
Characteristics of Particle Size Distributions of Falling Volcanic Ash Measured by Optical Disdrometers at the Sakurajima Volcano, Japan

1
Research and Education Center for Natural Hazards, Kagoshima University, Kagoshima 890-0065, Japan
2
Graduate School of Science and Engineering, Kagoshima University, Kagoshima 890-0065, Japan
3
Disaster Prevention Research Institute, Kyoto University, Kyoto 611-0011, Japan
*
Author to whom correspondence should be addressed.
Atmosphere 2021, 12(5), 601; https://doi.org/10.3390/atmos12050601
Submission received: 5 February 2021
/
Revised: 21 March 2021
/
Accepted: 21 April 2021
/
Published: 6 May 2021
(This article belongs to the Special Issue Disaster Prevention Research Institute, Kyoto University—Monitoring and Modelling Volcanic Ash Transport and Deposition)
Abstract
:In the present study, we analyzed the particle size distribution (PSD) of falling volcanic ash particles measured using optical disdrometers during six explosive eruptions of the Sakurajima volcano in Kagoshima Prefecture, Japan. Assuming the gamma PSD model, which is commonly used in radar meteorology, we examined the relationships between each of the gamma PSD parameters (the intercept parameter, the slope parameter, and the shape parameter) calculated by the complete moment method. It was shown that there were good correlations between each of the gamma PSD parameters, which might be one of the characteristics of falling volcanic ash particles. We found from the normalized gamma PSD analysis that the normalized intercept parameter and mass-weighted mean diameter are suitable for estimating the ash fall rate. We also derived empirical power law relationships between pairs of integrated PSD parameters: the ash fall rate, the volcanic ash mass concentration, the reflectivity factor, and the total number of ash particles per unit volume. The results of the present study provide essential information for studying microphysical processes in volcanic ash clouds, developing a method for quantitative ash fall estimation using weather radar, and improving ash transport and sedimentation models.
1. Introduction
The physical properties and chemical components of ash particles emitted by explosive volcanic eruptions represent useful basic data for investigating the mode, scale, and mechanisms of eruptions. Previous studies have investigated the generation mechanism of individual eruptions [1,2] and the fragmentation process during explosive eruptions by estimating the total grain size distribution following sediment surveys [3,4,5].
In recent years, volcanic sediment data analysis has facilitated many types of research, such as the detection, tracking, and prediction of ash fall to prevent volcanic disasters [6,7,8], estimation of the content fraction of particles smaller than 63 μm (which affect aircraft operation) from total grain size distribution [7], and investigation of variation in tephra features with distance from the volcano crater using the 100-year eruption records of volcanoes along the western coast of North America [8].
Although investigating ground sediments deposited following volcanic eruptions is an important method in volcanology research, and for volcanic disaster prevention, sediment data acquired on the ground are inevitably time-integrated, they are usually accumulated hours or days after an eruption. Large historical eruptions have resulted in centuries of accumulated sediment. Conventional geological methods for investigating sediments are limited in that the properties and sedimentary environment of volcanic ash particles change depending on weather conditions, such as wind and rain, during and after sedimentation [9], such that sediment data are often unsuitable for remote sensing and numerical forecasting of ash fall distribution and transportation, which change from moment to moment.
Recent studies have attempted to clarify the physical properties of ash particles at high temporal resolution using meteorological optical disdrometers, which were developed to measure the physical characteristics of precipitation particles [10,11,12] including particle size distribution (PSD), shape, falling velocity, and canting. Optical disdrometers have also been used to study microphysics in precipitation clouds, to develop quantitative precipitation estimates, and to provide ground truth data for satellite remote sensing of precipitation. Because the optical disdrometer is a non-contact sensor, it can measure falling volcanic ash particles without altering local environmental conditions. A certain type of optical disdrometer can acquire the shape of a falling single particle using its fast scanning frequency, which is typically a few thousands per second.
Free-fall experiments conducted in a large experimental facility measured the falling velocity, shape, and canting angles of ash particles using a two-dimensional video disdrometer (2DVD) [10], which was developed to observe precipitation particles [13,14]. Another type of optical disdrometer, Parsivel2 [15,16], was installed on Sakurajima, a volcano in Kagoshima Prefecture, Japan to automatically measure falling ash particles [11]. This instrument measured temporal changes in the PSD and fall velocity of tephra from a total of 76 eruptions of Sakurajima over a 2-year period. An analysis of these records showed that temporal changes in the Parsivel2 PSD data were synchronized with the crustal movements associated with eruptions. Based on the success mentioned above, automated measurements of ash particles are ongoing with 13 Parsivel2 instruments that have been arranged in all directions centering on the Minami-dake summit of Sakurajima [12].
The goal of the present study was to find characteristics of volcanic ash PSD. One of the unique features of the present study is an analysis of PSD data measured by disdrometers every 1 min. The results obtained will be useful for the radar monitoring of ash falls and improvement of volcanic ash transport and diffusion models.
The structure of the present paper is as follows. In Section 2, we describe the principles by which ash particles are measured by Parsivel2, the data analysis, and processing methods. In Section 3, we describe the functional forms and integrated parameters of ash particle PSD, which provide a theoretical basis for quantitative ash fall estimation and analysis of volcanic ash cloud microphysics. Our results are described and discussed in Section 4 and Section 5, respectively. The phenomenon of fragmentation, which is an important eruption mechanism based on the physical and chemical characteristics of volcanic ash particles, is beyond the scope of this study, and will not be discussed.
2. Measurements of Volcanic Ash Particles
2.1. Parsivel2
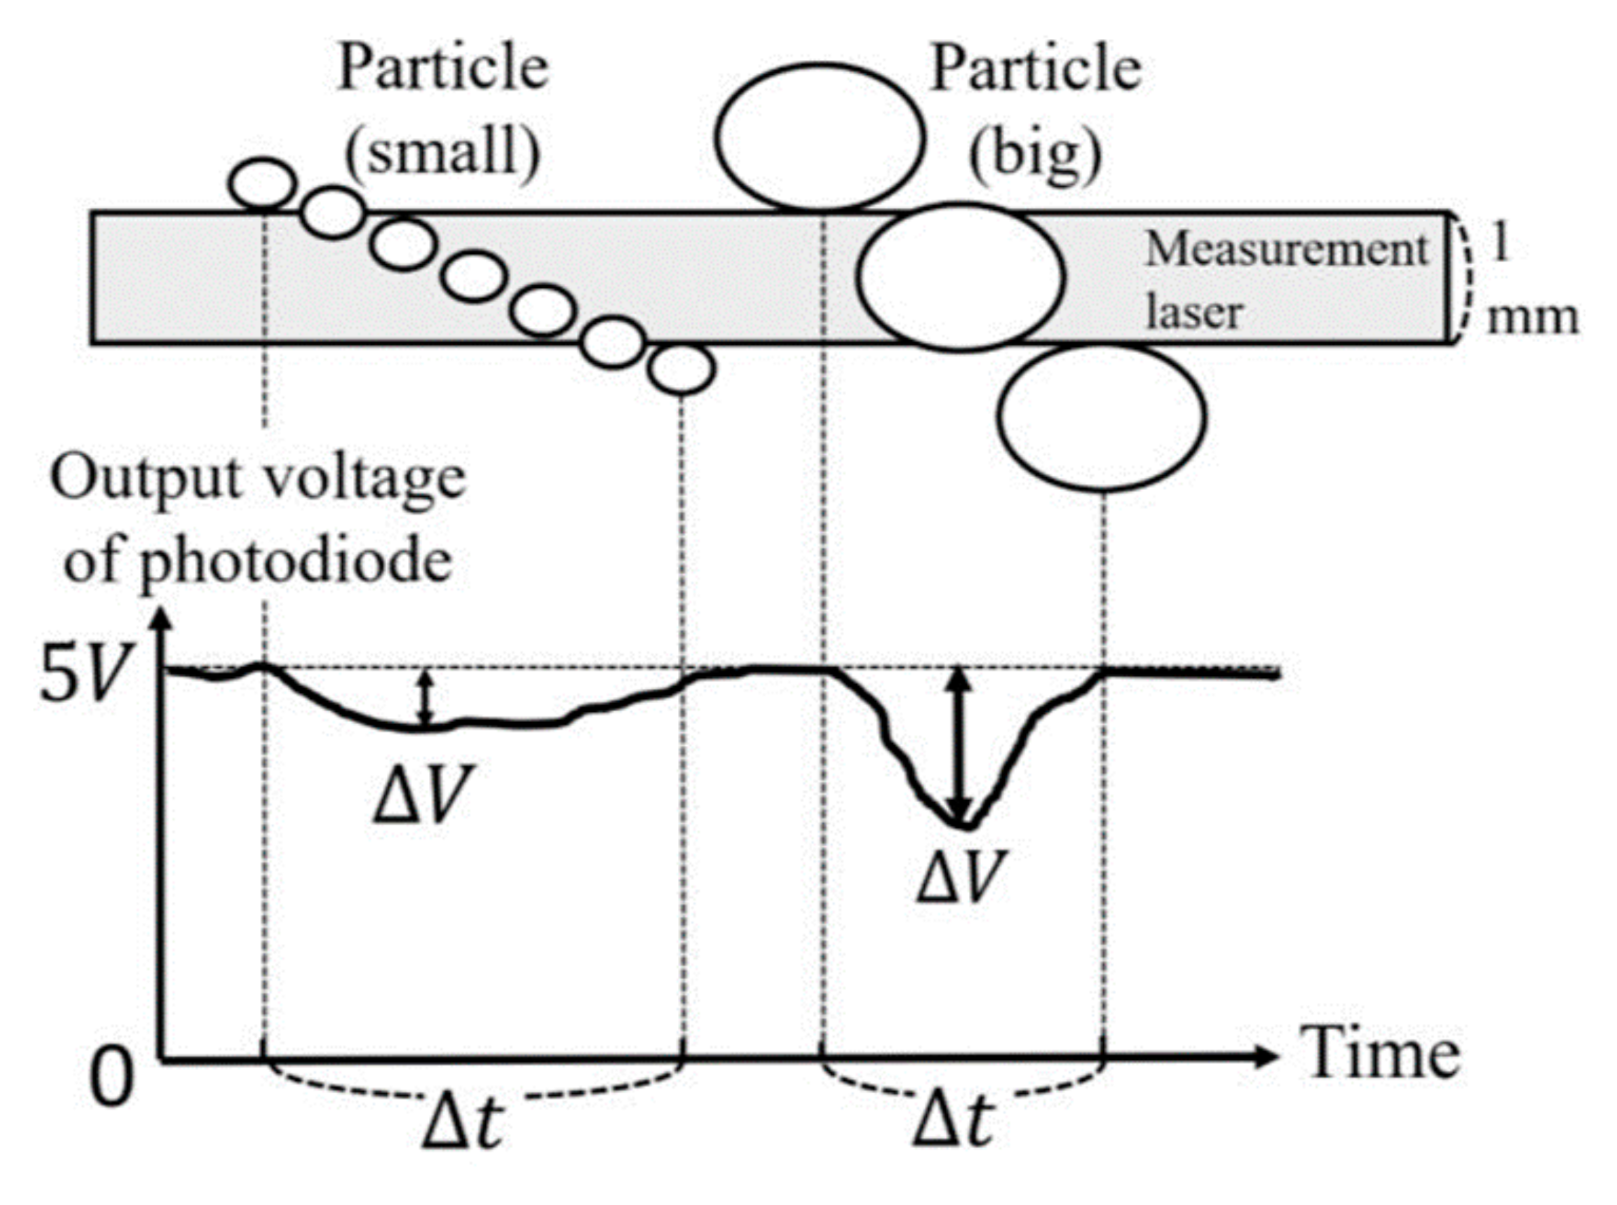
In this study, we used the Parsivel2 (PARticle SIze and VELocity) optical disdrometer; its main specifications are listed in Table 1 [17]. Parsivel2 measures falling particles as follows. A flat, horizontal laser measuring surface (180 mm × 30 mm × 1 mm) is formed between the light-emitting and light-receiving devices. The diameter (0.2–25 mm) and fall speed (up to 20 ms−1) of the particles are calculated in real time based on the voltage drop and duration as falling particles pass through the laser measurement surface (Figure 1). In these calculations, it was assumed that particles < 1 mm in diameter are spherical, the axial ratio of particles 1–5 mm in diameter varies linearly from 1 to 0.7, and the axial ratio of particles > 5 mm in diameter is 0.7. These assumptions are based on the original function of Parsivel, which was designed to measure raindrops, and may lead to errors in measurements of volcanic ash particles. At present, it is difficult to estimate these errors because the relationship between the axis ratio and diameter of volcanic ash particles is unclear.
The PSD estimation error for Parsivel has been compared with that for other instruments [15,16,18,19,20]. The accuracy of the first-generation Parsivel and Parsivel2 was evaluated by comparing measured data with those from an impact disdrometer observing raindrops [16,21]. The results showed that Parsivel2 has improved the accuracy of rainfall and PSD measurements of particles 0.5 and 4 mm in size. The accuracy of Parsivel2 is acceptable for estimating the fall velocity of particles < 1 mm in diameter. Parsivel2 was found to underestimate fall velocity near 1 m s−1, but this trend decreased as particle size increased.
2.2. Data Collection
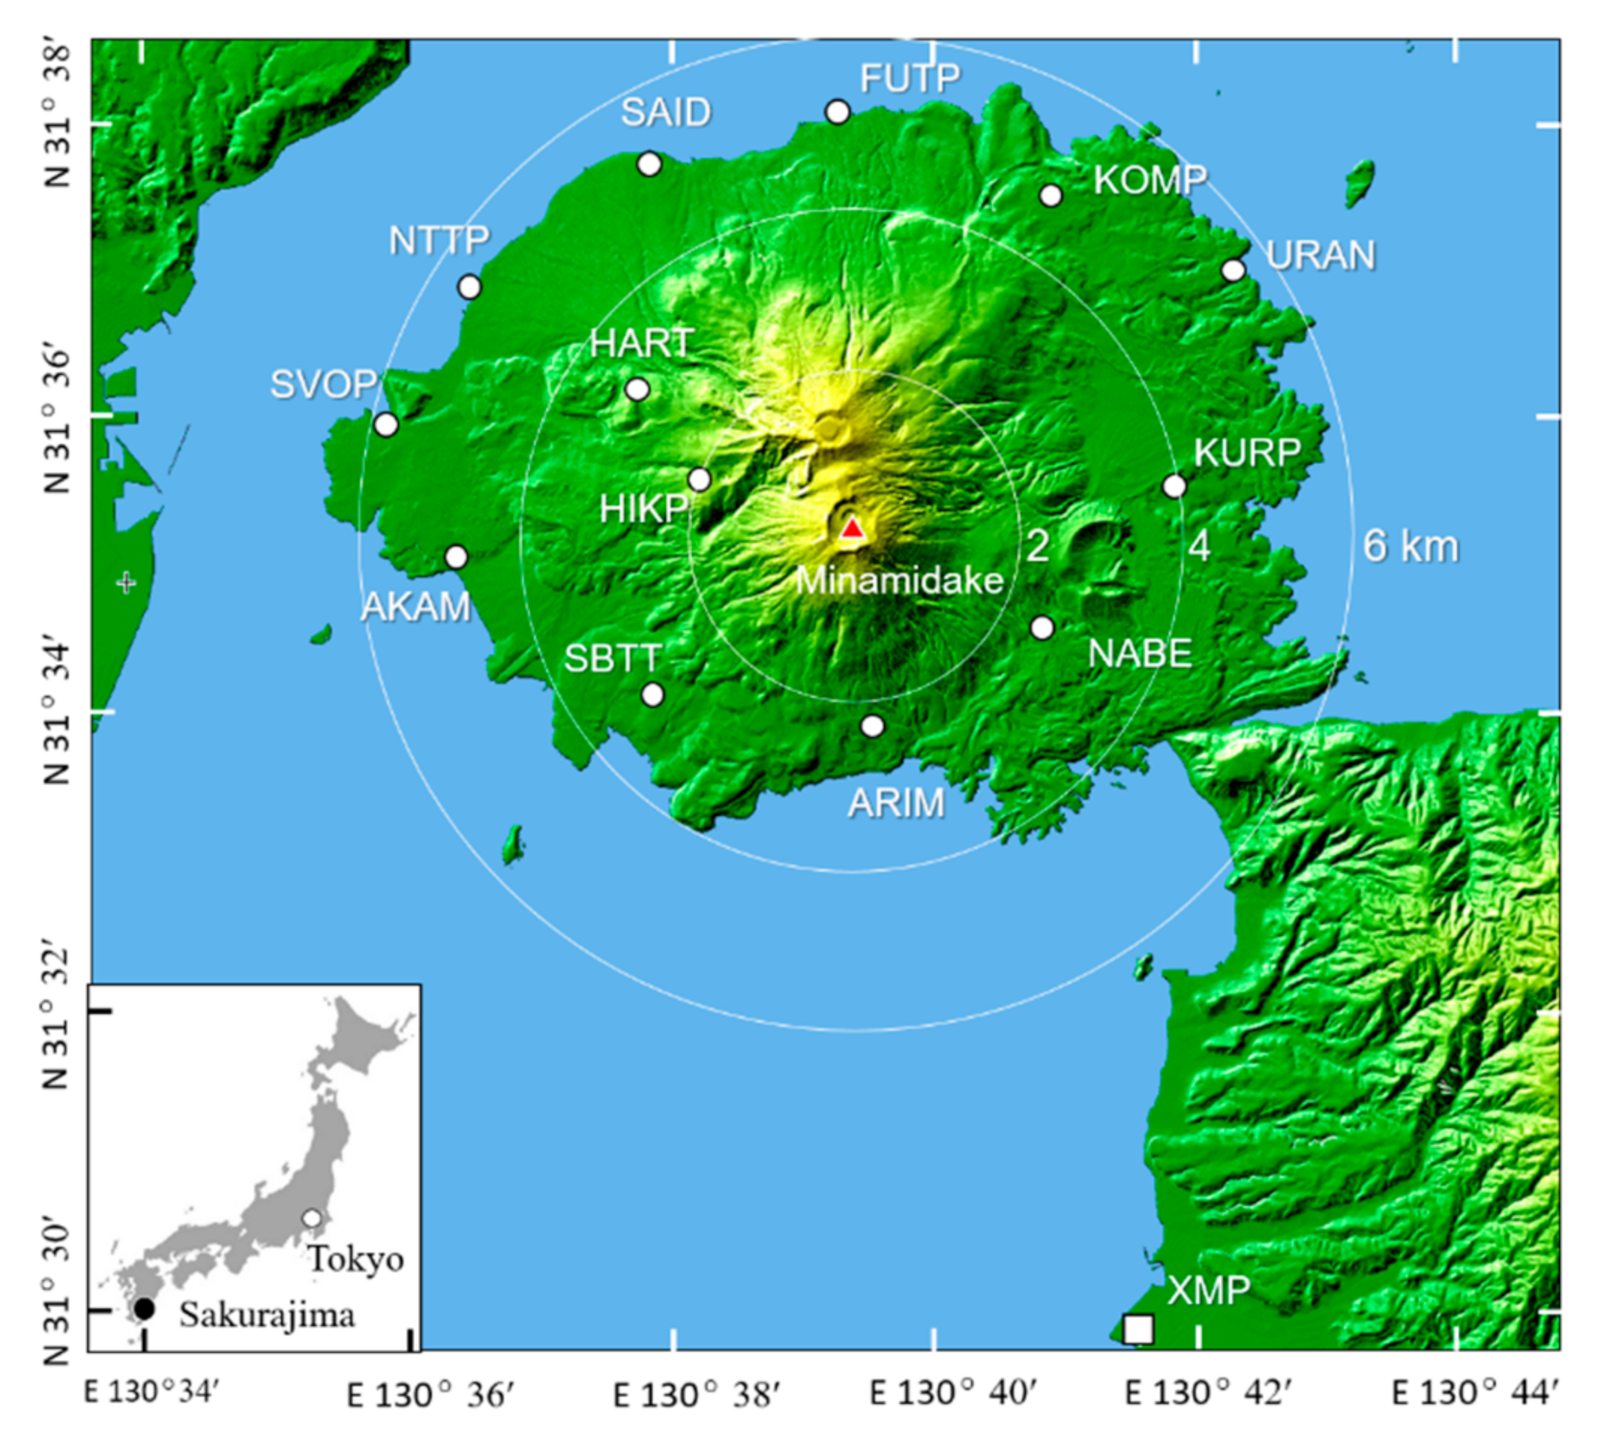
The ash particle data analyzed in this study were collected by the Parsivel2 network (Figure 2), which was installed on Sakurajima and operated by the Disaster Prevention Research Institute of Kyoto University. We extracted PSD data, including eruption onset time and cloud top height, from the Parsivel2 database for six volcanic eruptions that occurred in 2018 (Table 2), according to reports of Sakurajima volcanic eruptions published by the Kagoshima Local Meteorological Observatory of the Japan Meteorological Agency [22,23].
To confirm that an eruption cloud had passed over a Parsivel2 site, we used X-band multi-parameter radar (XMP), which was installed approximately 11 km from Sakurajima’s Minami-dake summit. XMP is operated by the Ministry of Land, Infrastructure and Transport to monitor debris flows on Sakurajima; although it is used to observe precipitation, it has also been shown to capture ash particles falling from eruption clouds [24].
Eruption cases were selected for analysis as follows. First, eruptions in which the eruption cloud top height was >2000 m above the vent were extracted. Then, XMP data for the extracted eruptions were downloaded from the Extended Rainfall Indicator Network (XRAIN) data download system [25] to draw time-cumulative plan position indicator (PPI) images of reflectivity at 2 elevation angles, of 1.7° and 6°. Finally, eruptions in which the installation point of Parsivel2 was within the cumulative reflectivity distribution area were selected for analysis.
2.3. Data Processing
Various physical quantities of particles falling through the atmosphere were calculated from PSD data measured by Parsivel2 [26]. The PSD of falling particles is calculated as follows:
where N(Di) is the number of particles from Di to Di + ΔDi in a unit volume, and Di, ΔDi are the average and bin spacing of the i-th size bin, respectively. Cij is the number of particles measured in the i-th size bin and the j-th speed bin, and nd is the number of size bins (32 in this study). Vj is the measured time interval (60 s for this instrument), and Ai is the fall rate measured for the j-th speed bin. The effective measurement area of the i-th size bin is calculated as follows:
The mean fall velocity of particles with a mean diameter Di is calculated as follows:
where nv is the number of velocity bins (32 for this instrument). The ash fall rate RA was calculated as follows:
where ρp is the solid density of ash particles. We assumed that ρp = 2.5 g cm−3 (= 2.5 × 10³ kg m−3). From Equation (1),
If RA is expressed in [mm h−1],
where ρb is the bulk density of ash deposits. We assumed that ρb = 1.25 g cm−3 (= 1.25 × 10³ kg m−3). The volcanic ash mass concentration CA is defined as the amount of ash particles in a unit volume of air, is calculated as follows:
and the reflectivity factor Z is calculated as follows:
The mass-weighted diameter Dm is a parameter characterizing the normalized PSD, and is calculated as the ratio of the fourth moment of PSD to the third moment, as follows:
Dm is closely related to the median volume particle diameter D0 (Section 3.2 and Section 3.4). The normalized PSD intercept parameter Nw is calculated as follows:
The basic parameters of volcanic ash particles described above were directly calculated from PSD data measured by Parsivel2.
3. Functional Representation of Falling Ash Particles
3.1. Radar Meteorological Approach
In radar meteorology, precipitation PSD is indispensable for quantitative estimation of precipitation and hydrometeor classification. Therefore, functions to approximate observed precipitation particles have been proposed in several previous studies. Functional forms of PSD can be used to investigate spatiotemporal variation in the microphysical processes of precipitation clouds, derive theoretical formulae for quantitative precipitation estimates, and simulate precipitation particle scattering.
In this study, we applied radar meteorology concepts and techniques to volcanic ash fall phenomena. In this section, we describe volcanic ash PSD using either gamma or normalized gamma functions. In addition, we show that the integrated PSD parameters such as RA, CA, Z, etc. can be expressed in terms of either gamma or normalized gamma PSD models.
3.2. Gamma PSD Model
Raindrop size distribution is commonly described using the gamma PSD model. In this study, we replaced raindrops with falling ash particles in the gamma PSD model, which is expressed as follows [27,28]:
where N(D) is the number of ash particles per unit diameter increment within a unit volume, N0 (mm−1−μ m−3) is the intercept parameter characterizing PSD, Λ (mm−1) is the slope parameter, and μ is the shape parameter. D is expressed in mm, and μ, which is normally dimensionless, takes the units of N0. Thus, N0 and μ are not completely independent, such that N0 is affected by the variation of μ and N0 has no physical meaning [29]. Equation (11) can be expressed using the median volume diameter D0, which has a physical meaning and is used in radar meteorology instead of Λ. Thus,
When Dmax/D0 ≥ 2.5, and μ ≥ −3, the following approximation holds, with an accuracy of ≤0.5% [27]: G = ΛD0 = 3.67 + μ. The median volume diameter D0 is defined as the diameter that divides the total volume of all falling ash particles within a unit volume into two equal parts in the falling ash PSD. Since the computation of D0 is cumbersome, the mass-weighted mean Dm is often used instead of D0. The relationship between Dm and D0 is as follows [27]:
The value 3.82 in the above equation is attributed to a power law approximation of the fall velocity of ash particles (D ≤ 2 mm; Table 3). The value 3.67 is typically used for raindrops. From Equation (13), when μ ≥ 0, the difference between Dm and D0 is less than 9%, and as μ becomes larger, this difference becomes smaller; when μ = 10, the difference is about 2%. Using Dm to represent the gamma PSD, the model becomes:
The intercept parameter Λ can be expressed as follows:
As a special case of the gamma distribution, μ = 0,
or
This PSD model is a well-known exponential PSD function [30].
3.3. Normalized Gamma PSD Model
Generally, falling ash PSDs fluctuate depending on CA or RA. To investigate the shape of the ash PSD, which is not affected by CA, normalized (scaled) PSD concepts have been proposed [35,36,37,38,39,40]. The normalized PSD is generally expressed as follows [39]:
where Nw is the normalized intercept parameter, which normalizes N (D), and Dm is the mass-weighted mean diameter, which normalizes D. F is a factor that determines the geometry of the PSD, and X = D/Dm. The normalized PSD expressed in Equation (18) is not a functional form of PSD. In this section, we derive a normalized PSD assuming a gamma function for measured PSD.
When N(D) is represented by the gamma function, i.e., Equation (12), the nth moment Mn of PSD is expressed as follows:
Dm and Nw are expressed as follows, in terms of Mn:
From Equations (14), (18), (20), and (21),
Therefore, the normalized gamma PSD can be represented as follows:
Importantly, the normalized gamma PSD described in Equation (23) is represented by three independent parameters, Nw, Dm, and μ.
3.4. Calculation of PSD Parameters
Three parameters of the gamma PSD, N0 (or Nw), Λ (D0 or Dm), and μ can be calculated using the nth moment Mn of the PSD [41,42], as follows:
Mn can be calculated by the following equation using PSDs measured by Parsivel2:
For convenience of computation, we introduce a variable η, which is defined as the combination of M2, M4, and M6, as follows:
such that η is a monotonically increasing function with respect to μ. By solving Equation (26), the shape parameter μ of the gamma PSD model can be obtained from the following equation:
If μ is known, the slope parameter Λ of the gamma profile is given by [42]:
where . N0 is calculated as follows:
where N0 can be obtained by specifying any value of n if μ and Λ are obtained. Thus, n can be 2, 4, or 6, and the difference in the calculated value of N0 for each case is about 1%. D0 can be computed as follows if μ and Λ are obtained:
The present paper utilizes the complete moment method to calculate the gamma PSD parameters. However, it may be necessary to mention that the calculation of gamma PSD parameters is more complex than the complete moment method when the lower and upper bounds of the integral are finite in Equation (24), i.e., an incomplete gamma distribution. The effects of Dmin and Dmax on the calculated gamma PSD parameters have been examined assuming an incomplete gamma distribution [42]; the effect of Dmin on the gamma PSD parameters is small, such that Dmin = 0 may be assumed [43,44]. The present paper use the observed Dmax to estimate the nth moment of the PSD.
3.5. Integrated PSD Parameters
The integrated PSD parameters include the total number of falling ash particles NT, CA, RA, and Z. The integrated parameters are expressed by PSD moments, as follows:
where v(D) is the falling velocity of volcanic ash particles of diameter D, calculated as follows:
The integrated PSD parameters defined in Equations (31)–(33) are determined by PSD moments calculated from the measured PSD data, and the relationships among integrated PSD parameters can be obtained by regression analyses of the integrated PSD parameters. If the PSD data are not available, then the relationships among integrated PSD parameters are derived by assuming the functional form of the PSD. Assuming the gamma PSD model, the following relationships are derived:
The gamma PSD parameters obtained by the full moment method in Section 3.4 may then be substituted into these equations.
4. Results
4.1. Fall Speed of Volcanic Ash Particles
The terminal velocity of falling particles is generally determined according to the balance among gravitational, buoyancy, and aerodynamic drag forces [45]. In the present study, we express the particle fall velocity as a power law function of particle diameter, as shown in Equation (33), which is obtained by applying regression analysis to fall velocity data measured using Parsivel2, as shown in Equation (3).
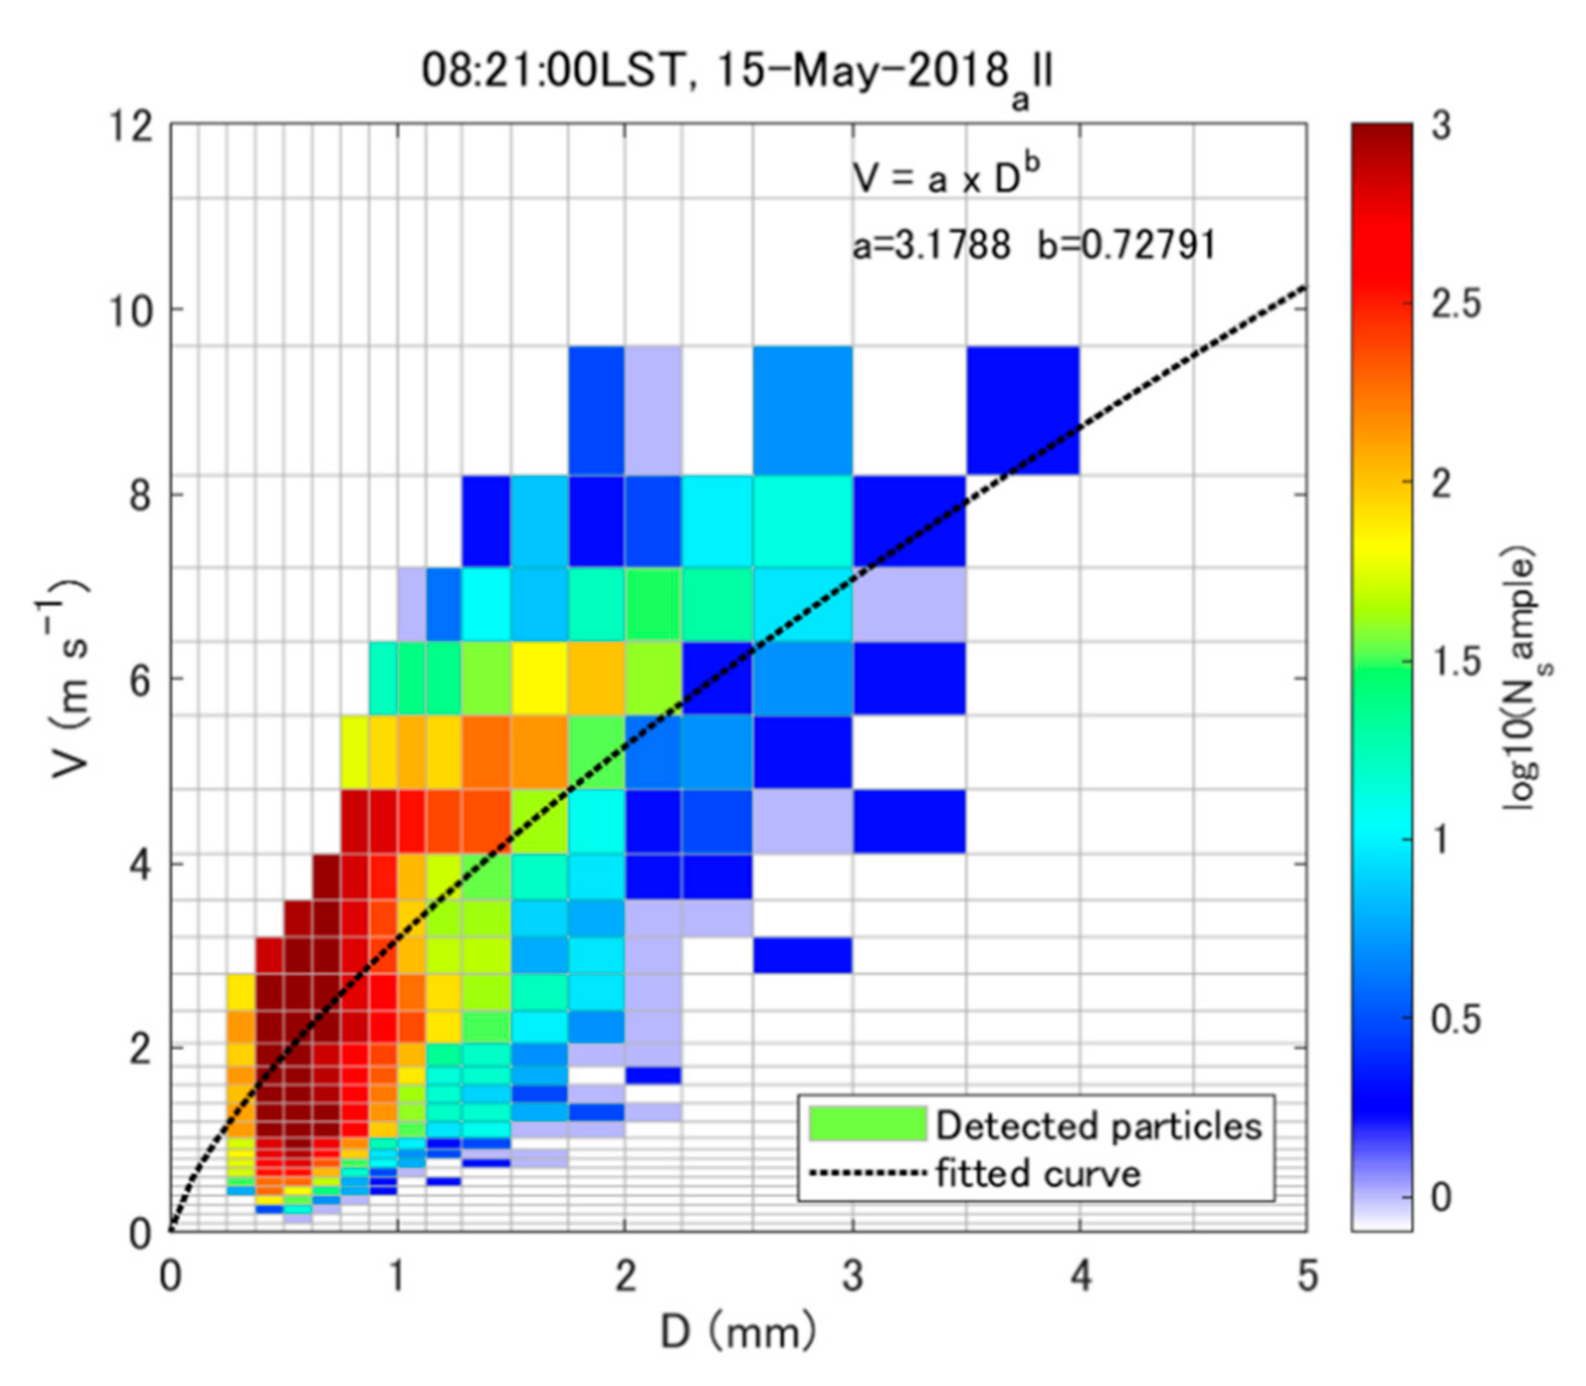
The distribution of the number of ash particles in the parameter space of fall velocity and diameter for the six selected volcanic eruptions is shown in Figure 3. The total number of samples was 63,237, and most of the observed data were for ash particles, i.e., D ≤ 2 mm. Particles with diameters ranging from 0.4 to 0.8 mm were the most frequent. The fall velocities corresponding to these particles were widely distributed, from 0.2 to 4 ms−1, with larger particles occurring less frequently but with greater variance. This variation may be caused by Parsivel2 measurement error or particle density variation. The falling velocity of particles increased in proportion to the square of the particle density [45]. Another reason for the large scatter observed in Figure 3 may be the particle shape, which determines the drag force acting on the particle [10]. The flatter the particle shape, the slower the falling velocity.
The largest particle observed in the present study was 4 mm in diameter. The power law equation for the fall velocity of all data shown in Figure 3 is:
For volcanic ash particles (D ≤ 2 mm), the fall velocity equation is:
which is quite similar to Equation (40).
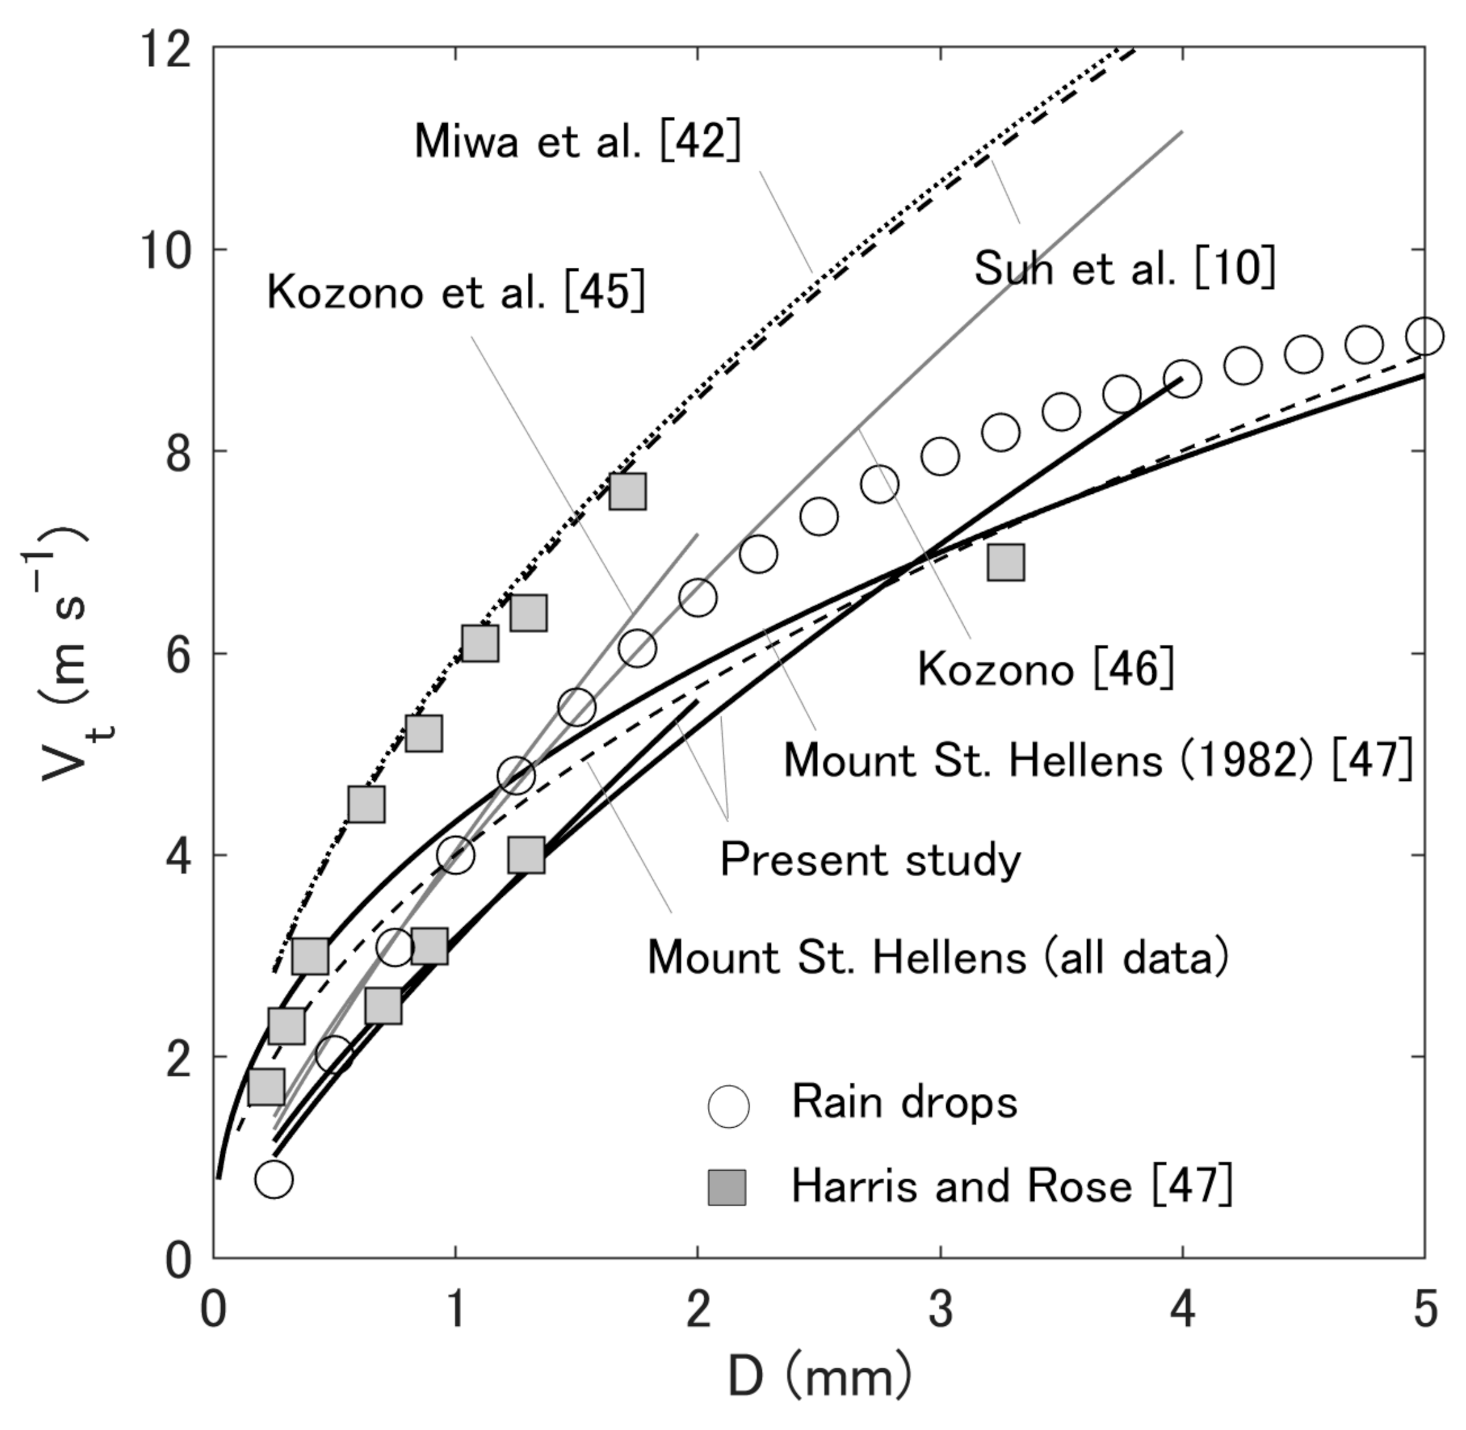
Table 3 summarizes the fall velocity equation derived in the present study and those proposed in previous studies. The equations for fall velocity versus diameter listed in Table 3 are shown in Figure 4. Among all curves shown in Figure 4, the formulae derived from experiments of ash particle free fall from a height of 17 m [10,31] give the largest fall velocity for the same diameter, likely because the fall velocity was accelerated by the fingering phenomenon [46,47]. Parsivel2, installed on Sakurajima, was used to observe the falling velocity of actual ash particles. [11,32]; the falling velocity of ash particles for a total of 76 eruptions from 2014 to 2016 was described as a power law (Figure 4) derived from observed data [33] and previously developed theoretical equations [11,34,48]. The power law formulae obtained in the present study provided the lowest fall velocity for the same diameter, and smaller than with the theoretical equations [34] in which the particle density was assumed to be 2500 (kg m−3).
4.2. PSD Parameters
4.2.1. Temporal Changes in PSD
Changes in the PSDs of the six selected eruptions over time, as eruption clouds passed over the Parsivel2 device, are shown in Figure 5. The maximum RA (11.7 mm h−1) was observed during eruption 4. The number of particles observed per unit volume (NT) ranged from 10 to 103 m−3. RA and log10NT were somewhat correlated. Particles with a maximum diameter of 3.75 mm were observed in eruptions 2b and 3. Dmax was not necessarily correlated with RA. In all eruptions except eruption 1, large values of Dmax were observed immediately after the onset of ash fall (Figure 5). Dmax and Dm were positively correlated, and Dmax was negatively correlated with both log10NT and log10 Nw. These new findings on the PSD of ash particles will be examined in detail in the following sections.
A temporal change in the PSD at a certain point is considered to reflect a spatial change in PSD within the eruption cloud. Therefore, it is necessary to know which part of the eruption cloud was observed by Parsivel2 when discussing a temporal change in the PSD. The distribution of the time-integrated reflectivity factor in eruption clouds during eruption 6 is shown in Figure 6. We also obtained the trajectories of the centroids of the eruption clouds (data not shown). Calculations of time-integrated radar reflectivity and the trajectories are based on PPI data at an elevation angle of 1.7°. Parsivel2 data for ash particles in the central part of eruption cloud as it passed over the observation site are shown in Figure 5. Unfortunately, there is no Parsivel2 site in the area where the accumulated reflectivity factor reached a maximum, since this area is 2 km from the vent and is therefore restricted.
4.2.2. Gamma PSD Parameters
Temporal changes in the observed PSD profiles for eruption 6 are shown in Figure 7, as a representative example. Two fitting curves of the gamma PSD function are superimposed on each set of observed PSD data; one curve was obtained by the momentum method, and the other curve, by non-linear regression analysis. It should be noted that non-linear regression analysis must be carried out to the logarithmic form of the gamma PSD formula because N(D) distributes over a wide range (from 100 to 104). A good fit was obtained for all samples, except at 15:54 LST, when large particles were observed. The gamma PSD obtained by the momentum method was approximately exponential, while the gamma PSD obtained by non-linear regression analysis exhibited an upward convex shape that fitted small particles. It should be noted that the results obtained by the two methods employed agree quite well for PSDs at 16:00 LST to 16:04 LST, a period during which only particles smaller than 2 mm were observed. The results suggest that the difference in the gamma PSD functional forms obtained by non-linear regression analysis and the momentum method is acceptable. We analyzed all the PSD data obtained in order to quantitatively confirm the results, which are shown in the discussion section of the present paper.
To clarify the statistical characteristics of the PSDs of volcanic ash particles, we investigated the frequency distribution and probability density function of four parameters (log10N0, Λ, D0, and μ) of gamma PSDs, and of the additional PSD parameters Dmax and NT observed in all eruptions. The results are shown in Figure 8. The six parameters (log10N0, D0, Λ, μ, Dmax, and NT) showed modes (standard deviation [SD]) of 8.8 (9.6), 0.65 (0.29), 13.4 (25.0), 8.3 (13.7), 0.97 (0.679), and 182 (380), respectively. It interesting that each of three parameters (log10N0, Λ, μ) had a wider range compared with that of precipitation particles. Other descriptive statistics, such as the maximum, median, and skewness, are summarized in Table 4.
The main objective of radar remote sensing is determining the physical quantities of eruption clouds from measured radar parameters. Normally, the number of physical quantities, which are unknowns, is larger than the number of parameters that can be measured by radar. Therefore, the number of unknowns is reduced by theoretically or empirically defining relationships between unknown parameters. If two parameters are strongly correlated, then the obtained relationship will be incorporated into a weather radar monitoring system for eruption clouds. Theoretical interpretations of such correlations are useful for understanding the microphysical processes of eruption clouds.
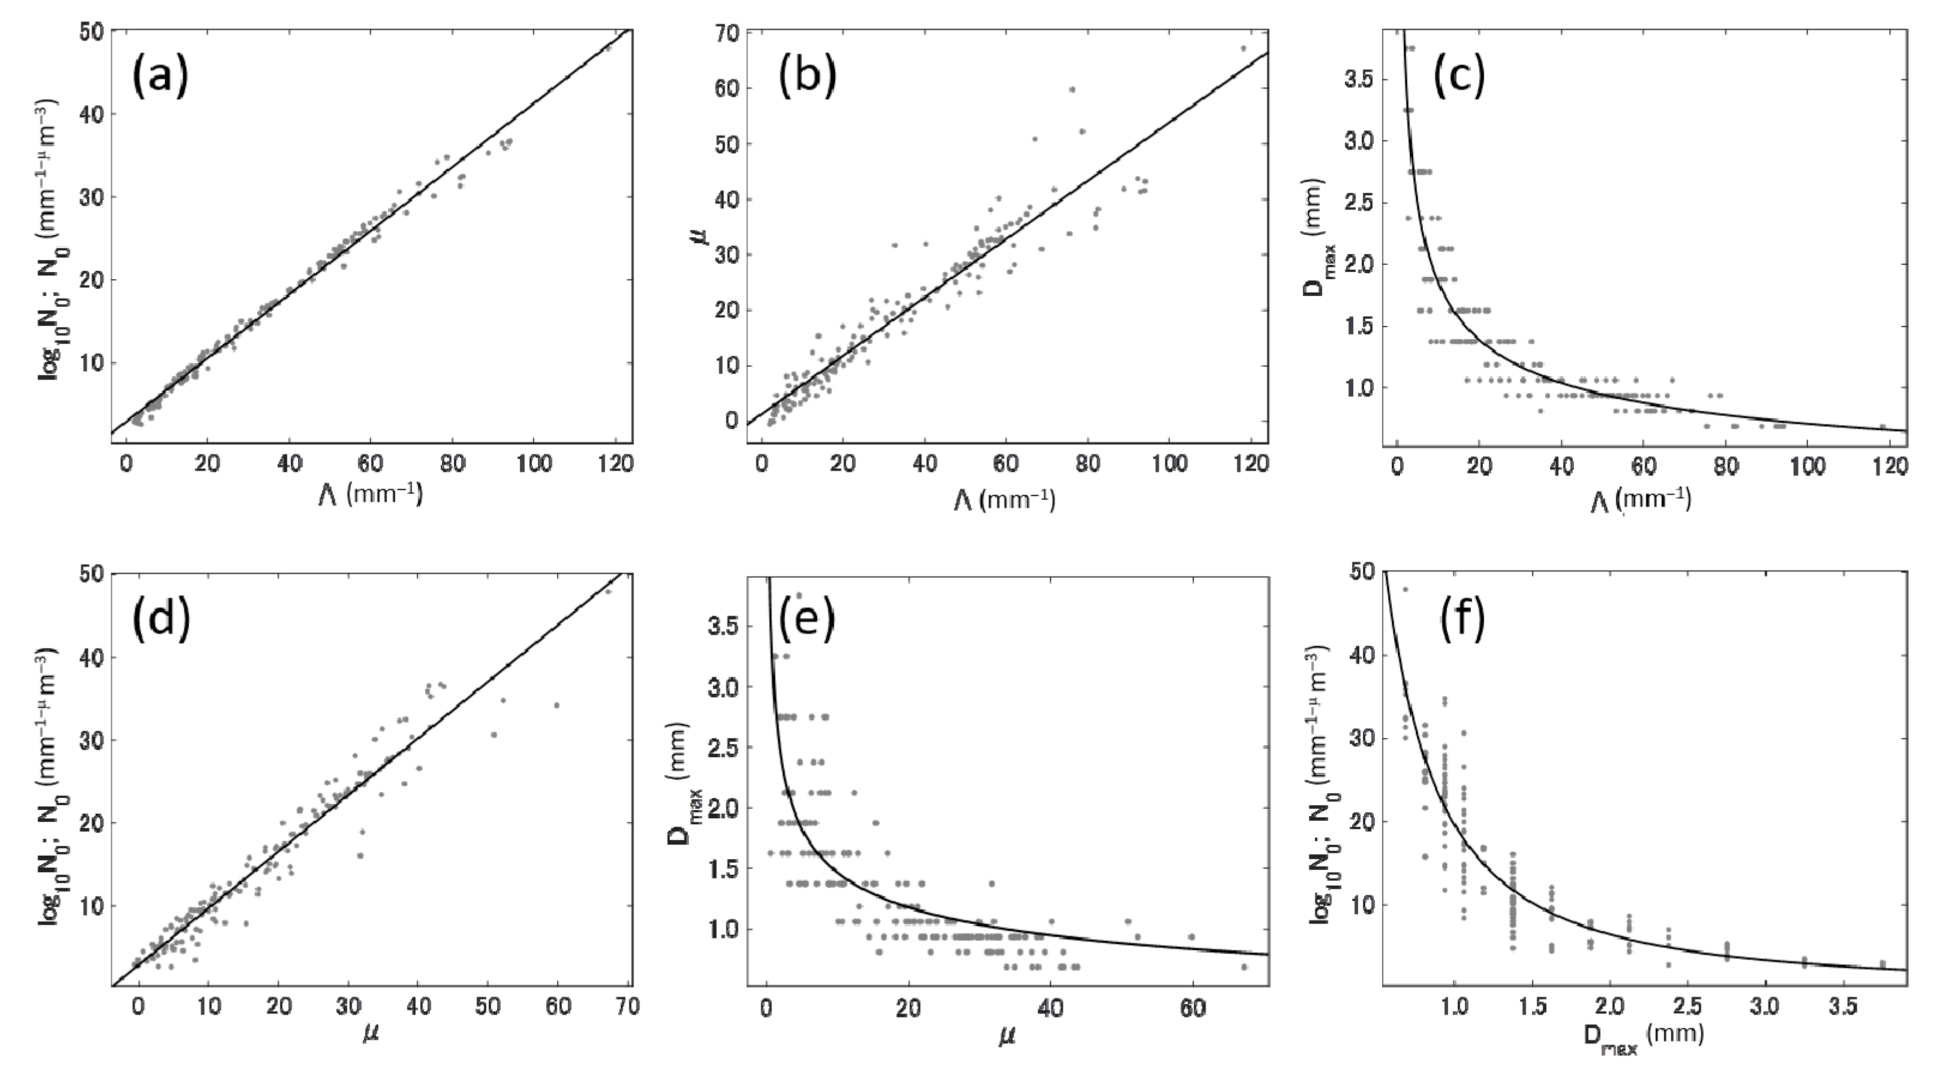
Clear correlations were detected between gamma PSD parameters in this study (Figure 9), which suggests that the gamma PSD model well describes the observed volcanic ash PSDs. The relationships between gamma PSD parameters are summarized in Table 5. Thus, if one gamma PSD parameter is obtained, the remaining parameters can be estimated using the information listed in Table 5. A scatter plot of Dmax and μ is also shown in Figure 9; the shape parameter μ approaches 0 (i.e., exponential PSD) when Dmax > ~3, and becomes large (i.e., upward concave PSD) when Dmax is small. Thus, once Dmax is given for an initial condition of the PSD, μ is determined by the μ–Dmax relationship. Next, N0 and Λ are estimated by the N0–μ and Λ–μ relationships, respectively.
4.2.3. Normalized PSD
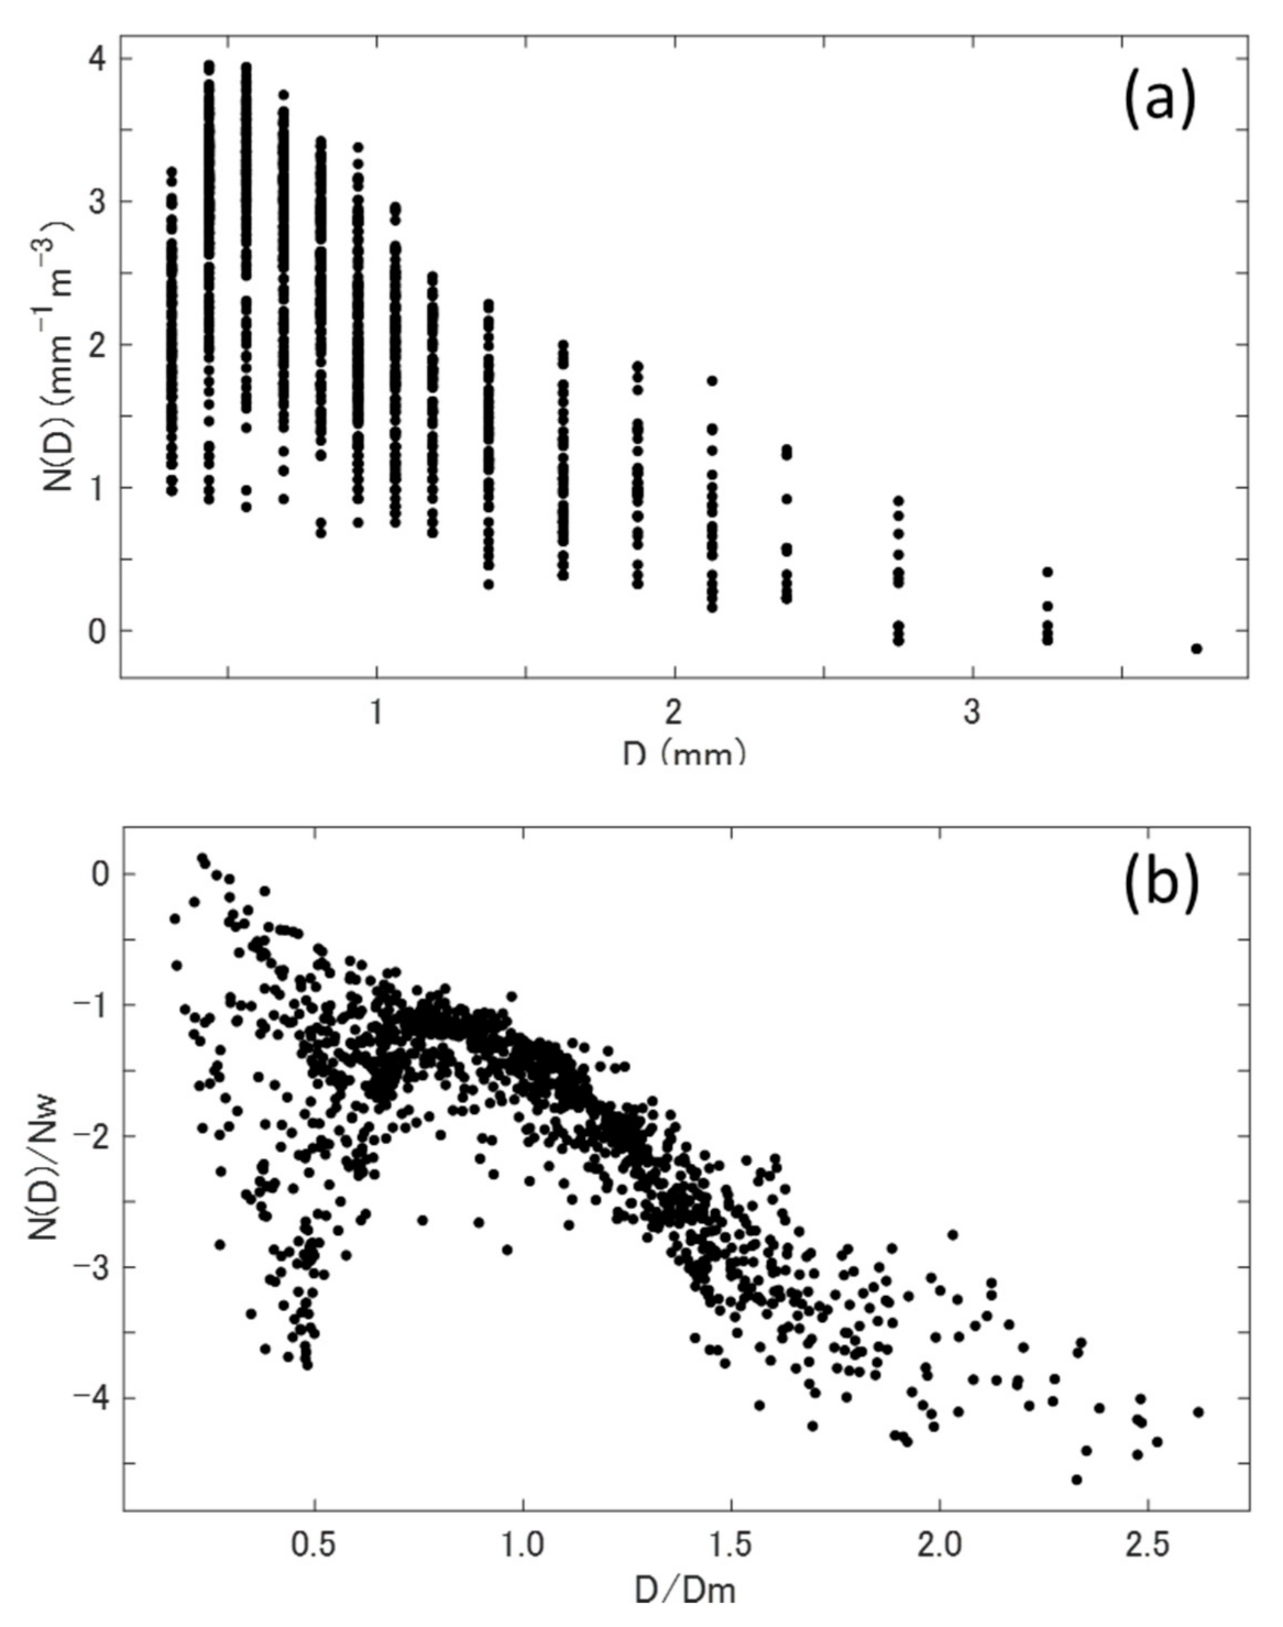
Figure 10 is a scatter plot showing PSDs before and after normalization. The normalized PSD parameters (Nw and Dm) were calculated directly from the PSD data measured by Parsivel2, without assuming a functional form of the PSD. Figure 10a shows the PSD before normalization, which is characterized by wide scattering due to variation in ash fall strength, such that the characteristic distribution could not be observed. After normalization, the PSDs converged to reduce the scatter (Figure 10b), allowing us to observe the form of the distribution. The shape parameter μ was determined by least-squares fitting of the measured N(D)/Nw data according to Equation (23). It may be interesting to examine the associations between Nw or Dm with the type and magnitude of volcanic eruption in a future study, using larger sample sizes.
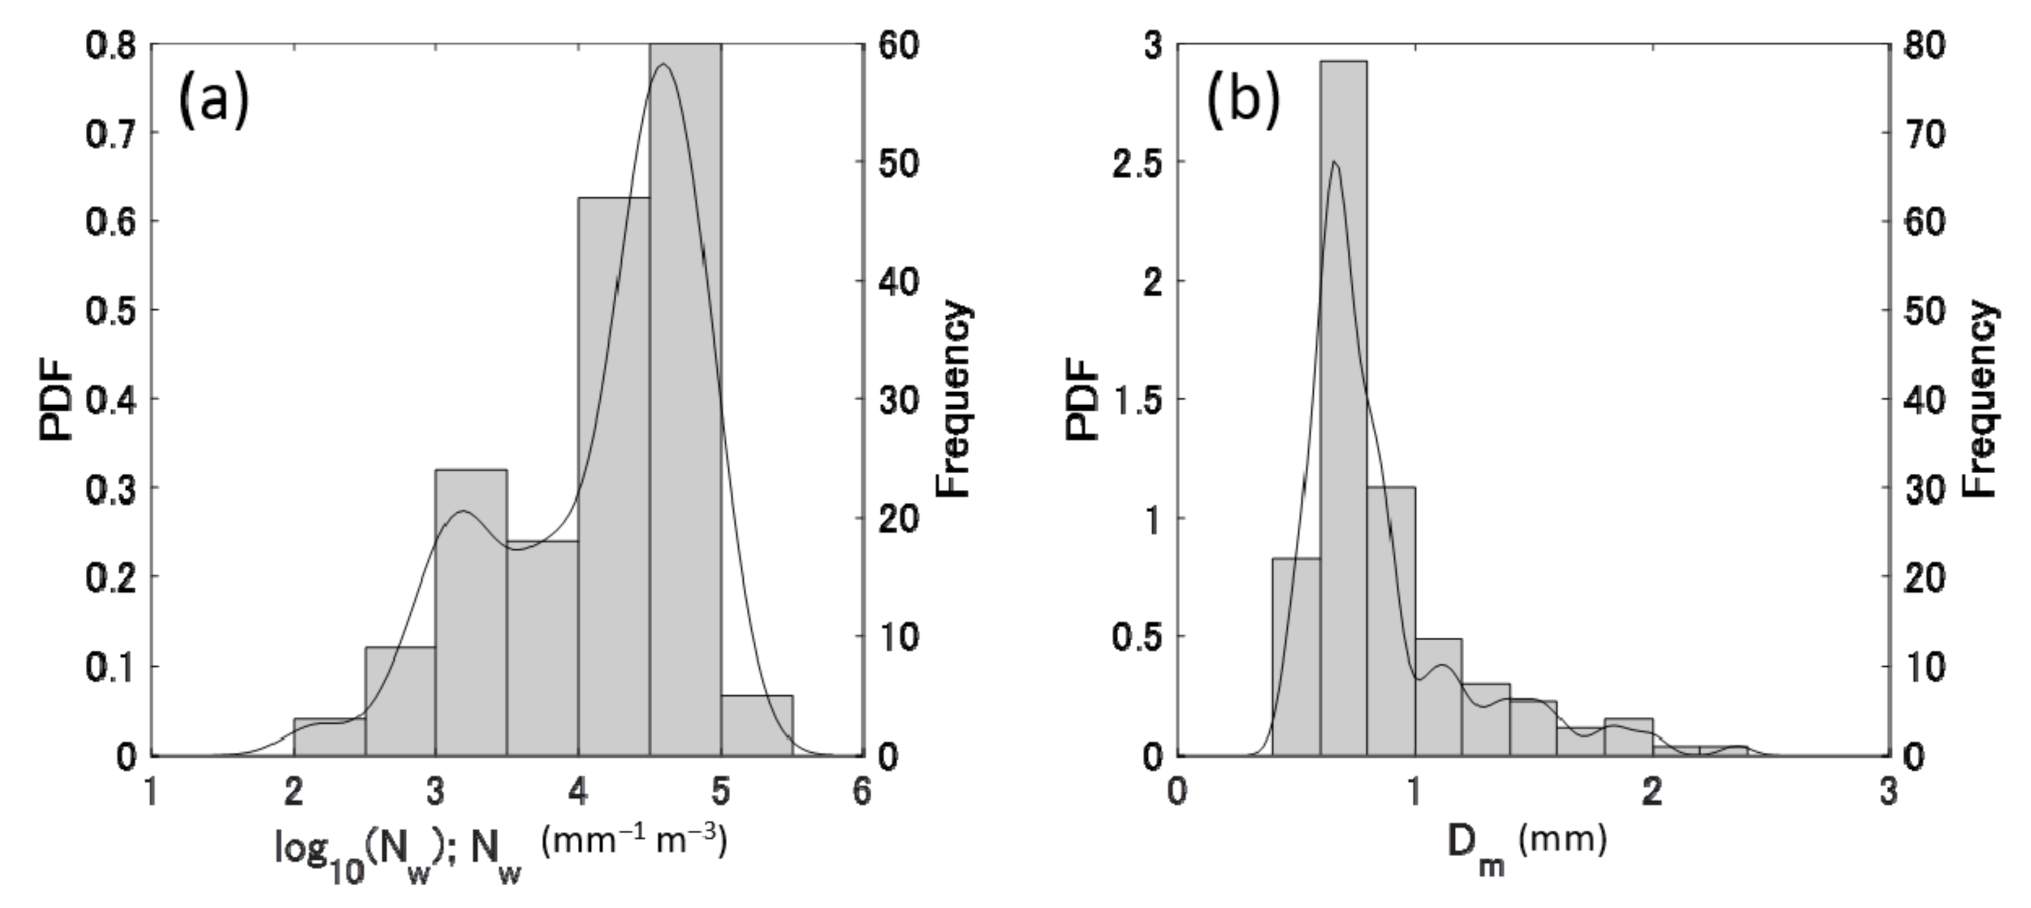
Despite the small sample sizes in the present study, they were useful for determining the statistical characteristics of normalized gamma PSD parameters. Figure 11 shows the frequency distributions and probability density functions of the two parameters (Dm and log10Nw) used to normalize the PSD. The shape parameter μ is shown in Figure 8d. The modes (SD) of Dm and log10Nw of the normalized gamma PSD parameters were 0.656 (0.350) and 4.60 (0.704), respectively, and the mode (SD) of μ was 8.31 (13.7).
4.2.4. Quantitative Ash Fall Estimation Using Normalized PSD Parameters
Next, we examined correlations between RA and gamma PSD parameters (Nw, Dm, and μ). Figure 12 shows a scatter plot of RA/Nw and Dm. Applying nonlinear regression analysis, we obtained the following power law equation:
By rearranging Equation (42), we obtained:
The power law equations for the upper and lower 95% confidence limits of Equation (43) are as follows:
In Figure 12, the correlation coefficient (root-mean-square error) between RA/Nw and Dm was 0.991 (0.000177), which was higher (lower) than that between RA and Z, as described in the next section. This result suggests that Equation (42) provides an advanced method for estimating RA if Nw and Dm are estimated with a sufficient degree of accuracy. For precipitation phenomena, two-frequency radar observations based on satellite remote sensing [49] and dual polarization radar observation [50] have been proposed to estimate Nw and Dm. Similar techniques may be available for ash fall phenomena, and should be explored in a future study.
As physical quantities that represent the microphysical processes within precipitation clouds, logNw and Dm have also been used to distinguish precipitation types (stratiform or convective) [51,52]. Similarly, Dm and Nw are expected to provide new insight into volcanic eruption clouds and their microphysical processes in future studies [53,54,55].
4.3. Conventional Relationship for Quantitative Ash Fall Estimation
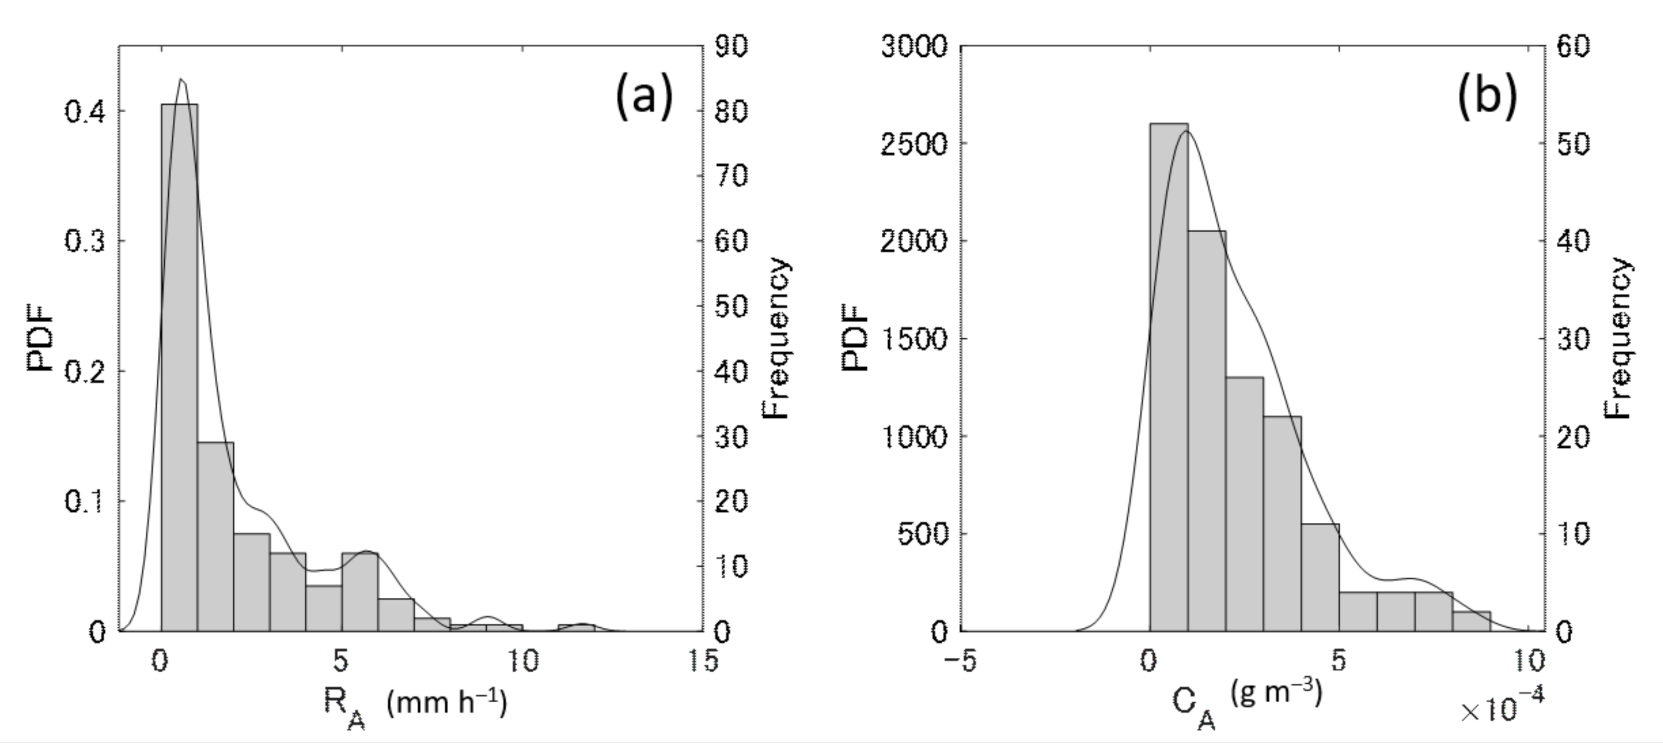
Figure 13 shows the frequency and probability density distributions of the three integrated PSD parameters (RA, CA, and 10log10Z). In this study, the modal values (SD) of RA, CA, and 10log10Z of the integrated PSD parameters were 0.52 (2.17), 0.0931 (0.189), and 17.1 (7.48), respectively.
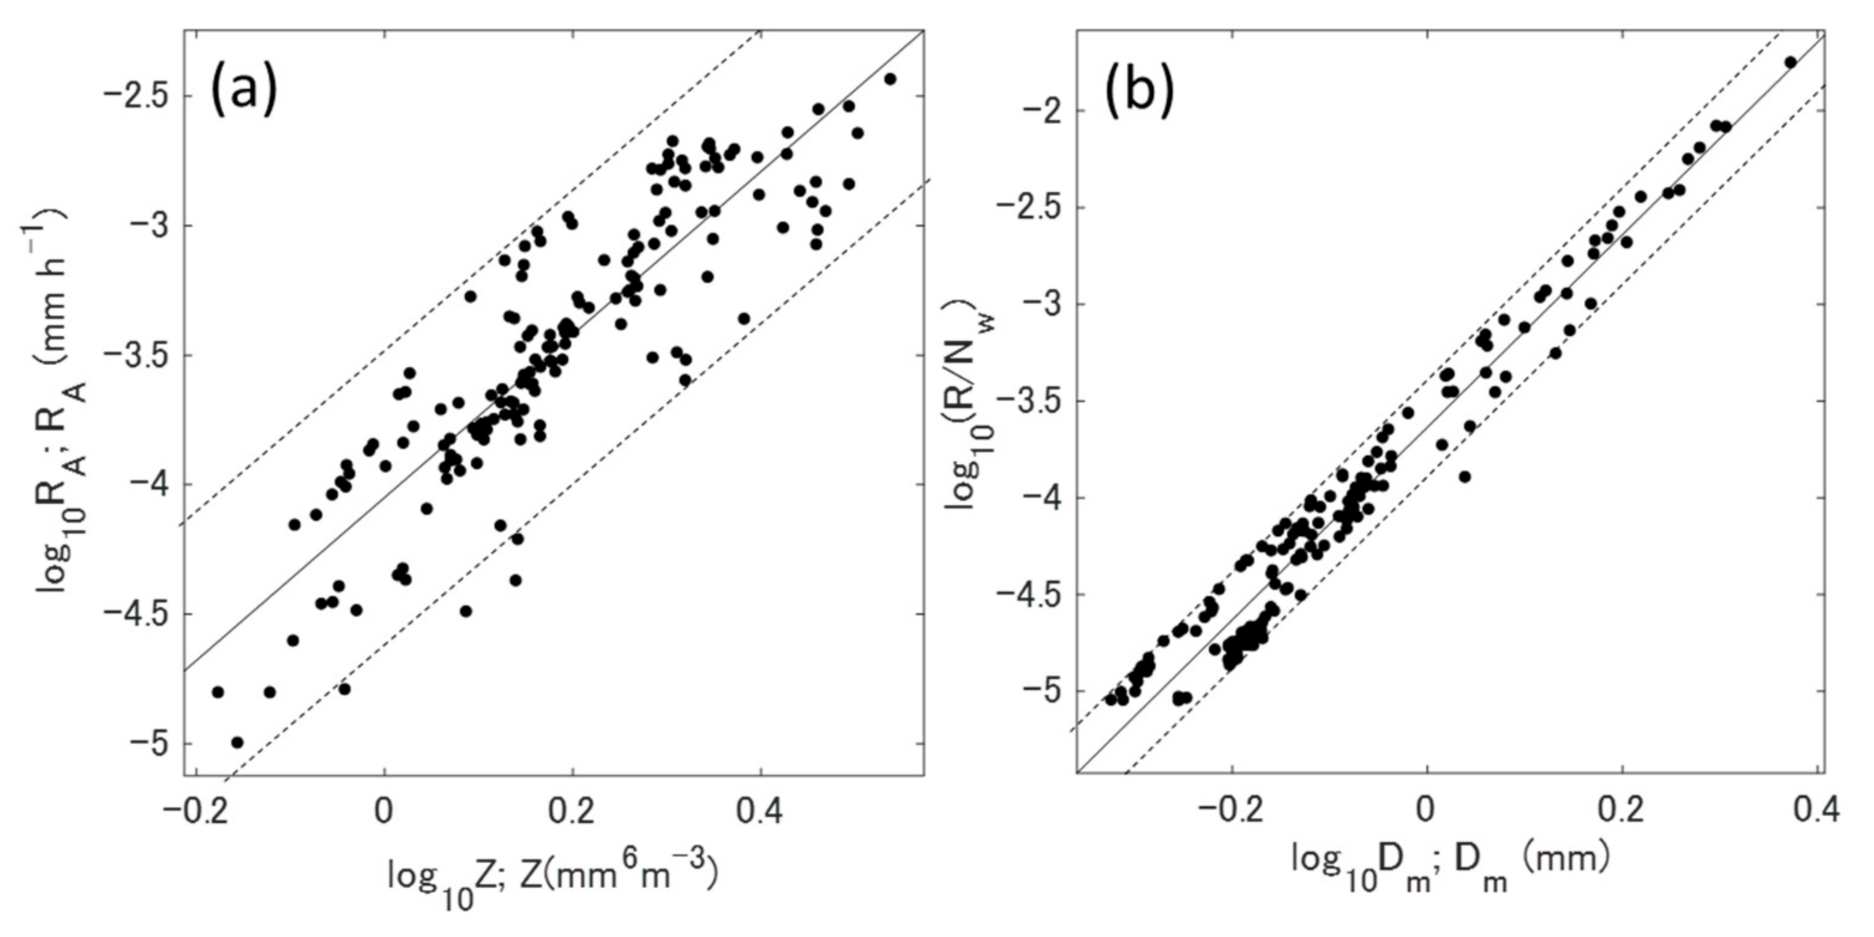
Next, we investigated the correlations among these integral parameters. In particular, the relationship between RA and Z is crucial as a practical equation for estimating the RA from weather radar observations. The CA–Z relationship is used to estimate the CA of volcanic ash. These relationships were derived from regression analyses of observed data for each eruption, and are summarized in Table 6. A scatter plot of RA and Z values obtained from Parsivel2 observations for all eruptions is shown in Figure 14. The RA–Z relationship was defined using the nonlinear least-squares method, as follows:
The RA–Z relationships for the upper and lower 95% confidence limits are as follows:
It must be mentioned that the R and RMSE for all eruptions are not as good as those of an individual eruption because the PSDs are changeable depending on the eruption case, which is similar to the variation of PSD in precipitation.
5. Discussion
In radar meteorology, various mathematical formulas for ‘precipitation particles’ have been proposed by researchers. These include exponential [30], gamma [27,28], log-normal [56,57], Poisson [58], and Weible [59]. The present study assumed a gamma PSD model for ‘volcanic ash particles’, for the following two reasons. First, gamma PS models have been used widely in previous radar meteorology studies, because the model is relatively simple and its error structure has been investigated [43]. Second, we can compare the results of our analysis with those of previous studies using the same PSD model. The differences in gamma PSD parameters between precipitation particles and volcanic ash particles, if any, can be used to discriminate eruption clouds from precipitation clouds, one of the goals of monitoring volcanic ash falls using radar.
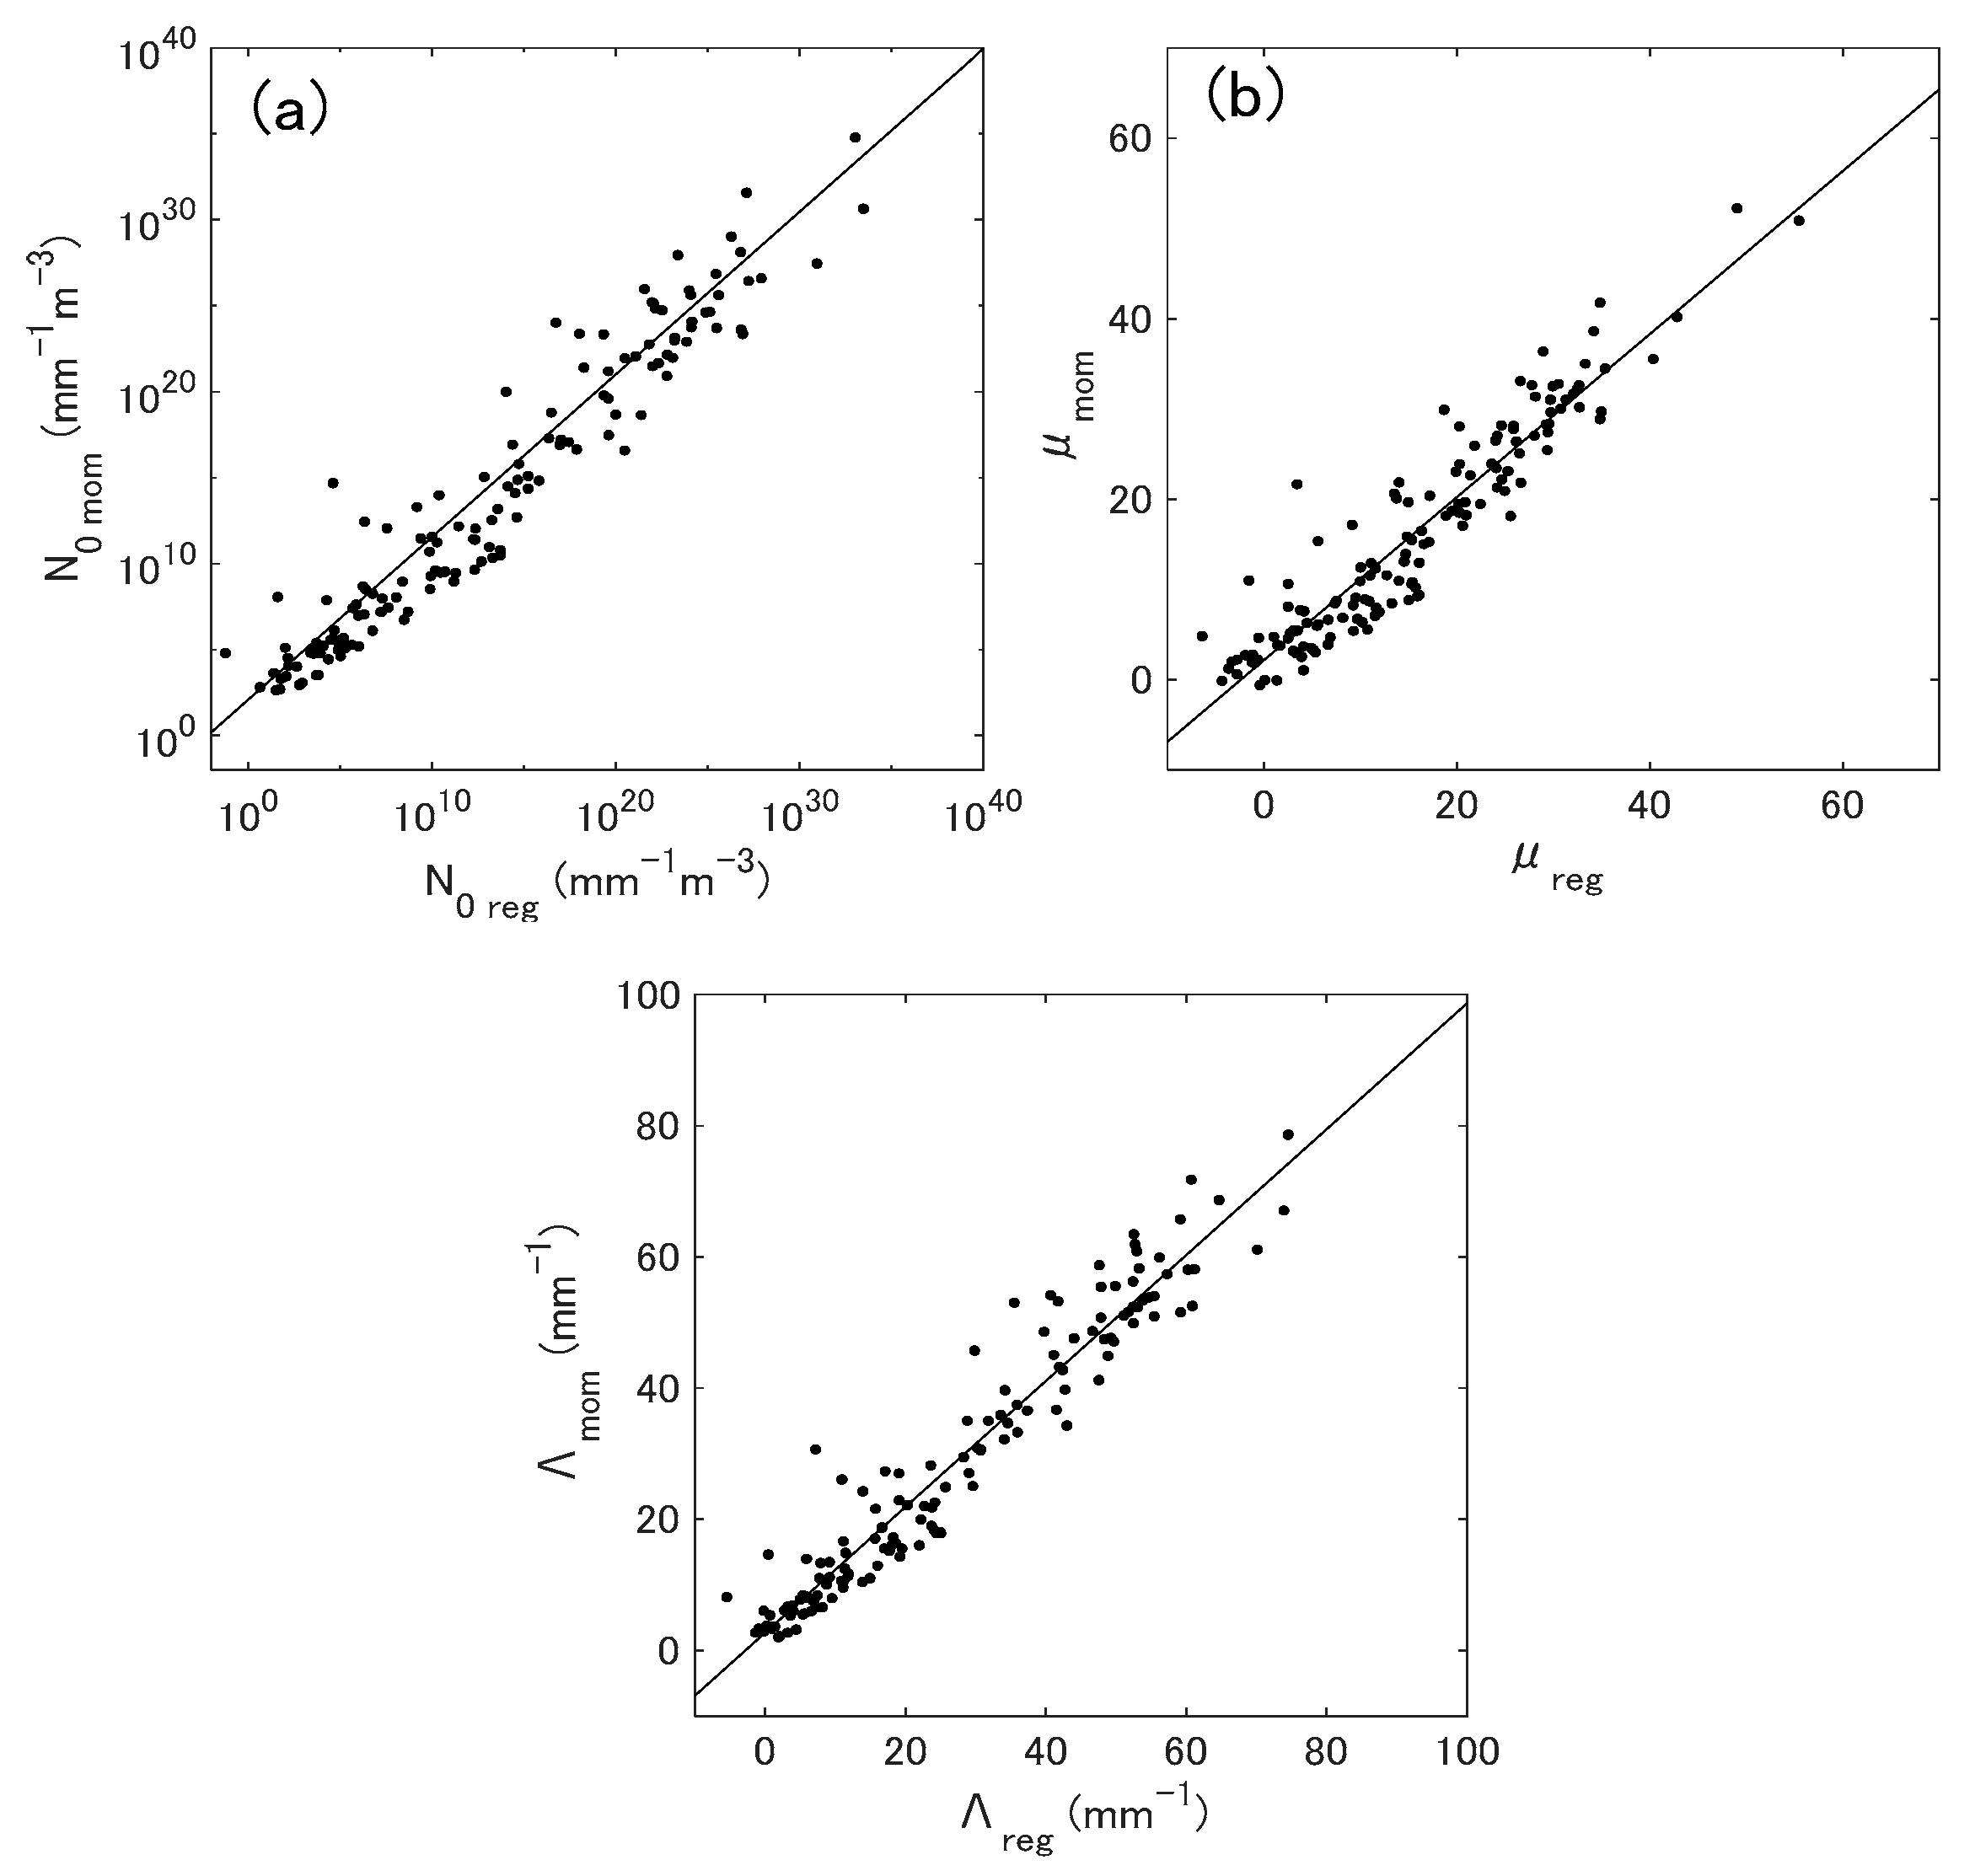
However, when the gamma PSD model is applied to volcanic ash particles, one point remains unclear. ‘Does the gamma PSD model represent observed volcanic ash PSD?’ This question results from the fact that validation studies have been limited due to the lack of observed ash PSD. In this section, we discuss the validity of the gamma PSD model of volcanic ash using PSD data obtained by Parsivel2. First, we examined the validity of the momentum method used to calculate the gamma PSD. As we have already shown in Figure 7 in this paper, the gamma N(D) obtained by the momentum method agreed with that obtained by non-linear regression analysis. However, as the number of analyzed PSD samples was limited in Figure 7, we examined all PSD samples obtained in six eruption cases. It should be mentioned again here that non-linear regression analysis must be executed not to N(D) but to log10N(D). If we used linear N(D) for the analysis, the obtained gamma PSD regression curve would represent only small particles that have large N(D) values. Figure 15 shows comparisons of gamma PSD parameters (N0, μ, Λ) calculated by the momentum method and non-linear regression analysis. Regression lines obtained were as follows.
where, the subscripts ‘mom’ and ‘reg’ in the variables mean the momentum method and regression analysis, respectively. The correlation coefficient R (the root mean square error RMSE) for N0, μ, and Λ were 0.962 (2.23), 0.940 (4.02), and 0.964 (5.38), respectively. We can confirm from these statistical values that the gamma PSD parameters estimated by the moment method agreed with those obtained by non-linear regression analysis.
Log10 N0_mom = 0.934 × log10 N0_reg + 1.47,
μ_mom = 0.904 × μ_reg + 2.14,
Λ_mom = 0.959 × Λ_reg + 2.72.
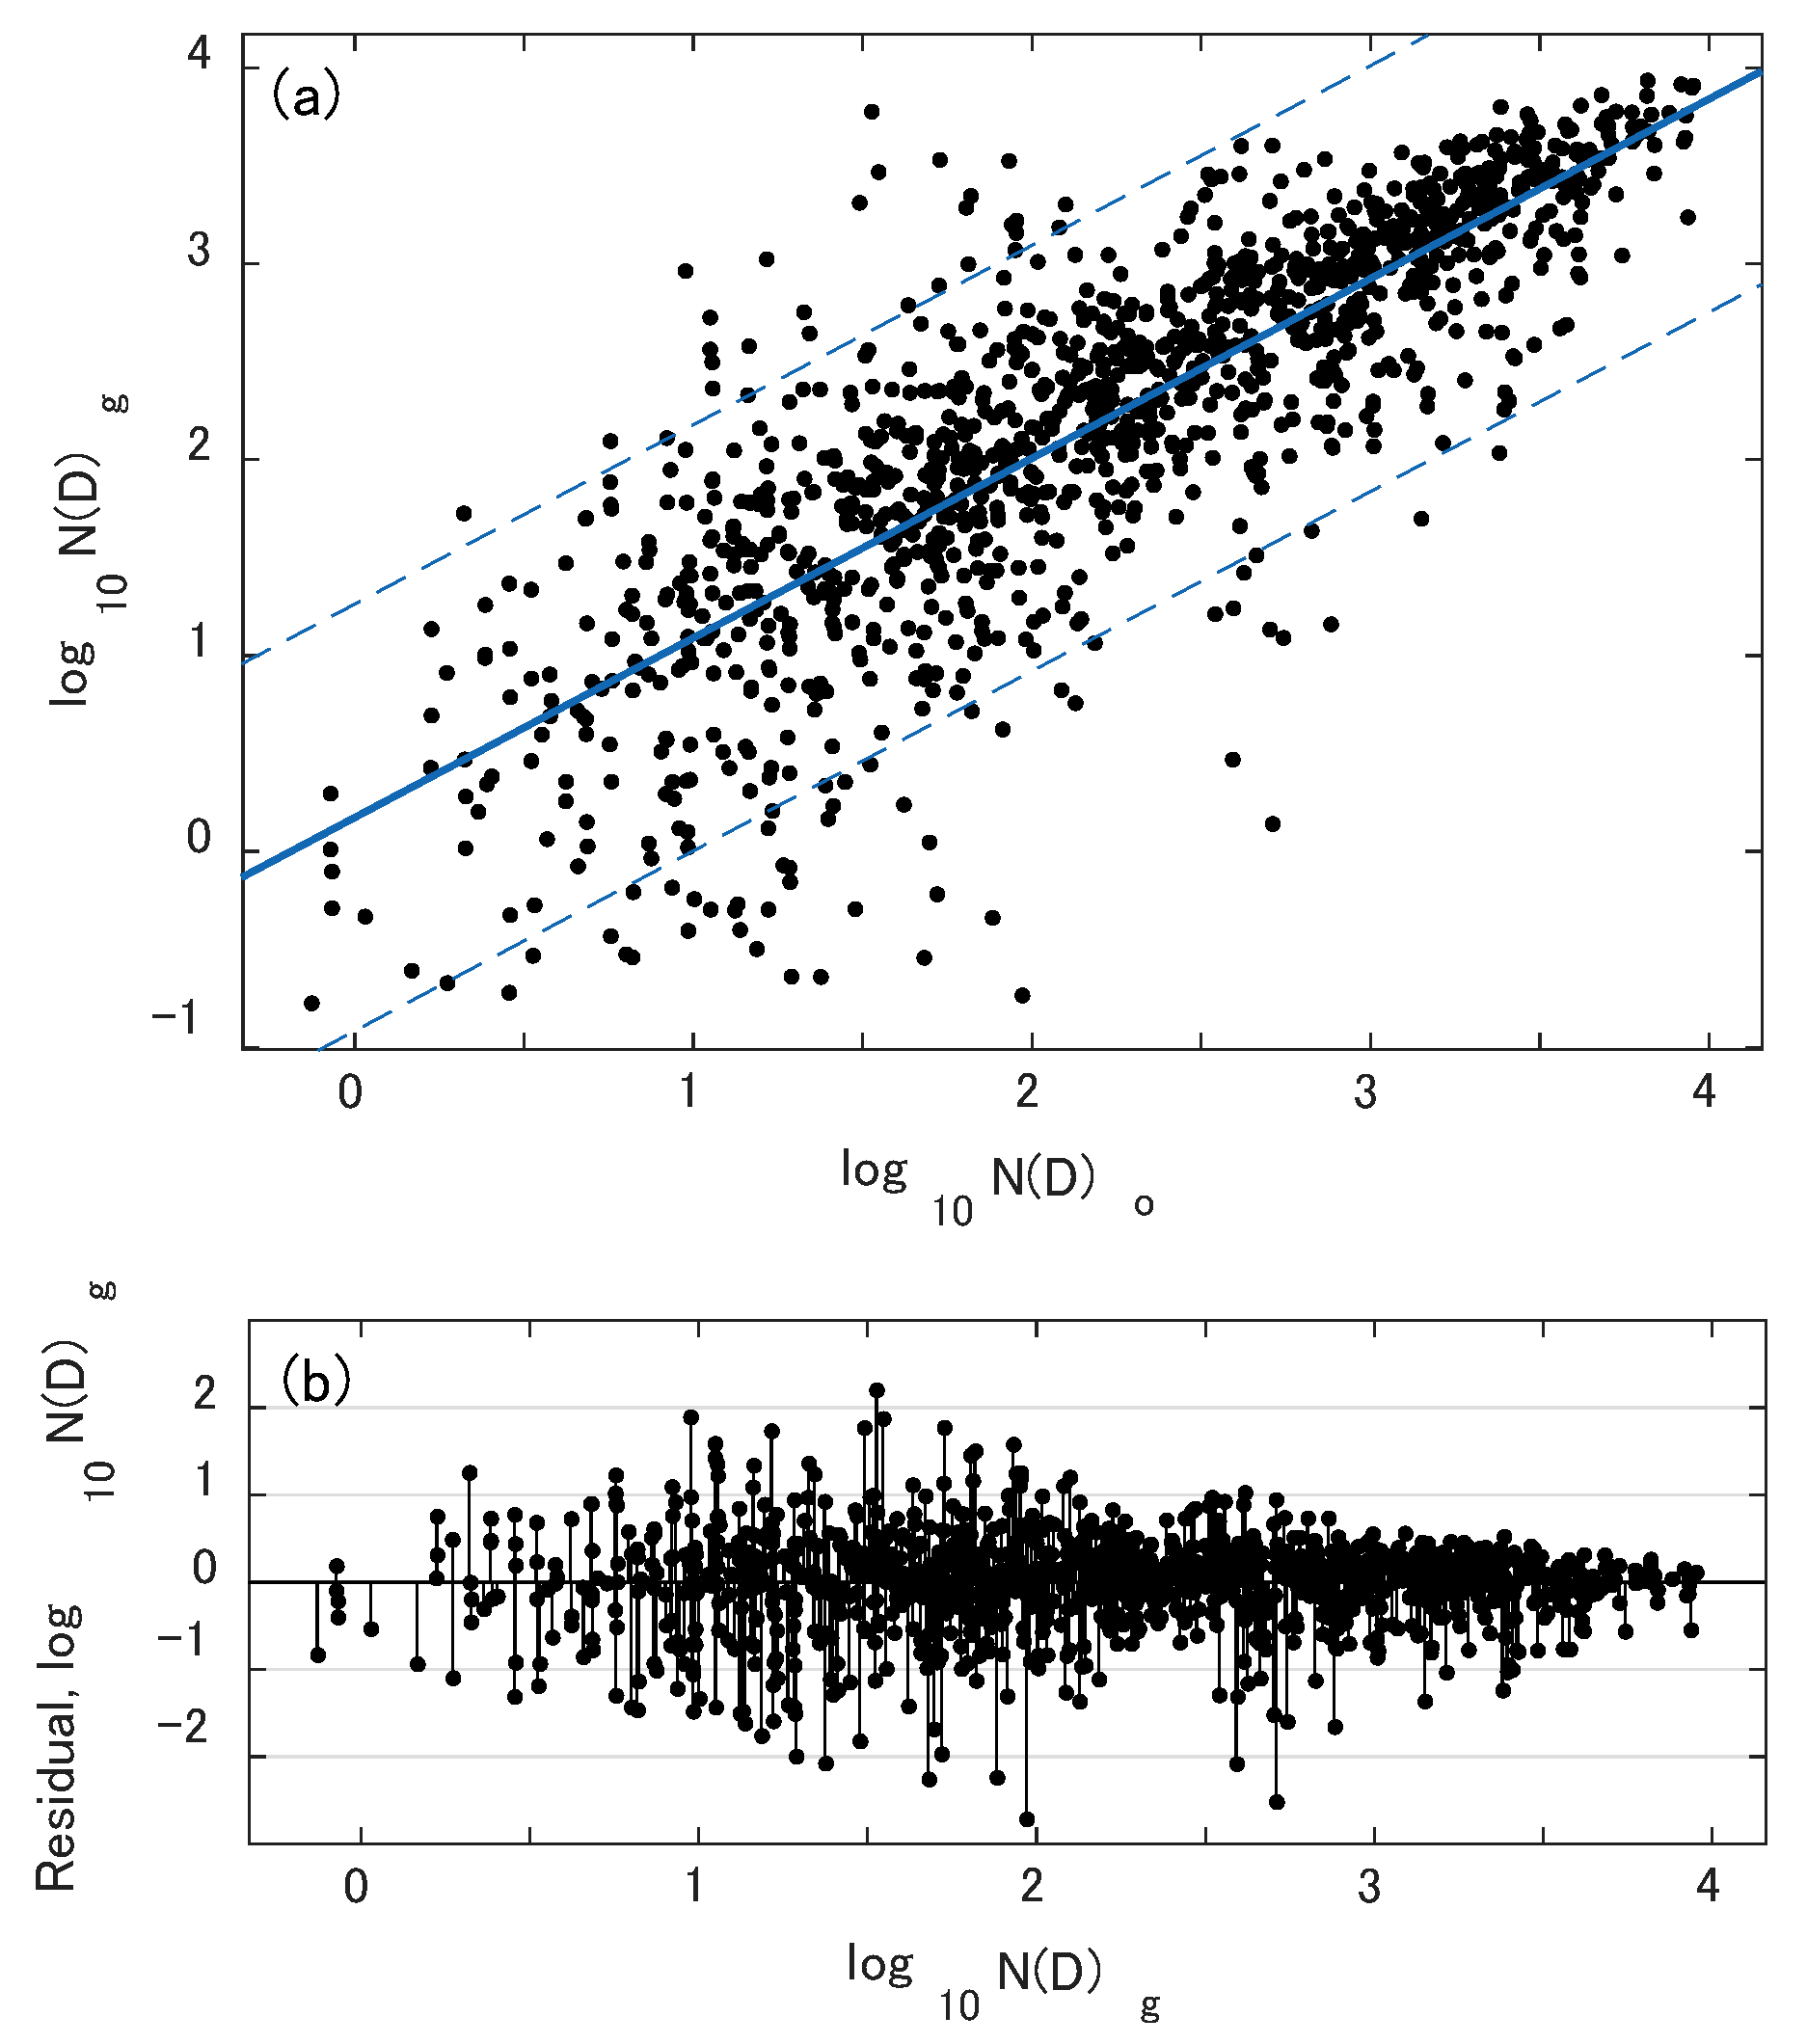
Next, we evaluated the validity of the gamma PSD model itself, which is in turn based on the complete momentum method. The result is shown in Figure 16a. Comparing N(D)_g based on the gamma model with N (D)_o observed by a Parsivel2, we obtained N (D)_g = 0.917 × N (D)_o + 0.175. The R and RMSE were 0.825 and 0.554, respectively. According to Figure 16b, most of the residuals of N (D)_g were within ±10% of their values. Given that the value of N (D) ranged from 100 to 104, these statistical values confirmed that the gamma PSD model is appropriate for describing volcanic ash PSD.
6. Summary
In the present study, we examined the characteristics of the PSD of volcanic ash particles and the relationships among PSD parameters. We used a total of 166 PSD samples collected by Parsivel2 during six explosive eruptions of the Sakurajima volcano in 2018. The PSD data were analyzed using methods developed for use in radar meteorology.
We proposed gamma and normalized PSD models to describe the PSDs of volcanic ash particles. The observed PSD data were well-described by both models. Strong correlations among the gamma PSD parameters (log10N0, Λ, and μ) were found and relationships between the gamma PSD parameters were derived. Interestingly, the μ–Rmax relationship showed that μ changes inversely with Rmax. When Dmax was large, μ approached zero; i.e., the PSD became exponential. These results could be applied to set up initial PSD conditions for a volcanic ash transport and diffusion model. It must be noted that the range of each of the gamma PSD parameters (log10N0, Λ, and μ) of ash particles was wider than that of precipitation particles.
The relationships between gamma PSD parameters can be used to solve the inverse problem in radar meteorology, i.e., the retrieval of PSD parameters from weather radar observations. In precipitation studies, D0 (or Λ) can be estimated from the differential reflectivity ZDR, which is measured by polarimetric radar, and N0 is estimated from D0 and observed Z, assuming that μ = 0 [60]. This method is based on the relationship between raindrop shape and diameter, such that flatter raindrops are associated with larger raindrop diameters. Recently, volcanic ash particle shape has been studied using 2DVD, which was designed to measure the shape of a falling raindrop. The classification of ash particle shapes can then be used to identify the volcanic eruption type [61]. To date, a clear relationship between particle shape and diameter has not been found for volcanic ash particles. Further studies of volcanic ash particle shape are required to establish a method for weather radar retrieval of ash particle PSD.
In this study, we also proposed a normalized PSD model, which does not require consideration of the PSD variation associated with ash fall intensity. We found a clear correlation between RA/Nw and Dm, and derived its power law functional relationship. Once the two parameters Nw and Dm are retrieved from radar measurements, RA can be estimated from the RA/Nw–Dm relationship proposed in this study. However, further theoretical and observational studies are needed to retrieve parameters Nw and Dm; for example, scattering simulations based on observed PSD could be used to establish theoretical relationships between Nw and Dm, and polarimetric radar parameters such as ZDR and KDP. Polarimetric radar observations of volcanic ash particles are necessary to validate such theoretical relationships.
Finally, we proposed conventional formulae for estimating the RA and CA. The RA–Z relationship was derived through regression analysis and the CA–Z relationship was calculated from measured PSD data. Although these relationships have large errors associated with instantaneous monitoring of ash fall caused by spatiotemporal variation in PSD, they are convenient and applicable for radar ash fall monitoring. It should be noted that the relationships obtained in this study were derived from a limited number of data. Thus, further analysis using larger PSD datasets is necessary.
Author Contributions
Conceptualization, M.M.; methodology, M.M.; software, R.T.; validation, M.M. and R.T.; formal analysis, M.M.; investigation, M.M.; resources, M.I.; data curation, M.I.; writing—original draft preparation, M.M.; writing—review and editing, M.M.; visualization, M.M. and R.T.; supervision, M.M.; project administration, M.I.; funding acquisition, M.I. All authors have read and agreed to the published version of the manuscript.
Funding
This research was funded mainly by the Ministry of Education, Culture, Sports, Science and Technology (MEXT) “Integrated Program for Next-generation Volcano Research and Human Resource Development” and partially by the Council for Science, Technology and Innovation (CSTI), “Cross-ministerial Strategic Innovation Promotion Program (SIP)”.
Institutional Review Board Statement
Not applicable.
Informed Consent Statement
Not applicable.
Data Availability Statement
Not applicable.
Acknowledgments
This work was supported by the MEXT “Integrated Program for Next-generation Volcano Research and Human Resource Development”. The radar data analyzed in the present study were obtained from the Ministry of Land, Infrastructure, Transport and Tourism (MLIT) of Japan using a framework designed by the Data Integration and Analysis System (DIAS), which is funded by MEXT.
Conflicts of Interest
The authors declare no conflict of interest. The funders had no role in the design of the study, the collection, analysis, or interpretation of the data, the writing of the manuscript, or the decision to publish the results.
Glossary
All symbols and units used in the present study are listed below. Conventional units in radar meteorology were used instead of Système international (SI) units.
List of symbols and units used in the present study.
| Symbol | Description | Unit |
| Ai | Effective measured area of the i-th size bin | mm2 |
| CA | Volcanic ash mass concentration | kg m−3 |
| Cij | Number of particles measured in i-th diameter bin and j-th Velocity bin | - |
| D | Particle diameter | mm |
| D0 | Median volume diameter | mm |
| Dm | Mass-weighted mean diameter | mm |
| Dmax | Maximum particle diameter | mm |
| Dmin | Minimum particle diameter | mm |
| ΔDi | Bin size of the i-th diameter channel | mm |
| N(D) | Particle size distribution (PSD) | mm−1 m−3 |
| N(Di) | Number of particles from Di to Di + ΔDi per unit volume | mm−1 m−3 |
| N0 | Intercept parameter of gamma PSD | mm–1–μ m−3 |
| NT | Total number of volcanic ash particles | m−3 |
| Nw | Normalized intercept parameter of gamma PSD | mm−1 m−3 |
| nd | Number of diameter bins | - |
| nv | Number of velocity bins | - |
| RA | Ash fall rate; 1 (kg m−2h−1) = ρp/ρb (mm h−1) | mm h−1 |
| Δt | Sampling time (60 s) | s |
| Vj | Fall velocity measured at the j-th velocity bin | m s−1 |
| Vt | Fall velocity of a volcanic ash particle | m s−1 |
| Z | Equivalent reflectivity factor | mm6 m−3 |
| Λ | Slope parameter of gamma PSD | mm−1 |
| μ | Shape parameter of gamma PSD | - |
| ρb | Bulk density of ash deposits (= 1.25 × 10³ kg m−3) | kg m−3 |
| ρp | Density of a solid ash particle (= 2.5 × 10³ kg m−3) | kg m−3 |
References
- Kaminski, E.; Jaupart, C. The size distribution of pyroclasts and the fragmentation sequence in explosive volcanic eruptions. J. Geophys. Res. 1998, 103, 29759–29779. [Google Scholar] [CrossRef]
- Costa, A.; Pioli, L.; Bonadonna, C. Insights into tephra total grain-size distribution from field data analysis. Earth Planet. Sci. Lett. 2016, 443, 90–107. [Google Scholar] [CrossRef]
- Kueppers, U.; Scheu, B.; Spieler, O. Fragmentation efficiency of explosive volcanic eruptions: A study of experimentally generated pyroclasts. J. Volcanol. Geoth. Res. 2006, 153, 125–135. [Google Scholar] [CrossRef]
- Rust, A.C.; Cashman, K.V. Permeability controls on expansion and size distributions of pyroclasts. J. Geophys. Res. 2011, 116, B11202. [Google Scholar] [CrossRef] [Green Version]
- Cashman, K.V.; Scheu, B. Magmatic fragmentation. In The Encyclopedia of Volcanoes, 2nd ed.; Sigurdsson, H., Houghton, B., McNutt, S., Rymer, H., Stix, J., Eds.; Academic Press: Cambridge, MA, USA, 2015; pp. 459–472. [Google Scholar]
- Webley, P.; Mastin, L. Improved prediction and tracking of volcanic ash clouds. J. Volcanol. Geotherm. Res. 2009, 186, 1–9. [Google Scholar] [CrossRef]
- Mastin, L.G.; Guffanti, M.; Servranckx, R.; Webley, P.W.; Barsotti, S.; Dean, K.; Denlinger, R.; Durant, A.; Ewert, J.W.; Gardner, C.A.; et al. A multidisciplinary effort to assign realistic source parameters to model of volcanic ash-cloud transport and dispersion during eruptions. J. Volcanol. Geotherm. Res. 2009, 186, 10–21. [Google Scholar] [CrossRef]
- Cashman, K.; Rust, A. Introduction: Part 2: Volcanic ash: Generation and spatial variations. In Volcanic Ash Hazard Observation; Mackie, S., Cashman, K., Ricketts, H., Rust, A., Watson, M., Eds.; Elsevier: Amsterdam, The Netherlands, 2016; pp. 5–22. [Google Scholar]
- Pioli, L.; Bonadonna, C.; Pistolesi, M. Reliability of total grain-size distribution of tephra deposits. Sci. Rep. 2019, 9, 10006. [Google Scholar] [CrossRef]
- Suh, S.-H.; Maki, M.; Iguchi, M.; Lee, D.-I.; Yamaji, A.; Momotani, T. Free-fall experiments of volcanic ash particles using a 2-D video disdrometer. Atmos. Meas. Tech. 2019, 12, 5363–5379. [Google Scholar] [CrossRef] [Green Version]
- Kozono, T.; Iguchi, M.; Miwa, T.; Maki, M.; Maesaka, T.; Miki, D. Characteristics of tephra fall from eruptions at Sakurajima volcano, revealed by optical disdrometer measurements. Bull. Volcanol. 2019, 81. [Google Scholar] [CrossRef]
- Iguchi, M.; Nakamichi, H.; Tanaka, H.; Ohta, Y.; Shimizu, A.; Miki, D. Integrated monitoring of volcanic ash and forecasting at Sakurajima volcano, Japan. J. Disast. Res. 2019, 14, 798–809. [Google Scholar] [CrossRef]
- Schönhuber, M.; Lammer, G.; Randeu, W.L. The 2D video disdrometer. In Precipitation: Advances in Measurement, Estimation and Prediction; Michaelides, S., Ed.; Springer: Berlin/Heidelberg, Germany, 2008; pp. 3–31. [Google Scholar]
- Kruger, A.; Krajewski, W.F. Two-dimensional video disdrometer: A description. J. Atmos. Ocean. Technol. 2002, 19, 602–617. [Google Scholar] [CrossRef]
- Löffler-Mang, M.; Joss, J. An optical disdrometer for measuring size and velocity of 852 hydrometeors. J. Atmos. Ocean. Technol. 2000, 17, 130–139. [Google Scholar] [CrossRef]
- Tokay, A.; Wolff, D.B.; Petersen, W.A. Evaluation of the new version of the laser-optical disdrometer, OTT Parsivel2. J. Atmos. Ocean. Technol. 2014, 31, 1276–1288. [Google Scholar] [CrossRef]
- OTT. Operating Instructions, Present Weather Sensor, OTT Parsivel2; Document Number 70.210.001.B.E 04-0911; Hydromet GmbH: Kempten, Germany, 2011; 46p. [Google Scholar]
- Krajewski, W.F.; Kruger, A.; Caracciolo, C.; Golé, P.; Barthes, L.; Creutin, J.-D.; Delahaye, J.-Y.; Nikolopoulos, E.I.; Ogden, F.; Vinson, J.-P. DEVEX—Disdrometer evaluation experiment: Basic results and implications for hydrologic studies. Adv. Water Resour. 2006, 29, 311–325. [Google Scholar] [CrossRef]
- Lanza, L.G.; Vuerich, E. The WMO field intercomparison of rain intensity gauges. Atmos. Res. 2009, 94, 534–543. [Google Scholar] [CrossRef]
- Thurai, M.; Petersen, W.A.; Tokay, A.; Schultz, C.; Gatlin, P. Drop size distribution comparisons between Parsivel and 2-D video disdrometers. Adv. Geosci. 2011, 30, 3–9. [Google Scholar] [CrossRef] [Green Version]
- Joss, J.; Waldvogel, A. Ein spektrograph für niederschlagstropfen mit automatischer auswertung (A spectrograph for raindrops with automatic interpretation). Pure Appl. Geophys. 1967, 68, 240–246. [Google Scholar] [CrossRef]
- Kagoshima Local Meteorological Observatory, 2019. List of Sakurajima Eruptions in 2013. Available online: https://www.jma-net.go.jp/kagoshima/vol/data/skr_exp_list/skr_exp_2019.html (accessed on 23 April 2021). (In Japanese)
- JMA. Available online: https://www.jma-net.go.jp/kagoshima/vol/data/skr_exp_2013.html (accessed on 3 October 2019).
- Maki, M.; Kim, Y.; Kobori, T.; Hirano, K.; Lee, D.-I.; Iguchi, M. Analyses of three-dimensional weather radar data from volcanic eruption clouds. J. Volcanol. Geotherm. Res. 2021. [Google Scholar] [CrossRef]
- DIAS. XRAIN Precipitation Original Data search and Download System. Available online: https://auth.diasjp.net/cas/login?service=http://xrain.diasjp.net/original/&locale=en (accessed on 13 March 2019).
- Guyot, A.; Pudashine, J.; Protat, A.; Uijlenhoet, R.; Pauwels, V.R.N.; Seed, A.; Walker, J.P. Effect of disdrometer type on rain drop size distribution characterisation: A new dataset for south-eastern Australia. Hydrol. Earth Syst. Sci. 2019, 23, 4737–4761. [Google Scholar] [CrossRef] [Green Version]
- Ulbrich, C.W. Natural variations in the analytical form of the drop size distribution. J. Clim. Appl. Meteorol. 1983, 22, 1764–1775. [Google Scholar] [CrossRef] [Green Version]
- Ulbrich, C.W.; Atlas, D. Assessment of the contribution of differential polarization to improved rainfall measurements. Radio Sci. 1984, 19, 49–57. [Google Scholar] [CrossRef]
- Chandrasekar, V.; Bringi, V.N. Simulation of radar reflectivity and surface measurements of rainfall. J. Atmos. Ocean. Technol. 1987, 4, 464–478. [Google Scholar] [CrossRef] [Green Version]
- Marshall, J.S.; Palmer, W.M. The distribution of raindrops with size. J. Meteorol. 1948, 5, 165–166. [Google Scholar] [CrossRef]
- Miwa, T.; Maki, M.; Kozono, T.; Fujita, E.; Tanada, T.; Iguchi, M. Experimental measurement on falling velocity of volcanic ash from Sakurajima volcano by using PARSIVEL disdrometer. Annu. Disas. Prev. Res. Inst. Kyoto Univ. 2015, 58, 91–94. Available online: http://hdl.handle.net/2433/210085 (accessed on 23 April 2021). (In Japanese with English abstract).
- Kozono, T.; Miwa, T.; Maki, M.; Maesaka, T.; Miki, D.; Iguchi, M. PARSIVEL tephra-fall observations at Sakurajima Volcano. Annu. Disast. Prev. Res. Inst. Kyoto Univ. 2015, 58B, 86–90, (In Japanese with English abstract). Available online: http://hdl.handle.net/2433/210086 (accessed on 23 April 2021). (In Japanese with English abstract).
- Kozono, T.; Tohoku University, Sendai, Miyagi, Japan. Personal communication, 2020.
- Harris, D.M.; Rose, W.I. Estimating particle sizes, concentrations, and total mass of ash in volcanic clouds using weather radar. JGR Oceans 2019, 88, 10969–10983. [Google Scholar] [CrossRef]
- Sekhon, R.S.; Srivastava, R.C. Doppler radar observations of drop-size distributions in a thunderstorm. J. Atmos. Sci. 1971, 28, 983–994. [Google Scholar] [CrossRef] [Green Version]
- Willis, P.T. Functional fits to some observed drop size distributions and parameterization of rain. J. Atmos. Sci. 1984, 41, 1648–1661. [Google Scholar] [CrossRef] [Green Version]
- Sempere Torres, D.; Porrà, J.M.; Creutin, J.-D. 1998: A general formulation for raindrop size distribution. J. Geophys. Res. 1998, 103, 1785–1797. [Google Scholar] [CrossRef]
- Testud, J.; Le Bouar, E.; Obligis, E.; Ali Mehenni, M. The rain profiling algorithm applied to polarimetric weather radar. J. Atmos. Ocean. Technol. 2000, 17, 332–356. [Google Scholar] [CrossRef]
- Testud, J.; Oury, S.; Black, R.A.; Amayenc, P.; Dou, X. The concept of “normalized” distribution to describe raindrop spectra: A tool for cloud physics and cloud remote sensing. J. Appl. Meteorol. 2001, 40, 1118–1140. [Google Scholar] [CrossRef]
- Delanoë, J.; Protat, A.; Testud, J.; Bouniol, D.; Heymsfield, A.J.; Bansemer, A.; Brown, P.R.A.; Forbes, R.M. Statistical properties of the normalized ice particle size distribution. J. Geophys. Res. 2005, 110, D10201. [Google Scholar] [CrossRef] [Green Version]
- Kozu, T.; Nakamura, K. Rainfall parameter estimation from dual-radar measurements combining reflectivity profile and path-integrated attenuation. J. Atmos. Ocean. Technol. 1991, 8, 251–271. [Google Scholar] [CrossRef] [Green Version]
- Ulbrich, C.W.; Atlas, D. Rainfall microphysics and radar properties: Analysis methods for drop size spectra. J. Appl. Meteorol. 1998, 37, 912–923. [Google Scholar] [CrossRef]
- Ulbrich, C.W. The effects of drop size distribution truncation on rainfall integral parameters and empirical relations. J. Climate Appl. Meteorol. 1985, 24, 580–590. [Google Scholar] [CrossRef] [Green Version]
- Sekhon, R.S.; Srivastava, R.C. Snow size spectra and radar reflectivity. J. Atmos. Sci. 1970, 28, 983–994. [Google Scholar] [CrossRef] [Green Version]
- Bagheri, G.; Bonadonna, C. Aerodynamics of volcanic particles: Characterization of size, shape, and settling velocity. In Volcanic Ash Hazard Observation; Mackie, S., Cashman, K., Ricketts, H., Rust, A., Watson, M., Eds.; Elsevier: Amsterdam, The Netherlands, 2016; pp. 39–52. [Google Scholar] [CrossRef]
- Manzella, I.; Bonadonna, C.; Phillips, J.C.; Monnard, H. The role of gravitational instabilities in deposition of volcanic ash. Geology 2015, 43, 211–214. [Google Scholar] [CrossRef] [Green Version]
- Freret-Lorgeril, V.; Gilchri, J.; Donnadieu, F.; Jellinek, A.M.; Delanoë, J.; Latchimy, T.; Vinson, J.P.; Caudoux, C.; Peyrin, F.; Hervier, C.; et al. Ash sedimentation by fingering and sediment thermals from wind-affected volcanic plumes. Earth Planet. Sci. Lett. 2020, 534. [Google Scholar] [CrossRef]
- Ganser, G.H. A rational approach to drag prediction of spherical and nonspherical particles. Powder Technol. 1993, 77, 143–152. [Google Scholar] [CrossRef]
- Liao, L.; Meneghini, R.; Iguchi, T.; Tokay, A. Characteristics of DSD bulk parameters: Implication for radar rain retrieval. Atmosphere 2020, 11, 670. [Google Scholar] [CrossRef]
- Bringi, V.; Chandrasekar, V. Polarimetric Doppler Weather Radar: Principles and Applications; Cambridge University Press: Cambridge, UK, 2001; pp. 378–426. [Google Scholar] [CrossRef]
- Bringi, V.N.; Chandrasekar, V.; Hubbert, J.; Gorgucci, E.; Randeu, W.L.; Schoenhuber, M. Raindrop size distribution in different climatic regimes from disdrometer and dual-polarized radar analysis. J. Atmos. Sci. 2003, 60, 354–365. [Google Scholar] [CrossRef]
- Jayalakshmi, J.; Seela, B.K.; Lin, P.-L.; Wang, P.K.; Tseng, C.-H.; Reddy, K.K.; Hashiguchi, H.; Feng, L.; Das, S.K.; Unnikrishnan, C.K. Raindrop size distribution characteristics of Indian and Pacific Ocean tropical cyclones observed at India and Taiwan sites. J. Meteorol. Soc. Japan 2020, 98, 299–317. [Google Scholar] [CrossRef] [Green Version]
- Coata, A.; Folch, A.; Macedonio, G. A model for wet aggregation of ash particles in volcanic plumes and clouds: 1. Theoretical formulation. J. Geophys. Res. 2010, 115, B09201. [Google Scholar] [CrossRef]
- Folch, A.; Costa, A.; Durant, A.; Macedonio, G. A model for wet aggregation of ash particles in volcanic plumes and clouds: 2. Model application. J. Geophys. Res. 2010, 115, B09202. [Google Scholar] [CrossRef]
- Brown, R.J.; Bonadonna, C.; Durant, A.J. A review of volcanic ash aggregation. Phys. Chem. Earth Parts A/B/C 2012, 45–46, 65–78. [Google Scholar] [CrossRef] [Green Version]
- Markowitz, A.H. Raindrop size distribution experiments. J. Appl. Meteorol. 1976, 15, 1029–1166. [Google Scholar] [CrossRef] [Green Version]
- Feingold, G.; Levin, Z. Application of the lognormal rain-drop distribution to differential reflectivity radar measurements (ZDR). J. Atmos. Ocean. Technol. 1987, 4, 377–382. [Google Scholar] [CrossRef] [Green Version]
- Cornford, S.G. Sampling errors in measurements of raindrop and cloud droplet concentrations. Meteorol. Mag. 1967, 96, 271–282. [Google Scholar]
- Best, A. The size distribution of raindrops. Quart. J. Roy. Meteorol. Soc. 1950, 76, 16–36. [Google Scholar] [CrossRef]
- Seliga, T.A.; Bringi, V.N. Potential use of radar differential reflectivity measurements at orthogonal polarizations for measuring precipitation. J. Appl. Meteorol. 1976, 15, 69–76. [Google Scholar] [CrossRef] [Green Version]
- Shoji, D.; Noguchi, R.; Otsuki, S.; Hino, H. Classification of volcanic ash particles using a convolutional neural network and probability. Sci. Rep. 2018, 8, 8111. [Google Scholar] [CrossRef]
Figure 1.
Schematic diagram illustrating ash particle diameter and fall velocity measurements by Parsivel2 (Löffler-Mang and Joss, 2000). As a particle passes through the measurement laser beam sheet, voltage reduction ΔV is generated during time interval Δt at the light-receiving device. The particle diameter is estimated from ΔV, and fall velocity is estimated from Δt.

Figure 2.
The network of 13 Parsivel2 instruments installed on Sakurajima to measure volcanic ash particle size distribution (PSD). Triangle indicates the southern summit (Minami-dake); square indicates the position of X-band multi-parameter radar (XMP).
Figure 2.
The network of 13 Parsivel2 instruments installed on Sakurajima to measure volcanic ash particle size distribution (PSD). Triangle indicates the southern summit (Minami-dake); square indicates the position of X-band multi-parameter radar (XMP).

Figure 3.
Density plots of the particle size and fall velocity of volcanic ash particles for six selected eruptions of the Sakurajima volcano. Data were collected by Parsivel2. Color scale indicates drop counts on a log scale. Line indicates the regression curve based on a power law.
Figure 3.
Density plots of the particle size and fall velocity of volcanic ash particles for six selected eruptions of the Sakurajima volcano. Data were collected by Parsivel2. Color scale indicates drop counts on a log scale. Line indicates the regression curve based on a power law.

Figure 4.
Relationships between ash particle fall velocity and diameter proposed in previous studies and the present one.
Figure 4.
Relationships between ash particle fall velocity and diameter proposed in previous studies and the present one.

Figure 5.
Temporal changes in gamma PSD parameters observed by Parsivel2 during eruption 6 (16 July 2018). (a) Ash fall rate RA. (b) Total number of volcanic ash particles NT. (c) Maximum diameter Dmax. (d) Normalized intercept parameter Nw. (e) Mass-weighted diameter Dm.
Figure 5.
Temporal changes in gamma PSD parameters observed by Parsivel2 during eruption 6 (16 July 2018). (a) Ash fall rate RA. (b) Total number of volcanic ash particles NT. (c) Maximum diameter Dmax. (d) Normalized intercept parameter Nw. (e) Mass-weighted diameter Dm.

Figure 6.
Plan position indicator (PPI) image of time-integrated radar reflectivity for eruption clouds formed in eruption 6 (16 July 2018). PPI images were obtained every 2 min at an elevation angle of 1.7°. Circle indicates the location of Parsivel2; triangle indicates the summit of Minami-dake.
Figure 6.
Plan position indicator (PPI) image of time-integrated radar reflectivity for eruption clouds formed in eruption 6 (16 July 2018). PPI images were obtained every 2 min at an elevation angle of 1.7°. Circle indicates the location of Parsivel2; triangle indicates the summit of Minami-dake.

Figure 7.
Temporal changes in measured PSD for eruption 6 (16 July 2018). Solid lines and dashed lines are the gamma PDS fitting curves for the measured PSD data by the moment method and non-linear regression analysis, respectively.
Figure 7.
Temporal changes in measured PSD for eruption 6 (16 July 2018). Solid lines and dashed lines are the gamma PDS fitting curves for the measured PSD data by the moment method and non-linear regression analysis, respectively.

Figure 8.
Histogram and probability density function of gamma PSD parameters including the (a) log of the intercept parameter (log10N0), (b) median volume diameter (D0), (c) slope parameter (Λ), (d) shape parameter (μ), (e) maximum particle diameter (Dmax), and (f) total particle number (NT).
Figure 8.
Histogram and probability density function of gamma PSD parameters including the (a) log of the intercept parameter (log10N0), (b) median volume diameter (D0), (c) slope parameter (Λ), (d) shape parameter (μ), (e) maximum particle diameter (Dmax), and (f) total particle number (NT).

Figure 9.
Scatter plots of gamma PSD parameters: (a) Λ vs. log10N0, (b) Λ vs. μ, (c) Λ vs. Dmax, (d) μ vs. log10N0, (e) μ vs. Dmax, and (f) Dmax vs. log10N0.
Figure 9.
Scatter plots of gamma PSD parameters: (a) Λ vs. log10N0, (b) Λ vs. μ, (c) Λ vs. Dmax, (d) μ vs. log10N0, (e) μ vs. Dmax, and (f) Dmax vs. log10N0.

Figure 10.
Comparison of PSD before and after normalization: (a) N(D) vs. D for the six selected volcanic eruptions measured by Parsivel2 and (b) corresponding plot of N(D)/Nw vs. D/Dm.
Figure 10.
Comparison of PSD before and after normalization: (a) N(D) vs. D for the six selected volcanic eruptions measured by Parsivel2 and (b) corresponding plot of N(D)/Nw vs. D/Dm.

Figure 11.
The same as Figure 8, but for normalized PSD parameters including (a) log10Nw and (b) Dm.
Figure 11.
The same as Figure 8, but for normalized PSD parameters including (a) log10Nw and (b) Dm.

Figure 12.
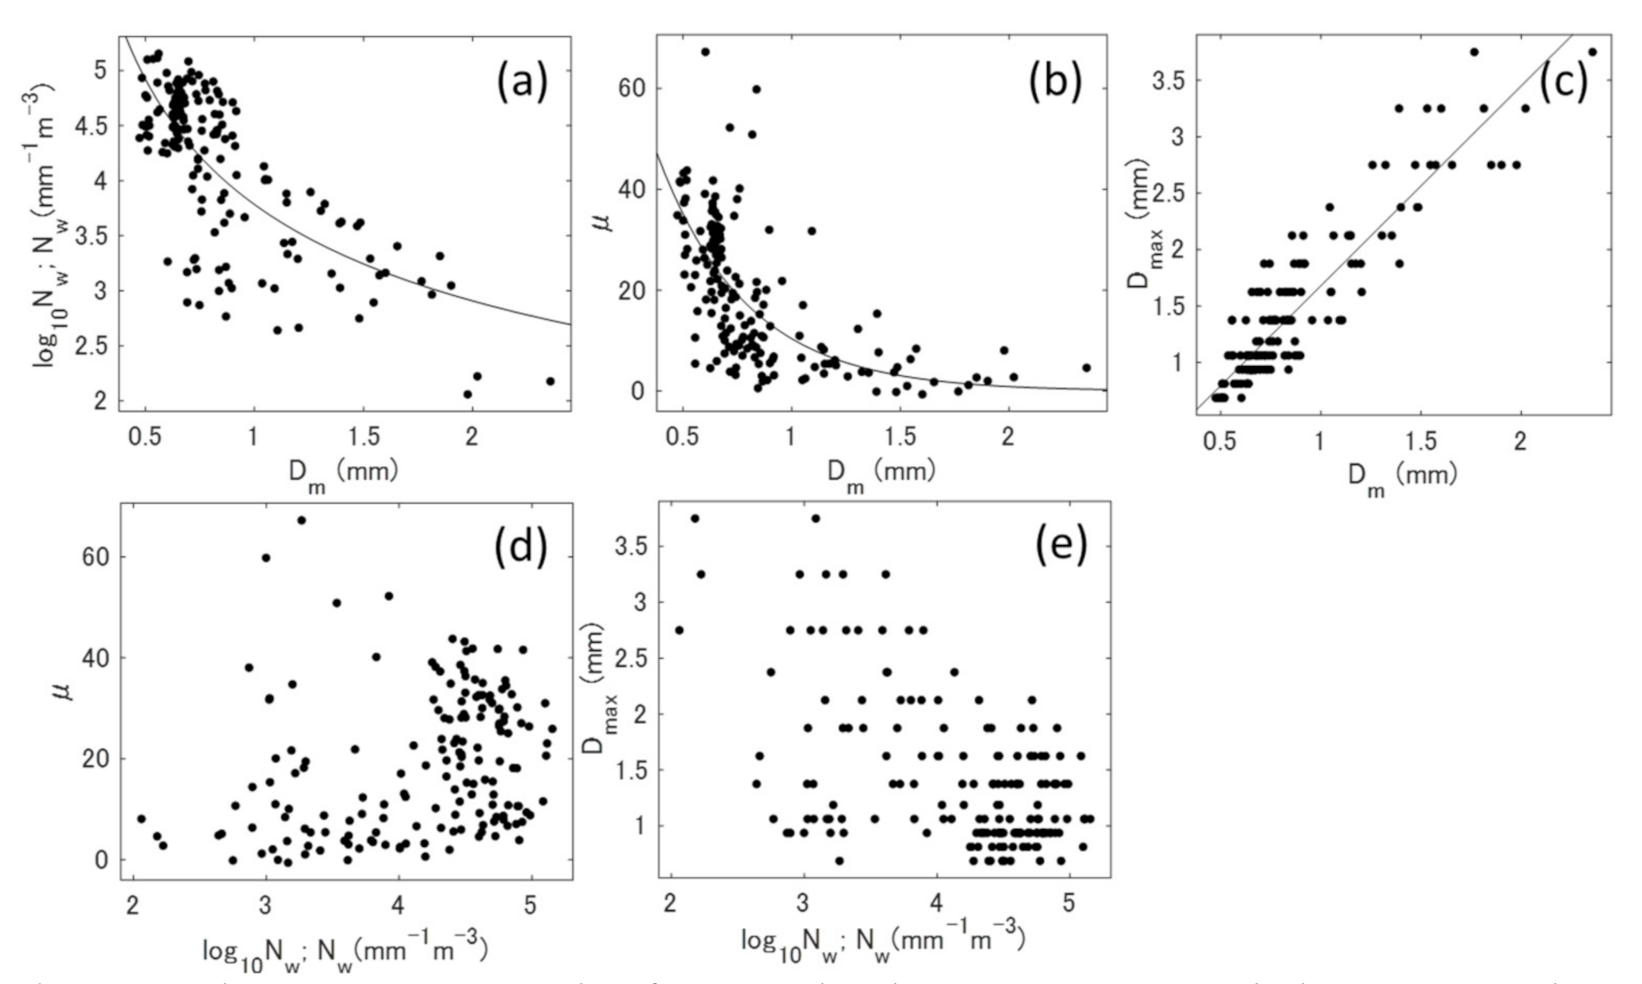
The same as Figure 9, but for normalized PSD parameters including (a) Dm vs. log10Nw, (b) Dm vs. μ, (c) Dm vs. Dmax, (d) log10Nw vs. μ, and (e) log10Nw vs. Dmax.
Figure 12.
The same as Figure 9, but for normalized PSD parameters including (a) Dm vs. log10Nw, (b) Dm vs. μ, (c) Dm vs. Dmax, (d) log10Nw vs. μ, and (e) log10Nw vs. Dmax.


Figure 14.
Quantitative ash fall estimation based on the relationships among integrated PSD parameters including (a) RA–Z, (b) RA/Nw–Dm, where RA, Nw, and Dm were calculated using PSD data obtained by Parsivel2.
Figure 14.
Quantitative ash fall estimation based on the relationships among integrated PSD parameters including (a) RA–Z, (b) RA/Nw–Dm, where RA, Nw, and Dm were calculated using PSD data obtained by Parsivel2.

Figure 15.
Comparison of gamma PSD parameters obtained from the complete momentum method and non-linear regression analysis. (a) log N0, (b) μ, and (c) Λ.
Figure 15.
Comparison of gamma PSD parameters obtained from the complete momentum method and non-linear regression analysis. (a) log N0, (b) μ, and (c) Λ.

Figure 16.
(a) Comparison of the gamma PSD model and observed PSDs. The solid line represents the regression line, and the dashed lines are 95% confidence limits. (b) The residual of gamma N(D) expressed on a logarithmic scale. The subscripts ‘g’ and ‘o’ in the variables mean the gamma PSD model and observed PSD, respectively.


Table 1.
Main specifications of the Parsivel2 disdrometer, according to the instruction manual (OTT, 2011).
Table 1.
Main specifications of the Parsivel2 disdrometer, according to the instruction manual (OTT, 2011).
| Category | Subcategory | Specification |
|---|---|---|
| Sensor | Type | Laser diode |
| Wavelength | 650 nm | |
| Output rating | 0.2 mW | |
| Laser class | 1 (IEC/EN 60825-1: 2014) | |
| Sampling | Light strip (W × D) | 30 × 1 mm (54 cm2) |
| Area (W × D) | 180 × 30 mm (54 cm2) | |
| Interval | 10 s to 60 min | |
| Output | Particle size | 32 classes: 0.2, …, 8 mm (liquid particles) 32 classes: 0.2, …, 25 mm (solid particles) |
| Fall velocity | 32 classes: 0.2, …, 20 m s−1 | |
| Precipitation intensity (accuracy) | 0.001, …, 1200 mm h−1 (±5% for liquid, ±20% for solid) | |
| Precipitation type | 8 types (drizzle, drizzle/rain, rain, snow, mixed rain/snow, snow grains, sleet, hail) | |
| Radar reflectivity factor | −9.999, …, 99.999 dBZ ± 20% | |
| Kinetic energy | 0, …, 999.999 J/(m2 h) | |
| Visibility in precipitation | 0, …, 20,000 m |
Table 2.
List of Sakurajima volcanic eruptions analyzed in the present study.
| Case | Eruption Onset (LST) | Cloud Top Height (m) | Movement | Disdrometer Code |
|---|---|---|---|---|
| 1 | 08:08, 15 May 2018 | 2500 | Top | NABE |
| 2 | 19:48, 22 May 2018 | Unknown | Unknown | HIKP, HART |
| 3 | 08:01, 30 May 2018 | 2500 | Eastward | KURP |
| 4 | 11:35, 10 June 2018 | 3500 | Top | HART |
| 5 | 07:19, 16 June 2018 | 4700 | Westward | SBTT |
| 6 | 15:38, 16 July 2018 | 4600 | Westward | AKAM |
Table 3.
List of coefficients and exponents of ash particle fall velocity formulae proposed in previous studies. Vt (D) = a Db, where Vt is expressed in m s−1 and D is expressed in mm.
Table 3.
List of coefficients and exponents of ash particle fall velocity formulae proposed in previous studies. Vt (D) = a Db, where Vt is expressed in m s−1 and D is expressed in mm.
| a | b | Note | Reference |
|---|---|---|---|
| 5.90 | 0.530 | 0.25 ≤ D < 4 mm (free fall experiments, Parsivel2) | Miwa et al. [31] |
| 5.96 | 0.530 | 0.25 ≤ D < 4 mm (free fall experiments, 2DVD) | Suh et al. [10] |
| 4.04 | 0.830 | 0.25 ≤ D < 2 mm (Sakurajima, Parsivel2, 26,075 particles) | Kozono et al. [32] |
| 3.96 | 0.748 | 0.25 ≤ D < 4 mm (Sakurajima, Parsivel2, 79,170 particles) | Kozono [33] |
| 3.18 | 0.728 | 0.25 ≤ D < 4 mm (Sakurajima, Parsivel2, 63,237 particles) | Present study |
| 3.14 | 0.817 | 0.25 ≤ D < 2 mm (Sakurajima, Parsivel2, 63,237 particles) | Present study |
| 3.42 | 0.371 | 0.2 ≤ D ≤ 6.0 mm (Mt. St. Helens, 19 March 1982) | Harris and Rose [34] |
| 5.02 | 0.335 | 0.22 ≤ D ≤ 1.3 mm (Mt. St. Helens, 19 March 1982) | Harris and Rose [34] |
| 6.87 | 1.0 | 0.02 ≤ D ≤ 0.38 mm (Mt. St. Helens, 18 May 1980) | Harris and Rose [34] |
| 4.33 | 0.437 | 0.02 ≤ D ≤ 6.0 mm (Mt. St. Helens, all data) | Present study (average) |
Table 4.
Statistical values of gamma, normalized, and integrated particle size distribution (PSD) parameters. ρb = 1.25 × 10³ kg m−3 and ρp = 2.50 × 10³ kg m−3 were assumed for the estimation of RA.
Table 4.
Statistical values of gamma, normalized, and integrated particle size distribution (PSD) parameters. ρb = 1.25 × 10³ kg m−3 and ρp = 2.50 × 10³ kg m−3 were assumed for the estimation of RA.
| Parameter | Unit | Mode | Med | Mean | SD | Max | Skew | D10 | D90 |
|---|---|---|---|---|---|---|---|---|---|
| log10 N0 | mm−1 m−3 | 8.83 | 9.64 | 15.8 | 9.64 | 47.9 | 0.581 | 4.79 | 28.2 |
| L | mm−1 | 13.4 | 27.2 | 33.5 | 25.0 | 118 | 0.742 | 6.05 | 65.4 |
| D0 | mm | 0.65 | 0.69 | 0.79 | 0.292 | 2.13 | 1.88 | 0.54 | 1.21 |
| m | – | 8.3 | 17.1 | 18.9 | 13.7 | 67.3 | 0.661 | 3.10 | 36.8 |
| Dmax | mm | 0.97 | 1.19 | 1.42 | 0.679 | 3.75 | 1.42 | 0.81 | 2.36 |
| log10Nw | mm−1 m−3 | 4.60 | 4.42 | 4.15 | 0.704 | 5.15 | −0.875 | 3.07 | 4.87 |
| Dm | mm | 0.853 | 1.19 | 0.853 | 0.350 | 2.36 | 1.83 | 0.559 | 139 |
| NT | m−3 | 182 | 252 | 381 | 380 | 1788 | 1.75 | 26 | 998 |
| RA | mm h−1 | 0.52 | 1.08 | 2.01 | 2.17 | 11.7 | 1.64 | 0.23 | 5.43 |
| CA | g m−3 | 0.0931 | 0.180 | 0.225 | 0.189 | 0.845 | 1.21 | 0.0323 | 0.478 |
| 10log10Z | dBZ | 17.1 | 18.2 | 19.3 | 7.43 | 36.9 | 0.087 | 9.28 | 28.8 |
Table 5.
Summary of relationships among gamma PSD parameters. The numbers in the brackets are the correlation coefficient and the root-mean-square error, respectively.
Table 5.
Summary of relationships among gamma PSD parameters. The numbers in the brackets are the correlation coefficient and the root-mean-square error, respectively.
| log10N0 | Λ | μ | Dmax | |
|---|---|---|---|---|
| log10N0 | - | log10N0 = 0.383 Λ + 2.942 (0.995, 0.91) | log10N0 = 0.684 μ + 2.89 (0.973, 2.211) | log10N0 = 19.67 Dmax −1.606 (0.920, 3.784) |
| Λ | Λ = 2.585 log10N0 − 7.308 (0.995, 2.361) | - | Λ = 1.751 μ + 0.469 (0.960, 7.005) | Λ = 42.23 Dmax−2.046 (0.937, 8.76) |
| μ | μ = 1.386 log10N0 − 3.02 (0.974, 3.148) | μ = 0.527 Λ + 1.222 (0.960, 3.842) | - | μ = 23.87 Dmax−1.713 (0.853, 7.178) |
| Dmax | Dmax = 5.863 log10N0 − 0.595 (0.922, 0.263) | Dmax = 4.862 Λ−0.418 (0.937, 0.238) | Dmax = 3.018 μ−0.314 (0.779, 0.393) | - |
Table 6.
RA–Z and CA–Z relationships obtained from regression analyses of PSD data measured by Parsivel2. Note that RA (mm h−1), CA (g m−3), Z (mm6 m−3). R: correlation coefficient, RMSE: root mean square error. ρb = 1.25 × 10³ kg m−3 and ρp = 2.50 × 10³ kg m−3 were assumed for the estimation of RA.
| Case | Site | Sampling Period (LST) | (min) | RA–Z Relationship (R, RMSE) | CA–Z Relationship (R, RMSE) | Range |
|---|---|---|---|---|---|---|
| 1 | NABE | 08:22–08:35, 15 May 2018 | 14 | RA = 8.62 × 10⁻² Z 0.809 (0.963, 0.300) | CA = 1.51 × 10⁻² Z 0.680 (0.912, 0.046) | 0 ≤ Z ≤ 1 × 10² |
| 2 | HART | 20:03–20:11, 22 May 2018 | 9 | RA = 5.44 × 10⁻² Z 0.595 (0.910, 0.907) | CA = 0.629 × 10⁻² Z 0.569 (0.950, 0.058) | 0 ≤ Z ≤ 2 × 10³ |
| HIKP | 20:00–20:14, 22 May 2018 | 12 | RA = 3.03 × 10⁻² Z 0.826 (0.977, 0.397) | CA = 0.496 × 10⁻² Z 0.770 (0.980, 0.043) | 0 ≤ Z ≤ 1 × 10³ | |
| 3 | KURP | 08:09–08:13, 30 May 2018 | 4 | RA = 14.6 × 10⁻² Z 0.522 (0.959, 0.613) | CA = 1.72 × 10⁻² Z 0.423 (0.903, 0.055) | 0 ≤ Z ≤ 1 × 10³ |
| 4 | HART | 12:03–12:20, 10 June 2018 | 12 | RA = 9.45 × 10⁻² Z 0.568 (0.972, 0.929) | CA = 4.49× 10⁻² Z 0.294 (0.899, 0.073) | 0 ≤ Z ≤ 5 × 10³ |
| 5 | SBTT | 07:35–08:21, 16 June 2018 | 31 | RA = 3.55 × 10⁻² Z 0.778 (0.917, 0.339) | CA = 1.20 × 10⁻² Z 0.692 (0.960, 0.036) | 0 ≤ Z ≤ 4 × 10² |
| 6 | AKAM | 15:53–16:12, 16 July 2018 | 18 | RA = 10.0 × 10⁻² Z 0.653 (0.851, 1.123) | CA = 0.553 × 10⁻² Z 0.782 (0.913, 0.100) | 0 ≤ Z ≤ 7 × 10² |
| All | - | - | 88 | RA = 22.8 × 10⁻² Z 0.436 (0.819, 1.247) | CA = 6.56 × 10⁻² Z 0.261 (0.634, 0.147) | 0 ≤ Z ≤ 5 × 10³ |
Publisher’s Note: MDPI stays neutral with regard to jurisdictional claims in published maps and institutional affiliations. |
© 2021 by the authors. Licensee MDPI, Basel, Switzerland. This article is an open access article distributed under the terms and conditions of the Creative Commons Attribution (CC BY) license (https://creativecommons.org/licenses/by/4.0/).
Share and Cite
MDPI and ACS Style
Maki, M.; Takaoka, R.; Iguchi, M. Characteristics of Particle Size Distributions of Falling Volcanic Ash Measured by Optical Disdrometers at the Sakurajima Volcano, Japan. Atmosphere 2021, 12, 601. https://doi.org/10.3390/atmos12050601
AMA Style
Maki M, Takaoka R, Iguchi M. Characteristics of Particle Size Distributions of Falling Volcanic Ash Measured by Optical Disdrometers at the Sakurajima Volcano, Japan. Atmosphere. 2021; 12(5):601. https://doi.org/10.3390/atmos12050601
Chicago/Turabian StyleMaki, Masayuki, Ren Takaoka, and Masato Iguchi. 2021. "Characteristics of Particle Size Distributions of Falling Volcanic Ash Measured by Optical Disdrometers at the Sakurajima Volcano, Japan" Atmosphere 12, no. 5: 601. https://doi.org/10.3390/atmos12050601
Note that from the first issue of 2016, this journal uses article numbers instead of page numbers. See further details here.