
The Use of the Odor Profile Method with an “Odor Patrol” Panel to Evaluate an Odor Impacted Site near a Landfill

Department of Environmental Health Science, UCLA, School of Public Health, Los Angeles, CA 90095, USA
*
Author to whom correspondence should be addressed.
Atmosphere 2021, 12(4), 472; https://doi.org/10.3390/atmos12040472
Submission received: 27 January 2021
/
Revised: 3 April 2021
/
Accepted: 5 April 2021
/
Published: 9 April 2021
(This article belongs to the Special Issue Environmental Odour)
Abstract
:A third-party-trained “Odor Patrol” program was conducted at a school that is about a one-mile distance from a landfill to clarify the odor nuisance problems from the landfill. Every 20 min from 6 to 9 a.m. on school days, the “Odor Profile Method” (OPM) was used with the landfill odor wheel to identify the odor type and intensity of each odor type. This study showed that an Odor Patrol using the OPM can accurately define odor nuisance changes over time and can be used as a method to confirm changes of odor nuisances in a field study. The Odor Patrol only found 13 data inputs of the 1000 data inputs (1.3%) for the 100-day odor monitoring with a landfill odor or trash odor that could cause odor complaints. The Odor Patrol data and the Odor Complaint data compared well. The OPM by an “Odor Patrol” could determine the contribution of the nuisance odors from 6 to 9 a.m. at the school site, about one mile away from the landfill. The study demonstrated a novel approach for odor monitoring by using the Odor Profile Method with an Odor Patrol. The OPM not only confirmed the mitigation of a landfill odor problem, but it also determined odor character, odor intensity, odor frequency and odor duration during this study period. “Landfill gas” was determined to be primarily a rotten vegetable odor with a secondary sewery/fecal odor of lower intensity, and “trash odors” were primarily a rancid and sweet odor with a secondary sewery/fecal and/or rotten vegetable odor of lower intensities generated from trash reaching the landfill. The order of intensity observed from high to low was: Trash odor (Rancid–Sweet) > Rotten vegetable > Sewery/Fecal > Rancid. Thus, trash odor is the major problematic odor from the landfill site. Quality assurance methods were used to remove local odors from the evaluation.
1. Introduction
Since 2009, California‘s South Coast Air Quality Management District (SCAQMD) has seen a dramatic increase in the number of complaints related to nuisance odors from a landfill. This landfill processes one-third of the daily waste from Los Angeles County per day. This is about 8300 tons of waste daily or more than 2.3 million tons annually. The landfill primarily accepts trash that has been separated from other waste streams, such as, green wastes, metals and plastics.
The SCAQMD method for odor detection relies on counting consumer complaints and sending an odor inspector to investigate the odor problem at the complaint location. When the consumer complaints reach an excessive number, and these are verified by the odor inspectors, SCAQMD considers it an odor nuisance problem.
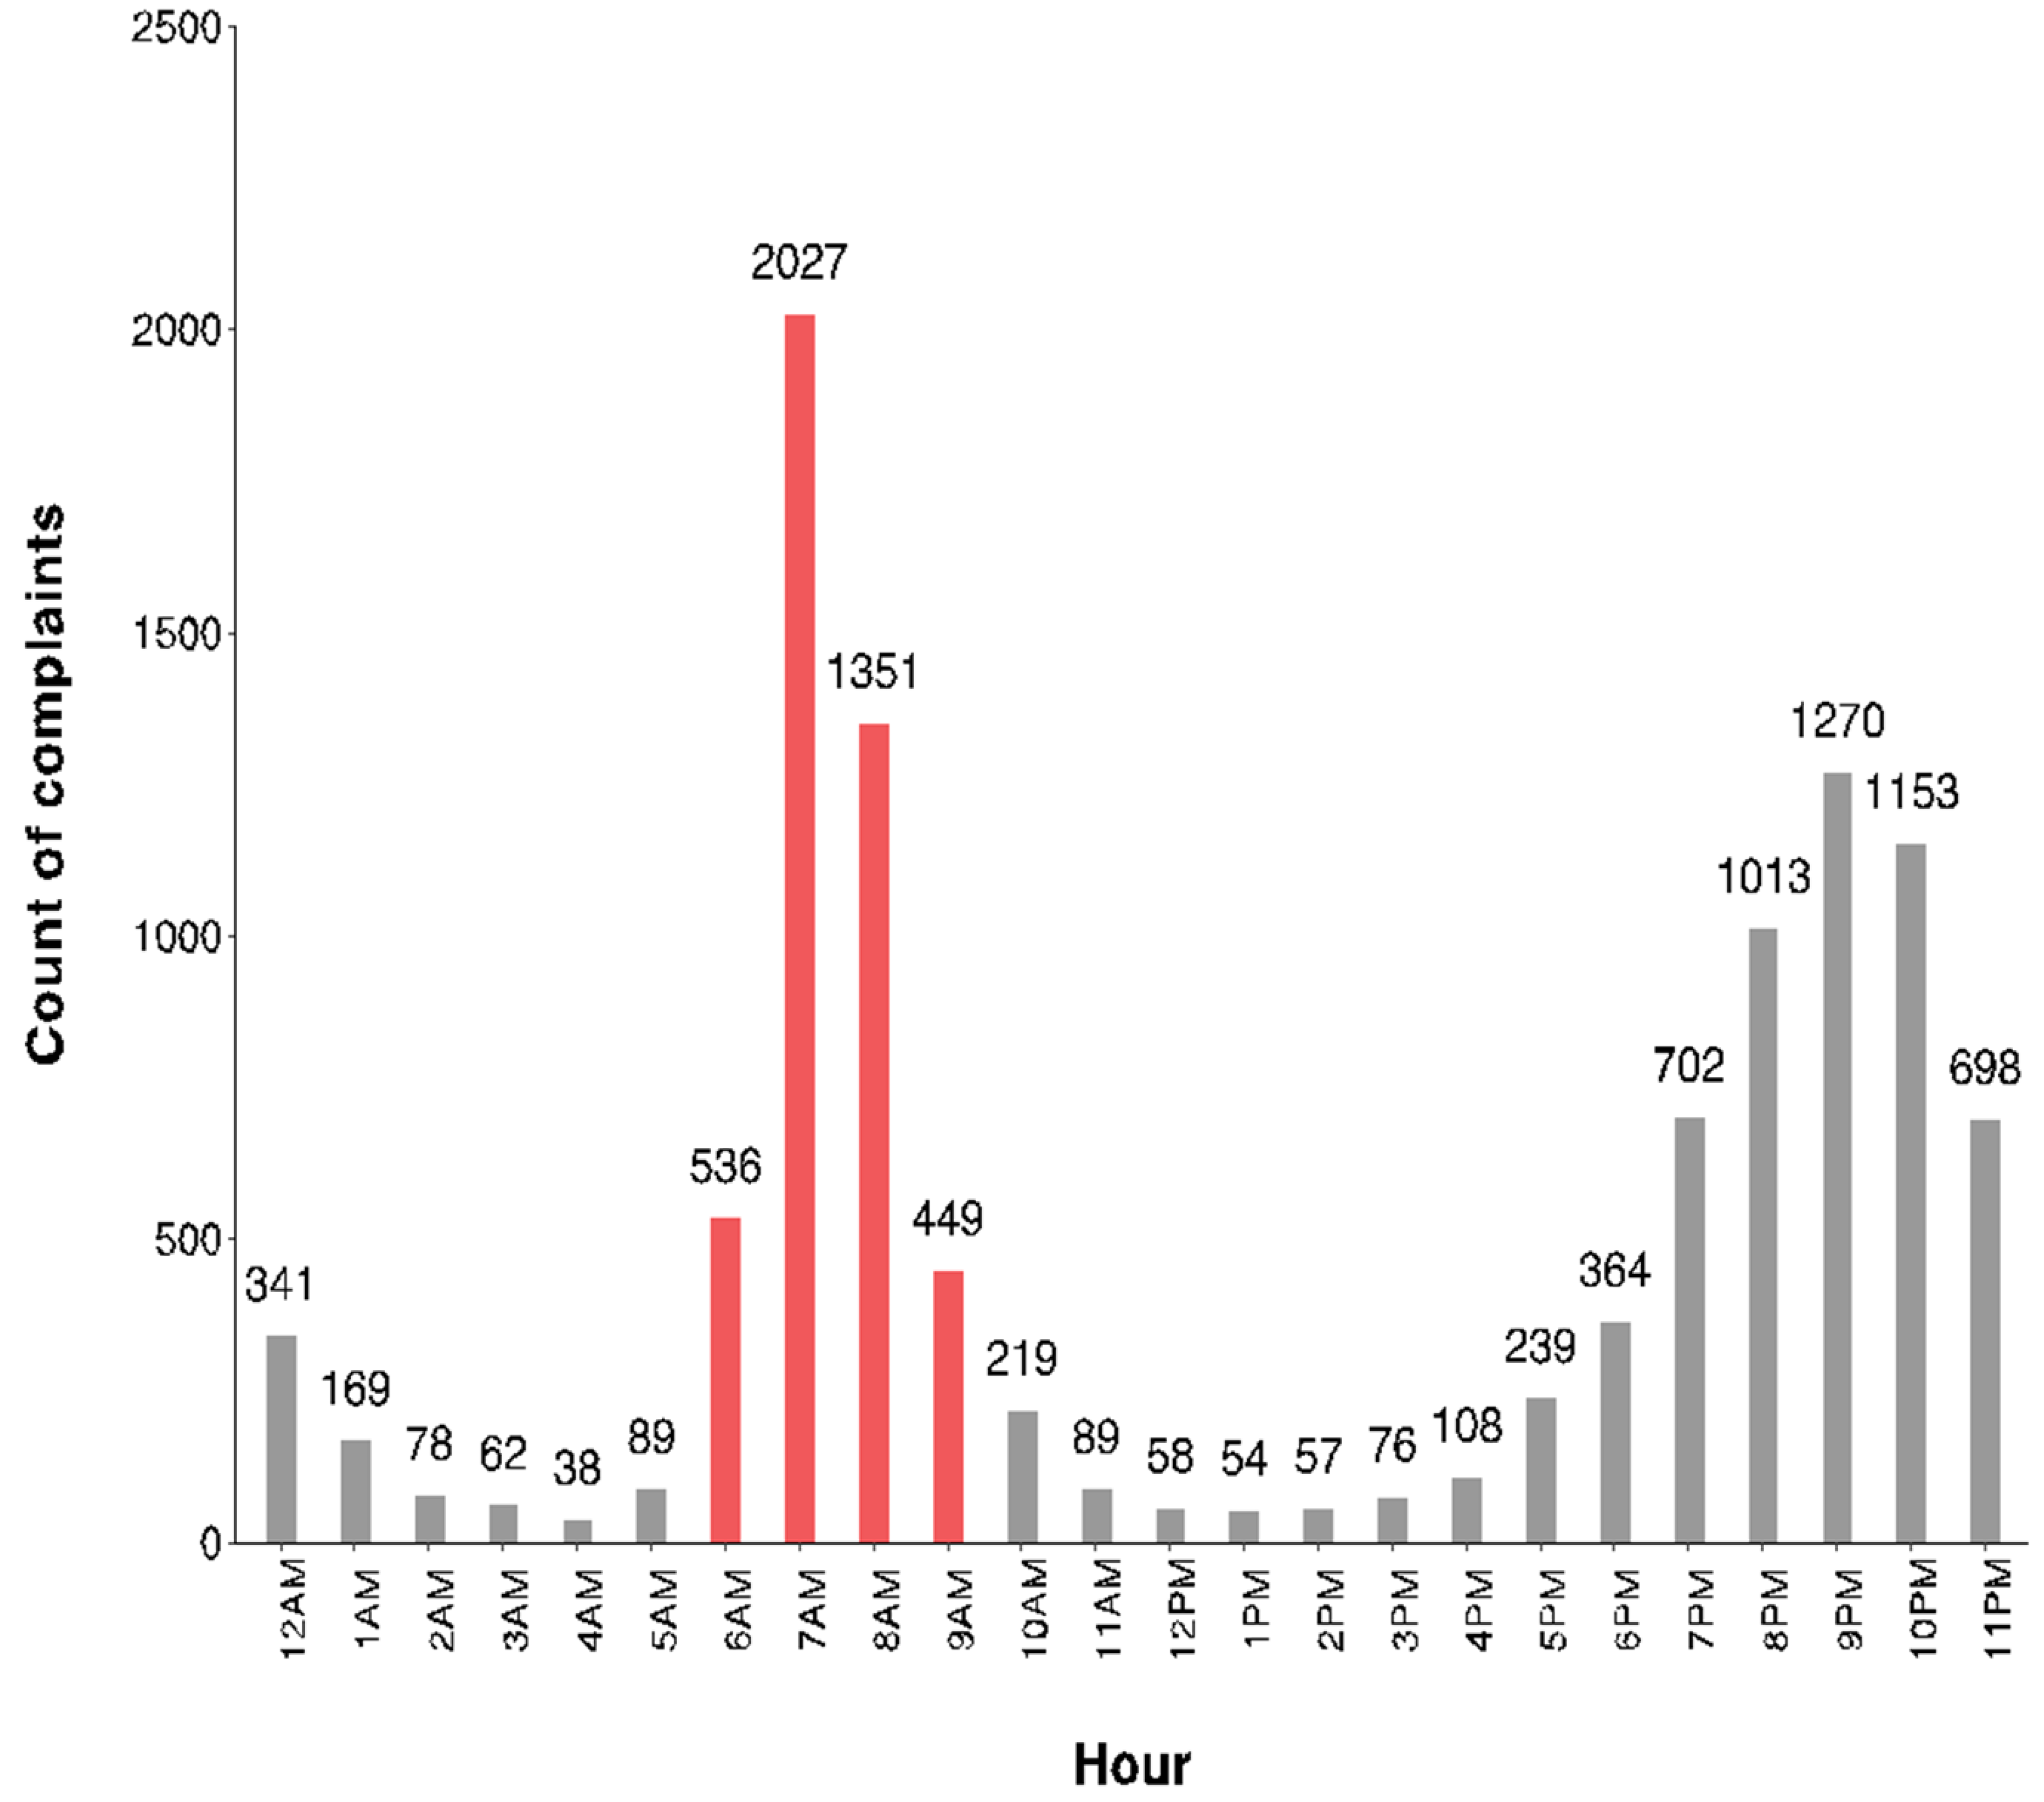
Figure 1 shows the Odor Complaint history between 6 and 9 a.m. in an area about a mile away from the landfill between the years 2008 and 2018 [1]. Figure 1 shows that thousands of complaints were most frequently received between 6 and 9 a.m. on weekdays.
There were some concerns related to the complaint data. The general population has not been trained with professional knowledge about identifying odors. Thus, they might be mistaking other environmental odors from the surrounding area with the odors from the landfill. The population may make false odor reports because of continuous odor concerns. The inspectors developed a general knowledge of the source of odors characteristics as landfill gas and trash odor. However, they were not professionally trained to characterize multiple odor characteristics such as rancid and sweet at a site, unlike the food and drinking water professional panelists, who use a standard method: Flavor Profile Analysis (FPA) [2,3]. The inspectors, apparently, did not have an odor intensity scale to rate the intensity of each odor characteristic. Additionally, another major concern was the duration of an odor event. The residents might not be observing an odor at the same time as when an inspector arrives at the complaint site.
The landfill was required by SCAQMD not to accept waste between 6 and 9 a.m. on weekdays due to a large number of complaints. SCAQMD decided that a Third-Party Odor-Monitoring Program should be conducted at the school site from 30 October 2017 to 2 May 2018 (100-week days) to evaluate the effects of closing the landfill between 6 and 9 a.m. weekdays. The Odor Monitoring Program selected was a human panel called an “Odor Patrol” that used the unique “Odor Profile Method” (OPM) [4,5,6,7] for air analysis based upon the well-documented Flavor Profile Analysis [2,3] that uses trained odor professionals.
The objectives of the study were:
- Determine if the “Odor Profile Method” by an “Odor Patrol” can evaluate the odor nuisance caused by a particular odor source: i.e., determine the odor character, odor intensity of each odorant and determine the frequency and duration of the odor problem.
- Can the “Odor Profile Method” by an “Odor Patrol” be used to determine if closure of the landfill between 6 and 9 a.m. can minimize odor complaints at an impacted site about one mile away?
The novelty of this study is the use of OPM to describe the odors and the intensity of each odor that can be defined as being from a landfill.
2. Materials and Methods
2.1. Experimental Method–Odor Profile Method
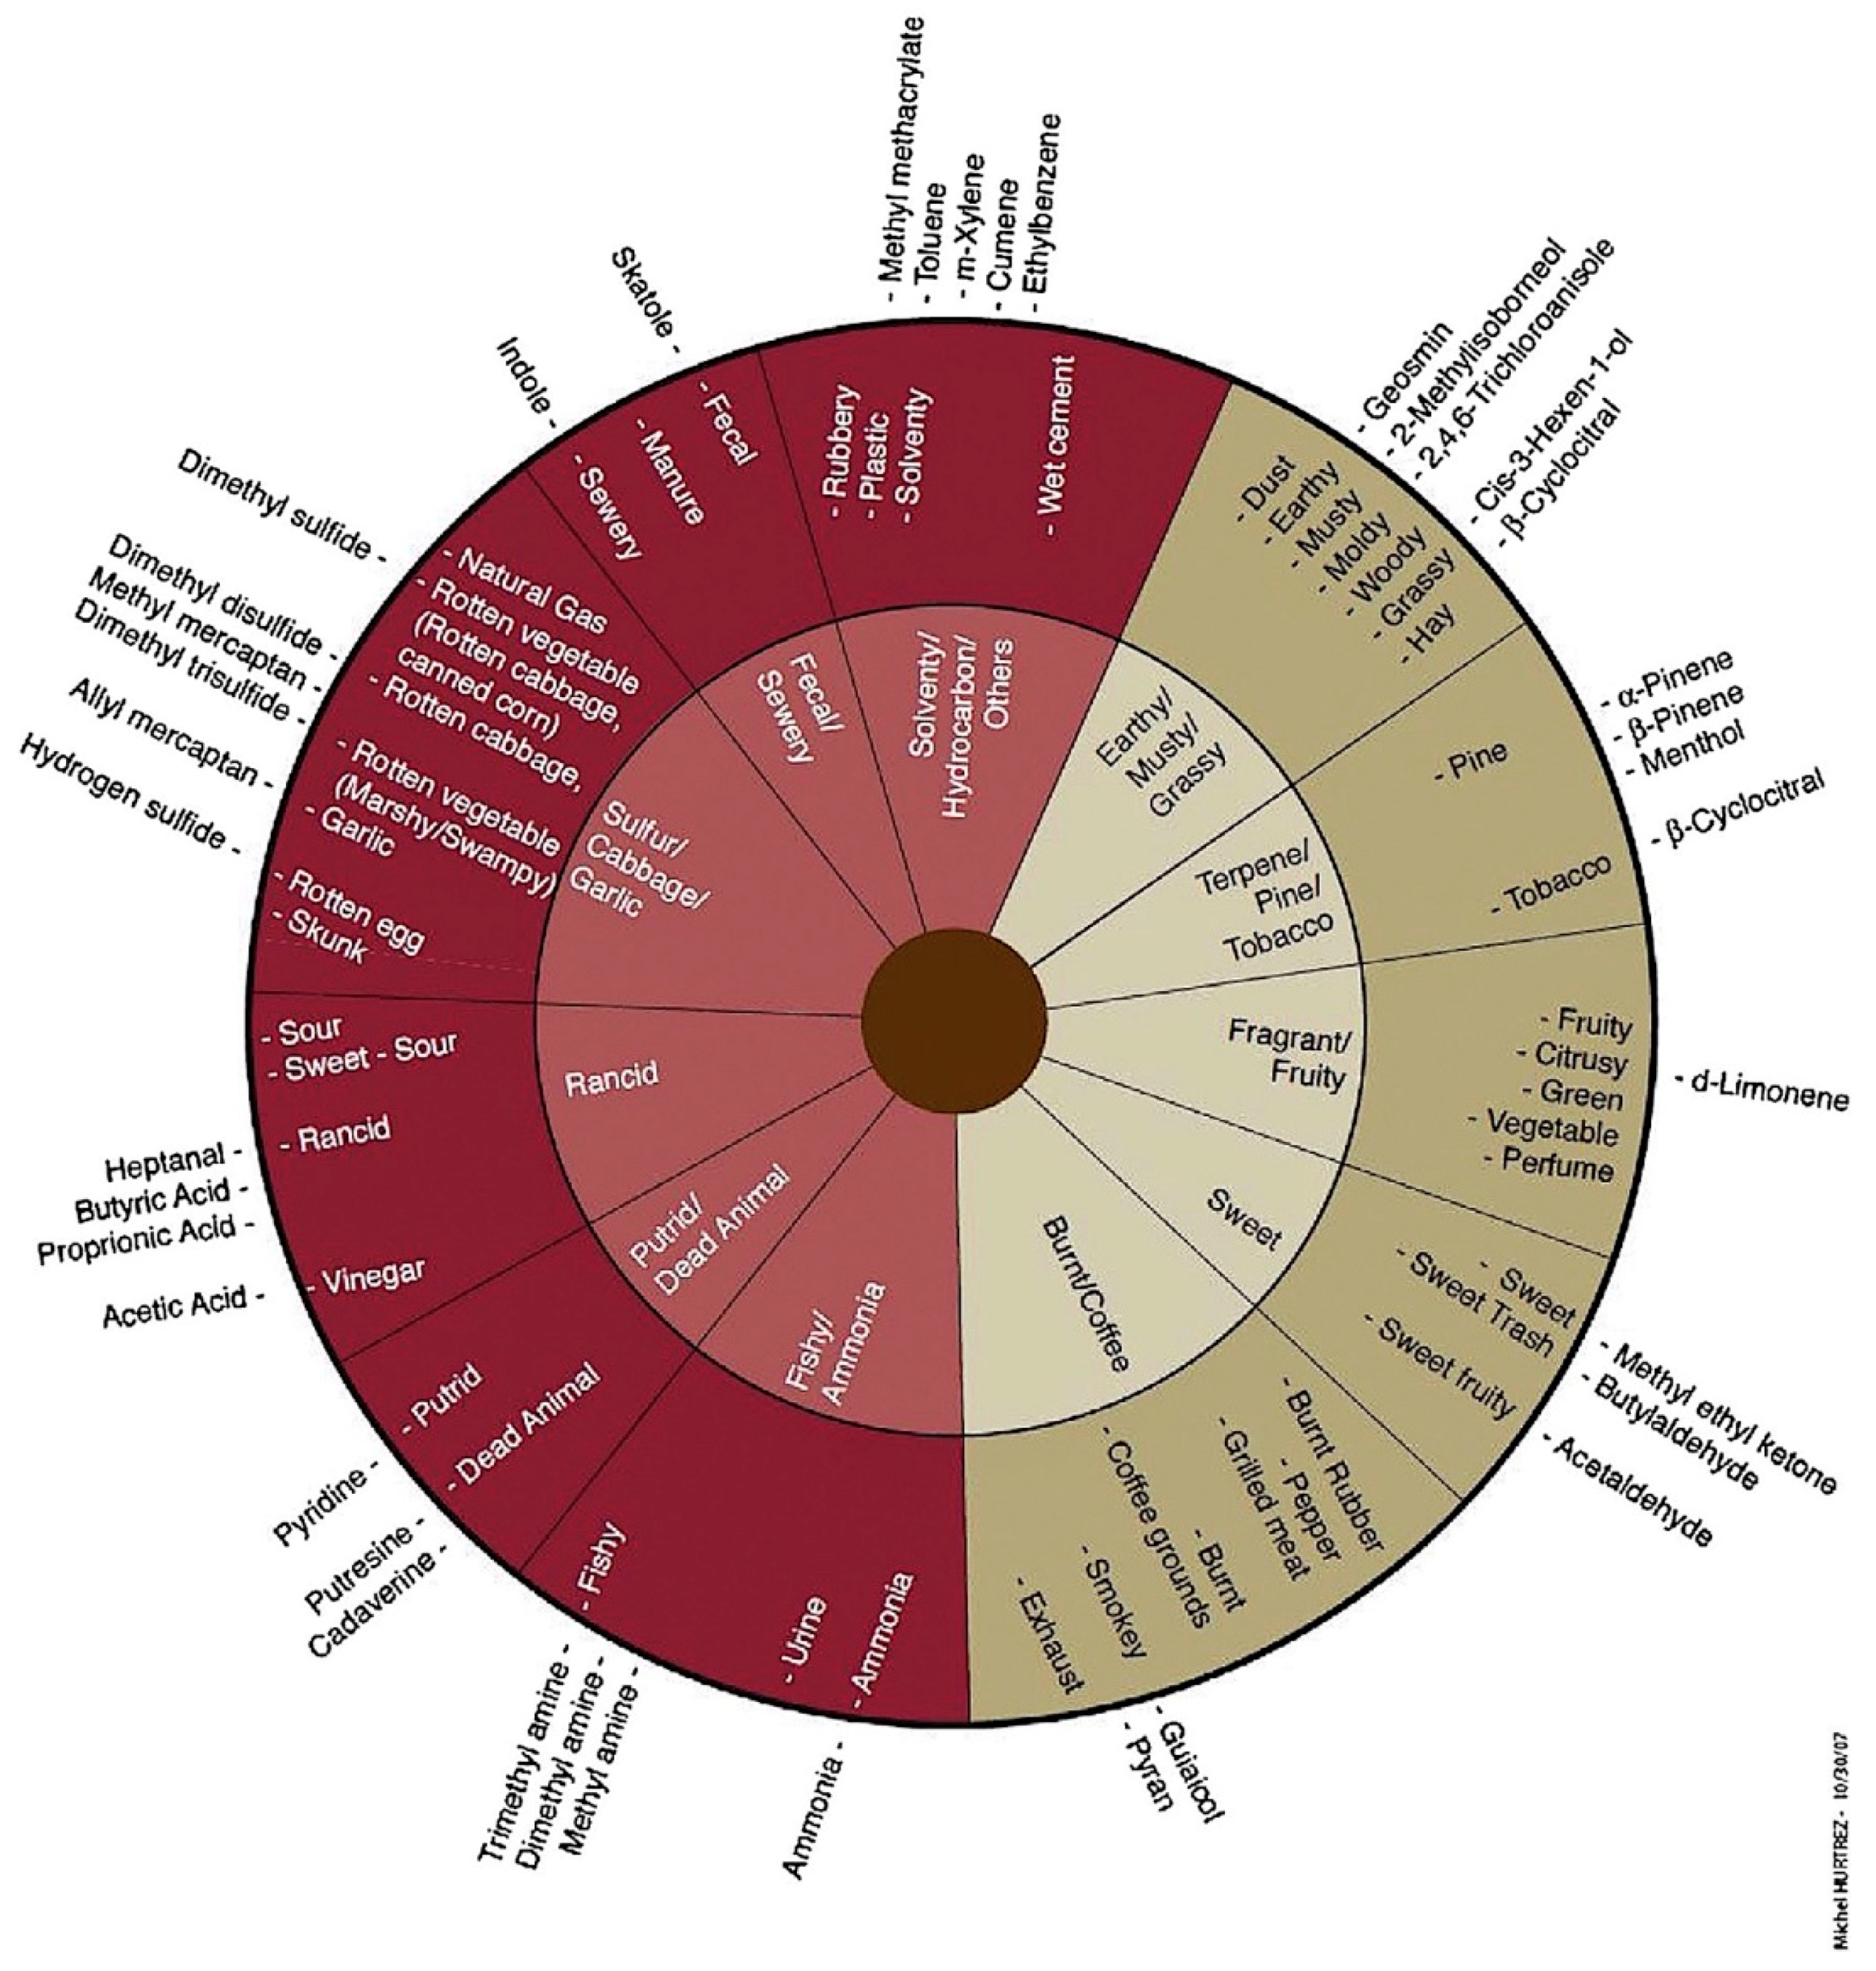
The Odor Profile Method was based upon the FPA method for the food and drinking water industries, specifically Method 2170, the “Flavor Profile Analysis” of “Standard Methods of Water and Wastewater” [3]. The FPA has a 7-level sugar scale for the intensity of an odorant. The FPA was developed for the headspace of drinking water. It has been used for over 30 years and is a standard method to evaluate odor problems and for quality control of specific odors in drinking water. The method was developed for air analysis studies by Burlingame [4], Burlingame et al. [5], Burlingame [6] and Curren et al. [7]. The landfill odor wheel (Figure 2) was used to identify each odor type and intensity [8]. Training and quality assurance measures were used [9].
The OPM includes (1) identifying one or more odor notes in the air sampled and (2) determining the odor intensity for each odor note [4,5,6,7]. The OPM method includes:
- Screening panelists for anosmia (lack of the sense of smell) using a “scratch-n-sniff” test [10].
- Using a minimum of 4 trained panelists of the 10 trained panelists for each OPM sample evaluation.
- Training odor panelists with the primary odorants of an odor wheel and mixtures of 2, 3 and 4 of these standard odorants over a 6-week period. Additionally, including training panelists on the background odors that could be found around the school as grassy.
- Teaching a standardized odor note vocabulary to panelists using the “landfill “odor wheels” (Figure 2) that consist of three rings: an inner ring of general odor categories, a middle ring of specific odor notes within each segment and an outer ring of known or potential odorants associated with each odor note.
- Panelists are calibrated to the odor intensity scale (Table 1)—threshold (1), slight (2), weak (4), medium (6), medium–strong (8), strong (10) and very strong (12)—using sugar-in-water solutions tasted by mouth that represent weak (5% sugar), medium–strong (10% sugar) and very strong (15% sugar) as defined by the FPA mehod (3).
- Group discussions are permitted after the individual odor evaluations to help panelists define their responses; however, panelists are ultimately instructed to work independently.
- Overall panel results for an “odor note” (an odor character with an associated odor intensity) require at least 50% agreement among panelists. The odor notes are calculated as the panel average mean with a standard deviation reported. If a panelist does not report the odor note, a zero is included in the calculation of the mean.
- If less than 50% of the panel agrees on an odor note, an “other odor note” is stated without an odor intensity.
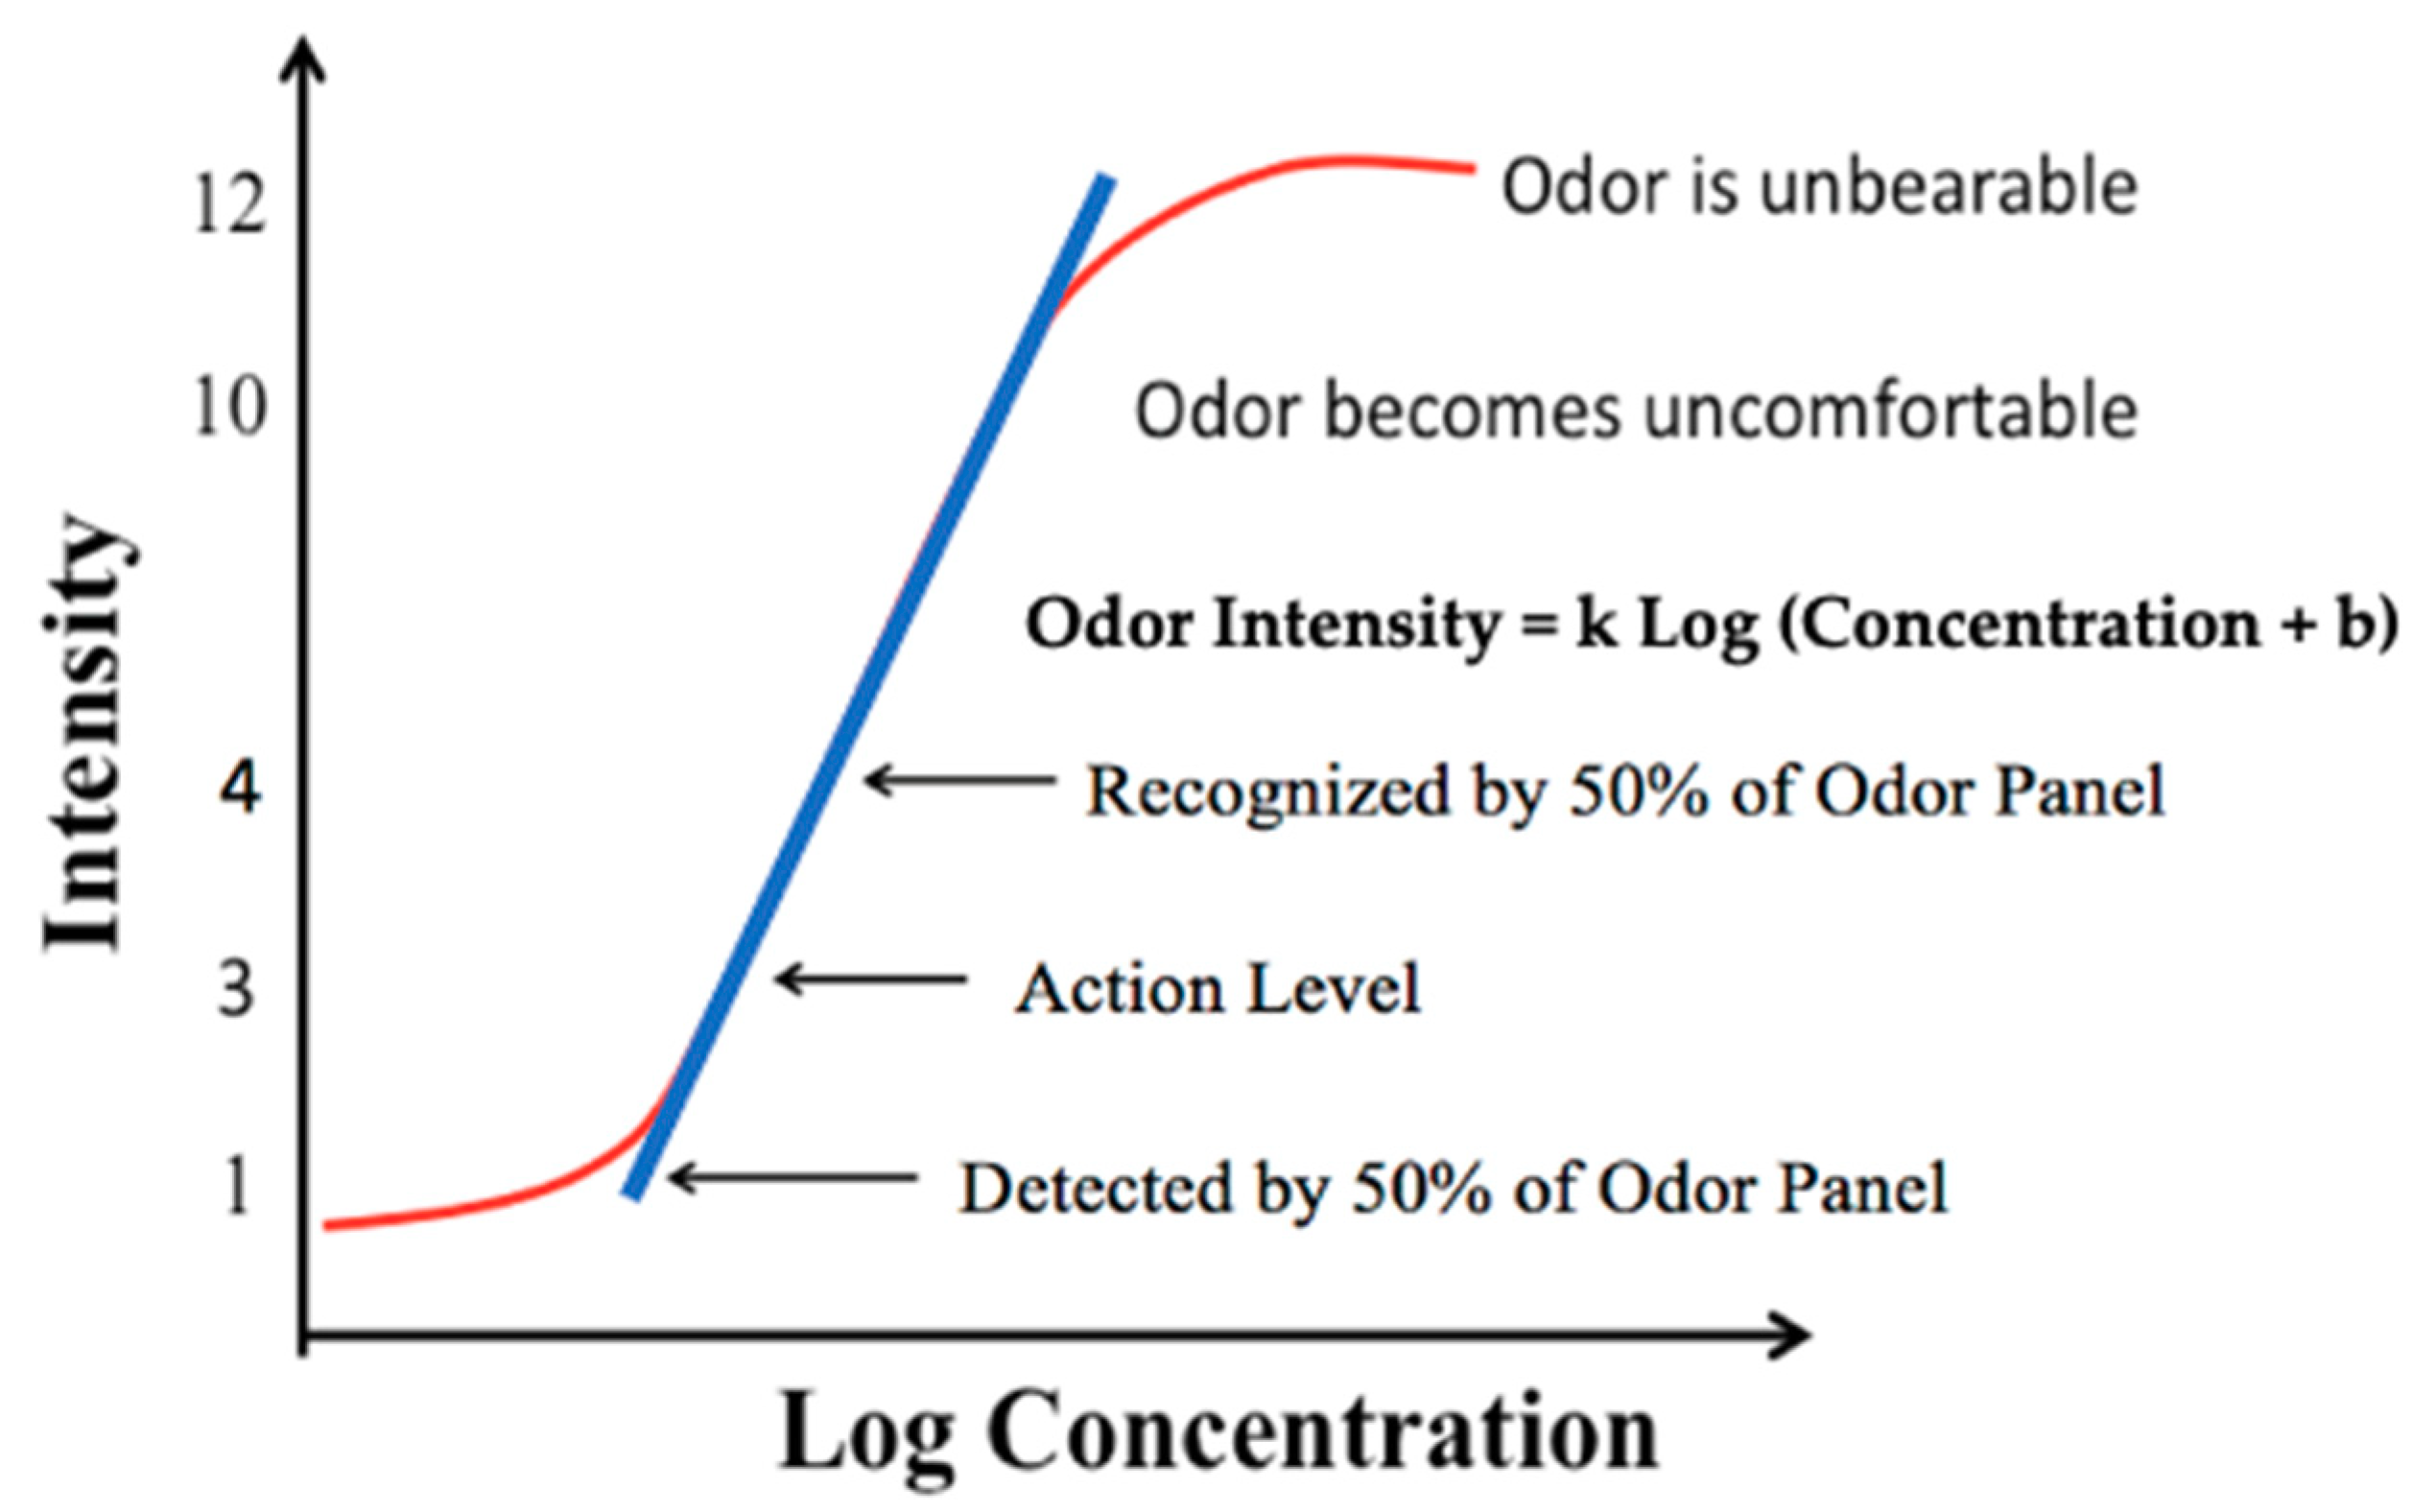
The OPM intensity scale is based upon the Weber–Fechner Law [11], in which a single odorant’s intensity is proportional to the Log of the odorant’s concentration.
Odor Intensity = k Log (Concentration) + b
Whereas the concentrations are units such as ppb or µg/m3, and k is a constant (called the Weber–Fechner coefficient) that is unique to each odorant. Figure 3 shows the relationship between Odor Intensity and the Log (Concentration). The odor level of detection (1) and recognition (4) of the odor name are shown. An action level of 3 below recognition is suggested to minimize an odor problem.
2.2. Background Information on Odors Related to a Landfill
Reference [1] indicated that during the Odor Patrol time period in the previous year to this study (from 2016 to 2017) “trash odor” was the primary odor. Additionally, a lower intensity, “rotten vegetable” and/or a “sewage/fecal” odor were also identified either from the trash gas or from landfill gas.
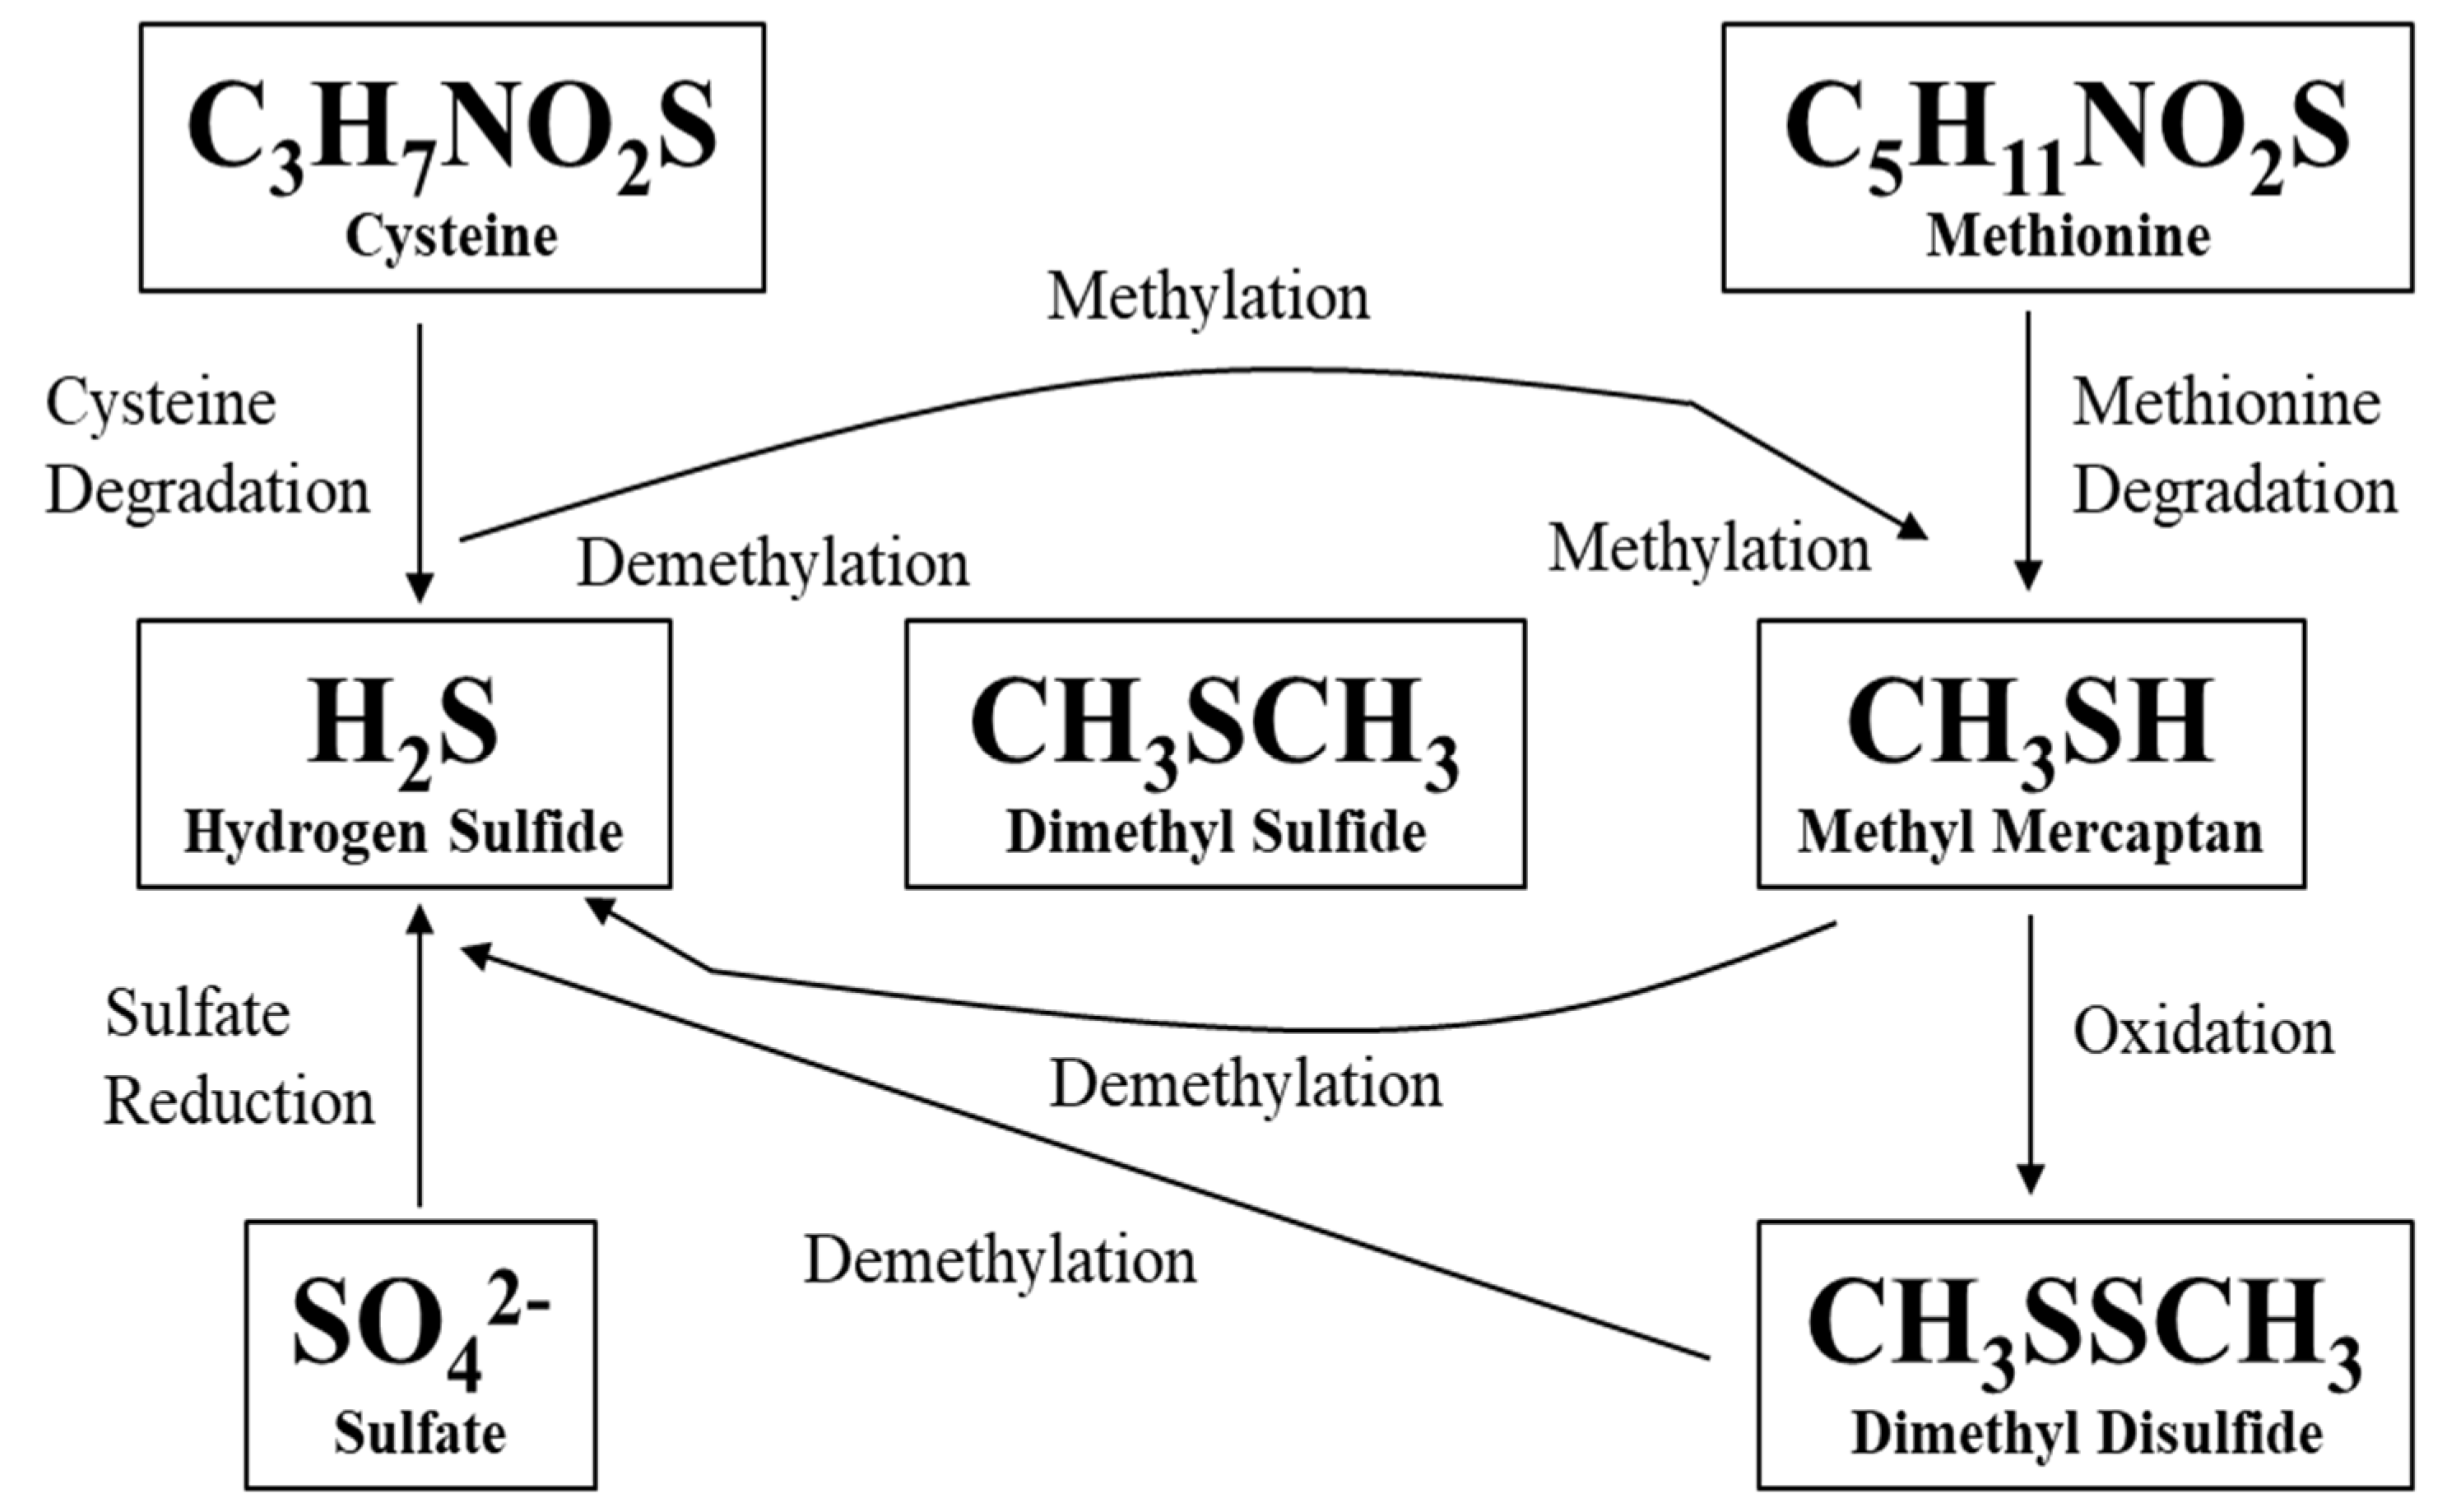
- Landfill Gas (LG) is described by the landfill community and inspectors for gases that are produced within the landfill from anaerobic reactions. Landfill gas, according to the Landfill Wheel (Figure 2), was within the general category (Sulfur/Cabbage/Garlic). Primary landfill gas odors in this category are rotten vegetable, rotten cabbage, and garlic. These odors are caused by the anaerobic production of sulfur compounds by microorganisms using sulfate instead of oxygen as the electron acceptors within the landfill [12] (see Figure 4). A secondary odor of lower intensity in the Landfill Wheel (Figure 2) was within the general category (Sewage/Fecal). These secondary odors in this category are also named sewage/fecal. This odor is generated by microorganisms under the same low-oxygen conditions by degrading nitrogen compounds (e.g., proteins) to yield compounds such as indole and skatole, which have a sewery/fecal odor character described in Figure 2. Figure 5 shows the microbiological origin of these odors [13]. In this paper this will be referred to as a sewery odor.
- Trash Odors (TRs) are described by the landfill community generically occur when trucks filled with trash are waiting and while dumping trash at the landfill. Although soil is used to cover the trash after it is dumped, the “trash odors” can still escape. Trash Odors, according to the Landfill Wheel (Figure 2), are within the general categories (Rancid and Sweet). The “trash odor” is primarily “rancid” from the air oxidation of fats to fatty acids. The fatty acids can be further oxidized in air to aldehydes and ketones. The aldehydes and ketones add a “sweet” note to the “rancid” odor as presented in the “Landfill Odor Wheel” (Rancid and Sweet) general categories (Figure 2). Secondary odors of lower intensity, “rotten vegetable” and/or “sewage/fecal” odors are produced from reduced sulfur and nitrogen compounds generated in low-oxygen (anaerobic) pockets by microbes within the load of trash that is transported to the landfill as described in the “landfill gas” odor section.
2.3. Experimental Procedure
The study was conducted from 31 October 2017 to 2 May 2018 for 100 school days (except weekends, holidays and school closing days). OPM analysis was completed in an open area school playground every 20 min from 6 to 9 a.m., e.g., 6:00, 6:20 and 6:40, respectively, to 9:00. Each of the four panelists had their own data sheets. At each sampling time, the panelist logged in their own data without talking to each other. After an average of a 3-min evaluation, the panel went to an air-conditioned, odor-free room to refresh their sense of smell before the next sampling period. If needed, the panelists discussed the sample results.
A walk around the campus before, during and after the 6–9 a.m. period was performed for the detection of environmental odors. At 9 a.m., as a quality assurance measurement, all panelists were required to open the dumpster outside of the school site, smell it and write down the odor data on their sample sheet. All data sheets were collected each day by the project manager and logged into the computer.
2.4. Quality Control
Each panelist was screened for anosmia (lack of the sense of smell) using a “scratch-n-sniff” test [10]. All of the panelists passed the test with over 70% correct answers, which means they all had a normal sense of smell. Prior to the start date of the study, all panelists went through complete odor training on the Odor Profiling Method. The training included (1) distinguishing different odor categories by a single standard gas sample; (2) distinguishing the different intensities on the odor intensity scale by sugar water standard; (3) distinguishing odor categories from mixed standard gas samples containing 2–3 chemical mixtures. The panelists were required to repeat the training to assure they were confident to identify the odors of importance. The duration of the study was about 5 months. Thus, the panelist completed a refresher training course halfway through the study.
In the air-conditioned classroom where the panelist stayed, no one was permitted to bring food, coffee or anything that smelled. The panelists did not wear perfume or use strongly scented shampoo or body wash. Therefore, panelists returning to the classroom could relax their noses and get prepared for the next sampling time period. Panelists were required to report any nose cold and withdrew from the panel for that day. A stuffed nose dramatically affects the sense of smell.
The odor panel performed” quality control” by monitoring trash odor produced at a covered waste trash container (dumpster) for food waste near the school site. Quality control data were collected after the Odor Patrol data were completed for that day. The odors from the dumpster represented some odors expected from the trash sent to the Sunshine Landfill. These odors are the rancid–sweet and rotten vegetable odors. Thus, this refreshed the Odor Patrol’s ability to recognize the odors from the landfill. This also confirmed the claim that if the school is experiencing these odors, they are coming from the trash in the landfill.
The school site is about a 1-mile distance from the landfill site. The odors that can be perceived at this school site are not limited to only the landfill. Many types of environmental odors can affect the school area. Thus, it is critical to distinguish the environmental odors from the targeted odors from the landfill. Therefore, it is noted that the panelists were trained on environmental odors, such as grassy and gasoline. The panelists were required to walk around the perimeter of the school to determine if any odor were from the nearby environment before leaving the school site. Local environmental odors, such as “smoke” during a wildfire in the area, “gasoline” from vehicle and traffic, “grassy” from mowing the lawn in the neighborhood nearby, etc., were not included in the data set.
3. Results
3.1. OPM Data by the Odor Patrol
Table 2 shows the total odor panel results for Week 2 on a weekly data sheet including the background odors. As Table 2 shows, each day of sampling has 10 sample time slots. The yellow highlights are for samples where landfill odors were observed. The legend of Table 2 indicates which odors are the background odor at the site.
Table 3 shows only the odor panel sample data when landfill odors were observed during the study from 30 October 2017 to 2 May 2018 (100-week days over 22 weeks). The environmental background odors were not included in these sample results. Only 13 times out of 1000 odor samples evaluated in the 100-week study showed significant landfill-related odors. Each data point shown in Table 3 presents information on the week, date and time of analysis. The values shown under “Odor Character” represent the average odor intensity and the standard deviation for each odor note that was detected by over 50% of the odor panel. For odor characters that were detected by less than 50% of the odor panel an “other odor note” was recorded without an odor intensity.
Figure 6 shows the time and frequency of the 13 detected odors in Table 3. For example, the first column shows that between the 6 and 7 a.m. time slot, rancid odor was detected 3 times, rotten vegetable odor was detected 2 times and sewery odor was detected 3 times. The primary times of observation were 6 and 7 a.m.
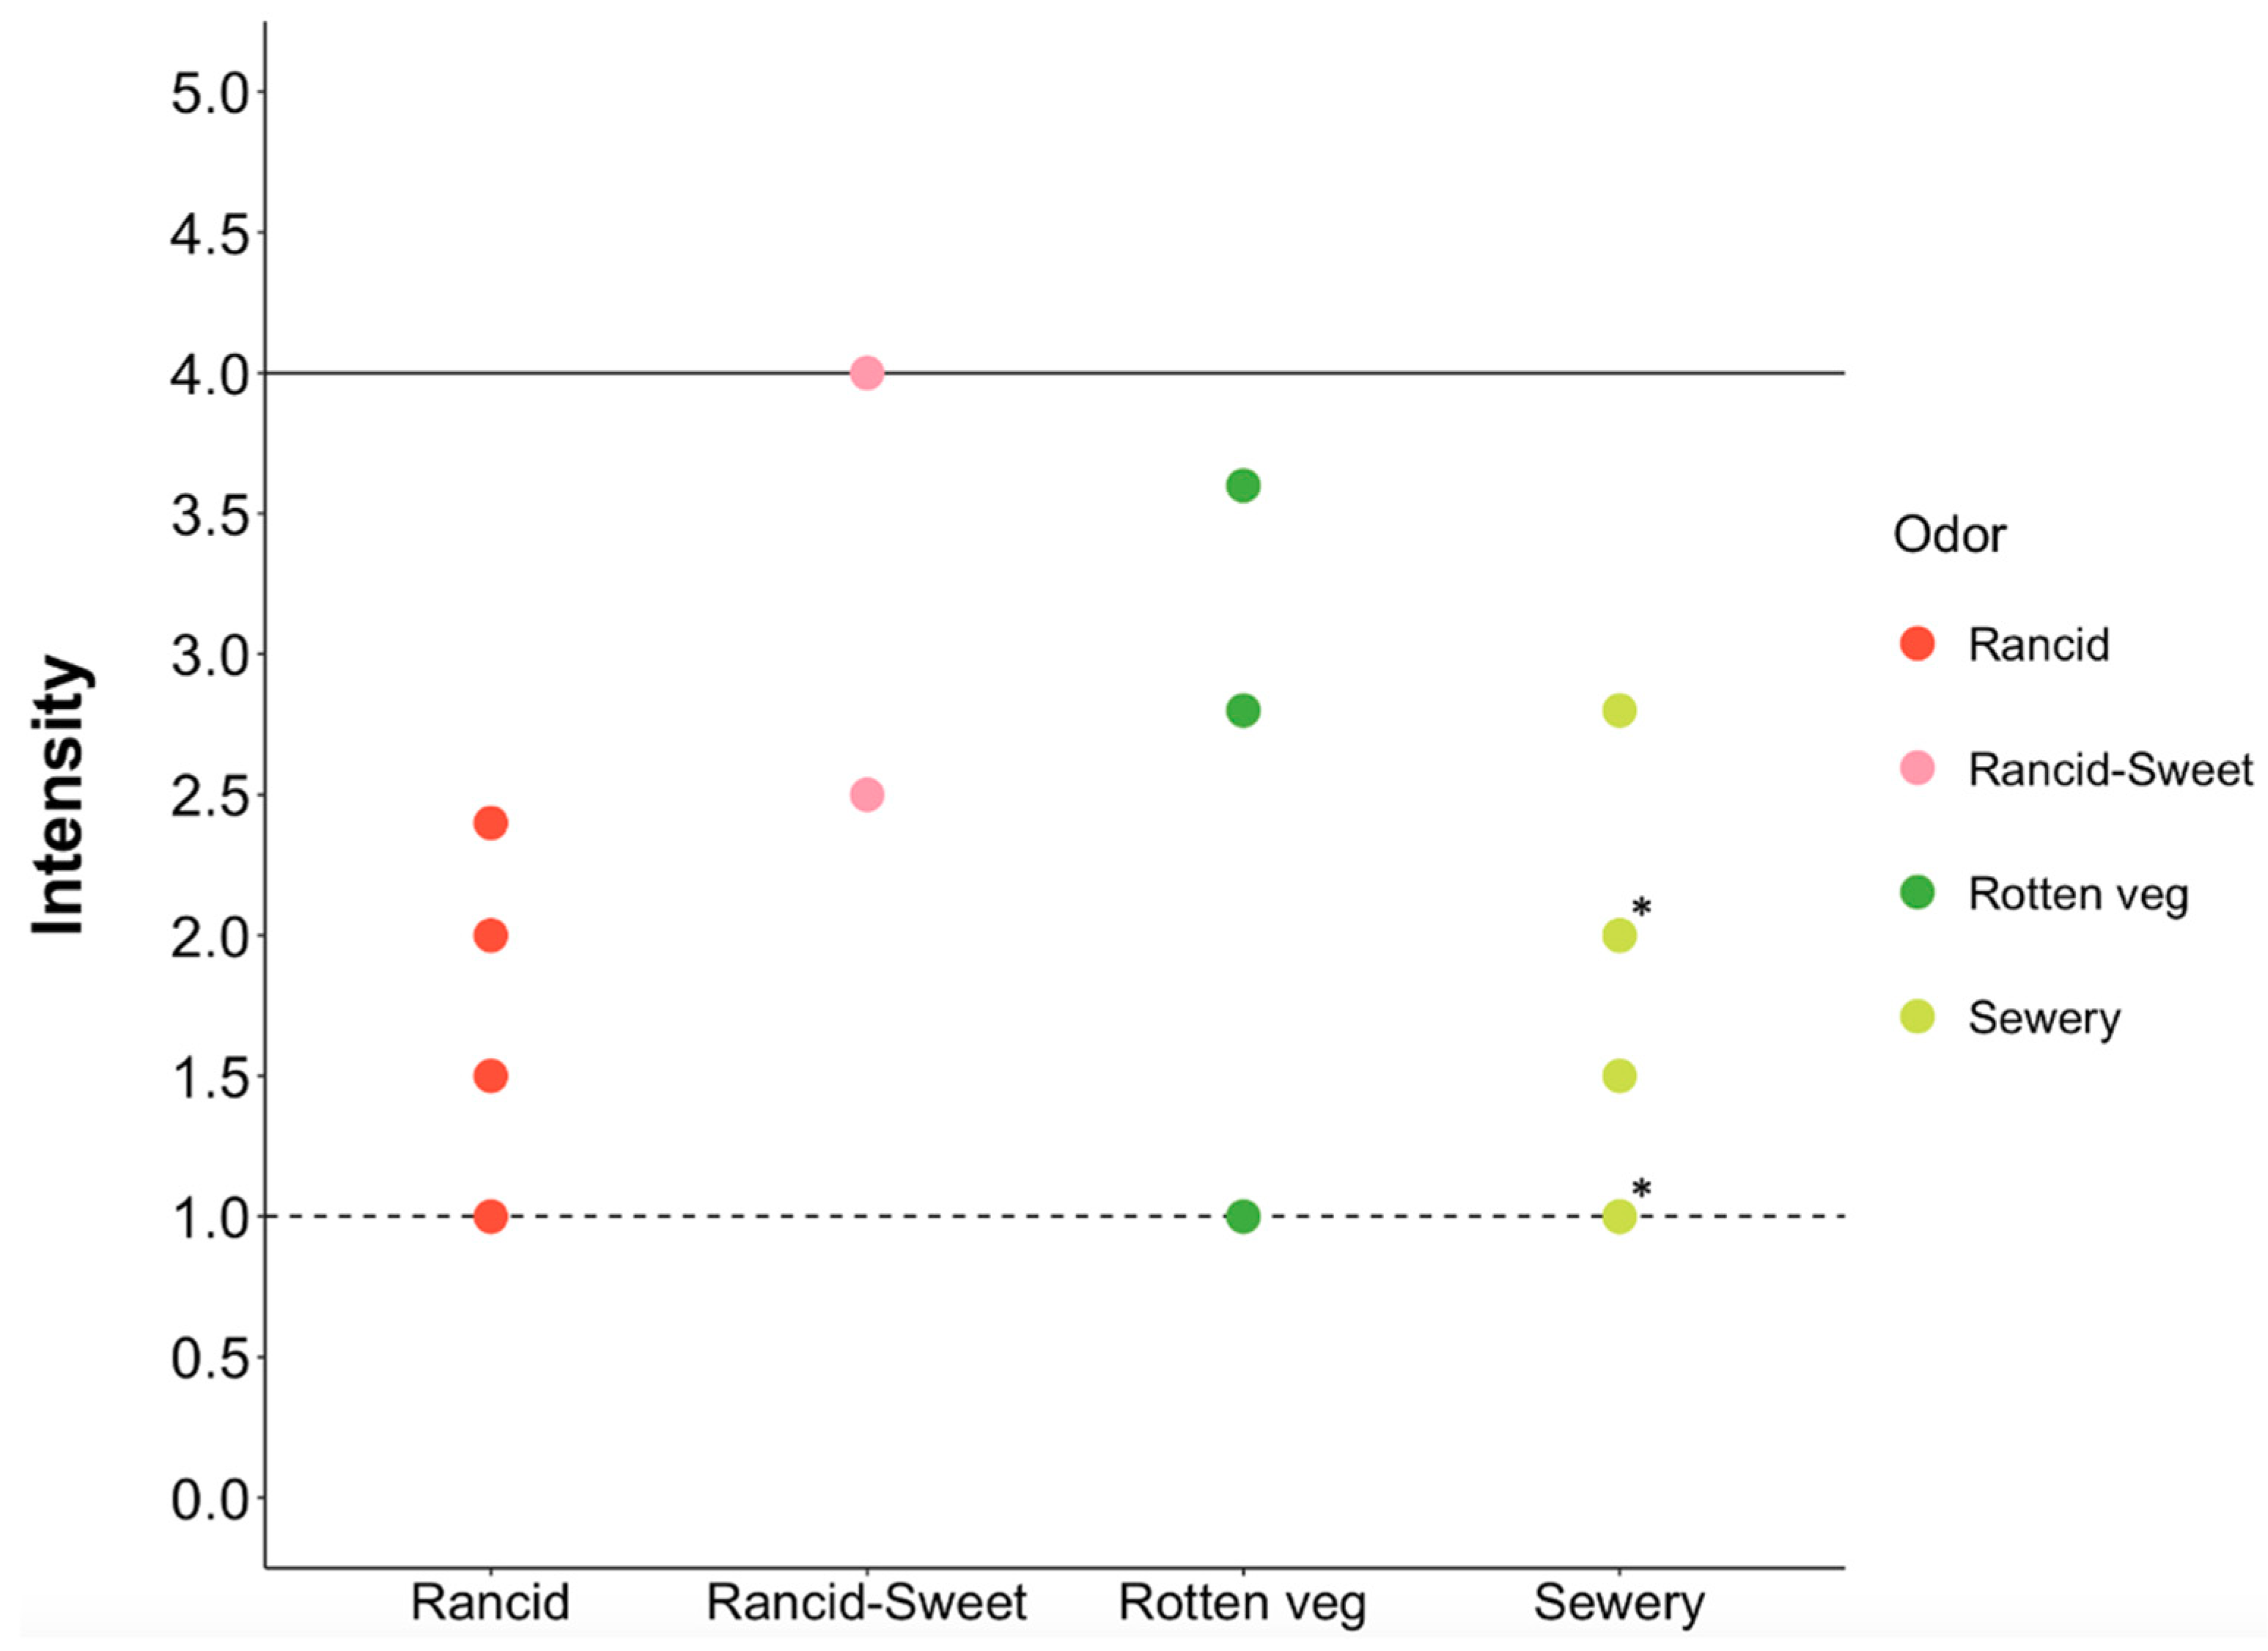
Figure 7 shows the intensities of landfill odors detected by the Odor Patrol. The intensities of the Trash Odor (rancid), and Landfill Odor (rotten vegetables) and sewery odors predominate. Most of the odors were recorded with intensity between one and four. The order of intensity across types from high to low is: Trash odor (Rancid–Sweet) > Rotten vegetable > Sewery > Rancid alone.
3.2. Complaint Data from SCAQMD
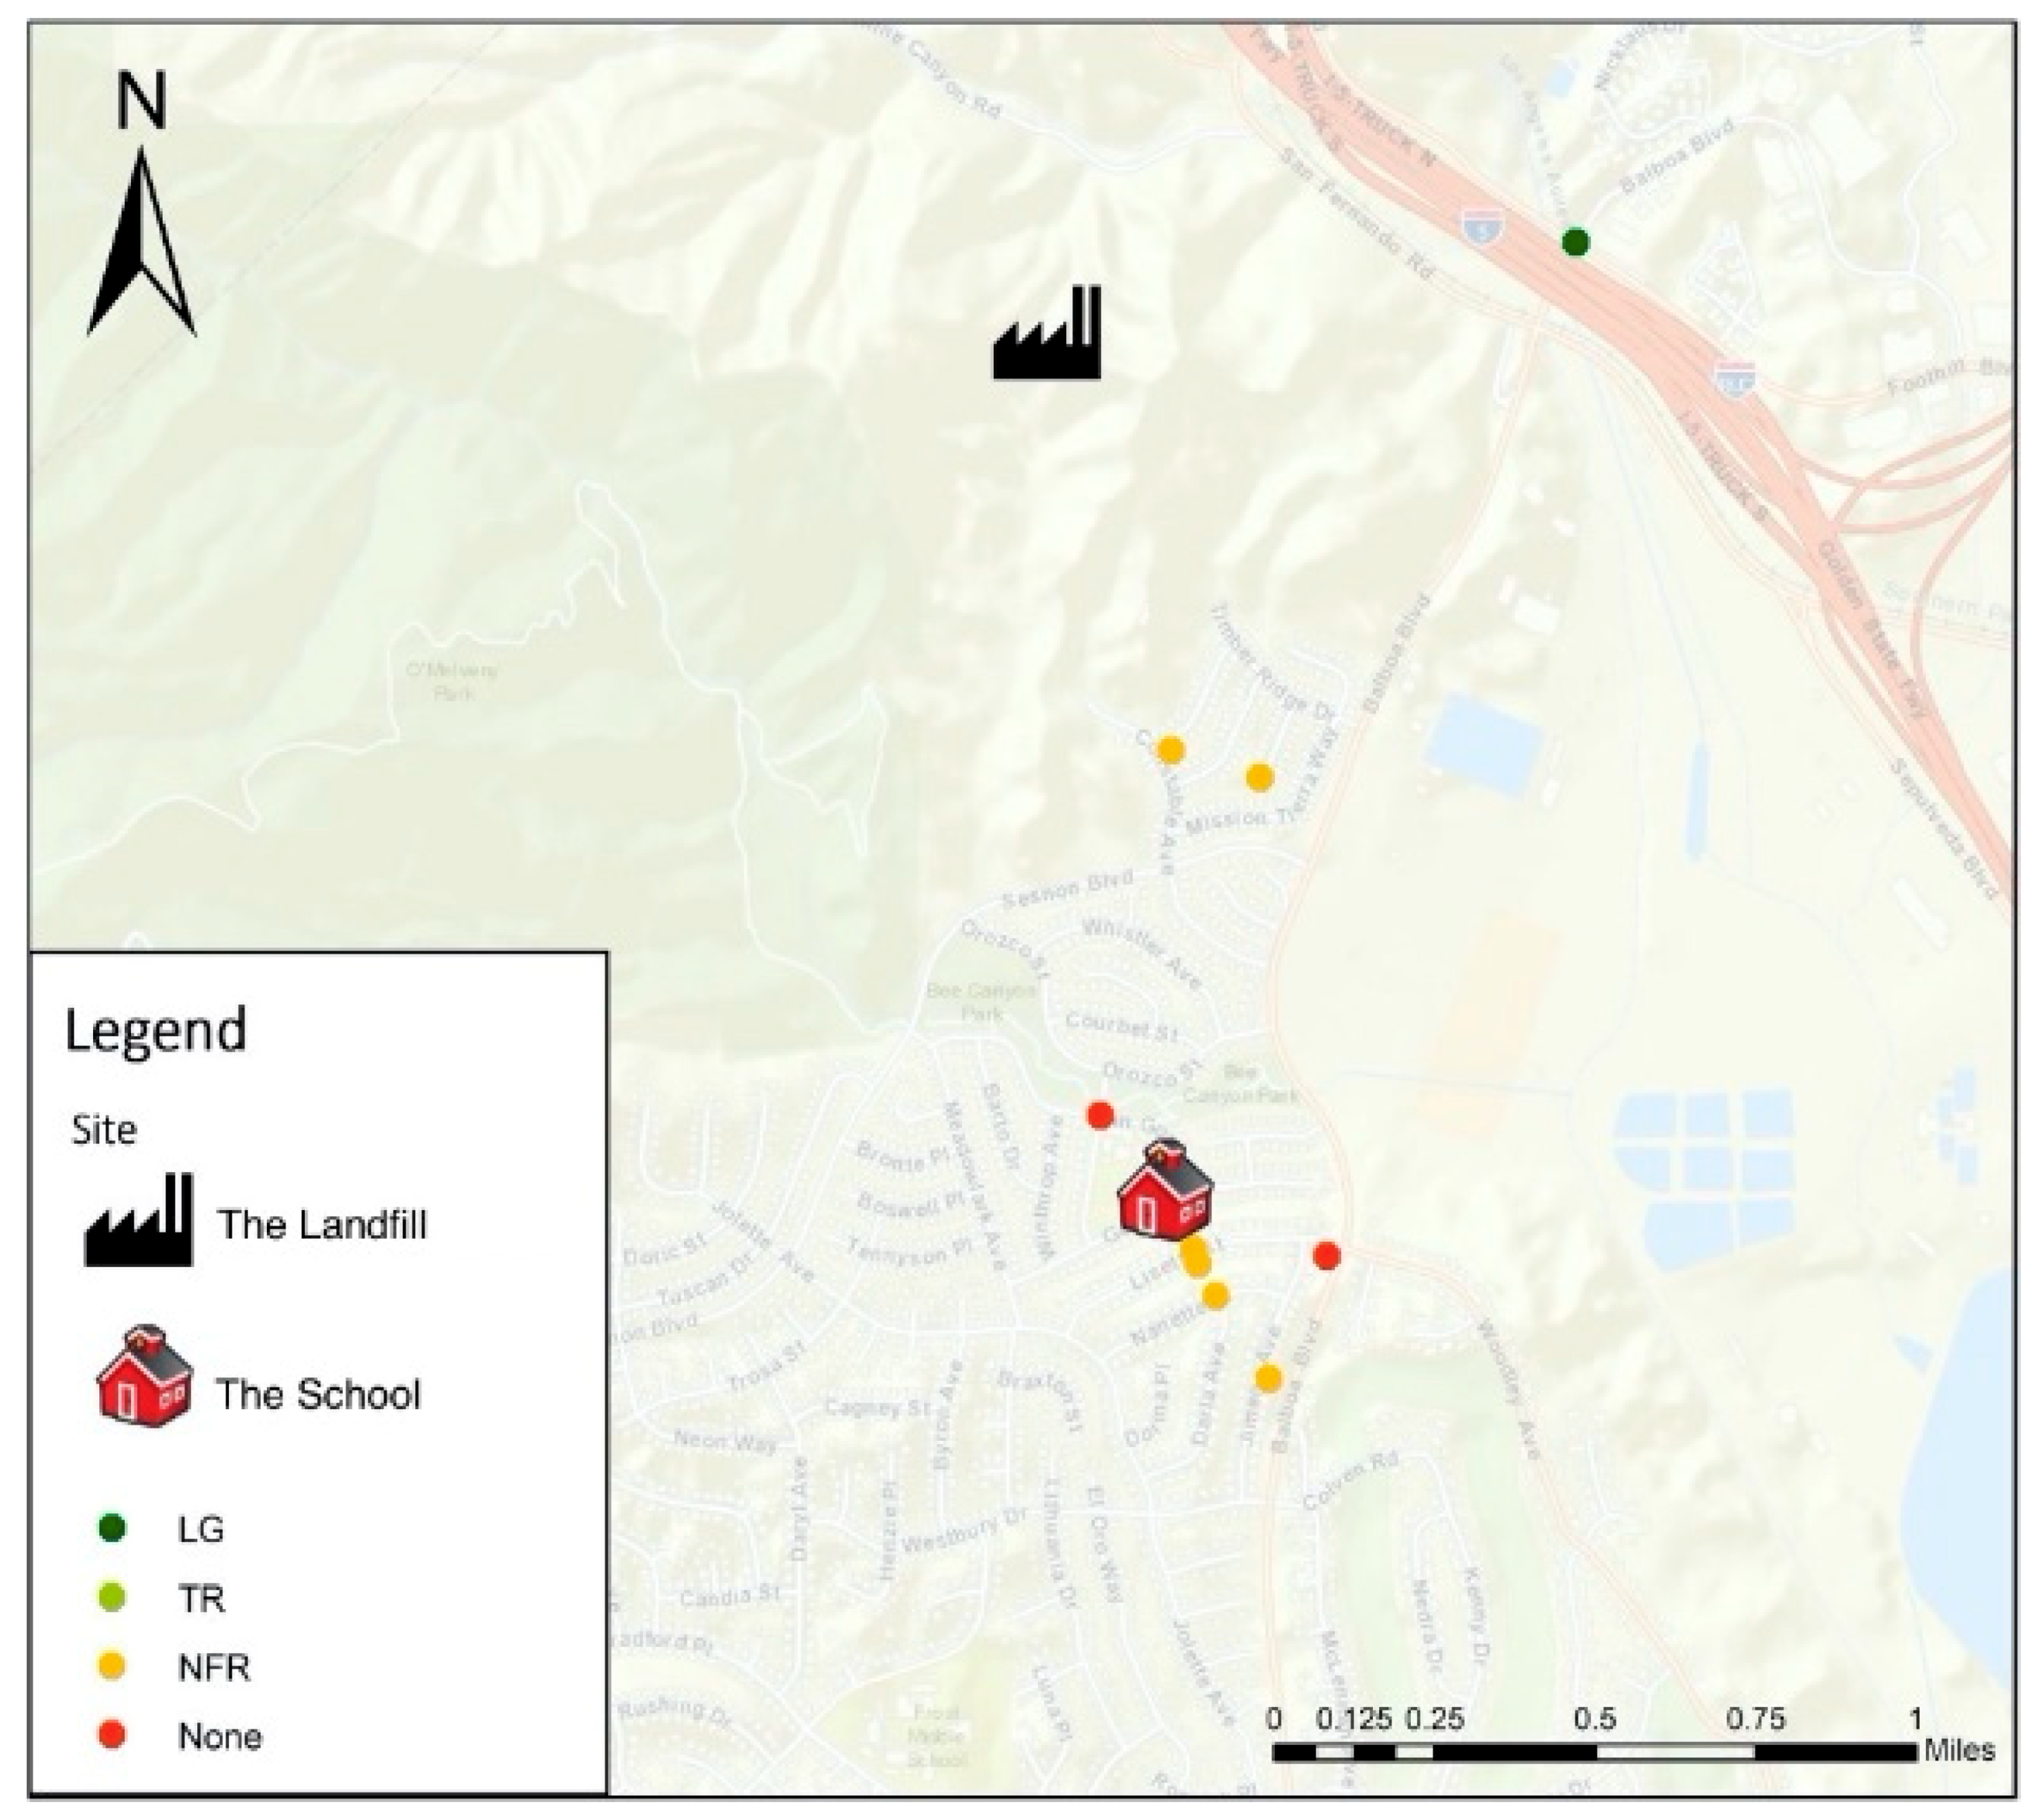
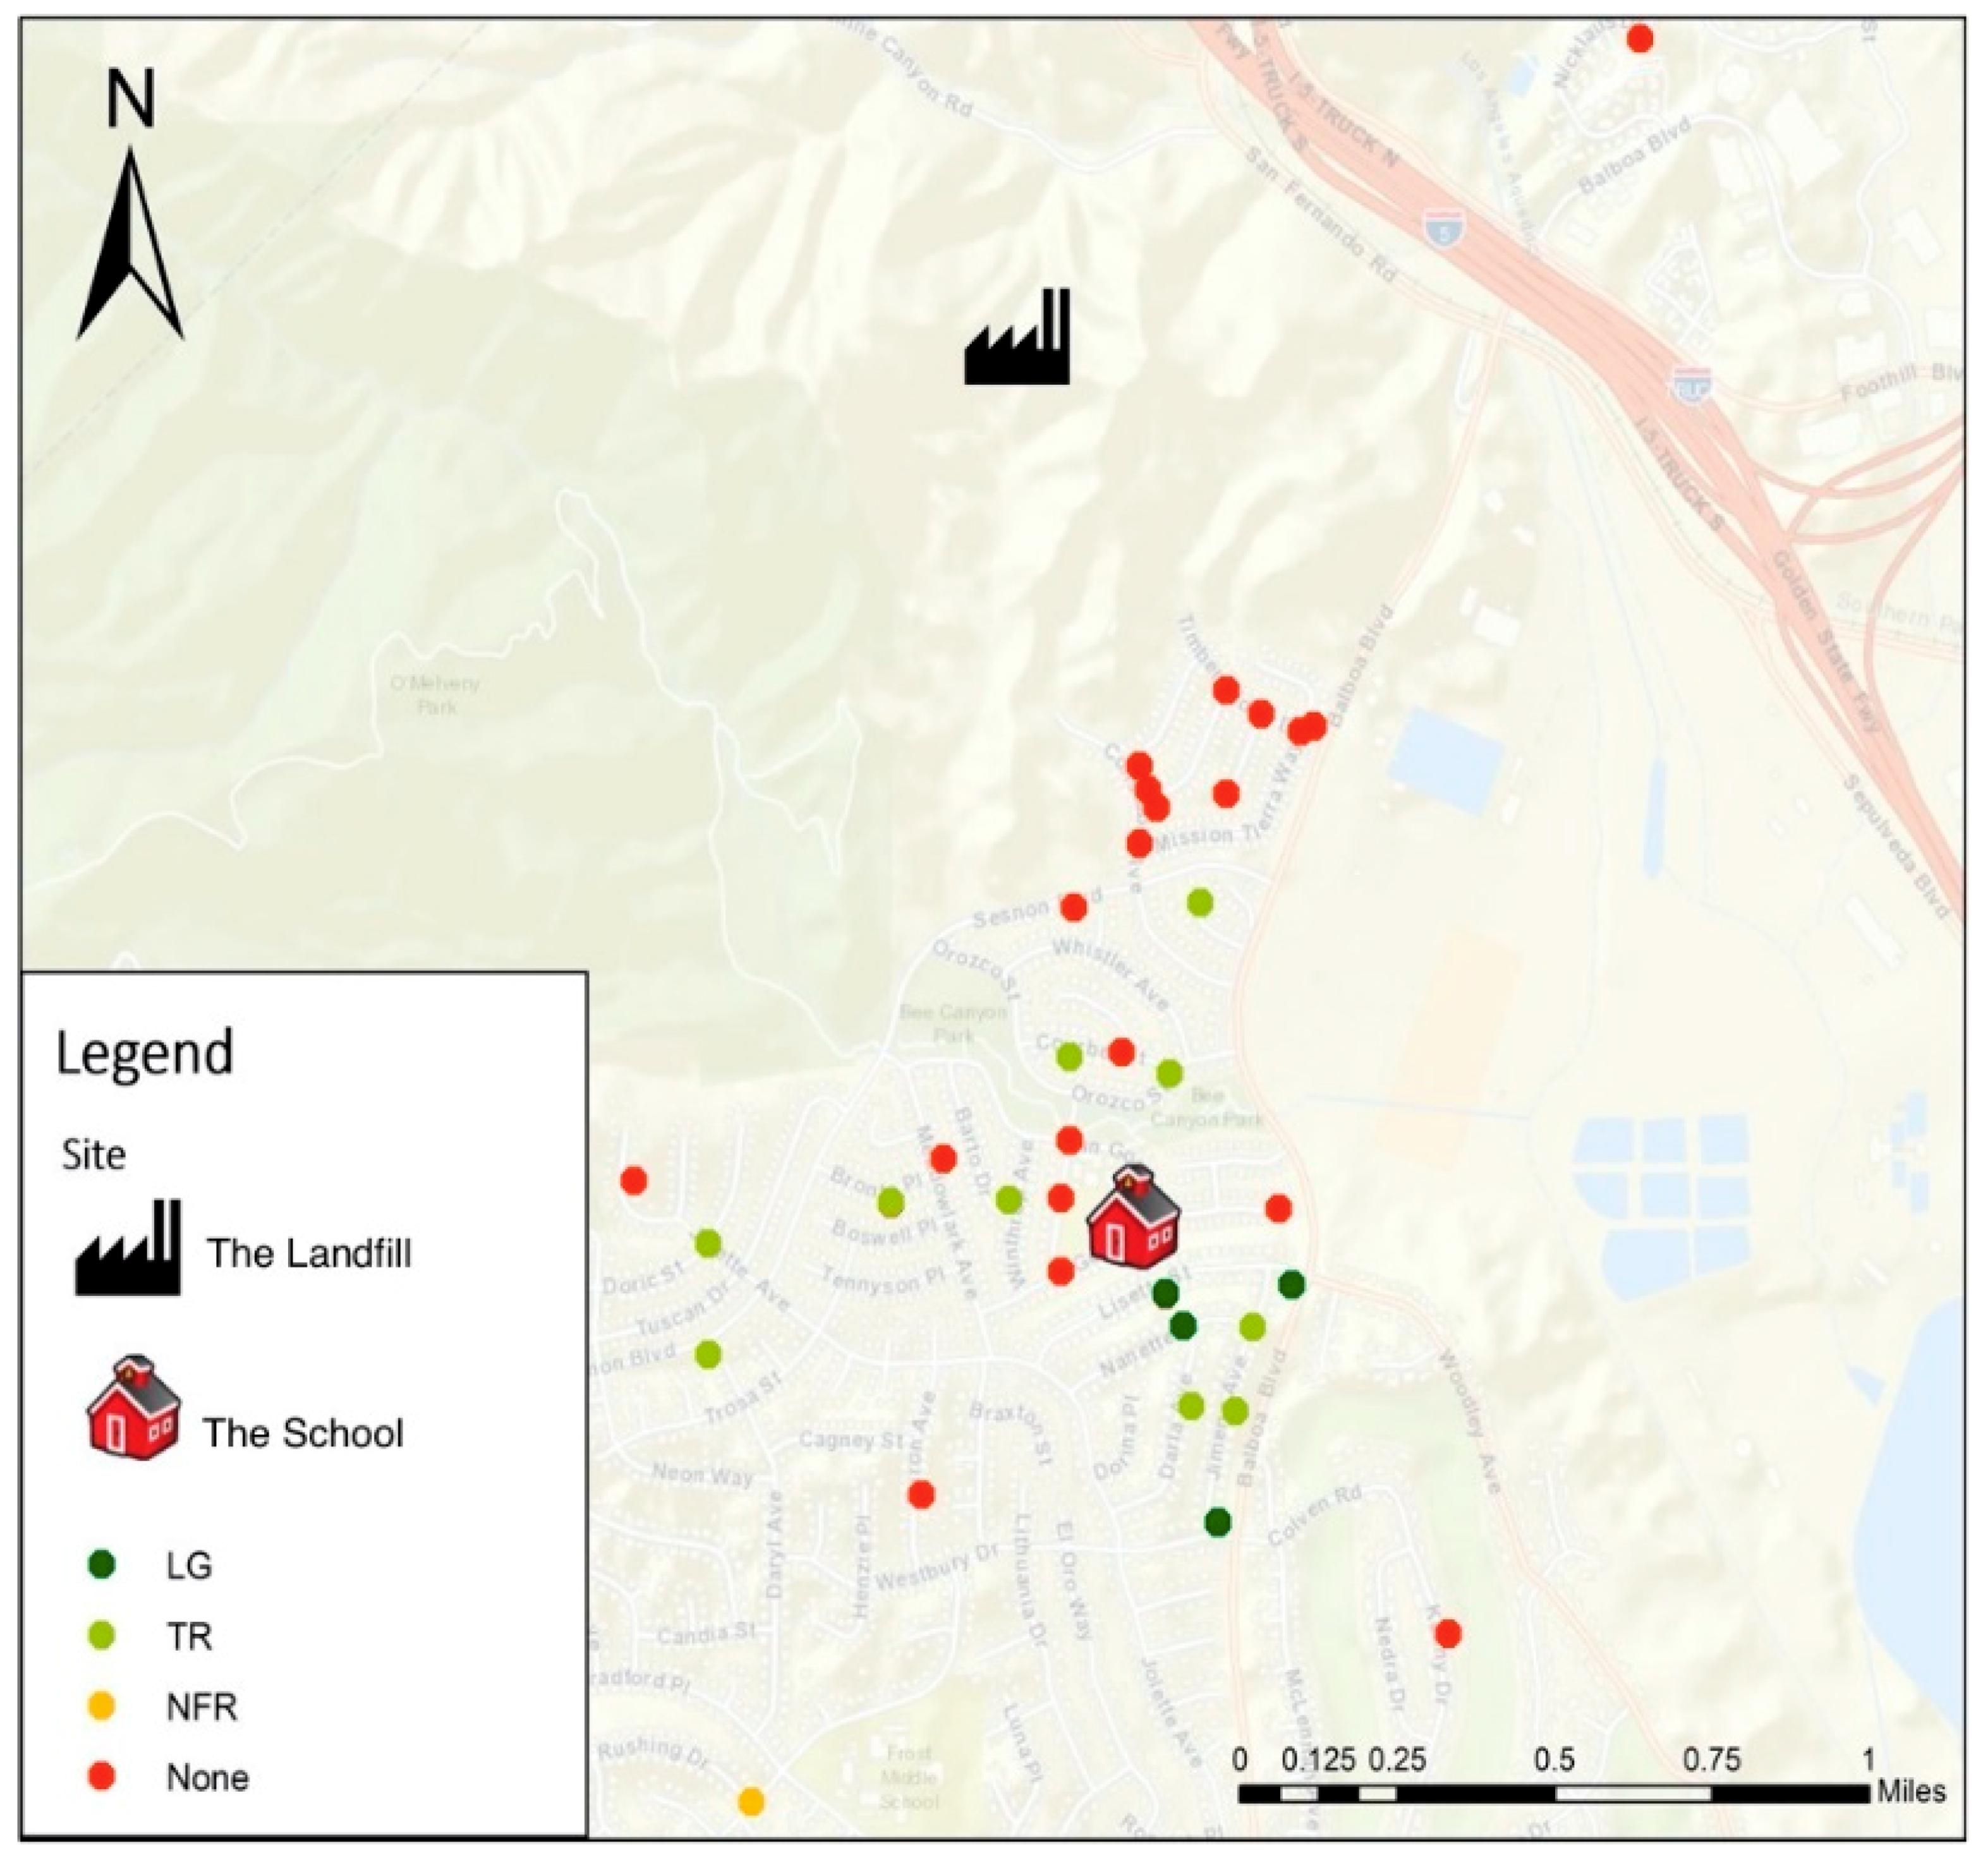
Figure 8 and Figure 9 show the primary locations of complaint data from SCAQMD during the Odor Patrol study and at the same time period the year before, respectively. The dots in Figure 8 and Figure 9 show the primary locations of complaints within one mile of the school during equivalent Odor Patrol periods in 2017–2018 vs. 2016–2017, respectively. The dots do not represent each complaint, only the general location of complaints.
The total complaints reported to SCAQMD during the Odor Patrol time period in 2017–2018 were 21 (Figure 8). There were 264 complaints reported to SCAQMD in 2016–2017 (Figure 9). In the year 2016 to 2017, there were 8 land field gas (LG) odors and 170 trash odor (TR) confirmed, while only 2 LG and no TR were reported in 2017–2018 during the Odor Patrol period.
4. Discussion
4.1. Odor Profiling Method vs. European Standard 16841–1:2016
The European Standard EN 16481-1:2016 [14] describes a grid field inspection method that uses a direct assessment of ambient air by trained panel members to characterize odor exposure in a defined area. The panelists determine whether they recognize an odor note selected from a list. The panelists write down their observations every 10 s for 10 min (60 observations). If six of those observations are a recognized odor note, then the label “odor hour” is applied (although not a full hour of odor exposure occurred) [14]. The frequency of “odor hours” is usually completed for a square of four measurement points that map an area. The grid method has been used to study industrial areas in German cities and provided a representative map of the exposure of the population to recognizable odors [15]. These studies took six months to one year, each with 21 panelists. Bax et al. [16] reviewed the grid field inspection method and stated that the method “cannot be used for the assessment of the odor concentration.” Thus, the grid field assessment method can recognize odor notes from a selected list but cannot determine the intensity of each odor note.
Different from the EN 16481-1:2016, the Odor Profile Method trains panelists to not only recognize odor notes from a selected list, i.e., the odor wheel, but also to detect all odor notes and define an intensity for each odor note. The panel specifies each odor character with its odor intensity. A minimum of four trained panelists are used. If over 50% of the panel agrees on an odor note, the average intensity +/–, a standard deviation, as shown in Table 2 and Table 3, was calculated. The intensity is based upon the Odor Intensity Strength Scale (Table 1). Thus, the Odor Profile Method can be considered an expansion of the European Standard EN 16481-1:2016 [14]. This paper used the OPM at one location. However, the OPM method can also be used over a grid as well.
4.2. Odor Patrol Data
The first objectives of the study were to determine if the “Odor Profile Method” by an “Odor Patrol” can evaluate the odor nuisance caused by a particular odor source; i.e., determine the odor character, odor intensity of each odorant and frequency and duration of the odor problem. The first part of the objective to determine the odor character and odor intensity was accomplished. Table 3 shows only the Odor Patrol sample data when landfill odors were observed during the study from 30 October 2017 to 2 May 2018 (100-week days over 22 weeks). Only 13 out of 1000 samples collected in the 100-week study showed significant landfill odors. Thus, only 1.3% of the samples were potentially attributable to the landfill during the Odor Patrol study.
Table 2 and Table 3 show the second part of the first objective was capable of providing information on odor frequency and odor duration. For example, the 3 positive OPM data in Table 2 and the 13 positive samples in Table 3 showed the frequency of OPM data. Additionally, these tables clearly show the duration of an odor event was always within a 20 min time period. These results appear to explain why SCAQMD odor inspectors may have missed some odor events after receiving a complaint call and the time it took to visit a complaint site.
The study demonstrated a novel approach for odor monitoring by using the Odor Profile Method with an “Odor Patrol.” The OPM not only confirmed the mitigation of a landfill odor problem, but it also determined odor character, odor intensity, odor frequency and odor duration during this study period. “Landfill gas” was determined to be primarily a rotten vegetable odor with a secondary sewery/fecal odor of lower intensity, and “trash odors” were primarily a rancid and sweet odor with a secondary sewery/fecal and/or rotten vegetable odor of lower intensities generated from trash at the landfill. Quality assurance methods were used to remove local odors from the evaluation.
The OPM detected the occurrences of these specific odors. For example, Figure 6 shows that from 6:00 to 6:40 a.m., a rancid odor was detected three times, rotten vegetable was detected two times and sewery/fecal was detected three times. The occurrence of most of the landfill-related odors was detected from 6:00 a.m. to 7:40 a.m. The order of intensity across types from high to low in Figure 7 is: trash odor (rancid–sweet) > rotten vegetable > sewery/fecal > rancid. Thus, trash odor is the major problematic odor from the landfill site.
The results from the OPM data by the Odor Patrol show the method is capable of determining the odors from a specific odor source without mistaking the odors from the surrounding background. OPM not only can provide odor type but can also provide odor intensity. This can help develop guidelines to understand the sources of a major odor nuisance. OPM can also provide information on the time and duration of a specific odor nuisance.
4.3. Complaint Data vs. Odor Patrol Data
The second objective of the study was to determine if the OPM by an “Odor Patrol” could be used to determine if the closure of a landfill between 6 and 9 a.m. could minimize odor complaints at an impacted site one mile away? The results indicate that the landfill did not contribute much to nuisance odors in 2017–2018 during the hours of 6 to 9 a.m. Figure 8 and Figure 9 show only the complaint data from SCAQMD. To make a reasonable comparison, Figure 9 shows the complaint data from 30 October 2016 to 2 May 2017, which is the exact date and month one year prior to our Odor Patrol period. There was a dramatic decrease from the previous year: 264 complaints in 2016–2017 versus only 21 complaints in 2017–2018 from 6 to 9 a.m. [1]. Thus, the complaint data show that the odor nuisance from the landfill source has been mitigated.
The Odor Patrol data results agree with the complaint data as only 1.3% of the data points showed landfill-related odor detection, and the intensity was at low levels between one and four (see Table 1 and Figure 3). Therefore, the scientifically based OPM used by the Odor Patrol can be used as a confirmation of the absence of odor complaints in 2017–2018.
4.4. Limitations and Future Improvement
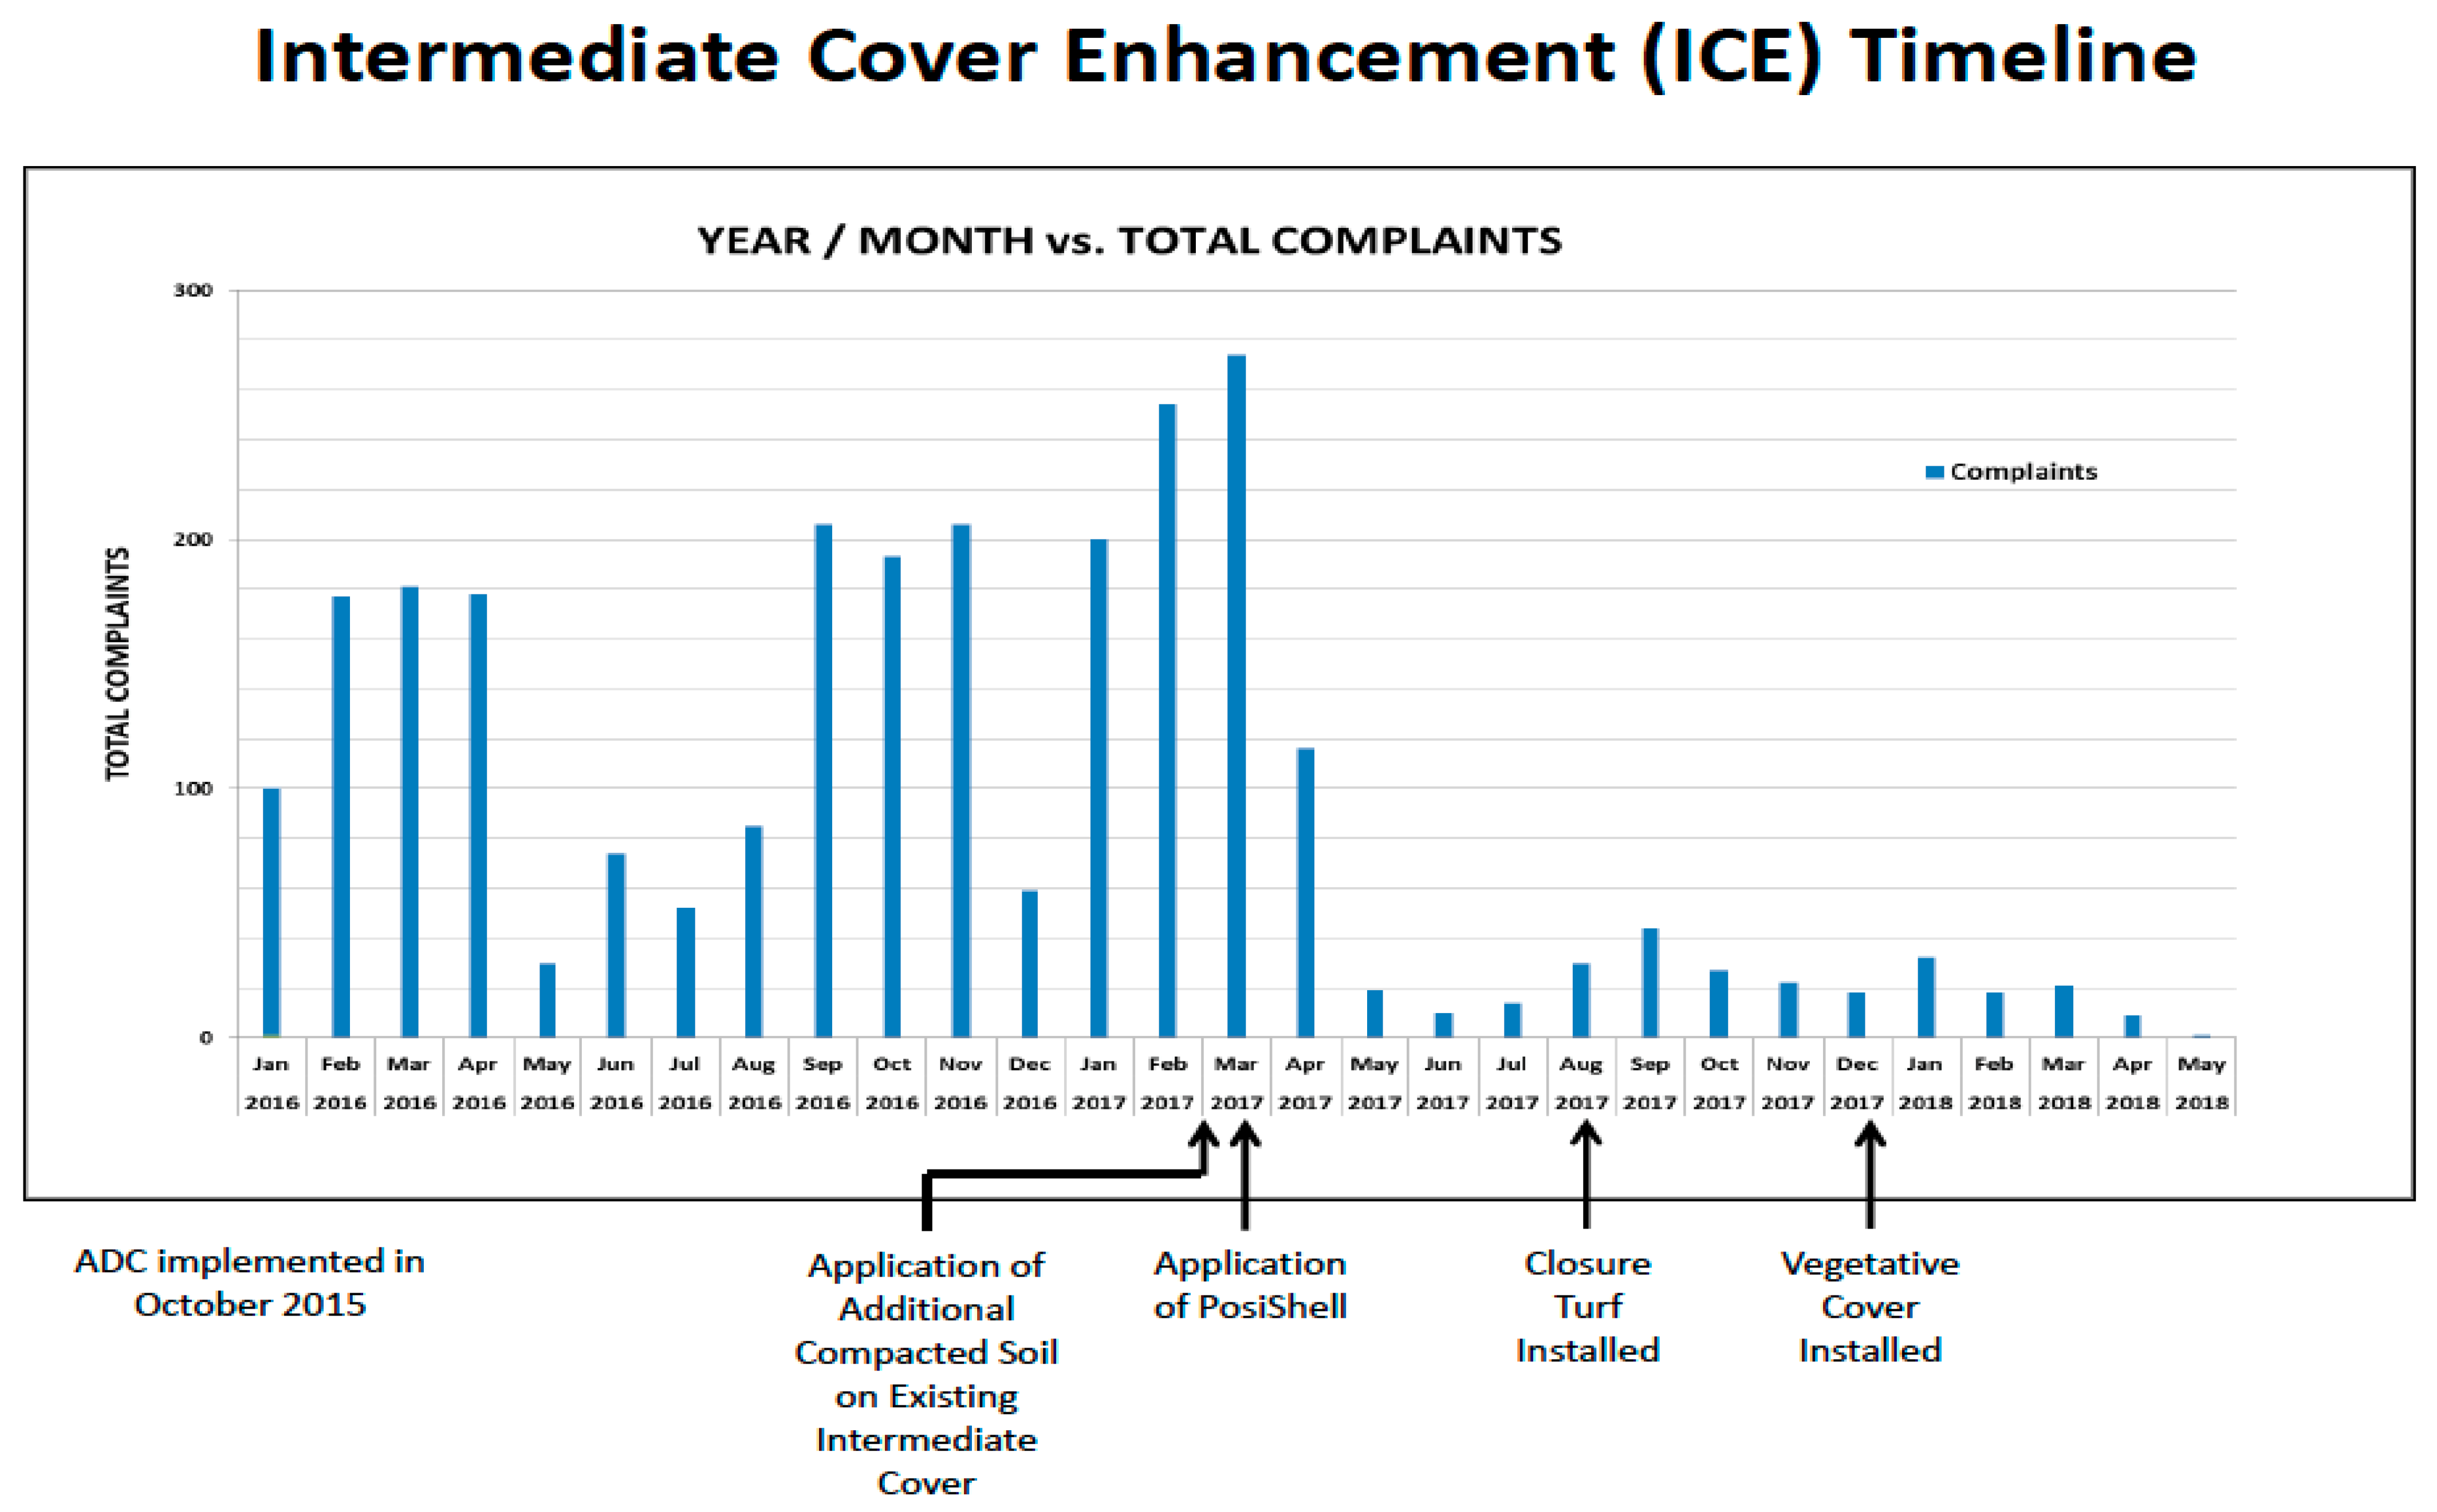
Without the knowledge of the Odor Patrol, the owners of the landfill before and during the study period were completing operational changes to mitigate the odors from the landfill (1). Figure 10 shows the timeline of operational changes at the landfill gas collection system, utilization of compacted soil for intermediate trash cover, the application of “PosiShell,” the utilization of “Closure Turf,“ Vegetative Covers, etc. Thus, odor mitigation approaches were being evaluated together, i.e., closure of the landfill from 6 to 9 a.m. and operational changes at the landfill.
Figure 10 shows a timeline of improvements at the landfill [1]. The “Odor Patrol” study was from 30 October 2017 to 2 May 2018 (100-week days) when the Closure Turf and Vegetative Covers were installed and the total complaints dropped significantly. Thus, either (A) optimizing the landfill operating approach, (B) closing the landfill from receiving trash at 6–9 a.m. or (C) both together lowering the odors from the landfill and decreasing odor complaints about a mile away near the school site.
The angles between wind direction and direction from complaint locations to the landfill were calculated from an air monitoring station at the landfill facing the direction of the complaint location. During the Odor Patrol time period in 2016–2017, over 65% of the winds coming from landfill to complaint locations were within ±15°, and about 90% of the winds coming from source to complaint locations were within ±30°. During the Odor Patrol time period in 2017–2018, 50% of the winds coming from landfill to complaint locations were within ±15°, and 76% of the winds coming from landfill to complaint locations were within ±30°. Due to the lack of weather station data at the landfill and the school location, a thorough meteorological study was not performed. Thus, Odor Patrol data from 30 October 2017 to 2 May 2018 were compared to the complaint data in the same period of time (30 October 2016 to 2 May 2017) in the previous year, and minimum meteorological differences were observed.
At present, it cannot be stated definitively that the closure of the landfill between 6 and 9 a.m. had no effect on the Odor Patrol data at the school or Odor Complaint data to SCAQMD. An Odor Patrol study as completed in this study could be completed with trucks delivering and dumping to the landfill at 6–9 a.m. to develop evidence that the landfill could receive trash between 6 and 9 a.m. This also should be compared to complaint data from SCAQMD. A complete meteorological study could be done during the 100 days of the Odor Patrol event to provide further information on weather influence on nuisance odor complaints.
5. Conclusions
This study shows that the “Odor Profile Method” by an “Odor Patrol” can evaluate the odor nuisance caused by a particular odor source; i.e., determine the specific character and odor intensity of each odorant and determine the frequency and duration of the odor problem. Additionally, the “Odor Profile Method” by an “Odor Patrol” could determine the contribution of the nuisance odors from 6 to 9 a.m. at the school site, about one mile away from the landfill. Quality assurance was maintained for the odor panel. The data show that the odor control panelists’ sense of smell was consistent throughout the 100 days of odor monitoring.
The Odor Patrol only found 13 data of the 1000 data inputs (1.3%) for the 100-day odor monitoring with landfill odor or trash odors that could cause odor complaints. This indicates the landfill did not generate much odor nuisance to the school site from 6 to 9 a.m. when the landfill was not receiving trash. The complaint data also showed a dramatic decrease in odor complaints from 2016–2017 to 2017–2018. Therefore, the Odor Patrol data and the Odor Complaint data correlate well, and the Odor Profile Method can be used to confirm the mitigation of a landfill odor problem.
The study demonstrated a novel approach for odor monitoring by using the Odor Profile Method with an Odor Patrol. The OPM defines the odors to study that come from the landfill. The OPM determined “landfill gas” was primarily a rotten vegetable odor with a secondary sewery/fecal odor of lower intensity and the “Trash odors” were primarily a rancid and sweet odor with a secondary sewery/fecal and/or rotten vegetable odor of lower intensities generated from trash reaching the landfill. The order of intensity observed from high to low was: trash odor (rancid–sweet) > rotten vegetable > sewery/fecal > rancid alone. Thus, trash odor was the major problematic odor from the landfill site. Quality assurance methods were used to remove local odors from the evaluation.
In conclusion, despite other factors such as weather and temperature differences, the closing operation of the landfill from 6 to 9 a.m. and also the implementation of odor control measures at the landfill did help mitigate the problems of unpleasant odors during the Odor Patrol time period of 6–9 a.m. in 2017–2018.
Author Contributions
Conceptualization I.H.S.; methodology, Y.B.; data curation, H.G.; writing—original draft preparation, Y.B.; writing—review and editing, I.H.S.; visualization, Y.B.; supervision, I.H.S. All authors have read and agreed to the published version of the manuscript.
Funding
This research was funded by South Bay Air Quality Management District via Republic Services, Browning-Ferris Industries of California, Inc.
Institutional Review Board Statement
UCLA Institutional Review Board Approval No. 11-002514.
Informed Consent Statement
Informed consent was obtained from all odor panel subjects involved in the study. We thank the students who participated as panelists in the Odor Patrol.
Data Availability Statement
The data presented in this study are available on request from the corresponding author. The raw data is in the authors files. The data of importance to the results of the study are presented in the article.
Conflicts of Interest
The authors declare no conflict of interest.
Presented
29 September–5 October 2019 the 17th Sardinia, International Waste Management and Landfill Symposium Forte Village, Santa Margherita de Pula (CA), Italy.
References
- Tseng, Eugene, Presentation at South Coast Hearing Board Meeting. Available online: https://m.youtube.com/channel/UCKLwLnQt6svrAeL9DgAAFqg (accessed on 26 June 2018).
- Lawless, H.T.; Heymann, H. Sensory Evaluation of Food; Principals and Practice, 2nd ed.; Springer Pubishing: New York, NY, USA, 2010. [Google Scholar]
- Rice, W.; Baird, R.B.; Eaton, A.D. (Eds.) Method 2170, Flavor Profile Analysis (FPA). In Standard Methods for the Evaluation of Water and Wastewater, 23rd ed.; American Public Health Association (APHA), American Water Works Association (AWWA) and Water Environment Federation (WEF): Washington, DC, USA, 2017. [Google Scholar]
- Burlingame, G.A. Odor Profiling of Environmental Odors. Water. Sci. Technol. 1999, 40, 31–38. [Google Scholar] [CrossRef]
- Burlingame, G.A.; Suffet, I.H.; Khiari, D.; Bruchet, A.L. Development of an Odor Wheel Classification Scheme for Wastewater. Water Sci. Technol. 2003, 49, 201–209. [Google Scholar] [CrossRef]
- Burlingame, G.A. A Practical Framework Using Odor Survey Data to Prioritize Nuisance Odors. Water Sci. Technol. 2009, 59, 595–602. [Google Scholar] [CrossRef] [PubMed]
- Curren, J.; Snyder, C.; Abraham, S.; Suffet, I.H. Comparison of Two Standard Odor Intensity Evaluation Methods for Odor Problems in Air or Water. Water Sci. Tech. 2014, 69, 142–146. [Google Scholar] [CrossRef] [PubMed]
- Decottignies, V.; Bruchet, A.; Suffet, I.H. New Landfill Odour Wheel: A New Approach to Characterize Odour Emissions at Landfill Sites. In Proceedings of the Sardinia, Twelfth International Waste Management and Landfill Symposium, CISA, Environmental Sanitary Engineering Centre, Sardinia, Italy, 5–9 October 2009. [Google Scholar]
- Wittes, J.; Turk, A. The Selection of Judges for Odor Discrimination Panels, Correlation of Subjective-Objective Methods in the Study of Odors and Taste, STP 440-EB; Stahl, W., Ed.; ASTM International: West Conshohocken, PA, USA, 1968; pp. 49–70. [Google Scholar] [CrossRef]
- Doty, R.L.; Shaman, P.; Kimmelman, C.P.; Dann, M.S. University of Pennsylvania Smell Identification Test: A Rapid Quantitative Olfactory Function Test for the Clinic. Laryngoscope 1984, 94, 176–178. [Google Scholar] [CrossRef] [PubMed]
- Fechner, G. Elemente de Psychophysik; Leipzig University: Leipzig, Germany, 1859. [Google Scholar]
- Higgins, M.J.; Yarosz, D.P.; Chen, Y.C.; Murthy, S.N.; Maas, N.; Cooney, J.; Glindemann, D.; Novak, J.T. Cycling of Volatile Organic Sulfur Compounds in Anaerobically Digested Biosolids and Its Implications for Odors. Water Environ. Res. 2006, 78, 243–252. [Google Scholar] [CrossRef] [PubMed]
- Chen, Y.; Higgins, M.J.; Murthy, S.N.; Maas, N.A.; Covert, K.J.; Toffey, W.E. Production of Odorous Indole, Skatole, p-Cresol, Toluene, Styrene, and Ethyl Benzene in Biosolids. J. Residuals Sci. Tech. 2006, 3, 193–202. [Google Scholar]
- CEN. EN 16841-1:2016 Ambient Air—Determination of Odour in Ambient Air by Using Field Inspection—Part 1: Grid Method; CEN: Brussels, Belgium, 2016. [Google Scholar]
- Mannebeck, B.; Mannebeck, C.; Mannebeck, D.; Hauschildt, H.; Van Den Burg, A. Field inspections according to EN16841-1:2015 in a naturally evolved neighborhood of industry and living areas. State-of-the-art-technology of a comprehensive data collection, interaction of different sources and effects on the perceiving citizens. Chem. Eng. Trans. 2016, 54, 181–186. [Google Scholar]
- Carmen, B.; Selena, S.; Laura, C. How Can Odors Be Measured? An Overview of Methods and Their Applications. Atmosphere 2020, 11, 92. [Google Scholar] [CrossRef] [Green Version]
Figure 1.
Odor complaints from January 2008 to April 2018 near the school site [1].
Figure 1.
Odor complaints from January 2008 to April 2018 near the school site [1].

Figure 2.
Landfill Odor Wheel [8].
Figure 2.
Landfill Odor Wheel [8].

Figure 3.
Weber–Fechner curve showing intensity vs. concentration. Note: The straight line represents the Weber–Fechner Law.
Figure 3.
Weber–Fechner curve showing intensity vs. concentration. Note: The straight line represents the Weber–Fechner Law.

Figure 4.
Production of odorous volatile sulfur compounds in a landfill. Based upon studies of anaerobically digested biosolids during cake storage [12].
Figure 4.
Production of odorous volatile sulfur compounds in a landfill. Based upon studies of anaerobically digested biosolids during cake storage [12].

Figure 5.
Microbial products of landfill gas sewery/fecal odors from amino acids. Based upon studies of anaerobically digested biosolids [13].
Figure 5.
Microbial products of landfill gas sewery/fecal odors from amino acids. Based upon studies of anaerobically digested biosolids [13].

Figure 6.
Hours of significant odors detected by the Odor Patrol. Note: if two different odors were detected at same time, it is considered two odor events.
Figure 6.
Hours of significant odors detected by the Odor Patrol. Note: if two different odors were detected at same time, it is considered two odor events.

Figure 7.
Average intensity and types of significant odors detected by the Odor Patrol. * Represents two results at the same intensity.
Figure 7.
Average intensity and types of significant odors detected by the Odor Patrol. * Represents two results at the same intensity.

Figure 8.
Odor complaints near the school during the Odor Patrol time period: 6–9 a.m., 2017–2018. The dots do not represent each complaint, only the general location of complaints. LG–Landfill Gas, TR–Trash Odor, NFR–No Field Response. The South Coast Air Quality Management District (SCAQMD) inspector did not go to the location. None: No odor was detected by SCAQMD inspectors at the complaint site.

Figure 9.
Odor Complaints near the school during the Odor Patrol time period: 6–9 a.m., 2016–2017. The dots do not represent each complaint, only the general location of complaints. LG–Landfill Gas, TR–Trash Odor, NFR–No Field Response:. The SCAQMD inspector did not go to the location, None: no odor was detected by the SCAQMD inspectors at the complaint site. Complaints near the school during the Odor Patrol time period: 6–9 a.m.

Figure 10.
The Intermediate Cover Enhancement (ICE) timeline at the landfill [1]. The “Odor Patrol” study was from 30 October 2017 to 2 May 2018 (100 weekdays) when the Closure Turf and Vegetative Covers were installed and the total complaints dropped significantly.
Figure 10.
The Intermediate Cover Enhancement (ICE) timeline at the landfill [1]. The “Odor Patrol” study was from 30 October 2017 to 2 May 2018 (100 weekdays) when the Closure Turf and Vegetative Covers were installed and the total complaints dropped significantly.


Table 1.
Flavor Profile Analysis: Odor Intensity Strength Scale [5].
Table 1.
Flavor Profile Analysis: Odor Intensity Strength Scale [5].
| Intensity Rating | Flavor Standard (% Sugar in Water) | Intensity Description |
|---|---|---|
| 0 | 0 | No odor |
| 1 | Threshold | Can detect odor but cannot describe the odor character |
| 2 | Very Weak | Odor barely perceptible |
| 3 | Recognized | Action Level |
| 4 | 5 | Odor clearly exists but takes time to describe |
| 6 | Weak–Moderate | Odor readily perceived and identified |
| 8 | 10 | Odor is uncomfortable to smell for extended periods of time |
| 10 | Moderate–Strong | Odor is uncomfortable to smell for extended periods of time |
| 12 | 15 | Odor is unbearable to smell for even short periods of time |
Table 2.
Exemplary Weekly Data Sheet for Week 2.
| WEEK 2. Odor Characteristics and Intensities of Each Odor Characteristic Observed by the Odor Profile Method Panel | |||||
|---|---|---|---|---|---|
| Sample Location: School Yard—Facing the Landfill Site including background odors that were observed | |||||
| 11/6/17 | 11/7/17 | 11/8/17 | 11/9/17 | ||
| Sample # | Time: AM | ODOR | ODOR | ODOR | ODOR |
| 1 | 6:00 | Other odor notes: musty, fecal, rotten vegetable | Other odor notes: sewery, sweet, lemon, rancid, pine | Rotten vegetable 3.6 ± 2.2, rancid 2.4 ± 1.7. Other odor notes: sweet, detergent | Other odor notes: musty |
| 2 | 6:20 | Other odor notes: musty | Sewery 2.8 ± 3.0, rancid 1.0 ± 0.9; Other odor notes: sweet, pine, rotten vegetable | Other odor notes: rotten vegetable, rancid, sweet, sewery | Other odor notes: musty, rotten vegetable, pine, rancid |
| 3 | 6:40 | Rotten vegetable 2.8 ± 1.1; Other odor notes: pine, grassy, rancid | Other odor notes: sweet, pine, vegetable | Not detected | Other odor notes: rancid, sweet |
| 4 | 7:00 | Other odor notes: pine, grassy | Other odor notes: sweet, pine, gasoline | Not detected | Not detected |
| 5 | 7:20 | Not detected | Grassy 2.0 ± 2.0; Other odor notes: pine | Other odor notes: rotten vegetable | Other odor notes: musty |
| 6 | 7:40 | Not detected | Other odor notes: pine | Not detected | Other odor notes: sweet |
| 7 | 8:00 | Not detected | Other odor notes: sweet, lemon, rancid | Not detected | Not detected |
| 8 | 8:20 | Other odor notes: burnt | Other odor notes: gasoline, detergent, burnt | Not detected | Not detected |
| 9 | 8:40 | Other odor notes: lemon | Other odor notes: sewery, gasoline, burnt | Not detected | Not detected |
| 10 | 9:00 | Other odor notes: grassy, detergent | Other odor notes: pine, musty | Other odor notes: sweet grass | Other odor notes: rancid, sweet, sweet grass, detergent |
| Weather Condition | Partly cloudy, 72°/53° F | Partly cloudy, 76°/54° F | Cloudy, 77°/51° F | Cloudy, 72°/54° F | |
| Table 2 Legend: Odor Characteristics—Odor Wheel—Landfill Odor Wheel Used. | |||||
| Intensity Scale: 0—odor free; 1—threshold, 2—very weak; 4—weak—recognition; 6—moderate, perceived; 8—moderate.—strong; 10—strong; 12- very strong | |||||
| Odor Profile Method | |||||
| Odor Character—Panel Average ± Standard Deviation | |||||
| Other Odor Note = < 50% of an odor was reported by the odor panel. This is an odor that should be below a complain level. | |||||
| Comments—Odor Notes—Primarily background odors that are not from the landfill | |||||
| 1 | Garlic -REAL if after checking suspected odor from the kitchen area, when actually walking toward kitchen | ||||
| 2 | Grassy—suspected from a lawn mower operation close to school; could hear the lawn mower machine. | ||||
| 3 | Detergent- suspected from cleaning at the school | ||||
| 4 | Gasoline- suspected from a truck or car outside of school | ||||
| 5 | Musty- usually during cloudy weather, wet ground odor or after a rain event | ||||
| 6 | Burnt -during the wildfire period | ||||
| 7 | Lemon—from plants possibly | ||||
| 8 | Solvent -unknown source at the school | ||||
| 9 | Perfume—suspected from teachers, parents or flowers | ||||
| 10 | Flowery -from flower blooming near the school | ||||
| 11 | Pine—probably from trees nearby school | ||||
| 12 | Ammonia—suspected animal urine | ||||
Table 3.
The 13 Odor Panel Sample Data When Landfill Odors Were Observed during the “Odor Patrol Study “of 100 midweek days. Note: environmental background odors were not included in this data set.
Table 3.
The 13 Odor Panel Sample Data When Landfill Odors Were Observed during the “Odor Patrol Study “of 100 midweek days. Note: environmental background odors were not included in this data set.
| 13 data points of Significant Landfill Odor Observed | |||
|---|---|---|---|
| Week | Date | Time AM | Odor Character |
| 2 | 6 Nov 2017 | 6:00 | Rotten vegetable 2.8 ± 1.1; Other odor note: rancid |
| 2 | 7 Nov 2017 | 6:20 | Sewery 2.8 ± 3.0, rancid 1.0 ± 0.9; Other odor note: sweet, rotten veg |
| 2 | 8 Nov 2017 | 6:40 | Rotten vegetable 3.6 ± 2.2, rancid 2.4 ± 1.7; Other odor note: sweet |
| 6 | 11 Dec 2017 | 6:20 | Sewery 1.0 ± 1.2 |
| 8 | 17 Jan 2018 | 7:40 | Rancid 1.5 ± 1.9, Other odor note: sewery, rotten veg |
| 9 | 22 Jan 2018 | 6:00 | Rancid 2.0 ± 2.8; Other odor note: sewery |
| 12 | 12 Feb 2018 | 7:00 | Sewery 1.5 ± 1.9 |
| 12 | 12 Feb 2018 | 7:20 | Sewery 2.0 ± 2.3; |
| 12 | 13 Feb 2018 | 7:40 | Sewery 2.0 ± 2.3; Other odor note: rancid |
| 13 | 21 Feb 2018 | 7:20 | Rotten vegetable 1.0 ± 1.2 |
| 17 | 20 Mar 2018 | 8:40 | Sweet trash 4.0 ± 1.6 |
| 17 | 20 Mar 2018 | 9:00 | Sweet trash 2.5 ± 3.0 |
| 19 | 12 Apr 2018 | 6:40 | Sewery 1.0 ± 1.2 |
Publisher’s Note: MDPI stays neutral with regard to jurisdictional claims in published maps and institutional affiliations. |
© 2021 by the authors. Licensee MDPI, Basel, Switzerland. This article is an open access article distributed under the terms and conditions of the Creative Commons Attribution (CC BY) license (https://creativecommons.org/licenses/by/4.0/).
Share and Cite
MDPI and ACS Style
Bian, Y.; Gong, H.; Suffet, I.H. The Use of the Odor Profile Method with an “Odor Patrol” Panel to Evaluate an Odor Impacted Site near a Landfill. Atmosphere 2021, 12, 472. https://doi.org/10.3390/atmos12040472
AMA Style
Bian Y, Gong H, Suffet IH. The Use of the Odor Profile Method with an “Odor Patrol” Panel to Evaluate an Odor Impacted Site near a Landfill. Atmosphere. 2021; 12(4):472. https://doi.org/10.3390/atmos12040472
Chicago/Turabian StyleBian, Yuge, Haoning Gong, and I. H. (Mel) Suffet. 2021. "The Use of the Odor Profile Method with an “Odor Patrol” Panel to Evaluate an Odor Impacted Site near a Landfill" Atmosphere 12, no. 4: 472. https://doi.org/10.3390/atmos12040472
Note that from the first issue of 2016, this journal uses article numbers instead of page numbers. See further details here.