Evaluating the Forecast Performance of the Meiyu Front Rainbelt Position: A Case Study of the 30 June to 4 July 2016 Extreme Rainfall Event


1
National Meteorological Center, China Meteorological Administration, 100081 Beijing, China
2
Department of Meteorology and Atmospheric Science, and Center for Advanced Data Assimilation and Predictability Techniques, The Pennsylvania State University, University Park, PA 16802, USA
*
Authors to whom correspondence should be addressed.
†
Author is deceased.
Atmosphere 2019, 10(11), 648; https://doi.org/10.3390/atmos10110648
Submission received: 24 July 2019
/
Revised: 21 October 2019
/
Accepted: 24 October 2019
/
Published: 26 October 2019
(This article belongs to the Section Meteorology)
Abstract
:An impactful and poorly forecasted heavy rainfall event was observed in association with the Meiyu front over the Yangtze River valley of China from 30 June–4 July 2016. Operational global numerical weather prediction models for almost all forecast lead times beyond 24 h incorrectly forecasted the location and intensity of the precipitation associated with this event. This study presents the first examination of this poleward bias in the operational models for the Meiyu front, which has been frequently noted by meteorologists at the Chinese Meteorological Administration, and explores areas of forecast error and uncertainty in the prediction of the position of the primary frontal rainbelt that is crucial to the placement and intensity of the heavy rainfall. A new zonal mean maximum accumulated precipitation index is introduced and utilized to identify members in the European Centre for Medium-Range Forecasts (ECMWF) Ensemble Prediction System (EPS) that either perform well or perform poorly in forecasting the location of the Meiyu front. Using this new precipitation metric, five-member subgroups representing the EPS members that were most accurate and those that incorrectly displace the Meiyu front the furthest north were identified. An analysis of composite mean fields for the EPS subgroups and the correlation between the rain band placement and the 500 hPa heights was performed for several EPS model runs. We showed that a successful prediction of the location of the Meiyu front rainbelt position by the EPS is most sensitive to the intensity of the 500 hPa trough located over eastern China for the event. The ensemble members that had the largest northward error in the location of the rain band were found to have a more intense 500 hPa trough than the members that more accurately predicted the rainbelt. The more intense upper level trough was found to have enhanced the lower tropospheric southerly flow equatorward of the front and led to a less zonal-oriented Meiyu front, resulting in a northward displacement of both the rainbelt and the regions of more intense precipitation rates. Finally, an examination of the evolution of the differences between the subgroups shows that the primary differences in 500 hPa intensity propagate in-phase with the 500 hPa trough. We show that it is the intensity of the trough, rather than the rate of propagation, that is the most important source of forecast dissimilarities between the successful and failed forecasts.
1. Introduction
Climatologically there exist three rainy seasons in east China from the boreal spring to autumn [1,2]: (1) The Pre-Summer Rainy Season; (2) The Meiyu season; and (3) The North and Northeast rainy season. These seasons are strongly influenced by the western Pacific subtropical high (WPSH) and the south Asian high, which shifts the Southeast Asian monsoon from south to north. Because nearly 50% of the floods in this region occur during the Meiyu season [3], the onset date and the spatial distribution of the Meiyu front have always been the subject of the operational forecast and scientific research [4].
The typical Meiyu front appears as a quasi-zonally oriented rain band near 30° N over east China and as a southwest to northeast-oriented rain band over Japan and Korea along 30°–40° N [5,6]. The convection associated with the front is typically found in a region of warm air advection over eastern China in early summer, and localized ascent along the front can be enhanced by transient mid-latitude troughs that propagate through this region in association with the jet stream [6]. The relatively compact and pseudo-stationary nature of the Meiyu front has resulted in natural disasters in portions of south central and eastern China due to extreme rainfall events [1,7,8,9,10]. For example, the 1998 Yangtze River flood resulted in 3004 fatalities, displaced 14 million people, and resulted in $24 billion in economic loss [5]. Perturbations in the location of the Meiyu front can also result in “northern drought/southern flood” or “northern flood/southern drought” patterns [11], leading to significant socio-economic impacts [12]. As such, an accurate prediction of these events on medium range (4–10 day) time scales is critical.
Many studies have investigated the synoptic and mesoscale features that contribute to the Meiyu rainfall season. In the upper troposphere, variability in the subtropical jet stream is important in establishing the onset and conclusion of the Meiyu season [13]. The strength and the position of the South Asian High is also an important modulator of regions of upper-level convergence and divergence along with convective activity over the Meiyu region [14]. High-latitude blocking, primarily located near the Ural Mountains and the Sea of Okhotsk, has also been noted to be an important precursor to the onset of the Meiyu season [15]. In particular, when both regions are subject to blocking, upper tropospheric winds over eastern China becomes either stagnant or gain an anomalous southerly component. In both cases, an abnormally strong Meiyu front can be established [16,17], resulting in notable impacts on precipitation.
In the lower troposphere, many studies have examined the mesoscale structure of the Meiyu front [18]. These studies have generally presented the Meiyu front as a quasi-stationary boundary defined by a wind shear line at 850 hPa that is associated with a robust gradient in 700 hPa equivalent potential temperatures. The shear line is established due to a strong low level jet in association with the WPSH which converges with the mid-latitude air mass over eastern China [1]. This low-level jet helps to provide strong moisture flux into the region, and the ascent along the front can generate elongated cloud and rain bands with embedded mesoscale disturbances.
In this study, the predictability of the Meiyu precipitation band position for a high-impact rainfall event that occurred over eastern China from 30 June–4 July 2016 (Figure 1) will be discussed. Daily precipitation totals for this event were in excess of 100 mm day−1 (defined by the Chinese Meteorological Service as a rain storm event) across much of the Sichuan Basin and the Yangtze and Huaihe Rivers (Figure 1) for five consecutive days, resulting in regional flooding. This event is of particular interest due to a failure by several of the operational global deterministic and ensemble forecast systems in accurately predicting the position of the Meiyu rain belt for forecast lead times of up to 7 days. Here, forecast errors in the prediction of the precipitation band specifically will be assessed using the 51-member European Centre for Medium-Range Weather Forecasts (ECMWF) Ensemble Prediction System (EPS) and will be referred to when discussing the predictability of the model for this event.
The 51 members of the EPS available for each forecast hour further provide a large sample size of forecasts to analyze and allows for a more robust statistical diagnosis for identifying possible dynamic and thermodynamic sources for the reduced forecast skill [9,19,20]. Uncertainty exists in the accurate predictions of weather phenomena due to a variety of factors including the initial conditions [9,21,22]. This study will focus less on the initial conditions and more on the evolution of the model in the medium range in identifying what features contribute to errors in the forecasted location and intensity of the Meiyu precipitation band. The EPS members will further be subdivided into two groups representing the most and least accurate forecasts of the precipitation band position and compared to examine the evolution of the forecast uncertainty [19].
2. Data and Methodology
In order to investigate the evolution of the forecasted Meiyu rain band position for the event, the ensemble forecasts from the medium-range ECMWF EPS initialized at 1200 UTC 27, 28, and 29 June 2016 were examined. The data were obtained from The Observing System Research and Predictability Experiment (THORPEX) Interactive Global Grand Ensemble (TIGGE) archive (https://apps.ecmwf.int/datasets/data/tigge/) [23,24]. The EPS has 51 members with horizontal grid spacing of 18 km with 91 vertical layers for the forecast periods of interest. The ECMWF deterministic forecast data [25], which has a horizontal resolution of 9 km and 91 vertical layers, was also utilized to examine the performance of the model in predicting the front. Verification of the modeled precipitation was performed using an interpolated daily rain gauge dataset, which was interpolated by the authors to a 0.5° × 0.5° gridded domain using an inverse distance weighting interpolation [26] from 2300 stations in China (provided by the National Meteorological Information Center of the China Meteorological Administration (CMA)). The 0-h analysis from the ECMWF deterministic forecast was further used to verify the performance of the EPS and the deterministic forecast for the event.
To diagnose the forecast differences in the location of the precipitation band, this study defined a metric to characterize the location of maximum rainfall in association with each ensemble member. First, the zonal mean (110°–120° E) of the 120-h accumulated precipitation for the event period (0000 UTC 30 June to 0000 UTC 5 July) was calculated for the observations (Figure 2a,b), the deterministic forecast, and each EPS member. The latitude of the maximum in precipitation was then identified and termed the zonal mean maximum accumulated precipitation (ZMCP) point (Figure 2b). By examining the ZMCP for consecutive runs of the ECMWF deterministic or ensemble forecasts, temporal trends in both the forecasted latitude and the intensity of the Meiyu rain band can be readily identified. A mean rain belt position index (RBI), defined as the mean ZMCP for a set of EPS members, was also utilized to diagnose the performance of the EPS mean forecast or subgroups within.
The ZMCP for each EPS member was calculated for forecasts initialized at 1200 UTC on 27, 28, and 29 June 2016. To diagnose sources of error for the forecasted rain band, two subgroups were selected to from the EPS members using the difference between the member forecasted ZMCP and observed ZMCP. One subgroup, termed the GOOD group, consists of the five EPS members with the smallest forecast ZMCP error compared to the observations, while a second subgroup, termed the NORTH group, consists of the five EPS members with the largest ZMCP error compared to the observations. A new set of EPS members was selected for subgroup at each separate initialization of the EPS based on the performance of the respective members for each model run. The ensemble mean of each subgroup were analyzed and differences between the two were compared as a function of forecast lead time.
3. Results
3.1. Evolution of the 30 June–4 July 2016 Event
3.1.1. Synoptic Circulation Evolution
The Meiyu front is generally established through a combination of synoptic and mesoscale processes. It is typically defined as a mesoscale shear line in the lower and middle troposphere that forms as a result of the convergence between southerly flow associated with the WPSH and the midlatitude air mass. Here, the cold sector of a retrograding 500 hPa midlatitude cyclone found near 55° N, 125° E establishes the midlatitude air mass (Figure 3a–c). The WPSH, often identified from the 5880-m height contour on the 500-hPa surface [3,10], is denoted by the thick red line in Figure 3. The southerly flow on the western flank of the WPSH provides a sustained source of tropical moisture and helps establish a quasi-stationary, zonally elongated 850 hPa wind shear line (Meiyu front) along the Yangtze river near 30° N, 110°–130° E (Figure 4, green dashed).
The 500-hPa flow near the Meiyu front can be broadly characterized as the transition from a departing mid-latitude trough with a closed low centered near 55° N, 125° E at the onset of the event (Figure 3a) to the establishment of a ridge near 43° N, 115° E by the completion of the event (Figure 3e). Mesoscale vortices at 850 hPa were identified along the Meiyu front as well, in particular near the Sichuan Basin, indicating additional regions of localized forcing for convergence and ascent (Figure 3). These mesoscale vortices may form in response to flow across terrain (e.g., the Southwest China Vortex) or due to forcing for ascent (and commensurate convergence) in the region downstream of the 500 hPa trough, and are known to be a mechanism that can result in enhanced precipitation along the Meiyu front [1]. This enhancement is found for this case (Figure 1), where the highest daily precipitation values are generally found slightly offset to the east of the center of the mesoscale vortices along the Yangtze-Huaihe River basin (Figure 1 and Figure 3).
3.1.2. Deterministic ECMWF Forecasts
Progressive runs of the deterministic ECMWF throughout the 2016 Meiyu season (mid-June to mid-July) demonstrate a systemic northward bias in the ZMCP location at medium-range lead times leading up to the onset of the Meiyu precipitation periods (Figure 4). The observed totals of precipitation for the 30 June–4 July event show the band of the heavy rainfall event located near the Yangtze River with localized values in excess of 500 mm (Figure 5a). The forecast initialized at 1200 UTC 27 Jun (Figure 5d) is characterized by a diffuse region of two weak rain bands that are offset poleward of the observations. Subsequent forecasts initialized on 28 and 29 June (Figure 5b,c) predict a single poleward-shifted band of heavier precipitation that would impact the Huaihe River valley rather than the Yangtze River valley.
The ZMCP characterizes this northward bias in the deterministic ECMWF as well, with an equatorward drift in the ZMCP from 34.5° N in the 1200 UTC 24 June initialization to 32.5° N in the 1200 UTC 29 June initialization (Figure 6), while the observed ZMCP is 31.5° N (Figure 2b). In addition to the northward bias, the model runs also exhibited lower event-total precipitation values, with localized values just exceeding 260 mm (Figure 5b–d, Figure 6). Though the model progressively improved toward a more accurate prediction of the frontal precipitation location in shorter lead times, differences still exist between the forecasted and the observed frontal precipitation leading up to the onset of the event. Such spatial and intensity errors can be magnified in areas of complex orography and hydrology that have high population densities such as in the Yangtze River valley.
3.1.3. ECMWF EPS Forecast
In order to evaluate possible sources of forecast error for this event, the EPS forecast initialized 1200 UTC 27, 28, and 29 June 2016 is further analyzed. The 1200 UTC initialization on 29 June 2016 had a systematic poleward bias in the rain band as identified through the ZMCP (Figure 7), with 34 of 51 members falling north of the observed ZMCP. This poleward bias is similar to that noted in the deterministic run for the same period (Figure 2c, Figure 5b), and the individual members of the EPS had a poleward position biases of the forecasted ZMCP of upwards of +3 standardized anomalies (Figure 7b).
The performance of the EPS can be examined by looking at the RBI of the full 51-member EPS as well as the RBI for the subgroups of the five best and worst performing EPS members, which are termed GOOD and NORTH, respectively (Figure 8). The EPS demonstrated an expected trend toward a more accurate representation of the event total RBI (Figure 8a,b) and a higher precision (reduced model spread) for initializations closer to the event onset (Figure 8b), with the exception of the 25 June initialization. Though the observed ZMCP for the event does fall within the envelope of possible forecasts for these lead times, the observed event ZMCP fell within the 25th–75th quartile range only for the EPS initializations starting 27 June, indicating that the model generally lacked significant skill at further lead times.
The daily evolution of the differences in the ensemble, GOOD, and NORTH RBI from the 1200 UTC 29 June 2016 EPS initialization can be compared against the ZMCP of the observations for the full event (31.5° N; Figure 2). Differences between the RBI of the GOOD and NORTH subgroups are larger on 1–2 July 2016 compared to 30 June and 3–4 July, with a latitudinal displacement of nearly 2° between the two (Figure 8). The ensemble mean RBI was similar to the GOOD subgroup RBI from 30 June–1 July but was similar to the NORTH subgroup for 2 July. The 2° difference between the GOOD and NORTH subgroups is equivalent to difference in latitude between the 25th and 75th percentile ranges of the full EPS for this forecast period (Figure 8b). As such, the differences between the subgroups on 1–2 July are quite large relative to the EPS variability, and the largest differences between the forecasts are most likely confined to the 1–2 July period.
The regional distribution of precipitation for 1 July further demonstrates this difference (Figure 9). Both model solutions show a southwest to northeast orientated rain belt. The GOOD group composite consists of a single band of precipitation located just north of the Yangtze River valley (Figure 9a,c) and is reasonably close to the location of the observed precipitation for 1 July (Figure 1b), though the intensity of the forecast precipitation is too weak. The NORTH group composite has a higher (and more accurate) forecasted intensity of precipitation but is significantly offset to the north (2°–4°), with the heaviest precipitation concentrated over the Huaihe River valley (Figure 9d). As the model initializations approach the onset of the event, the GOOD and NORTH group composites converge toward a similar solution, though the NORTH groups still is offset further north from the Yangtze River valley (Figure 9c,d).
3.2. Sources of Forecast Errors
3.2.1. Diagnosis of Forecast Error
Differences between the GOOD and the NORTH subsets using the 28 June 1200 UTC EPS forecast for 1 July at 0000 UTC are next explored for a variety of tropospheric fields. First explored are the 850-hPa winds (which can broadly define the location of the Meiyu frontal shear line) and the 500-hPa geopotential heights (Figure 10). Both the GOOD and the NORTH subsets captured the 500-hPa trough near 31° N, 112° E, though the GOOD group was less amplified and displaced eastward of the NORTH group. The shear line at 850 hPa, annotated by the black dashed line, was farther south for the GOOD group (Figure 10a) than the NORTH group (Figure 10b). Given the differences in the 500 hPa flow, it is likely that the deeper mid-tropospheric trough played a role in inducing a stronger surface circulation centered near 35°N, 113°E. This stronger circulation is evident in the vector wind difference (Figure 10b, colored), which shows stronger overall winds around the Meiyu front for the NORTH group. Stronger southerly winds (maximized near 35° N, 115° E) on the equatorward side of the Meiyu front likely contributed to a northward displacement of the shear line for the NORTH group (Figure 10b). This surface circulation also acts to strengthen the low-level convergence along the shear line (Figure 10b), resulting in heavier rainfall when compared to the GOOD group (Figure 9a,b, Figure 10).
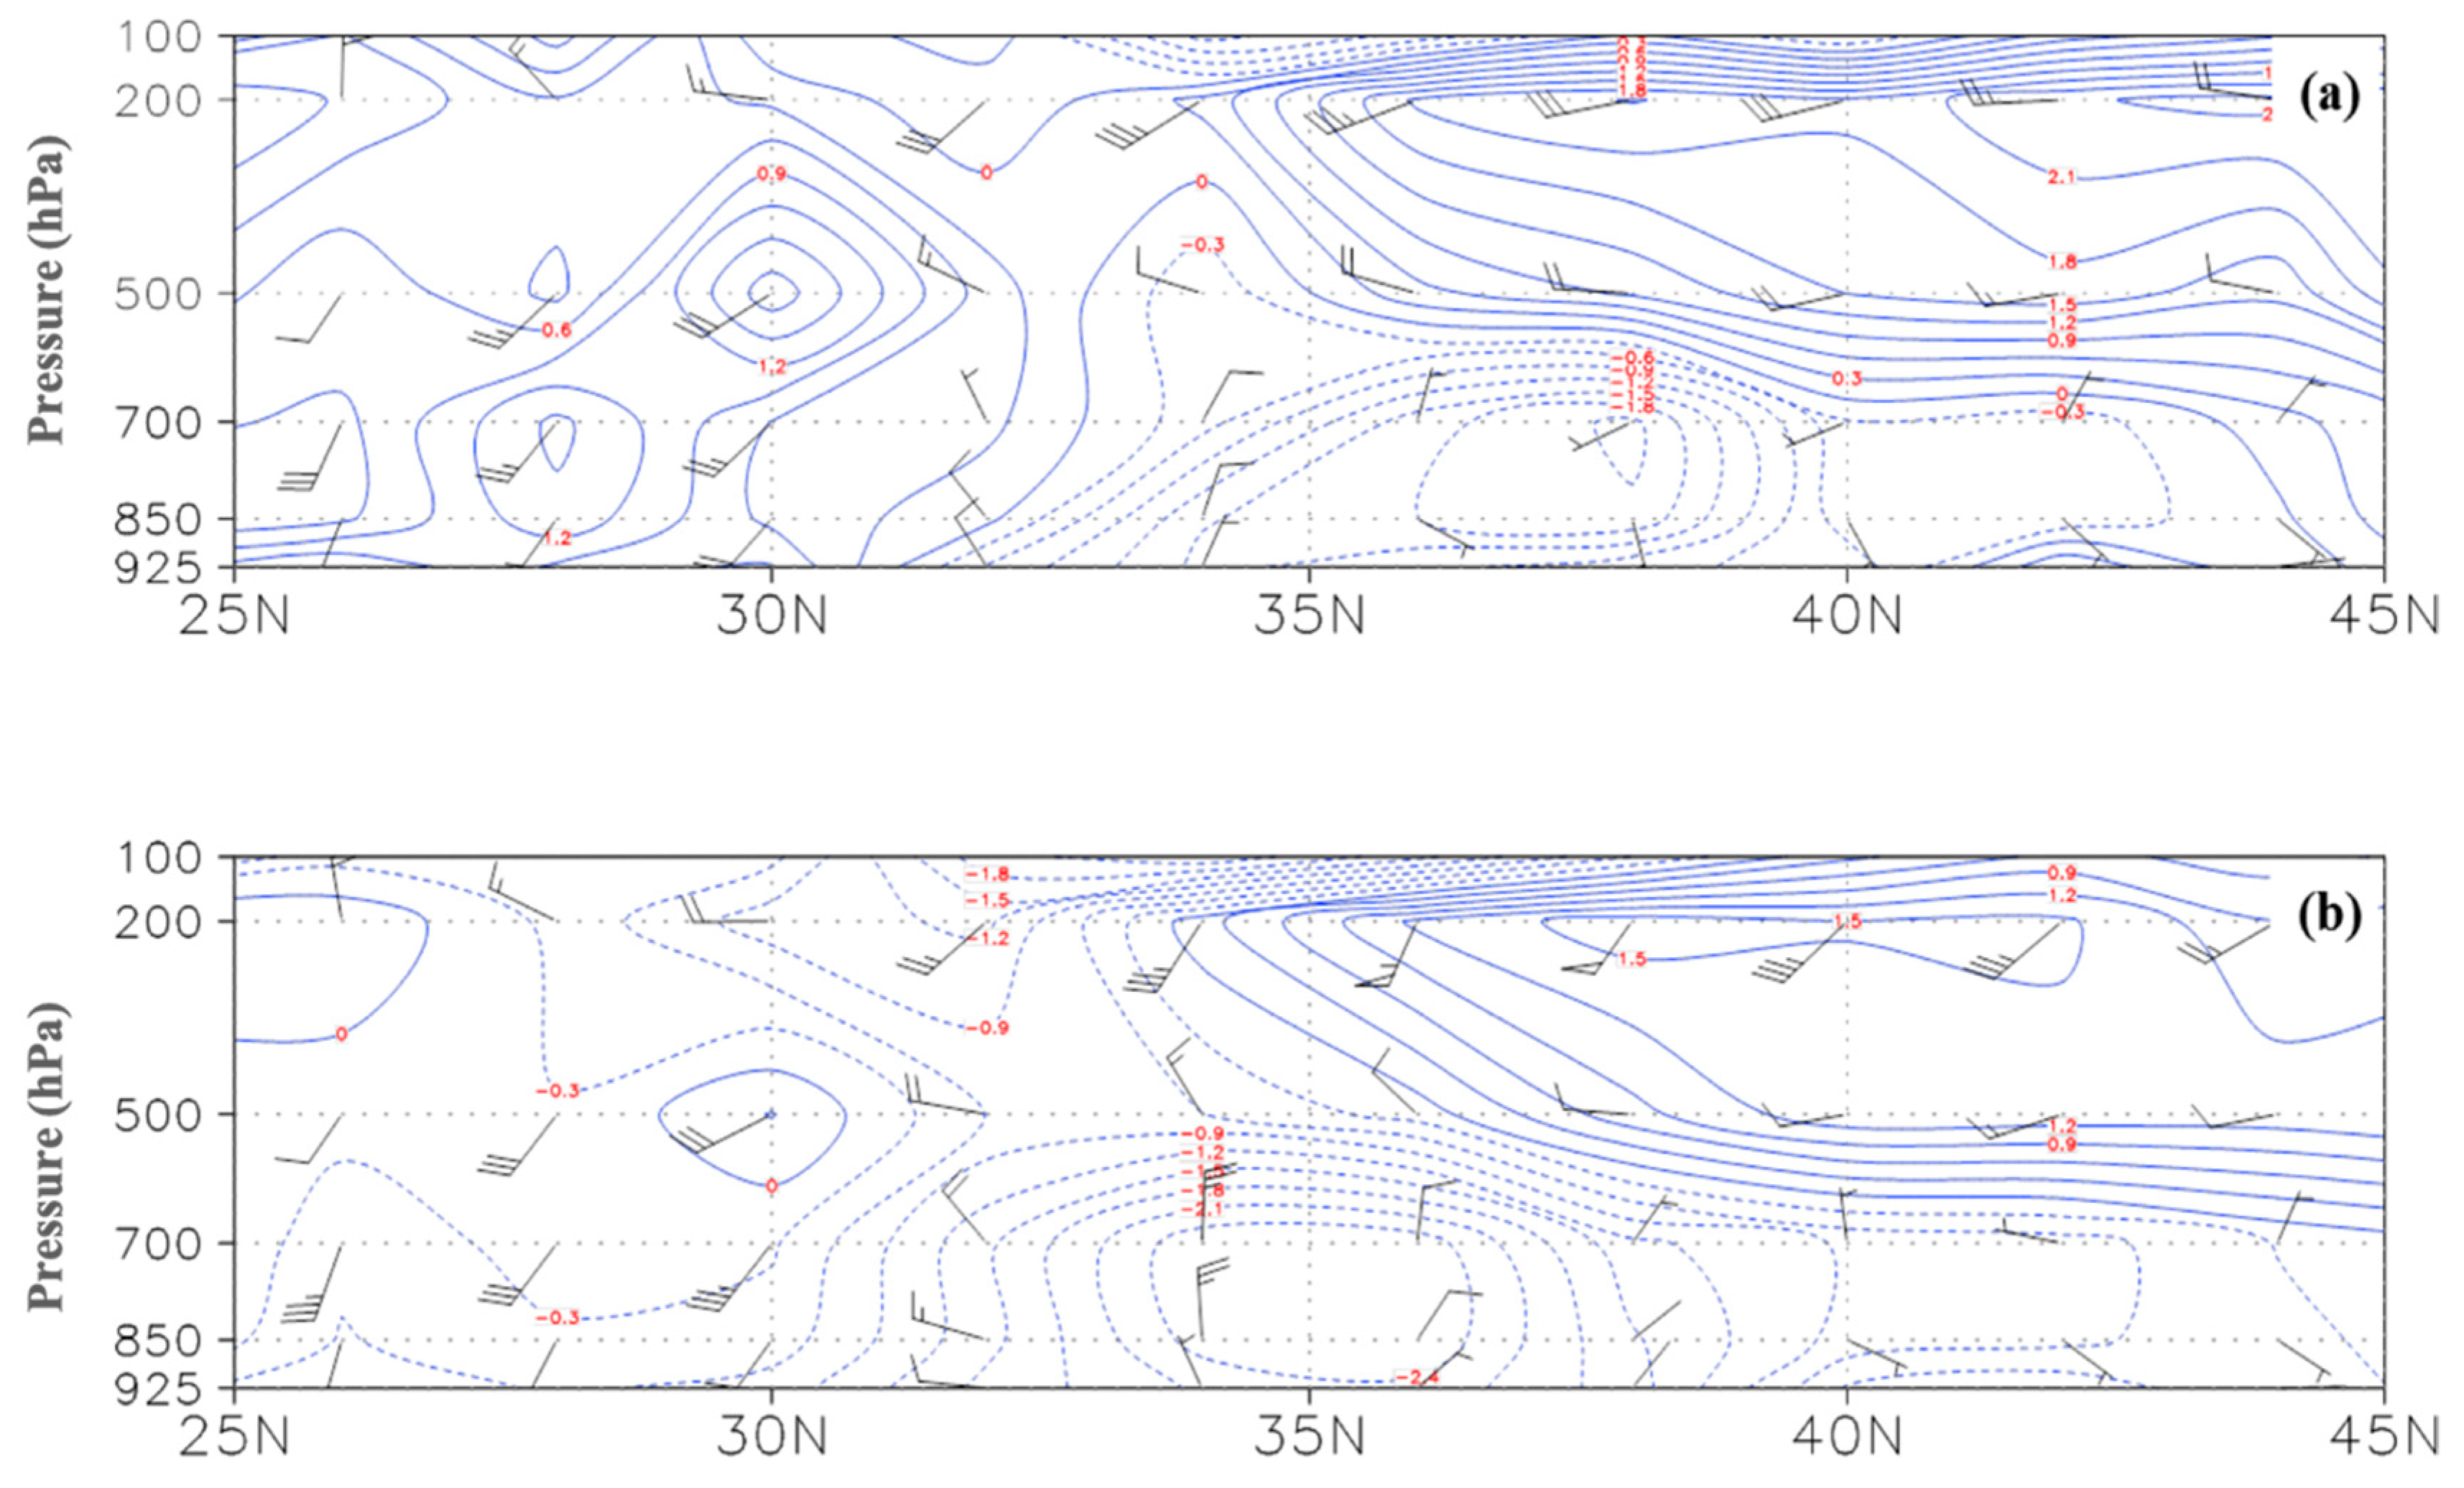
To further examine the vertical extent of the geopotential height and meridional wind differences, a cross-section is taken at 112° E from 25°–45° N (Figure 11). Here, positive values in the standardized difference of meridional winds correspond to the NORTH group having stronger southerlies than the GOOD group, while the opposite is true for negative values (Figure 11a). Similarly, positive geopotential height differences would indicate that the NORTH group has higher heights than the GOOD group while negative differences would indicate the opposite (Figure 11b). The NORTH group has notably stronger southerly flow through the depth of the troposphere south of 33° N and stronger northerly winds in the 925–600 hPa-layer from 33°–43° N (Figure 11a). As such, a region of enhanced convergence is noted at slopes from approximately 32° N at 925 hPa to 34° N near 500 hPa. This enhanced convergence also occurs in the vicinity of the stronger lower tropospheric cyclone in the NORTH group (Figure 10b, Figure 12b). Differences are also present in the upper levels (500–200 hPa), where the NORTH group has stronger southerly winds than the GOOD subset (Figure 11a). These differences in the magnitude and direction of the winds (25–35 knot west-southwesterly winds in the GOOD compared to 45–55 knot south-southwesterly winds in the NORTH) are due to the more amplified 500 hPa trough for the NORTH subset (Figure 10b, Figure 12b).
An analysis of the differences in 700 hPa relative humidity further demonstrates the poleward displaced and less zonally oriented region of convergence for the NORTH group (Figure 12). In the GOOD group, the band of relative humidity values in excess of 70% in association with the Meiyu front extends from near 25° N, 103° E to 33° N, 120° E, approximately paralleling the Yangtze River valley (Figure 12a). In the NORTH subset, the Meiyu band is oriented from approximately 25° N, 108° E to 37° N, 116° E (Figure 12b). This difference in the orientation is primarily confined to the region directly downstream of the 500 hPa trough in the NORTH group (Figure 12c), further indicating the importance of the role of the magnitude of the trough in impacting the forecast accuracy. In addition, it is probable that this enhanced region of cloud cover (Figure 12c) and precipitation (Figure 10b) is associated with substantial latent heat release which could act to further intensify the lower tropospheric circulation.
3.2.2. Temporal Evolution of Forecast Error
Consecutive ECMWF EPS runs initialized on 27, 28, and 29 June at 1200 UTC were analyzed next to diagnose the evolution of the forecast differences identified in the previous sections. One point correlation maps [27] between the RBI and the 500 hPa geopotential height field for all 51 EPS members were calculated and examined for 1 and 2 July (Figure 13). Here, a positive correlation coefficient indicated that high geopotential heights correlate with a higher latitude for the RBI, or alternatively, low geopotential heights correlate with a more equatorward RBI. The opposite was true for a negative correlation coefficient, which indicates low geopotential heights correlating with a more poleward RBI or high geopotential heights correlating with a more equatorward RBI. Coefficients with values larger than 0.3 were considered to be robust due to the large size of each ensemble group (51 members).
A stable negative-positive mode in the correlation coefficient was evident for all three forecasts for both 1 and 2 July centered over eastern China (Figure 13). Negative correlation coefficients in excess of −0.5 were collocated with the largest negative difference in 500 hPa heights between the GOOD and NORTH groups (−30 to −80 m). Furthermore, positive correlations (up to +0.9, Figure 13d) collocate with the largest positive difference in 500 hPa heights between the GOOD and NORTH groups (+30 to +50 m). This combined correlation field indicates that the more amplified trough and ridge pattern over eastern China in the EPS mean favors a more poleward RBI, which is supported by the collocated large differences between the GOOD and NORTH 500 hPa height fields. Ensemble forecasts from progressive initializations with shorter lead times show that differences in the magnitude of the 500 hPa trough and ridge between the NORTH and GOOD groups broadly reduce for the 1 July forecast (Figure 13a,c,e). For the 2 July forecast (Figure 13b,d,f), the differences between the NORTH and GOOD groups for the downstream ridge amplitude decrease with progressive model runs while the differences for the trough increase (near 35° N, 115° E). As such, it is clear that a deeper trough and a more amplified ridge at 500 hPa, as seen in the NORTH group, plays an important role in creating a more southwest-to-northeast oriented front. Furthermore, the consistency of the higher magnitude correlation coefficients in association with the 500 hPa trough suggest that the trough plays a more important role than the associated downstream ridging in establishing the poleward displacement of the Meiyu frontal rain band.
The evolution of the forecast differences can further be ascertained from the 700-hPa equivalent potential temperature (θe; Figure 14). Sharp gradients in θe are considered, along with significant horizontal wind shear, an excellent indicator of the location of the Meiyu front. The forecast initialized on 28 June (for 1 July) indicates significant differences in the orientation of the Meiyu front θe gradient between the GOOD and NORTH groups (Figure 14a,b). For the region from 105°–115° E, the NORTH group (associated with a stronger 500 hPa trough—Figure 13c) front has a latitudinal extent from approximately 27°–37° N (Figure 14b), while the GOOD group has a frontal extent from approximately 27°–34° N (Figure 14a). The differences between the two frontal bands for the 29 July initialization show a similar frontal orientation between the two groups that is generally more zonally elongated (Figure 14c,d). As such, it is again evident that when there is a deep trough at 500 hPa, the resultant front at 700 hPa is more southwest-northeast oriented.
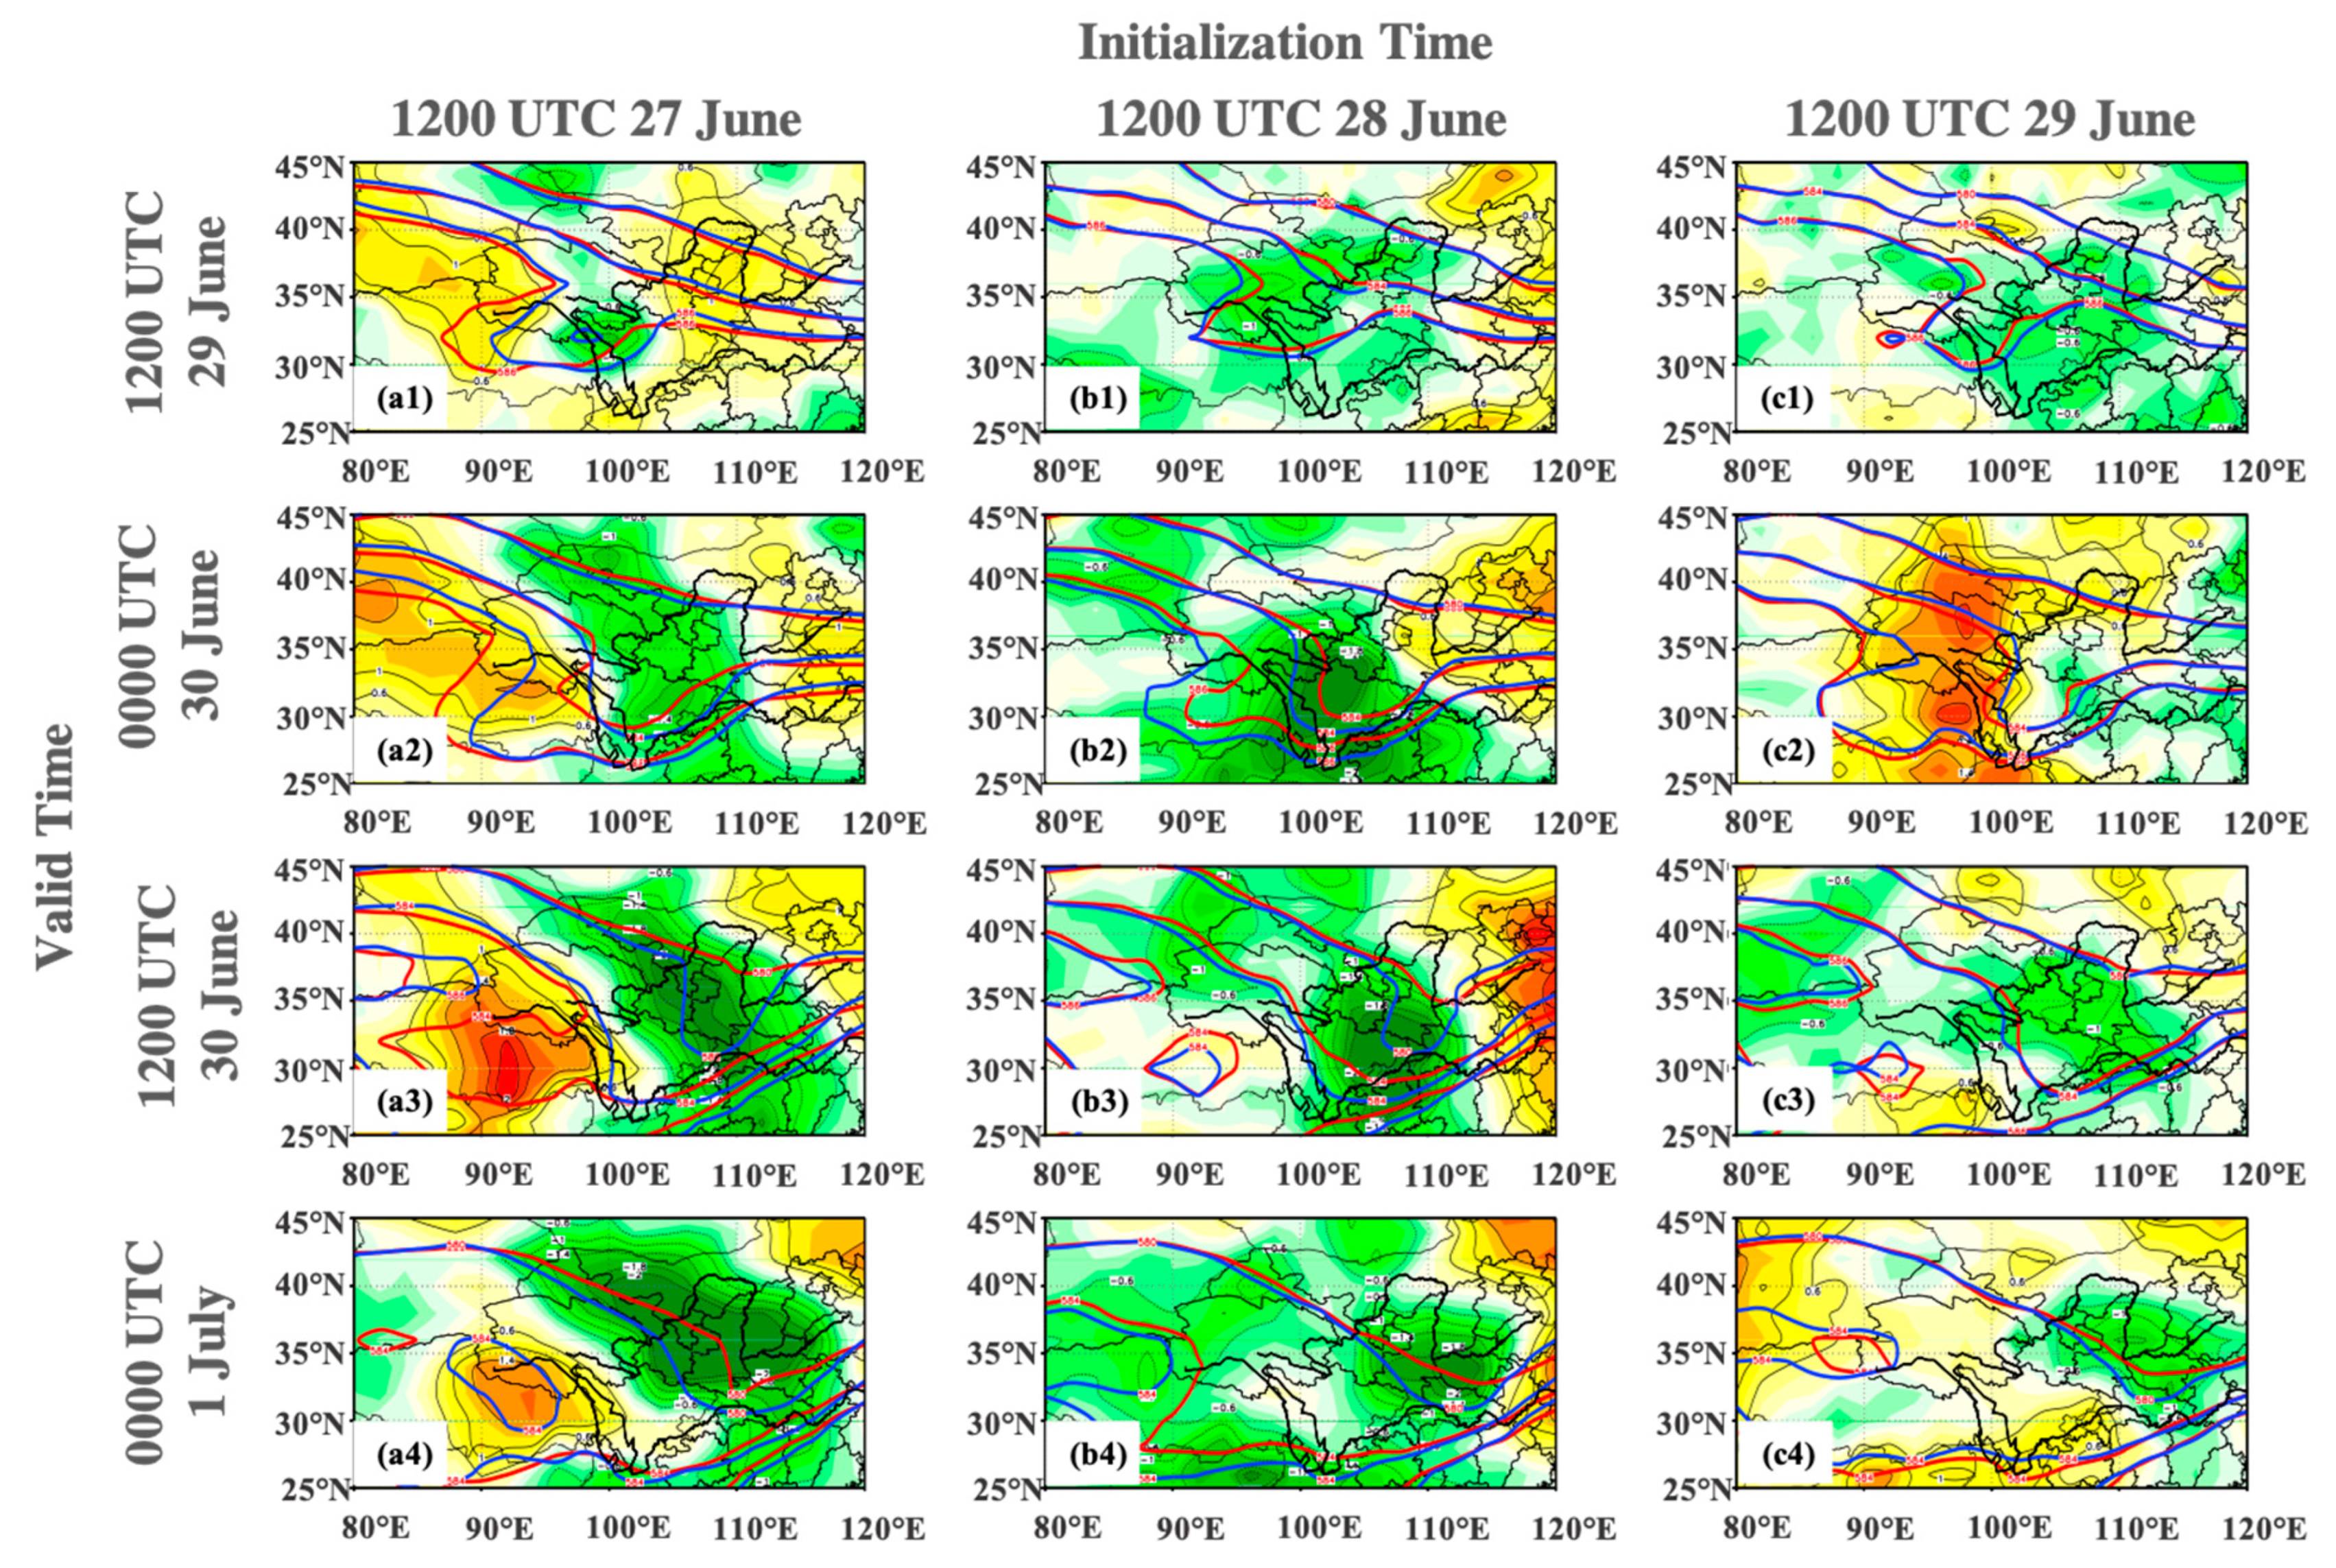
Though the above analysis has identified the importance of the 500-hPa trough in perturbing the Meiyu frontal rain band position during the latter half of the period of extreme precipitation (1–2 July), the question remains as to how 500-hPa forecast differences between the two subsets evolved through the duration of the event. To explore this, EPS runs initialized from 27, 28, and 29 June were analyzed for forecasts of the four consecutive periods: 1200 UTC 29 June, 0000 UTC 30 June, 1200 UTC 30 June, and 0000 UTC 1 July (Figure 15). Here, the red contours are the GOOD subset mean, the blue contours the NORTH subset mean, and the shading represents the differences in the 500-hPa geopotential height between the two groups.
The evolution of the model differences (Figure 15) indicate that the differences in the trough in the Meiyu front region (30°–40° N, 95°–105° E) propagate with the axis of the trough for all model initializations and forecast periods with the exception of the 0000 UTC 30 June forecast from the 29 June initialization (Figure 15c2). The collocation of the trough axis and the maximum difference between the forecasts indicate that the majority of the differences are likely associated with the strength of the trough rather than the location. Following the previously shown results, these differences in the intensity of the 500 hPa trough can result in a poleward shift in the rain belt position. Further differences could be due to a number of factors including changes to the 500-hPa geopotential heights in response to temperature advections and latent heat release. As such, we believe that the strength of the trough is the dominant source of forecast differences between the successful GOOD forecast subset and the unsuccessful NORTH subset with regards to the position and strength of the Meiyu front. This hypothesis would be of interest to test further in a future study.
4. Summary and Discussions
Using both the deterministic and ensemble (EPS) forecasts from the European Centre for Medium-Range Weather Forecasts (ECMWF), this study investigated sources of error for a heavy rainfall event from 30 June to 4 July 2016 in eastern China. This event, associated with the Meiyu front, resulted in rainfall in excess of 500 mm over 5 days near the Yangtze River valley. However, the ECMWF deterministic forecast along with the majority of the EPS members initialized for 27–29 June predicted heavy precipitation would occur near the Huaihe River valley, which is located north of the Yangtze River valley. Historically, this region is particularly prone to hazardous floods induced by heavy rainfall and inaccurate predictions of heavy rainfall events can have profound socio-economic impacts.
A new index was developed to identify the latitude of the zonal mean maximum accumulated precipitation between 110°–120° E. This index was utilized to further develop a new rain belt position index metric which was used to measure the accuracy of the ECMWF EPS members in predicting the Meiyu rain belt position. Analysis of the EPS shows a systematic poleward bias in the location of the heavy precipitation band, a bias that has been frequently discussed by forecasters at the CMA but has not been previously documented and diagnosed. This bias was shown to be well correlated with the magnitude of a 500-hPa trough present for much of the duration of the event.
Differences in the strength of the upper level trough between the most and least accurate EPS members are shown to influence a variety of lower-tropospheric processes, including but not limited to: (1) an enhanced lower tropospheric vortex along the Meiyu front; (2) an enhanced southerly low-level jet that increases the moisture flux convergence along the front; and (3) poleward displacements of the eastern flank of the Meiyu front as indicated through both the location of the maximum 850 hPa horizontal wind shear and the location of the maximum 700 hPa equivalent potential temperature gradient. We further found that that the 500-hPa geopotential height differences were the dominant mechanism in modulating the overall synoptic and mesoscale evolution and errors.
While the role of the localized 500-hPa trough was shown to be of importance, several outstanding questions still remain. For example, a secondary region of forecast difference located well to the north of the Meiyu front in association with a weak mid-latitude trough that may have influenced earlier forecasts for the period (27 and 28 June), while the 29 June forecast focused errors only within the region of the Meiyu front and the associated upper level trough. The phasing of such midlatitude systems with regions of robust subtropical moisture often can result in significant flooding events, and as such the source of this error should be further examined. Furthermore, an examination of the role of the terrain and latent heating in this region merits further examination.
Lastly, though this study presented the first documented case of this poleward bias in the EPS, the authors do recognize that this study is limited in that it represents a single case from the 2016 Meiyu rainfall season. However, forecasters at the CMA have noted the poleward bias discussed in this study for the Meiyu front with the newest version of the deterministic ECMWF and EPS [28] and the authors are presently documenting further cases. Similar errors have been noted by the CMA for the Global Ensemble Forecast System (GEFS), though this forecast system instead tends to be biased equatorward with the Meiyu front in similar scenarios. These apparent systematic differences indicate that there may be an interesting source of bias or error, perhaps associated with the upstream sampling over eastern China or differences in the convective parameterizations. As such, a more thorough examination of a series of such events across both forecasting systems should be performed to determine the extent of the forecasting challenges presented in this manuscript.
Author Contributions
Supervision, F.Z.; Analysis and Figures, J.M.; Writing, K.A.B., J.M., and F.Z.
Funding
This study was funded by the National Science and Technology Infrastructure Program of China (2015BAC03B04), US National Science Foundation grant 1712290 and also supported by scholarship provided by the Chinese Scholarship Council (CSC) awarded to J.M. for his visit to the ADAPT center of Penn State University.
Acknowledgments
This work is based on TIGGE data. TIGGE (The Interactive Grand Global Ensemble) is an initiative of the World Weather Research Programme (WWRP). We also thank the anonymous reviewers and Jianping Li for their constructive feedback that improved the manuscript.
Conflicts of Interest
The authors declare no conflict of interest.
References
- Ding, Y. Summer monsoon rainfalls in China. J. Met. Soc. Jpn. 1992, 70, 373–396. [Google Scholar] [CrossRef]
- Luo, Y.; Zhang, R.; Wan, Q.; Wang, B.; Wong, W.K.; Hu, Z.; Jou, B.J.-D.; Lin, Y.; Johnson, R.H.; Chang, C.-P.; et al. The Southern China Monsoon Rainfall Experiment (SCMREX). Bull. Am. Meteorol. Soc. 2017, 98, 999–1013. [Google Scholar] [CrossRef]
- Wang, W.Z.; Zhao, Z.C.; Gong, D.Y.; Zhou, T.J. Introduction of Climatology; China Meteorological Press: Beijing, China, 2005; p. 43. [Google Scholar]
- Lu, C.H.; Guan, Z.Y.; Cai, J.X. Interhemispheric atmospheric mass oscillation and its relation to interannual variations of the Asian monsoon in boreal summer. Sci. China Earth Sci. 2010, 53, 1343–1350. [Google Scholar] [CrossRef]
- Gentiloni, F.; Johansson, E.; Greenall, T.; Hoekstra, E.; Yi, X.H.; Xueron, L.; Huiyan, M.; Xiang, G.R.; Kamp, K. Final Report on 1998 Floods in the People’s Republic of China. Available online: https://reliefweb.int/report/china/final-report-1998-floods-peoples-republic-china (accessed on 25 October 2019).
- Sampe, T.; Xie, S.-P. Large-scale dynamics of the Meiyu–Baiu rainband: Environmental forcing by the westerly jet. J. Clim. 2010, 23, 113–134. [Google Scholar] [CrossRef]
- Chen, S.-J.; Kuo, Y.-H.; Wang, W.; Tao, Z.-Y.; Cui, B. A modeling case study of heavy rainstorms along the Mei-Yu front. Mon. Weather Rev. 1998, 126, 2330–2350. [Google Scholar] [CrossRef]
- Chang, C.-P. East Asian Monsoon; World Scientific: Singapore, Singapore, 2004; p. 564. [Google Scholar]
- Bei, N.; Zhang, F. Mesoscale predictability of the torrential rainfall along the mei-yu front of China. Quart. J. Roy. Meteorol. Soc. 2007, 133, 83–99. [Google Scholar] [CrossRef]
- Zhou, T.; Gong, D.; Li, J.; Li, B. Detecting and understanding the multi-decadal variability of the East Asian summer monsoon—Recent progress and state of affairs. Meteorol. Z. 2009, 18, 455–467. [Google Scholar] [CrossRef]
- Zhu, X.Y.; He, J.H.; Wu, Z.W. Meridional seesaw-like distribution of the Meiyu rainfall over the Changjiang-Huanghe River valley and characteristics in the anomalous climate years. Chin. Sci. Bull. 2007, 52, 2420–2428. [Google Scholar] [CrossRef]
- Zhou, T.; Yu, R.; Zhang, J.; Drange, H.; Cassou, C.; Deser, C.; Hodson, D.L.; Sanchez-Gomez, E.; Li, J.; Keenlyside, N.; et al. Why the Western Pacific Subtropical High Has Extended Westward since the Late 1970s. J. Clim. 2009, 22, 2199–2215. [Google Scholar] [CrossRef] [Green Version]
- Hua, L.; He, S.; Fan, K.; Wang, H. Relationship between the onset date of the Meiyu and the South Asian anticyclone in April and the related mechanisms. Clim. Dyn. 2019, 52, 209–226. [Google Scholar]
- Du, Y.; Zhang, Y.C.; Xie, Z.Q. Impacts of longitude location changes of East Asian westerly jet core on the precipitation distribution during Meiyu period in middle lower reaches of Yangtze River valley. Acta Meteorol. Sin. 2008, 66, 566–576. [Google Scholar]
- Zhang, L.; Qiao, Q.M.; Deng, B.; Zhang, X. Large-scale compositing analysis and model of the Meiyu (Bailu) front. Sci. Atmos. Sin. Spec. Issue 1986, 191–201. [Google Scholar]
- Bi, B. More torrential rain processes in South China and more thunder storms in North China—Review on weather of June 1998. Meteorol. Mon. 1998, 24, 58–63. (In Chinese) [Google Scholar]
- Keming, Y. Frequent torrential rain processes and more rainfall in most of State—Review of July 1998. Meteorol. Mon. 1998, 24, 58–61. (In Chinese) [Google Scholar]
- Fei, Y.; Fu, S.-M.; Zhao, S.-X.; Sun, S.J. Study on the Dynamic Characteristics of an Eastward-offshore Mesoscale Vortex along the Meiyu-Baiu Front. Atmos. Ocean. Sci. Lett. 2012, 5, 360–366. [Google Scholar] [CrossRef] [Green Version]
- Lamberson, W.S.; Torn, R.D.; Bosart, L.F.; Magnusson, L. Diagnosis of the source and evolution of medium-range forecast errors for extratropical cyclone Joachim. Weather Forecast. 2016, 31, 1197–1214. [Google Scholar] [CrossRef]
- Lee, S.M.; Nam, J.E.; Choi, H.W.; Ha, J.C.; Lee, Y.H.; Kang, K.S.; Cho, C.H. A study on the predictability of the transition day from the dry to the rainy season over South Korea. Theor. Appl. Climatol. 2016, 125, 449–467. [Google Scholar] [CrossRef]
- Torn, R.D.; Hakim, G.J. Ensemble-based sensitivity analysis. Mon. Weather Rev. 2008, 136, 663–677. [Google Scholar] [CrossRef]
- Enomoto, T.; Yamane, S.; Ohfuchi, W. Simple sensitivity analysis using ensemble forecasts. J. Meteorol. Soc. Jpn. 2015, 93, 199–213. [Google Scholar] [CrossRef]
- Bougeault, P.; Toth, Z.; Bishop, C.; Brown, B.; Burridge, D.; Chen, D.H.; Ebert, B.; Fuentes, M.; Hamill, T.M.; Mylne, K.; et al. The THORPEX Interactive Grand Global Ensemble. Bull. Am. Meteorol. Soc. 2010, 91, 1059–1072. [Google Scholar] [CrossRef]
- Swinbank, R.; Kyouda, M.; Buchanan, P.; Froude, L.; Hamill, T.M.; Hewson, T.D.; Keller, J.K.; Matsueda, M.; Methven, J.; Pappenberger, F.; et al. The TIGGE project and its achievements. Bull. Am. Meteorol. Soc. 2016, 97, 49–67. [Google Scholar] [CrossRef]
- Miller, M.; Buizza, R.; Haseler, J.; Janssen, P.; Untch, A. Increased resolution in the ECMWF deterministic and ensemble prediction systems. ECMWF Newsl. 2010, 124, 10–16. [Google Scholar]
- Chen, D.T.; Ou, T.; Gon, L.; Xu, C.Y.; Li, W.; Ho, C.-H.; Qian, W. Spatial interpolation of daily precipitation in China: 1951–2005. Adv. Atmos. Sci. 2010, 27, 1221–1232. [Google Scholar] [CrossRef]
- Wilkes, D. Statistical Methods in the Atmospheric Sciences, 3rd ed.; Academic Press: Oxford, UK, 2011; p. 704. [Google Scholar]
- Zhou, N.-F.; Ma, J.; Liu, C.-H. Analysis of mid-range forecast bias by ECMWF on precipitation features and related large-scale circulation during 2016 Meiyu season. J. Trop. Meteorol. 2018, 34, 499–506. [Google Scholar]
Figure 1.
Spatial distributions of the observed 24-h accumulated precipitation (mm) in central eastern China valid starting at 0000 UTC on (a) 30 June, (b) 1 July, (c) 2 July, (d) 3 July, and (e) 4 July 2016. The observed precipitation is obtained from the daily rain gauge data interpolated to a 0.5° × 0.5° gridded domain. Thin black contours denote political boundaries and thick blue lines denote the Huanghe and Yangtze Rivers to the north and south, respectively. The location of Bengbu city represents the Huaihe River here.

Figure 2.
Observed event total accumulated precipitation for 0000 UTC 30 June–0000 UTC 5 July 2016. (a) Observed total accumulated precipitation from the daily rain gauge data interpolated to a 0.5° × 0.5° gridded domain. (b) Zonal mean (110°–120° E) of the observed 120-h accumulated precipitation (mm), maximizing at the identified zonal mean maximum accumulated precipitation (ZMCP) of 31.5° N. Thin black contours denote political boundaries and thick black lines denote the Huanghe and Yangtze Rivers to the north and south, respectively.

Figure 3.
European Centre for Medium-Range Forecasts (ECMWF) 0000-h forecast valid at (a) 1200 UTC 29 June, (b) 1200 UTC 30 June, (c) 1200 UTC 1 July, (d) 1200 UTC 2 July, (e) 1200 UTC 3 July, and (f) 1200 UTC 4 July, 2016. Plotted are the 500 hPa geopotential heights (decameters, medium black contour, 4 dam contour interval) and the 850 hPa wind vectors (knots, blue barbs, typical meteorological conventions). The Meiyu front is objectively identified as the area of maximized horizontal shear at 850 hPa (green dashed lines). Objectively identified embedded closed mesoscale vortices along the front are denoted with a ‘V’, and the 588 dam contour is denoted by the thick red contour. Thin black contours denote political boundaries and thick blue lines denote the Huanghe and Yangtze Rivers to the north and south, respectively.

Figure 4.
The observed ZMCP (station data, black line) and the 96-h, 168-h, and 216-h deterministic ECMWF forecasted ZMCP of the Meiyu rain band (blue, green, and red lines, respectively) for the Meiyu precipitation season from 18 June to 16 July 2016. The thick dashed black line represents the starting (0000 UTC 30 June 2016) and ending point (0000 UTC 5 July 2016) of the period of interest for the study.

Figure 5.
The event-total observed and the forecasted accumulated precipitation (mm) over the 5-day (120-h) period from 0000 UTC 30 June to 0000 UTC 5 July 2016. (a) Observed accumulated precipitation from daily rain gauge data in China which was interpolated to a 0.5° × 0.5° gridded domain. (b–d) ECMWF deterministic forecast 120-h forecasted accumulated precipitation initialized at 1200 UTC on 29, 28, and 27 June 2016, respectively. Thin black lines denote political boundaries and thick black lines denote the Huanghe and Yangtze Rivers to the north and south, respectively.

Figure 6.
The zonal mean (110°–120° E) forecasted precipitation totals (mm) for the period of 0000 UTC 30 June to 0000 UTC 5 July 2016 from consecutive runs of the ECMWF deterministic forecast initialized from 1200 UTC 24 to 1200 UTC 29 June 2016. Observed zonal mean precipitation values for the event are shown on the right-most tick mark of the time axis. The dashed white line represents the zonal mean maximum accumulated precipitation (ZMCP).

Figure 7.
The ZMCP of the event total (120-h) accumulated precipitation for the observed total accumulated precipitation from daily rain gauge data interpolated to a 0.5° × 0.5° gridded domain (black line) and each Ensemble Prediction System (EPS) member (red triangles) from the ECMWF ensemble initialized at 1200 UTC 29 June 2016. (a) The forecasted ZMCP latitude for each EPS member and observed ZMCP. (b) ZMCP standardized anomaly for each forecasted EPS member, re-ordered by the magnitude of the anomaly from the observed mean rain belt position. The standardized anomaly represents the standard deviation of each ensemble member rain belt position index (RBI) from the observed RBI, standardized by the ensemble mean.

Figure 8.
Time evolution of the ZMCP and the RBI forecast for the ECMWF EPS. (a) Forecasted event ZMCP for individual EPS members (colored points) and (b) statistical distribution of forecasted event ZMCP for consecutive daily EPS runs initialized 1200 UTC 24 June to 29 June 2016. Observed event ZMCP is represented by the black dashed line in panel (a). Red line in panel (b) is the EPS median ZMCP, edges of the boxes represent the 25th and 75th quartiles, whisker edges represent the 5th and 95th quartiles, and blue points represent outliers. (c) Daily variability of the RBI forecasted by the five member GOOD subgroup (‘G’, blue solid line), the five member NORTH subgroup (‘N’, red dashed line) and the 51-member ensemble (‘E’, black line) from the ECMWF EPS initialized at 1200 UTC 29 June 2016 for each day during 30 June to 4 July 2016.

Figure 9.
Composite 24-h accumulated precipitation forecasts valid at 0000 UTC 1 July for (a,c) the GOOD subset and (b,d) the NORTH subsets selected from the ECMWF EPS initialized at 1200 UTC 28 (a,b) and 29 (c,d) June 2016. Thin black contours denote political boundaries and thick blue lines denote the Huanghe and Yangtze Rivers to the north and south, respectively.

Figure 10.
ECMWF EPS subgroup composite mean fields for 0000 UTC 1 July from the forecast initialized at 1200 UTC 28 June 2016. Plotted are the composite 850-hPa vector wind (knots, barbs, typical meteorological convention) of (a) the GOOD subset and (b) the NORTH subset along with the vector difference between the two fields (knots, colored, panel b, NORTH-GOOD). Also plotted are the composite 500-hPa geopotential heights for the GOOD and NORTH subsets (solid and dashed blue, respectively). The Meiyu Front is objectively identified as the area of maximized horizontal shear at 850 hPa (black dashed lines) for each subset. Thin red contours denote political boundaries and thick black lines denote the Huanghe and Yangtze Rivers to the north and south, respectively.

Figure 11.
Normalized difference (difference between NORTH and GOOD composite means divided by EPS 51-member ensemble spread) for (a) meridional wind (b) geopotential heights between the NORTH subset and the GOOD subset valid at 0000 UTC 1 July (contoured blue, dashed negative, red contour labels). The wind vector (knots, black barbs, typical meteorological convention) of the GOOD subset are shown in (a) and the NORTH subset in (b). The ensemble forecast is initialized at 1200 UTC 28 June 2016.

Figure 12.
700-hPa relative humidity (%, colored) and wind vectors (knots, black barbs, typical meteorological convention) for (a) the GOOD subset and (b) the NORTH subset, and (c) the normalized difference of relative humidity (colored) between the two subsets along with the NORTH subset 500 hPa geopotential heights (dam, blue dashed). Panels are valid at 0000 UTC 1 July, derived from the ECMWF EPS initialized at 1200 UTC 28 June 2016. Thin black contours denote political boundaries and thick black lines denote the Huanghe and Yangtze Rivers to the north and south, respectively.

Figure 13.
The ensemble-derived correlation coefficients between the forecasted RBI and the 500-hPa geopotential height (colored) along with the geopotential height difference between the NORTH subset and the GOOD subset (meters, blue contours (dashed negative), 10 m contour interval) valid at 0000 UTC of (a,c,e) 1 July and (b,d,f) 2 July for ensembles initialized at 1200 UTC 27 June (a,b), 28 June (c,d), and 29 June (e,f) 2016, respectively. Thin black contours denote political boundaries and thick black lines denote the Huanghe and Yangtze Rivers to the north and south, respectively.

Figure 14.
The 700-hPa forecasted pseudo-equivalent potential temperature (K, thin black contour, 2 K contour interval) valid at 0000 UTC 1 July for (a) and (c) the GOOD subsets, and (b) and (d) the NORTH subsets selected from the ECMWF operational ensemble initialized at 1200 UTC 28 and 29 June 2016, respectively. Thick blue contour identifies the 342 K pseudo-equivalent potential temperature isotherm. Thin black lines denote political boundaries and thick black lines denote the Huanghe and Yangtze Rivers to the north and south, respectively.

Figure 15.
Evolution of the 500-hPa geopotential heights from the GOOD subset (thick red contours) and the NORTH subset (thick blue) along with the normalized difference between the two (colored, NORTH-GOOD) valid at 1200 UTC 29 June (a1,b1,c1), 0000 UTC 30 June (a2,b2,c2), 1200 UTC 30 June (a3,b3,c3) and 0000 UTC 1 July (a4,b4,c4) for ensembles initialized at 1200 UTC 27 June (a1,a2,a3,a4), 1200 UTC 28 June (b1,b2,b3,b4), and 1200 UTC 29 June (c1,c2,c3,c4) 2016, respectively. Thin black contours denote political boundaries and thick black lines denote the Huanghe and Yangtze Rivers to the north and south, respectively.

© 2019 by the authors. Licensee MDPI, Basel, Switzerland. This article is an open access article distributed under the terms and conditions of the Creative Commons Attribution (CC BY) license (http://creativecommons.org/licenses/by/4.0/).
Share and Cite
MDPI and ACS Style
Ma, J.; Bowley, K.A.; Zhang, F. Evaluating the Forecast Performance of the Meiyu Front Rainbelt Position: A Case Study of the 30 June to 4 July 2016 Extreme Rainfall Event. Atmosphere 2019, 10, 648. https://doi.org/10.3390/atmos10110648
AMA Style
Ma J, Bowley KA, Zhang F. Evaluating the Forecast Performance of the Meiyu Front Rainbelt Position: A Case Study of the 30 June to 4 July 2016 Extreme Rainfall Event. Atmosphere. 2019; 10(11):648. https://doi.org/10.3390/atmos10110648
Chicago/Turabian StyleMa, Jie, Kevin A. Bowley, and Fuqing Zhang. 2019. "Evaluating the Forecast Performance of the Meiyu Front Rainbelt Position: A Case Study of the 30 June to 4 July 2016 Extreme Rainfall Event" Atmosphere 10, no. 11: 648. https://doi.org/10.3390/atmos10110648
Note that from the first issue of 2016, this journal uses article numbers instead of page numbers. See further details here.