Article

Mapping Selected Emergent Marine Toxin-Producing Organisms Using Historical Samples with Two Methods (Biosensors and Real-Time PCR): A Comparison of Resolution

1
EcoToxilab, Calle Juan XXIII, 10 Tielmes, 28550 Madrid, Spain
2
Marine Biological Association, Citadel Hill, Plymouth PL1 2PB, UK
3
School of Natural and Environmental Sciences, Newcastle University, Newcastle upon Tyne NE1 7RU, UK
4
School of Biological and Marine Science, University of Plymouth, Drake Circus, Plymouth PL4 8AA, UK
*
Author to whom correspondence should be addressed.
Appl. Microbiol. 2024, 4(1), 312-328; https://doi.org/10.3390/applmicrobiol4010021
Submission received: 22 November 2023 / Revised: 15 January 2024 / Accepted: 17 January 2024 / Published: 30 January 2024

Abstract

:
The Continuous Plankton Recorder (CPR) survey is a valuable resource for mapping changes in plankton distribution and understanding harmful algal ecology because of its breadth and longevity. Preservation methods with formalin degrade DNA, making it difficult to use as a molecular tool for archived marine samples. DNA was extracted from CPR samples immediately after collection, seven months later and after nine years of storage from a cruise track along the Iberian Peninsula. PCR reactions performed from the nine-year timepoint were hybridized to probes in an electrochemical biosensor and compared to results obtained from RT-PCR performed at two earlier time points. The successful identification of Pseudo-nitzschia spp., Prorocentrum lima, Alexandrium minutum, Alexandrium ostenfeldii, Gambierdiscus spp. and Coolia spp. was documented. The biosensor analysis outperformed RT-PCR, allowing us to document certain tropical toxic dinoflagellates, viz., Gambierdiscus and Coolia, that produce human ciguatoxins and Coolia toxins, respectively. These non-native algal toxins can accumulate, pervade the food web and negatively impact human food security. This supports the northerly movement of microalgae with climate change in offshore Iberian peninsular waters. This study highlights biosensors as a cost-effective tool for the offshore monitoring of HAB species and advances molecular technologies for long-term CPR datasets that have limited records of harmful algae. DNA from formalin-preserved CPR samples is degraded, so the use of a short, multiprobe biosensor can augment historical plankton records with contemporary methods that also capture infrequently occurring benthic taxa carried in surface waters. The integration of probe-based biosensor technologies offers a promising avenue for exploring plankton dynamics in response to environmental changes.

1. Introduction

The Continuous Plankton Recorder Survey houses the longest running time series collection in the world, going back to 1931. It is located at the MBA as an independent research foundation and is the most spatially extensive plankton survey programme, recording approximately 500 taxonomic entities via microscopy, surveying over 7 million miles of ocean [1,2]. Samples and taxonomic data are available at the MBA. Its data are distributed within global biological databases, OBIS and EMODNET. Additional sister surveys operate in the Southern Ocean and the Coral Sea, and they span the North Pacific from Canada to Japan and now into the Arctic Ocean, which expands the coverage of open-ocean plankton taxonomic information [3]. CPR samples collect around 3 m3 of water that is filtered onto ca. 10 nm of a continuous roll of silk mesh immediately preserved in formalin to a final 4% concentration covering mostly open-ocean regions [2]. Larger plankton (>50 microns) are most effectively captured with a mesh pore size of 270 µm, but plankton as small as bacteria are also captured as the mesh is clogged with larger forms, allowing a wide variety of organisms to be trapped and investigated. These samples are a vast resource to map past and current changes in plankton distribution under climate-relevant scales and understand drivers shaping harmful algae ecology [4]. The formalin preserves morphological features for taxonomic identification, creating the largest long-term database of plankton, but this also degrades DNA and creates cross-linkages impairing PCR amplification efficiency [5]. Long-term storage negatively impacts DNA quality even with the gold standard preservative, ethanol [6]. However, specialised DNA extraction methods have been developed to remove cross-linkages, and targeting small sections of DNA have allowed for the identification of plankton taxa [7,8] including the high-throughput sequence identification of Pseudo-nitzschia [9] and Vibrio bacteria [10] even using metagenomics [1]. Harmful algae are routinely speciated for Dinophysis, Tripos and Prorocentrum species; Noctiluca scintillans; two morphotypes (large and small cell sizes) of Pseudo-nitzschia spp.; and two Phaeocystis forms (=species) [11]. Softer or small cells are difficult or impossible to identify routinely. CPR samples have been stored in buffered formalin in cool, dark conditions since 1960 to minimize damage, with DNA integrity being best in the first few months, but formalin eventually form cross-links, and the DNA disintegrates into 200 bp fragments, making the PCR amplification of larger fragments challenging [5]. Nevertheless, specialized DNA extraction methods and PCR strategies adapted to target smaller genomic regions have been developed to detect plankton species, including Pseudo-nitzschia spp. [8,9,12] as well as other plankton species, as reviewed by Vezzulli et al. [1,13]. Nevertheless, challenges remain in DNA detection from formalin damage because the cross-linkages reduce available oligonucleotide or enzymic binding sites for downstream detection. eDNA survey sequencing only produces limited taxonomic information from large subunit or small subunit ribosomal rDNAs (LSU, SSU, respectively) and takes relatively longer than species-specific assays. Probe-based strategies offer the most effective and time-efficient solution to interrogate CPR samples as compared to examining the oldest archival sample.
The purpose of our investigation was to apply probe and biosensor technology to PCR products amplified from the CPR samples nine years after collection and to compare the resolution found with this method to an earlier study using RT-PCR on the same cruise track extracted at two different, earlier time points.

2. Materials and Methods

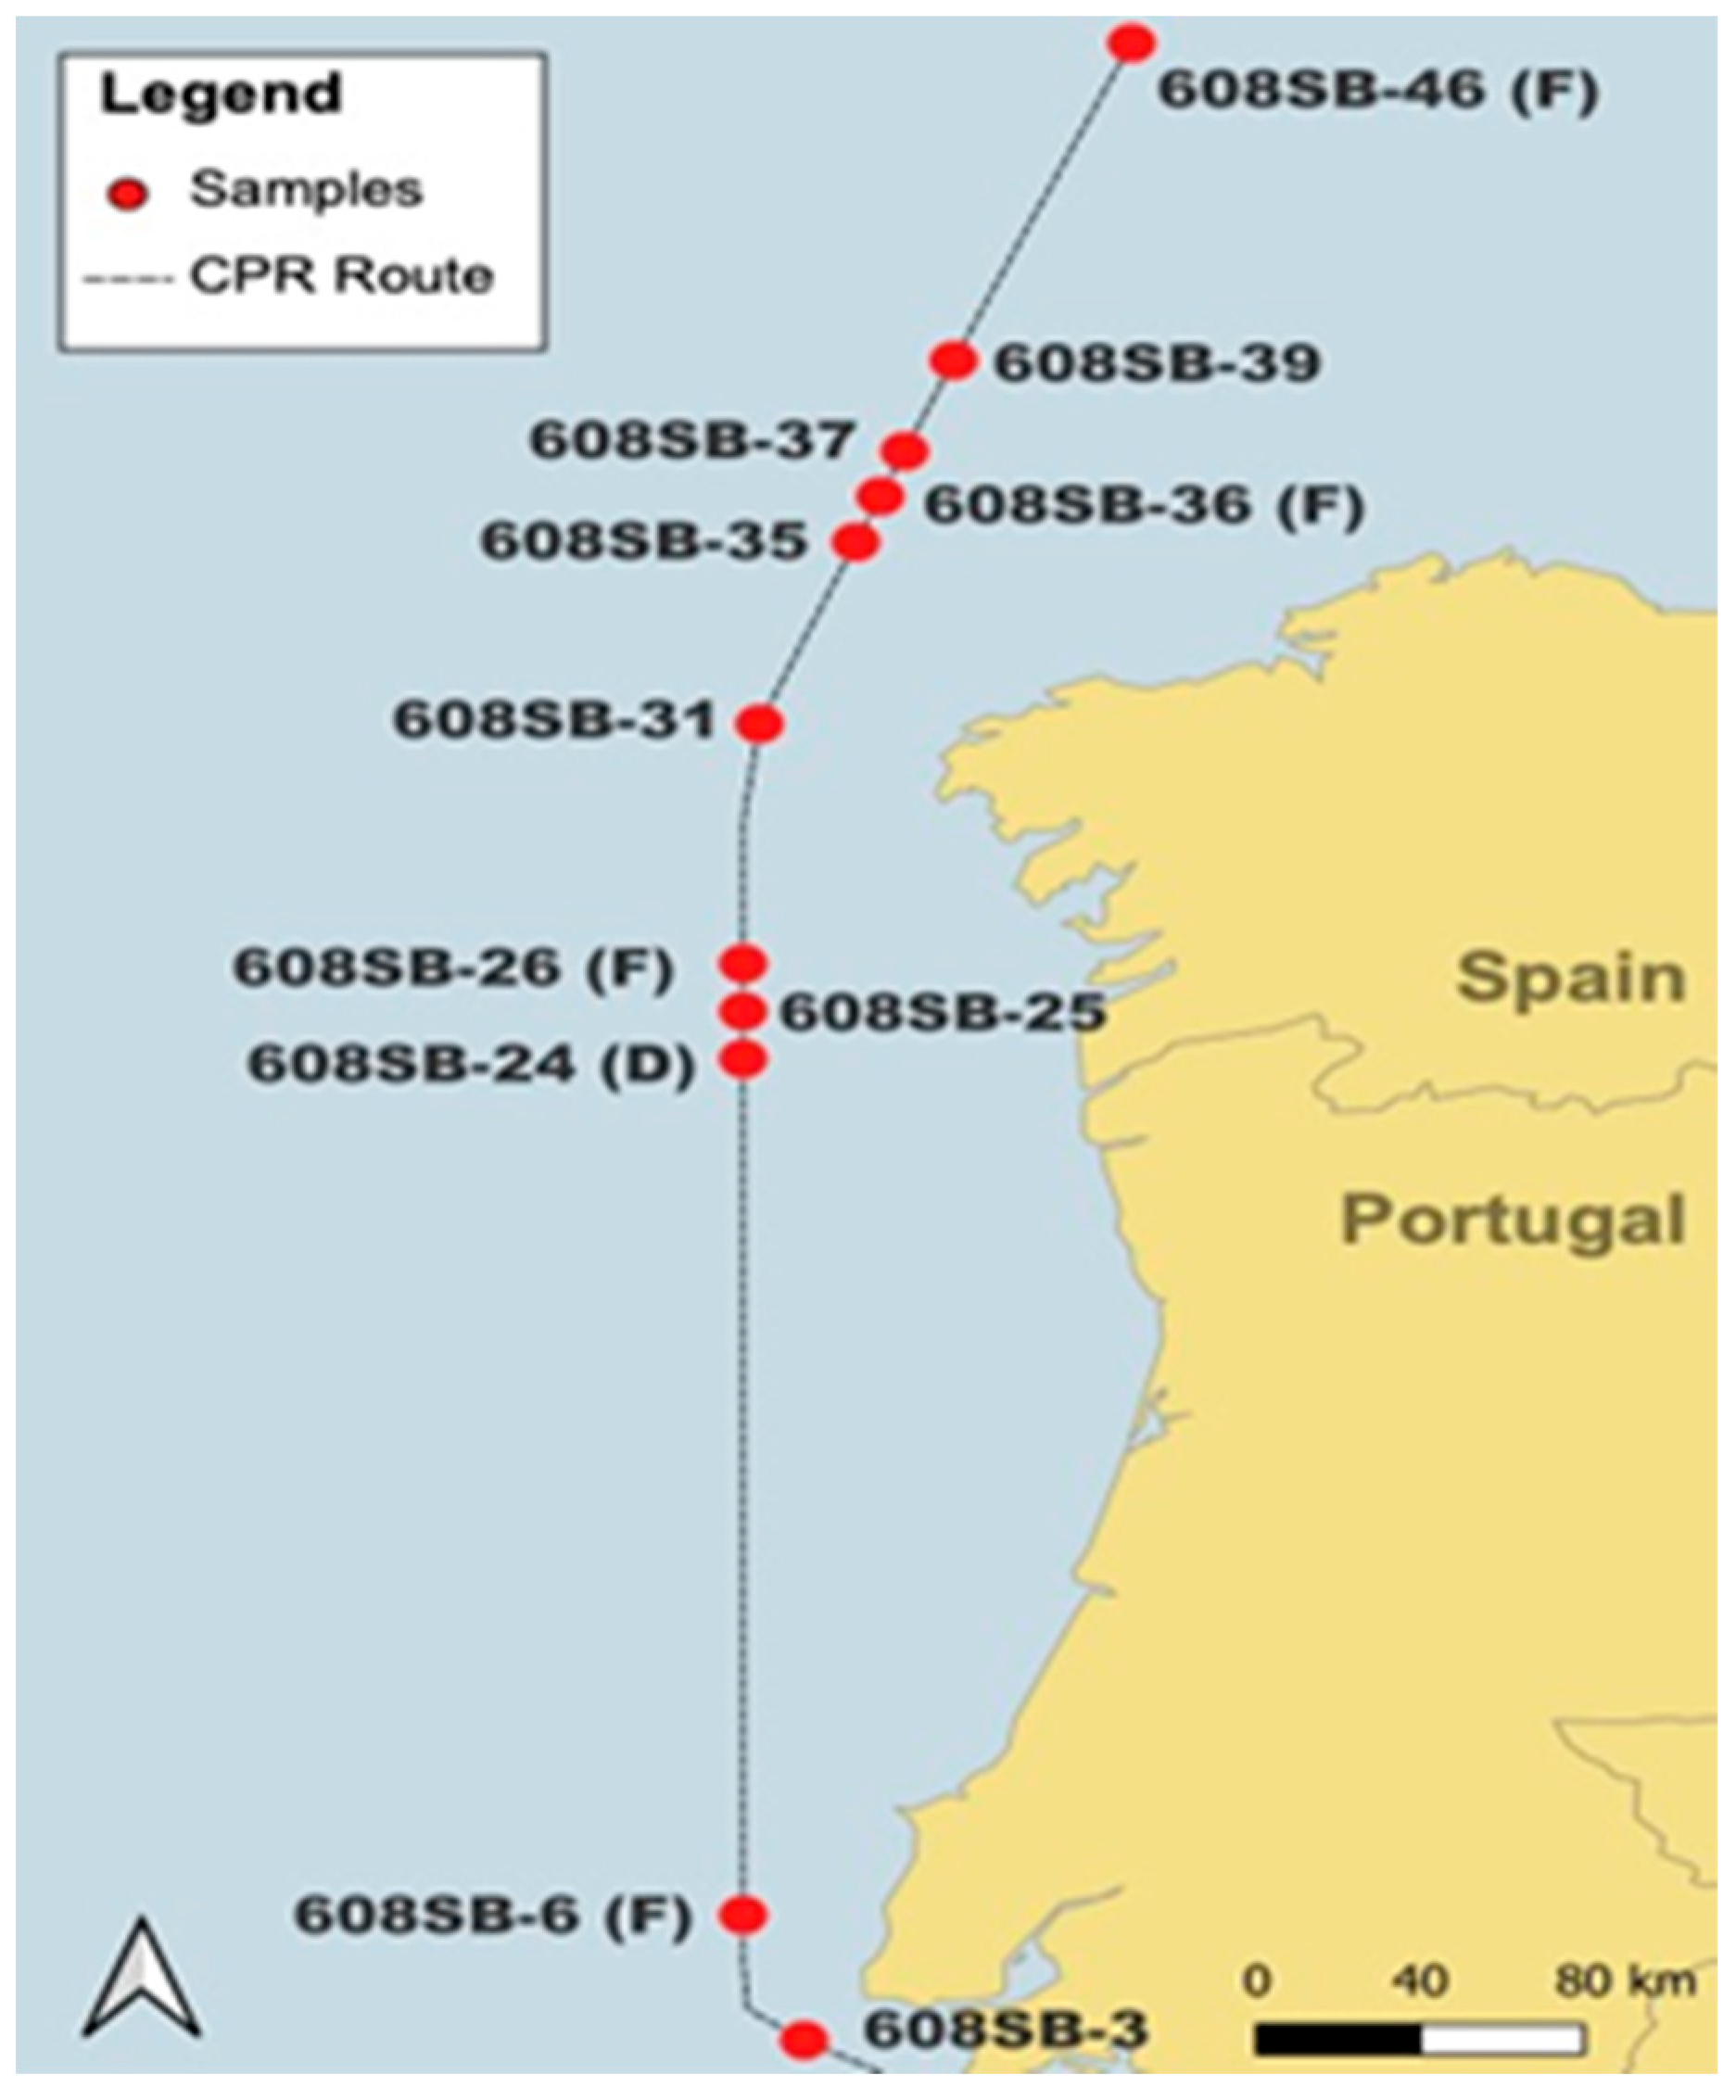
2.1. Sample Collection

Plankton was collected on a CPR device containing two silk meshes of a 270 µm pore size that are sandwiched together, collected on a rotating spool and preserved in a final concentration of 4% formalin. The CPR device was towed between 4 and 10 m depths in May 2014 from the SB route via the CPR survey behind a ship of opportunity (Figure 1). Associated microscopic CPR data are available at https://doi.org/10.17031/6401f86057b61 (accessed on 14 January 2024). Plankton collection on a CPR device is described in detail in [2]. Silks were cut into strips representing 10 nautical miles, wrapped in plastic film and preserved in either 2% buffered formalin (D) or standard 4% buffered formalin (F), the latter being the default storage solution. Samples were kept in the dark at ambient temperature.

2.2. Extraction of DNA from CPR Samples

Extractions were performed as described in [14] with CPR samples presented in Table 1. These samples were tested in 2015 for Pseudo-nitzschia delicatissima (see Section 2.4). DNA extractions were performed immediately (within 2 weeks of collection), after 7 months of storage and after 9 years of storage (see below). All steps were performed at room temperature unless otherwise stated. Plankton washing was performed in 25 mL of TE buffer with agitation for 12 h. The supernatant was transferred to a fresh tube and centrifuged at 4000 rpm for 20 min. After removing the TE buffer, the pellet was resuspended in a 1 mL TE buffer, 0.2% SDS and 0.125 μM proteinase K and incubated for further 12 h at 55 °C with agitation. A second addition of 0.2% SDS and 0.25 μM proteinase K was performed with incubation at 55 °C for further 12 h. Samples were split in half as technical duplicates and extracted using equal volumes of phenol:chloroform solution (Sigma, Gillingham, UK). Samples were mixed by inversion and centrifuged at 5000 rpm for 10 min. The aqueous phase was removed and re-extracted with 25:24:1 phenol:chloroform:isoamyl alcohol solution (Sigma, Gillingham, UK) to remove residual phenol, repeating the mixing and centrifugation step, this time at 10,000 rpm for 10 min. The final aqueous phase was removed. Proteins were precipitated by adding an equal volume of 7.5 M ammonium acetate (Sigma, Gillingham, UK) to a final concentration of 2.5 M at room temperature for 30 min, followed by centrifugation at 10,000 rpm for 10 min and removal of the supernatant. Two and a half volumes of 100% ethanol were added to precipitate nucleic acids at −20 °C for 12 h and then centrifuged for 30 min at 13,000 rpm in a microcentrifuge. The pellet was washed in 80% ice-cold ethanol and centrifuged at 13,000 rpm for 5 min twice before drying the pellet and resuspending in 30 µL sterile TE buffer. DNA was stored at −20 °C.
The nine further DNA extractions, performed at 9-year time points (Table 1), used a similar protocol to those above but with amendments as detailed below, again at room temperature unless stated otherwise. The plankton washing stage was performed in 50 mL of TE buffer instead of 25 mL for 12 h. The cell lysis step differed with an additional incubation with 50 µL of 10 mg/mL lysozyme (Sigma, Gillingham, UK) for 10–15 min at RT. Cell lysis and DNA extraction were performed as follows. Cell lysis solution was 1 mL of freshly prepared, filter-sterilized CTAB (hexadecyltrimethylammonium bromide) with freshly prepared 2% ß-mercaptoethanol (Sigma, Gillingham, UK) and 1 µg/µL proteinase K (Sigma, Gillingham, UK) instead of TE base buffer. Incubation steps were shorter at 56 °C with agitation for 8 h, instead of 48 h. An additional sample-heating step was performed at 95 °C for 30 min to remove cross-linkages, and then centrifugation was performed for 10 min at 4000 rpm to pellet any precipitates that might inhibit downstream analyses. Duplicate cell lysates were only extracted with an equal volume of 24:1 chloroform:isoamylalcohol solution (Sigma), excluding the phenol:chloroform step. Tubes were inverted for 1 min then centrifuged for 10 min at 10,000, RT. The aqueous layer was transferred into fresh tubes, and an additional RNA removal stage was performed, with the addition 2 µL of 5 µg/µL RNaseA to the DNA solution, with incubation for 30 min at 37 °C.
After the ammonium acetate protein precipitation step (the same as above), DNA precipitation was performed by adding 2 M sodium acetate to a final concentration of 0.3 M with two volumes of 100% ice-cold ethanol for at least 1 h at −20 °C. DNA was centrifuged for half the time at 15,000 rpm for 15 min, and the two 70% ethanol washes were performed at 15,000 rpm instead of 13,000 rpm. DNA pellets were dried and resuspended in a larger volume of 50 µL of sterile TE buffer and stored at −20 °C.

2.3. PCR Reactions

To augment rDNA content, PCRs were performed with REDTaq® ReadyMix™ PCR Reaction Mix in 25 µL volume with 0.35 µM of primers, according to the manufacturer’s instructions and a 2 µL genomic DNA template. Primers used are listed in Table 2; both LSU and SSU amplifications were attempted, but only the LSU primers were successful and are listed below. Thermocycling conditions were as described in Round 1-PCR (see below). Often, second-round reactions were necessary, and we used 1 µL of the first-round reaction template (unpurified) for the second-round PCRs. Where we used the same primers as in the first round, Round-1 PCR thermocycling conditions were repeated. When the second round used different primers (nested PCR), Round-2 PCR thermocycling conditions were used. The PCR products were not purified but used directly in the hybridization with the probes after denaturation (Table 2).
Round 1-PCR: Conditions for denaturation, annealing, extension: 94 °C, 5 min, followed by 35 cycles (94 °C for 1 min, 54 °C for 2 min, 72 °C for 3 min), followed by 72 °C for 10 min.
Round 2 PCR: (semi-nested PCR)—Conditions for denaturation, annealing, extension: 94 °C, 5 min, followed by 35 cycles (94 °C for 30 sec min, 62 °C for 1 min, 72 °C for 90 s), followed by 72 °C for 10 min.

2.4. Probe Hybridization

The hybridization protocol for electrochemical detection was performed by assembling capture probes for each species to be tested by hybridization to PCR products from selected CPR samples. Probes were synthesized as described in Medlin et al. [19]. Five μL of magnetic beads (Strep-MBs, 2.8 μm Ø, 10 mg mL−1, Dynabeads M-280 Streptavidin, 11206D, from Dynal Biotech ASA, Oslo, Norway) were added to 50 μL of B&W buffer (10 mM Tris–HCl solution containing 1 mM EDTA and 2 M NaCl) in each Eppendorf tube. We placed the tubes in a magnetic rack for 2′, removing the B&W buffer and repeating this step once by flicking the tubes several times to resuspend beads before placing them back in the magnetic rack for 2′, with the lid open before removing all of the liquid.
We prepared 0.1 mM stock of the capture probe in the B&W buffer with 1 μL of 100 μM stock and 999 μL B&W buffer and added 25 μL of probe solution to tubes with MBs, incubating them at 37 °C 60′ and then washing them twice with PBS buffer, allowing each wash to stay in the magnetic rack for 2′ before removing the liquid. They were then resuspended in 25 μL BB buffer (PBS solution containing 1% w/v of purified casein, Thermo Scientific, Swindon, UK), removing all of the liquid in the last rinse.
Table 3 shows the samples colour coded relative to the length of the amplified PCR products obtained from those samples. Table 4 shows the position of each probe in the full-length LSU region. It should be noted that if the probe position is before position 378 in the LSU it will not be present and available for hybridisation in the shorter PCR products that were obtained from those stations highlighted in blue in Table 3.
PCR products from all CPR samples tested are shown in Supplemental Table S1 and Supplemental Figure S1. The positive reactions belonged to the SWS 608 cruise series (Table 3). These PCR products were denatured at 95 °C for 5′ and held at 60 °C until needed. One μL of each denatured CPR PCR product was added to the resuspended magnetic beads with the immobilized probe. This mixture was heated at 55 °C for 30′ with agitation and then rinsed with PBS on the magnetic rack twice at 2′ incubation per rinse.
An RNA/DNA antibody (AbRNA/DNA, clone: D5H6, from Covalab, Bron, France) was prepared with 200 μL AB RNA/DNA (2 μg/μL) + 200 μL HRP Poly A (1/50 Dilution) (ProtA-poly-HRP40, Antibodies-Online, Aachen, Germany). Each tube with the hybridized PCR product/probe received 25 μL AB/PolyA mixture and was incubated at 37 °C for 30′ with agitation, and then rinsed twice with PBS buffer for 2′ on the magnetic rack. All beads were resuspended in 25 μL of PBS. Hydroquinone (HQ, Sigma, UK) was prepared with 1.1 mg/rxn = 11 mg in 1 mL PBS buffer and kept in the dark until used. We prepared H2O2; 51 μL in 5 mL PBS buffer.
For measurements using the amperometer, we inserted a new carbon single-electrode chip into the SENSIT-SMART potentiostat from PalmSens (Houten, The Netherlands). We pipetted each probe/AB/PolyA/MB construct in solution onto one working carbon electrode chip (Dropsens (DRP-110, from Methrom-DropSens, Birmingham, UK)) and added 25 μL HQ as a mediator to facilitate the reduction reaction. We applied a current of −0.2 V, and when the reading of the electrode was stable, we added 25 μL H2O2, recording the reading in μAMPs (see Figure 2 [16]). The blank was subtracted from each signal to obtain a normalised signal that, if greater than the blank, was considered to be a positive signal for the probe/species tested. The positive control for each probe (ca. 1000 pM RNA) and the signal of the blank were different for each probe tested.

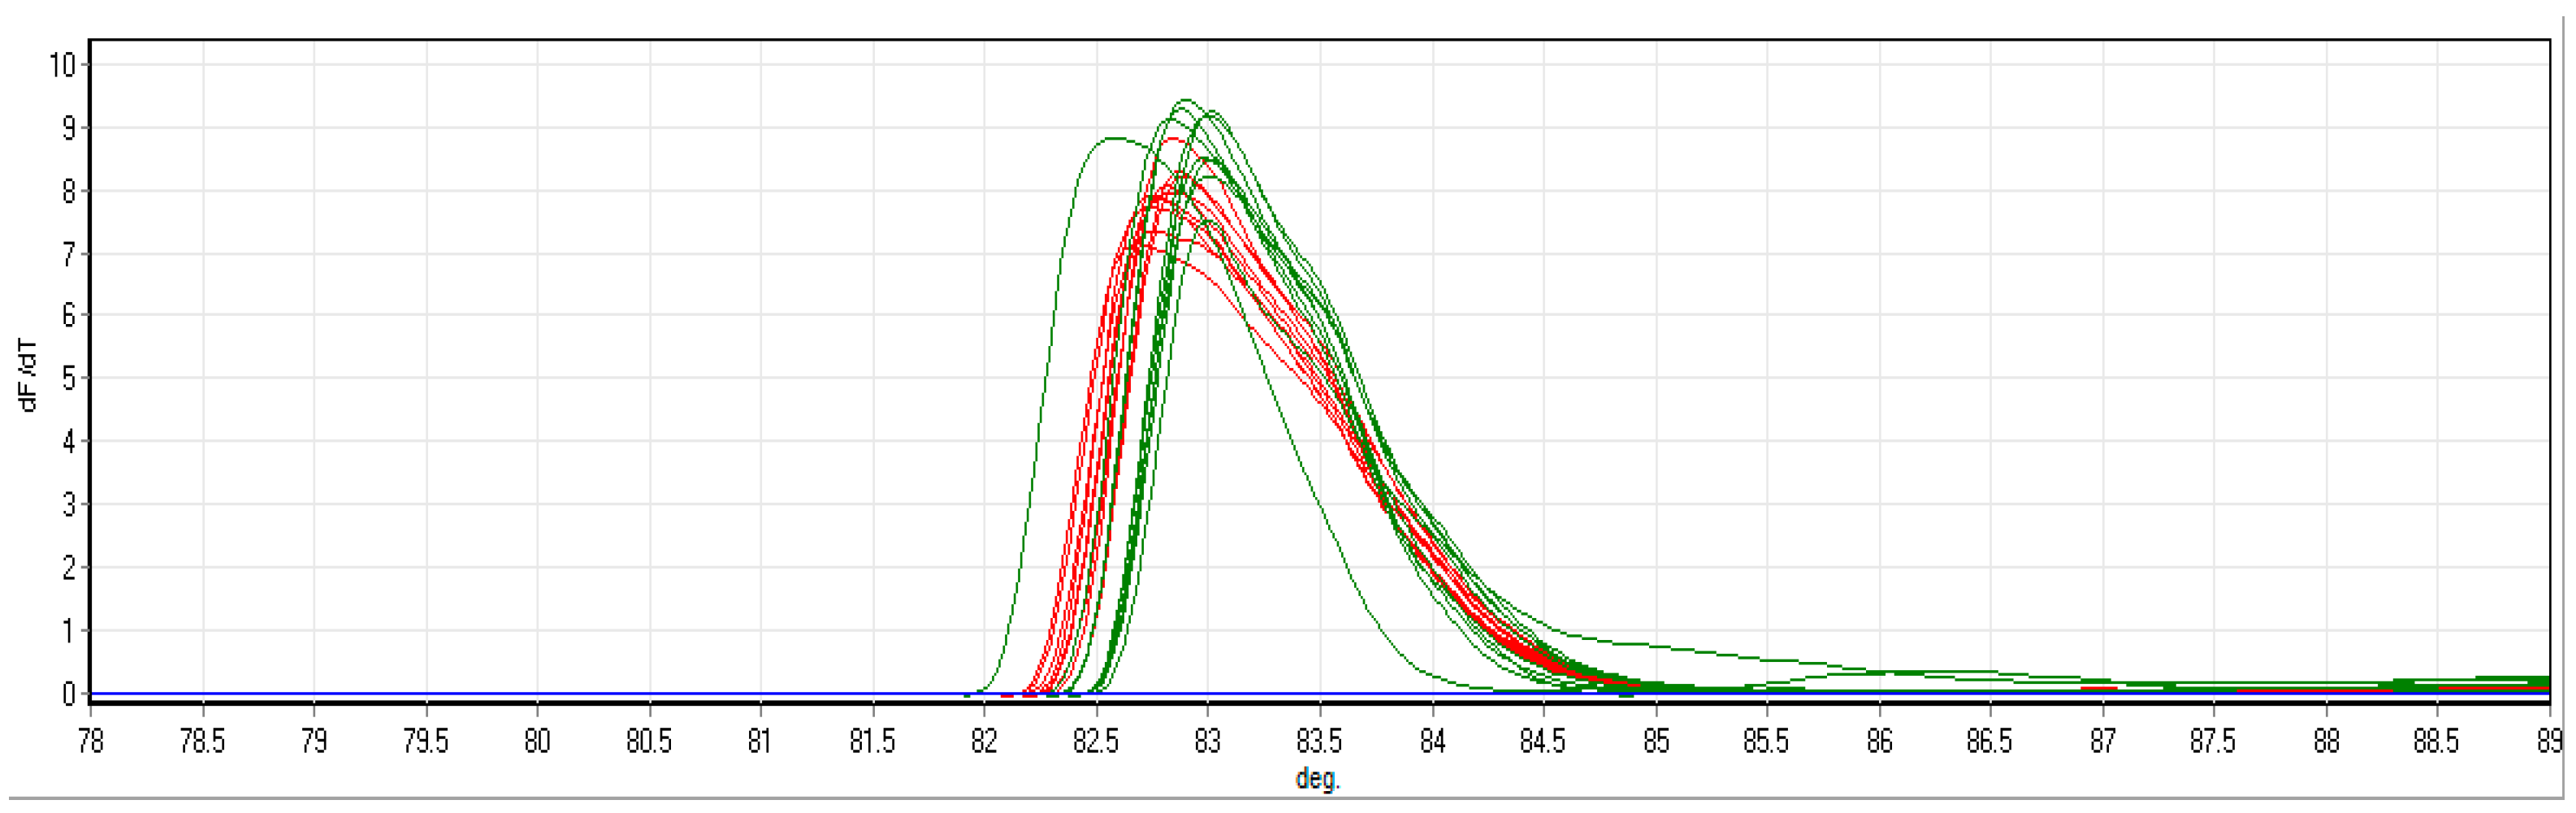
2.5. High-Resolution Melt-Curve Quantitative Real-Time PCR (HRM-RT-PCR) of P. delicatissima on CPR Samples from the 608 SB Route

Primers were designed from an LSU rDNA alignment of 137 Pseudo-nitzschia sequences and 9 outgroups to amplify partial LSU rDNA from P. delicatissima as described by Clarke [14]. Standard PCR products were generated using LSU amplification from P. delicatissima CCAP 1061/41 (CCAP, SAMS, Oban, UK), whose identity was verified by sequencing the ITS region (GenBank OM350397) and LSU region (unpubl., see Supplementary Information S1). PCR reaction conditions and thermocycling settings were performed as described in Section 2.3 for Round 2. The 277 bp LSU rDNA product was purified and used directly as a standard in HRM-qRT-PCR assays. DNA copy number calculation was quantified from the standard as described by Stern [20], and a dilution series was prepared, ranging between 1 × 10³ and 1 × 10⁸ copies in 4 µL volume. DNA standards, genomic P. delicatissima DNA (positive control), were run alongside experimental CPR DNA samples in duplicate at 1:10 and 1:100 dilutions in HRM-qRT-PCR reactions.
HRM-RT-PCR amplifications were performed using a Rotorgene 6000 real-time PCR machine (Qiagen, Valencia, CA, USA) in 10µL volumes of a Sensifast SYBR green reaction mix (Bioline, London, UK) as described by the manufacturer’s instructions using a 72-sample rotor and rotor tubes (Qiagen, Manchester, UK). Thermal cycling conditions were as follows: 1 cycle 95 °C for 3 min, followed by 40 cycles at 95° for 5 s, 60 °C for 10 s and 72 °C for 20 s. The HRM immediately followed: ramping from 70 °C to 90 °C degrees in steps of 0.1 °C. The results from the standards were then quality-checked using LinRegPCR (v2015, [21]), log transformation and standard curves creation. Amplification curve quality control was set according to LinRegPCR recommended parameters using the linear regression method of generating Cq (quantification cycle) values. Reactions outside the range but showing an amplification product via gel electrophoresis were scored for presence only. All samples were checked for the presence of correctly sized PCR products by agarose gel electrophoresis, and the product identity was checked through sanger sequencing according to their protocol (Source Bioscience, Nottingham, UK). Corrected Cq values for reactions were exported to an Excel file. Standard-curve log-transformed Cq values were plotted against standard copy number to generate a straight-line equation that was used to calculate copy number concentration of PCR products in CPR DNA samples. Cell concentrations of standards were used to calculate copy number of targets per cell, and from there, cell concentrations were determined. A detailed protocol is described by [14]. Samples showing presence were plotted using QGIS (QGIS 3.28, London, UK).

3. Results

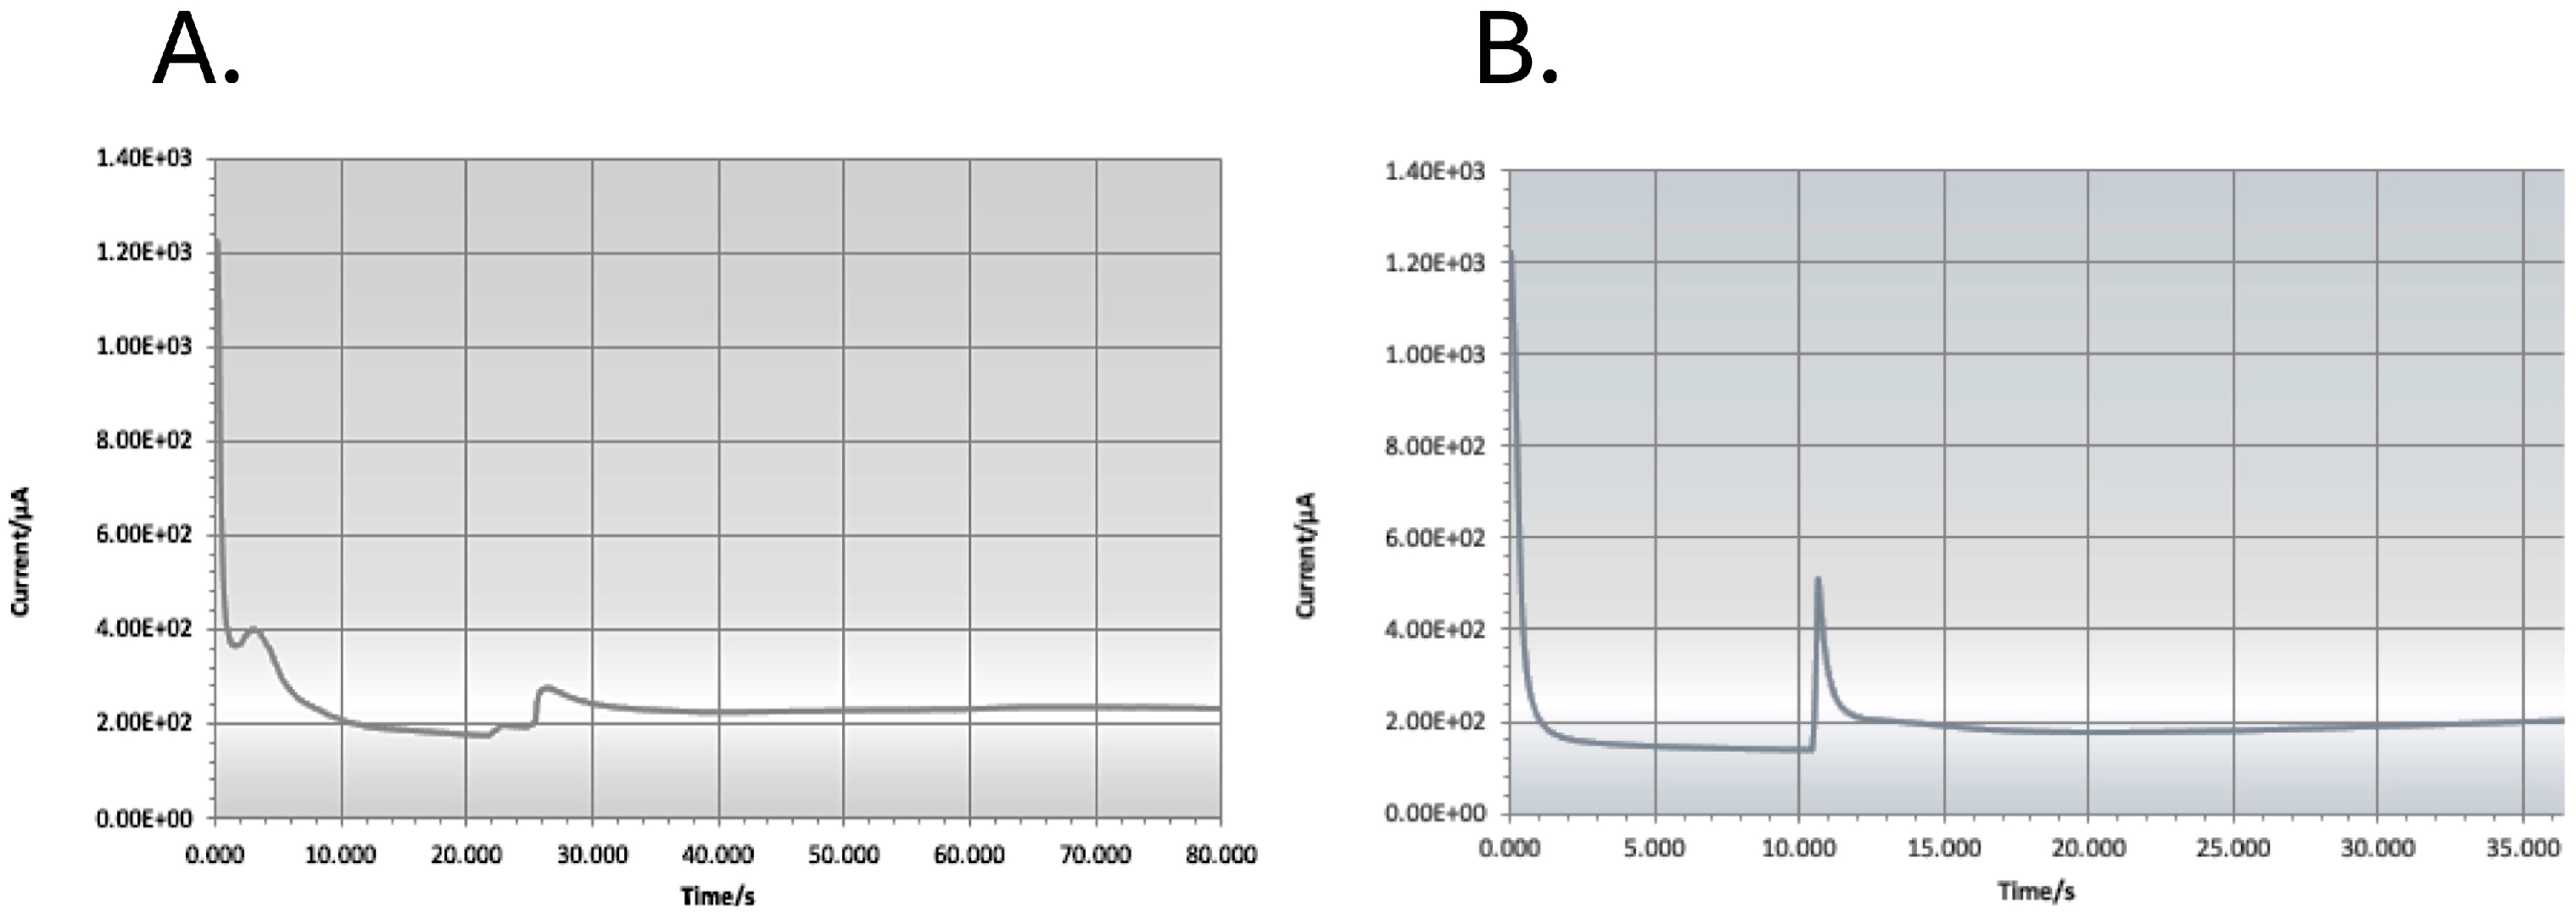
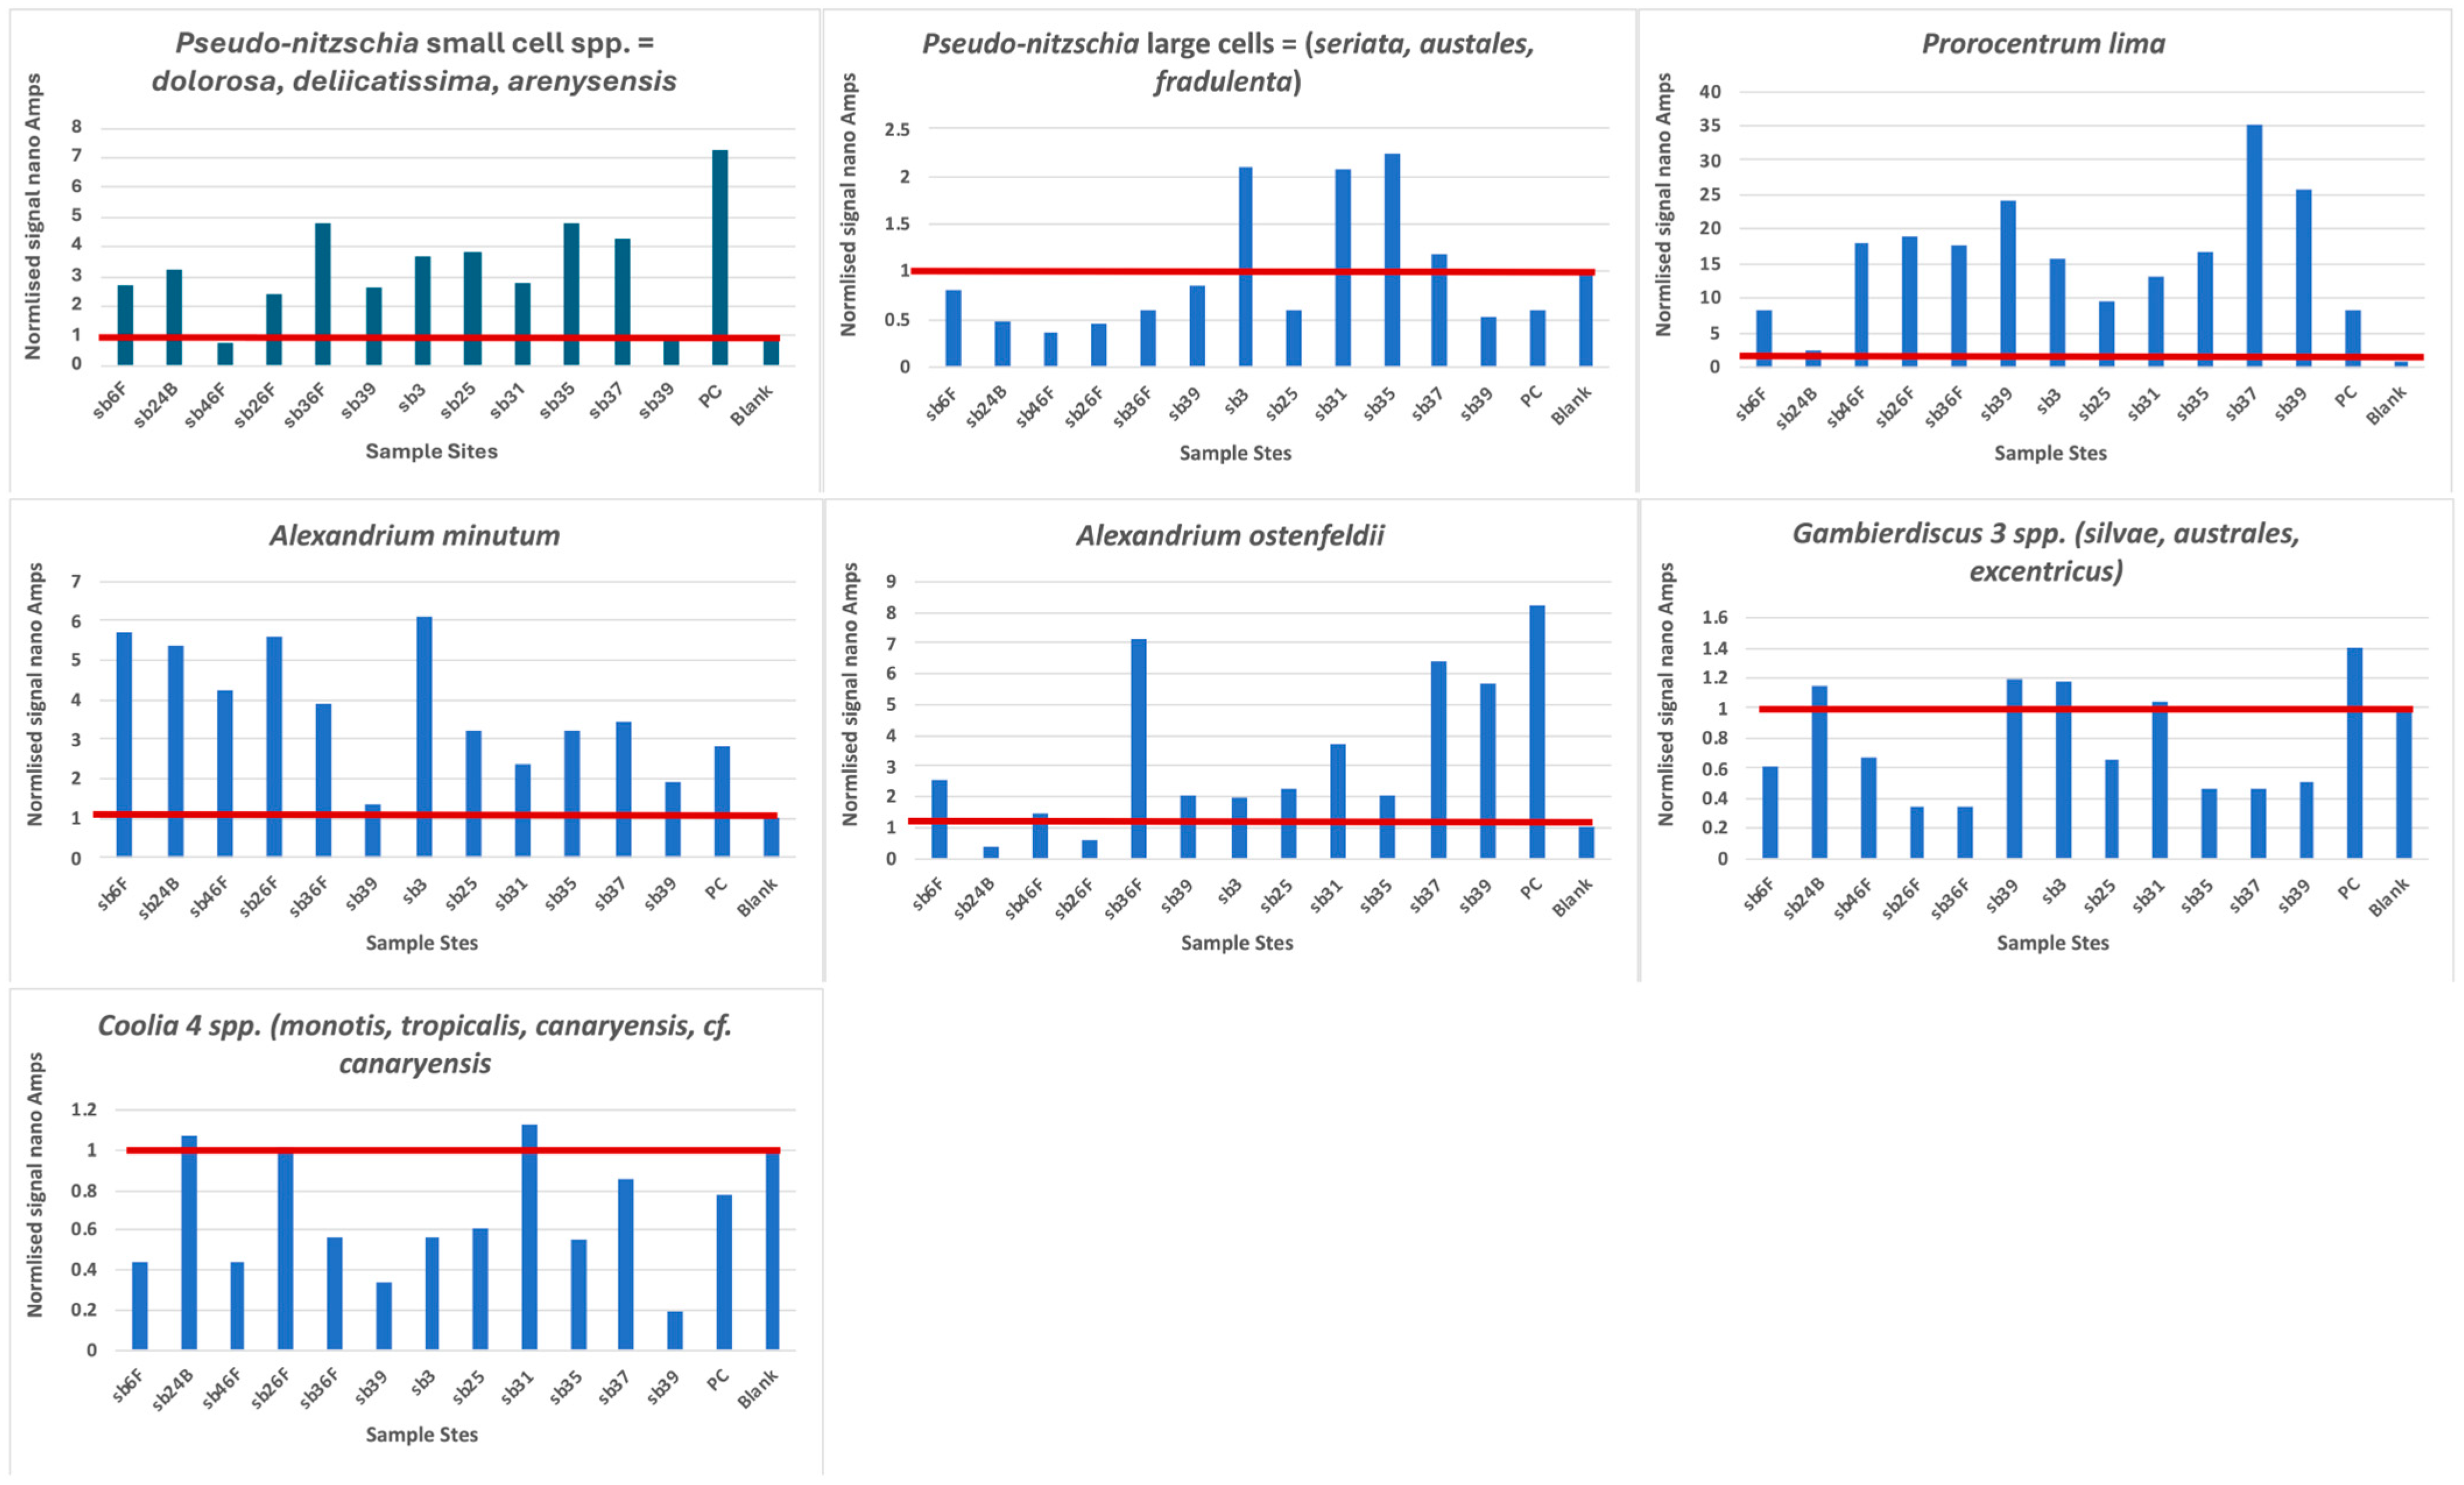
3.1. Biosensor Analysis

The results of PCRs and their gel documentation are shown in Supplemental Table S1 and Supplemental Figure S1. Of the CPR samples from the 608SB cruise track that were taken close to the Iberian Peninsula, only 11 of them produced positive PCR reactions. We decided to use for the biosensor analysis, primarily those samples where the full D1/D2 region of the LSU was amplified to compare the same results from hybridization to the same suite of probes. We added five samples whose PCR products were shorter because they were amplified with the primer combination 378F + D2CR. We were unable to obtain any PCR products from the SSU gene, and, thus, several probes with SSU targets were eliminated from our testing (viz., Ostreopsis and Dinophysis spp.). We finally tested the probes listed in Table 2 with the PCR products from samples listed in Table 1. For Pseudo-nitzschia probes, we pooled three species’ probes for both the large cell and small cell categories based on cell width. All cell counts for this genus are routinely divided into large and small cells unless electron microscopy is performed to identify species. Pseudo-nitzschia cannot be identified at the light-microscopic level, and the species selection that we chose to pool and test as a single unit because of time restraints (one-month secondment for ETL to MBA as part of the EU project EMERTOX) reflects those species identified in Spanish waters using electron microscopy and the EU MIDTAL microarray for toxic algae from the Spanish coast.
The plots of the hybridization of the probes to the PCR products are shown in Figure 3 and compared in Table 5. Our probes are designed to bind to RNA and, thus, can be quantified to infer cell numbers present in any sample. In the extraction of DNA from the CPR samples, RNAase is normally added to remove all RNA, leaving only DNA. The amount of DNA present cannot be compared to any cell numbers unless RT-PCR is performed, and neither can the PCR reactions that we used. We denatured the PCR products so that the coding and the non-coding strands were separated prior to probe hybridization. The non-coding strand is the same as RNA, except that thymine is present instead of uracil; thus, this strand can hybridize to our DNA probes. However, we were unable to quantify the number of cells present and could only compare the strength of the electrochemical reaction to the amount of targets present, and, presumably, the amount of targets present is somewhat indicative of the amount/number of DNA/cells present. However, the starting material was not quantified, so even though 1 μL was used in each PCR reaction, it could well represent different quantities of DNA, although band patterns on the gels (Supplemental Figure S1 suggests a concentration of 100–200 ng/μL for nearly all the bands). Thus, our comparisons between stations could only be considered presence/absence given the PCR conditions that we applied. This was also compromised by two of the experiments with high blanks (Gambierdiscus spp. and Coolia spp.), so some of the negative stations could well be positive if they were retested, or they were from the samples where a shorter fragment was amplified and the target site was not present.
Pseudo-nitzschia small cells present a distribution pattern that increases northward (Figure 4), broadly following the pattern observed with microscopic Pseudo-nitzschia abundances from the CPR survey (https://doi.org/10.17031/6401f86057b61, accessed on 10 January 2024). Sample SB39 is hybridized twice, once with the complete D1/D2 region and once with a shorter fragment (primers 378F to D2CR) of the D1/D2 region. In the shorter fragment, only the probe site for Pseudo-nitzschia delicatissima is present, and the signal obtained represents only that species. The signal is below the blank, which means that the signal obtained from the full length of the D1/D2 region is either P. dolorosa or P. arenysensis. Pseudo-nitzschia large cells had positive signals only at three stations.
Prorocentrum lima and Alexandrium minutum have a uniform distribution along the entire sampled coastline, with some of the highest signals obtained (Figure 3); notably, both species have a very low blank, which enhances all signals. The CPR survey does not record Alexandrium spp., but high levels of Prorocentrum “exuviaella” type microscopic counts are evenly distributed throughout the transect. Exuviaella is a synonym of Prorocentrum [22]; thus, Exuviaella lima is a synonym of a likely benthic Prorocentrum species and based on the biosensor results could be Prorocentrum lima. This probe recognises all clades of the P. lima species complex. All of them should be described as new, but the morphology of most of these genetically distinct clades are not yet studied.
Gambierdiscus 2 spp. and Coolia 4 spp. are less abundant, although their north–south distribution is homogeneous. For Coolia 4 spp. there is no signal in the shorter fragment, which means that the signal in the full-length fragment is that of either C. monotis or canariensis. Notable again is the signal for Gambierdiscus in sample SB39, where, in the full-length sample, there is a signal, and in the shorter fragment, it is below the blank, suggesting that Gambierdiscus is present because both probe sites are present in the full-length PCR fragment. Alexandrium ostenfeldii has its maximum concentration in the middle of the cruise track, with the weakest signals at the most northernly stations.

3.2. HRM-RT-PCR Analysis

P. delicatissima HRM curves specifically detected one product (Figure 5), which was verified through DNA sanger sequencing in 2015 as P. delicatissima but is identical [14] to several other Pseudo-nitzschia species recently deposited in GenBank, such as P. qiana, P. simulans and P. cf. arenysensis. All of these belong to a broader clade that includes P. delicatissima and P. pseudodelicatissima [23,24], which are characterised in light microscopic counts as Pseudo-nitzschia small cells. P. qiana and P. simulans are from tropical seas, and a separate, specific P. delicatissima probe detection indicates that this is P. delicatissima and not a related species. The product was found in seven out of ten CPR samples and in all five of the CPR samples preserved in the standard 4% formalin concentrations, compared to just two of the five samples in 2% formalin (Table 6). All but one of the samples detected were below a dynamic range to quantify cells accurately apart from 608SB-36F with an abundance of 66 cells mL−1. Detection was better in samples preserved in 4% formalin compared to 2% formalin. All samples with P. delicatissima also corresponded to Pseudo-nitzschia small cells in Table 5 at the 0 time point for DNA extraction, which also revealed elevated levels in 608SP-36, indicating better detection sensitivity.

3.3. Comparison of RT-PCR Time Intervals with Biosensor Detection of Pseudo-nitzschia

A selection of 608SB DNA samples examined using RT-PCR for P. delicatissma were also tested using the biosensor. All samples with P. delicatissima also corresponded to Pseudo-nitzschia small cells in Table 5 at the 0 time point for DNA extraction in exactly the same DNA extracts, so it was comparable to RT-PCR. The biosensor also detected elevated levels in 608SB-36, which was the only sample with sufficiently high levels of Pseudo-nitzschia to be detected using RT-PCR. The biosensor also detected small cells of Pseudo-nitzschia small cells in the only-2%-formalin stored samples (608SB-24D). The biosensor detected small cells of Pseudo-nitzschia from adjacent samples (608SB-35, -37) to those tested using RT-PCR (607SB-36), even after nine years in storage with advanced DNA degradation, demonstrating extreme sensitivity of detection. The newly extracted nine-year samples were tested with a different protocol with a crucial heat-step to remove cross-linkages (see Section 2.2), which may aid downstream DNA-based detection [25] and does not use any phenol.

3.4. Distribution of Harmful Algae along the Iberian Peninsula

To assess the accuracy of species detected, we compared our findings to those of historical species distributions found along the Iberian Peninsula. Because we pooled three probes for each size category of Pseudo-nitzschia species, we define large Mediterranean Atlantic species (>3 µM width) as P. fraudulenta, P. subfraudulenta, P. multiseries, P. australis, P. pungens, P. seriata, P. multistriata and P. caciantha; and we defined small Mediterranean Atlantic species (<3 µM width) as P. delicatissima complex = P. delicatissima, P. pseudodelicatissima, P. cf. arenysensis, P. calliantha, P. cuspidata, P. galaxiae, P. granii and P. turgidula as defined by Algaebase [26] and references therein and in Trainer et al. [27].
The presence of five biosensor-detected taxa was confirmed by previous studies (Table 7), but two are newly reported here. Only toxin testing indicated the potential for A. ostenfeldii, whereas the nearest Gambierdiscus sightings were found in islands off Africa. Historically, large and small cells of Pseudo-nitzschia are typically observed in nearshore coastal regions, but one report [28] detected larger cells at the surface at the North0-westerly Peninsula, consistent with the strongest corresponding signals from the biosensor and with CPR microscopic observations. The biosensor detected stronger signals of smaller cells than larger cells. However, P. delicatissima/P. pseudo-delicatissima have only been reported in nearshore areas (Table 7), and only small signals were observed offshore in 608SB-25. Nevertheless, the P. delicatissima complex is cosmopolitan [27] and confirmed via RT-PCR above. The Prorocentrium “exuviella”-type observations in the CPR survey might be the benthic Prorocentrum lima detected by the biosensor. The biosensor also detected P. lima at 608SB-31 and -39, with no corresponding CPR microscopic records on these samples, and at 608SB-6, which are two adjacent samples where microscopic observations were negative. This may be caused by the detection of different taxa and/or a more sensitive detection of cells/cell fragments with the biosensor because CPR samples are only counted on certain standard parts of the silk. No tests were possible for Dinophysis or Ostreopsis for technical reasons (PCR failure), unfortunately. The limitations of CPR sampling mean smaller or delicate cells are likely to be missed and benthic species are only transiently captured.

4. Discussion

The most valuable result from this study is that we have successfully amplified and hybridized relatively short, universal PCR products from CPR samples, which eliminates the effort needed for multiplex identification. The biosensor outperformed the RT-PCR detection of Pseudo-nitzschia, demonstrating its improved sensitivity even in degraded DNA samples after nine years of storage. Potentially harmful algal taxa were identified off the Iberian coast, a front for subtropical and boreal waters with upwelling regions, and northerly winds at the Galician northwest coast that generate nutrient-rich, well-mixed waters to sustain these taxa in spring/summer at coastal areas [40,41,42,43]. The biosensor data corresponded well with most of the original CPR microscopic counts for the Prorocentrumexuviaella” type, synonymous with a benthic Prorocentrum species, and for large cells of Pseudo-nitzschia. Smaller Pseudo-nitzschia microscopic and genetic counts did not correspond well, which may be caused by their appearance being masked within clumps of other taxa on samples [44] or because of poor historical offshore data, although they have been detected offshore in the NE Atlantic [45] and could be present there or advected through one of the three currents influencing the area, such as the Iberian Poleward current (see below) that can occur in spring [28]. Offshore, the P. seriata complex has undergone dramatic spatial and seasonal changes from the NE Atlantic from the 1960s to the 2000s [4]. Their presence has been reported previously, with Pseudo-nitzschia common in upwelling systems in late spring [29]. Spirolides, a toxin signature for only A. ostenfeldii, have been observed off the Galician coast [31]. A. ostenfeldii is more common in the northern part of the cruise track and is patchier than A. minutum, perhaps because it prefers lower-salinity water [46], which can be found off the northwest of Spain. Observation of toxic Alexandrium in Rias [34] on the Peninsula may point to a source of these cells but their presence in shelf waters may be caused by wind advection and transitional, low-salinity waters [47] sustaining their growth. Several of these HAB taxa were associated with ocean temperature or salinity changes [4,29]
The biosensor detection was applied to DNA limited quantification of taxa by signal strength. There is much variation in ribosomal rDNA copy numbers between harmful algal genera/species, and it can vary up to six-fold within the Alexandrium genus [48]. Without relating DNA copies to species-specific cell numbers, there is no indication of cell numbers. The biosensor is more sensitive, but contaminants or DNA damage within a probe region could create false negatives, as we found for Gambierdiscus and Coolia detection, which is a drawback to any method; thus, including controls is important. Nevertheless, techniques to acquire harmful algal copy numbers rapidly are available via droplet digital PCRs [49], and there is increasing evidence of a relationship between genome size, cell volume and copy numbers for dinoflagellates [48,50] that will help estimate cell numbers in future.
Significantly, we have shown that the emergent toxic benthic taxa, P. lima, Coolia spp. and Gambierdiscus spp., targeted in Emertox have been present in surface waters along the Iberian Peninsula at least since 2014. Ostreopsis could not be tested, so its presence is unknown. The most important of these is the signal for Gambierdiscus, which is present in the full-length D1/D2 region PCR product but absent in the shorter fragment. In a parallel study from modern samples a positive signal for this genus was recovered in the Porto Cruise terminal, which we had initially interpreted to be a possible introduction from the algal fouling community on the bottom of the cruise liners coming from the Canary Islands. However, these results from the CPR offshore samples suggest that Gambierdiscus is also found in the water column. Although benthic, they could be present on fragments of seaweed or debris caught by the CPR survey. Seasonal currents in the summer indicate southerly currents creating upwelling in this region, but in the winter, there is weaker atmospheric forcing, and a poleward current develops along the Iberian Peninsula that can occur in spring [28,51]. Depending on the strength and extent of this and other currents, this may be a route for harmful algal taxa to reach the Iberian Peninsula from the Canary Islands. With climate change, tropical species are increasing their northern extension, and conditions may change such that they may allow Gambierdiscus to thrive. Ciguatera poisonings from this genus are a major concern under climate change scenarios and potential multiple pressures as it often co-occurs with Ostreopsis, Coolia and Prorocentrum [52].
Growth experiments performed on multiple strains of five Gambierdiscus species by Ramilo et al. [53] showed that G. excentricus and G. silvae were better adapted to lower temperatures but could not survive below 17 °C, whereas G. australes survived at temperatures as low as 15 °C and exhibited the broadest range of temperature tolerances, hence its global distribution. All species that tolerated lower temperatures were kept at low temperatures for up to six months, and when returned to 25 °C, they started to grow. These authors also reported the monthly average temperatures in coastal waters of the Canary Islands from 2013 to 2018 to range from 17.26 °C to 18.65 °C in winter and from 23.30 °C to 25.44 °C in summer, which would suggest that the Gambierdiscus spp. in the Canary Islands can tolerate low winter conditions and survive until the summer. Ramilo et al. [53] also report other studies that show that G. australes can tolerate temperatures as low as 13 °C. The CPR is towed behind ships at a depth of 4–10 m. Surface water temperatures along the cruise track for 2014 ranged from 15 to 17 °C. Thus, there is a potential for Gambierdiscus to survive in coastal waters, depending on its substrate, along the Iberian coast until warmer summer sea temperatures (e.g., climate change) could initiate growth to cause a toxic event. However, eDNA in marine environments decays exponentially with a half-life of 26 h, and it is more persistent offshore [54], so it is possible Gambierdiscus may not have been alive.
The Iberian Peninsula climate is influenced by Atlantic currents, the Gulf Stream and North Atlantic currents interacting with climatic conditions from the Azores and Iceland fronts. Representative Concentration Pathway (RCC) predictions from the Intergovernmental Panel on Climate Change at the highest (8.5) and moderate (4.5) scenarios suggest that changes to the trajectories of ocean currents, increased winter rains in the NW Peninsula and promotion of long-shore summer northerly winds will promote upwelling in the NW Peninsula [55]. Gambierdiscus has been reported in temperate waters [52], and potentially greater winds may accentuate further blooms in the region. Other species show a broad distribution along the cruise tract.
The hybridization with electrochemical detection is a powerful tool that allows us to precisely determine the south–north movement of microalgae in general, and specifically toxic dinoflagellates. Crucially, it extends the potential for the rapid, offshore monitoring of these organisms and the tracing of their distribution through the CPR survey at very low costs. It detected species that the CPR does not count. This method can be used in future applications to monitor the movement of these microalgae, to predict abundance or distributional changes and to take appropriate preventive measures to protect health and ecosystems when possible. Crucially, it extends the potential for the rapid, offshore monitoring of these organisms and the tracing of their distribution through the CPR survey at costs that are approximately five to six times less than the average research vessel costs per nautical mile, including microscopic analysis.

5. Conclusions

The biosensor detected 10 types of harmful algae from 11 CPR samples, including three benthic taxa and the highly toxic genus Gambierdiscus. Two of these species detected were recorded via microscopy by the CPR survey. The detection of Pseudo-nitzschia small cells with the biosensor is similar to the detection using RT-PCR. We showed that even after nine years, the biosensor outperformed the RT-PCR detection of Pseudo-nitzschia in neighbouring samples. Our results show an environmental validation of a miniaturised biosensor to detect multiple HABs even from degraded samples that can provide results within 48 h. There are multiple applications for this device, and we showed its application on historical plankton samples. Because of its high sensitivity and specificity, probe hybridization with electrochemical detection is a powerful tool that will allow us to preserve public health through the early detection of toxin-producing dinoflagellates.

Supplementary Materials

The following supporting information can be downloaded at: https://www.mdpi.com/article/10.3390/applmicrobiol4010021/s1, Supplemental Table S1. Summary of PCR reactions from various CPR stations and positive controls in yellow (full D1/D2 LSU and in blue 378F+D2CR); Supplementary Information S1. Sanger sequencing of Pseudo-nitzschia delicatissima CCAP 1061/41 partial LSU amplicon. Supplemental Figure S1. Summary of gel documentation of PCR reactions. Gels are arranged by PCR primers used in the reaction. Supplementary Figure S2. Agarose gel of P. delicatissima LSU products following completion of HRM-RT-PCR assay on DNA standards, positive P. delicatissima DNA, positive control and negative no-template control (top row).

Author Contributions

Methodology, L.K.M., R.F.S., J.L.C. and G.M.; Formal analysis, G.M., R.F.S., J.L.C., M.F. and L.K.M.; Investigation, G.M., R.F.S., J.L.C., M.F. and L.K.M.; Writing—original draft, L.K.M.; Writing—review & editing, G.M., R.F.S., J.L.C., M.F. and L.K.M.; Visualization, J.L.C. and M.F.; Supervision, R.F.S.; Project administration, L.K.M.; Funding acquisition, G.M., R.F.S. and L.K.M. All authors have read and agreed to the published version of the manuscript.

Funding

This project was funded by EU Horizons 2020 FP5 EMERTOX project, grant number 778069. Additionally, EU Horizons 2020 projects AtlantOS, grant agreement No 633211, and ACTNOW grant agreement 101060072. The CPR survey is funded through NERC Climate Linked Atlantic Sector Science (CLASS), grant numbers NE/R015953/1.

Data Availability Statement

Data are contained within the article and Supplementary Materials. The data presented in this study are available on request from the corresponding author. The data are not publicly available because the probes are patent-pending.

Acknowledgments

We wish to thank the crew of the good ship MV SOPHIA (SB route) operated by MacAndrews Shipping for collecting plankton samples and the CPR technician and analyst team for processing and storing CPR samples.

Conflicts of Interest

The authors declare no conflicts of interest.

References

  1. Vezzulli, L.; Martinez-Urtaza, J.; Stern, R. Continuous Plankton Recorder in the omics era: From marine microbiome to global ocean observations. Curr. Opin. Biotechnol. 2022, 73, 61–66. [Google Scholar] [CrossRef]
  2. Richardson, A.J.; Walne, A.W.; John, A.W.G.; Jonas, T.D.; Lindley, J.A.; Sims, D.W.; Stevens, D.; Witt, M. Using continuous plankton recorder data. Prog. Oceanogr. 2006, 68, 27–74. [Google Scholar] [CrossRef]
  3. Batten, S.D.; Abu-Alhaija, R.; Chiba, S.; Edwards, M.; Graham, G.; Jyothibabu, R.; Kitchener, J.A.; Koubbi, P.; McQuatters-Gollop, A.; Muxagata, E.; et al. A global plankton diversity monitoring program. Front. Mar. Sci. 2019, 6, 321. [Google Scholar] [CrossRef]
  4. Hinder, S.L.; Hays, G.C.; Edwards, M.; Roberts, E.C.; Walne, A.W.; Gravenor, M.B. Changes in marine dinoflagellate and diatom abundance under climate change. Nat. Clim. Chang. 2012, 2, 271–275. [Google Scholar] [CrossRef]
  5. Stern, R.; Schroeder, D.; Highfield, A.; Al-Kandari, M.; Vezzulli, L.; Richardson, A. Chapter 2—Uses of molecular taxonomy in identifying phytoplankton communities from the Continuous Plankton Recorder Survey. In Advances in Phytoplankton Ecology; Clementson, L.A., Eriksen, R.S., Willis, A., Eds.; Elsevier: Amsterdam, The Netherlands, 2022; pp. 47–79. [Google Scholar]
  6. Oosting, T.; Hilario, E.; Wellenreuther, M.; Ritchie, P.A. DNA degradation in fish: Practical solutions and guidelines to improve DNA preservation for genomic research. Ecol. Evol. 2020, 8643–8651. [Google Scholar] [CrossRef] [PubMed]
  7. Ripley, S.J.; Baker, A.C.; Miller, P.I.; Walne, A.W.; Schroeder, D.C. Development and validation of a molecular technique for the analysis of archived formalin-preserved phytoplankton samples permits retrospective assessment of Emiliania huxleyi communities. J. Microbiol. Methods 2008, 73, 118–124. [Google Scholar] [CrossRef] [PubMed]
  8. Shiozaki, T.; Itoh, F.; Hirose, Y.; Onodera, J.; Kuwata, A.; Harada, N. A DNA metabarcoding approach for recovering plankton communities from archived samples fixed in formalin. PLoS ONE 2021, 16, e0245936. [Google Scholar] [CrossRef]
  9. Stern, R.; Moore, S.; Trainer, V.; Bill, B.; Fischer, A.; Batten, S. Spatial and temporal patterns of Pseudo-nitzschia genetic diversity in the North Pacific Ocean from the Continuous Plankton Recorder survey. Mar. Ecol.-Prog. Ser. 2018, 606, 7–28. [Google Scholar] [CrossRef]
  10. Vezzulli, L.; Brettar, I.; Pezzati, E.; Reid, P.C.; Colwell, R.R.; Höfle, M.G.; Pruzzo, C. Long-term effects of ocean warming on the prokaryotic community: Evidence from the Vibrios. ISME 2012, 6, 21–30. [Google Scholar] [CrossRef] [PubMed]
  11. Johns, D.; Broughton, D. The CPR Survey; v1.0, Dataset/Sampling Event; Marine Biological Association: Plymouth, UK, 2019. [Google Scholar] [CrossRef]
  12. Penna, A.; Galluzzi, L. The quantitative real-time PCR applications in the monitoring of marine harmful algal bloom (HAB) species. Environ. Sci. Pollut. Res. 2013, 20, 6851–6862. [Google Scholar] [CrossRef]
  13. Vezzulli, L.; Grande, C.; Reid, P.C.; Hélaouët, P.; Edwards, M.; Höfle, M.G.; Brettar, I.; Colwell, R.R.; Pruzzo, C. Climate influence on Vibrio and associated human diseases during the past half-century in the coastal North Atlantic. Proc. Nat. Acad. Sci. USA 2016, 113, E5062–E5071. [Google Scholar] [CrossRef]
  14. Clarke, J. Determining the Occurence of Non-Toxic Variants of Harmful Algal Species Using Automated Sampling Platforms. Master’s Thesis, University of Plymouth, Plymouth, UK, 2015. [Google Scholar]
  15. Scholin, C.A.; Herzog, M.; Sogin, M.; Anderson, D.M. Identification of group- and strain-specific genetic markers for globally distributed Alexandrium (Dinophyceae). II. Sequence analysis of a fragment of the LSU rRNA gene. J. Phycol. 1994, 30, 999–1011. [Google Scholar] [CrossRef]
  16. McDonald, S.M.; Sarno, D.; Zingone, A. Identifying Pseudo-nitzschia species in natural samples using genus-specific PCR primers and clone libraries. Harmful Algae 2007, 9, 849–860. [Google Scholar] [CrossRef]
  17. Guillou, L.; Nézan, E.; Cueff, V.; Erard-Le Denn, E.; Cambon-Bonavita, M.; Gentien, P.; Barbier, G. Genetic diversity and molecular detection of three toxic dinoflagellate genera (Alexandrium, Dinophysis, and Karenia) from French Coasts. Protist 2002, 153, 222–238. [Google Scholar] [CrossRef] [PubMed]
  18. Toebe, K.; Alpermann, T.J.; Tillmann, U.; Krock, B.; Cembella, A.; John, U. Molecular discrimination of toxic and non-toxic Alexandrium species (Dinophyta) in natural phytoplankton assemblages from the Scottish coast of the North Sea. Eur. J. Phycol. 2013, 48, 12–26. [Google Scholar] [CrossRef]
  19. Medlin, L.K.; Gamella, M.; Mengs, G.; Serafín, V.; Campuzano, S.; Pingarrón, J.M. Advances in the detection of toxic algae using electrochemical biosensors. Biosensors 2020, 10, 207. [Google Scholar] [CrossRef] [PubMed]
  20. Stern, R.; Picard, K.; Clarke, J.; Walker, C.E.; Martins, C.; Marshall, C.; Amorim, A.; Woodward, E.M.S.; Widdicombe, C.; Tarran, G.; et al. Composition and patterns of taxa assemblages in the western channel assessed by 18s sequencing, microscopy and flow cytometry. J. Mar. Sci. Eng. 2023, 11, 480. [Google Scholar] [CrossRef]
  21. Ruijter, J.M.; Pfaffl, M.W.; Zhao, S.; Spiess, A.N.; Boggy, G.; Blom, J.; Rutledge, R.G.; Sisti, D.; Lievens, A.; De Preter, K.; et al. Evaluation of qPCR curve analysis methods for reliable biomarker discovery: Bias, resolution, precision, and implications. Methods 2013, 59, 32–46. [Google Scholar] [CrossRef] [PubMed]
  22. Guiry, M.D. Exuviaella lima (Ehrenberg) Bütschli 1885; AlgaeBase—World-Wide Electronic Publication: Galway, Ireland, 2016. [Google Scholar]
  23. Ajani, P.A.; Verma, A.; Kim, J.H.; Woodcock, S.; Nishimura, T.; Farrell, H.; Zammit, A.; Brett, S.; Murray, S.A. Using qPCR and high-resolution sensor data to model a multi-species Pseudo-nitzschia (Bacillariophyceae) bloom in southeastern Australia. Harmful Algae 2021, 108, 102095. [Google Scholar] [CrossRef] [PubMed]
  24. Huang, C.X.; Dong, H.C.; Lundholm, N.; Teng, S.T.; Zheng, G.C.; Tan, Z.J.; Lim, P.T.; Li, Y. Species composition and toxicity of the genus Pseudo-nitzschia in Taiwan Strait, including P. chiniana sp. nov. and P. qiana sp. nov. Harmful Algae 2019, 84, 195–209. [Google Scholar] [CrossRef]
  25. Einaga, N.; Yoshida, A.; Noda, H.; Suemitsu, M.; Nakayama, Y.; Sakurada, A.; Kawaji, Y.; Yamaguchi, H.; Sasaki, Y.; Tokino, T.; et al. Assessment of the quality of DNA from various formalin-fixed paraffin-embedded (FFPE) tissues and the use of this DNA for next-generation sequencing (NGS) with no artifactual mutation. PLoS ONE 2017, 12, e0176280. [Google Scholar] [CrossRef]
  26. Guiry, M.D.; Guiry, G.M. AlgaeBase. World-Wide Electronic Publication. 2017. Available online: https://www.algaebase.org (accessed on 14 January 2024).
  27. Trainer, V.L.; Bates, S.S.; Lundholm, N.; Thessen, A.E.; Cochlan, W.P.; Adams, N.G.; Trick, C.G. Pseudo-nitzschia physiological ecology, phylogeny, toxicity, monitoring and impacts on ecosystem health. Harmful Algae 2012, 14, 271–300. [Google Scholar] [CrossRef]
  28. Crespo, B.G.; Figueiras, F.G. A spring poleward current and its influence on microplankton assemblages and harmful dinoflagellates on the western Iberian coast. Harmful Algae 2007, 6, 686–699. [Google Scholar] [CrossRef]
  29. Torres Palenzuela, J.M.; González Vilas, L.; Bellas, F.M.; Garet, E.; González-Fernández, A.; Spyrakos, E. Pseudo-nitzschia blooms in a coastal upwelling system: Remote sensing detection, toxicity and environmental variables. Water 2019, 11, 1954. [Google Scholar] [CrossRef]
  30. Lundholm, N.; Moestrup, Ø.; Kotaki, Y.; Hoef-Emden, K.; Scholin, C.; Miller, P. Inter- and intraspecific variation of the Pseudo-nitzschia delicatissima complex (Bacillariophyceae) illustrated by rRNA probes, morphological data and phylogenetic analyses. J. Phycol. 2006, 42, 464–481. [Google Scholar] [CrossRef]
  31. Blanco, J.; Arévalo, F.; Moroño, Á.; Correa, J.; Rossignoli, A.E.; Lamas, J.P. Spirolides in bivalve mollusk of the Galician (NW Spain) coast: Interspecific, spatial, temporal variation and presence of an isomer of 13-desmethyl spirolide C. Toxins 2022, 15, 13. [Google Scholar] [CrossRef]
  32. Lamas, J.P.; Arévalo, F.; Moroño, Á.; Correa, J.; Rossignoli, A.E.; Blanco, J. Gymnodimine A in mollusks from the north Atlantic Coast of Spain: Prevalence, concentration, and relationship with spirolides. Environ. Poll. 2021, 279, 116919. [Google Scholar] [CrossRef] [PubMed]
  33. Bravo, I.; Isabel Figueroa, R.; Garcés, E.; Fraga, S.; Massanet, A. The intricacies of dinoflagellate pellicle cysts: The example of Alexandrium minutum cysts from a bloom-recurrent area (Bay of Baiona, NW Spain). Deep Sea Res. Part II Top. Studies Ocean. 2010, 57, 166–174. [Google Scholar] [CrossRef]
  34. Nogueira, E.; Bravo, I.; Montero, P.; Díaz-Tapia, P.; Calvo, S.; Ben-Gigirey, B.; Figueroa, R.I.; Garrido, J.L.; Ramilo, I.; Lluch, N.; et al. HABs in coastal upwelling systems: Insights from an exceptional red tide of the toxigenic dinoflagellate Alexandrium minutum. Ecol. Ind. 2022, 137, 108790. [Google Scholar] [CrossRef]
  35. Godinho, L.; Soliño, L.; Churro, C.; Timoteo, V.; Santos, C.; Gouveia, N.; Diogène, J.; Reis Costa, P. Distribution, identification and cytotoxicity of Gambierdiscus (Dinophyceae) in the Atlantic Selvagens Islands (Madeira, Portugal): A ciguatera gateway to Europe. Eur. J. Phycol. 2023, 58, 156–168. [Google Scholar] [CrossRef]
  36. Costa, P.R.; Churro, C.; Rodrigues, S.M.; Frazão, B.; Barbosa, M.; Godinho, L.; Soliño, L.; Timóteo, V.; Gouveia, N. A 15-Year retrospective review of ciguatera in the Madeira Islands (North-East Atlantic, Portugal). Toxins 2023, 15, 630. [Google Scholar] [CrossRef]
  37. Bravo, I.; Rodriguez, F.; Ramilo, I.; Rial, P.; Fraga, S. Ciguatera-causing dinoflagellate Gambierdiscus spp. (Dinophyceae) in a subtropical region of north Atlantic Ocean (Canary Islands): Morphological characterization and biogeography. Toxins 2019, 11, 423. [Google Scholar] [CrossRef] [PubMed]
  38. David, H.; Laza-Martínez, A.; Miguel, I.; Orive, E. Broad distribution of Coolia monotis and restricted distribution of Coolia cf. canariensis (Dinophyceae) on the Atlantic coast of the Iberian Peninsula. Phycologia 2014, 53, 342–352. [Google Scholar] [CrossRef]
  39. David, H.; Laza-Martínez, A.; Kromkamp, J.C.; Orive, E. Physiological response of Prorocentrum lima (Dinophyceae) to varying light intensities. FEMS Micro. Ecol. 2017, 94, fix166. [Google Scholar] [CrossRef] [PubMed]
  40. Torres, R.B.; Barton, E.D.; Miller, P.; Fanjul, E. Spatial patterns of wind and sea surface temperature in the Galician upwelling region. J. Geophys. Res. Space Phys. 2003, 108, 1–14. [Google Scholar] [CrossRef]
  41. González-Nuevo, G.; Nogueira, E. Intrusions of warm and salty waters onto the NW and N Iberian shelf in early spring and its relationship to climate variability. J. Atmos. Ocean. Sci. 2005, 10, 361–375. [Google Scholar] [CrossRef]
  42. Picado, A.; Vaz, N.; Alvarez, I.; Dias, J.M. Modelling coastal upwelling off NW Iberian Peninsula: New insights on the fate of phytoplankton blooms. Sci. Total. Environ. 2023, 874, 162416. [Google Scholar] [CrossRef]
  43. Quality Status Report 2000: Region IV—Bay of Biscay and Iberian Coast; OSPAR Commission: London, UK, 2000; Available online: https://qsr2010.ospar.org/media/assessments/QSR_2000_Region_IV.pdf (accessed on 10 January 2024).
  44. Rines, J.E.B.; Donaghay, P.L.; Dekshenieks, M.M.; Sullivan, J.M.; Twardowski, M.S. Thin layers and camouflage: Hidden Pseudo-nitzschia spp. (Bacillariophyceae) populations in a fjord in the San Juan Islands, Washington, USA. Mar. Ecol.-Prog. Ser. 2002, 225, 123–137. [Google Scholar] [CrossRef]
  45. Painter, S.C.; Finlay, M.; Hemsley, V.S.; Martin, A.P. Seasonality, phytoplankton succession and the biogeochemical impacts of an autumn storm in the northeast Atlantic Ocean. Prog. Oceanogr. 2016, 142, 72–104. [Google Scholar] [CrossRef]
  46. Martens, H.; Van de Waal, D.B.; Brandenburg, K.M.; Krock, B.; Tillmann, U. Salinity effects on growth and toxin production in an Alexandrium ostenfeldii (Dinophyceae) isolate from The Netherlands. J. Plank. Res. 2016, 38, 1302–1316. [Google Scholar] [CrossRef]
  47. Bravo, I.; Fraga, S.; Figueroa, R.I.; Pazos, Y.; Massanet, A.; Ramilo, I. Bloom dynamics and life cycle strategies of two toxic dinoflagellates in a coastal upwelling system (NW Iberian Peninsula). Deep Sea Res. Part II Top. Stud. Oceanogr. 2010, 57, 222–234. [Google Scholar] [CrossRef]
  48. Ruvindy, R.; Barua, A.; Bolch, C.J.S.; Sarowar, C.; Savela, H.; Murray, S.A. Genomic copy number variability at the genus, species and population levels impacts in-situ ecological analyses of dinoflagellates and harmful algal blooms. ISME Commun. 2023, 3, 70. [Google Scholar] [CrossRef] [PubMed]
  49. Yarimizu, K.; Sildever, S.; Hamamoto, Y.; Tazawa, S.; Oikawa, H.; Yamaguchi, H.; Basti, L.; Mardones, J.I.; Paredes-Mella, J.; Nagai, S. Development of an absolute quantification method for ribosomal RNA gene copy numbers per eukaryotic single cell by digital PCR. Harmful Algae 2021, 103, 102008. [Google Scholar] [CrossRef] [PubMed]
  50. Liu, Y.; Hu, Z.; Deng, Y.; Shang, L.; Gobler, C.J.; Tang, Y.Z. Dependence of genome size and copy number of rRNA gene on cell volume in dinoflagellates. Harmful Algae 2021, 109, 102108. [Google Scholar] [CrossRef]
  51. Martínez, J.; García-Ladona, E.; Ballabrera-Poy, J.; Isern-Fontanet, J.; González-Motos, S.; Allegue, J.M.; González-Haro, C. Atlas of surface currents in the Mediterranean and Canary–Iberian–Biscay waters. J. Oper. Oceanogr. 2024, 17, 40–62. [Google Scholar] [CrossRef]
  52. Heimann, K.; Sparrow, L. Chapter 37—Ciguatera: Tropical reef fish poisoning. In Handbook of Marine Microalgae; Kim, S.-K., Ed.; Academic Press: Boston, MA, USA, 2015; pp. 547–558. [Google Scholar]
  53. Ramilo, I.; Figueroa, R.I.; Rayon-Vina, F.; Cuadrado, A.; Bravo, I. Temperature-dependent growth and sexuality of the ciguatoxin producer dinoflagellate Gambierdiscus spp. in cultures established from the Canary Islands. Harmful Algae 2021, 110, 102130. [Google Scholar] [CrossRef]
  54. Collins, R.A.; Wangensteen, O.S.; O’Gorman, E.J.; Mariani, S.; Sims, D.W.; Genner, M.J. Persistence of environmental DNA in marine systems. Commun. Biol. 2018, 1, 185. [Google Scholar] [CrossRef]
  55. de la Vara, A.; Cabos, W.; Sein, D.V.; Teichmann, C.; Jacob, D. Impact of air–sea coupling on the climate change signal over the Iberian Peninsula. Clim. Dyn. 2021, 57, 2325–2349. [Google Scholar] [CrossRef]
Figure 1. Spatial display of stations sampled in cruise track 608SB that produced a positive PCR reaction and were tested with EMERTOX probes.
Applmicrobiol 04 00021 g001
Figure 2. Typical blank where no PCR product was added to the reaction (A) and typical strong electrochemical reaction (B). The sharp rise in the base line reading represents the moment when the H2O2 is added to the reaction solution on the electrode chip, and the electrochemical reduction reaction is initiated and completed when the potentiostat reading returns to the baseline.
Applmicrobiol 04 00021 g002
Figure 3. Graph of each probe hybridization. The red line denotes the level of the blank, and all reactions above this line can be considered positive. PC = positive control.
Applmicrobiol 04 00021 g003
Figure 4. Map of presence/absence of all species tested along the 608 SB route of the Iberian coast. See legend for presence/absence definition.
Applmicrobiol 04 00021 g004
Figure 5. HRM for P. delicatissima LSU amplicon standard dilution series from [14]. Red lines are the known standards. Green lines are positive controls from a dilution series. Blue line represents designated colour for environmental samples that were not analysed for this figure. All are within the detection limit.
Applmicrobiol 04 00021 g005
Table 1. CPR samples from cruise track 608SB tested in this study from south to north. D: 2% formalin storage treatment, F: 4% formalin storage treatment. The 9 y samples were stored in standard 4% buffered formalin. Time periods for extraction were 1 m = one month, also indicated by a * in the Sample ID, 7 m = seven months and 9 y = 9 years.
Sample IDYearMonthLatitudeLongitudeDNA Extraction Time Point
   608SB-32014538.558−9.6629 y
   608SB-4D *2014538.667−9.821 m
   608SB-4D2014538.667−9.827 m
   608SB-6F *2014538.997−9.8331 m
   608SB-6F2014538.997−9.8337 m
   608SB-132014540.163−9.8339 y
   608SB-14D *2014540.332−9.8331 m
   608SB-14D2014540.332−9.8337 m
   608SB-16F *2014540.663−9.8331 m
   608SB-16F2014540.663−9.8337 m
   608SB-192014541.165−9.8839 y
   608SB-24D *2014541.997−9.8331 m
   608SB-24D2014541.997−9.8337 m
   608SB-252014542.163−9.8339 y
   608SB-26F *2014542.33−9.8331 m
   608SB-26F2014542.33−9.8337 m
   608SB-312014543.17−9.7879 y
   608SB-332014543.488−9.6539 y
   608SB-34D *2014543.647−9.5851 m
   608SB-34D2014543.647−9.5857 m
   608SB-352014543.807−9.5179 y
   608SB-36F *2014543.967−9.4481 m
   608SB-36F2014543.967−9.4487 m
   608SB-392014544.125−9.389 y
   608SB-372014544.443−9.2429 y
   608SB-44D *2014545.238−8.8871 m
   608SB-44D2014545.238−8.8877 m
   608SB-46F *2014545.555−8.7431 m
   608SB-46F2014545.555−8.7437 m
Table 2. The LSU primers used in standard PCRs and RT-PCRs (grey).
   Primer Name   Sequence 5′ to 3′Reference
   D1R-Eukaryote F   ACCCGCTGAATTTAAGCATA[15]
   D2C-Eukaryote R   CCTTGGTCCGTGTTTCAAGA[15]
   186F/D1-Pseudo-nitzschia    GTTCCTTGGAAAAGGACAGCTGA[16]
   548R D1-Pseudo-nitzschia    AGACATCAACTCTGACTG[16]
   Alex1 Alexandrium tamarense complex    ACCACCCACTTTGCATTCCA[17]
   Amin2 Alexandrium minutum    AGCACTGATGTGTAAGGGCT[17]
   378F Alexandrium tamarense    CCATGAGGGAAATATGAAAGGA[18]
   Acat3 Alexandrium catenella   AAGTGCAACACTCCCACCAA[17]
   PdeliLSUF2    CCTGGTGGAGTGAGTCGTTGTCAACG [14]
   PdeliLSUR3    TCAACCAAAGCAAACCCACGCAAGCTC [14]
Table 3. Location of selected CPR samples from cruise track 608SB that produced a PCR with the entire D1/D2 region of the LSU amplified (in yellow) or from position 378F to the end of the D2 region (in blue) to yield a shorter PCR product that excluded some of the probes tested (Table 4), arranged from North to South, as seen in Figure 1.
Sample Number Latitude Longitude
      608SB-46 (F) 45.555 −8.743
      608SB-39 44.443 −9.242
      608SB-37 44.125 −9.38
      608SB-36 (F) 43.967−9.448
      608SB-35 43.807−9.517
      608SB-31 43.17 −9.787
      608SB-26 (F) 42.33 −9.833
      608SB-25 42.163 −9.833
      608SB-24 (D) 41.997−9.833
      608SB-6 (F) 38.997 −9.833
      608SB-3 38.558 −9.662
Table 4. List of species probes hybridized to the CPR PCR products and their respective locations in the D1/D2 region of the LSU. Those in () are not found in the shorter PCR fragment amplified with the 378F + D2CR primers.
Species ProbeApproximate Location in LSU Using Prorocentrum micans as a Reference Sequence for the Dinoflagellate Probes. Those Positions in () Are Not Present in the Shorter PCR Fragment Amplified with 378F + D2R.
Alexandrium minutum583
Alexandrium ostenfeldii629
Coolia 4 spp. (monotis, tropicalis, canariensis, cf. canariensis 379, (177), 393, (265)
Gambierdiscus 2 spp. (silvae, australes)(76), (338)
Prorocentrum lima species complex554, 426
Pseudo-nitzschia small cells = (delicatissima, dolorosa, arenysensis)579, (143), (167)
Pseudo-nitzschia large cells = (seriata, australes, fraudulenta)379, 439, 424
Table 5. Strength of normalised hybridization reaction. + = below the blank; ++ = 1–3 nAMP; +++ = >3nAMP. Sample names are shortened, but all are prefixed by 608.
SB46FSB39SB39
Short
SB37SB36FSB35SB31SB26FSB25SB24DSB6FSB3
Pseudo-nitzschia small cells++++++++++++++++++++++++++++
Pseudo-nitzschia large cells++++++++++++++++
Prorocentrum lima+++++++++++++++++++++++++++++++++++
Alexandrium ostenfeldii++++++++++++++++++++++++++++
Alexandrium minutum+++++++++++++++++++++++++++++++++
Gambierdiscus 2 spp.++++++++++++++++
Coolia 4 spp.+++++++++++++++
Table 6. CPR samples from cruise track 608 tested in this study. All were tested in a 1/10 and 1/100 dilution. D: 2% formalin treatment, F: 4% formalin treatment. 1 m: one-month time period, also noted by an * in the sample ID, 7 m: seven-month time period, 9 yr: nine-year period. A: Absence, P: Presence. Numbers refer to corresponding agarose gel lanes in Supplemental Figure S1. D: 2% formalin storage, F: 4% formalin storage. N/A refers to the samples where no DNA sample was available.
Sample IDP. delicatissima
RT-PCR Time 1 m
P. delicatissima
RT-PCR Time 7 m
Small Cell of Pseudo-nitzschia Biosensor Time 9 yr
   608SB-4D *1 (A)11 (A)N/A
   608SB-6F *2 (P)12 (A)P
   608SB-14D *3 (A)13 (A)N/A
   608SB-16F *4 (P)14 (P)N/A
   608SB-24D *5 (P)15 (A)P
   608SB-26F *6 (P)16 (P)P
   608SB-34D *7 (A)17 (A)N/A
   608SB-36F *8 (P)18 (A)P
   608SB-44D *9 (P)19 (A)N/A
   608SB-46F *10 (P)20 (A)P
Table 7. Comparison of historical distribution of harmful algae taxa from the literature and CPR survey data archives that were identified by the biosensor in the Iberian Peninsula along the SB transect in 2014.
Biosensor Taxa
Positively Identified
Identified Historically in the Iberian
Peninsula
ReferenceExplanation
Large cells of Pseudo-nitzschia (>3 µM width)Yes[28]
[27]
[29]
Wide variety of larger species of P. seriata complex, commonly P. australis and also P. pungens. Mostly near coastal areas, except at surface NW point, outside Iberian Poleward current.
CPR microscopic observations at 608SB-3, -35, -36, -37, -39.
Small cells of Pseudo-nitzschia (<3 µM width)Yes[27]
[29]
[30]
P. delicatissima complex in Rias and isolated from near-coastal Portugal.
CPR microscopic observation only at 608SB-25.
Alexandrium ostenfeldiiUnclear[31]
[32]
Spirolides and Gymnodinine A in molluscs, also produced by A. ostenfeldii.
Not recorded in CPR survey.
Alexandrium minutumYes[33]
[34]
Typically in Rias with accompanying cyst beds but found offshore in 2018.
Not recorded in CPR survey.
Gambierdiscus 2 spp.No[35]
[36]
[37]
Found in NE Atlantic Balieric, Madiera and Selvagens Islands reported gateway to Europe.
Not recorded in CPR survey.
Coolia 4 spp.Yes[38]C. monotis broad distribution. C. canariensis near Bilbao.
Not recorded in CPR survey.
Prorocentrum limaYes[39]Isolated in 3 regions. Slow growing taxa.
CPR microscopic observation of ProrocentrumExuviella” at 608SB-3, -23, -25, -27, -32, -35, -36, -37, -39.
Disclaimer/Publisher’s Note: The statements, opinions and data contained in all publications are solely those of the individual author(s) and contributor(s) and not of MDPI and/or the editor(s). MDPI and/or the editor(s) disclaim responsibility for any injury to people or property resulting from any ideas, methods, instructions or products referred to in the content.

