1. Introduction
Pap smear has been valuable for the prevention of cervical cancer for decades [
1]. Unfortunately, this neoplasm is still one of the main causes of death from cancer among the female population in developing countries [
2]. Manual Pap smear analysis presents several issues, such as the number of false-negative results of up to 62%, which is a serious problem because it can delay a treatable early detection case [
3,
4,
5,
6,
7,
8,
9].
One of the leading causes is the visual inspection of cytopathological lesions under an optical microscope, which comprises two main tasks performed by the cytopathologist: locating and classifying pre-neoplastic cells. At this examination stage, scrutiny and interpretation errors may occur, respectively [
10].
Excellence in the performance of these tasks is closely related to the professional’s qualification and experience and can also be hampered by the extensive daily workload, fatigue, qualitative cytomorphological criteria, and the wide variety of morphological lesions in different samples [
11]. Therefore, cytopathological diagnosis is linked to subjective factors that culminate in human errors [
12].
Thus, monitoring the quality of the Pap smear has allowed the application of a set of measures aimed at reducing deficiencies in the process [
13]. Computer-aided diagnosis (CAD) has gained evidence in this context as these systems can achieve promising results in minimizing diagnostic errors [
14], acting as a supplementary tool for decision-making.
Computational approaches in this context need to deal with a different set of challenges. The main one is the overlapping elements within images from conventional cytology, which makes it challenging to perform classification and detection algorithms. This problem can be circumvented by using images collected in liquid-based cytology since they have fewer overlapping elements than in conventional cytology. However, this approach for generating images has high costs and is not widely used.
This work proposes a tool to support the cytopathologist’s decision through automated analysis of images based on deep learning, which provides feedback to the user about the possible classifications of cervical cells from the Pap smear slide. The cytopathologist uses the CAD system output as a “second opinion” and makes the final decision. Our contributions are summarized as follows:
- (A)
Detection and classification of cells in multi-cell images that do not require prior segmentation and hand-crafted features;
- (B)
Evaluation of different YOLO architectures and their configurations to detect and classify the nuclei from the CRIC Cervix images;
- (C)
Introduction of a computer-aided diagnosis system to detect and classify cervical cells, the Cytopathologist Eye Assistant (CEA).
The methodology proposed in this work is limited to databases with known ground truth nuclei. Furthermore, supervised machine learning models need to receive data similar to those they have been trained on; otherwise, they may perform poorly. So, in this case, for the models presented to continue with good results, the images must have the same characteristics, such as but not limited to resolution, zoom, and focus. Ideally, they should be collected on the same equipment used to construct the databases.
The remainder of this paper is organized as follows.
Section 2 presents the related studies, followed by the details of the proposed methodology in
Section 3.
Section 4 shows our experiments, including the database, metrics, results, and discussions.
Section 5 introduces the CEA tool, our proposal for a computer-aided cervical cell screening system. Finally, the conclusions are exposed in
Section 6.
2. Background
This section is organized as follows.
Section 2.1 reviews methods of cell detection and classification, while
Section 2.2 presents an analysis of computational tools to support the cytopathologist’s work routine. Finally,
Section 2.3 presents a review of YOLOv5 architecture.
2.1. Detection and Classification Review
Recently, several studies have analyzed different approaches to support cytopathologists in their work routine. One of these approaches is automatic cell classification since this task is an essential part of the professional’s routine and is also challenging. Rehman et al. [
15] proposed a method to extract deep features in cells and used softmax regression, support vector machine, and GentleBoost ensemble of decision trees to perform the classification. Ghoneim et al. [
16] also performed feature extraction for classification using Shallow, VGG-16, and CaffeNet architectures and they used Extreme Learning Machine and Autoencoder for classification. Diniz et al. [
17] investigated ten deep convolutional neural networks and proposed an ensemble of the three best ones to perform the cell classification.
Some studies performed cell classification based on handcrafted features. Diniz et al. [
18] investigated eight traditional machine learning methods to perform hierarchical cell classification. Di Ruberto et al. [
19] used different descriptors to classify the images using k-nearest neighbors, and Bora et al. [
20] classified cells based on their shape, texture, and color using an ensemble method.
However, performing the automatic classification of cervical lesions is a highly challenging task that becomes even more challenging when combined with automatic cell detection.
Matias et al. [
21] presented a survey that addresses cytology assisted by computer vision in a whole slide image. They reported that all studies employed state-of-the-art object detectors instead of proposing a new architecture of Convolutional Neural Network (CNN). An example of this approach is presented by Xiang et al. [
22], who used YOLOv3 followed by an additional task-specific classifier to perform the detection and classification.
The studies presented in this review use unicellular databases and/or private databases, and/or liquid-based cytology databases. Single-cell databases have the disadvantage of not representing reality since unit cells do not overlap. Private databases do not allow a good comparison for future work. Moreover, liquid-based cytology databases have images that are easier to automatically classify since the collected cells undergo a preparation to improve their spatial distribution. However, this preparation increases the exam cost, making it less used in middle and low-income countries.
Unlike the studies presented, we investigated convolutional neural networks to perform image detection and classification using a newly published multi-cell image database of conventional cytology, the most used in underdeveloped countries. Furthermore, we used the cell nuclei as the region of interest for the detection and classification tasks since Diniz et al. [
18] showed that this region contains enough information to perform the classification process. In addition, we presented a decision support tool to complement the work, followed by feedback from cytopathologists who evaluated the tool.
2.2. Landscape Analysis
The BD FocalPoint Slide profiler is attached to a slide scanner [
23]. The slides are analyzed, and the software returns information about the likelihood that the slide contains abnormalities. This information is sent to the professional for review. The system returns regions of interest to the user instead of the entire slide, facilitating the process and reducing the workload.
The TIS system combines image processing and slide scanning automation [
24]. It allows the analysis of 22 regions of interest and forwards the results to the professional who can intuitively track them. Each slide is sent to the professional for review, and complex areas can be marked for further analysis.
Recently, Hologic introduced Genius
TM Digital Diagnostics System, a digital cytology platform that combines a new artificial intelligence algorithm with advanced volumetric imaging technology to help pathologists identify pre-cancerous and cancerous lesions in women [
25]. The AI algorithm identifies suspicious structures on the slide. The regions of interest are classified, and the most relevant lesions are presented to the pathologist for review. For now, Genius diagnostic software is only being sold in Europe.
We also highlight the company KFBIO (
https://www.kfbiopathology.com/) (accessed on 1 November 2022), producer of the KFBIO Pathological Remote Diagnosis Platform software that works with cervical cancer and is coupled to a slide scanner, allowing high efficiency, sensitivity of 98.2%, and specificity of 63.5%. Artificial intelligence is applied based on deep convolutional neural networks to analyze liquid-based cervical cytology samples to confirm their feasibility in clinical practice.
All approaches are linked to the whole slide imaging (WSI) scanning equipment, a complete microscope slide scanning, and a high-resolution digital image. Thus, their use is restricted to the acquisition of high-cost equipment. In addition, their use is limited to liquid-based slides and Thin Prep tests, so it is impossible to use samples obtained by the conventional method.
In 2019, a startup (
https://datexim.ai/) (accessed on 1 November 2022) presented the CytoProcessor
TM software that uses artificial intelligence methods to differentiate normal cells from lesioned cells and then performs classification [
26]. Cells are shown in a table sorted from the most to the least diagnostically relevant. Each cell can be visualized in its context, similar to the microscope view. Compared to TIS, CytoProcessor
TM significantly improves diagnostic sensitivity without compromising specificity [
27].
Some computational tools even analyze cell structures individually or in collections, which may be helpful during the diagnostic process. However, none are specific to support the diagnosis of cervical cancer.
Another free and open-source software is Cytomine (
https://cytomine.com/) (accessed on 1 November 2022), a web platform that promotes collaborative image analysis through segmentation, manual cell annotation services and collection generation. In addition, it offers paid AI analysis services for images.
As mentioned, the software allows integration with image analysis algorithms. However, such use must be implemented separately and integrated into the platforms, which is not trivial. None of them have AI tools that allow support for diagnosing a cervical cell lesion quickly and easily for the pathologist without the support of an AI specialist.
2.3. YOLOv5 Review
The network architecture of YOLOv5 is composed of three components: backbone, neck, and head. The backbone component processes the image to generate feature sets at different levels. In YOLOv5, the backbone component is made by CSPDarknet [
28] architecture with extracted features based on an adapted DenseNet [
29] process. Its architecture is shown in
Table 1.
The neck component combines the features generated in the backbone and passes them to the prediction task. Therefore, this component uses the PANet [
30] architecture to create feature pyramids, which can represent objects in different scales and work with images of different sizes. In addition, the use of PANet improves the information flow.
Finally, the head component, performed by the YOLO layer, consists of using the features extracted by the previous components to generate the bounding box, the probability of each class, and the anchors of each detected object in the image. The hidden layers on the network and the detection layer use as an activation function, the ReLU function, and the Sigmoid function, respectively.
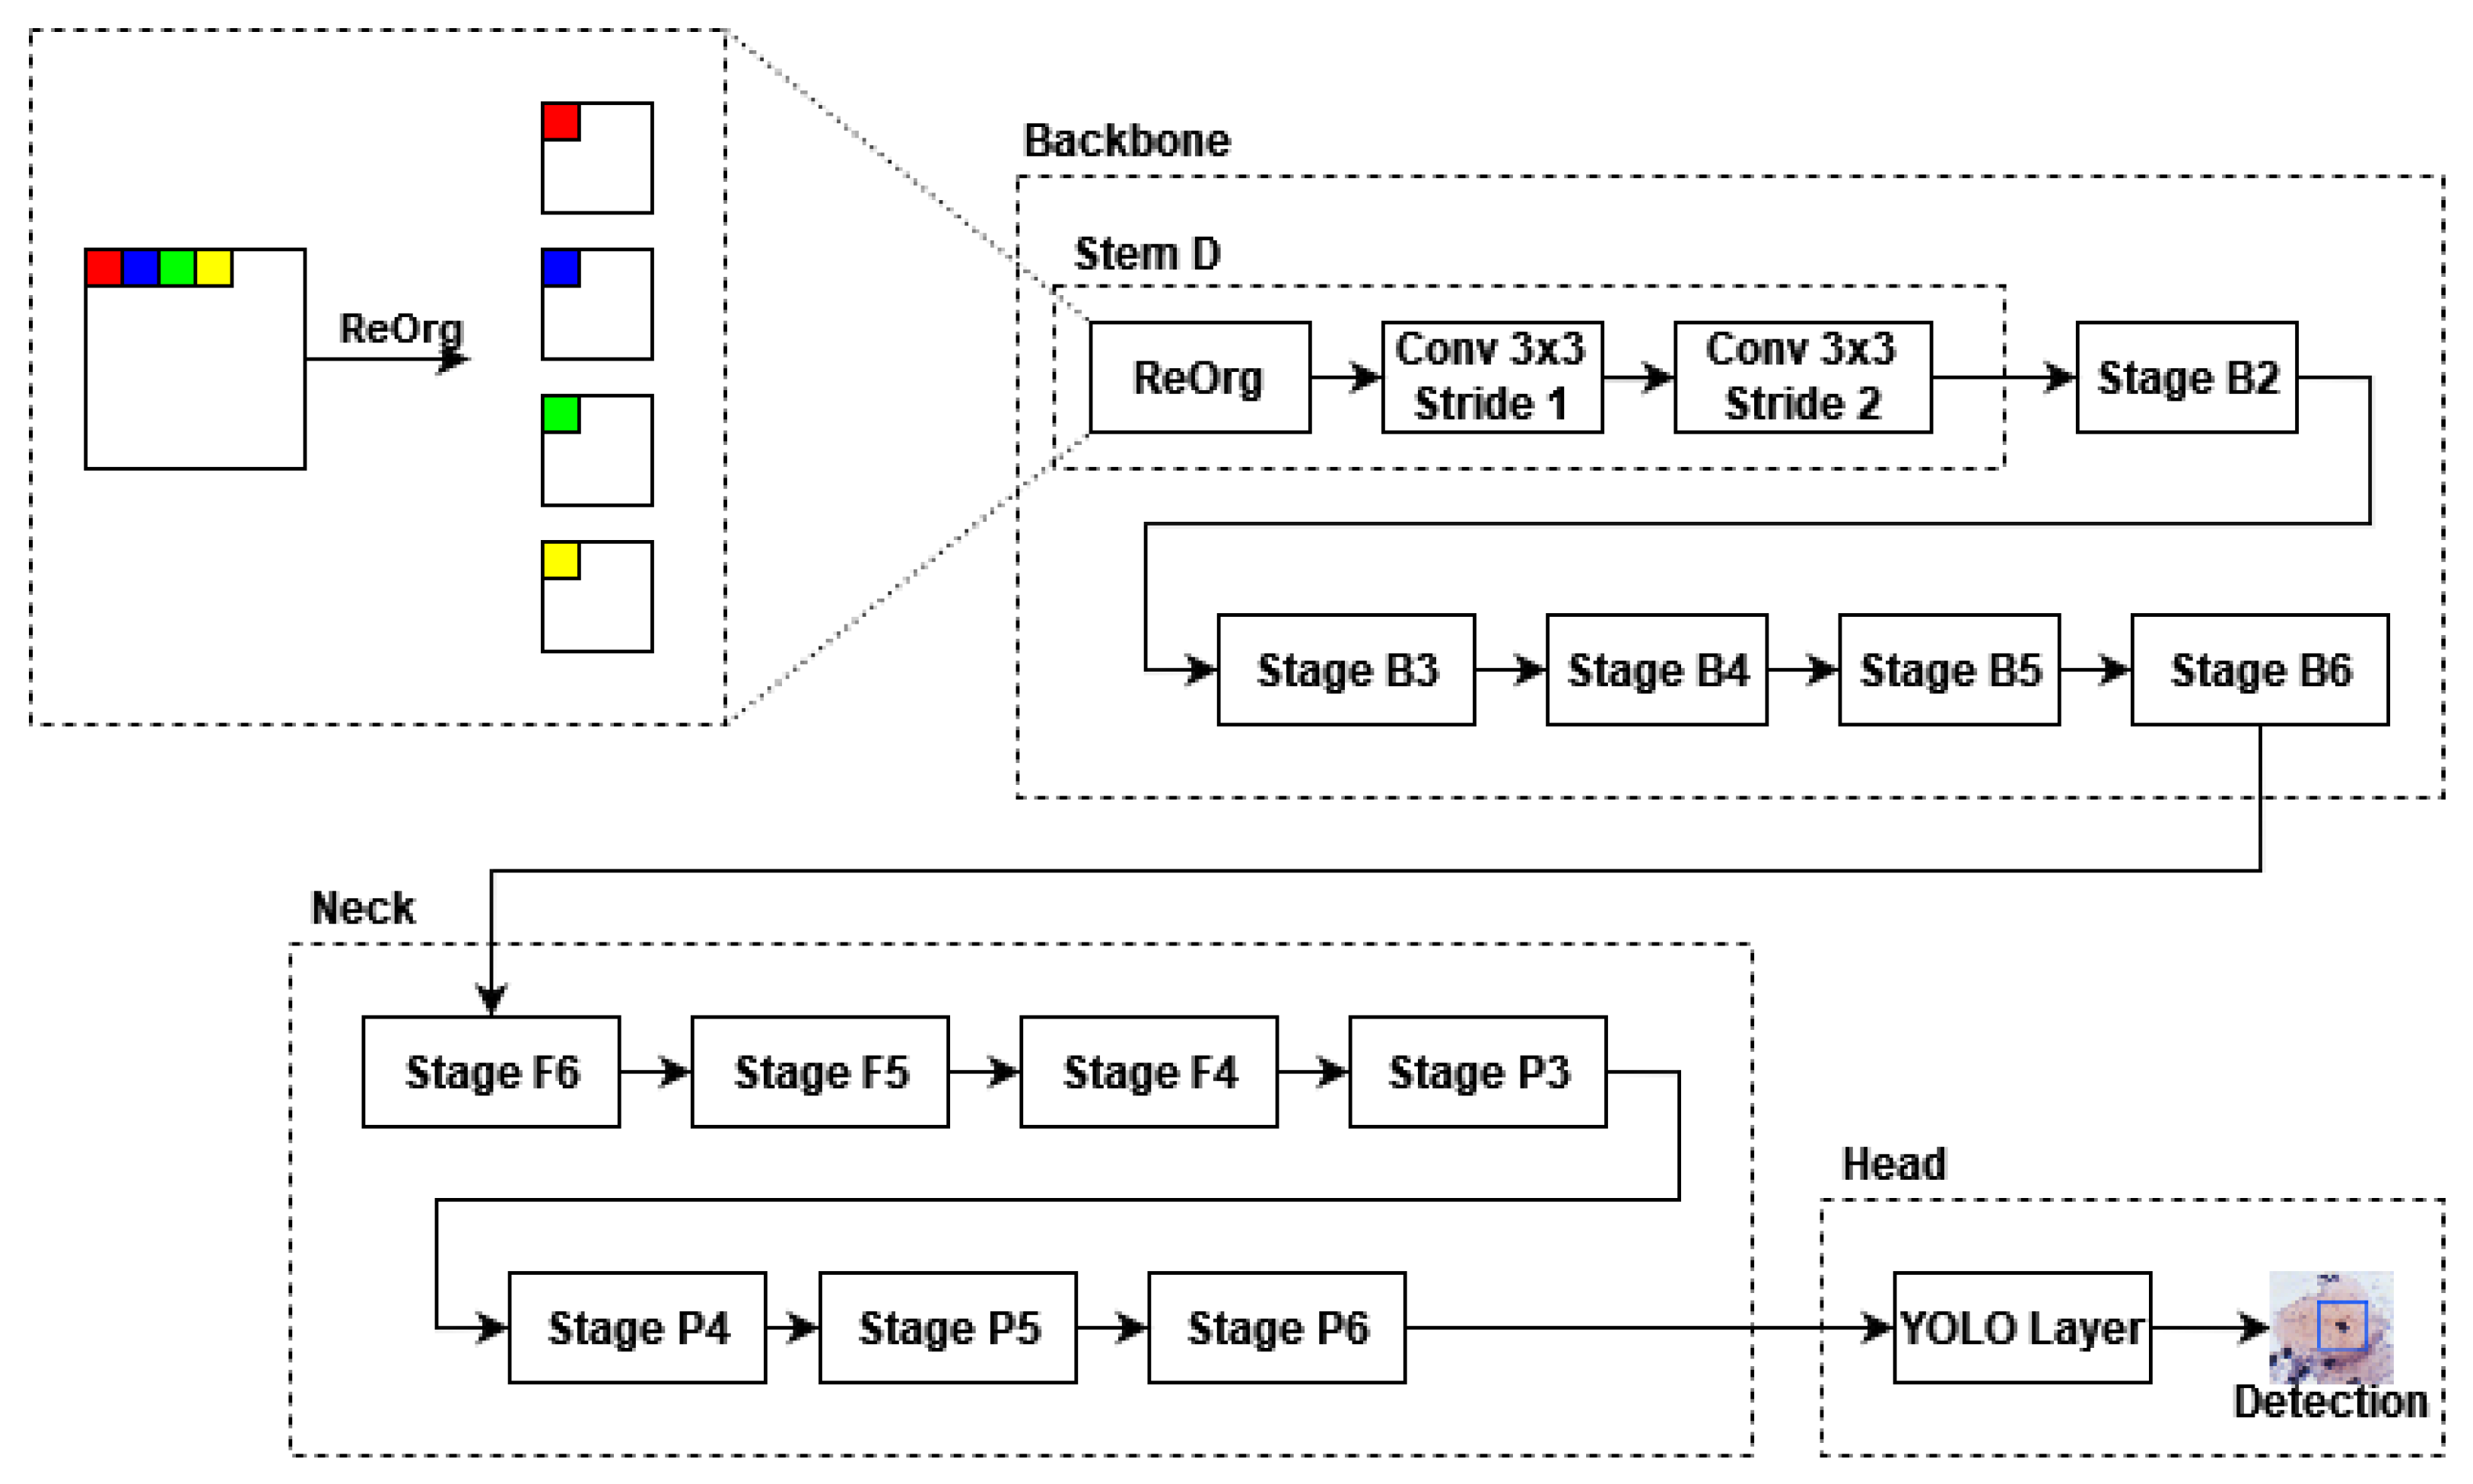
2.4. YOLOR Review
The YOLOR architecture is adapted from the YOLOv4 and works as an architecture to perform multiple tasks in a single execution. It combines the YOLOv4 architecture with the concepts of implicit and explicit knowledge in its execution [
31]. An overview of its architecture is presented in
Figure 1.
According to Wang et al. [
31]: (i) the backbone component is made by a focus layer (Stem D) followed by Stages B2, B3, B4, B5, and B6; (ii) YOLOR uses a CSP convolution as a down-sampling module in each stage to optimize the gradient propagation; (iii) the base channels and repeat number of the backbone layers are set to {128, 256, 384, 512, 640} and {3, 7, 7, 3, 3}, respectively; and, (iv) one difference between YOLOR and YOLOv4 is that YOLOv4 uses Mish as an activation function, while YOLOR uses SiLU.
3. Methodology
Our proposal applies a CNN to detect and classify regions of interest and presents the results to assist cytopathologists in interpreting cervical cells. We used neural networks based on the YOLO (You Only Look Once) [
32,
33] architecture, which presents excellent results and shorter times for training and inference. Furthermore, as YOLO considers the image as a whole, this also allows it to reduce the occurrence of background errors compared to other detection networks such as R-CNN and Fast R-CNN [
32].
This work uses YOLOv5 [
34] and YOLOR [
31] implementations, which present better inference times than other detection and classification networks [
35]. In addition, they present a more modularized way to run tests and detections using the architecture. These characteristics were crucial for choosing these networks as they allow easier integration into a tool.
This modularization of the YOLO architecture also allows using other classification algorithms to classify the detected objects. Based on that, this work also evaluated the combination of the YOLO detection and the classification proposed by Diniz et al. [
17], which obtained the best results for the database used.
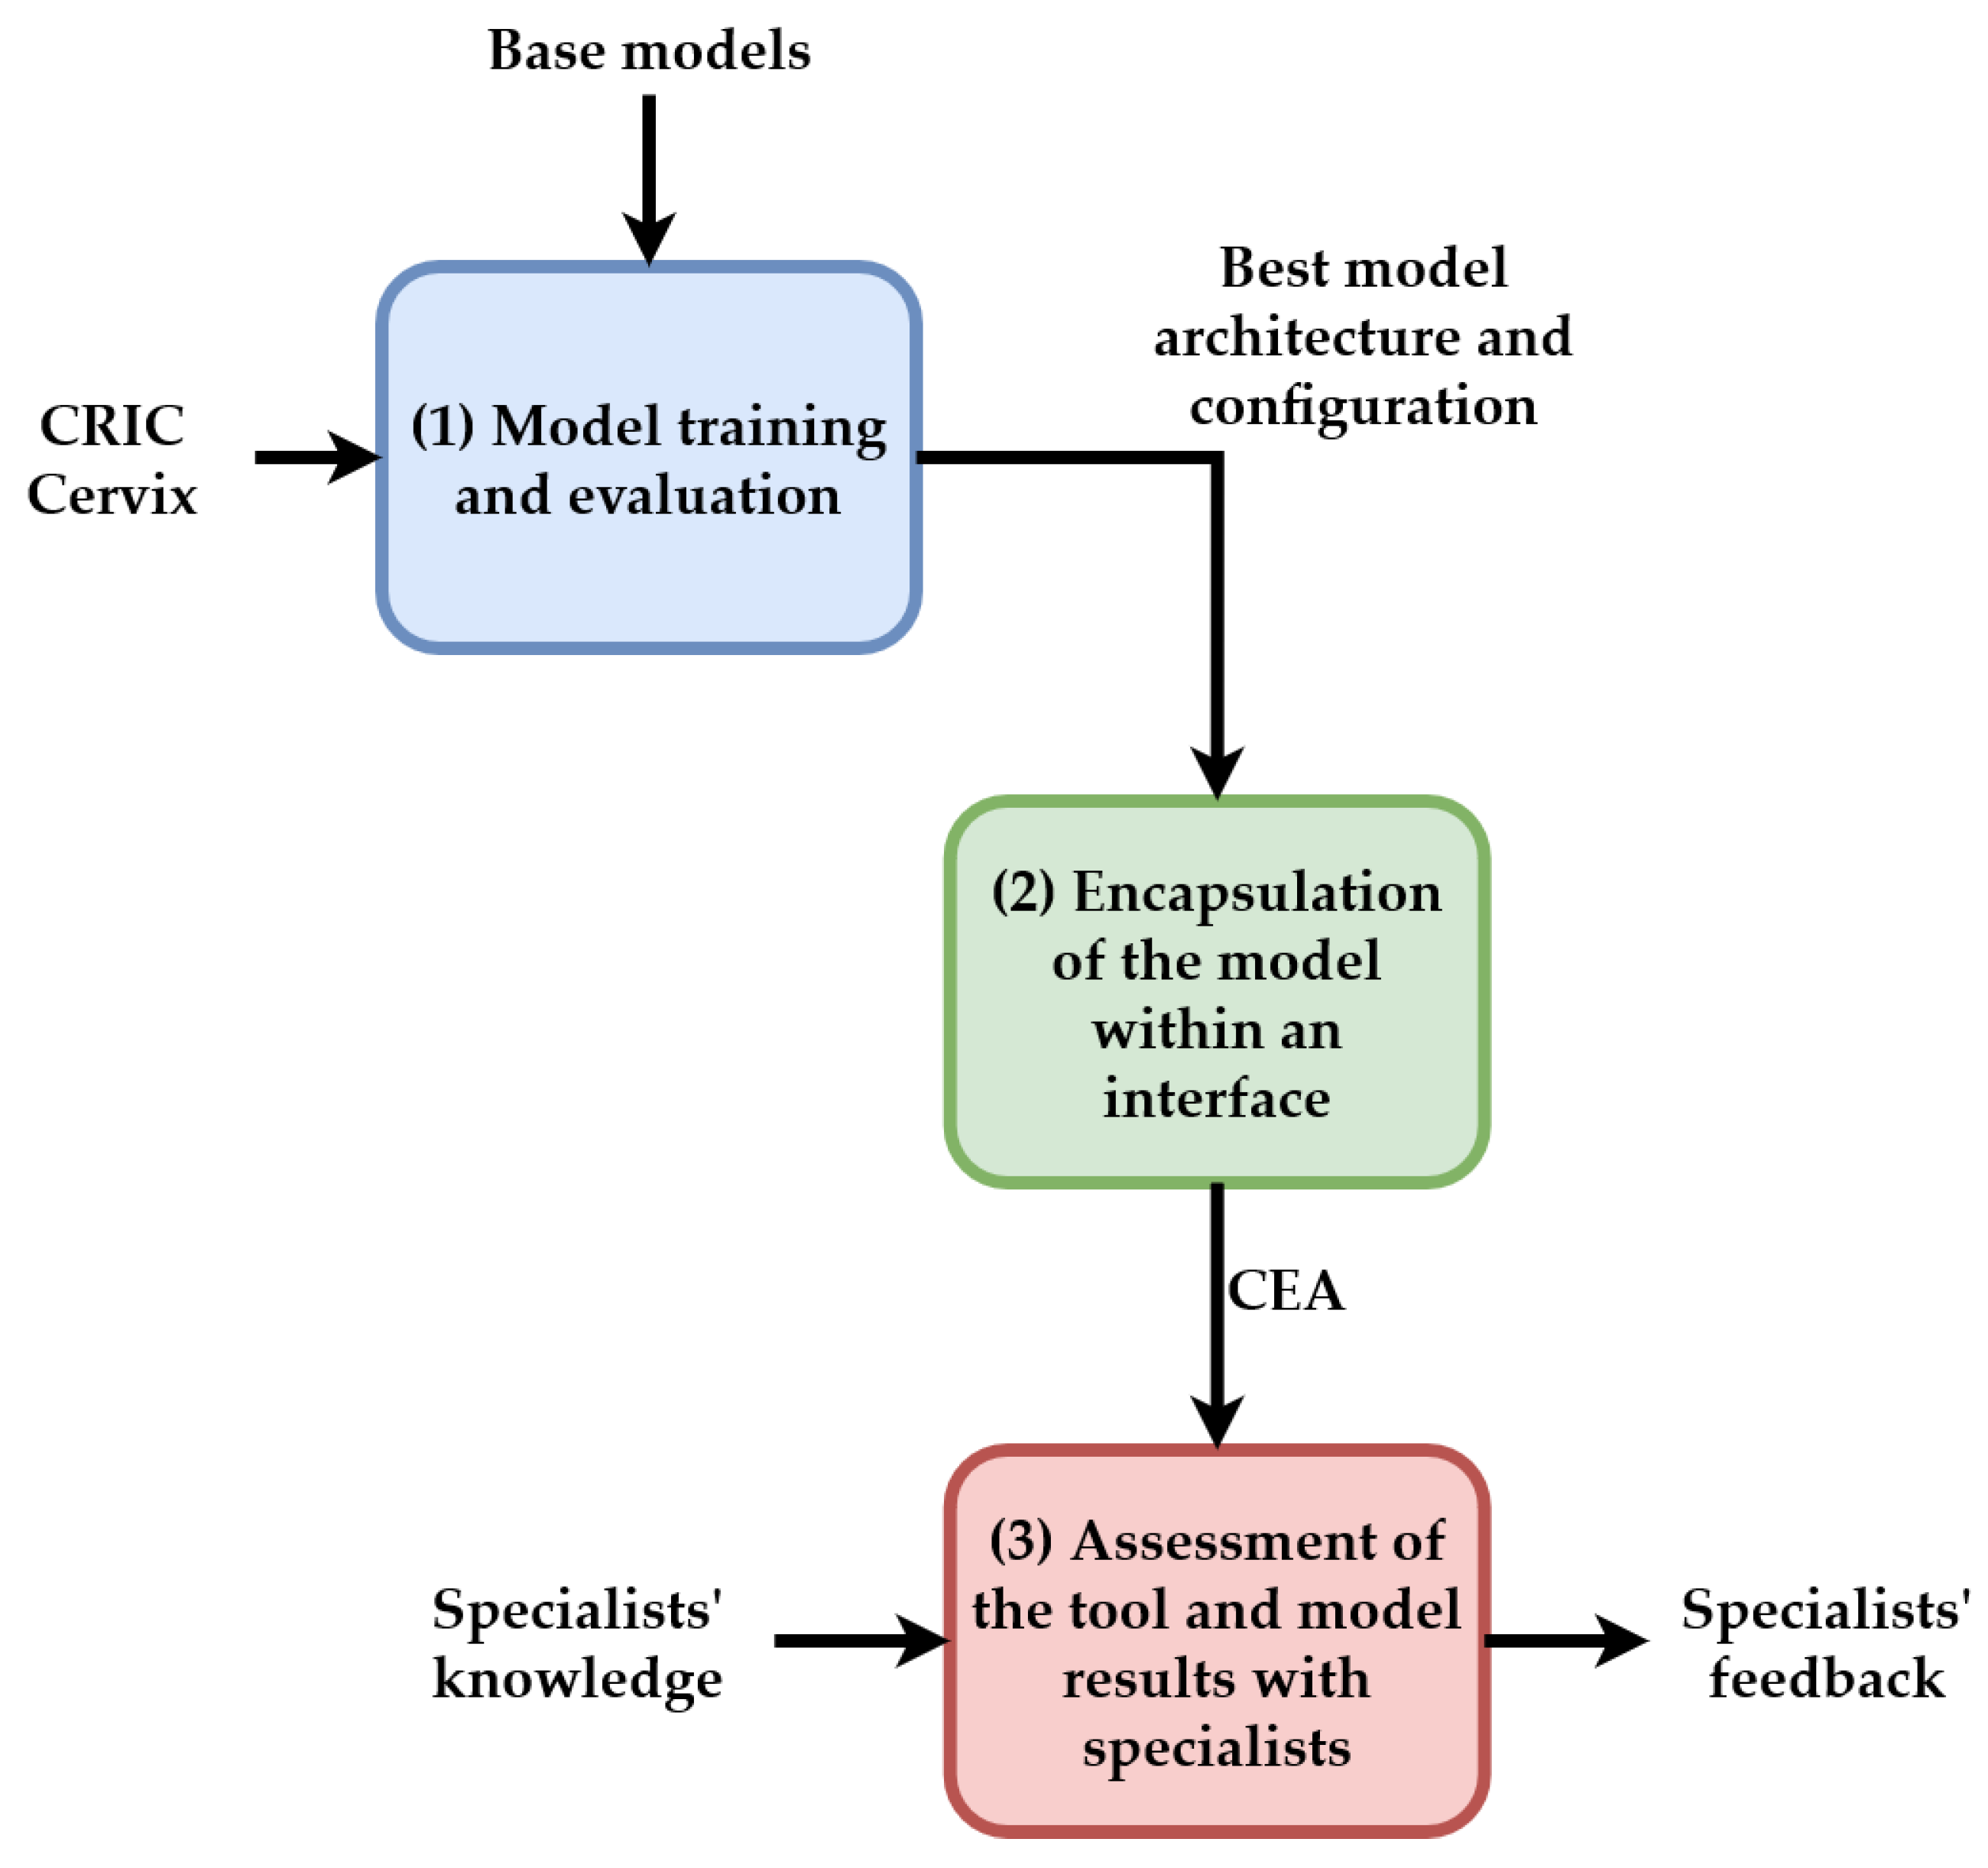
Figure 2 presents the general workflow of this proposal, which consists of three steps: (1) Model training and evaluation; (2) Encapsulation of the model within a software interface; and (3) Assessment of the tool and model results with specialists. In Step (1), we use the CRIC Cervix to train and evaluate base models previously selected. We show these models in
Section 4. This step is associated with our contributions A, B, and C. In Step (2), a tool named CEA was built with the best performance configuration obtained in Step (1) and is intended to offer the professionals the model results in a friendly and accessible interface. This step is associated with our contributions D and E. Finally, in Step (3), specialists evaluated the tool and provided feedback on its use.
4. Experiments
This section describes how our experiments were constructed and the results achieved.
4.1. Database
We tested the proposed method on the cervical cell classification collection available in the CRIC Searchable Image Database (
https://database.cric.com.br) (accessed on 1 November 2022), the CRIC Cervix [
36]. This collection contains 400 images from slides of the conventional smear (Pap smear) captured using conventional microscopy in a bright field with a 40× objective and a 10× eyepiece through a Zeiss AxioCam MRc digital camera coupled to a Zeiss AxioImager Z2 microscope with the Axio Vision Zeiss Software.
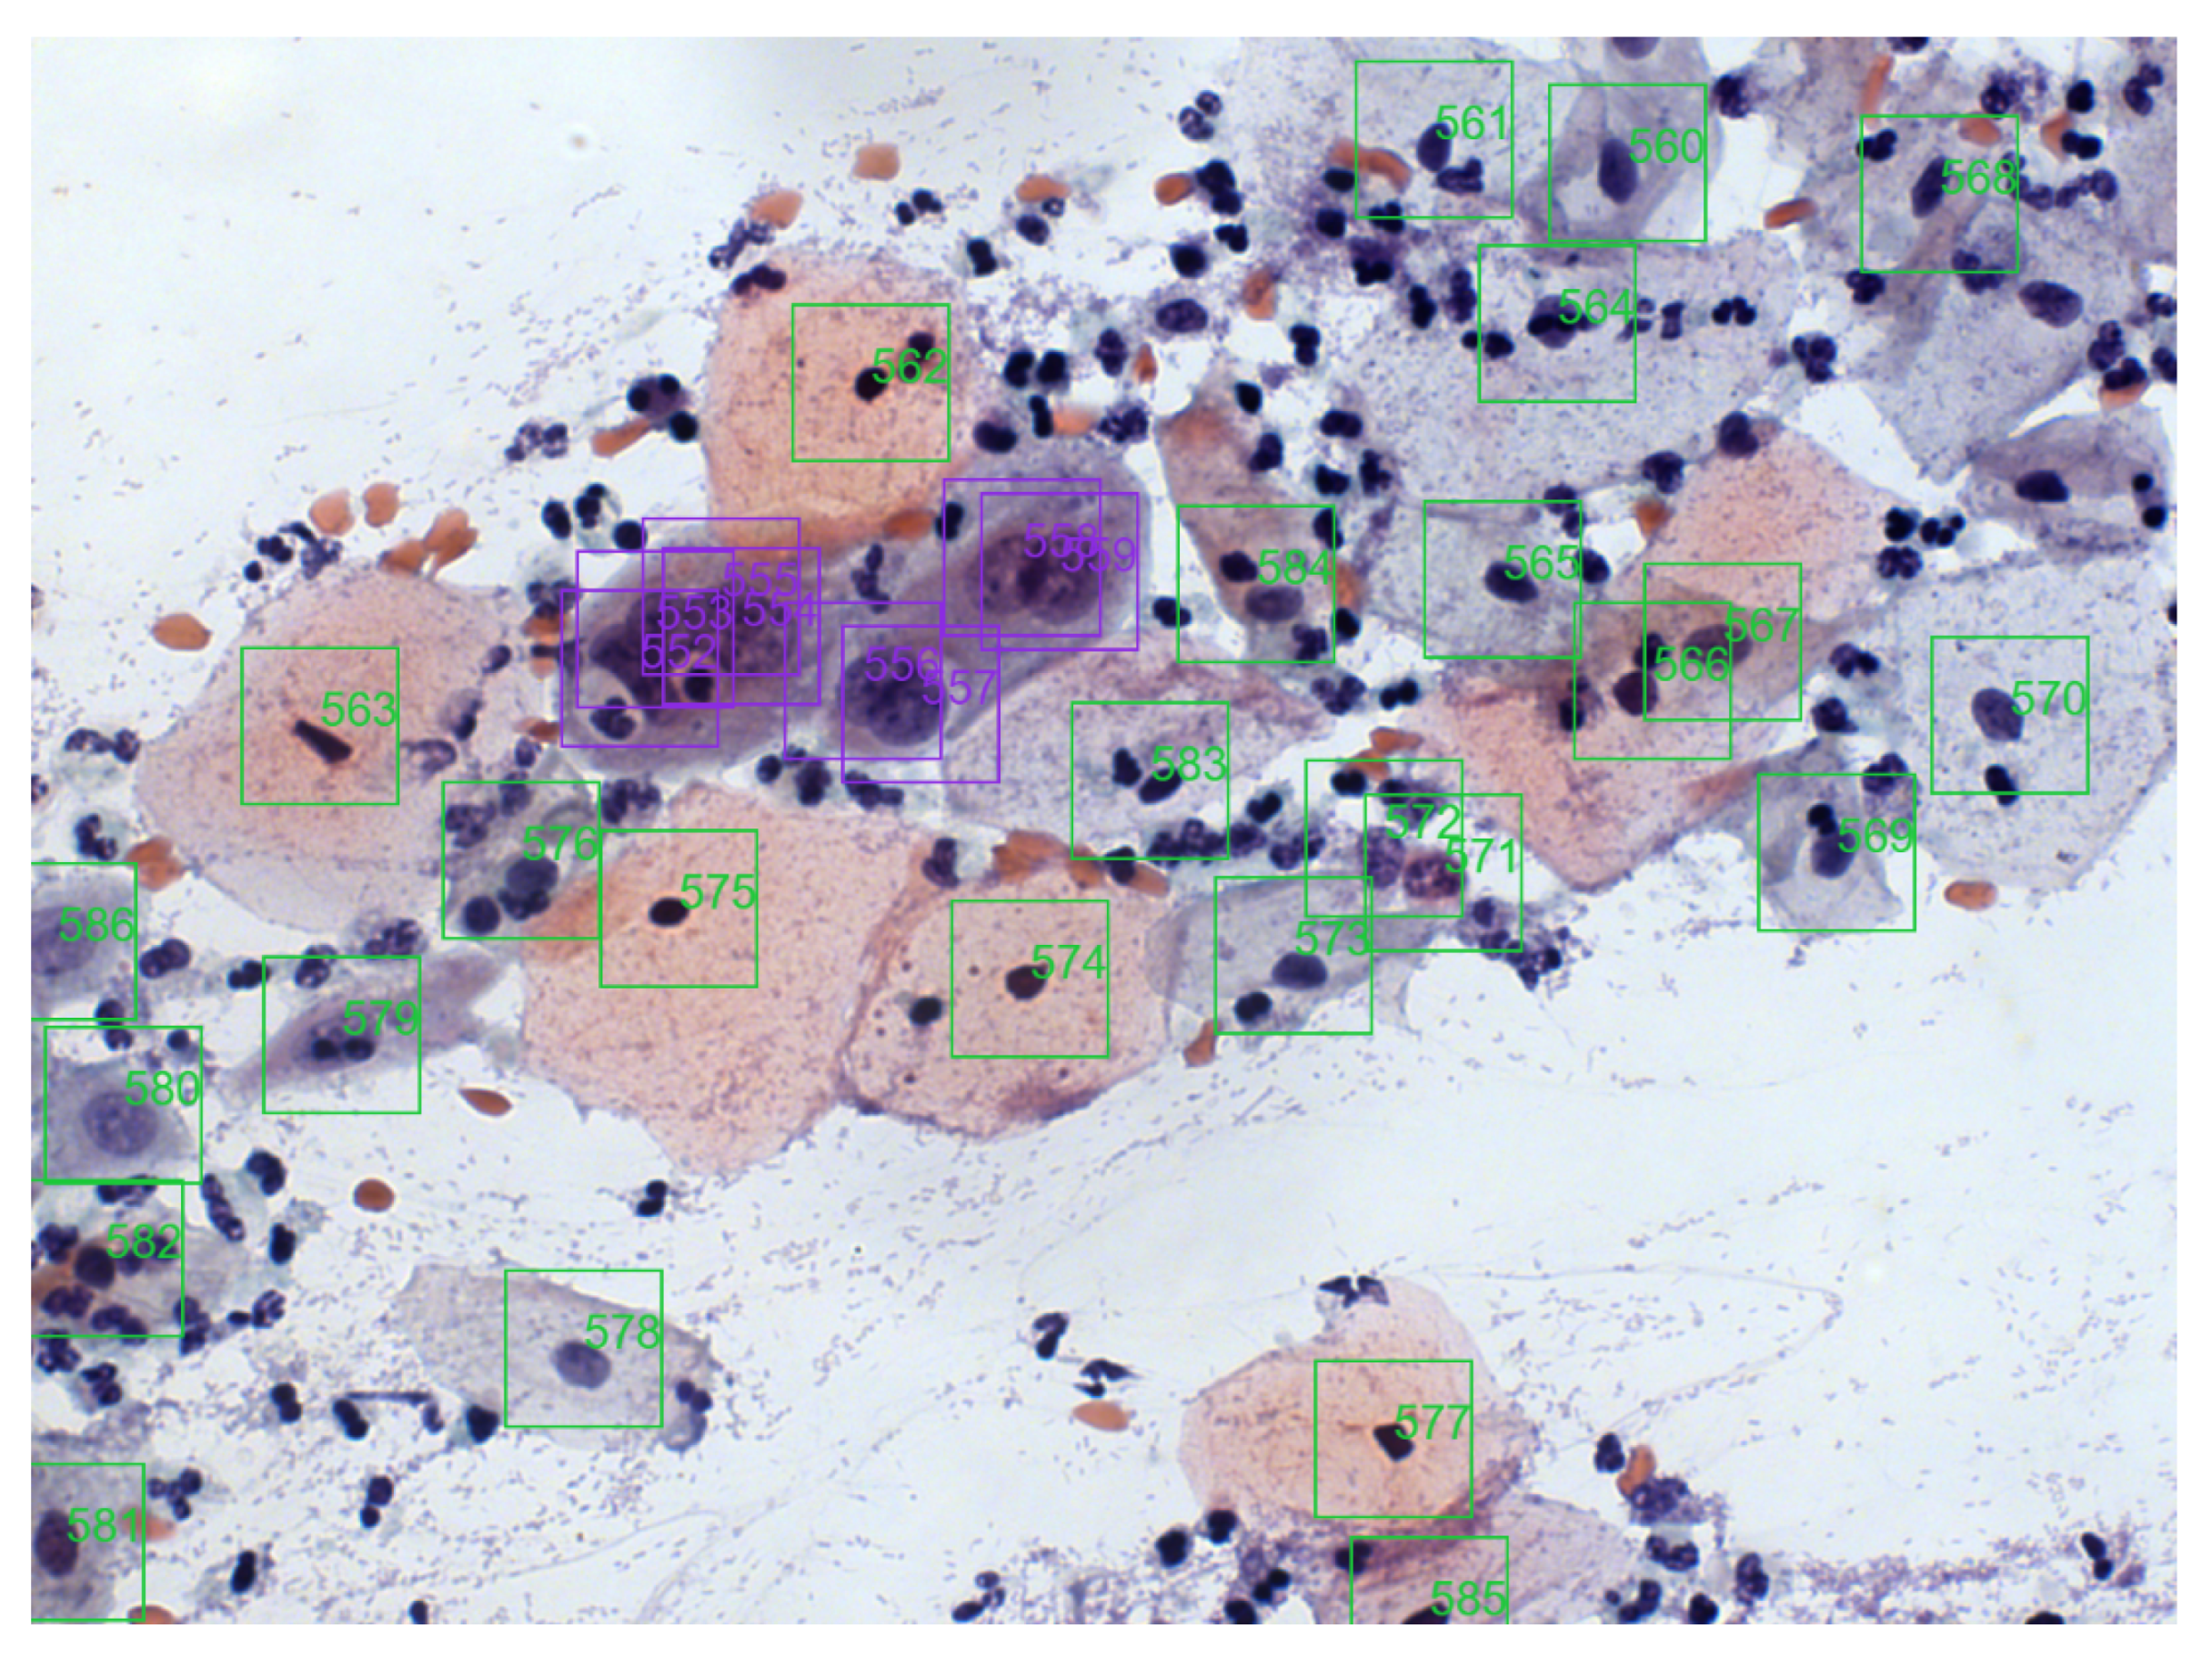
The collection images have a totality of 11,534 marks of their cells represented by bounding boxes of 100 px × 100 px. Four cytopathologists classified and revised each mark according to the Bethesda System nomenclature for cell lesions, labeled as Negative for Intraepithelial Lesion or Malignancy (NILM), Atypical Squamous Cells of Undetermined Significance (ASC-US), Low-grade Squamous Intraepithelial Lesion (LSIL), Atypical Squamous Cells, cannot exclude HSIL (ASC-H), High-grade Squamous Intraepithelial Lesion (HSIL), and Squamous Carcinoma (SCC). NILM labels correspond to normal cells, and the others (ASC-US, LSIL, ASC-H, HSIL, and SCC) correspond to lesioned cells (distinct grades).
Figure 3 shows an image sample from the cervical cell classification collection, where colored boxes represent different lesions. A more detailed database description may be found in [
36].
4.2. Database Manipulations
For the image’s configuration, we considered: the original format of the images, resizing the images to 561 px × 451 px, and the generation of new images for training using augmentation strategies and balancing classes.
We utilized an undersampling method for balancing the database. That method removed images that contained many samples of the negative class to balance the number of examples for training.
The augmentation was implemented using Python’s Clodsa library [
37]. We used the horizontal, vertical, and vertical–horizontal flips, average blurring (
parameter equals 5), and raised hue (
parameter as 0.9).
With these image manipulations, the new database with the resized images had the same size as the original database, with 400 images. Simultaneously, the database with resized images and augmentation comprised 1800 images, and the database with resized images and balanced classes comprised 332 images.
4.3. Metrics
We apply precision, recall, and mAP (mean average precision) metrics to evaluate the proposed solution using CNN. Precision (see Equation (
1)) measures the model’s ability to detect altered cells only in lesioned slides; recall (see Equation (
2)) measures the model’s ability to detect altered cells; mAP (see Equation (
3)) measures the model’s performance in detecting and retrieving information in the images. These metrics are typically used in object detection and classification scenarios.
In these equations, , , , and represent the number of true positives, false positives, false negatives, and the number of classes, respectively.
4.4. Development and Test Environment
We used a computer with an Intel Core i7-9700F processor with a GPU GeForce RTX 2080 and 16 GB of RAM in a Windows 64-bit system to perform the experiments. Algorithms were written in Python and leveraged the PyTorch framework, versions 3.7.9 and 1.7, respectively.
We split the database into training, testing, and validation sets. The distribution of each database setup is shown in
Table 2. We also performed a 10-fold evaluation as suggested by Dhurandhar et al. [
38]. All results are the average obtained by cross-validation.
4.5. Configuration and Evaluation of the YOLO Models
In the first four columns of
Table 3, we present the combinations between the base model, the image configuration, and the model’s fitness formula used in our experiments. The models considered were the small (
s), medium (
m), large (
l), and extra-large (
x) YOLOv5 configurations and the YOLOR-P6 model.
We use pre-trained networks, which means that the networks used have been previously trained on a large dataset. The advantage of this pre-training is the improvement of the model’s capability to extract basic features. This happened because, in CNNs, the features are more generic in the early layers and more specific to the treated problem in the last layers [
39]. Therefore, it is possible to fine-tune a generic network on a smaller dataset of the target domain using transfer learning. So, the YOLOv5 was pre-trained with the ImageNet [
40] database and the YOLOR with MS COCO [
41] database.
For the fitness formula, we considered: the default formula (“Default” in
Table 3) that combines
[email protected] and
[email protected]:0.95; a variation that considers equal weights for all metrics (“Equal” in
Table 3), therefore no priority in metrics; and a variation prioritizing the recall (“Recall” in
Table 3), since this metric is the most important for the problem addressed as it measures the amount of lesioned cells that were classified as normal.
The networks were trained with the following hyperparameters: learning rate of 0.01, momentum of 0.937, weight_decay of 0.0005, and IoU threshold (in training) of 0.2 and considering rectangular bounding boxes. An IoU threshold of 0.45 and a confidence threshold of 0.25 were considered for the evaluation. Values for these parameters are from the default network configuration.
In addition, the highest possible value was used for the batch, which is limited by the model size in the GPU memory. We also emphasize that not all combinations could be tested due to memory constraints.
The last four columns of
Table 3 summarize our results ordered by the F1-score metric. The best result for each metric is highlighted in bold. Each model was trained for 200 epochs. The best result, considering the F1-score metric for the evaluated combinations (see
Table 3), was obtained by the YOLOv5s model with the original image and the model’s default fitness. Under these conditions, the recall was 0.777 for the test set. However, the best recall value obtained among the evaluated combinations was 0.884. This result was achieved through the YOLOR model using recall as the only metric in the model’s fitness. In contrast, when performing this prioritization, there was a sharp loss of precision.
The same observation holds for precision. The model with the best F1-score metric has a precision of 0.736, while the best precision found was 0.767. However, this increase in accuracy resulted in a loss in the recall. When considering the F1-score, the result of the YOLOv5s model was better than those obtained by the YOLOv5l model. As previously stated, recall is more important for the considered problem, mainly because, in an actual scenario, the tool detections would go through the validation of a professional. The false positives that influenced the accuracy value would be easily excluded by the professional.
It is also important to emphasize that the resized image allows larger models (due to memory allocation). However, the use of these models did not lead to better results. Looking at
Table 3, we can see that the configurations
m,
l, and
x of the YOLOv5 model were better than those of the configuration
s for the resized images. However, the best result was obtained with the images in the original size. Thus, the benefit of resizing the images is restricted to reducing the model training time and the necessary memory allocation.
4.6. Comparison between Different Classification Algorithms
Considering only the nuclei classification of the CRIC Database images, we found that in the literature, the best result was achieved by Diniz et al. [
17]. In their work, the authors proposed an ensemble of EfficientNets to perform the classification. Thus, we analyzed if using this ensemble as a classifier of the objects detected by YOLO improves its results. We also investigate each EfficientNet that composes the ensemble method as a classifier.
Table 4 reports the obtained results of this investigation. As
Table 3, the results are ordered by the F1-score metric, and the best ones are highlighted in bold.
As we can see in
Table 4, performing nuclei detection using YOLOv5s and the classification using the ensemble proposed by Diniz et al. [
17], there was an improvement in recall (from 0.777 to 0.906) and F1-score (from 0.756 to 0.805). Precision dropped from 0.736 to 0.726, and AUC dropped from 0.825 to 0.816.
4.7. Whole Image Classification
We also evaluate the whole image classification; that is, if at least one nucleus of the image is classified as lesioned, the image is also classified as lesioned. On the other hand, if all nuclei are classified as normal, the image is also considered normal. This evaluation corresponds to an image classification as a whole, similar to how professionals do their daily work. So, we performed and evaluated the whole image classification for the best approaches presented in
Section 4.5 and
Section 4.6: the YOLOv5s performing the classification and detection of the nuclei; and the combination of the YOLOv5s for the detection and the EfficientNets ensemble for the classification.
Table 5 presents the results (ordered by F1-score with the best ones highlighted in bold) for this general image evaluation. Using YOLOv5s for detecting and classifying nuclei, it achieved the best precision and F1-score results. Its recall was lower than the other approach, but it remained high. For the AUC metric, both scenarios obtained unsatisfactory results. However, this may have been caused by the distribution of samples of each class in the test set. When we modify the problem to classify the image as a whole, we have very few samples of entirely negative images. This limitation is due to the database that was planned for classifying lesioned nuclei in an image since images containing only non-lesioned nuclei are underinvestigated.
4.8. Literature Comparison
Carrying out a comparison with the results obtained by Diniz et al. [
17] is not feasible because the authors only dealt with the classification task, and the results obtained in our work carry the error from both detection and classification tasks. When writing this work, we did not find any work in the literature that detected and classified nuclei in the CRIC Cervix database.
Xiang et al. [
22] presented a similar approach for this situation, obtaining an mAP of 0.634 and a recall of 0.975 in the whole image analysis. Our results of mAP of 0.806 and recall of 0.992 were superior to theirs, but it is important to note that the bases used in these two studies differ. It is worth emphasizing that Xiang et al. [
22] used liquid-based cytology images, which means that the collected cells were pre-processed to improve their spatial distribution leading to an easier problem than the one we approach in this work.
5. CEA: Cytopathologist Eye Assistant
We developed the Cytopathologist Eye Assistant (CEA) using Python’s Kivy library (
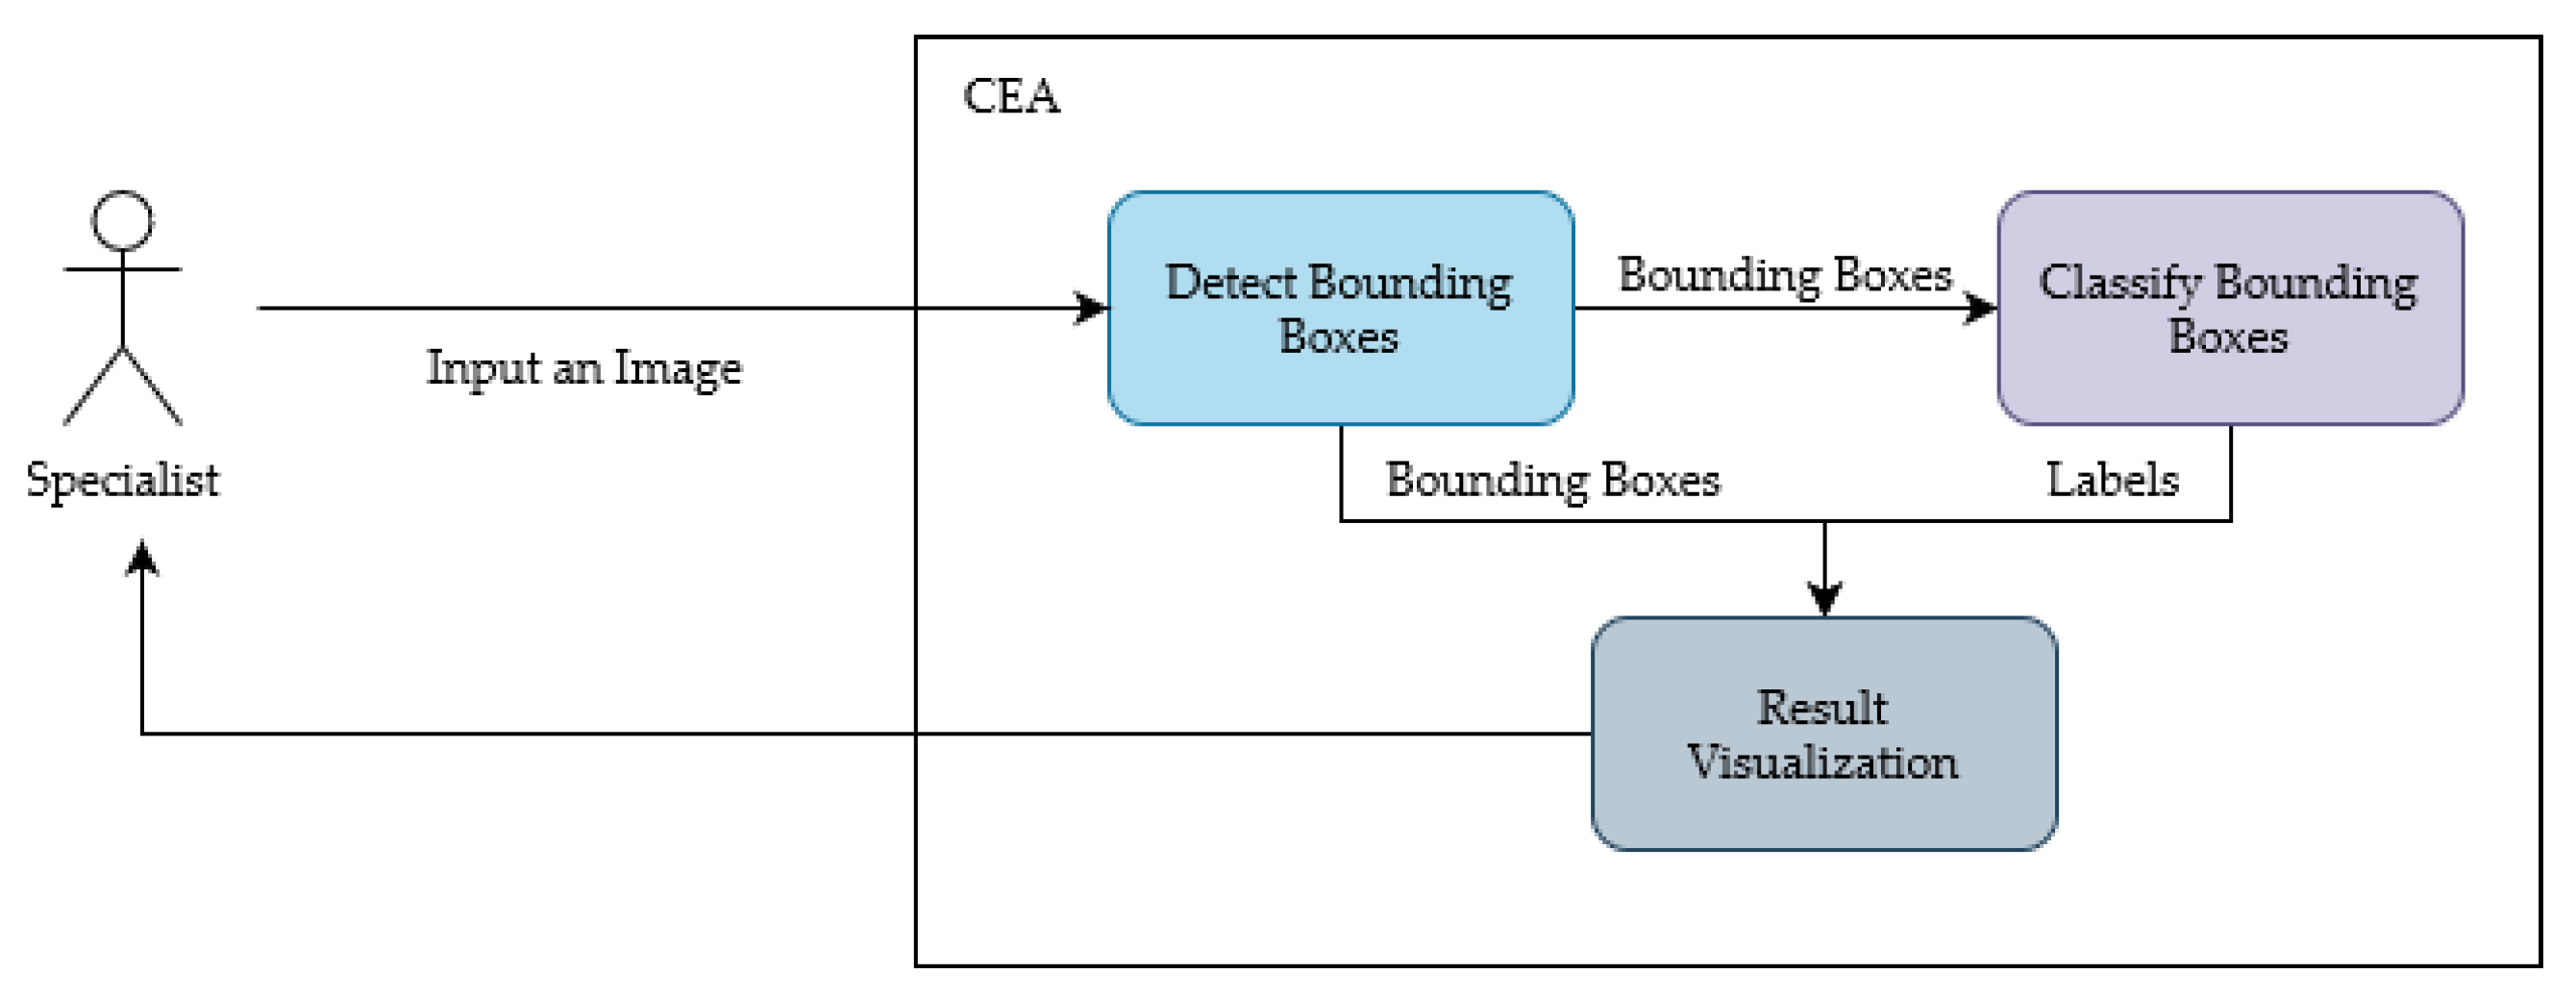
https://kivy.org) (accessed on 1 November 2022). The idea of the tool is to assist the cytopathologist in diagnosing cervical cancer using images obtained from the Pap smear. In general, the CEA follows the interaction displayed in
Figure 4, in which a specialist inputs an image for the system, and a detection algorithm processes this image. The results of the detection are the input for a classification algorithm. In the end, both results are combined and shown for the specialist in the CEA interface. In addition, the detection and classification models can be changed without impacting the general interaction flow of the tool; however, the models need to accept an image as input and provide bounding boxes and labels as output.
For implementation, we have used the YOLO model with the best result configuration obtained in this work. This model was selected because YOLO and the ensemble approach have similar results for the whole image classification (
Table 5). However, YOLO has the detection and classification unified in a single process improving the tool processing time.
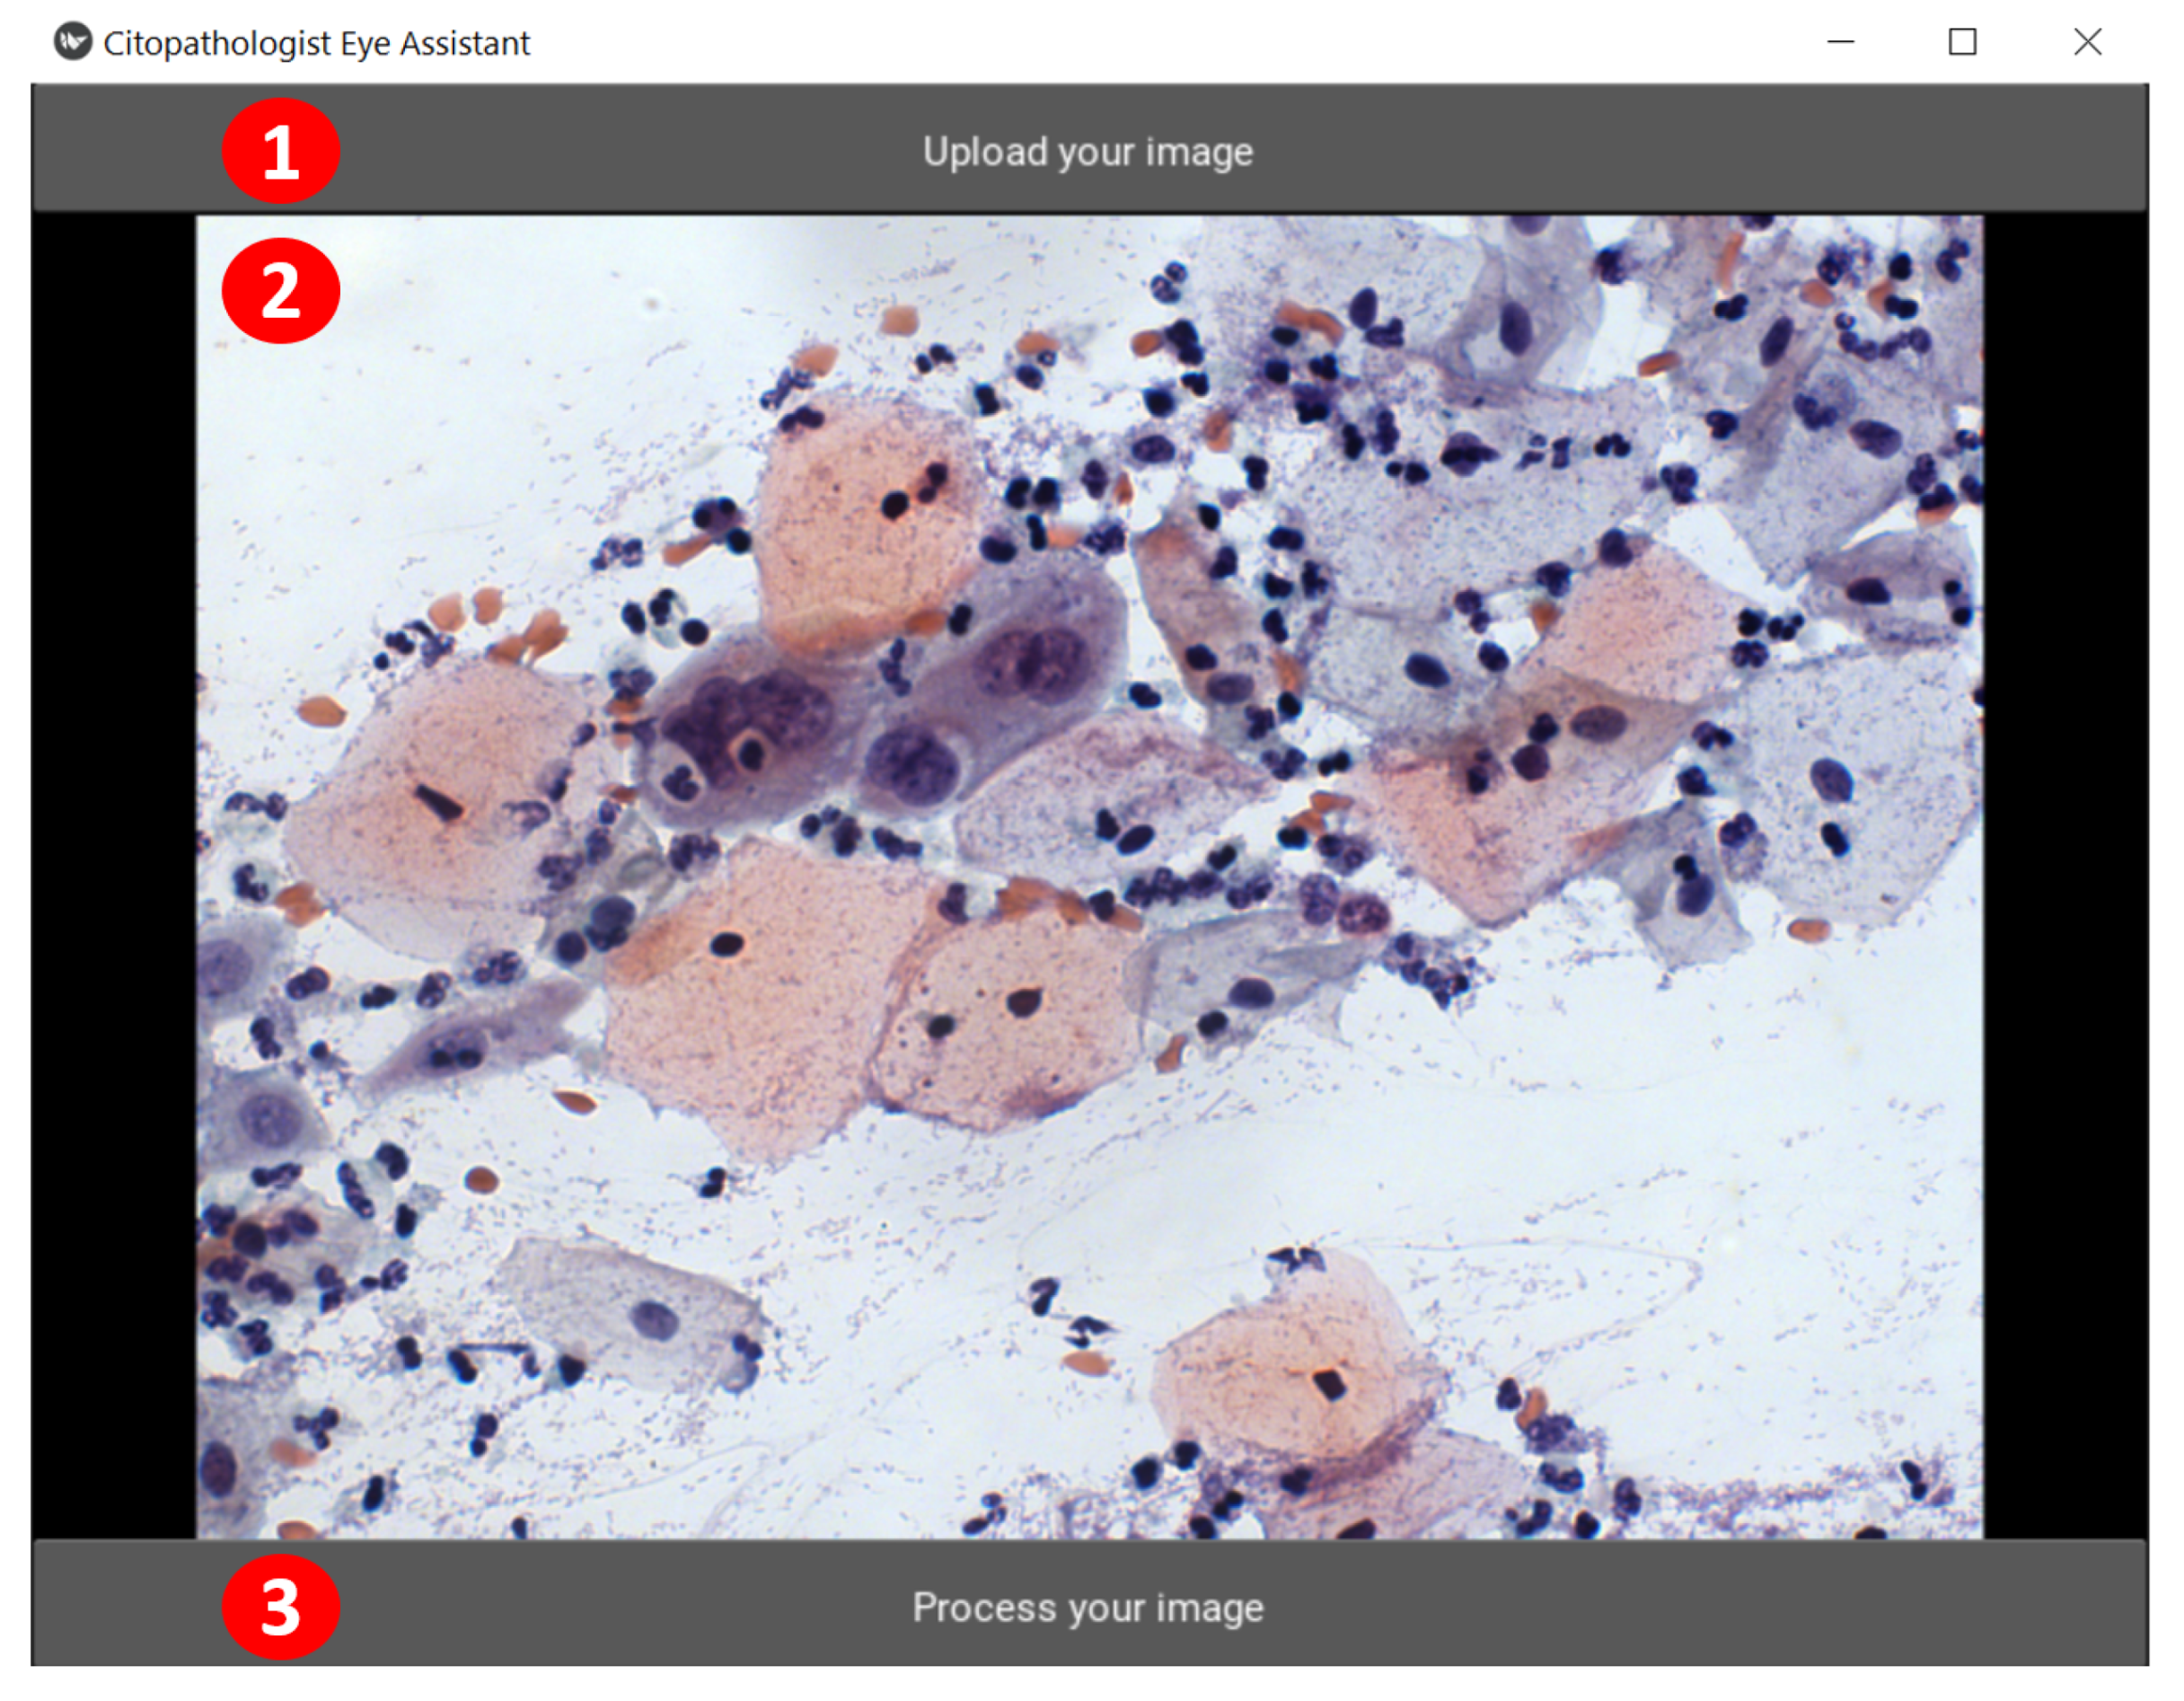
The CEA interface is presented in
Figure 5 and
Figure 6. Its functionalities are highlighted through numbered red circles. In
Figure 5, the user clicks on the “Upload your image” button to select the image to have its cells detected and classified (see red circle 1). CEA shows the chosen image below (see red circle 2), and the user can send the selected image for processing (by clicking on the “Process your image” button, see red circle 3) or can select another one (in red circle 1).
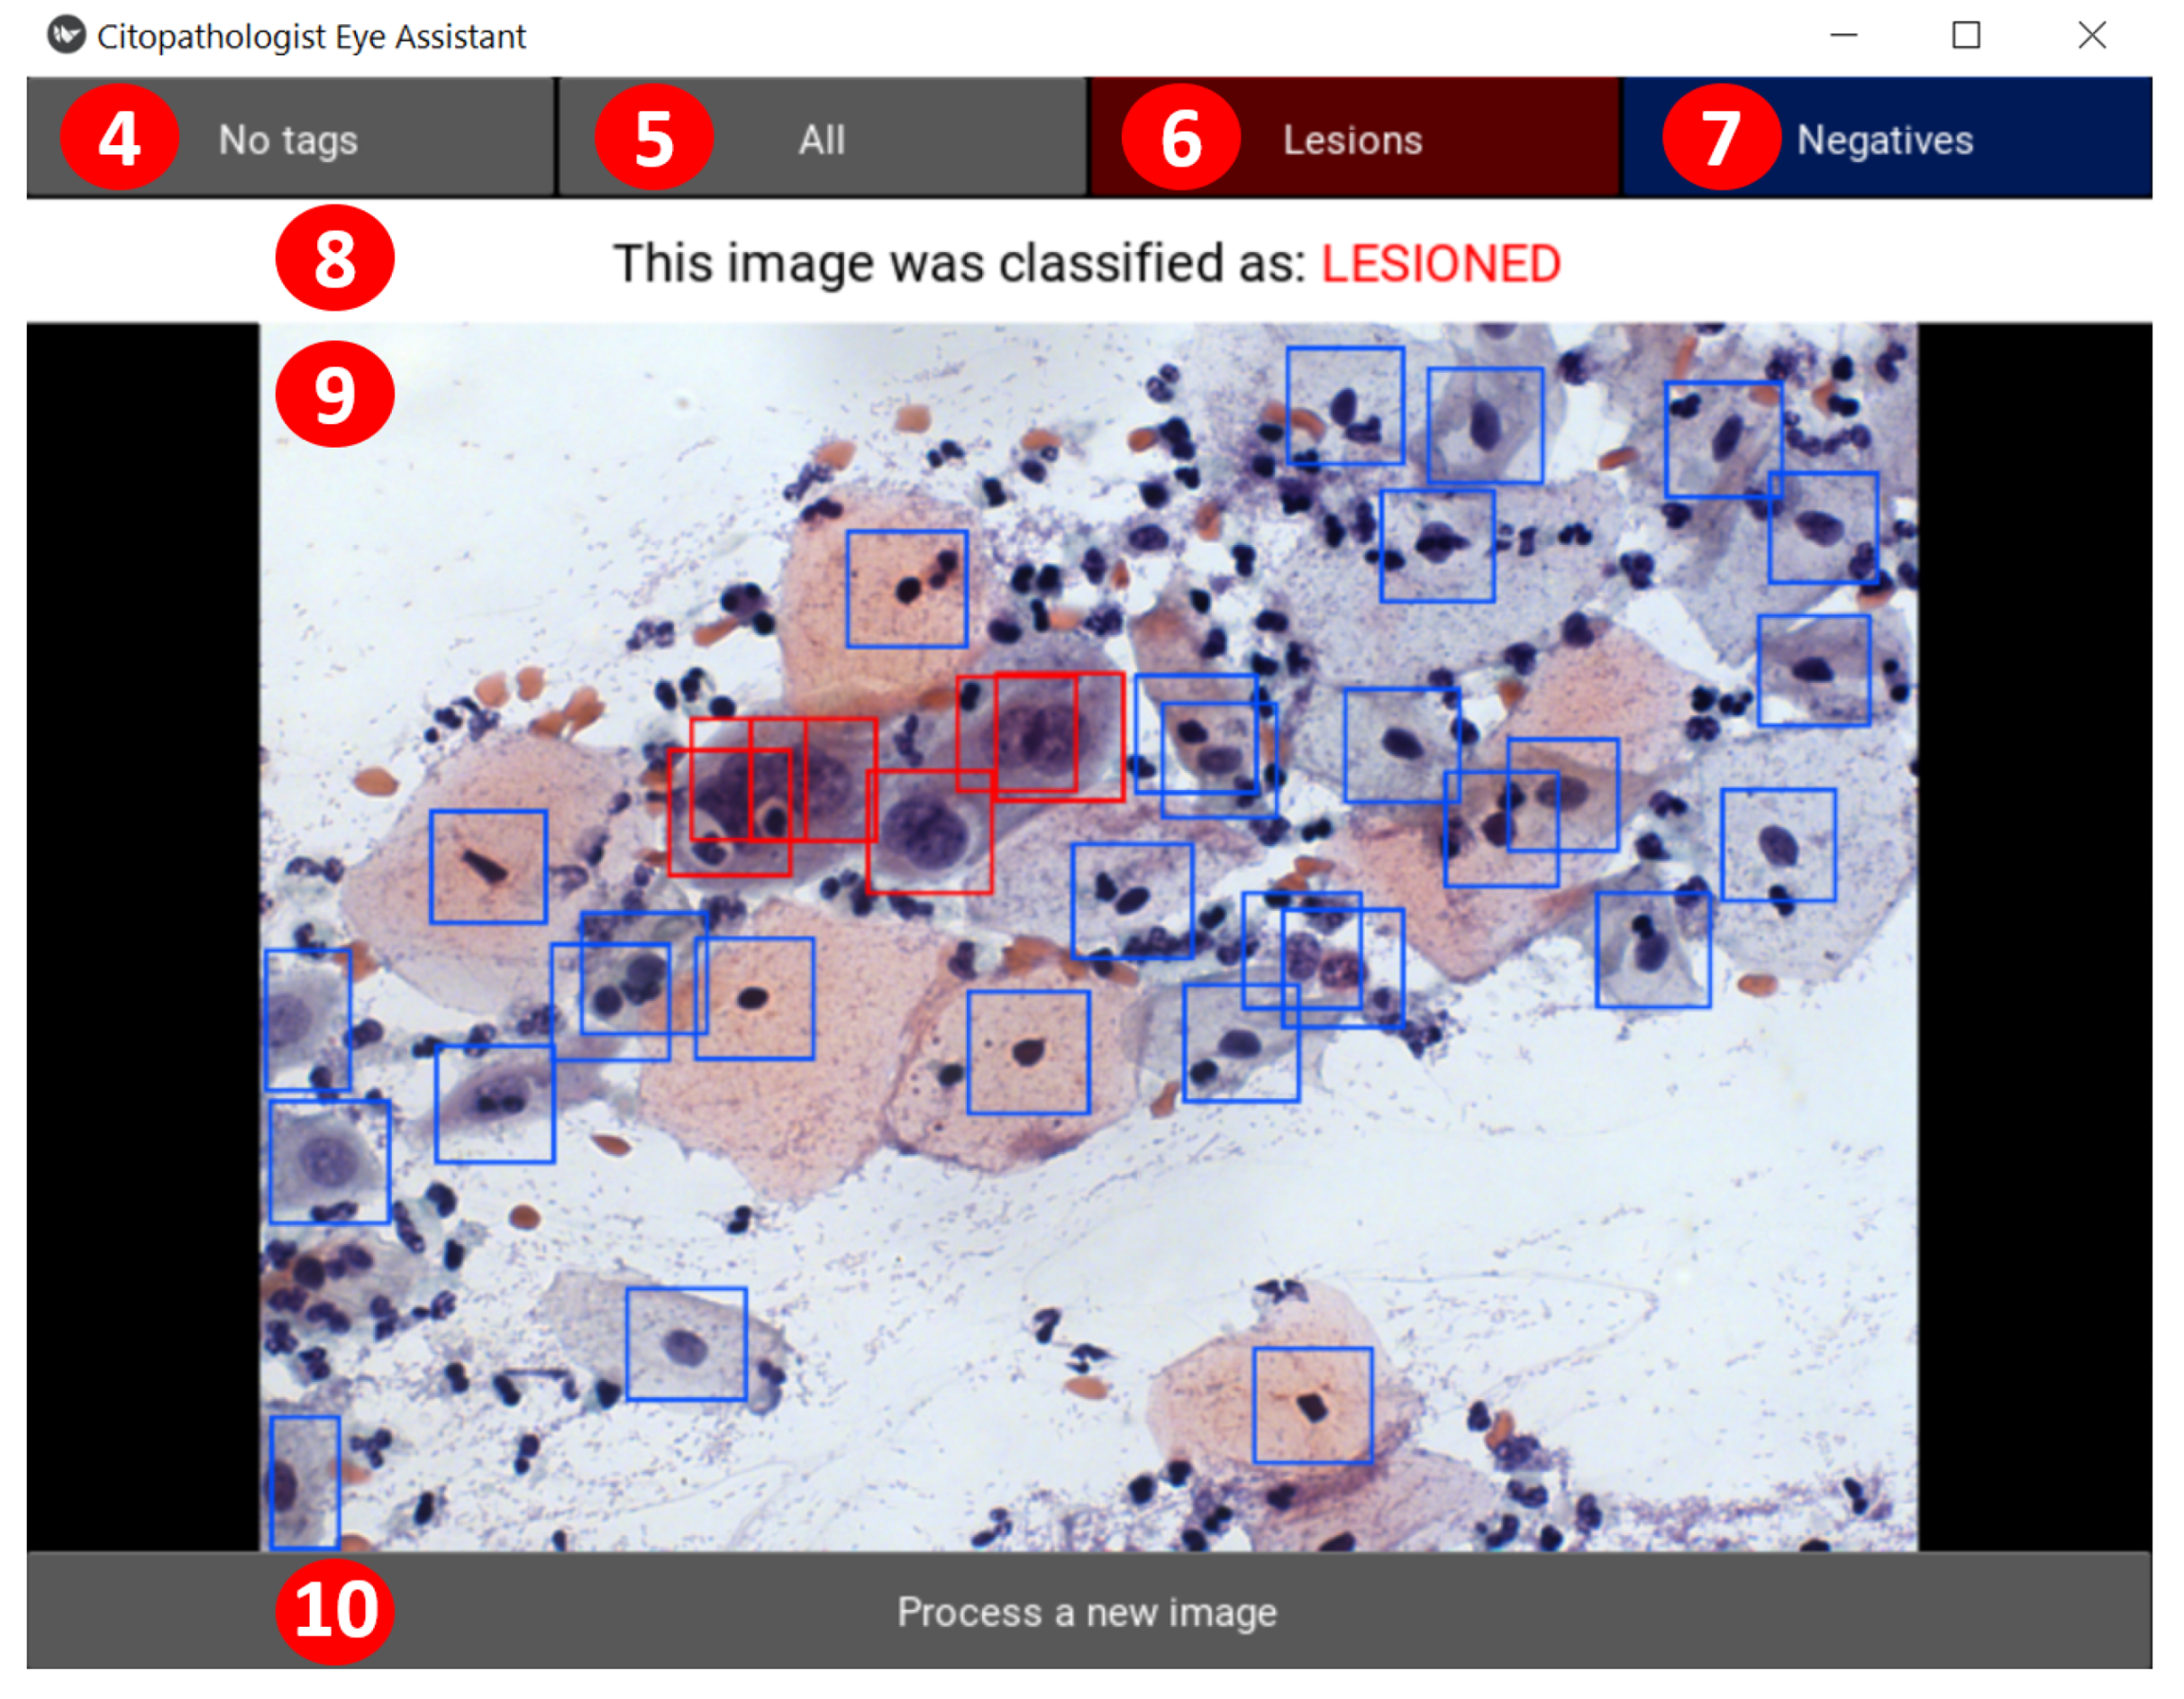
After the image processing step, the application presents the second screen, shown in
Figure 6. CEA displays the resulting image at the position highlighted by the red circle 9. If the user wants to view the original image, he can click on the “no tags” button (see red circle 4). The “all” button (see red circle 5) displays the user-submitted image with all tags found. The user can also select only lesioned cells marked (see red circle 6) or only negative cells marked (see red circle 7). In the position highlighted by red circle 8, the user will see the overall automatic classification of the image. Finally, in the “Process a new image” button (see red circle 10), the user can choose a new image for classification, returning to the first screen shown in
Figure 5.
5.1. CEA Validation Procedure
We designed a validation procedure to analyze the use of CEA and what specialists think about its applicability, possible improvements, or unnecessary functionalities.
The procedure was performed with three authors with 7, 12, and 24 years of experience in cytopathology. Moreover, for this evaluation, they were not aware of the construction of the tool or its characteristics.
Initially, the users (the authors performing the process) were asked to use the tool to classify four images. They have not received any prior instructions on how to use the tool. Then, the users were informed of the effect of “no tags”, “all”, “lesions”, and “negatives” buttons and notified that they could use them to assist their analysis. After that, the users classify another four images using CEA. In each image, the users answered if they agreed with the image’s overall classification and if the tags helped them in the analysis.
We gathered the images used for testing from the model’s test set. We separated the images from the model’s test set into four groups: only lesioned images, only negative images, images with few markings, and images with many markings and overlaps. We defined these groups because they represent the primary cases of application use in a more generic way. Thus, we randomly selected two images from each of these four groups for testing with users, totaling eight images.
After interacting with CEA, participants filled out a questionnaire in which they were asked if they thought the buttons helped them and if they thought the tool contributed to the image analysis. In addition, they evaluated the ease of use and learning, intuitiveness, and response time of the tool on a five-point Likert scale (1 as strongly disagree and 5 as strongly agree) based on their experience with the tool during the test. Finally, we conducted a semi-structured interview to gain more insights into the participants’ experiences.
5.2. Specialists’ Feedback
During the test, users agreed with the image overall classification made by the CEA tool in 83% of the cases. They reported that some cases lack general context information of the slide (similar to other cells) to have confidence in the result. However, another user reported that these buttons could contribute to specific cases.
Specialists described that in some cases, the color, the number, and the overlapping of tags on the image might have negatively impacted the analysis since these characteristics may have influenced the user’s ability to capture information. At this point, they reported that the filter buttons helped in the investigation. During the interview, a user suggested that the buttons for negatives filter and no tags are unnecessary, although it does not interfere. However, another user reported that buttons might not be needed in all analyses but can contribute to specific cases.
All users scored 5 (strongly agree) on the Likert scale concerning the statements analyzed in the test. That is, they agreed that the application was intuitive, easy to learn, and to use. During the interviews, users reinforced the application’s ease of learning and used it as a positive point. Furthermore, they also rated the processing time of 8 seconds (on average) as satisfactory. However, during the interview, we realized that this evaluation was based on different reasons, varying from response time expectations and experience with other algorithms and tools.
During the interviews, some users highlighted that we could improve the flow of interaction with the system. They highlighted two distinct viewpoints: (1) remove non-essential steps; (2) change evaluation structure. For case (1), one user highlighted that viewing the image between loading it and submitting it allows them to perform a preliminary visual analysis of the image. However, this user understood that we only used it to confirm the chosen image. For case (2), the user highlighted that the process would become exhaustive and error-prone for multiple images due to repeated steps (select, evaluate, repeat). One suggestion in the interviews is that the tool could allow the loading and processing of multiple images.
Another observation reported by users concerns the number of classified classes. They confirmed that the classification into two classes is interesting for them, but they pointed out that it would be better to have more detail on the lesion class by classifying it into three or six classes according to the lesion type. Furthermore, they reported that it would be interesting if the application could handle images with different characteristics (such as zoom, resolution, and noise) since even similar equipment still generates slightly different images. However, we do not find a database with these characteristics. Thus, it is not possible yet to train a model capable of dealing with this variability.
Finally, users reported that the application could be beneficial in answering specific questions. One of these cases is when there is doubt and no other professional to assist them. Currently, the process adopted consists of taking a photo and sending it to other professionals.
6. Conclusions
This work presents the CEA (Cytopathologist Eye Assistant) tool that detects and classifies cells in multicellular images obtained in the Pap smear. Internally, the CEA processes utilize a detection algorithm and a classification algorithm to provide the results for the specialist. The application uses the YOLOv5s, a deep learning model for both tasks in this work. The goal is to support the cytopathologist’s decision-making by offering a second opinion based on the whole image, not demanding a previous cell segmentation.
This work investigated different configurations for cervical cell detection and classification using YOLO architecture. The best results obtained were using the YOLOv5s with the original dataset. For this configuration, we obtained a precision of 0.736, recall of 0.777, and
[email protected] of 0.806. In addition, we evaluate the classification process as a separate task. For this analysis, we used the ensemble proposed by Diniz et al. [
17] and obtained a precision of 0.726 and a recall of 0.906 for classifying the bounding boxes detected by the YOLOv5s.
The analysis becomes even more interesting when we analyze the image as a whole. In this case, if the image has at least one lesioned cell, it is classified as lesioned. Otherwise, it is classified as negative. For this analysis, the YOLOv5s achieved the best results with 0.975 precision, 0.992 recall, 0.970 accuracy, and 0.983 F1-score for the CRIC Cervix database. The results outperform the literature method proposed by Xiang et al. [
22] concerning the precision, recall, and F1 metrics; however, as they used liquid-based cytology, their images were easier to detect and classify than ours.
We can conclude from the specialists’ assessment of CEA that it contributes to a general analysis of Pap smear images. They also reported that the tool is easy to learn and use, intuitive, and has an adequate response time. The main improvements suggested by users to be incorporated into the application were the following: (1) allowing the user to select multiple images for processing and (2) making a new version of the tool for classification into three or six classes.

 ,
, 


