Measuring Method of Node Importance of Urban Rail Network Based on H Index


1
School of Traffic and Transportation, Beijing Jiaotong University, Beijing 100044, China
2
Key Laboratory of Transport Industry of Big Data Application Technologies for Comprehensive Transport, Beijing Jiaotong University, Beijing 100044, China
3
Transport Planning and Research Institute, Ministry of Transport, Beijing 100028, China
*
Author to whom correspondence should be addressed.
Appl. Sci. 2019, 9(23), 5189; https://doi.org/10.3390/app9235189
Submission received: 14 October 2019
/
Revised: 24 November 2019
/
Accepted: 26 November 2019
/
Published: 29 November 2019
(This article belongs to the Special Issue Intelligent Transportation Systems)
Abstract
:Urban rail stations play an important role in passenger distribution and connectivity intervals in the network. How to effectively and reasonably evaluate their importance in the network is the key to optimizing the urban rail network structure and reducing operational risks. Taking the site as the research object and considering the topology, passenger volume, and passenger flow correlation of the urban rail network, the index of citation index is used to define node importance metric based on the h-index. Furthermore, the method of calculating the importance degree of urban rail transit network nodes based on h-index is proposed. The validity of the method is verified by the data of Beijing urban rail network in 2016, and the results are compared with the existing central index based on the network topology characteristics.
1. Introduction
Urban rail transit is the backbone of the transportation system. With the network operation of rail transit and the rapid increase of passenger flow, the operation safety risks of rail transit are increased, for instance, operational accidents can cause trains in local section stops or can even lead to severe casualties and breakdown of the entire network system. Meanwhile, many scholars have discussed the cascading failure phenomenon in urban rail network [1,2,3]. This shows that when some key stations fail, they will cause other stations to fail through the connection between stations, which greatly reduces the transmission efficiency of the urban rail network, and even leads to a global crash. Therefore, accurate identification of key stations is an effective way to reduce the safety risk of urban rail operation and improve the transportation efficiency.
With the deepening of the research on the importance of nodes in urban rail networks, the existing research can be divided into the following three categories:
- Evaluation method of node importance considering cascading failure.In this method, the following two steps are used to evaluate the importance of the nodes in an urban rail network: (1) remove the nodes from the network, (2) measure the decline rate of network efficiency. In the literature [1], the Shanghai metro network is taken as an example to study the vulnerability of the subway network to random failures of nodes and deliberate attacks on nodes. It is found that the attack strategy based on the number of betweenness centrality has the most devastating impact on the urban rail network, that is, nodes with a large number of betweenness centrality are more important. In the literature [2,3], considering the distribution characteristics of passenger flow in the Nanjing metro network, the cascading failure mechanism of metro network stations is analyzed based on the “capacity-load” model, and different passenger flow distribution methods are proposed. In this way, the evaluation index of node importance is the ratio of the station capacity to the actual passenger flow. However, this method relies on the accuracy of “load” distribution, and passengers have autonomous path decision-making behavior, which will affect the evaluation of node importance in urban rail network.
- Evaluation method of node importance based on network topology.Previous researchers have revealed valuable insights into the structure of metro infrastructure networks, including scale-free features [4], small-world properties [5], node centrality [6,7,8,9]. Among them, the metrics of node centrality can be divided into two categories: (1) local centrality measure, (2) global centrality measure. The evaluation index of local centrality is degree centrality. The idea of the degree centrality method is that the more direct neighbors a node has, the more important it is. In the literature [6,7], the topological characteristics of the Minsk metro network, Shanghai Metro network, Seoul metro network, and Boston metro network were discussed respectively, and the average degree of the network is calculated. The second kind of index tries to evaluate the importance of nodes from the perspective of global network. The representative evaluation indexes are betweenness centrality, the closeness centrality, and eigenvector centrality. Compared with the local centrality, the global centrality can obtain better results [8]. In the literature [9], the topological characteristics of the Beijing metro network were discussed, and the global topological index such as clustering coefficient, betweenness, and degree were calculated. These studies typically focused on the complex network topology of subway systems.
- Evaluation method of node importance based on eigenvector index.The most relevant method for our work is the third one, which not only considers the number of adjacent nodes, but also their relative importance [8]. A typical example of this method is PageRank [10,11]. The literature [10] provides us with a method of using PageRank algorithm to sort nodes in urban network. In the literature [11] in the improved PageRank model, the data matrix is constructed according to the original idea of PageRank vector. Regardless of the topological distance between nodes, it gives the same opportunity to jump from one node to another. The improved algorithm is applied to the real urban network.
The above references provide a reliable theoretical background for the study of the importance of urban rail network nodes. However, due to the correlation of passenger flow in the urban rail network, these methods cannot be directly applied. The passenger flows between stations are mutually influential, and their volatility characteristics are very similar. Considering the spatial correlation characteristics, a method based on h-index is proposed to study the node importance. In recent years, some scholars have attempted to apply h-index [12] and its variants to the study of complex networks. The literature [13] used the Hirsch index to identify influential communicators in the network and found it to be superior to the recently introduced non-backtracking centrality indicator. The literature [14] believed that identifying the influential nodes in the dynamic process was the key to understanding the structure and function of the network. By constructing an H operator, the relationship between node degree, h-index, and kernel number was explained as follows: node degree, h-index, and kernel number are the initial state, intermediate state, and steady state of the sequence. In the measurement of the key categories of software systems, the literature [15] defined the h-index based on nodes and node-based edge weights, which improved the existing research [14]. However, the influence of the combination of node degree and edge weight on the importance of the node was not considered. For this reason, literature [16] proposed the concept of neighbor weight in a software system. Considering the influence of the degree of neighbor nodes and the community of connected edges on the nodes, the variant index of h-index was defined, and good results were obtained in the identification of important classes.
In summary, researchers have borrowed the h-index to study the measurement of the importance of nodes in software networks, but have not applied the h-index to the study of the importance metrics of urban traffic network nodes. This paper introduces the h-index idea into the traffic field to study the importance of nodes in the urban rail network and identify its key nodes. The index of combines the spatial correlation of passenger flow in the urban rail network. In addition, it considers the topology, passenger volume, and passenger flow correlation of the urban rail network.
The structure of this paper is as follows: Section 2 describes the basic theory of urban rail network node importance measurements. In Section 3, a calculation method of node importance in urban rail network based on h-index was proposed; In Section 4, the proposed method is validated and discussed by using passenger flow data and network topology data in a real urban rail network. Section 5 concludes the paper.
2. Preliminaries
This section summarizes the current indicators used to measure the importance of urban transport network nodes from two different dimensions; and introduces the basic theory of h-index.
2.1. Node Importance Measurement Index Based on Complex Network Centrality
The urban transportation network is a complex network. According to the topological characteristics of the network, some scholars have proposed a variety of central indicators to characterize the importance of nodes. The relevant indicators are shown in Table 1.
2.2. Node Importance Measurement Index Based on PageRank Algorithm
Google’s PageRank is a variant of the centrality measure of feature vectors. Google uses the PageRank algorithm to compute the PageRank value of each page, and then ranks the pages in the result set. The higher the PageRank value of a page, the higher the ranking of the page in the result set.
Some scholars have applied PageRank algorithm to the research of network node importance [10,11]. Let undirected graph , whose adjacency matrix is . If there is an edge between node i and node j, then = 1, and vice versa = 0. The transition matrix is represented as , among them, is the reciprocal of the sum of all the elements of the corresponding column in the adjacency matrix A, as shown in formula (1).
Then the PageRank algorithm can be expressed as:
Among them, represents the damping factor, , usually = 0.15; is the unit matrix.
Let the maximum eigenvalue of matrix G be and the corresponding eigenvector be . Using Perron–Frobenius theorem [17] to solve :. If the solution result is , then is the importance value of node i.
2.3. Node Importance Measurement Index Based on Passenger Flow of Urban Rail Stations
The passenger flow of the station is obtained by adding the passenger flow of each direction connected to the station. The calculation formula is as follows: , is the set of neighbor nodes of the node i; a is the a-th node connected to node i, , is the passenger flow between node i and node a.
2.4. Definitions of h-Index and g-Index
The h-index skillfully takes into account both the quantity and quality of scholars’ papers, and achieves the effect of describing productivity and influence with one index value. However, the h-index is insensitive to the papers with high citation frequency. Based on this, L. Egghe [17] puts forward the g-index, which can reflect the evaluation index of the papers with high citation frequency. The h-index and g-index are defined as follows:
Definition 1.
If and only if each of the papers published by a scientist has at least h citations, and the other papers have no more than h citations, this h value is the scientist’s h-index [12].
For instance, Hirsch’s own h-index is 59, which means that in his published papers, each paper cited at least 59 times has a total of 59 papers. Hirsch believes that the h-index can accurately reflect a person’s academic achievements. The higher the h-index, the greater the influence of his paper [12]. An important node in an urban rail network identified by h-index has a feature that there is a correlation coefficient of no less than a certain value between the station and a certain number of stations. It indicates that the operation status of the station can represent the status of some stations in the urban rail network. However, h-index is not sensitive to both high cited papers and low cited papers, so it is not conducive to the objective evaluation of those scientists with low number of papers and high cited papers. Then L. Egghe [17] puts forward an evaluation g-index which can reflect the high frequency paper.
Definition 2.
Papers are listed in descending order of citation number. The cumulative citation number of g papers with the highest citation number is greater than or equal to , while the cumulative citation number of papers is less than , which is the scientist’s g-index [17].
For instance, suppose that the citation number of four articles of a scholar is , and the corresponding , because , then the scholar’s g-index is 3. When g-index is used to evaluate the importance of urban rail network nodes, it can avoid the problem that h-index is not sensitive to the identification of nodes with high passenger flow correlation, and improve the accuracy of identification of important nodes in urban rail network.
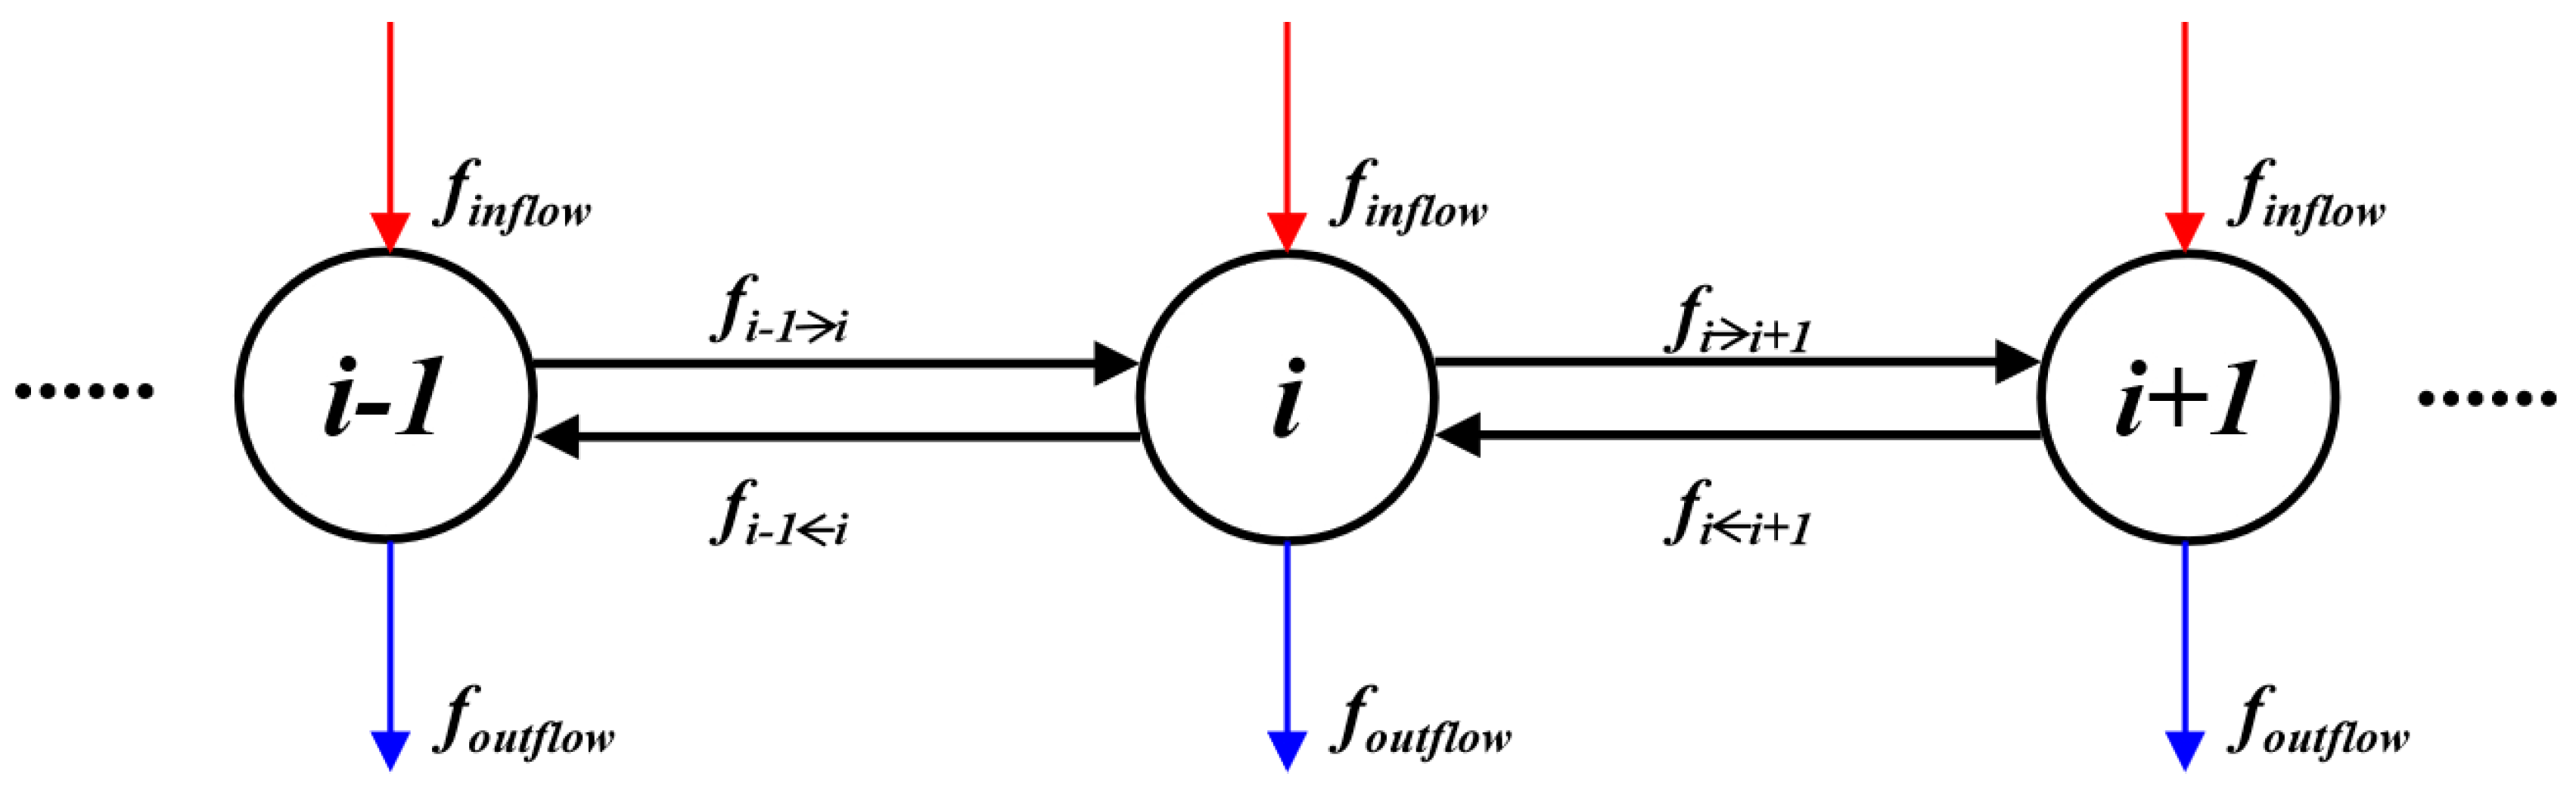
From a scientist’s perspective, the h-index is known to be exponentially harder to increase: when one’s h-index is 150, a 150 times cited paper does not qualify to increase the h-index any further. As such, when relating this back to urban rail network, every line should be equally busy for a node to be identified as busy. However, as the h-index in this paper considers the relationship between passenger flow and passenger flow of each station, it can be seen from Figure 1 that the passenger flow in the interval can reflect the correlation between the flows, and the passenger flow status of each station at each sampling time is different, that is to say, the h-index proposed in this paper further considers the relationship between passenger flow in the urban rail network.
3. Method for Calculating the Importance of Urban Rail Network Nodes Based on h-Index
The characteristics of urban rail network topology and passenger flow distribution represent the characteristics of the network to a certain extent. In an urban rail network, the passenger flow at the station changes with time. There are similarities and correlations between the passenger flow of stations in a certain spatial range. Considering the spatial correlation characteristics, a method based on h-index is proposed to study node importance. The main contents include: (1) correlation analysis of urban rail network node passenger flow; (2) the measurement index of node importance based on h-index is proposed, and on this basis, the measurement method of node importance based on h-index is constructed, and the corresponding flow chart is given.
3.1. Construction of Urban Rail Transit Network Model
In order to study node importance of urban rail transit network, the topology of urban rail transit network should be described and defined. According to different research purposes or different travel behaviors, the abstract way of network is often different. In the literature [18], a set of space syntax analysis method was proposed, which combines urban infrastructure and geographic network. The literature [19] systematically describes the emergence of complex urban area networks, their structure, and possible representations. According to the different network abstraction methods, there are three kinds of abstraction methods: Space L method, dual method, and Space P method.
The abstract way of Space L is convenient to study the basic topological characteristics of a traffic network. For an urban rail network, the subway station is abstracted as a node, and the two stations with direct rail lines between them are abstracted as an edge. When the dual method is used to model, the result of Space L is taken as the basis, the station interval is taken as the node, and the station is taken as the edge. This modeling method ignores the geographical characteristics of urban rail network and highlights the connection relationship between urban rail networks. The modeling method of Space P mainly reflects the transfer property of an urban rail network. In the abstract method of Space P, the subway station still represents the nodes in the complex network, but for the edge, all stations on the same subway line are directly connected. This abstract way emphasizes the direct relationship between two stations and ignores the number of stations on the same route. The urban rail network model constructed by the Space P method mainly reflects the connectivity between stations. At this time, the connectivity refers to the number of transfers between stations, not the geometric distance between stations.
By using the Space L model of complex network, all stations in an urban rail transit network are abstracted as the set of nodes, and the connection between stations is abstracted as the set of connection edges between nodes. The rail transit network graph is constructed. Among them, is the set of nodes, is the set of connecting edges, based on which the importance of nodes in urban rail transit network is analyzed.
3.2. Relevance Analysis of Node Passenger Flow in Urban Rail Network
Because of the connectivity of urban rail network, there are different intensity relationships among passenger flows for each stations. Mining hidden information between urban rail stations from mass passenger flow data and identifying the correlation between passenger flow can evaluate the importance of the station according to the fluctuation of passenger flow at urban rail stations, and achieve the goal of key station control and passenger flow management.
3.2.1. Node Correlation Coefficient of Urban Rail Network
The correlation coefficient is used to describe the degree of correlation among the stations in the urban rail network. The calculation formula is as follows:
(1) Establishing the original passenger flow matrix between stations.
Among them, m is the number of stations, and N is the length of the data sample.
(2) Normalization of data. Data are standardized using the following formula:
Among them, represents the sample mean and is the sample variance. Standardized passenger flow data mean is 0, variance is 1.
(3) Correlation matrix.
Among them, is the correlation coefficient between node i and j of urban rail network.
3.2.2. Node Reference Coefficient
After calculating the correlation coefficient matrix of the urban rail stations, the correlation coefficient is assigned and the node reference coefficient between the stations is obtained. Node reference coefficient is defined as:
Among them, is the coefficient of node i and node j; is the correlation coefficient between stations; m is the number of stations. ⌈⌉ takes an integer up, and if it is given an integer, it returns the integer itself. For example, , .
After calculating the node reference coefficient between nodes, the node reference coefficient matrix H between nodes can be obtained.
The H matrix represents the “citation frequency” of each station cited by other stations, corresponding to the citation frequency of articles defined by the h-index.
Property 1.
Node reference matrix is a symmetric matrix, that is .
Proof.
Undirected network G = <V,E> has n nodes , n-order matrix is the node reference matrix of graph G.
and , therefore .
note (1): There is a relationship between and
note (2): There is no relationship between and [20]. □
3.3. Definition of Node Importance Measurement Index Based on h-Index
After calculating the node reference coefficient matrix between nodes, the ‘h-index’ of each node can be further calculated, and the importance of urban rail network nodes can be judged according to the index. Firstly, the index and index of nodes are defined.
Definition 3.
In the urban rail transit network, all nodes in the network are arranged in descending order for the nodal coefficient of a node. If and only if the index coefficients of the h nodes before the sort are at least h, and the index coefficient of the h + 1 node is less than h + 1, then the h value is defined as the index of the node.
If is the node reference coefficient of the k in descending order to node i, the mathematical expression of the index can be written as: .
index combines the spatial correlation of passenger flow among urban rail transit nodes, overcomes the restriction that the node degree only considers the number of adjacent nodes in the complex network, and extends to the global nodes of the network, which has the global topological characteristics.
Definition 4.
In the urban rail transit network, the index coefficients of all nodes in the network are sorted in descending order. If and only if the sum of the index coefficients of the g nodes before the sorting is not less than , and the sum of the index coefficients of the nodes is less than , then the g value is defined as the index of the node.
The mathematical expression of the index can be written as: .
Obviously, the index is the maximum number of the cumulative number of the indexing factors greater than or equal to the square of the number.
Property 2.
In any case, .
Proof.
3.4. Methodology
In the h-index defined by Hirsch, scientists publish papers in descending order of citations and then calculate index values to evaluate scientists’ scientific contributions. Scientists can be considered as nodes, and the papers represent the attributes of nodes. In this study, firstly, the coefficient of the other nodes in the urban rail network to node i is calculated. Then, sort the coefficients in descending order. Finally, the index and index of the urban rail network nodes are calculated according to Definitions 3 and 4, thereby evaluating the importance of the urban rail station. In fact, Hirsch’s h-index measures scientists from the perspective of the paper. The difference in this study is that the proposed index is calculated based on the level of “scientists” rather than the “paper” level. The index and the index obtained by such a calculation concept are more objective in evaluating the importance of the node. For example, a transfer site in a urban rail network has four neighbor nodes. Assume that node i contains only four attributes (adjacent nodes, corresponding to the scientist’s “paper”), and other nodes have a higher correlation with the node. At the time, if the h-index of the node is calculated based on the “paper” level, the value of the index can be up to 4. However, if the h-index is calculated from the level of “scientist”, the limit of the attribute value can be broken, and the value can better reflect the importance of the node.
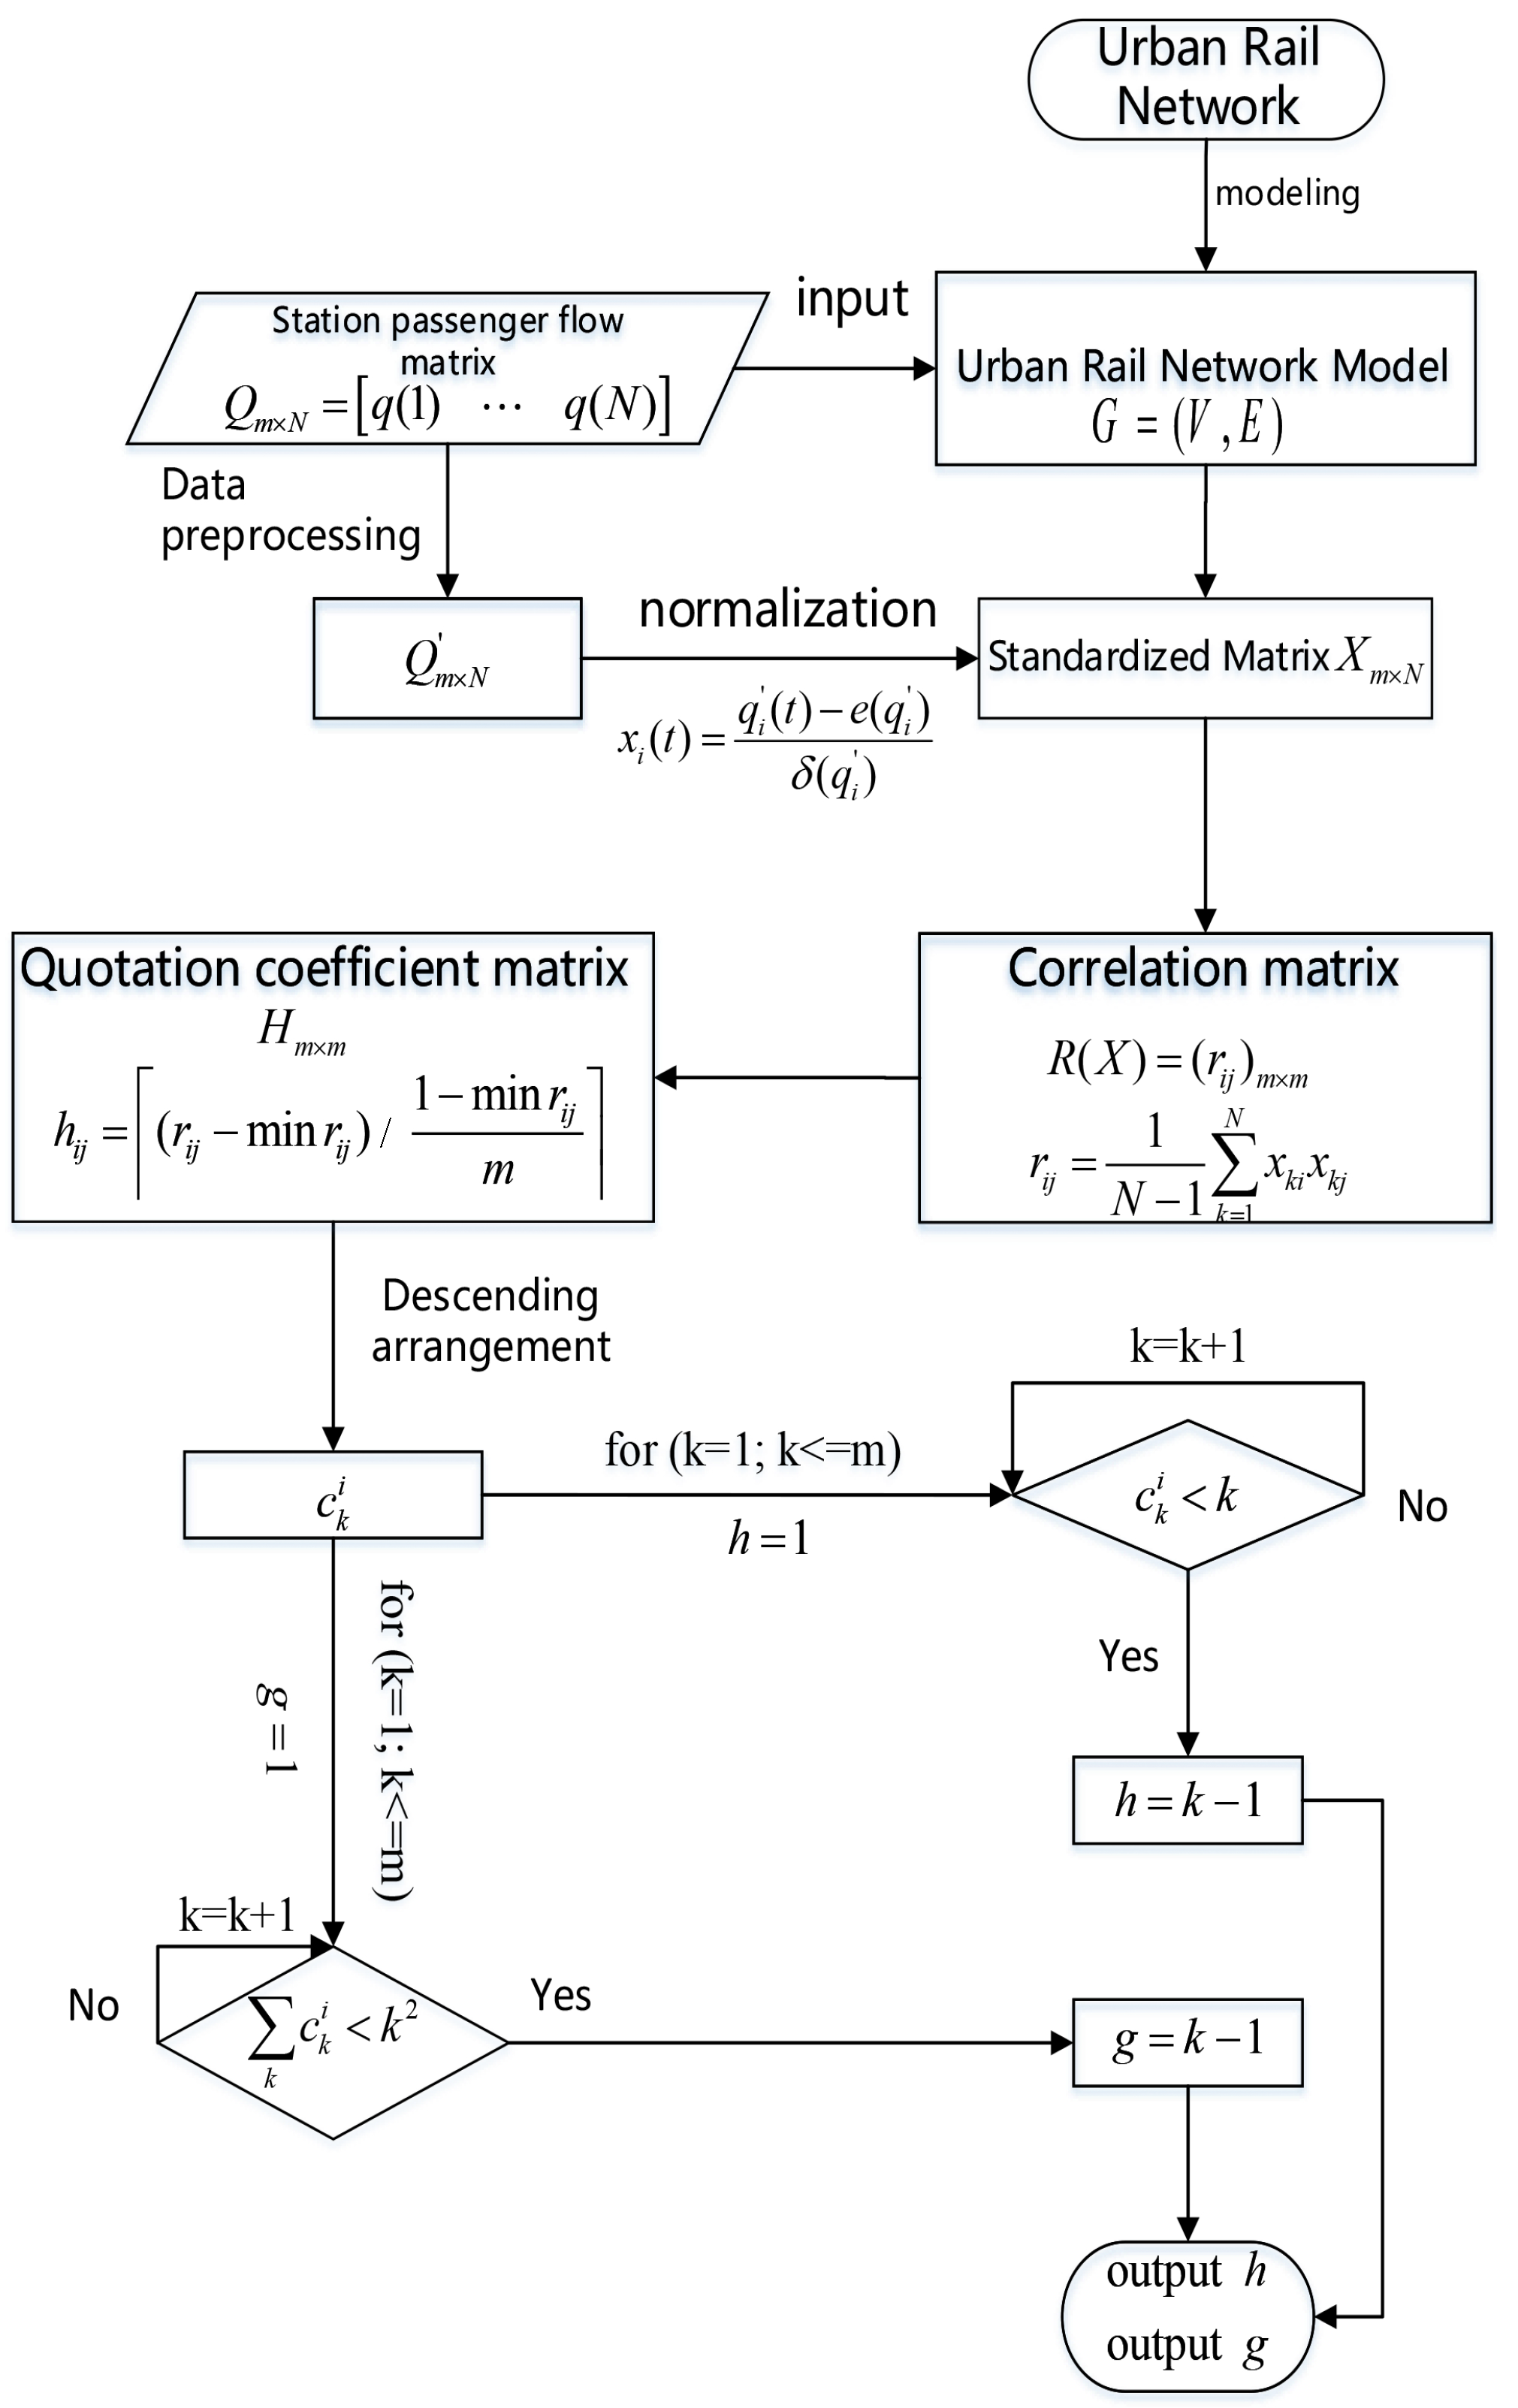
The process of calculating the importance degree of urban rail network nodes based on h-index is shown in Figure 2.
The method of calculating the importance degree of urban rail network nodes based on h-index is mainly divided into the following steps:
Input: Urban rail transit network G, network node traffic matrix .
Output: The index and index of the node, where i is the node number.
Step 1. Construct an urban rail transit network model ;
Step 2. Establish a passenger flow matrix of the urban rail network based on the pre-processed passenger flow data;
Step 3. Normalize the passenger flow matrix using Equation (6) to obtain a standardized matrix ;
Step 4. Calculate the correlation coefficient of the passenger flow between the two nodes using Equation (7), and establish a matrix of sample correlation coefficients ;
Step 5. Use Equation (8) to find the joint coefficient between the nodes, and obtain the joint coefficient matrix between the nodes;
Step 6. For node i, the order of index is in descending order, the sorting number after descending order is , and the corresponding index is ;
Step 7. The h index and g index are calculated separately until the conditions and are satisfied respectively, then the index and index of node are output.
3.5. Evaluation Standard
(1) Intersection degree
Definition 5.
Use to denote the sequence set, consisting of the first n nodes arranged in descending order of node importance in index i. Then the intersection degree of the two sorting sequences X and Y is defined as:
Among them: represents the number of elements in the set of . The greater the degree of intersection, the more similar the ranking results of the two sequences are.
For instance, assume that X is a set sorted by BC index, Y is a set sorted by CC index, the first 10 elements of X and Y after sorting are , , the intersection of X and Y has four elements , then = 4/10 = 0.4.
(2) Intersection value
Definition 6.
Use to indicate the sort value of the v-th node in . Then the values of the respective sequences under the intersection of the two sorting sequences X and Y are defined as:
The difference in value between the two indicators is . If , it means that the node identified by indicator j is more important than the node identified by indicator i.
For instance, assume that X is a set sorted by BC index, Y is a set sorted by CC index, the first 10 elements of X and Y after sorting are , , the intersection of X and Y has four elements , these four elements are sorted in the X and Y sets as (2, 6, 8, 10) and (1, 2, 3, 4), respectively. Then , , , it means that the node identified by indicator X(BC index) is more important than the node identified by indicator Y(CC index).
4. Case Study
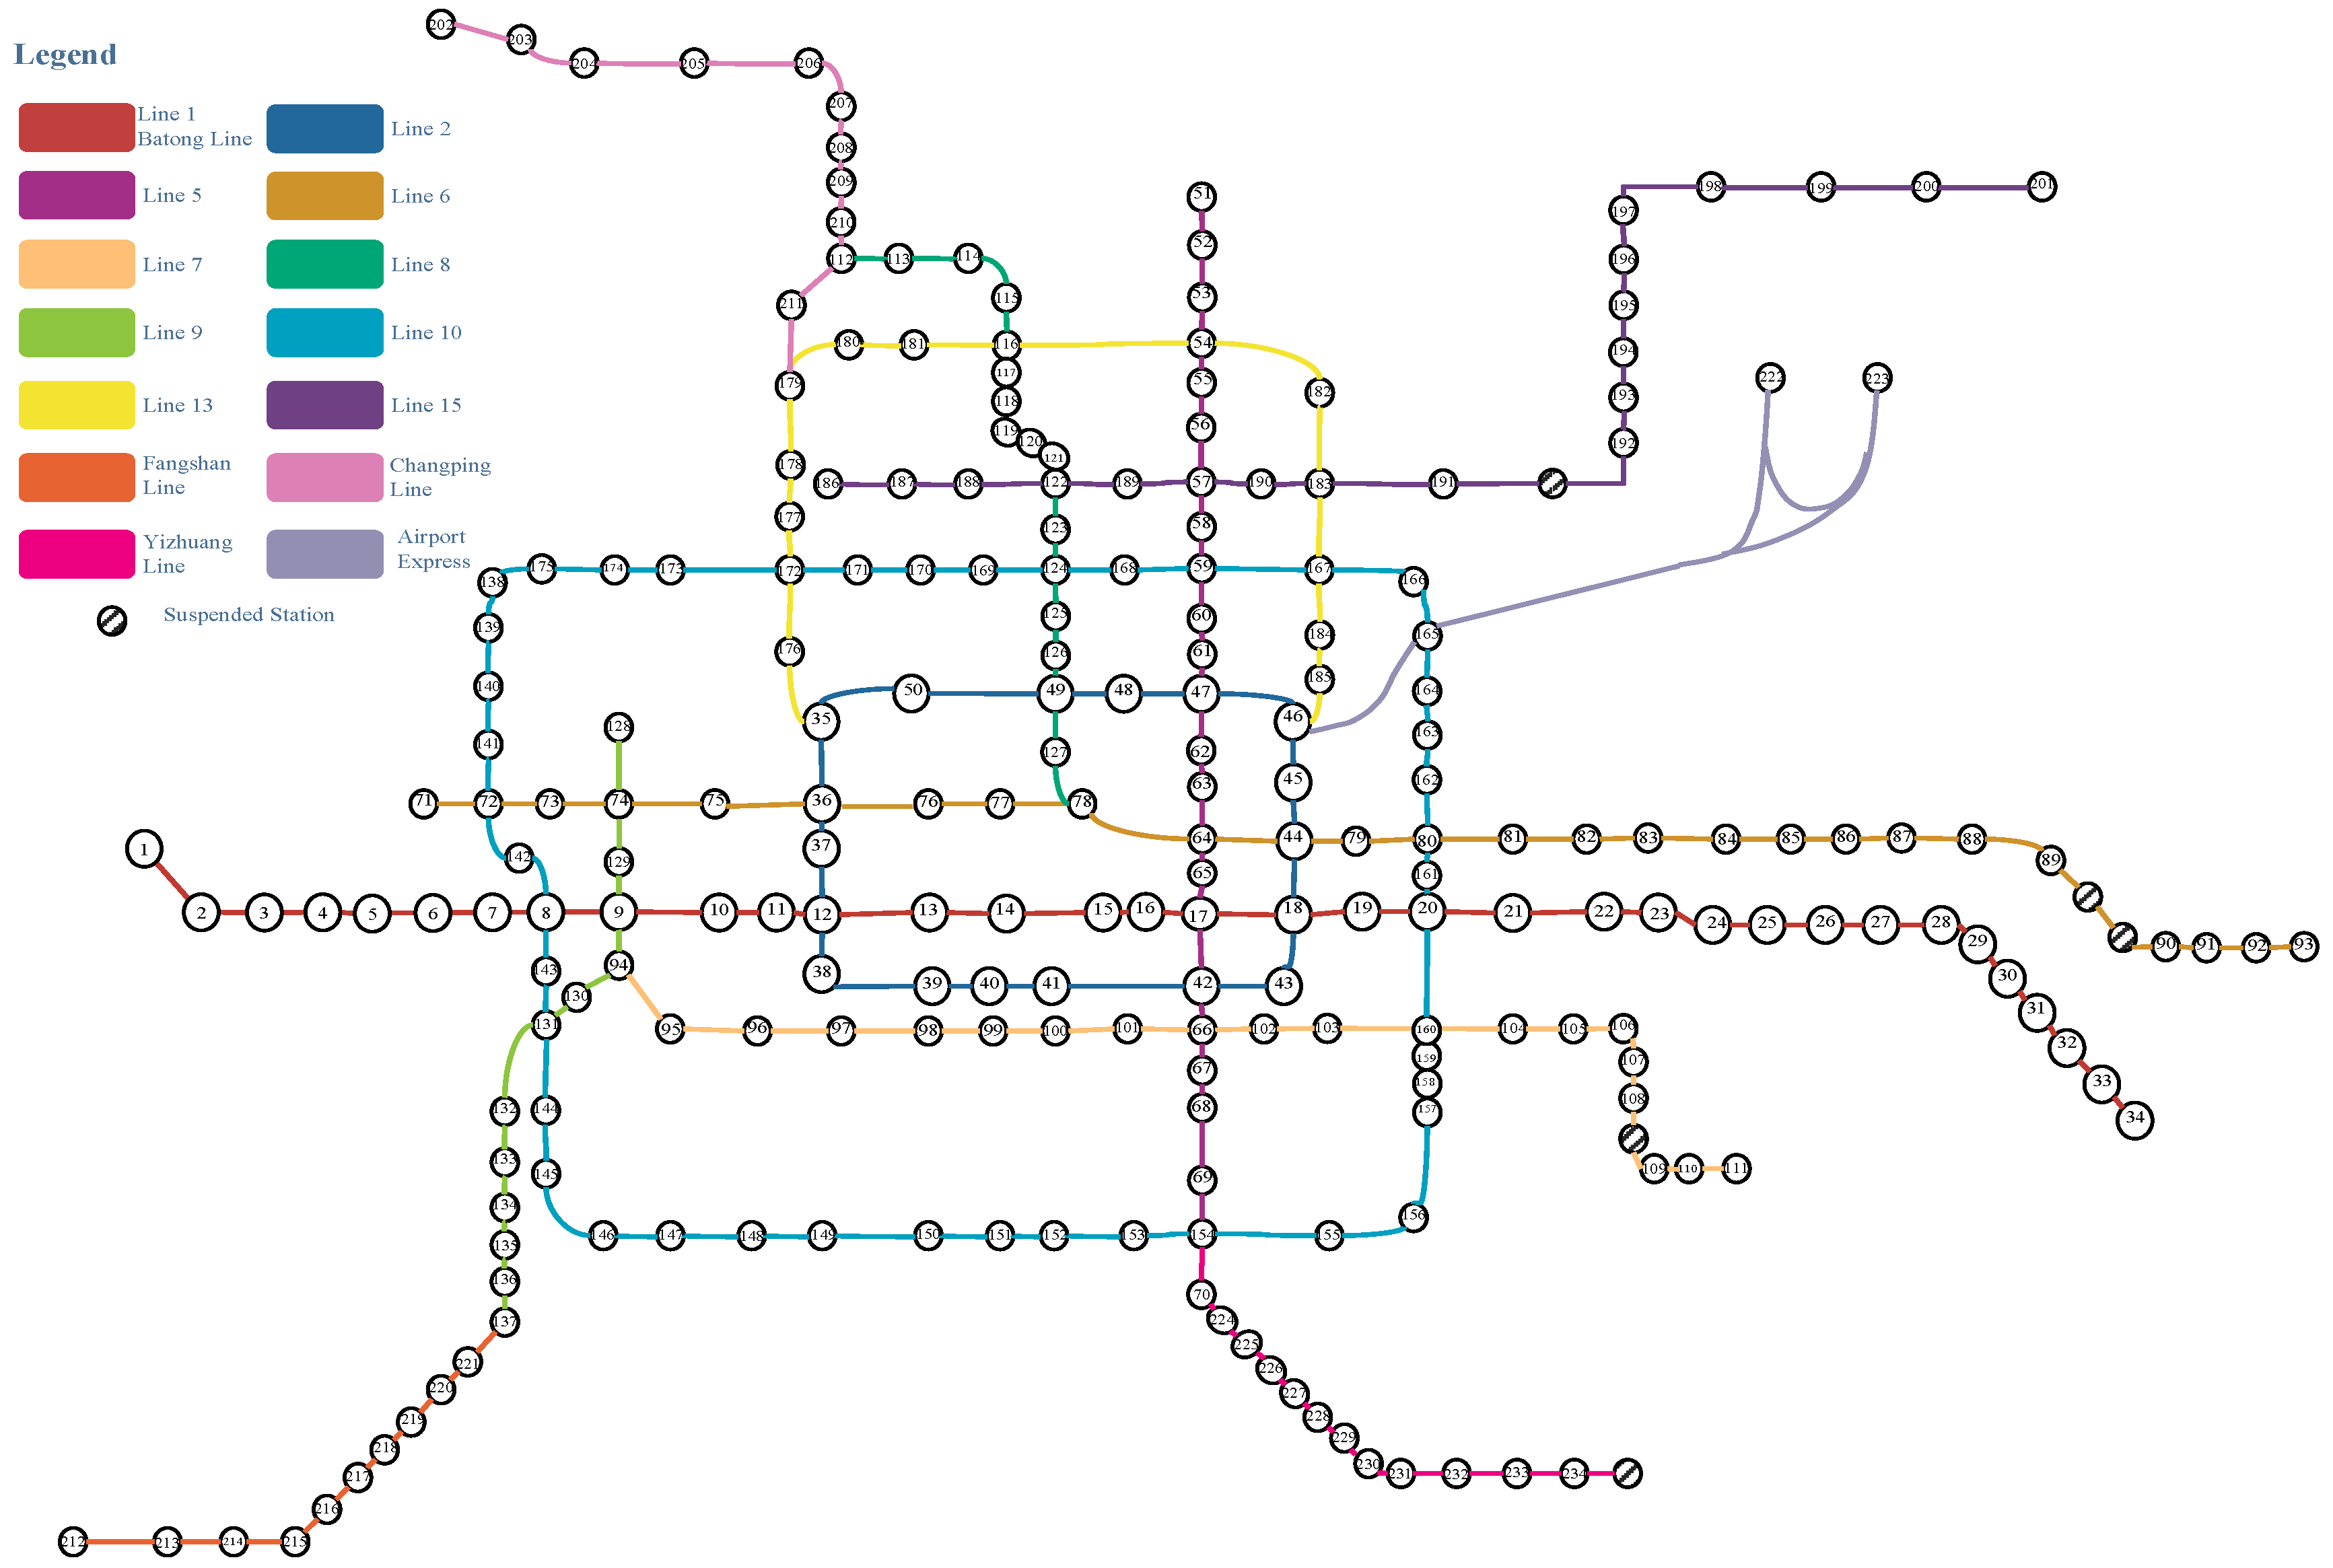
The importance of the traffic network nodes is studied in Beijing’s 2016 urban rail network. As shown in Figure 3.
4.1. Static Geometric Characteristics Analysis of Urban Rail Network
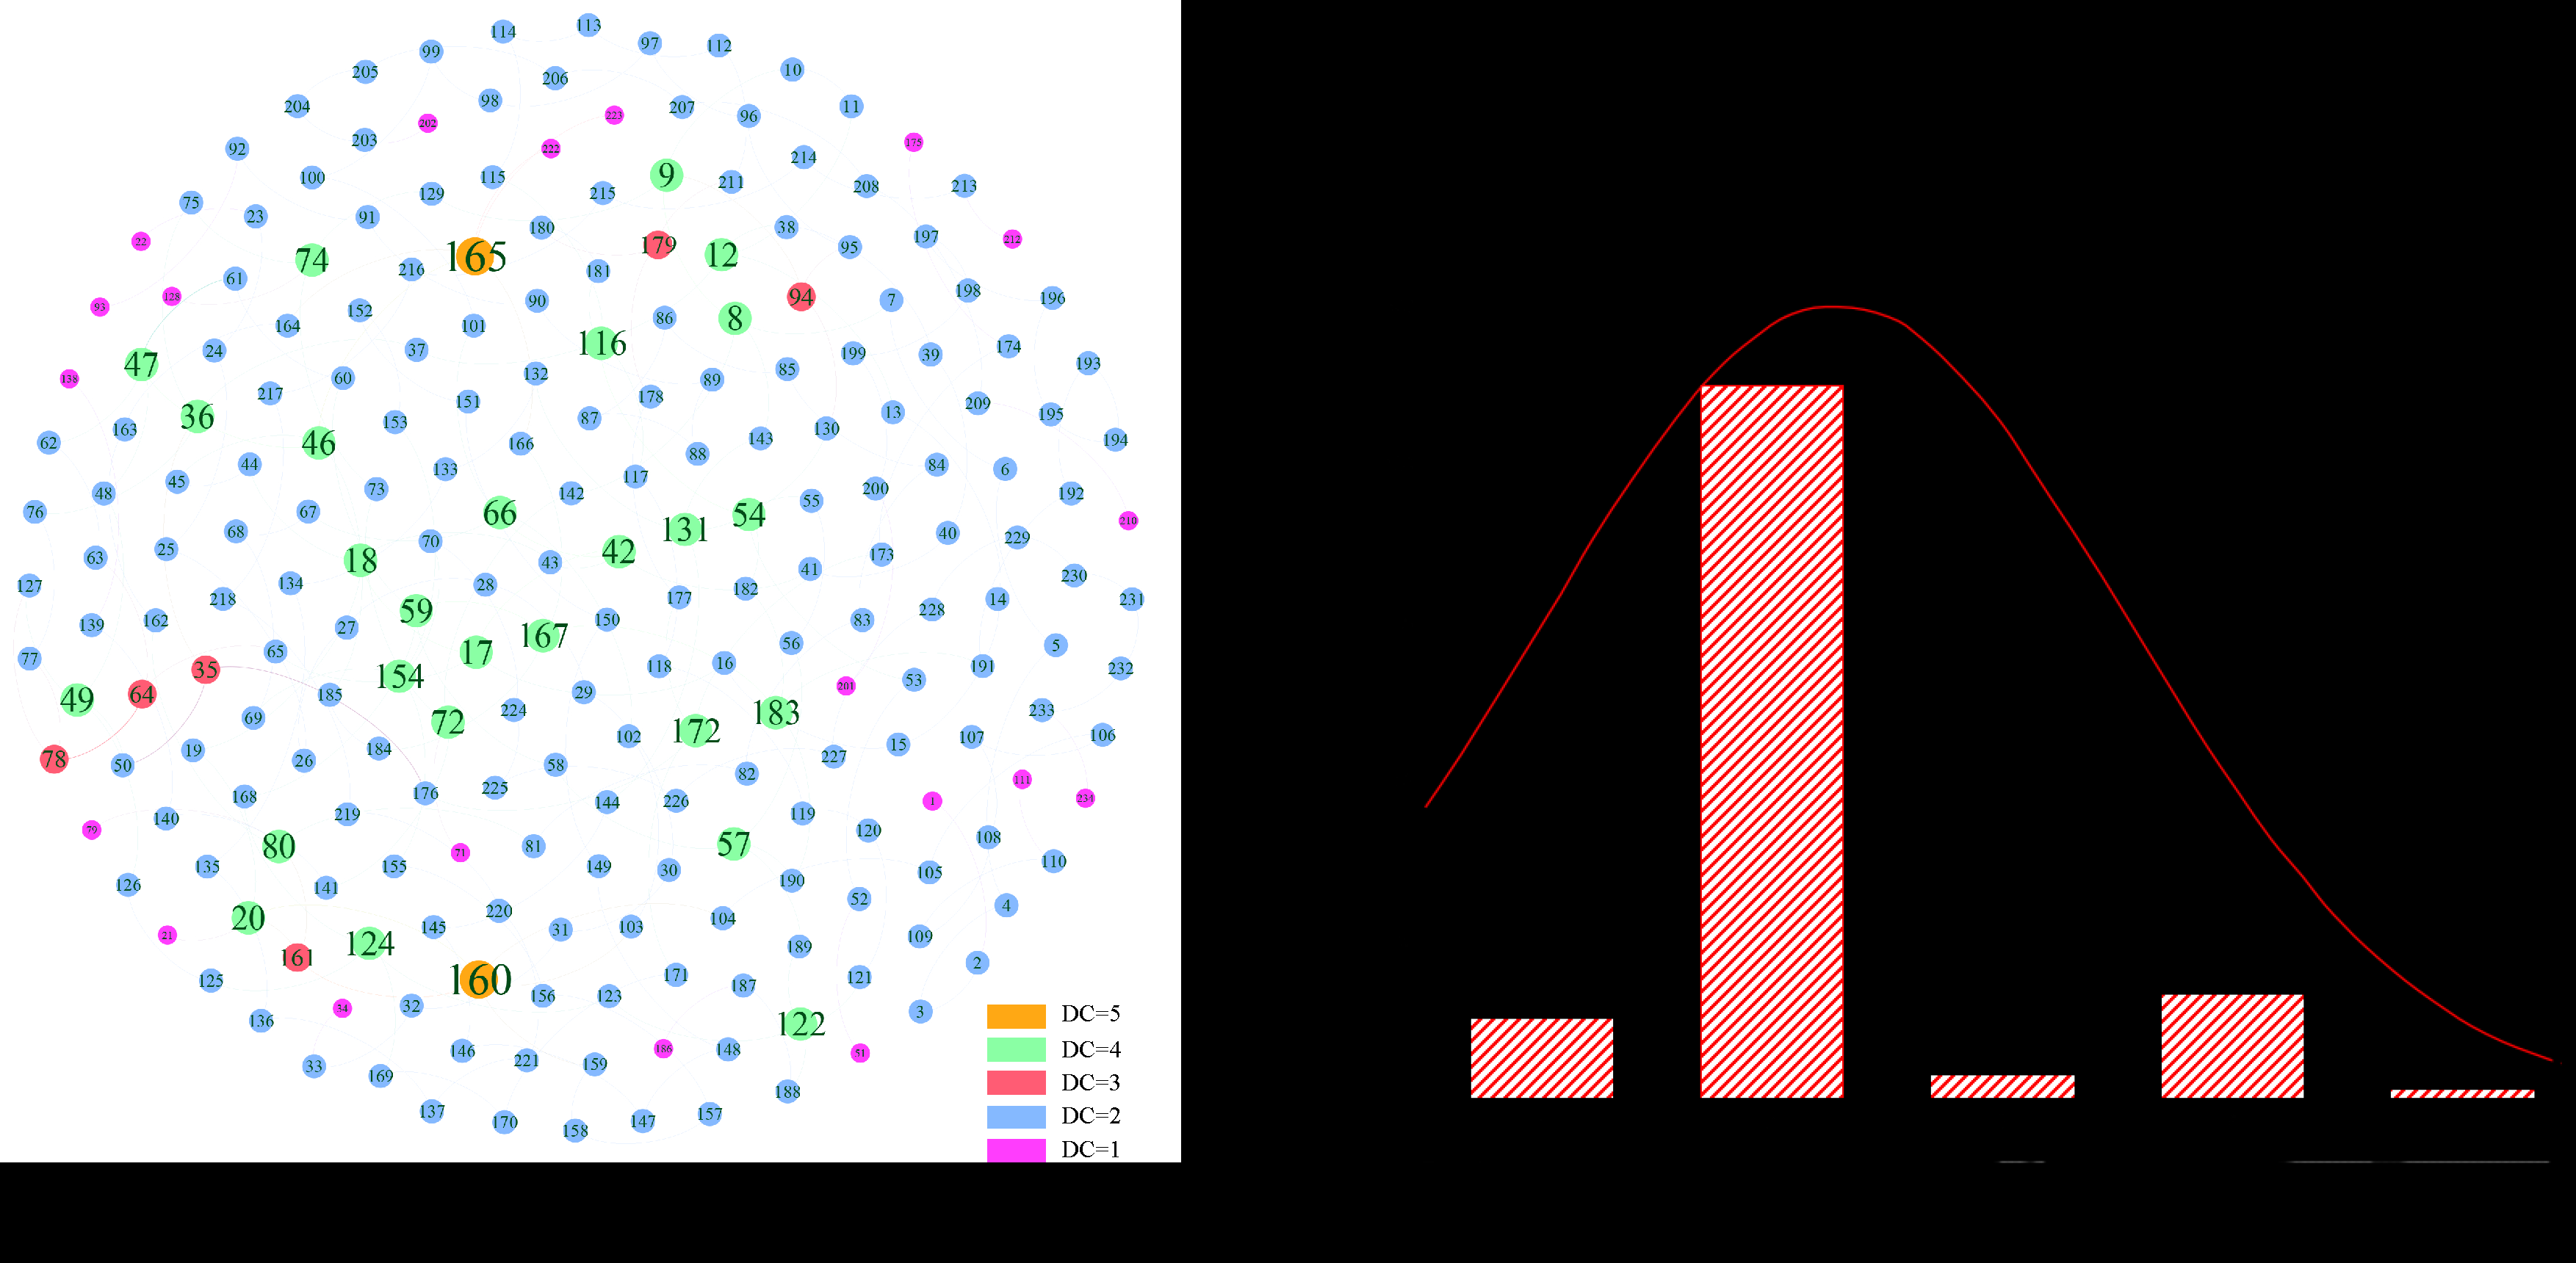
Count the number of nodes N of the urban rail network, the number of edges E, the average degree <k> of the nodes, the maximum degree of the nodes, the average path length L, and the clustering coefficient C. As shown in Table 2.
It can be seen that the average node degree of the network is 2.188, which is consistent with the structural characteristics of the urban rail network. In the urban rail network, most nodes except the transfer node have a degree of 2, and a few network edge nodes have only one adjacent edge. Figure 4 shows the degree distribution of the nodes. In the figure, the node size indicates the size of the urban rail station. It can be seen that the green node is the most, indicating that most of the urban rail network nodes are nodes with degree 2, and the network has scale-free characteristics.
4.2. Node Importance Measurement Result Based on Network Centrality Index
Calculate the degree centrality (DC), the betweenness centrality (BC), the closeness centrality (CC), the eigenvector centrality (EC), and the PageRank value of the road network node. The node importance is sorted and the results are shown in Table 3.
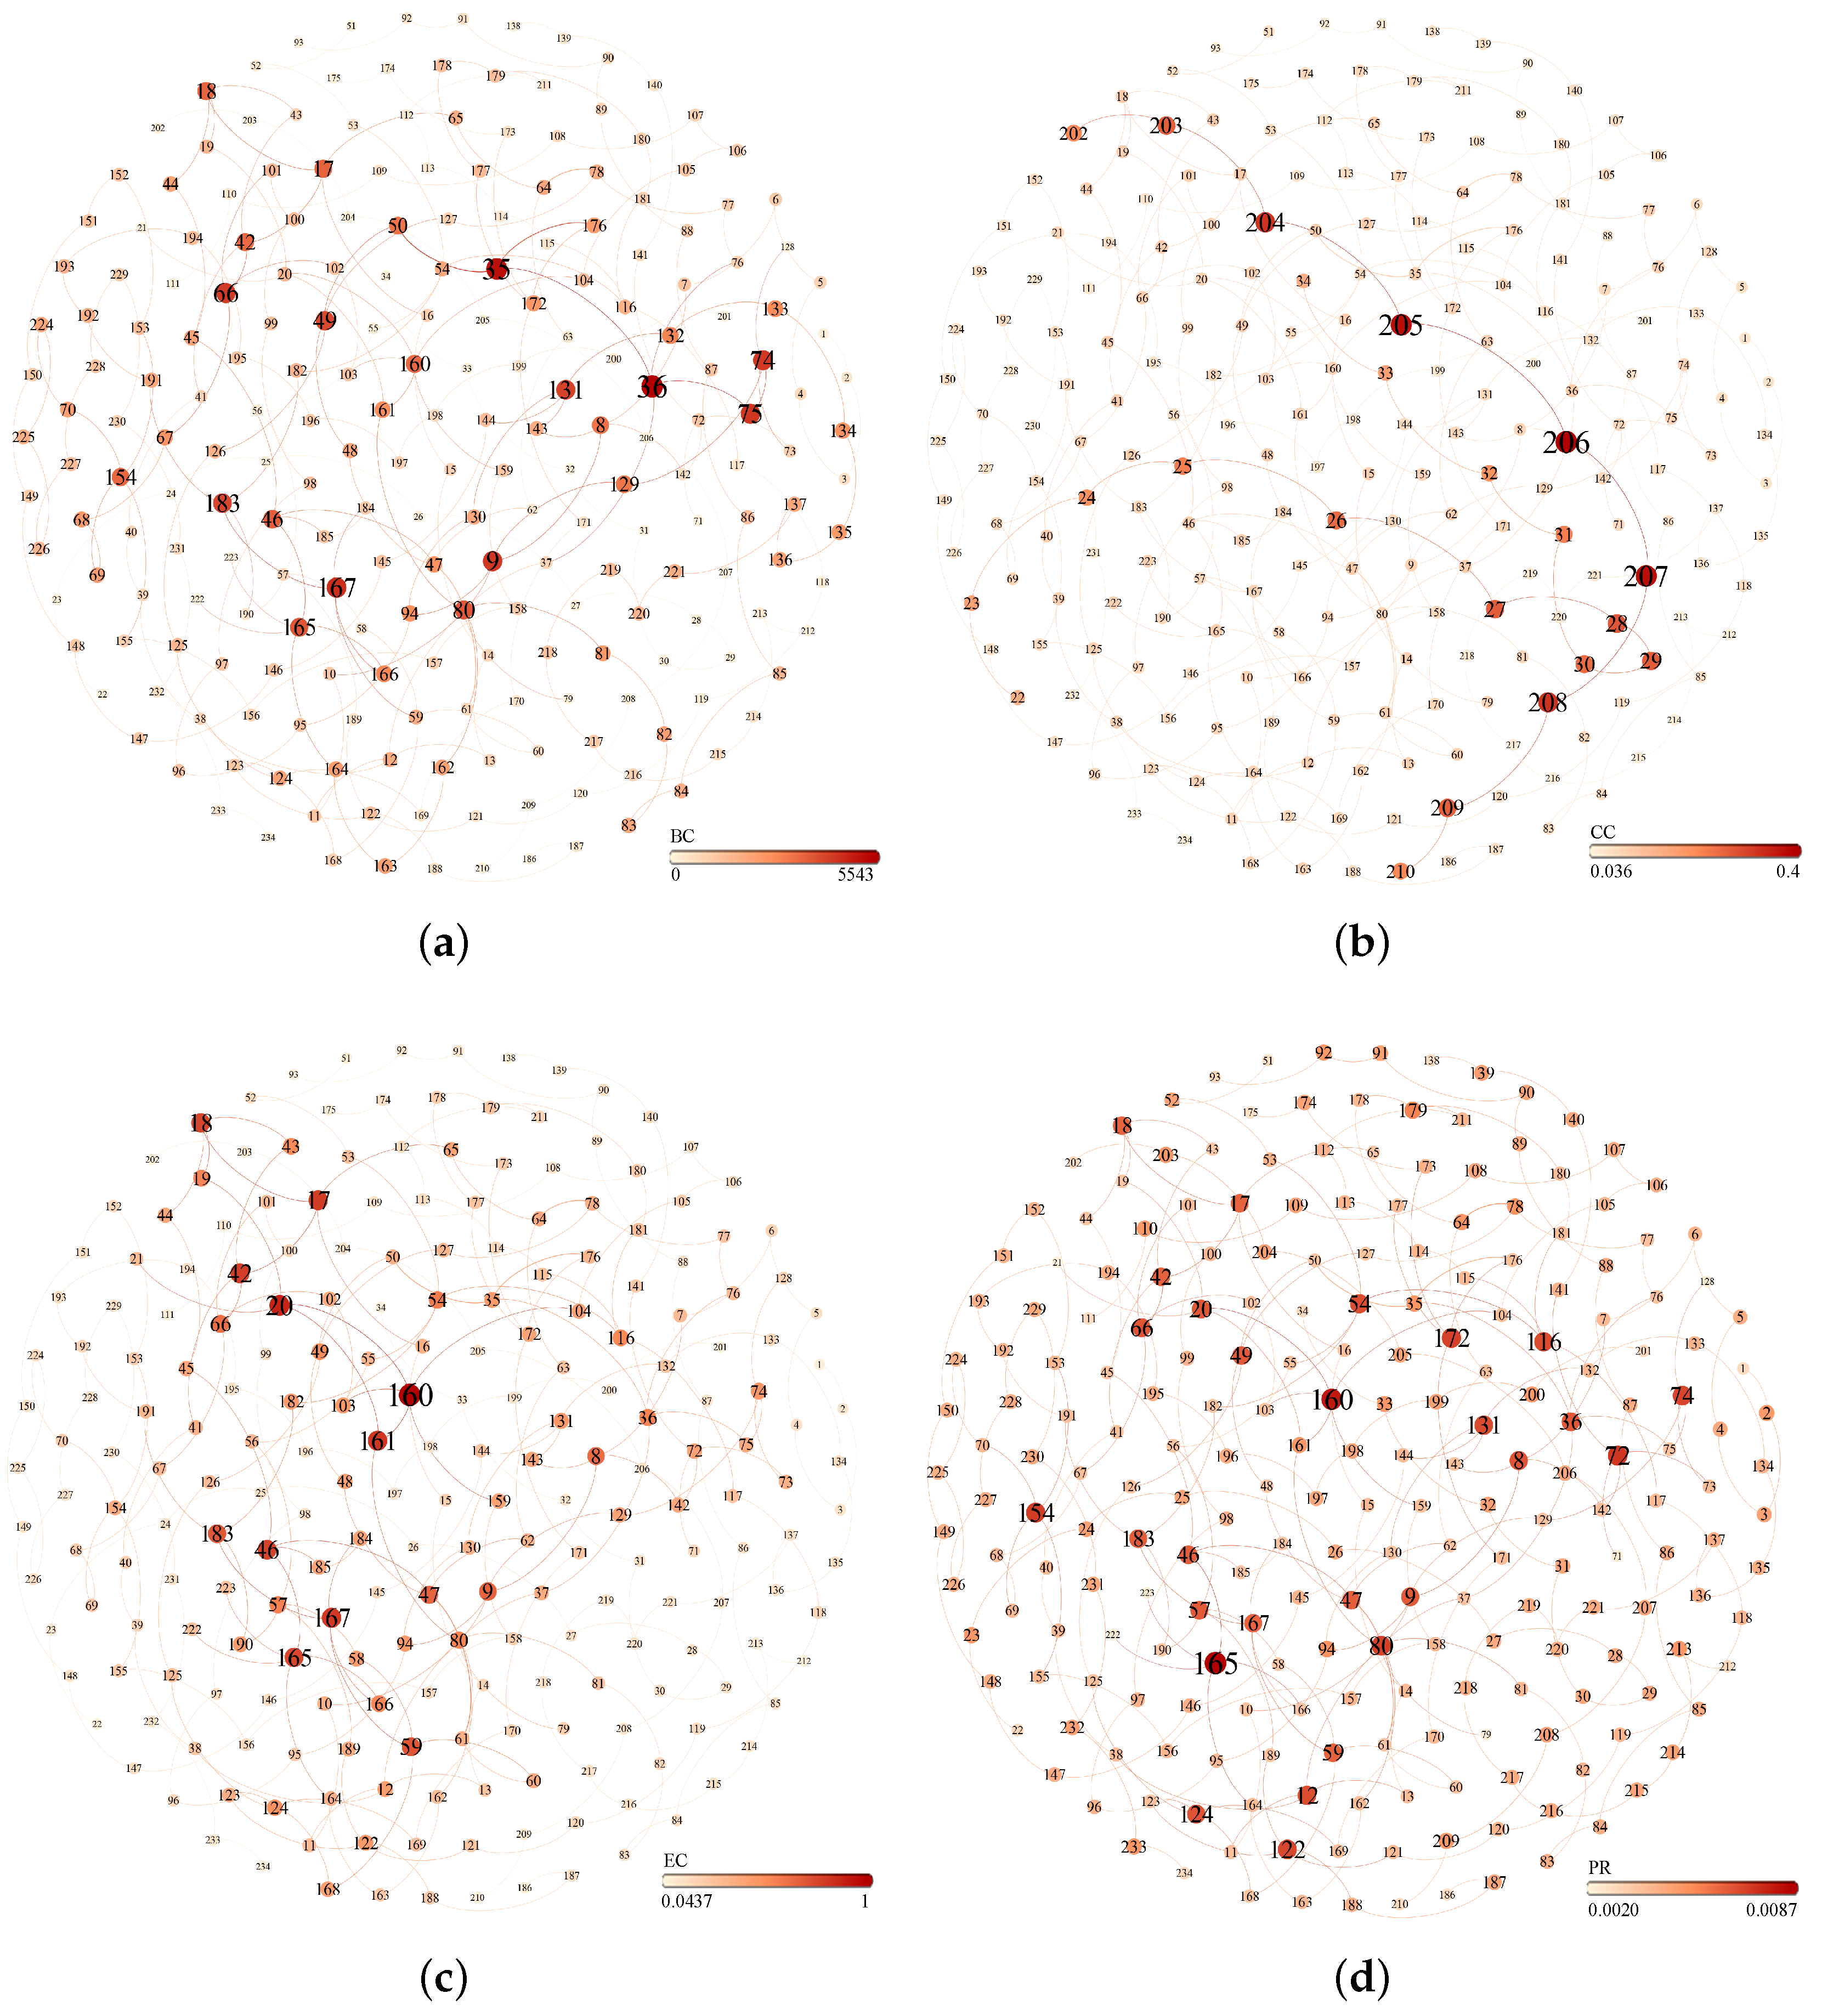
According to the degree value, the greater the degree of node, the greater the importance, but the importance of the nodes in each class cannot be distinguished. BC, CC, EC, and PageRank distinguish the importance of nodes well, and use Gephi to get results, as shown in Figure 5.
Consider a graph of the BC, CC, EC, PageRank results of the nodes, as shown in Figure 5. It can be seen from the figure that although the BC, CC, EC, and PageRank values of the nodes are widely distributed, the respective recognition effects are quite different. It can be clearly seen that the nodes of the PageRank recognition result are nodes with large importance such as nodes 72 and 154, but the colors in Figure 5a–c are very light. The PageRank algorithm measures the degree of node importance by considering the degree of connection of the nodes. When the degree of the normal node is large in the undirected graph, the node is of great importance. The BC considers the shortest path. It is considered that the more the shortest path passing through a node, the more important the node is. It can be seen from the topology map of the urban rail network that node 72 is at the edge of the network, and the shortest path between the pair of nodes does not pass through it, so the BC is small. Also, due to the position of the edge, the average distance between node 72 and other nodes is large, so the CC is small. Neighbor nodes of node 72 are not very important, so the EC is not high. It is worth noting that node 206 is the most important node in the CC recognition result, and node 160 is the most important node in the EC recognition result. The node with high EC importance is located in the central area of the network.
4.3. Node Importance Measurement Result Based on Passenger Flow of Urban Rail Network
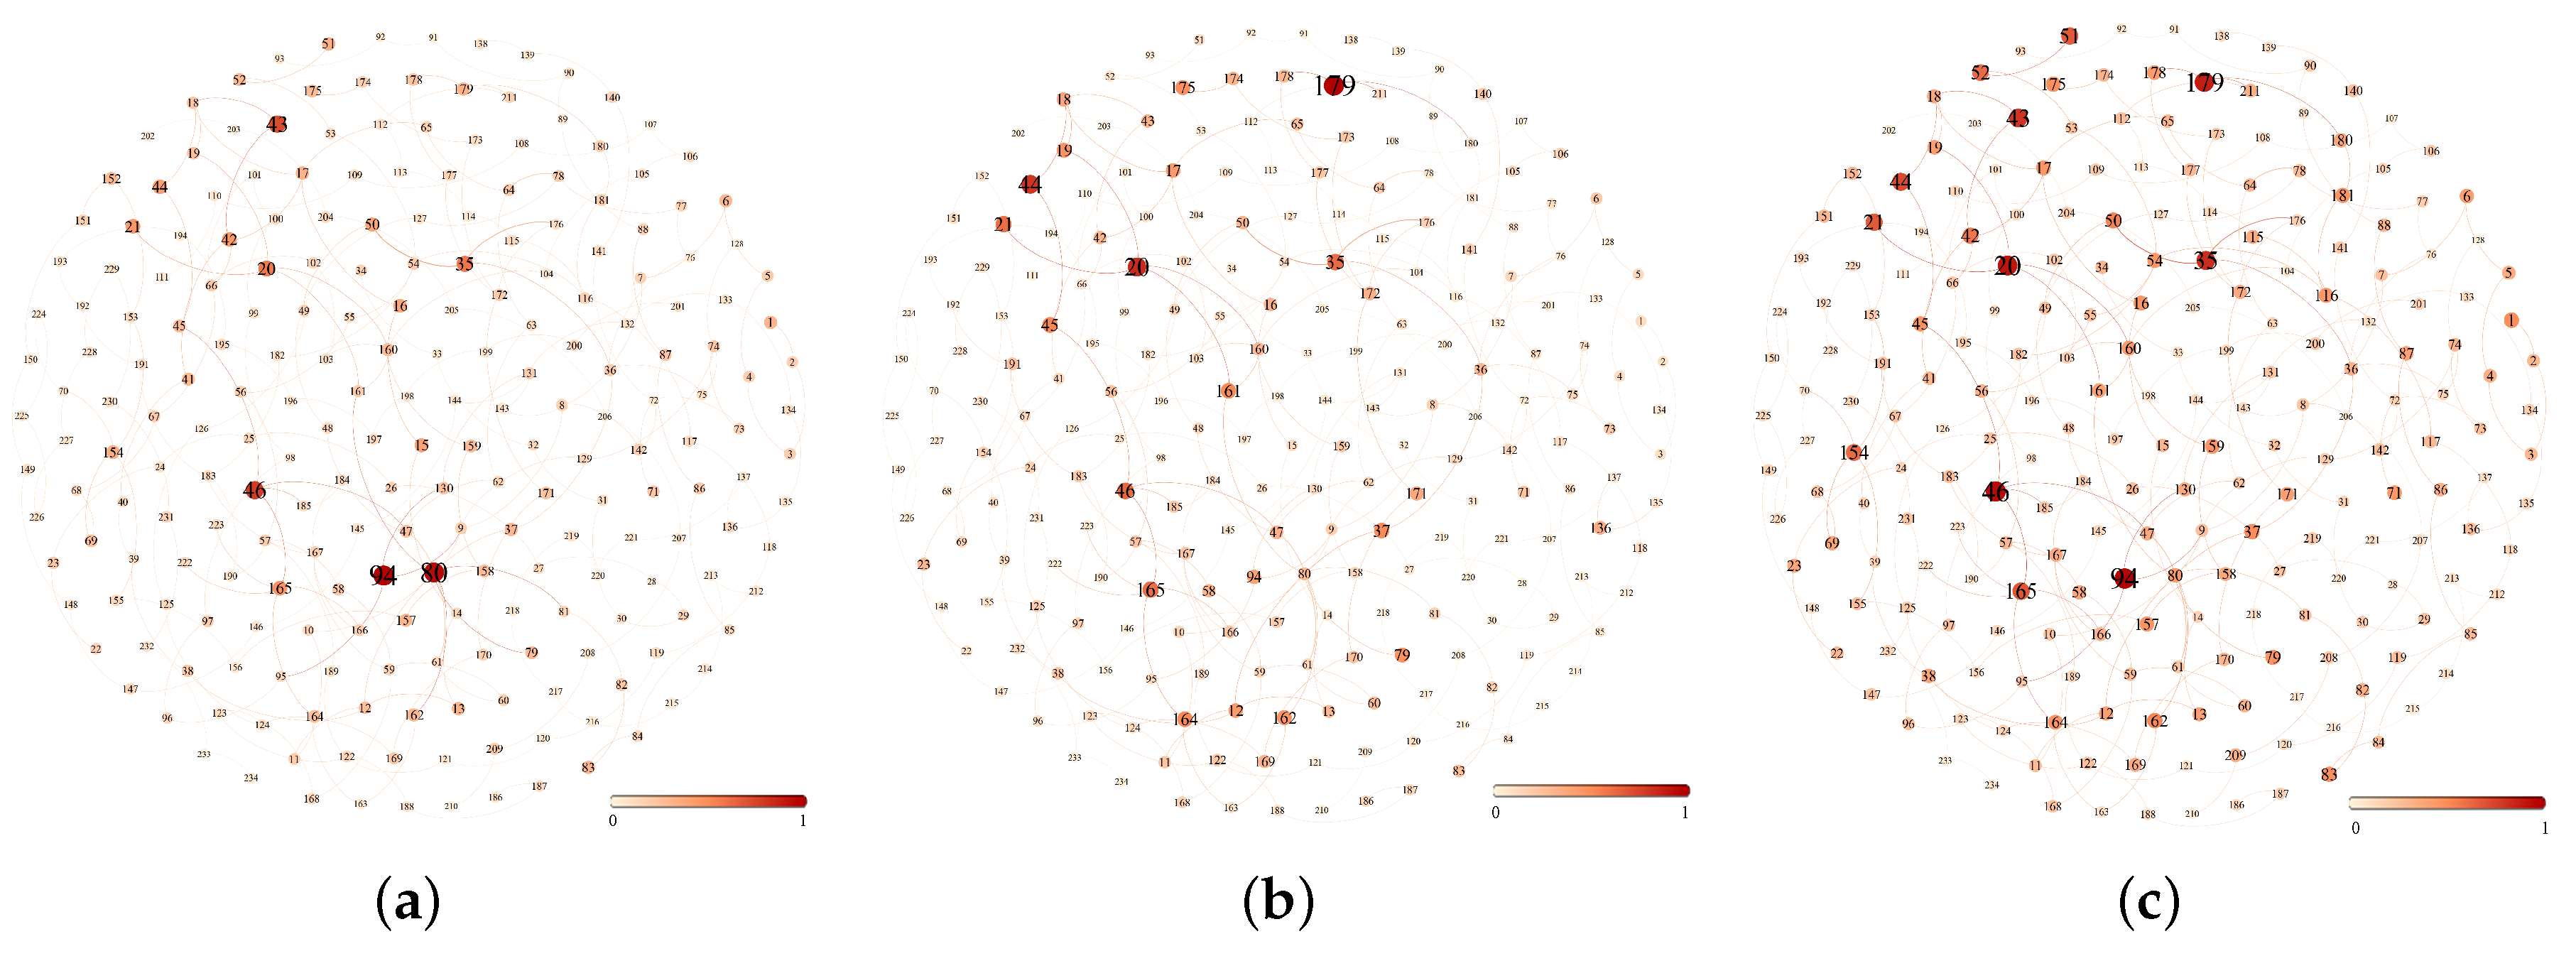
Taking the peak period (17:30–19:30) and the off-peak period (14:30–16:30) of 22 June 2016 and the full day inbound passenger flow as the measurement indicators, the importance of the nodes was ranked respectively. To facilitate data processing, the passenger flow data were normalized. Nodes of high importance in urban rail networks tend to have significant passenger flow characteristics. A ranking diagram of node importance by metrics of passenger flow is given, as shown in Figure 6. In the figure, the larger the diameter of the node and the darker the color, it means that the larger the passenger flow of the node and the higher the importance of the node.
As shown in Figure 6a, the nodes with large passenger flow during the off-peak period are Beijing West Railway Station, Beijing Station (large hub station with multiple modes of transportation), and Dongzhimen, Xizhimen, Guomao, and other multi line transfer stations. As shown in Figure 6b, the nodes with large passenger flow in peak period are mainly concentrated in No. 2 ring line and No. 10 ring line, such as Xierqi, Guomao, Chaoyangmen, Sanyuanqiao, Liangmaqiao, etc. As shown in Figure 6c, the important nodes obtained by the full day inbound passenger flow are mainly concentrated in the ring road and residential areas, such as xierqi, Guomao, Chaoyangmen, Tiantongyuan, Tiantongyuanbei, etc.
4.4. Node Importance Measurement Result Based on h-Index of Urban Rail Network
There are 234 urban rail network nodes, taking the passenger flow of the whole day as the sample, and the data collection interval is every half an hour, then the length of the passenger flow data sample is 48 (Taking full-day passenger inbound flow as an example, the calculation process of peak period and off-peak period are the same as this). After normalizing the original passenger flow matrix , the correlation coefficient matrix between 234 stations is calculated according to formula :
According to formula (1), the moment of the index coefficient between 234 stations is calculated according to formula :
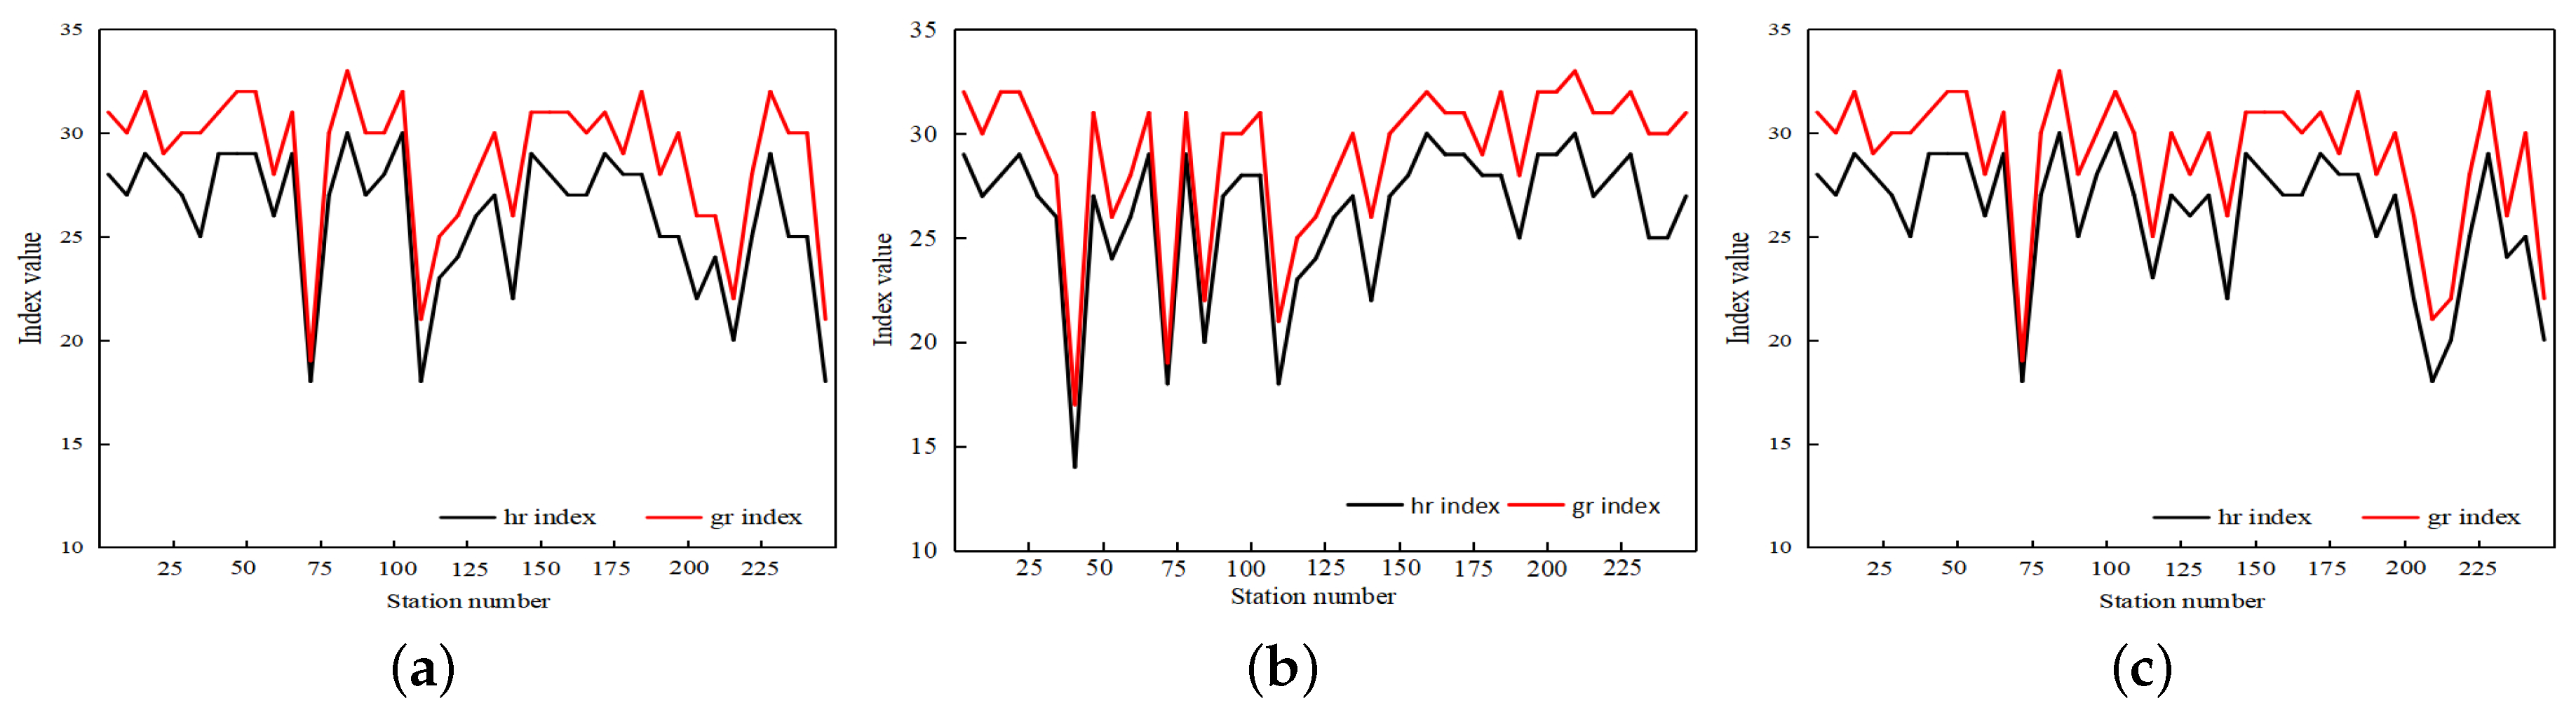
After obtaining the matrix of the index coefficients of the urban rail network nodes, all the nodes in the regional rail network are arranged in descending order for the index coefficients of node i. When and , the index of node i is obtained. Similarly, the index of node i can be obtained when and . A graph showing the results of the index and index of the node is shown in Figure 7.
The index and index of the nodes have similar fluctuation trends. From a vertical perspective, the exponential curve is always above the exponential curve, which is consistent with property 2.
Calculate the intersection degree and intersection value of the top ten nodes of the two sorting sequences are:
The first 10 elements of and after sorting are , , the intersection of and has seven elements , these seven elements are sorted in the and sets as (4, 3, 7, 2, 5, 8, 9) and (1, 2, 3, 4, 5, 6, 7), respectively. Then , , , , it means that the node identified by index is more important than the node identified by index.
4.5. Accuracy Analysis
Accuracy is used to evaluate the performance of the node importance measurement method. Accuracy refers to the proportion of the number of important nodes in the measurement result set. In order to calculate the accuracy of the node importance calculation method, it is necessary to know the order of importance of the nodes in the urban rail network in advance. Here, the accuracy of the urban rail network node importance degree proposed in the initial planning of the Beijing urban rail network planning is used.
In the initial stage of urban rail network planning, if the proposed ranking result of node importance is set U, the precision of ranking sequence X under is expressed as follows:
For instance, assume that the first 10 node importance set U set in the initial planning stage is U = , the first 10 node importance sets calculated by index is X = , then the intersection of two sets has three elements 3, 6, 9, = 3/10 = 0.3.
The accuracy of the index, the index, and the centrality index from 40 to 240 is calculated by Equation (14), as shown in Table 4.
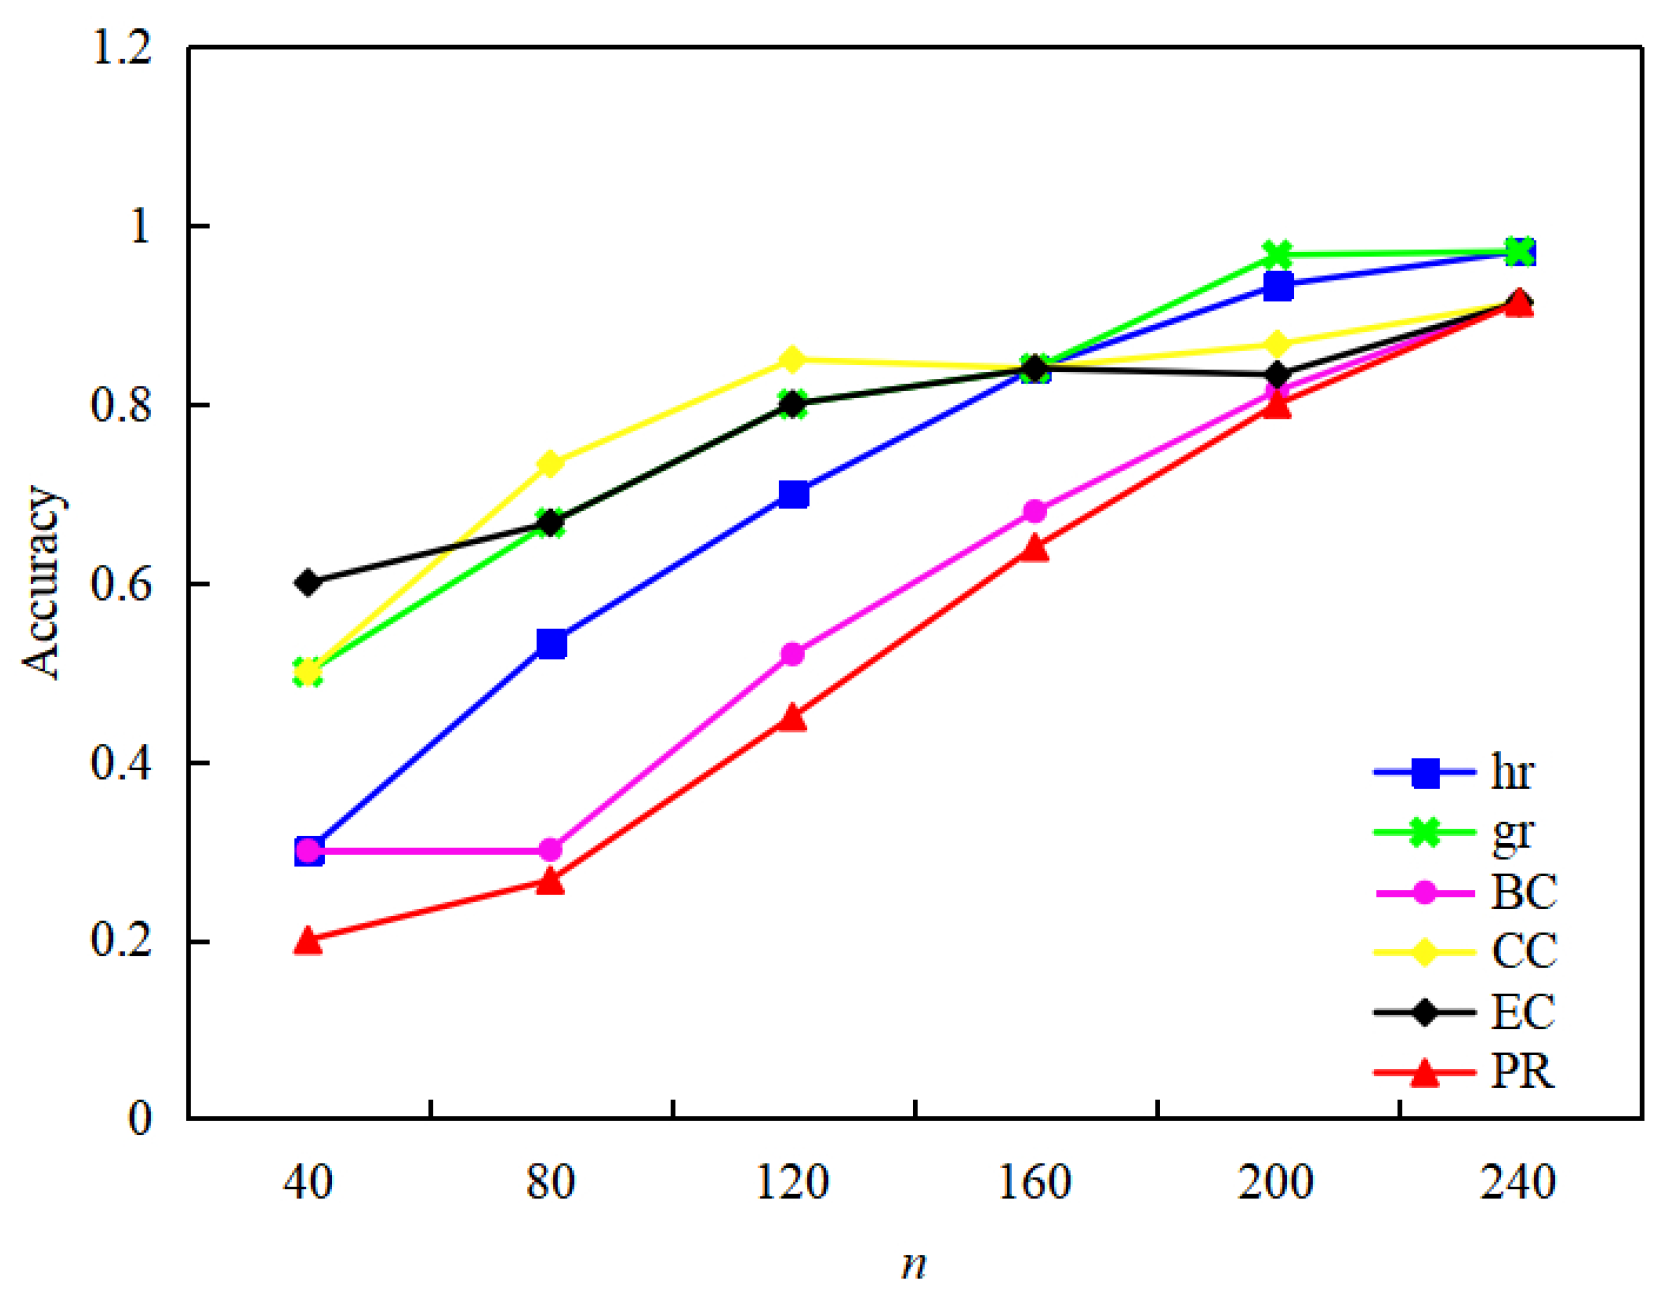
The accuracy diagrams of different calculation methods for the variation from 40 to 240 are given, as shown in Figure 8.
As can be seen from Figure 8: when , the measurement eigenvector centrality has the highest accuracy, and the index is the second; when , the closeness centrality has the highest accuracy, and the index is the second; when , the index has the highest accuracy, and the index is second. The feasibility of using index and index to analyze the importance of urban rail network nodes is illustrated. The more urban rail network nodes, the better the estimation results of index and index. The PageRank algorithm is applied to the urban rail network, and the node importance measurement accuracy is low.
4.6. Comparative Analysis
Since the degree of centrality is not discriminative, the proposed node importance measurement results based on index and index are compared with the result that based on BC, CC, EC, PageRank (PR), full-day passenger inbound flow (PF). The top ten most important nodes based on various metrics are shown in Table 5.
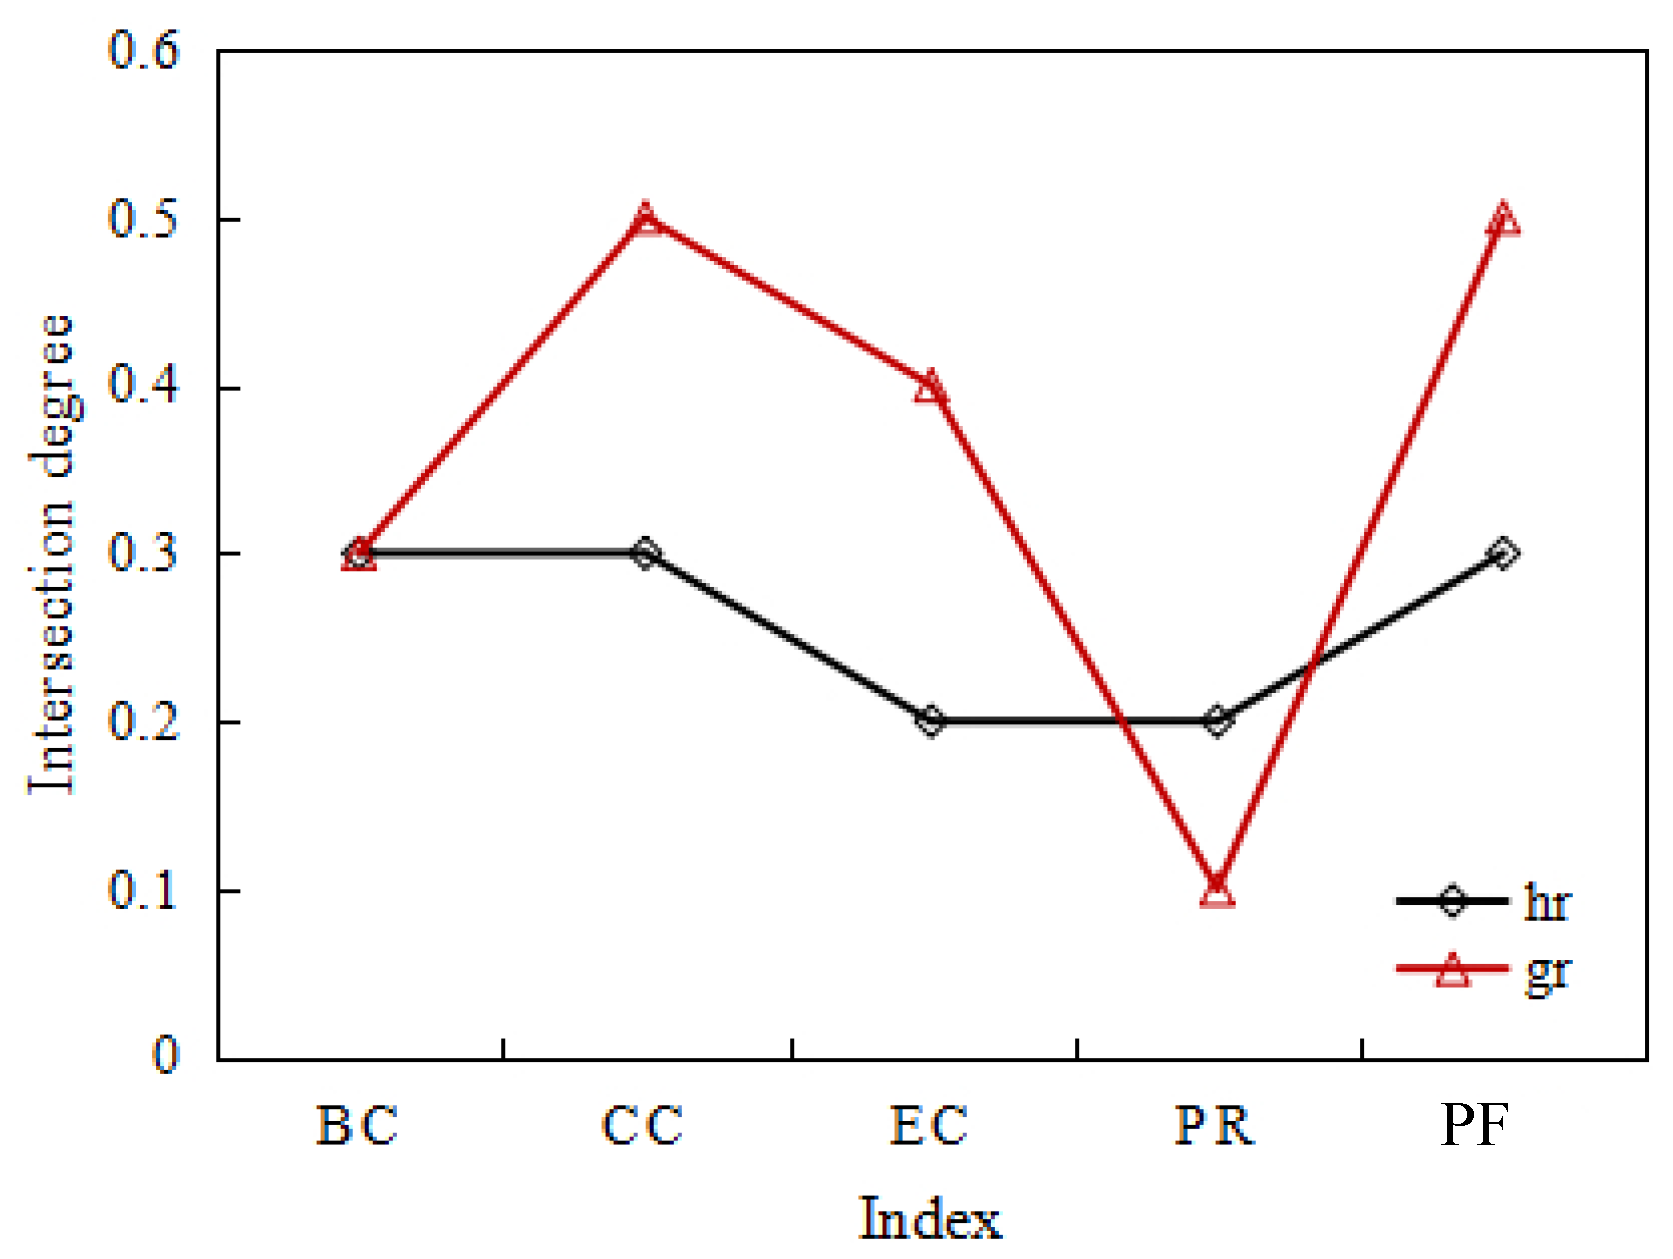
Calculate the intersection degree between the index and the index and the top ten most important nodes of other sequences, as shown in Figure 9.
It can be seen that the maximum intersection degree of the index and the betweenness centrality, the closeness centrality, and the full-day passenger inbound flow is 0.3. The minimum intersection degree of the index and the eigenvector centrality and PageRank is 0.2. The maximum intersection degree of the index and the closeness centrality and the full-day passenger inbound flow is 0.5. The intersection degree of index with the PageRank algorithm is at least 0.2. The index and the index have good intersection with the closeness centrality and full-day passenger inbound flow, but have a bad intersection with the PageRank algorithm. The closeness centrality reflects the topological characteristic of the network and the full-day passenger inbound flow shows the passenger flow characteristics of the network, which reflects the characteristics of the index and the , that is to say, considering both the network topology and passenger flow characteristics, balancing and optimizing the two aspects.
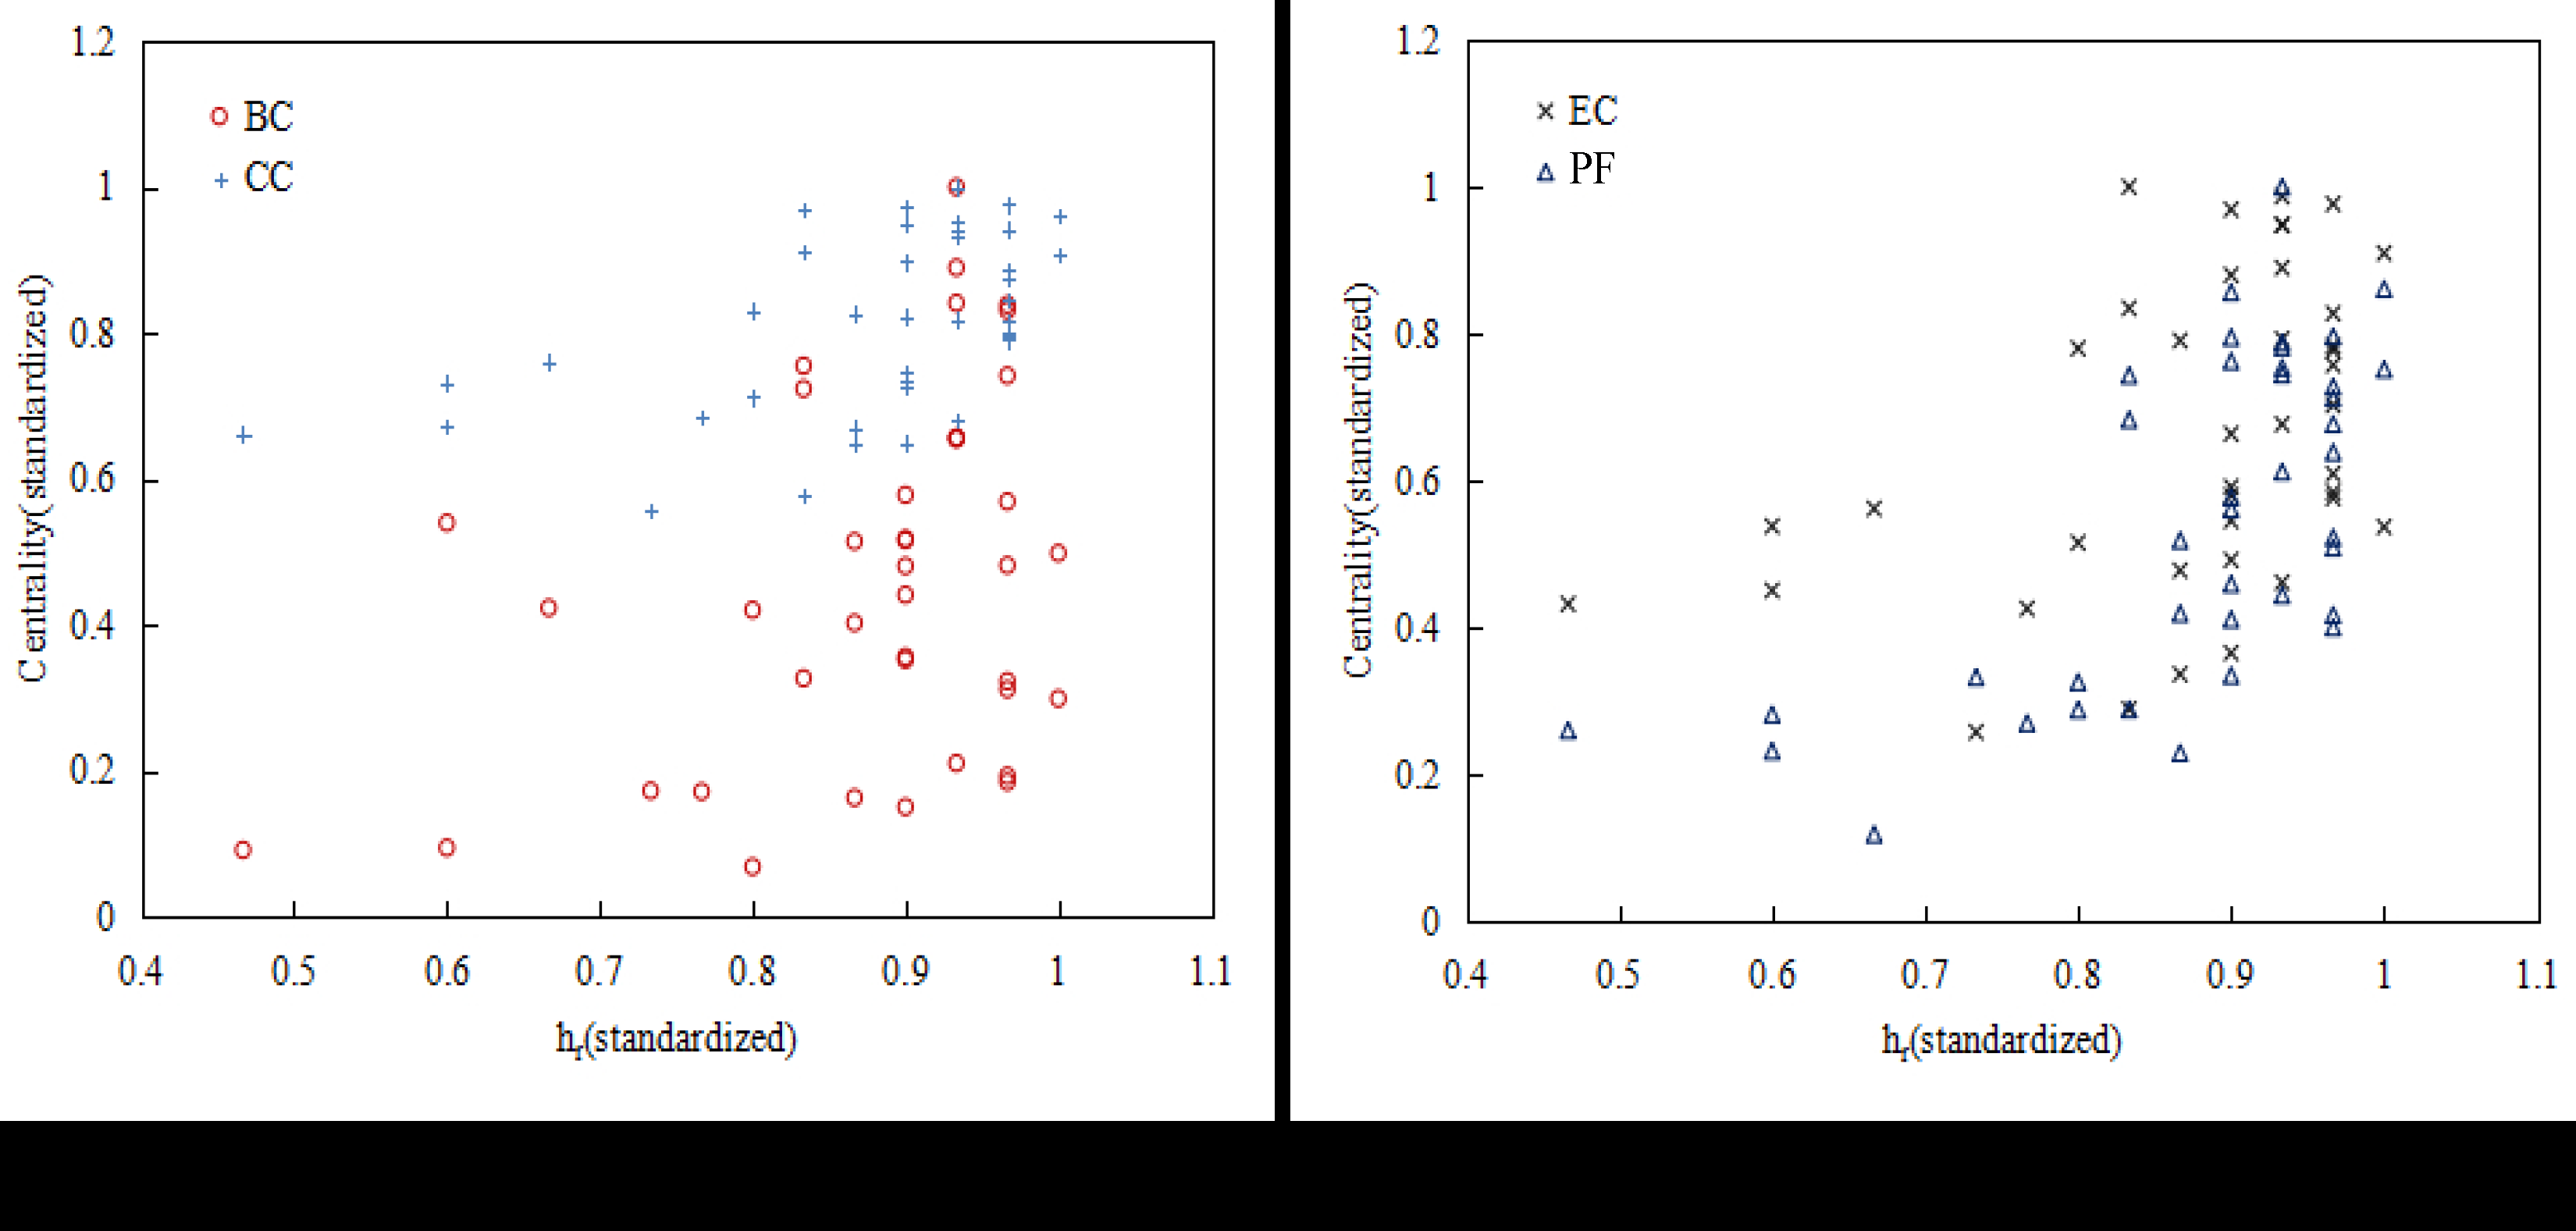
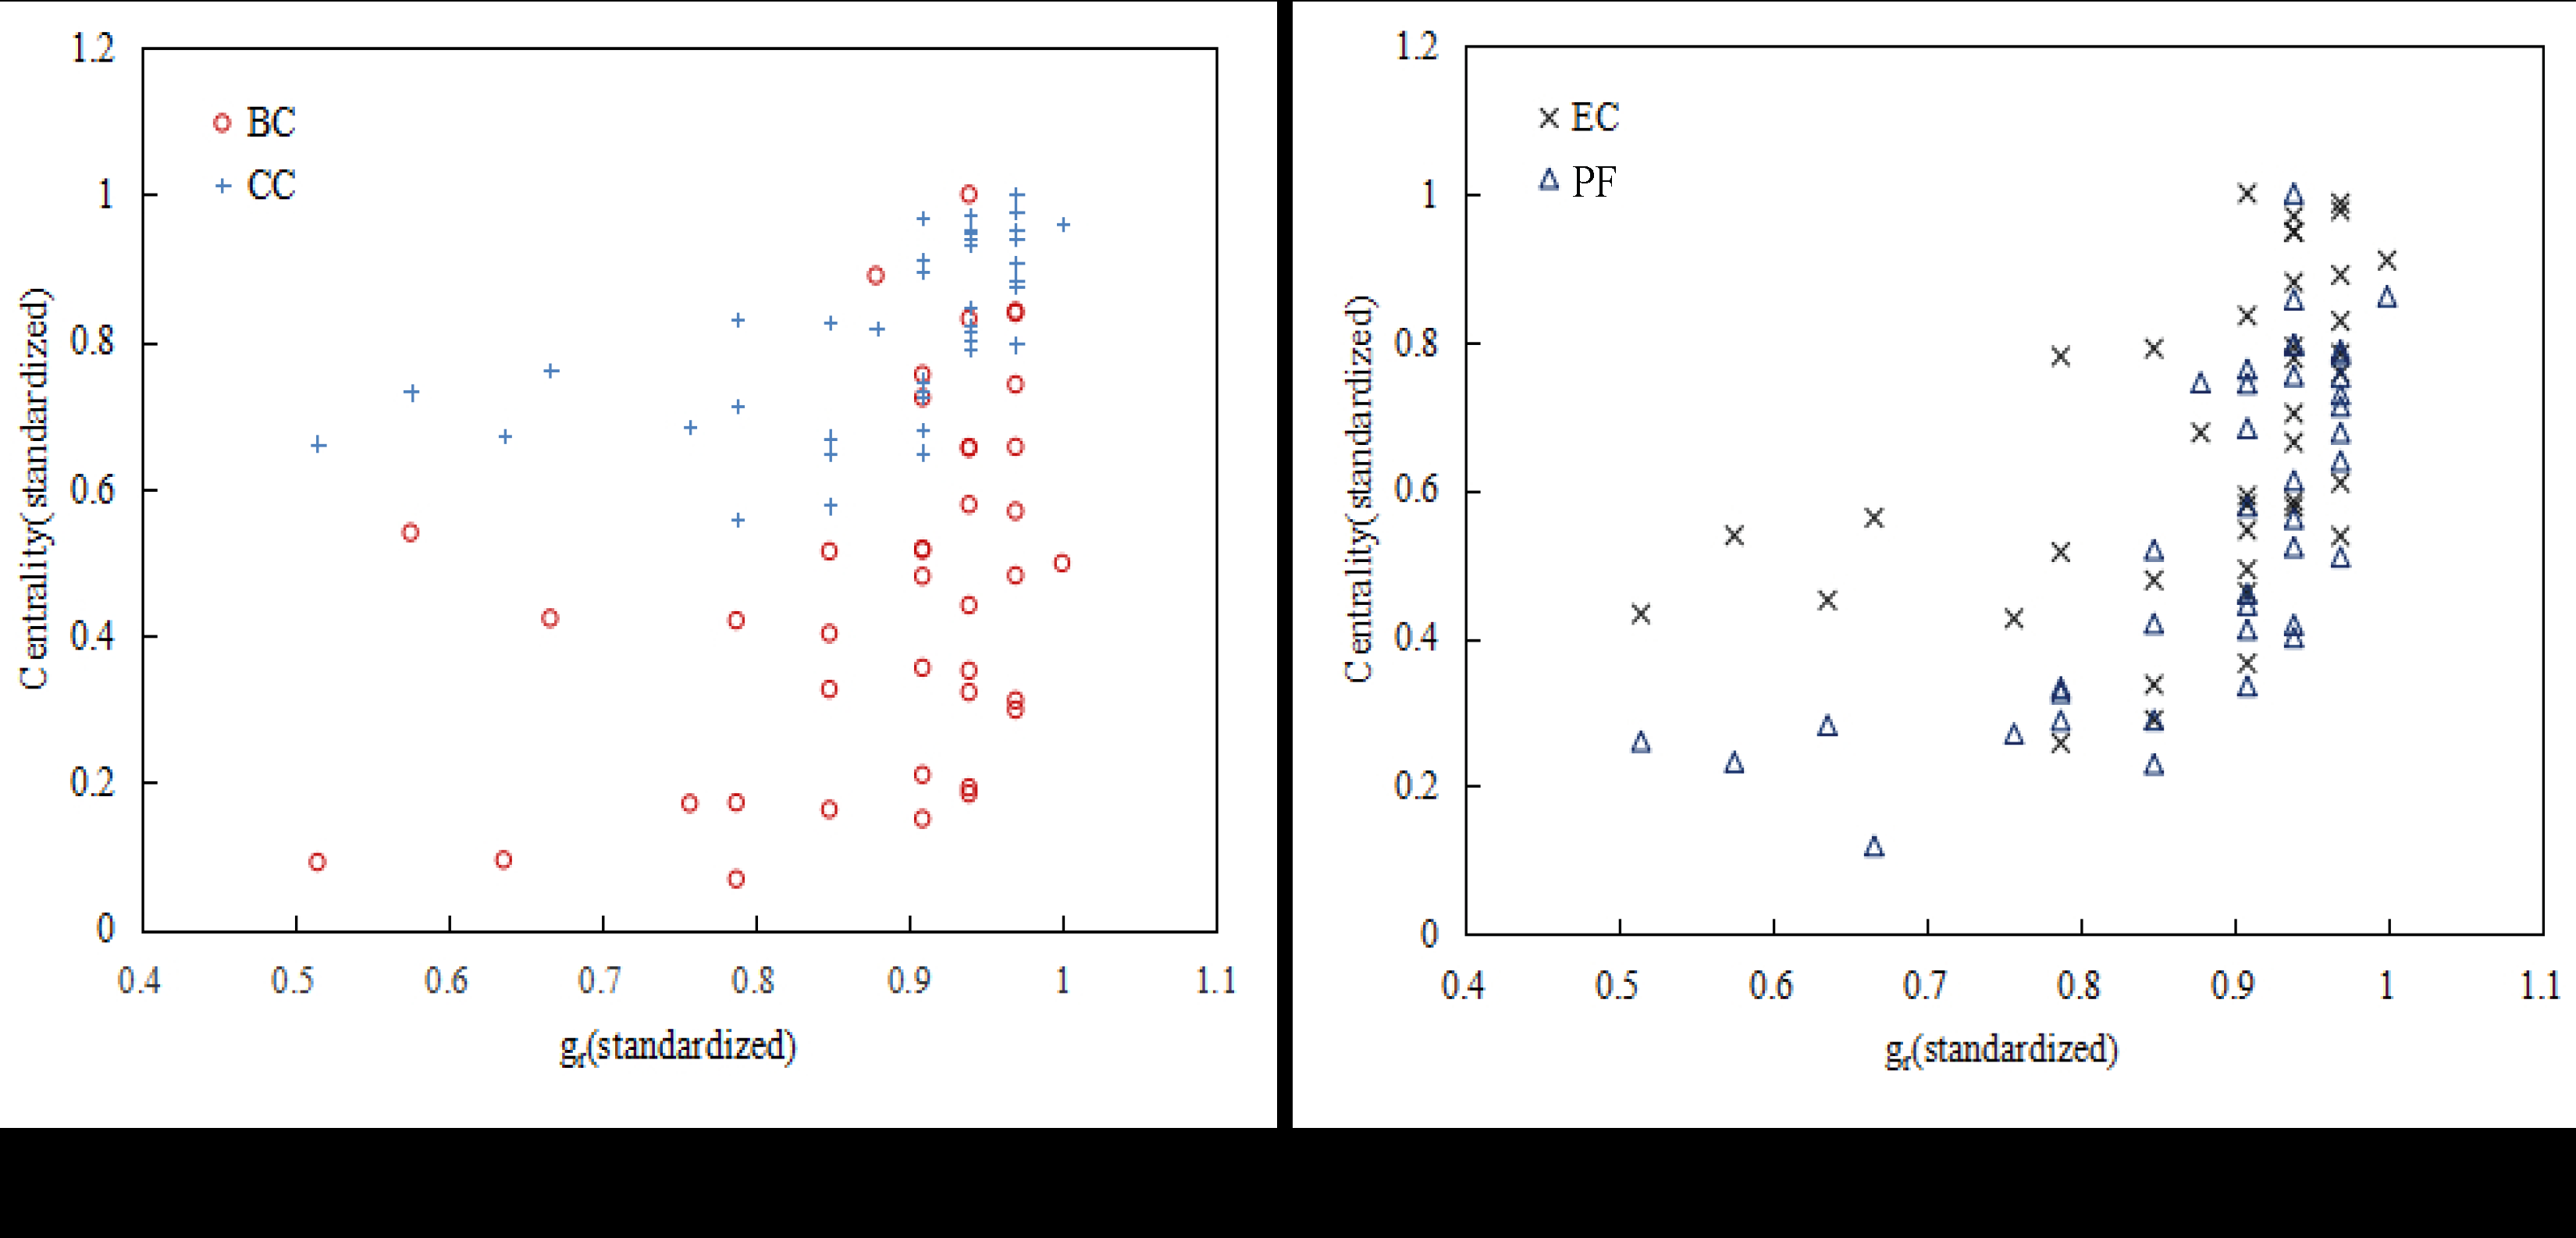
In addition to the PageRank algorithm, the intersection degree of index and the betweenness centrality, the closeness centrality, the eigenvector centrality, and the full-day passenger inbound flow are better than the index. In this respect, the index has a small number of correlations with passenger flow, but the nodes with high correlation coefficients are fairer and the recognition effect is better. Figure 10 shows the relationship between the index of the urban rail network nodes and the typical centrality metrics and full-day passenger inbound flow. Figure 11 shows the relationship between the index of the urban rail network nodes and the typical centrality metrics and full-day passenger inbound flow.
The index and the index have two metrics when measuring node importance: First, the nodes with strong correlation of the passenger flow space between the intersection nodes of the urban rail network are important. Second, the strength of the correlation must be kept above a certain “scale”, and the node is judged to be important. This “scale” is the index and the index. In addition, the calculation process of the index and the index also includes a property. That is, when a node is implemented as a target node, other nodes in the network are treated as nodes adjacent to it. This adjacency is achieved by spatial correlation. In this sense, the index and the index also extend the concept of nodal degrees. In the traditional node degree calculation, only the node that is connected to the node in the actual physical network is regarded as its neighbor node. It can be seen that the index and the index are different in the calculation concept from the centrality index based on the single nature of one aspect of the network topology. Therefore, the consistency of the results with other indicators is not strong, which is also the difference and innovation between index, index, and other existing indexes.
5. Conclusions and Future Work
Identifying key nodes in the urban rail network helps the traffic management department to study the reliability of the urban rail network and formulate passenger flow guidance and control strategies. In the paper, considering the topology and passenger flow characteristics of the urban rail network, the importance index method of urban rail network nodes based on the h-index is proposed. What is more, the feasibility of the index and index are verified by an case analysis. These two indexes consider the spatial correlation of node passenger flow, and take into account the number of nodes in the urban rail network and the influence of the nodes themselves.
Due to the different research mechanisms of different indicators, the results are different. On the basis of the above, the h-index and the centrality index and other indicators can be further studied in combination. In addition, this paper only discusses the importance ranking of urban rail network nodes, and how to optimize the line network and operation management based on the results still need further study. For example, from the perspective of operation safety, how many stations need to be controlled, and which station control can ensure the minimum safety risk and the maximum passenger flow volume still need further discussion. From the perspective of urban traffic network planning, how to combine the existing results to plan new metro lines, more broadly, how to coordinate operation between urban rail and bus systems with the existing results, so as to form a highly coupled public transport system. These directions have practical application background and can be used as the direction of follow-up research.
Author Contributions
Data curation, P.Z.; Funding acquisition, G.Z.; Investigation, P.Z.; Methodology, X.L.; Software, X.L.; Supervision, G.Z.; Validation, X.L.; Writing—original draft, X.L.
Funding
This work is supported by the Fundamental Research Funds for the Central Universities (No. 2019YJS103), the National Science Foundation of China (No. 61872037, 61833002(3)).
Acknowledgments
Special thanks to the three anonymous reviewers for their suggestions.
Conflicts of Interest
The authors declare no conflict of interest.
References
- Xing, Y.; Lu, J.; Chen, S.; Dissanayake, S. Vulnerability analysis of urban rail transit based on complex network theory: A case study of shanghai metro. Public Transp. 2017, 9, 501–525. [Google Scholar] [CrossRef]
- Zhang, J.; Wang, M. Transportation functionality vulnerability of urban rail transit networks based on movingblock: The case of Nanjing metro. Phys. A Stat. Mech. Its Appl. 2019, 535, 122367. [Google Scholar] [CrossRef]
- Shen, Y.; Ren, G.; Ran, B. Cascading failure analysis and robustness optimization of metro networks based on coupled map lattices: a case study of Nanjing, China. Transportation 2019, 11, 1–17. [Google Scholar] [CrossRef]
- Li, W.; Cai, X. Empirical analysis of a scale-free railway network in china. Phys. A Stat. Mech. Its Appl. 2007, 382, 693–703. [Google Scholar] [CrossRef]
- Lin, J.; Ban, Y. Complex Network Topology of Transportation Systems. Transp. Rev. A Transnatl. Transdiscip. J. 2013, 33, 658–685. [Google Scholar] [CrossRef]
- Zhang, J.; Xu, X.; Hong, L.; Wang, S.; Fei, Q. Networked analysis of the shanghai subway network, in china. Phys. A Stat. Mech. Its Appl. 2011, 390, 4562–4570. [Google Scholar] [CrossRef]
- Zhang, J.; Wang, S.; Zhang, Z.; Zou, K.; Shu, Z. Characteristics on hub networks of urban rail transit networks. Phys. A Stat. Mech. Its Appl. 2016, 447, 502–507. [Google Scholar] [CrossRef]
- Xu, M.; Wu, J.; Liu, M.; Xiao, Y.; Wang, H.; Hu, D. Discovery of Critical Nodes in Road Networks Through Mining From Vehicle Trajectories. IEEE Trans. Intell. Transp. Syst. 2019, 20, 583–593. [Google Scholar] [CrossRef]
- Hu, Y.; Chen, F.; Chen, P.; Tan, Y. The influence of passenger flow on the topology characteristics of urban rail transit networks. Int. J. Mod. Phys. B 2017, 31, 1750181. [Google Scholar] [CrossRef]
- Agryzkov, T.; Oliver, J.L.; Tortosa, L.; Vicent, J.F. An algorithm for ranking the nodes of an urban network based on the concept of PageRank vector. Appl. Math. Comput. 2012, 219, 2186–2193. [Google Scholar] [CrossRef]
- Agryzkov, T.; Tortosa, L.; Vicent, J.F. New highlights and a new centrality measure based on the Adapted PageRank Algorithm for urban networks. Appl. Math. Comput. 2016, 291, 14–29. [Google Scholar] [CrossRef]
- Hirsch, J.E. An index to quantify an individual’s scientific research output. Proc. Natl. Acad. Sci. USA 2005, 102, 16569–16572. [Google Scholar] [CrossRef] [PubMed]
- Pastor-Satorras, R.; Castellano, C. Topological structure and the h index in complex networks. Phys. Rev. E 2017, 95, 022301. [Google Scholar] [CrossRef] [PubMed]
- Lü, L.; Zhou, T.; Zhang, Q.M.; Stanley, H.E. The h-index of a network node and its relation to degree and coreness. Nat. Commun. 2016, 7, 10168. [Google Scholar] [CrossRef] [PubMed]
- Hu, S.-W.; Li, B.; He, P.; Zhao, Y.-Q.; Liu, H.-Y. Approach based h-index to measuring the important classes in software network. J. Chin. Comput. Syst. 2017, 38, 249–253. [Google Scholar]
- Yi, D.; Bing, L.I.; Can, C.; Yuqi, Z. A method of node importance measurement in software network based on the variations of h-index. Adv. Eng. Sci. 2017, 49, 136–144. [Google Scholar]
- Egghe, L. Theory and practise of the g-index. Scientometrics 2006, 69, 131–152. [Google Scholar] [CrossRef]
- Hillier, B.; Hanson, J. The Social Logic of Space; Cambridge University Press: Cambridge, NY, USA, 1984. [Google Scholar]
- Blanchard, P.; Volchenkov, D. Mathematical Analysis of Urban Spatial Networks; Springer: Berlin/Heidelberg, Germany, 2009. [Google Scholar]
- Diestel, R. Graph-theory. Math. Gaz. 2000, 173, 67–128. [Google Scholar]
- Abbas, A.M. Bounds and inequalities relating h-index, g-index, e-index and generalized impact factor: An improvement over existing models. PLoS ONE 2012, 7, e33699. [Google Scholar] [CrossRef] [PubMed] [Green Version]
Figure 1.
Simplified network structure and passenger flow relationship.

Figure 2.
Process of calculating the importance degree of urban rail transit network nodes based on h-index.
Figure 2.
Process of calculating the importance degree of urban rail transit network nodes based on h-index.

Figure 3.
Topological map of an urban rail network.

Figure 4.
Node degree distribution of urban rail network: (a) Measurement results of node importance based on node degree; (b) Distribution characteristics of node degree in urban rail network.
Figure 4.
Node degree distribution of urban rail network: (a) Measurement results of node importance based on node degree; (b) Distribution characteristics of node degree in urban rail network.

Figure 5.
BC, CC, EC, PageRank (PR) node importance measurement results (Diameter and color shade represent the size of the value) (a) BC node importance; (b) CC node importance; (c) EC node importance; (d) PR node importance.
Figure 5.
BC, CC, EC, PageRank (PR) node importance measurement results (Diameter and color shade represent the size of the value) (a) BC node importance; (b) CC node importance; (c) EC node importance; (d) PR node importance.

Figure 6.
Node importance result based on passenger flow at urban rail station (a) Node importance based on passenger flow in off peak hours; (b) Node importance based on passenger flow in peak hours; (c) Node importance based on full day passenger flow.
Figure 6.
Node importance result based on passenger flow at urban rail station (a) Node importance based on passenger flow in off peak hours; (b) Node importance based on passenger flow in peak hours; (c) Node importance based on full day passenger flow.

Figure 7.
Calculation result of the index and index of the nodes (a) Calculation result based on passenger flow in off peak hours; (b) Calculation result based on passenger flow in peak hours; (c) Calculation result based on full day passenger flow.
Figure 7.
Calculation result of the index and index of the nodes (a) Calculation result based on passenger flow in off peak hours; (b) Calculation result based on passenger flow in peak hours; (c) Calculation result based on full day passenger flow.

Figure 8.
Precision accuracy of different methods.

Figure 9.
Statistical values of intersection between the new index and the existing index.

Figure 10.
Relationship between the value of index and other index (a) Relationship between and typical metrics (BC, CC); (b) Relationship between and typical metrics (EC, full-day passenger inbound flow [PF]).
Figure 10.
Relationship between the value of index and other index (a) Relationship between and typical metrics (BC, CC); (b) Relationship between and typical metrics (EC, full-day passenger inbound flow [PF]).

Figure 11.
Relationship between the value of index and other index (a) Relationship between and typical metrics (BC, CC); (b) Relationship between and typical metrics (EC, PF).
Figure 11.
Relationship between the value of index and other index (a) Relationship between and typical metrics (BC, CC); (b) Relationship between and typical metrics (EC, PF).


Table 1.
Node importance measurement indicators based on complex network centrality.
| Index | Definition | Calculation Method |
|---|---|---|
| Degree Centrality | Degree centrality (DC) is the most direct measure of the centrality of a node. The greater the degree of a node, the higher the degree of centrality of the node, and the more important the node is in the network. | , N is the total number of network nodes; represents a collection of neighbor nodes of node i |
| Betweenness Centrality | The Betweenness centrality (BC) indicator is used to measure the importance of the individual status of a social network. The measure of BC is the shortest number of paths through a node. | , N is the total number of nodes in the network; represents the number of all shortest paths through node i in the shortest path from node s to node t. |
| Closeness Centrality | Closeness centrality (CC) is used to measure the ability of a node to influence other nodes through the network. Its metric is the topological distance between nodes. | , represents the shortest distance between node i and node j. |
| Eigenvector Centrality | Eigenvector centrality (EC) is an indicator that takes into account the number of neighbor nodes and the importance of neighbor nodes. Its basic idea is that the neighbor nodes of the node have different effects on the node. | , is the set of neighbor nodes of node i, where is a constant. |
Table 2.
Statistical values of urban rail network.
| N | E | <k> | L | C | |
|---|---|---|---|---|---|
| 234 | 256 | 2.188 | 4 | 13.797 | 0.003 |
Table 3.
Calculation results of degree centrality (DC), betweenness centrality (BC), closeness centrality (CC), eigenvector centrality (EC), and PageRank for some nodes.
Table 3.
Calculation results of degree centrality (DC), betweenness centrality (BC), closeness centrality (CC), eigenvector centrality (EC), and PageRank for some nodes.
| Nodes | DC | Ranking Results | BC | Ranking Results | CC | Ranking Results | EC | Ranking Results | PR | Ranking Results |
|---|---|---|---|---|---|---|---|---|---|---|
| 2 | 2 | 35 | 210 | 179 | 0.0568 | 203 | 0.0785 | 211 | 0.0049 | 44 |
| 16 | 2 | 35 | 904.25 | 124 | 0.0986 | 36 | 0.3471 | 63 | 0.0036 | 179 |
| 58 | 2 | 35 | 413.81 | 168 | 0.0837 | 104 | 0.4423 | 33 | 0.0034 | 213 |
| 95 | 2 | 35 | 1256.6 | 87 | 0.0835 | 105 | 0.2310 | 102 | 0.0038 | 155 |
| 123 | 2 | 35 | 1108.5 | 107 | 0.0839 | 102 | 0.3582 | 58 | 0.0035 | 189 |
| 199 | 2 | 35 | 418 | 158 | 0.0498 | 216 | 0.0993 | 202 | 0.0046 | 53 |
| 225 | 2 | 35 | 1818 | 56 | 0.0650 | 185 | 0.1247 | 150 | 0.0042 | 106 |
| 233 | 2 | 35 | 210 | 179 | 0.0435 | 227 | 0.0783 | 213 | 0.0049 | 39 |
| 12 | 4 | 3 | 1886.9 | 53 | 0.0974 | 41 | 0.4396 | 35 | 0.0068 | 11 |
| 20 | 4 | 3 | 1605.7 | 69 | 0.0917 | 69 | 0.8774 | 2 | 0.00657 | 16 |
| 36 | 4 | 3 | 5543.4 | 1 | 0.0990 | 33 | 0.5511 | 18 | 0.00655 | 17 |
| 49 | 4 | 3 | 4090 | 10 | 0.1014 | 25 | 0.5083 | 24 | 0.00652 | 19 |
| 116 | 4 | 3 | 1741.5 | 62 | 0.0779 | 132 | 0.5285 | 22 | 0.00689 | 10 |
| 183 | 4 | 3 | 4131.3 | 9 | 0.0859 | 91 | 0.6997 | 11 | 0.00647 | 21 |
Table 4.
Precision accuracy of different methods.
| BC | CC | EC | PR | |||
|---|---|---|---|---|---|---|
| 0.300 | 0.500 | 0.300 | 0.500 | 0.600 | 0.200 | |
| 0.533 | 0.667 | 0.301 | 0.733 | 0.667 | 0.267 | |
| 0.700 | 0.800 | 0.520 | 0.850 | 0.800 | 0.450 | |
| 0.840 | 0.840 | 0.680 | 0.840 | 0.840 | 0.640 | |
| 0.933 | 0.967 | 0.815 | 0.867 | 0.833 | 0.800 | |
| 0.971 | 0.971 | 0.914 | 0.914 | 0.914 | 0.914 |
Table 5.
Calculation results of DC, BC, CC, EC, and PageRank for some nodes.
| Sort | BC | CC | EC | PR | PF | ||
|---|---|---|---|---|---|---|---|
| 1 | 210 | 160 | 36 | 206 | 160 | 165 | 35 |
| 2 | 183 | 179 | 35 | 205 | 20 | 160 | 154 |
| 3 | 179 | 183 | 167 | 207 | 161 | 72 | 59 |
| 4 | 160 | 160 | 75 | 204 | 167 | 154 | 80 |
| 5 | 17 | 22 | 9 | 208 | 17 | 80 | 18 |
| 6 | 20 | 17 | 74 | 28 | 42 | 172 | 20 |
| 7 | 59 | 66 | 66 | 27 | 46 | 74 | 150 |
| 8 | 80 | 128 | 131 | 29 | 18 | 122 | 128 |
| 9 | 150 | 174 | 183 | 203 | 165 | 131 | 174 |
| 10 | 128 | 154 | 49 | 209 | 59 | 116 | 22 |
© 2019 by the authors. Licensee MDPI, Basel, Switzerland. This article is an open access article distributed under the terms and conditions of the Creative Commons Attribution (CC BY) license (http://creativecommons.org/licenses/by/4.0/).
Share and Cite
MDPI and ACS Style
Li, X.; Zhang, P.; Zhu, G. Measuring Method of Node Importance of Urban Rail Network Based on H Index. Appl. Sci. 2019, 9, 5189. https://doi.org/10.3390/app9235189
AMA Style
Li X, Zhang P, Zhu G. Measuring Method of Node Importance of Urban Rail Network Based on H Index. Applied Sciences. 2019; 9(23):5189. https://doi.org/10.3390/app9235189
Chicago/Turabian StyleLi, Xiaolu, Peng Zhang, and Guangyu Zhu. 2019. "Measuring Method of Node Importance of Urban Rail Network Based on H Index" Applied Sciences 9, no. 23: 5189. https://doi.org/10.3390/app9235189
Note that from the first issue of 2016, this journal uses article numbers instead of page numbers. See further details here.