Modeling of Muscle Activation from Electromyography Recordings in Patients with Cerebral Palsy

1
Research Unit of the Buhl-Strohmaier Foundation for Cerebral Palsy and Pediatric Neuroorthopaedics, Orthopedic Department, Klinikum rechts der Isar, Technical University of Munich, 81675 Munich, Germany
2
Markus Würth Professorship, Technical University of Munich, 81675 Munich, Germany
*
Author to whom correspondence should be addressed.
Appl. Sci. 2018, 8(12), 2345; https://doi.org/10.3390/app8122345
Submission received: 18 October 2018
/
Revised: 7 November 2018
/
Accepted: 17 November 2018
/
Published: 22 November 2018
(This article belongs to the Section Applied Biosciences and Bioengineering)
Abstract
:The present study estimated muscle activation from electromyographic (EMG) recordings in patients with cerebral palsy (CP) during cycling on an ergometer. This could be used as an input to the modeling of muscle force following the neuromusculoskeletal modeling technique which can help to understand the alterations in neuromotor processes underlying disabilities in CP. EMG signals of lower extremity muscle activity from 14 adult patients with CP and 10 adult healthy participants were used here to derive muscle activation. With a self developed EMG system, signals from the following muscles were recorded: Musculus tibialis anterior, Musculus gastrocnemius, Musculus rectus femoris, and Musculus biceps femoris. Collected EMG signals were mathematically transformed into muscle activation following a parameter dependent and a nonlinear transformation. Muscle activation values from patients with CP were compared to equivalent reference values obtained from healthy controls. Muscle activation calculated at specific foot positions deviated clearly from reference values. The deviation was larger for patients with higher degree of spasticity. Observations underline the need of muscle force modeling during cycling for individualized cycling training for rehabilitation strategy.
1. Introduction
An exact description of the way deficient neuronal activity leads to motor impairments and deficient sensorimotor integration in cerebral palsy (CP) is still missing. CP has its origin in damage during early brain development. The main symptoms are impairments of motor function [1,2], but other problems, such as learning disability, speech disorders and behavioral problems, are often also present [3,4]. Depending on the extent of the brain damage, motor limitations can range from a slightly limited ability to walk to a permanent dependence of a wheelchair to move. Muscular imbalances in CP, together with increased spastic muscle tone, lead to severe contractures and joint deformities [1].
Injury to cerebral motor cortex in CP affects the neuronal input to corticospinal and reticulospinal tracts, and consequently affects the input of motor neurons to muscle fibers they innervate [2,5]. These alterations in neuronal-muscular pathways lead to alterations in musculoskeletal functioning. Despite the neuronal origin of the multifactorial disability in CP, it is not entirely understood to what extent and exactly how damage to the corticospinal tract neurons affects functioning of the muscles they innervate.
Modeling neuromusculoskeletal processes, and the kinematics of the associated movements can help to understand the alterations in neuromotor processes underlying disabilities in CP. Knowledge of inter-muscular forces during movement could also be an important direction for developing rehabilitation programs for patients with CP. The relationship between EMG and muscle force output has long been a subject of discussion [6,7,8]. Some investigators described a linear relationship between electromyography signal (EMG) and force produced by voluntary isometric contraction in human muscle [6], while others have found a nonlinear relationship [9]. Some suggest the combination of linear and nonlinear relationship depending on the muscle fiber composition and fiber distribution [7].
In case of children with CP, the EMG–force relationship has been studied using gait analysis, estimating the joint moment of lower limbs [10,11,12,13,14]. However, abnormal muscle activity in patients with CP influences the choice of estimation method to find a close relationship between EMG and force [14]. Studies of isometric bicep contraction in children with CP with secondary distonia showed a larger force variability in these children compared to controls [12].
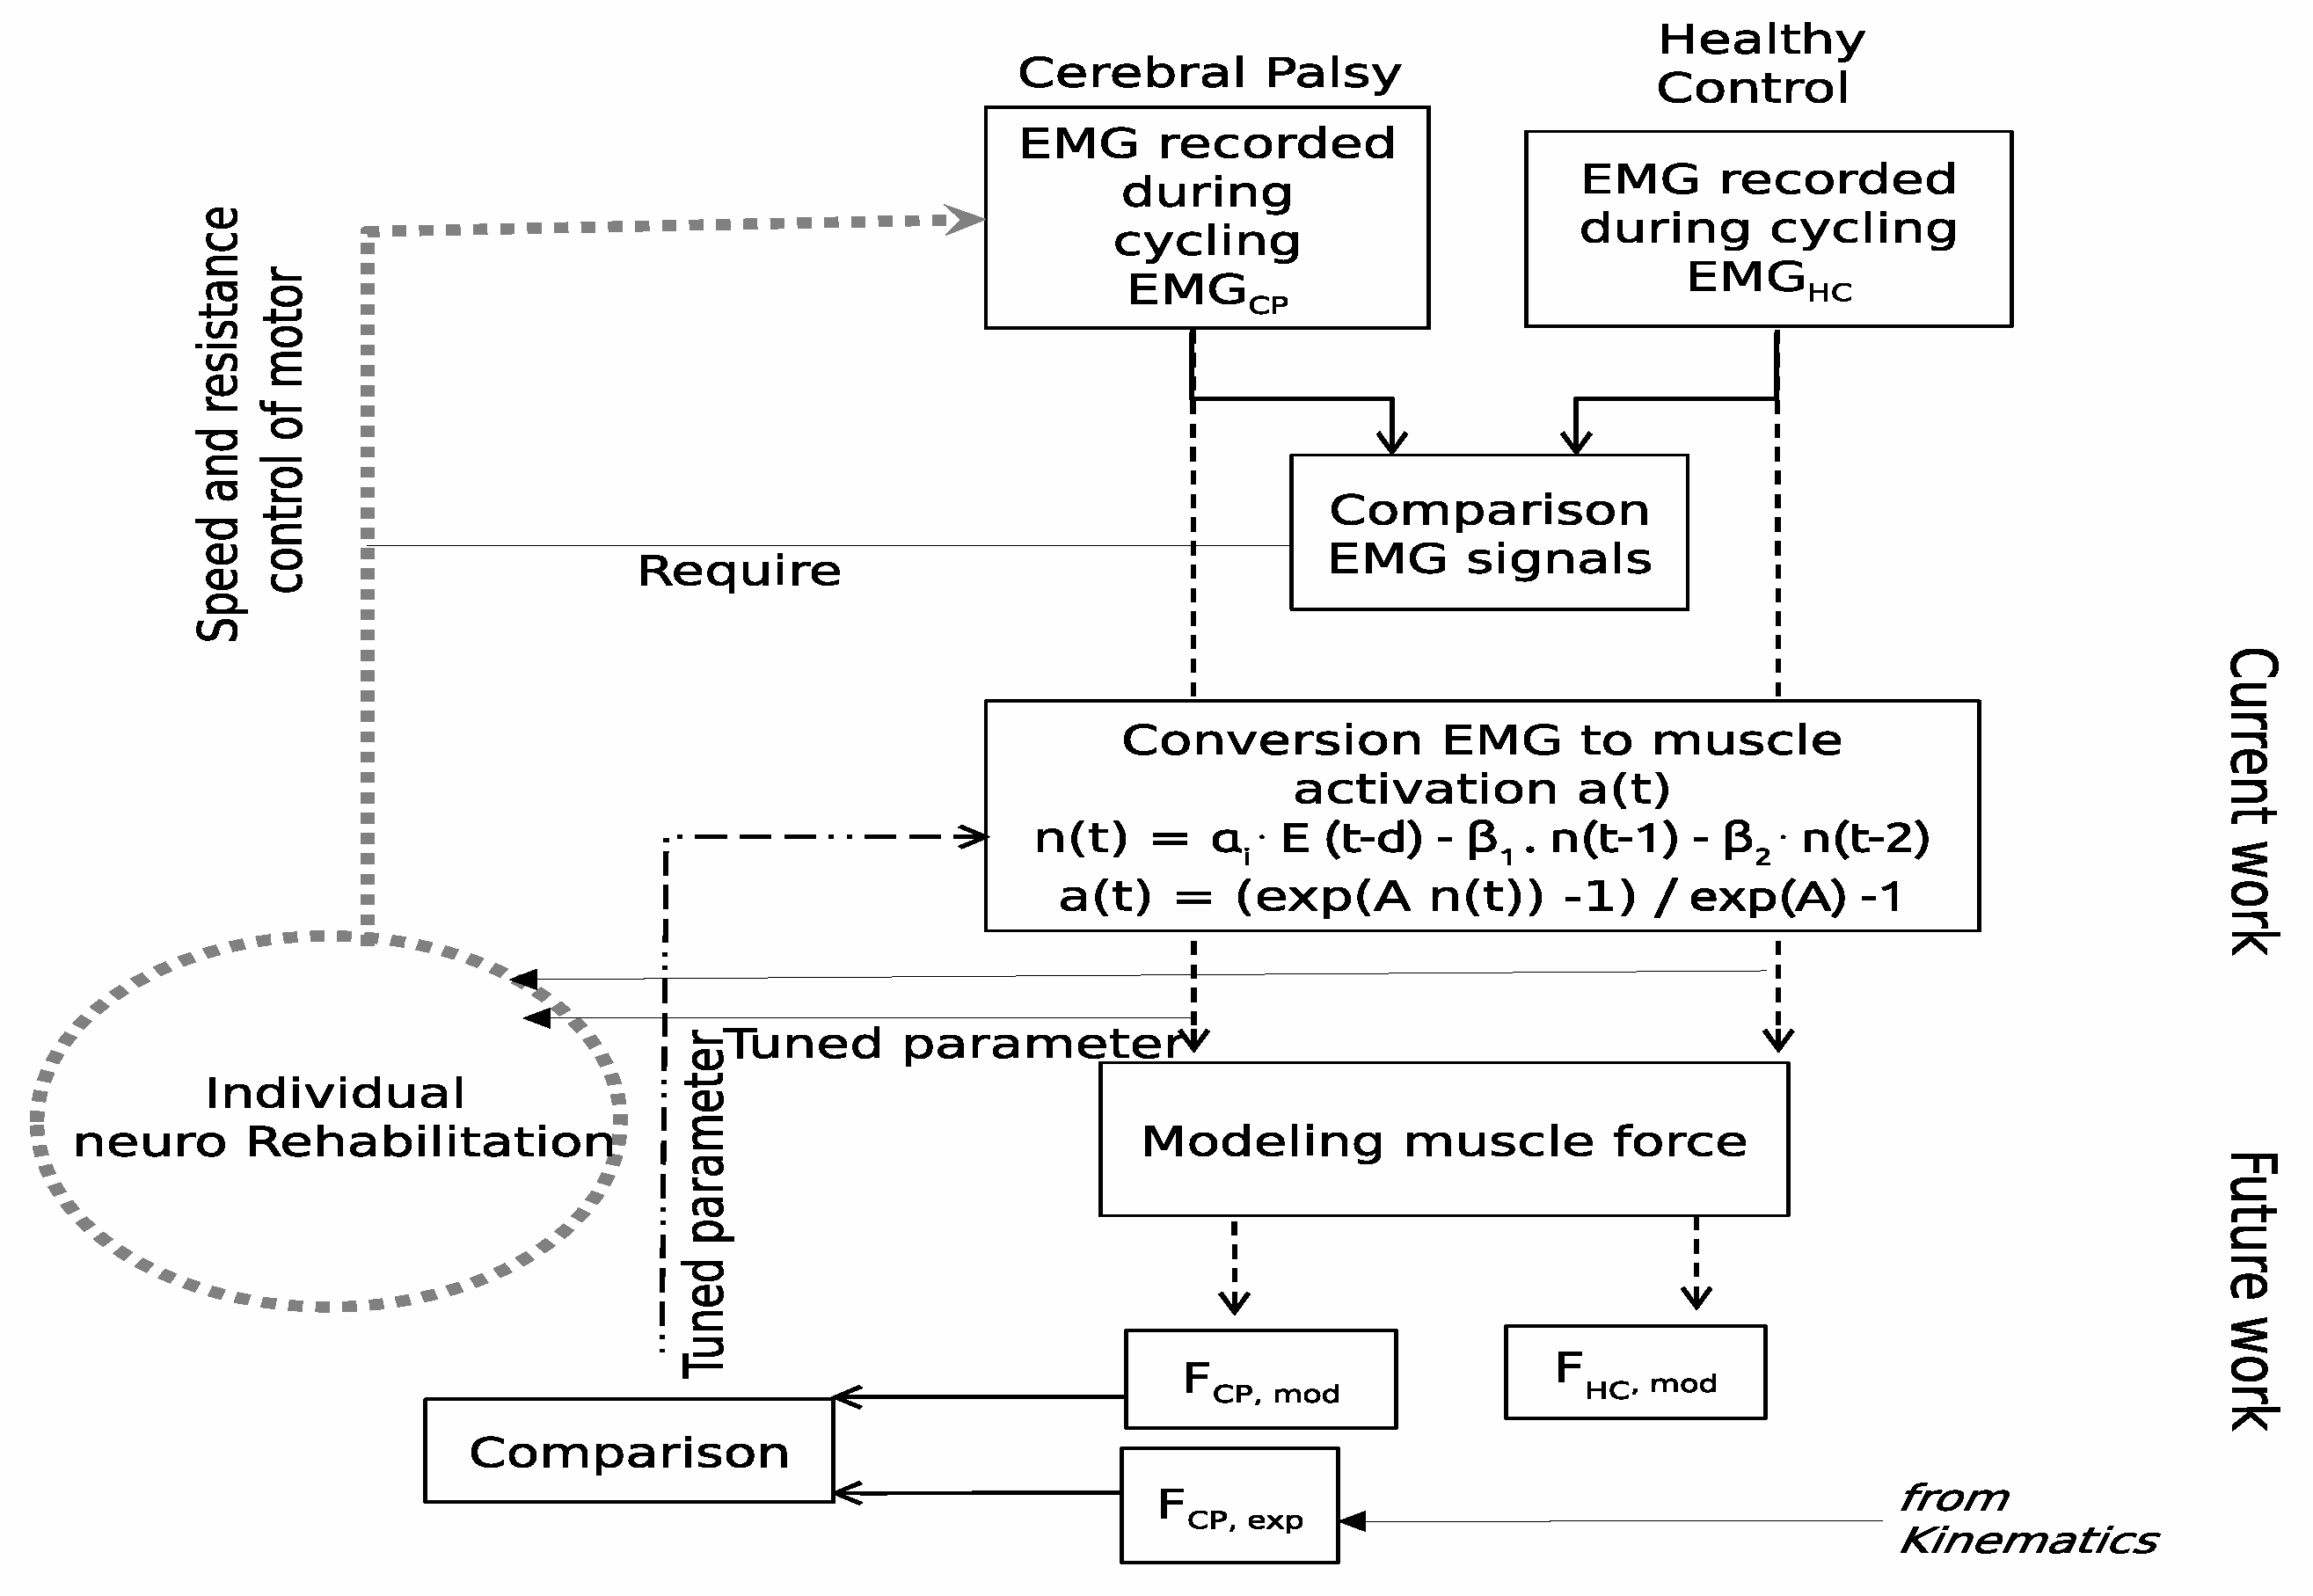
Several previous studies [15,16,17,18] have analyzed EMG recordings during cycling on the ergometer and have reported more frequent co-contractions and prolonged EMG activity in patients with CP, when compared to a group of healthy controls [15,16]. Analysis of EMG signals at different crank angles [16,19] confirms the often reported variability in EMG signals across patients, and points to the necessity of individual rehabilitation strategies. The study presented here is a first step in the attempt to understand the neuromusculoskeletal transformations during cycling in patients with CP. Specifically, models presented in previous studies were here applied to convert the EMG signal recorded during cycling into a processed signal from which the force output of leg muscles can be determined. Despite the debate surrounding the exact relationship between a recorded EMG signal and the force output of the corresponding muscle mentioned above, it is the general understanding that there is no direct relationship between these two quantities. Transformations of the original EMG signal are therefore necessary before the force output of a muscle can be determined and compared with equivalent experimental measures. Those transformations take into account, amongst other factors, filtering effects, the electromechanical delay and nonlinear effects between the neuronal signal and the effective activation of muscle fibers. The processed EMG signal derived in this study is named below, following the designation given in previous studies, as muscle activation [20,21]. As schematically represented in Figure 1, understanding how muscle force is employed by patients with CP during cycling may give indications on how cycling training can be used for rehabilitation. As also shown in the scheme, the work here presented is an intermediate step in that direction. EMG recordings of both a group of patients with CP and a group of healthy controls were analyzed with the following aims: (i) characterizing muscle activation in CP during cycling on the ergometer, and (ii) allowing a comparison in terms of muscle activation with respect to muscle spasticity of lower extremities of participants with CP. Knowing muscle activation is important in order to derive the muscle force employed to turn the bicycle wheel. Getting a regular training for physiologically coordinated interactions of the muscles may help patients with CP to develop a more efficient neuro-motor control and consequently more efficient movement. Furthermore, individual-fitted technical adaptations during rehabilitation cycling can be developed. In particular, the real-time EMG signal could be used as a feedback system to change the dynamical resistance of an ergometer.
2. Methods
2.1. Recording of EMG Signal
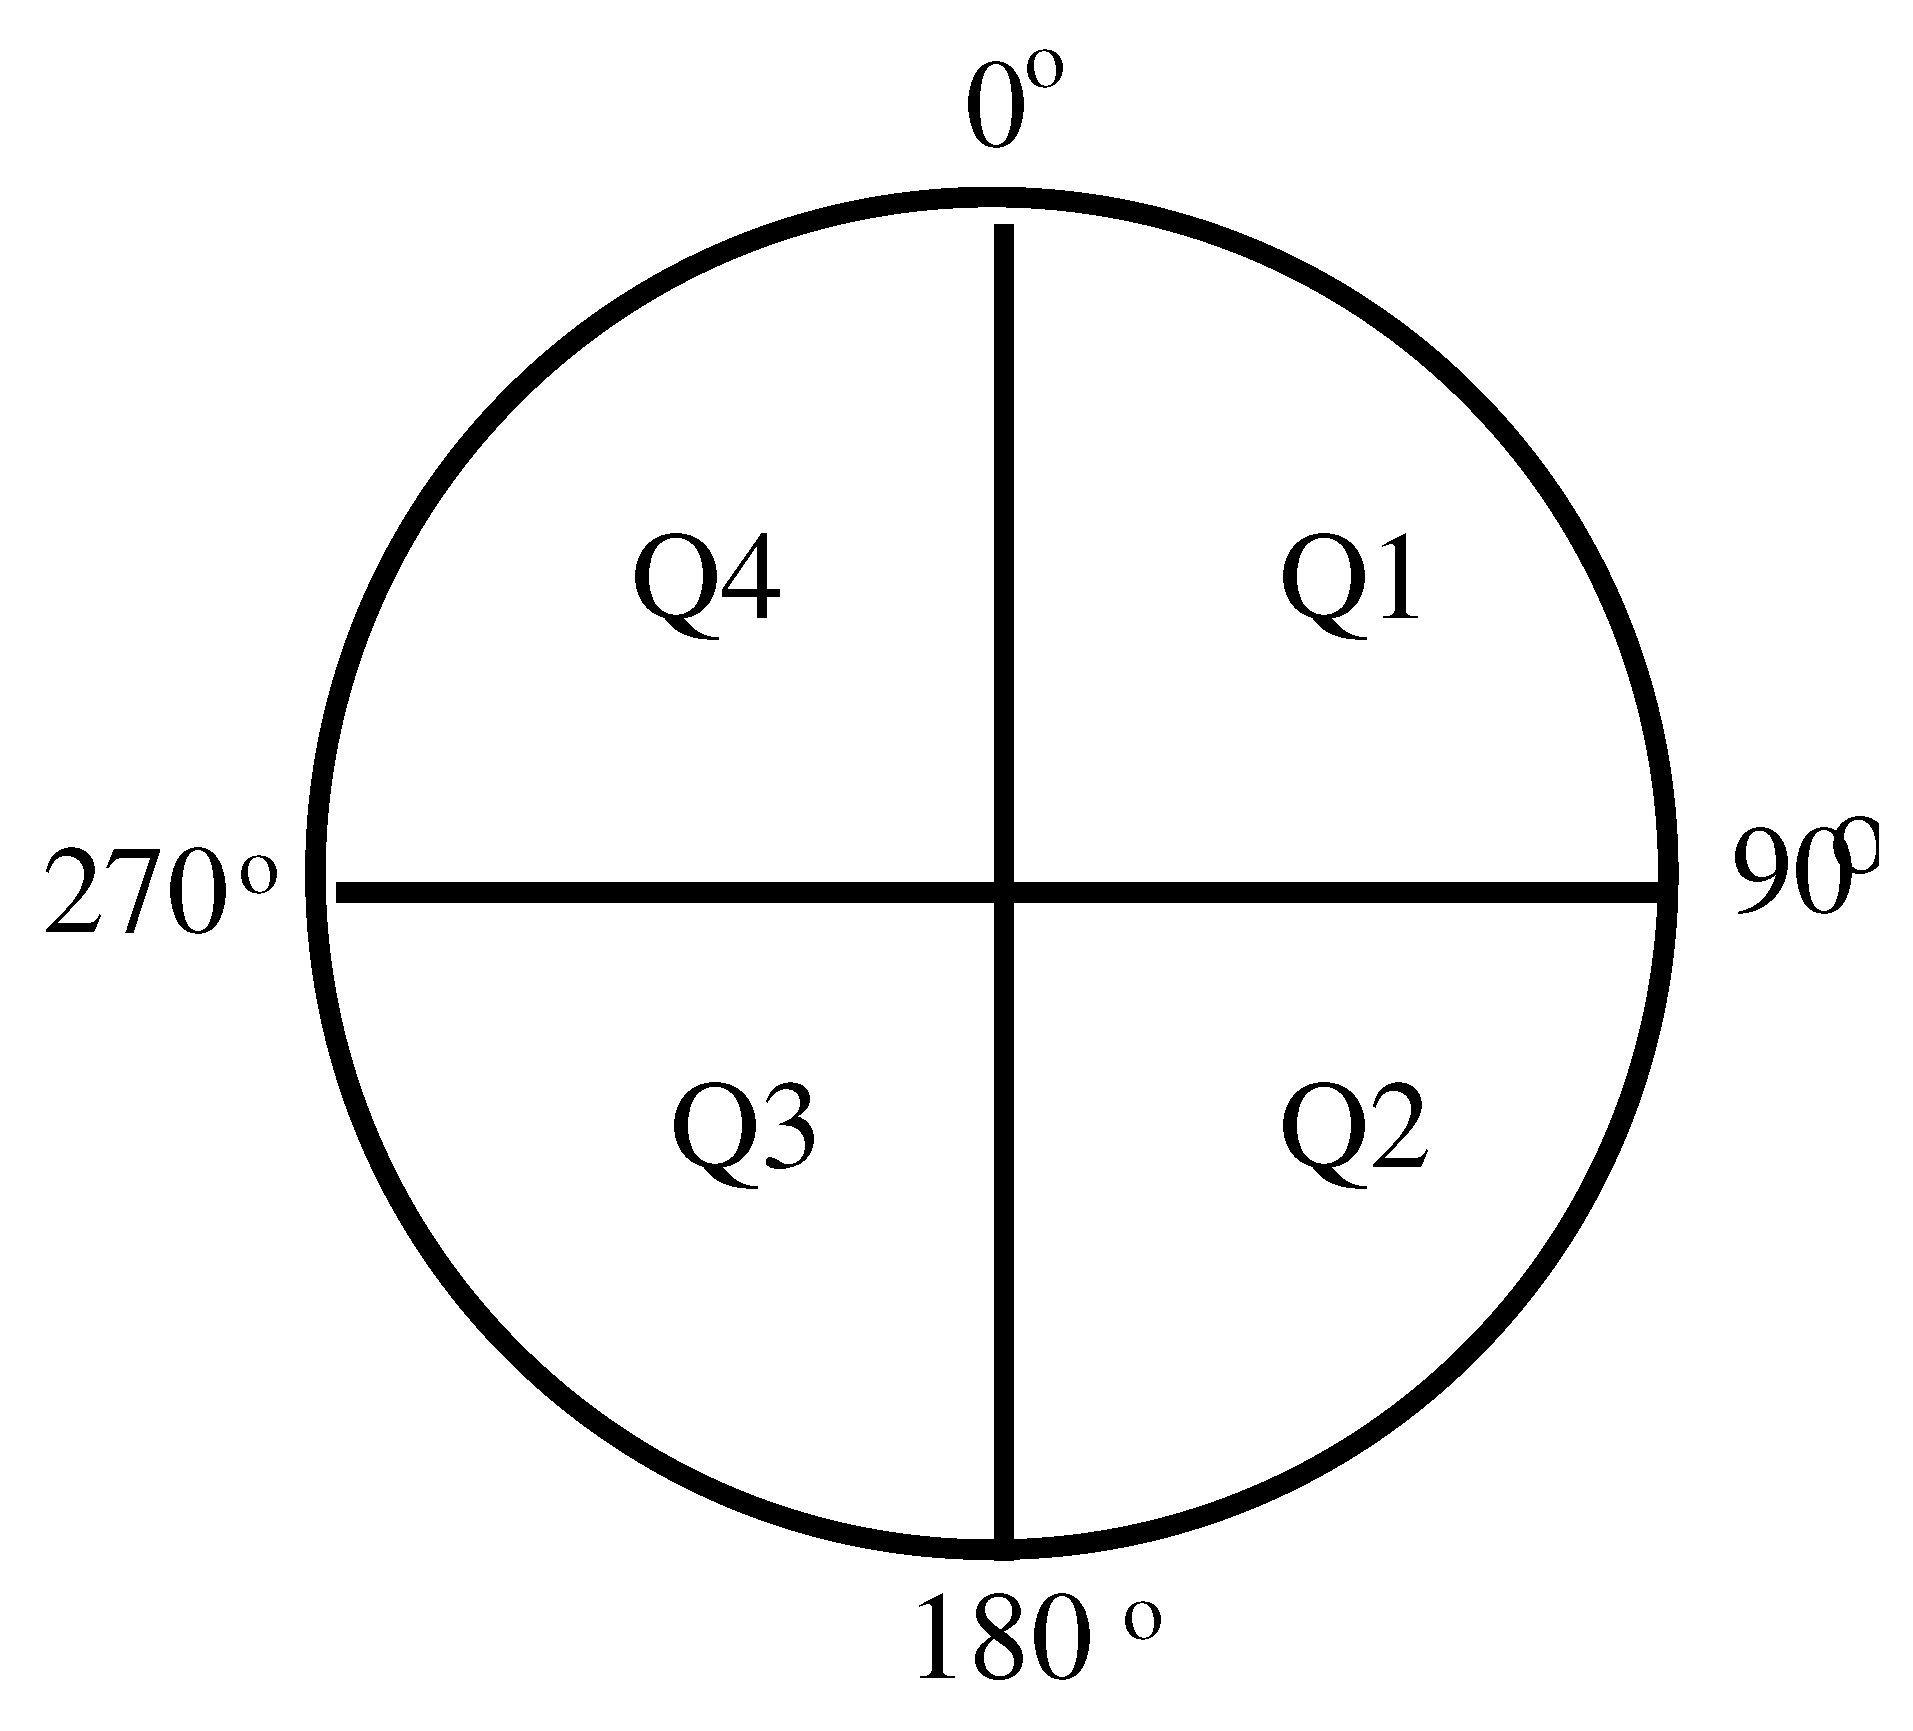
EMG signals collected for a previous study [15] were used here to derive muscle activation during cycling exercise on an ergometer. Participants were asked to cycle as regularly as possible on their own (e.g., without external help) with an average speed of 60 revolutions per minute (shown in the ergometer display) and for a period of 5 min. During cycling, the foot was fixed to the ergometer’s foot support (the angle leg-ankle-foot was not fixed, though). A set of four reflectors fixed to the wheel of the ergometer together with a distance sensor attached to the pedal were used to determine the crank angle during cycling. This allowed also synchronization between the cycling movement and the EMG recordings. During cycling, the circular path traveled by the foot was divided into four quadrants as illustrated in Figure 2. The crank angle secured by the foot at any instant is defined by the angle formed by the following two radial lines: one stretching from the center of the wheel to the highest point possible—the reference position—and the other one stretching from the center of the circle to the current position. When the foot is at the point of maximum height, this corresponds to a crank angle of (Figure 2). Before starting a recording, the distance of the participant to the ergometer was adjusted such that, when the crank angle was , the leg stretched to make an “upper leg-to-lower leg” angle of .
EMG signals were recorded from the following four muscles in each leg: Musculus rectus femoris (M. rectus femoris), Musculus biceps femoris (M. biceps femoris), Musculus tibialis anterior (M. tibialis anterior), and Musculus gastrocnemius (M. gastrocnemius). These muscles were chosen because spasticity in any of these four muscles, either individually or in combination/simultaneously with another of these muscles, can lead to contractures, limit the range of motion and influence movement/mobility. Regular training for better coordination of these muscles may increase muscle strength and improve functionality of movement.Placement of electrodes followed the recommendations of the SENIAM (Surface ElectroMyography for the Non-Invasive Assessment of Muscles) european project [22]. The skin was cleaned with an alcohol containing cleansing liquid before placing the electrodes in bipolar configuration. A contact gel was used between the electrode and skin to improve electrical conductance. The EMG analog signal was amplified, half-wave rectified and smoothed (low-pass filter with a 2-Hz cut-off frequency). The resulting envelope signal was then amplified again and recorded for offline analysis with a 77 Hz sampling rate. Even though this is a much lower sampling rate than recommended for EMG signals, it is enough to reproduce the envelope of the raw EMG signal, with maximum frequency at 2 Hz, here used to derive muscle activation. The reader is referred to the previous studies [15,16] for further details on the experimental procedure.
EMG signals analyzed here were collected for a group of fourteen adult patients with CP (nine with diplegia and five with hemiplegia) with ages between 23 to 60 years and a group of ten healthy adults aged between 25 and 55 years. A patient’s degree of mobility according to the Gross Motor Function Classification Scale (GMFCS) [23] varied from Level I to Level IV. The degree of muscle spasticity classified according to the Modified Ashworth Spasticity (MAS) scale [24], ranged from 0 to 3, with a higher MAS level indicating a higher level of spasticity.
Experimental procedures were approved by the ethics committee of the Faculty of Medicine of the Technical University of Munich. Participation in the study was voluntary, and all subjects, or in some cases their legal protectors, gave their written informed consent before performing the tests.
2.2. Analysis and Modeling
The EMG signal reflects the sum of muscle fiber action potentials, triggered by the neural activation by the motor neurons innervating those fibers. The absolute magnitude of the EMG voltage, however, depends not only on the magnitude of the original signal but also on the gain of the amplifiers, on the placements of the electrodes relative to the muscles’ motor points, and on the amount of tissue between the electrodes and the muscles [20,21]. Therefore, to be able to compare signals recorded from different muscles and different persons, the EMG signal was normalized to the peak value registered for each muscle during cycling. Although this normalization procedure does not allow comparison of the EMG amplitude values or muscle activity levels between participants, comparison of temporal variations of muscle activity is possible. A mathematical transformation was then applied to the normalized EMG signal that takes into account the delay in the propagation of the action potentials along the muscle that will end up in muscle activation, that is, it takes into account the activation history of the muscle. Following the work of [25], the transformation used here was the approximated form of the first order differential equation for a discretized signal and is expressed as [26,27]:
where is the filtered normalized EMG voltage at time t, is the output of this transformation, d is the time delay between EMG recording and motor response, and , , are the second-order dynamics coefficients. These parameters map the transformation from to and were chosen such that Equation (1) forms a stable equation. That is, together with the parameter, they must satisfy the following relations [20]:
where , are real values.
Furthermore, in order to make not exceed 1, the following condition must also be held:
The value of time delay d in Equation (1) ranges between 10 ms to 100 ms according to the literature [28,29].
A second transformation was applied to to account for the nonlinear characteristics of muscle activation. This accounts for the fact that increasing stimulation frequency of the muscle fibers does not always lead to a steady increase in muscle activation, but that, beyond a certain stimulation rate, the activation does not continue to increase but remains approximately constant. This nonlinear relation between the transformation term and the muscle activation can be fitted by an exponential function as follows [30,31]:
where is the muscle activation at time t, is the signal output of Equation (1) and A is a nonlinear shape factor, limited to .
The first two initial values of () were chosen to correspond approximately to the resting potential of ∼−70 mV of a muscle fiber at time zero, and to a higher value at time reflecting the rapid change in potential after neuronal stimulation.
The magnitude of muscle activation at the point of the cycling path (Figure 2) was then compared between participants with CP and control participants. For that comparison, norm-distance (ND) was computed as the absolute difference between the muscle activation status of a patient with CP () at the position of the cycle path during the active cycling time and the muscle activation value at the same point, averaged across healthy participants (). This difference was then normalized to the standard deviation (S) computed for the healthy group [32,33]:
Individual ND values were then analyzed with respect to the individual’s MAS level.
All calculations and analysis here presented were performed with customized code in MATLAB2017a (MathWorks, Natick, MA, USA).
3. Results
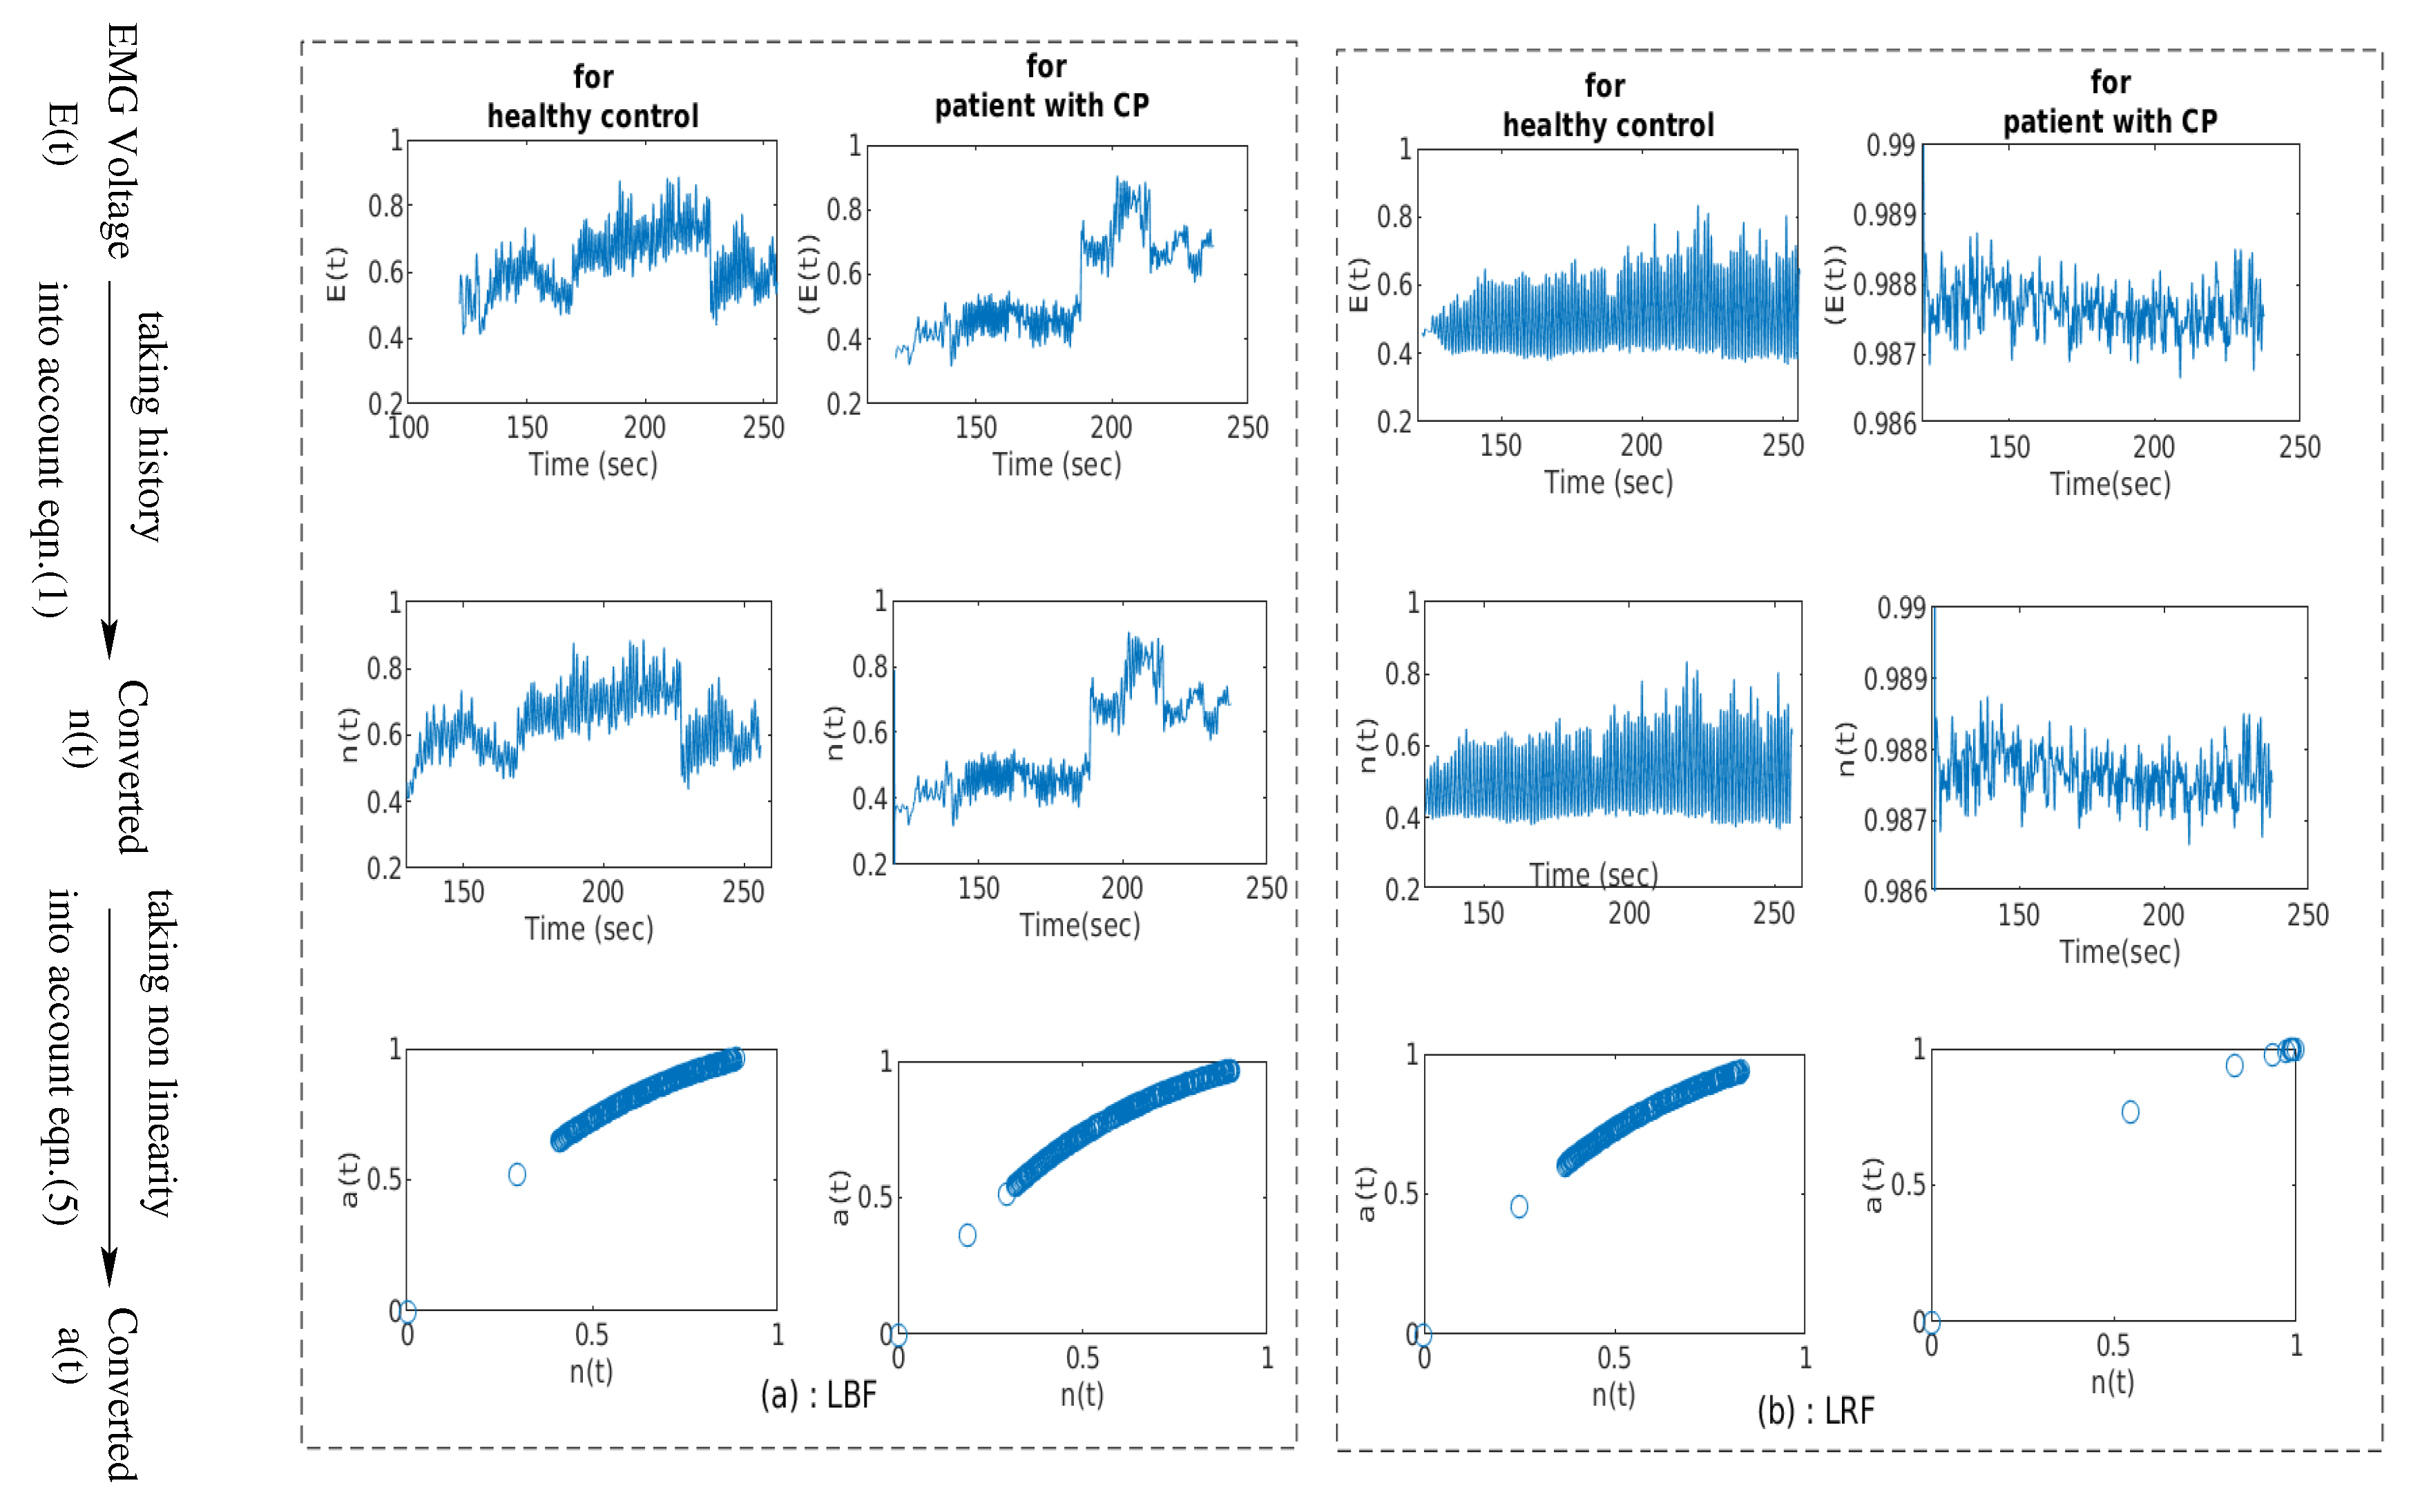
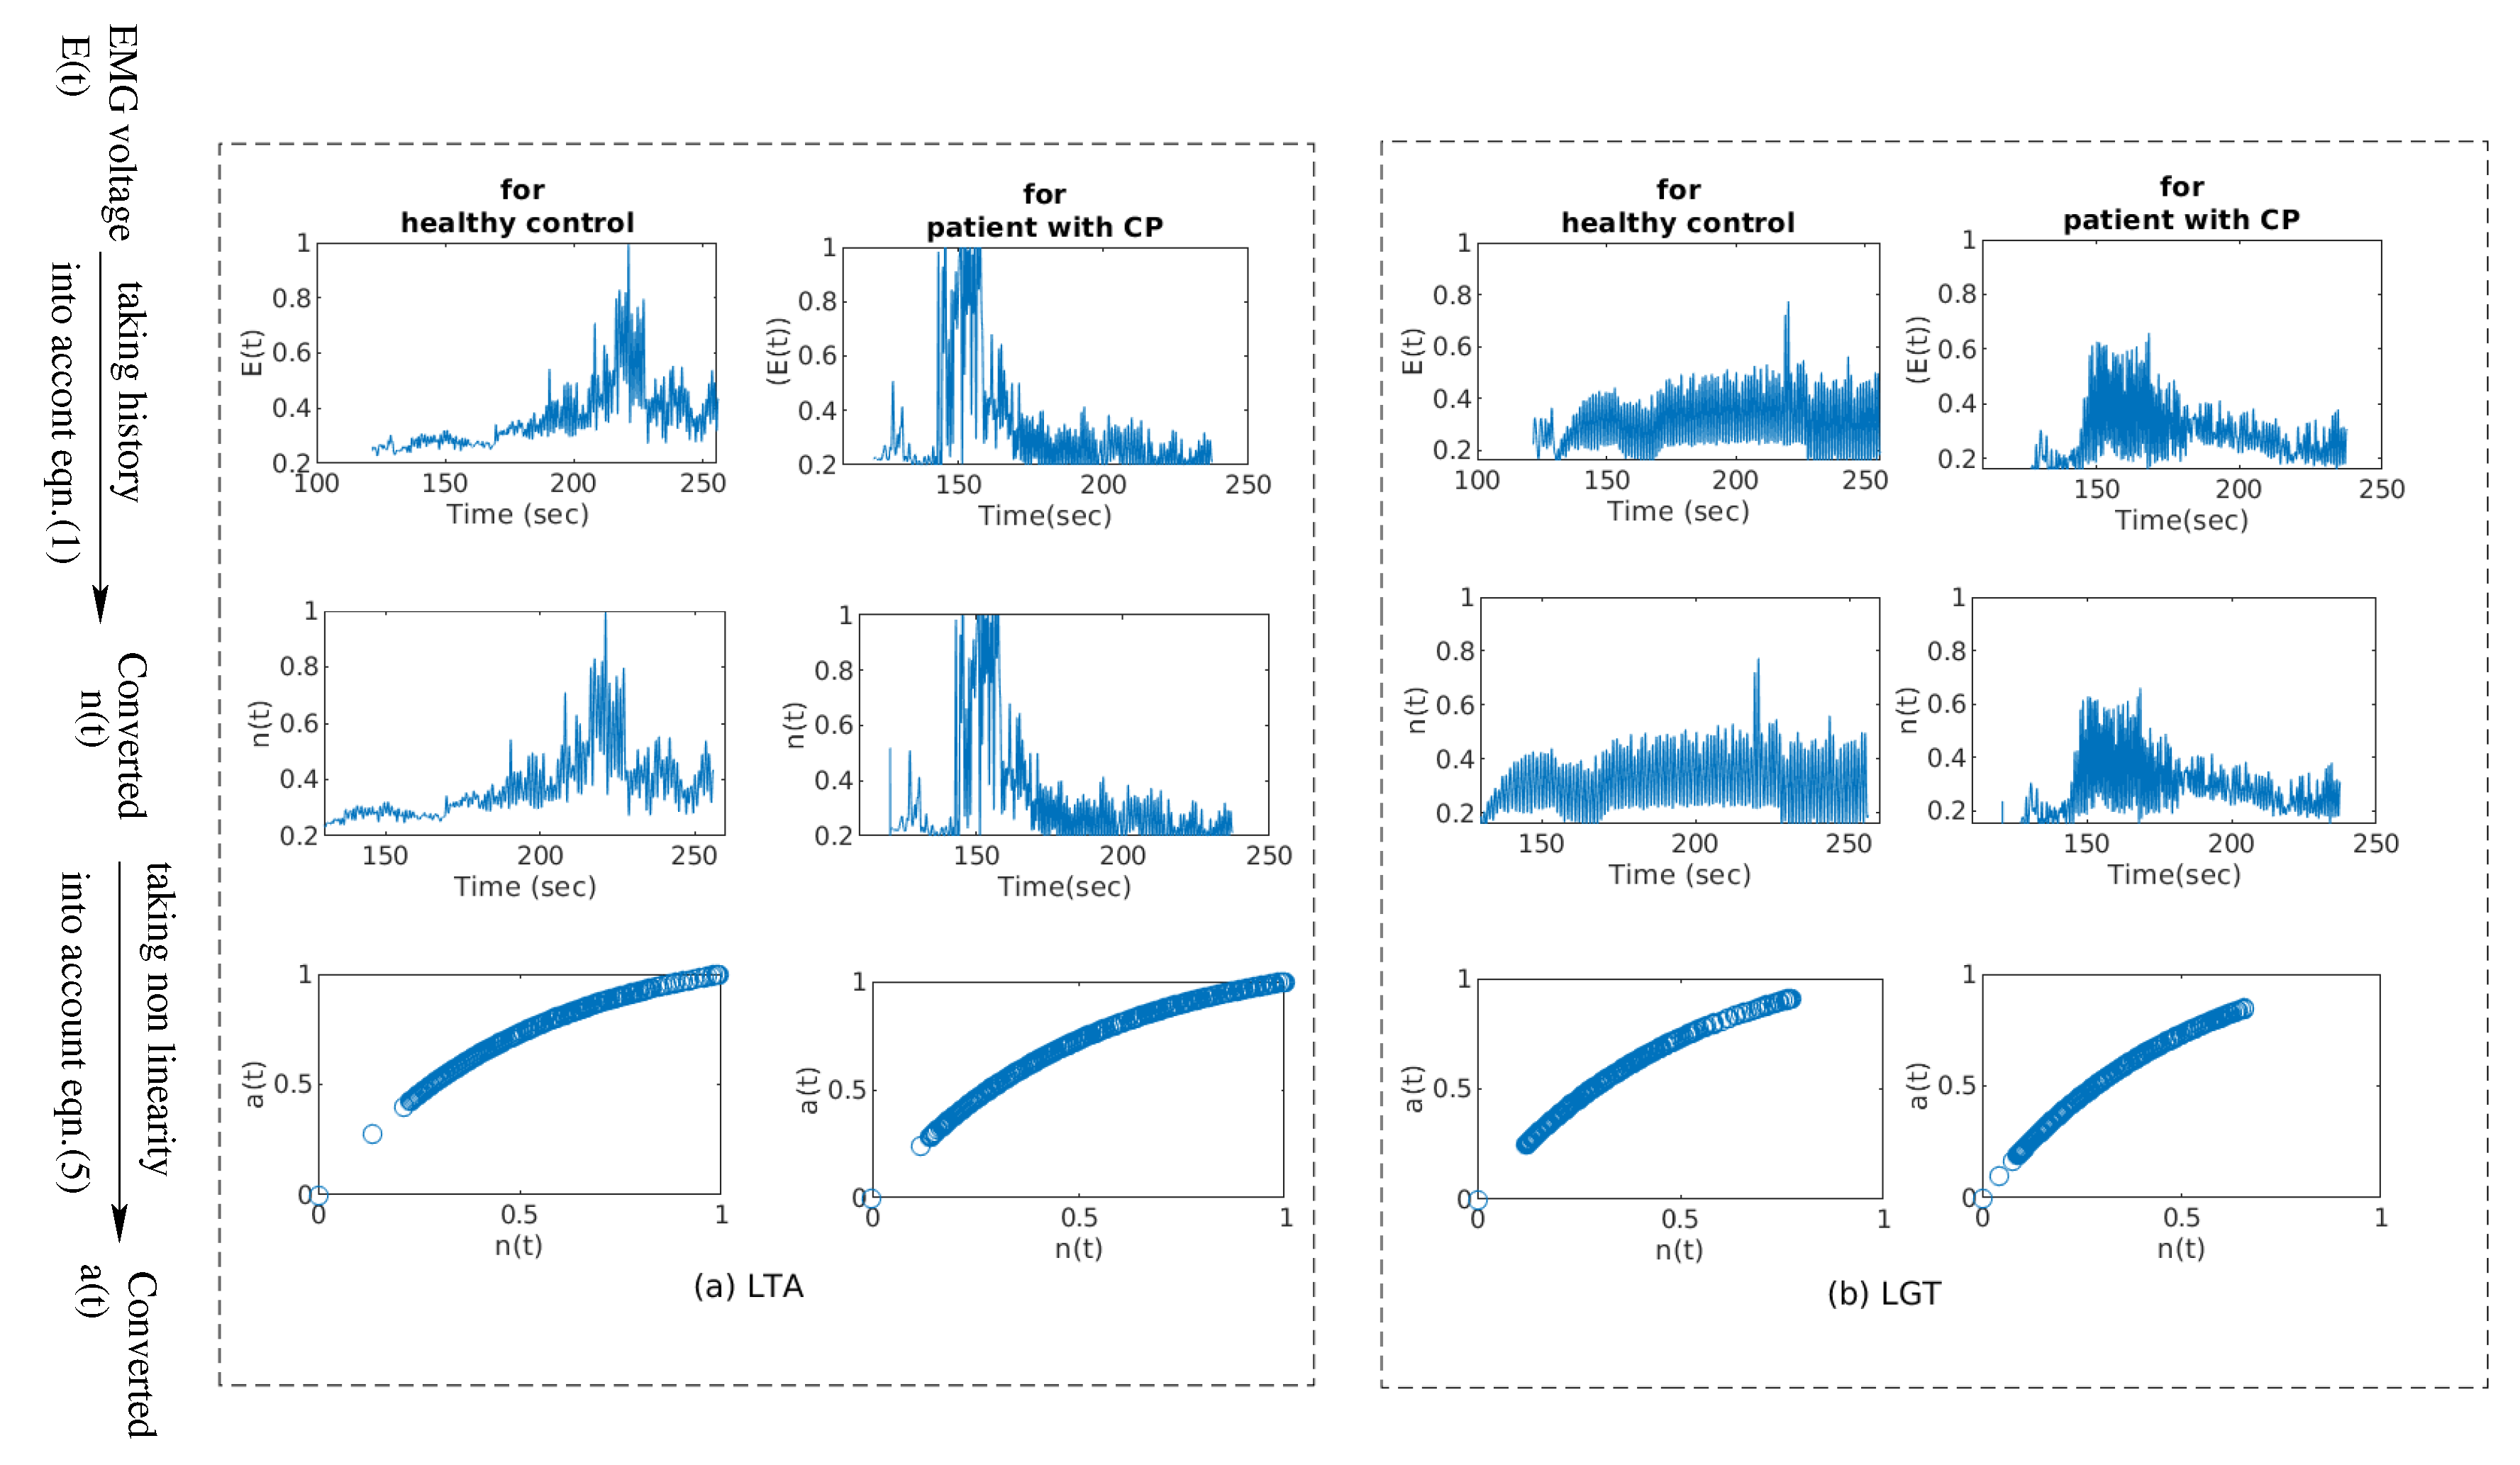
The EMG signals collected for full cycling revolutions were converted into muscle activation patterns following the mathematical transformations described in the Methods section. Examples of two such data sets are presented in Figure 3, and in Figure 4 for a healthy participant and for a patient with CP.
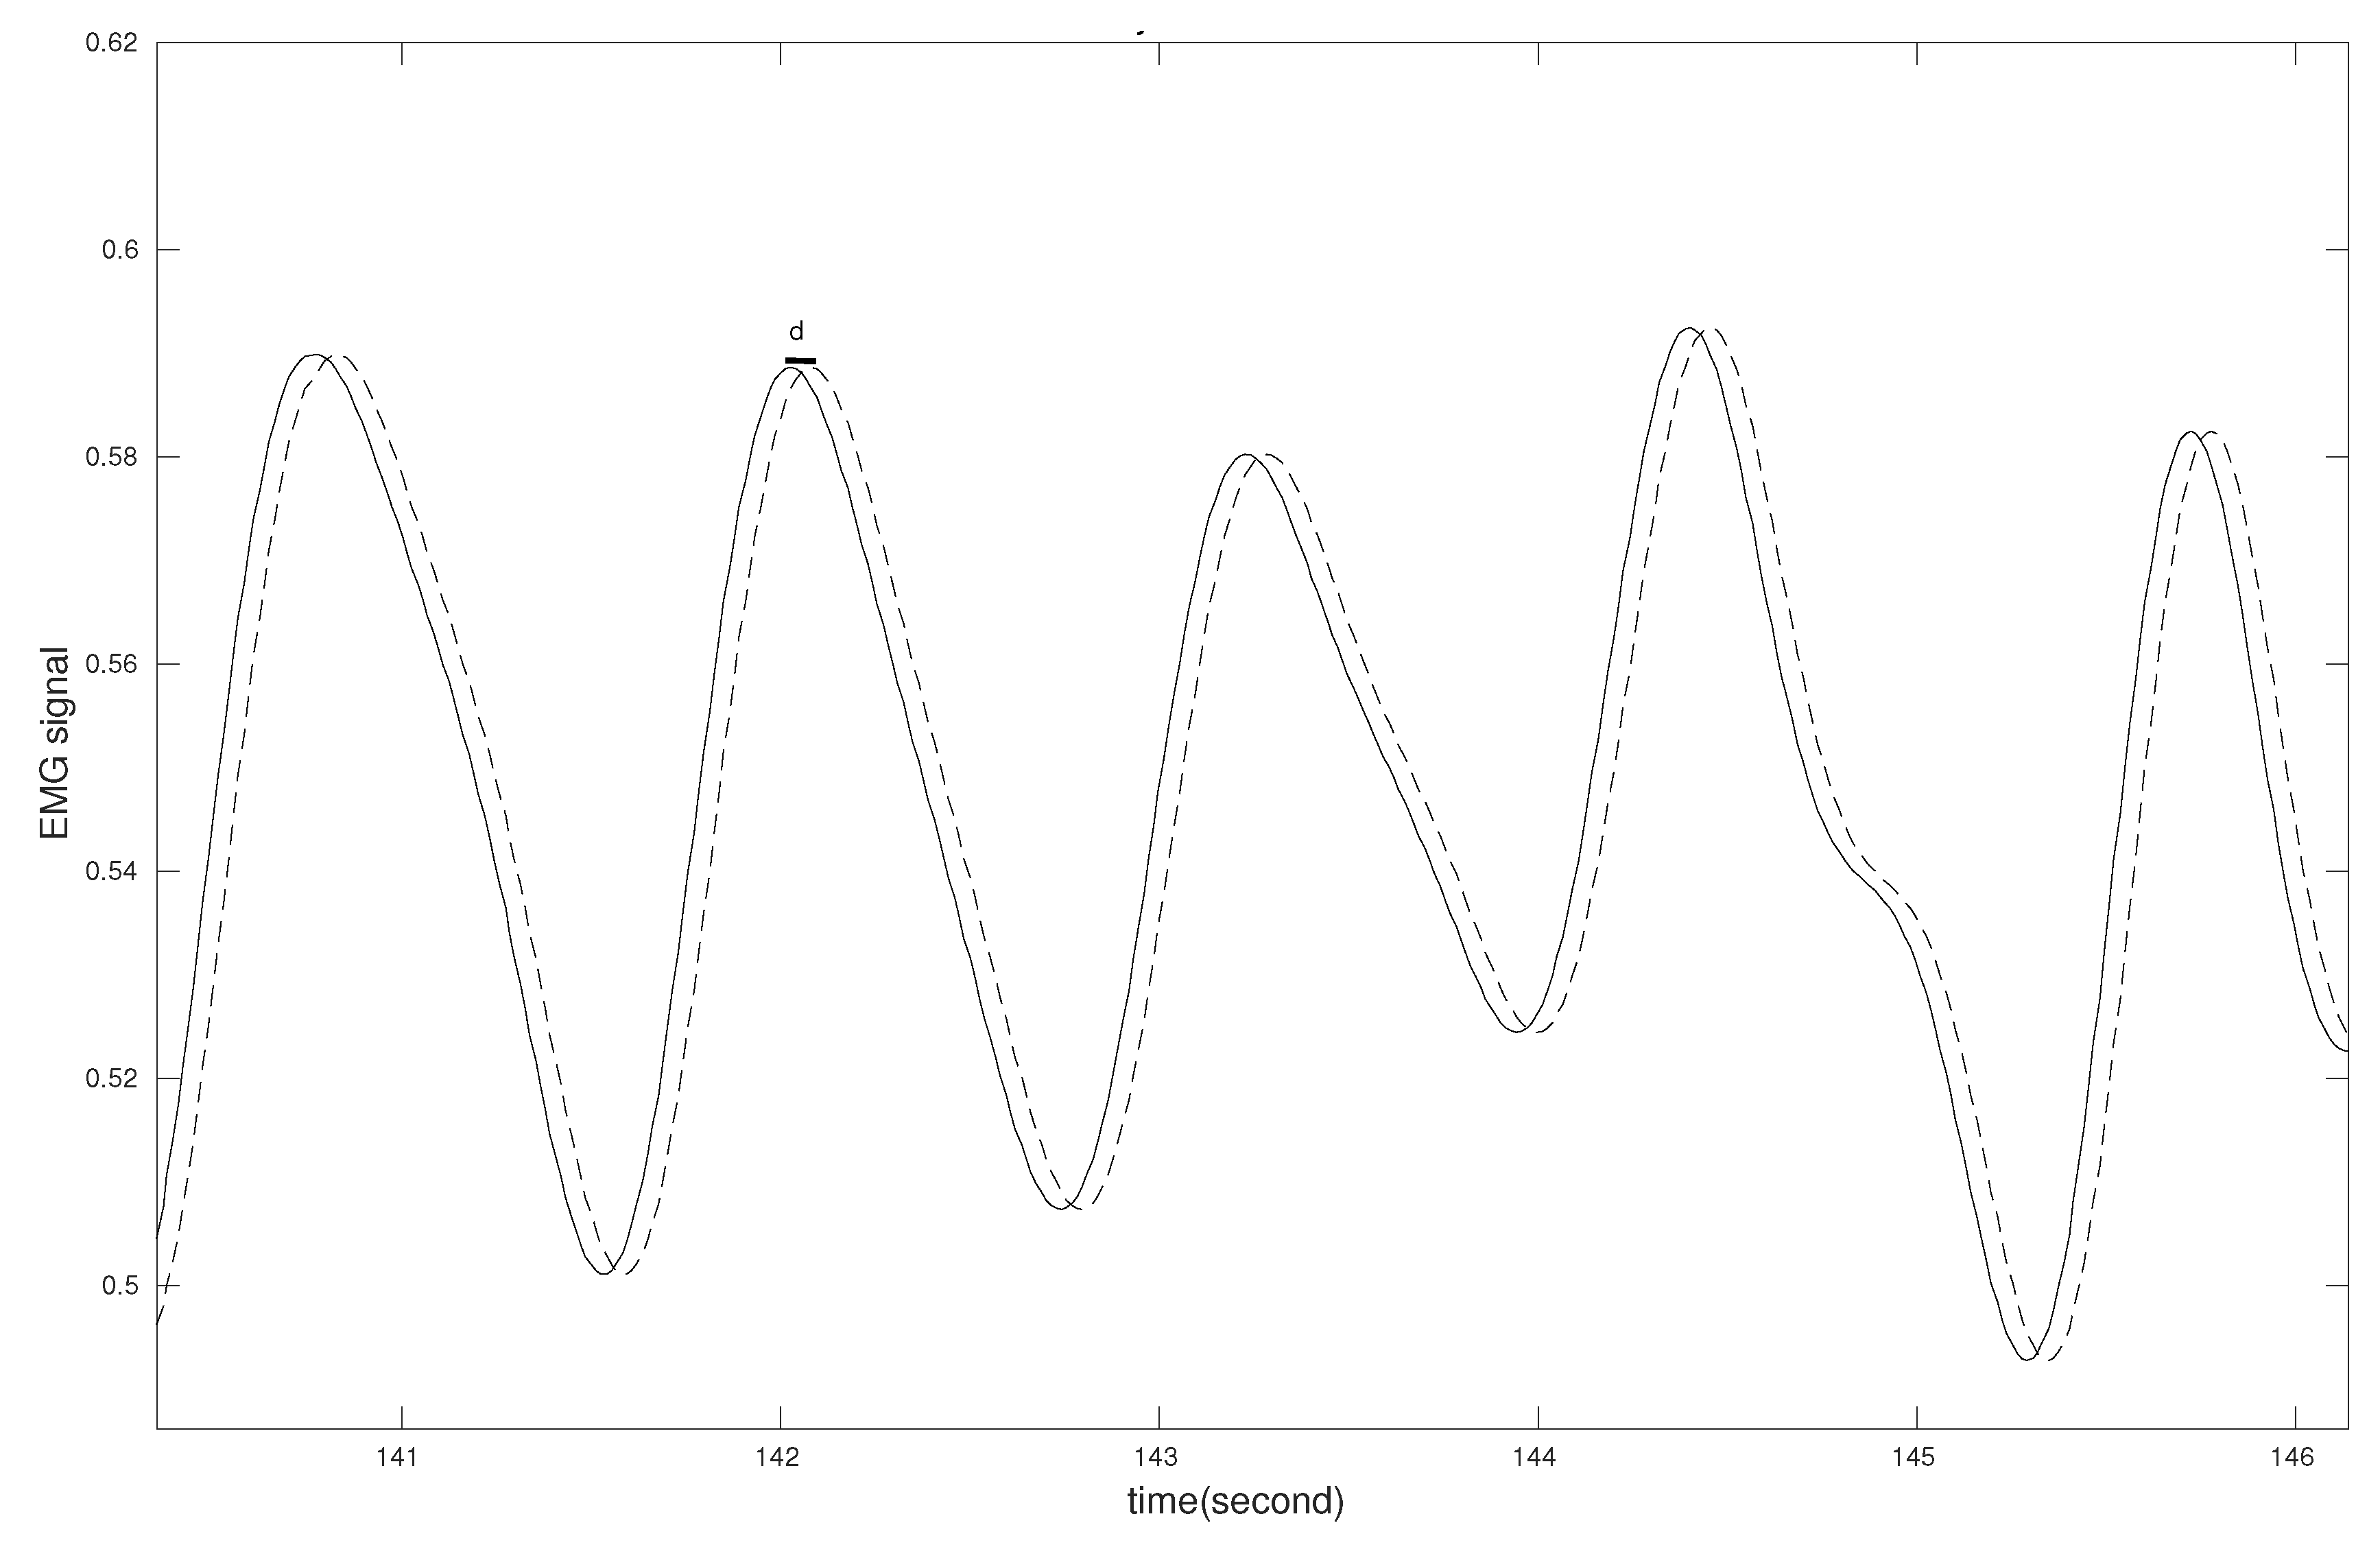
Comparison of top and central panels in both Figure 3 and Figure 4 show that signals and have similar shapes. They are separated only by the delay time (d) considered in the conversion from to , as shown in more detail in Figure 5.
The nonlinear transformation delivered vs. plots that were similar for the patient and control groups, as illustrated by the individual data sets in the bottom panels of Figure 3 and Figure 4.
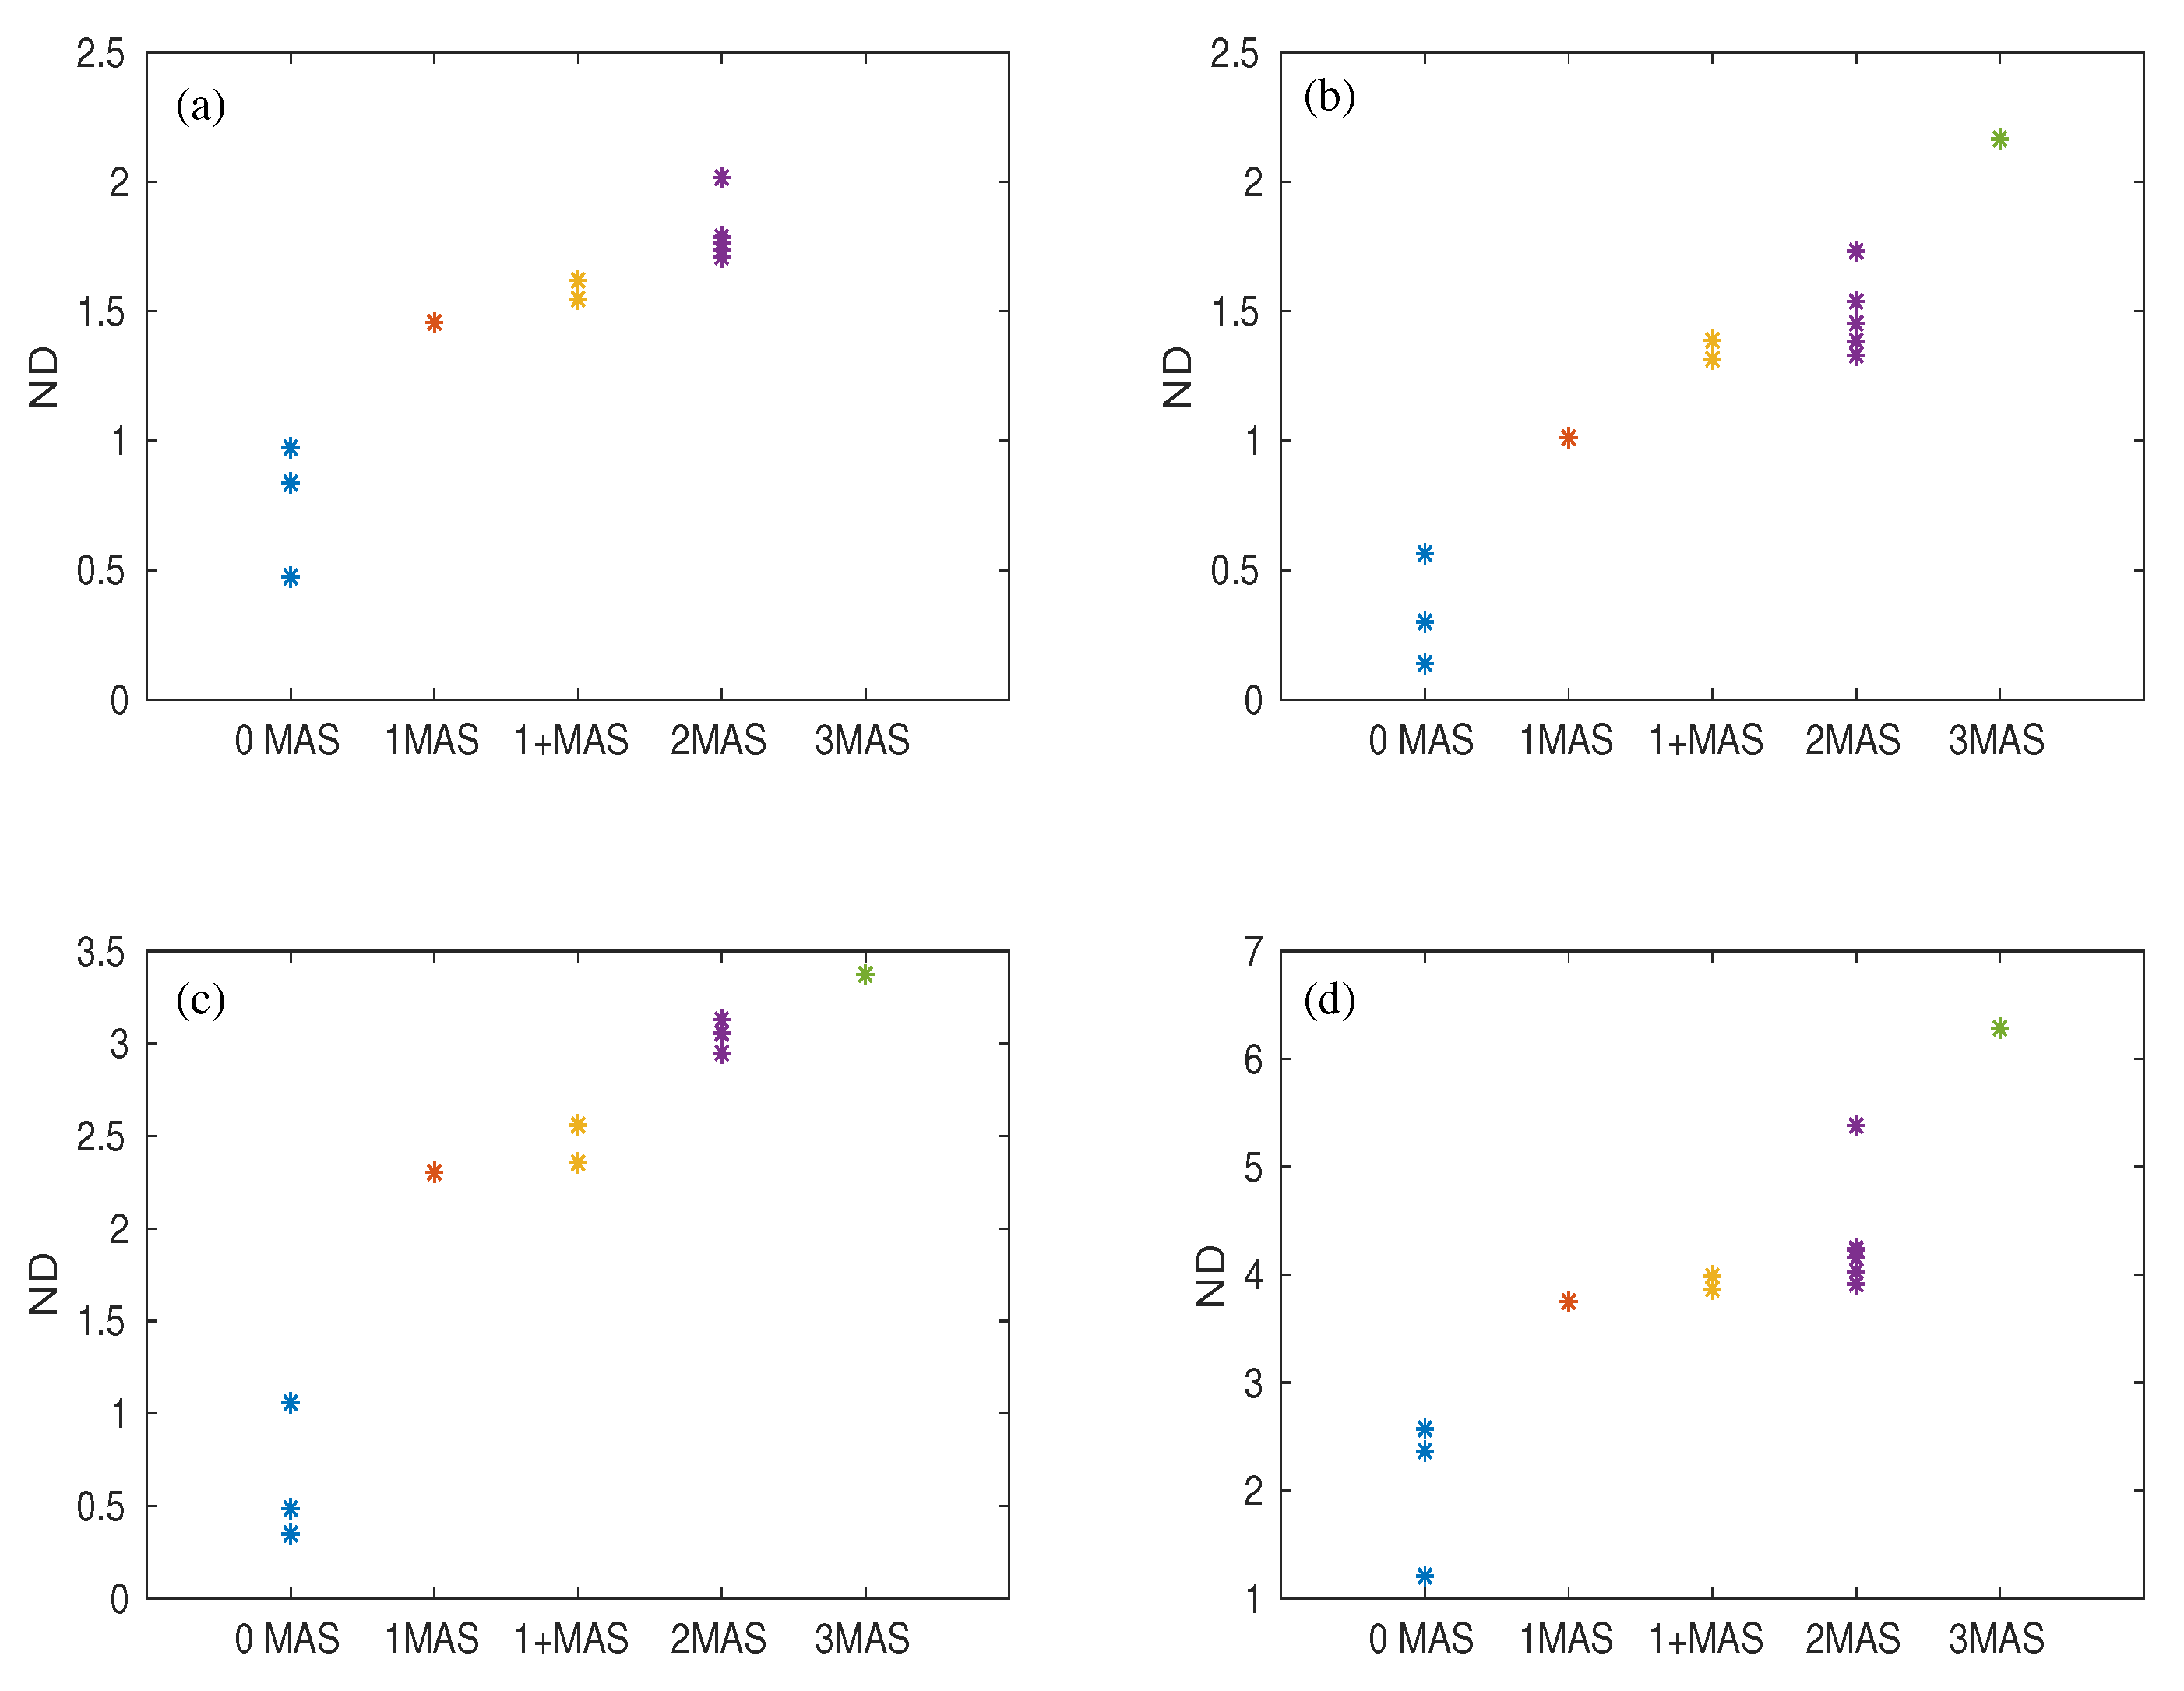
However, muscle activation assessed at crank angle position of the cycling path was much more variable in patients, as indicated by the norm distance values in Figure 6. This deviation occurred for all four muscles and was larger for higher MAS levels.
4. Discussion
In the current work, EMG signals collected from lower extremity muscles whilst participants were cycling on an ergometer, were converted into muscle activation profiles. In the study by Buchanan et al. [20,21], EMG signals were normalized by dividing the recorded signal by the value of maximum voluntary contraction. This is a common scaling method for EMG signal in sports and performance diagnostics, used to avoid the equivalent scaling of the low electrical activity and high electrical activity of the muscles. In patients with CP, however, and, especially those with spasticity, it is not possible to record voluntary muscle contractions. For patients with spasticity, the central activation of the muscle is disturbed and, as a result, they do not have voluntary access to their own muscular system. On the other hand, the reflex activation of the muscles, which is fully preserved as it is initiated by peripheral sensors and is involuntary, likely mixes with maximum muscle contractions.
The plots obtained after normalizing the EMG signal with the maximum value of the individual muscle’s EMG signal were similar to those described previously—for example, by [20]. No differences in muscle activation profiles were observed between the group of patients with CP and the group of healthy controls. This is due to the fact that parameters , and , which map the correspondence between the EMG signal and the intermediate signal , as well as parameter A mapping the conversion , were given the same values for both groups. This was done as no information is available in the literature specifically for patients with CP, and assuming different values would have been equally speculative. Furthermore, it is unlikely that muscular activation is different in CP. Given the origin of impairments in CP, alterations probably occur at a previous stage, at the level of the neuronal input to motor neurons and from these to muscle fibers. Comparison of muscle force patterns, derived from kinematic variables during the experiment, with the equivalent patterns derived from will enable using the future parameter values for the group with CP that are more realistic.
The tendency of increasing ND values of muscle activation with the level of spasticity MAS (Figure 6) indicates larger deviations of muscle activation from reference values with increasing spasticity. The fact that this tendency is observed for all four muscles analyzed here indicates that the deviations observed are characteristic of spasticity. Hence, they can potentially provide additional objective information, based on EMG recordings, on the level of spasticity of a patient. A larger sample of data points would be nevertheless necessary to confirm this. In addition to this, assuming that deviations in muscle activation with spasticity occur at any point along the cycle path, it is likely that muscle force also deviates from muscle force patterns in healthy participants. A result of this would be a less regular speed of cycling in patients with a higher MAS level.
Some additional limitations of the study need to be mentioned. First, displacement of electrodes during cycling may have resulted in crosstalk. This may affect the shape of the recorded EMG signal and lead to the estimation of unrealistic muscle activation patterns. Variability in the measured signal may have also contributed to the latter. Finally, the importance of the mapping parameters [20,30] for the conversion of show the need for ways to find optimal values for these parameters. These can be fitted to individual participants and muscles based on measurements of the force exerted on the pedal during cycling. Only then can muscle activation in patients with CP be better characterized and more efficient rehabilitation strategies be designed.
5. Conclusions
The current work described the modeling of muscle activation patterns from recorded EMG signals in patients with CP during cycling on an ergometer. This is an intermediate step to model muscle force developed during that cycling task. Muscle activation values obtained when the foot reached the highest point of the cycling path deviated from the mean muscle activation value derived from healthy participants. This deviation was furthermore larger for more severe degrees of spasticity. Further modeling developments are needed before muscle activation and muscle force in patients with CP can be more realistically modeled and individualized rehabilitation through cycling training can be designed.
Author Contributions
S.R. analyzed the data and drafted the manuscript. A.A.P. provided valuable comments and edited the manuscript. R.L. designed the study concept and interpreted results. All of the authors revised the final version of the manuscript.
Funding
This project was supported by Bayerisches Staatsministerium für Bildung und Kultus, Wissenschaft und Kunst, by the Buhl-Strohmaier Foundation and by the Würth Foundation.
Acknowledgments
The authors would like to thank the therapists and participants of the MFZ for the time and support to this study. We thank the company Paravan for lending the ergometer for the study.
Conflicts of Interest
The authors declare no conflict of interest. The funders had no role in the design of the study; in the collection, analyses, or interpretation of data; in the writing of the manuscript, or in the decision to publish the results.
Abbreviations
The following abbreviations are used in this manuscript:
| CP | Cerebral Palsy |
| EMG | Electromyography |
| M. rectus femoris | Musculus rectus femoris |
| M. biceps femoris | Musculus biceps femoris |
| M. tibialis anterior | Musculus tibialis anterior |
| M. gastrocnemius | Musculus gastrocnemius |
| GMFCS | Gross Motor Function Classification Scale |
| MAS | Modified Ashworth Spasticity |
| ND | Norm-Distance |
| LRF | Left rectus femoris |
| LBF | Left biceps femoris |
| LTA | Left tibialis anterior |
| LGT | Left gastrocnemius. |
References
- Stotz, S. Therapie der Infantilen Cerebralparese; Pflaum Verlag: München, Germany, 2000. [Google Scholar]
- Koman, L.A.; Smith, B.P.; Shilt, J.S. Cerebral palsy. Lancet 2004, 363, 1619–1631. [Google Scholar] [CrossRef]
- Bax, M.; Goldstein, M.; Rosenbaum, P.; Leviton, A.; Paneth, N.; Dan, B.; Jacobsson, B.; Damino, D. Proposed definition and classification of cerebral palsy, April 2005. Dev. Med. Child Neurol. 2005, 47, 571–576. [Google Scholar] [CrossRef] [PubMed] [Green Version]
- Krägeloh-Mann, I.; Cans, C. Cerebral palsy update. Brain Dev. 2009, 31, 537–544. [Google Scholar] [CrossRef] [PubMed]
- Eyre, J.A.; Miller, S.; Clowry, G.J.; Conway, E.A.; Watts, C. Functional corticospinal projections are established prenatally in the human foetus permitting involvement in the development of spinal motor centres. Brain 2000, 123, 51–64. [Google Scholar] [CrossRef] [PubMed] [Green Version]
- Lippold, O. The relation between integrated action potentials in a human muscle and its isometric tension. J. Physiol. 1952, 117, 492–499. [Google Scholar] [CrossRef] [PubMed] [Green Version]
- Woods, J.J.; Bigland-Ritchie, B. Linear and nonlinear surface EMG/Force relationships in human muscles. Am. J. Phys. Med. 1983, 62, 287–299. [Google Scholar] [PubMed]
- Hof, A. The relationship between electromyogram and muscle force. Sportverletz. Sportschaden Organ Ges. Orthop.-Traumatol. Sportmed. 1997, 11, 79–86. [Google Scholar] [CrossRef] [PubMed]
- Fuglsang-Fredriksen, A. Electrical activity and force during voluntary contraction of normal and diseased muscle. Acta Neurol. Scand. 1981, 63, 7–60. [Google Scholar] [CrossRef]
- Reinbolt, J.A.; Fox, M.D.; Arnold, A.S.; Õunpuu, S.; Delp, S.L. Importance of preswing rectus femoris activity in stiff-knee gait. J. Biomech. 2008, 41, 2362–2369. [Google Scholar] [CrossRef] [PubMed] [Green Version]
- Hicks, J.; Schwartz, M.; Arnold, A.; Delp, S. Crouched postures reduce the capacity of muscles to extend the hip and knee during the single-limb stance phase of gait. J. Biomech. 2008, 41, 960–967. [Google Scholar] [CrossRef] [PubMed] [Green Version]
- Chu, W.T.V.; Sanger, T.D. Force variability during Isometric biceps contraction in children with secondary dystonia due to cerebral palsy. Mov. Disord. 2009, 24, 1299–1305. [Google Scholar] [CrossRef] [PubMed]
- Goldberg, E.; Requejo, P.; Fowler, E. Joint moment contributions to swing knee extension acceleration during gait in individuals with spastic diplegic cerebral palsy. Gait Posture 2011, 33, 66–70. [Google Scholar] [CrossRef] [PubMed]
- Kwon, S.; Park, H.; Stanley, C.; Kim, J.; Kim, J.; Damiano, D. A practical strategy for sEMG-based knee joint moment estimation during gait and its validation in individuals with cerebral palsy. IEEE Trans. Biomed. Eng. 2012, 59, 1480–1487. [Google Scholar] [CrossRef] [PubMed]
- Alves-Pinto, A.; Blumenstein, T.; Turova, V.; Lampe, R. Altered lower leg muscle activation patterns in patients with cerebral palsy during cycling on an ergometer. Neuropsychiatr. Dis. Treat. 2016, 12, 1445. [Google Scholar] [PubMed] [Green Version]
- Roy, S.; Alves-Pinto, A.; Lampe, R. Characteristics of Lower Leg Muscle Activity in Patients with Cerebral Palsy during Cycling on an Ergometer. BioMed Res. Int. 2018, 2018, 6460981. [Google Scholar] [CrossRef] [PubMed]
- Phoebe, R.; MBChB, D.W.; Suzanne, F.; Yumna, A.K.; Ross, T. A Descriptive Comparison of Sprint Cycling Performance and Neuromuscular Characteristics in Able-Bodied Athletes and Paralympic Athletes with Cerebral Palsy. Am. J. Phys. Med. Rehabil. 2015, 94, 28–37. [Google Scholar]
- Kaplan, S. Cycling patterns in children with and without cerebral palsy. Dev. Med. Child Neurol. 1995, 37, 620. [Google Scholar] [CrossRef] [PubMed]
- Li, L.; Caldwell, G.E. Muscle coordination in cycling: Effect of surface incline and posture. J. Appl. Physiol. 1998, 85, 927–934. [Google Scholar] [CrossRef] [PubMed]
- Buchanan, T.S.; Lloyd, D.G.; Manal, K.; Besier, T.F. Neuromusculoskeletal Modeling: Estimation of Muscle Forces and Joint Moments and Movements from Measurements of Neural Command. J. Appl. Biomech. 2004, 20, 367–395. [Google Scholar] [CrossRef] [PubMed] [Green Version]
- Shao, Q.; Bassett, D.N.; Manal, K.; Buchanan, T.S. An EMG-driven Model to Estimate Muscle Forces and Joint Moments in Stroke Patients. Comput. Biol. Med. 2009, 39, 1083–1088. [Google Scholar] [CrossRef] [PubMed]
- Hermens, H.J.; Freriks, B.; Disselhorst-Klug, C.; Rau, G. Development of recommendations for SEMG sensors and sensor placement procedures. J. Electromyogr. Kinesiol. 2000, 10, 361–374. [Google Scholar] [CrossRef]
- Palisano, R.; Rosenbaum, P.; Walter, S.; Russell, D.; Wood, E.; Galuppi, B. Development and reliability of a system to classify gross motor function in children with Cerebral Palsy. Dev. Med. Child Neurol. 1997, 39, 214–223. [Google Scholar] [CrossRef]
- Gregson, J.M.; Leathley, M.; Moore, A.; Sharma, A.K.; Smith, T.L.; Watkins, C.L. Reliability of the tone assessment scale and the modified ashworth scale as clinical tools for assessing poststroke spasticity. Arch. Phys. Med. Rehabil. 1999, 80, 1013–1016. [Google Scholar] [CrossRef]
- Zajac, F.E. Muscle and tendon: properties, models, scaling, and application to biomechanics and motor control. Crit. Rev. Biomed. Eng. 1989, 17, 359–411. [Google Scholar] [PubMed]
- Thelen, D.G.; Schultz, A.B.; Fassois, S.D.; Asthon-Miller, J.A. Identification of Dynamic Myoelectric Signal-to-Force Models during Isometric Lumbar Muscle Contractions. J. Biomech. 1994, 27, 907–919. [Google Scholar] [CrossRef]
- Lloyd, D.G.; Buchanan, T.S. A model of load sharing between muscles and soft tissues at the human knee during static tasks. J. Biomech. Eng. 1996, 118, 367–376. [Google Scholar] [CrossRef] [PubMed]
- Corcos, D.M.; Gottlieb, G.L.; Latash, M.L.; Almeida, G.L.; Agarwal, G.C. Electromechanical Delay: An Experimental Artifact. J. Electromyogr. Kinesiol. 1992, 2, 59–68. [Google Scholar] [CrossRef]
- Hull, M.L.; Hawkins, D. Analysis of muscular work in multisegmental movements: Application to cycling. In Multiple Muscle Systems: Biomechanics and Movement Organization; Winters, J.M., Woo, S.L.-Y., Eds.; Springer: New York, NY, USA, 1990; pp. 621–638. [Google Scholar]
- Manal, K.; Gonzalez, R.V.; Lloyd, D.G.; Buchanan, T.S. A real-time EMG-driven virtual arm. Comput. Biol. Med. 2002, 32, 25–36. [Google Scholar] [CrossRef]
- Lloyd, D.G.; Besier, T.F. An EMG-driven musculoskeletal model to estimate muscle forces and knee joint moments in vivo. J. Biomech. 2003, 36, 765–776. [Google Scholar] [CrossRef] [Green Version]
- Patikas, D.; Wolf, S.; Schuster, W.; Armbrust, P.; Dreher, T.; Döderlein, L. Electromyographic patterns in children with cerebral palsy: Do they change after surgery? Gait Posture 2007, 26, 362–371. [Google Scholar] [CrossRef] [PubMed]
- Wolf, S.; Loose, T.; Schablowski, M.; Döderlein, L.; Rupp, R.; Gerner, H.J.; Bretthauer, G.; Mikut, R. Automated feature assessment in instrumented gait analysis. Gait Posture 2006, 23, 331–338. [Google Scholar] [CrossRef] [PubMed]
Figure 1.
Schematic representation of steps followed in the present work and to be followed in future work. EMG: electromyography.
Figure 1.
Schematic representation of steps followed in the present work and to be followed in future work. EMG: electromyography.

Figure 2.
Definition of crank angle and quadrants during cycling.

Figure 3.
EMG signal (1st row) collected from lower extremity muscles during cycling on an ergometer and mathematical transformations (middle and bottom row) applied to as schematically described on the left border of the figure. The first and third panels (from left) illustrate an example from a healthy participant, and the second and fourth panels from a participant with left hemiparesis and spasticity MAS level 3. Block (a) refers to left biceps femoris (LBF); block (b) refers to left rectus femoris (LRF).

Figure 4.
Similar to Figure 3 but for two other muscles under consideration. Figure panels correspondence as in Figure 3. Block (a) for left tibialis anterior (LTA); block (b) for left gastrocnemius (LGT).

Figure 5.
Time difference between EMG recording (solid line) and input spread function (dashed line, input for motor response) against time. The two functions are separated by electromechanical delay time d.
Figure 5.
Time difference between EMG recording (solid line) and input spread function (dashed line, input for motor response) against time. The two functions are separated by electromechanical delay time d.

Figure 6.
Variation of Norm Distance (ND) with respect to MAS level for four muscles activity converted from EMG signal. (a) for M. rectus femoris, (b) for M. biceps femoris, (c) for M. tibialis anterior and (d) for M. gastrocnemius. The number of data points changes for different panels because EMG signals collected from some muscles had poor quality and had to be discarded from analysis.


© 2018 by the authors. Licensee MDPI, Basel, Switzerland. This article is an open access article distributed under the terms and conditions of the Creative Commons Attribution (CC BY) license (http://creativecommons.org/licenses/by/4.0/).
Share and Cite
MDPI and ACS Style
Roy, S.; Alves-Pinto, A.; Lampe, R. Modeling of Muscle Activation from Electromyography Recordings in Patients with Cerebral Palsy. Appl. Sci. 2018, 8, 2345. https://doi.org/10.3390/app8122345
AMA Style
Roy S, Alves-Pinto A, Lampe R. Modeling of Muscle Activation from Electromyography Recordings in Patients with Cerebral Palsy. Applied Sciences. 2018; 8(12):2345. https://doi.org/10.3390/app8122345
Chicago/Turabian StyleRoy, Susmita, Ana Alves-Pinto, and Renée Lampe. 2018. "Modeling of Muscle Activation from Electromyography Recordings in Patients with Cerebral Palsy" Applied Sciences 8, no. 12: 2345. https://doi.org/10.3390/app8122345
Note that from the first issue of 2016, this journal uses article numbers instead of page numbers. See further details here.