Article

Characterization of Reduced Graphene Oxide (rGO)-Loaded SnO2 Nanocomposite and Applications in C2H2 Gas Detection

1
State Key Laboratory of Power Transmission Equipment & System Security and New Technology, Chongqing University, Chongqing 400044, China
2
School of Electrical Engineering, Chongqing University, Chongqing 400044, China
3
College of Engineering and Technology, Southwest University, Chongqing 400715, China
*
Author to whom correspondence should be addressed.
Appl. Sci. 2017, 7(1), 19; https://doi.org/10.3390/app7010019
Submission received: 31 October 2016 / Revised: 4 December 2016 / Accepted: 17 December 2016 / Published: 23 December 2016
(This article belongs to the Special Issue Metal Oxide Nanostructures)

Abstract

:
Acetylene (C2H2) gas sensors were developed by synthesizing a reduced graphene oxide (rGO)-loaded SnO2 hybrid nanocomposite via a facile two-step hydrothermal method. Morphological characterizations showed the formation of well-dispersed SnO2 nanoparticles loaded on the rGO sheets with excellent transparency and obvious fold boundary. Structural analysis revealed good agreement with the standard crystalline phases of SnO2 and rGO. Gas sensing characteristics of the synthesized materials were carried out in a temperature range of 100–300 °C with various concentrations of C2H2 gas. At 180 °C, the SnO2–rGO hybrid showed preferable detection of C2H2 with high sensor response (12.4 toward 50 ppm), fast response-recovery time (54 s and 23 s), limit of detection (LOD) of 1.3 ppm and good linearity, with good selectivity and long-term stability. Furthermore, the possible gas sensing mechanism of the SnO2–rGO nanocomposites for C2H2 gas were summarized and discussed in detail. Our work indicates that the addition of rGO would be effective in enhancing the sensing properties of metal oxide-based gas sensors for C2H2 and may make a contribution to the development of an excellent ppm-level gas sensor for on-line monitoring of dissolved C2H2 gas in transformer oil.

1. Introduction

Condition monitoring and fault diagnosis is crucial in ensuring the long-term safe and stable operation of power transformers. Latent faults in the power transformer in early stages can be found by monitoring the operation state of the insulation system, which mainly consists of oil and paper [1]. The occurrence of incipient thermal or discharge faults cause the C-H and C-C bond cleavage of oil-paper insulation system, leading to the formation of various dissolved gases, such as H2, CH4, C2H6, C2H4 and C2H2 [2]. These gases turn into insulated defects, which reduce the insulation strength of the oil-paper insulation system and develop into permanent faults. The composition and content of these dissolved gases must be detected in order to identify types and severity, as well as to accurately assess the insulation status of power transformer [3,4,5]. In addition, Acetylene (C2H2) is a colorless combustible hydrocarbon. It is the simplest alkyne, with a distinctive odor. It is widely used as a fuel and in many other industrial applications. For example, it is an important raw material for organic synthesis such as in 2-chloro-1,3-butadiene; in lighting; in welding and metal cutting; and in dry-cell batteries, etc. However, it is extremely unstable in its pure form and it is easy to incur fire or explosive accidents when it is liquefied, compressed, heated or mixed with air. Thus, the safety monitoring of C2H2 is vital during its production and handling. Use of gas sensors is one of the most widely and effectively used methods to detect the composition and content of C2H2 gas [6].
Metal oxides (MOs) that change their electrical conductance while exposed to ambient gas can be utilized as gas sensing materials [7]. Many MOs are applicable to detect the reducing and oxidizing gases, for instance, the conductance of CuO, NiO, In2O3, WO3, TiO2, Fe2O3, etc. show different response to gases. However, ZnO and SnO2 are the main gas sensing materials for commercial applications and experimental research [8]. Pure SnO2 is sensitive to all the dissolved gases, but it still has some shortcomings, such as high heating temperature, unsatisfied response and poor selectivity [9].Research on how to efficiently improve gas sensing properties is focused on surface modification [10], doping [11] and morphology or size control [12,13]. Recently, graphene has attracted much attention because of its two-dimensional nanostructure with extremely high specific area and electron mobility. The graphene sensor is expected to exhibit excellent gas sensing performance [14]. However, pure graphene is composed of periodic, closely-packed carbon atoms with a benzene ring structure, which is unfavorable for the adsorption of gas molecules. In this regard, the graphene derivative, which is decorated with oxygen functional groups to increase the adsorption site for gas molecules, was named reduced graphene oxide (rGO) [15]. In particular, many groups have reported the gas sensing properties of rGO-based materials, loaded with MOs nanoparticles, with respect to various gases. The NiO–rGO nanocomposite exhibited high response, good repeatability and acceptable selectivity toward CH4 gas detection [16]. ZnO–rGO exhibited significantly higher responses than pure ZnO with respect to various gases, including O2, SO2, NO2, CO, C6H6, and C2H5OH [17]. The MO–rGO (SnO2, Fe2O3 and NiO) composite porous films exhibited much better sensing performances than those of the corresponding pure oxide films in detecting C2H5OH gas [18]. TiO2–rGO shows good sensitivity and excellent selectivity to different concentrations of NH3 from 5 ppm to 50 ppm at room temperature [19]. Latif and Dickert summarized the recent progress and gas sensing applications in graphene hybrid materials, including fabrication method of graphene-based sensors, nanostructures of hybrid materials, gas sensing mechanisms and future perspectives [20]. Nevertheless, there is few reports about the gas sensing properties of SnO2 nanoparticle–reduced graphene oxide (SnO2–rGO) nanocomposites for C2H2 gas detection at a ppm level.
Herein, we investigated the gas sensing properties (including optimum operating temperature, response to concentration, dynamic sensing transient, response and recovery time, selectivity and long-term stability) of SnO2–rGO nanocomposites with respect to C2H2 gas detection. The SnO2–rGO nanomaterials were synthesized via a simple two-step hydrothermal method and characterized by X-ray diffraction (XRD), transmission electron microscopy (TEM), energy dispersive spectroscopy (EDS), Raman spectra, X-ray photoelectron spectroscopy (XPS) and thermogravimetric analyses (TGA). Meanwhile, planar sensors were fabricated to examine the gas sensing performance with respect to C2H2 gas. The results indicate that the SnO2–rGO can efficiently detect the C2H2 gas under a low operating temperature, showing better sensing performances than those of rGO alone. Finally, the possible gas sensing mechanisms of the SnO2-rGO with respect to C2H2 detection have been discussed.

2. Experimental Method

2.1. Materials

The commercially available high-purity graphene oxide (GO) was purchased from XFNANO Materials Technology Co., Ltd. (Nanjing, China). Sodium stannate hydrate (Na2SnO3·3H2O), citric acid hydrate (C6H8O7·H2O) and sodium hydroxide (NaOH) were purchased from Chuandong Chemical Reagent Co., Ltd. (Chongqing, China). All chemicals in our work were of analytical reagent grade and used as-received, without any further purification.

2.1.1. SnO2 Nanoparticle Synthesis

SnO2 nanoparticles were synthesized by the following hydrothermal method [21]. First, 2.5 mmol of Na2SnO3·3H2O and 1.0 mmol of C6H8O7·H2O were dissolved in the mixture of 20 mL deionized water (DIW) and 20 mL anhydrous ethanol (EtOH), and the solution was vigorously stirred for 10 min. Subsequently, 15 mmol of NaOH was added dropwise into the above solution and stirred vigorously for 30 min. Then, the precursor solution was transferred to a 50 mL Teflon-lined autoclave which was heated at 180 °C for 14 h. Afterwards, the product was collected after centrifuging and washing for several times. Finally, the product was calcined at 400 °C for 2 h.

2.1.2. SnO2–rGO Nanocomposite Preparation

SnO2–rGO was prepared by compositing as-prepared SnO2 nanoparticles and GO under the hydrothermal treatment and the detailed preparation process was presented as follows. The same amount (5 mg) of as-prepared SnO2 nanoparticles and GO were added into 30 mL of DIW with stirring and ultrasonic dispersion for 30 min to achieve uniform dispersion. Then, the dispersion solution was transferred to 50 mL Teflon autoclave (180 °C, 12 h). The products were centrifuged and calcined at 200 °C for 2 h to obtain the SnO2-rGO nanocomposite. For comparison, the rGO was prepared by the similar method without addition of SnO2.

2.1.3. Characterization

The microstructure and morphology of as-prepared samples were characterized. X-ray diffraction (XRD) patterns were recorded on a Bruker D8 Advance (Bruker, Karlsruhe, Germany) using Cu Kα radiation at 40 kV and 40 mA. Raman spectra were determined using a HORIBA Jobin Yvon LabRam (HORIBA Jobin Yvon, Paris, France) equipped with a 532 nm wavelength laser and full-range grating. Thermogravimetric analyses (TGA) were carried out with a NETZSCH STA 449F3 (Netzsch, Selb, Germany) unit at a heating rate of 5 °C/min under a nitrogen atmosphere. Scanning electron microscopy (SEM) images were observed by a FEI Nova Nano Field Emission SEM (FEI, Hillsboro, OR, USA) operated at 20 kV. Transmission electron microscopy (TEM) and energy dispersive spectroscopy (EDS) images were performed by an FEI Tecnai G2 F20 S-TWIN (FEI, Hillsboro, OR, USA) operated at 200 kV. The Thermo ESCALAB 250Xi spectrometer (Thermo Fisher Scientific, Waltham, MA, USA) was used to recorded the X-ray photoelectron spectroscopy (XPS) images.

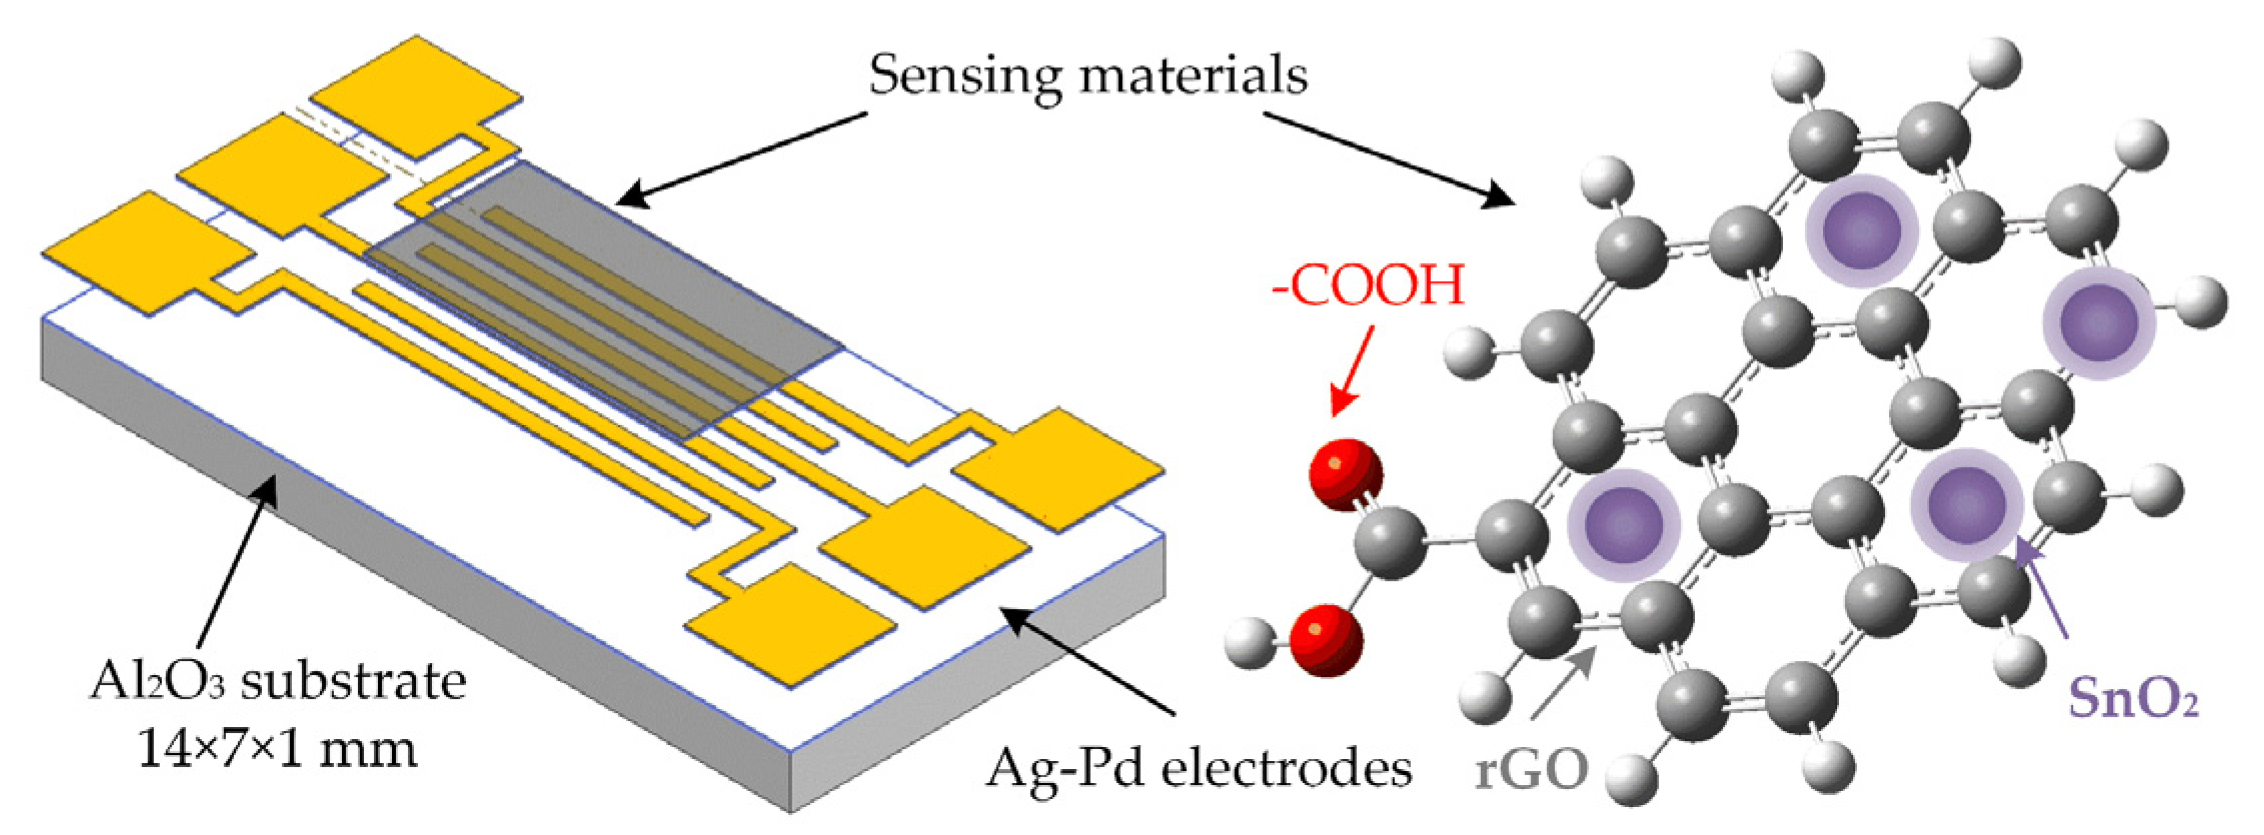
2.2. Fabrication of Planar Gas Sensor

Aiming at testing the gas sensing of as-synthesized gas sensing nanomaterials, a planar resistivity-type sensor device was fabricated. The sensor is mainly made up of three layers: sensing materials, Ag–Pd electrodes and Al2O3 substrate. For the planar sensor depicted in Figure 1, Ag–Pd electrodes were interdigitally etched on Al2O3 with ≈300-nm-thick foil, 0.2-mm electrode width and spacing by screen-printing. The Ag–Pd pastes (9:1 by weight ratio) used in our experiment have been used for chemical sensors in many cases [22,23]. These substrates can work in atmospheres under 300 °C with stable electric and chemical properties, which are based on the interactions of Pd-doping in Ag pastes. The required quantity of nanocomposites was evenly dispersed in the mixture of DI water and ethanol ratio of 1:1, then the paste was dispersed coated onto the interdigital area of Ag–Pd electrodes to form uniform, dense and smoothly deposited thick films by screen-printing technique [24,25]. Finally, after drying overnight, aging occurred at 120 °C for 120 h to ensure surface resistance value remained stable. For this reason, the stability and repeatability of planar sensor was enhanced.

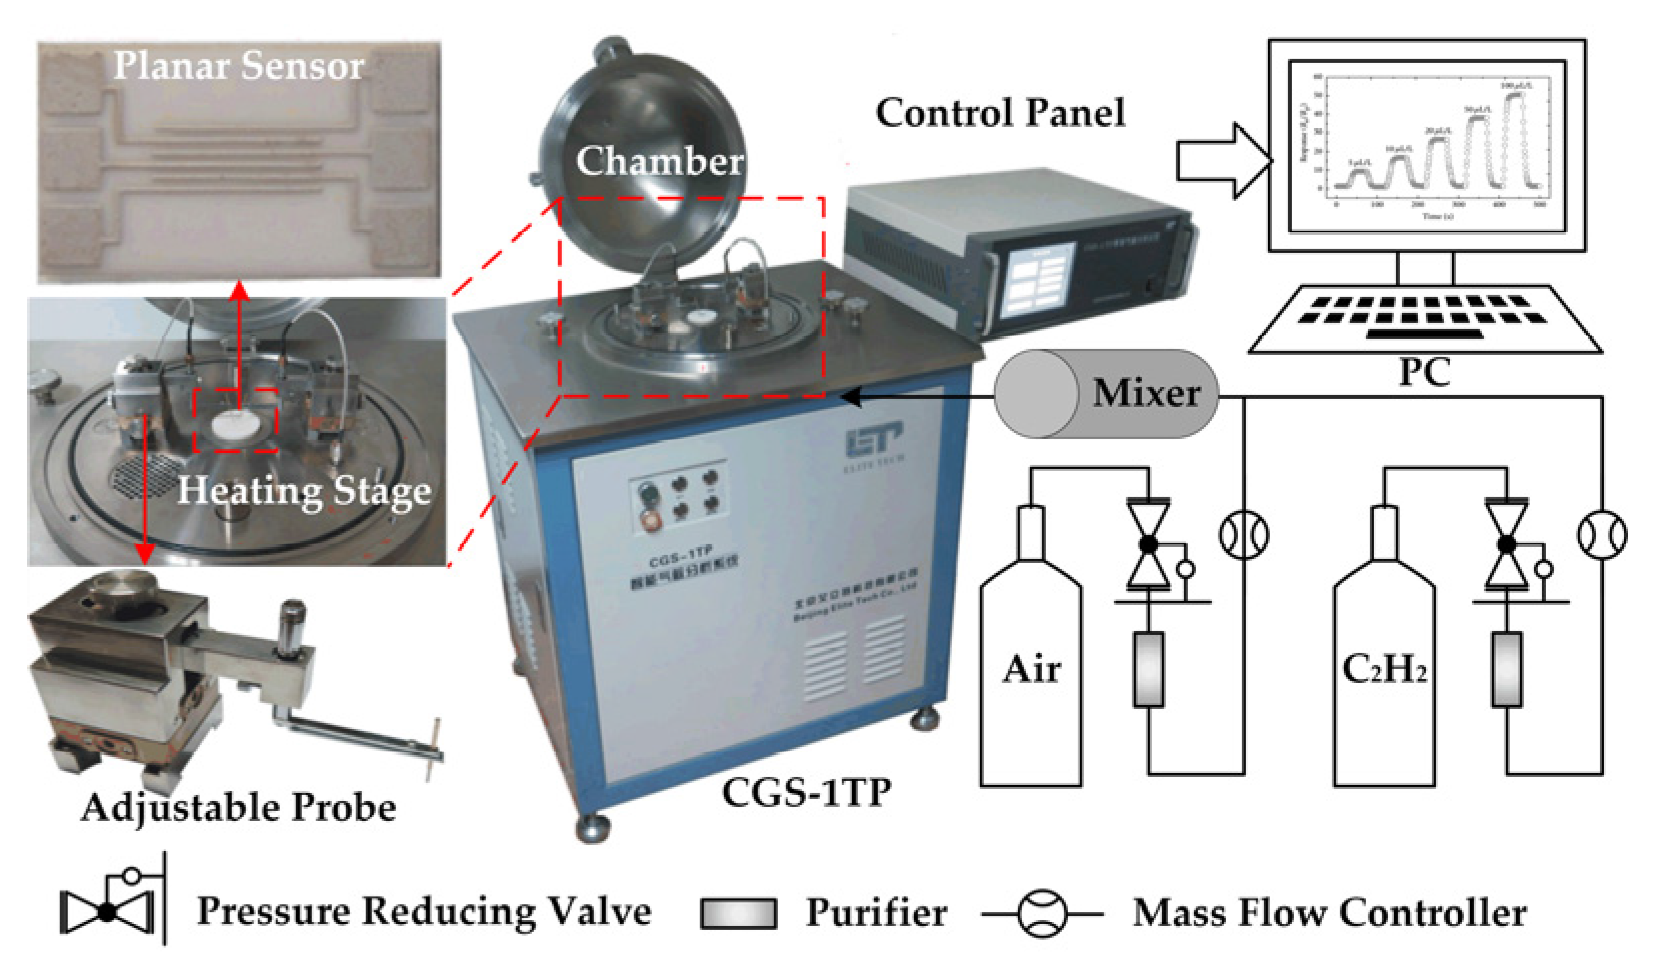
2.3. Gas Sensing Measurements

The gas sensing properties of the fabricated planar gas sensor for C2H2 were tested by our gas sensing analysis measurement system, which is made up of an automatic gas distribution equipment and the CGS-1TP intelligent gas sensing analysis system (Elite Technology Co., Ltd., Beijing, China), is shown in Figure 2. This measurement system is convenient for controlling and obtaining the experimental parameters (operating temperature, resistance characteristic, ambient condition, etc.).
The procedure of testing is described below. First, the fabricated planar gas sensor was fixed in the center of heating stage by two adjustable probes, which were used to collect the electrical signals of the sensing materials. Then, the operating temperature of sensor was set and air was delivered into a sealed chamber at a constant flow rate. When the resistance of the sensor remained stable, the C2H2 gas was injected into the chamber. After the response was achieved, the gas sensor was exposed to air again. The concentration of C2H2 gas was controlled by the mass flow controllers (MFCs) with the following equation:
Gas concentration ( ppm ) = Flow   rate C 2 H 2 Flow   rate air + Flow   rate C 2 H 2
The sensor was measured at temperatures ranging between 100 °C and 300 °C for various concentrations of C2H2. The response of a sensor is calculated as S = Ra/Rg, where Ra and Rg are the resistances of the sensor in the air and C2H2 gas at certain concentrations, respectively. Response time and recovery time of the sensor were defined as the time required to reach 90% of the total resistance change [26]. The whole experiment process conducted at the same environment temperature and relative humidity (25 °C, 35%).

3. Results and Discussion

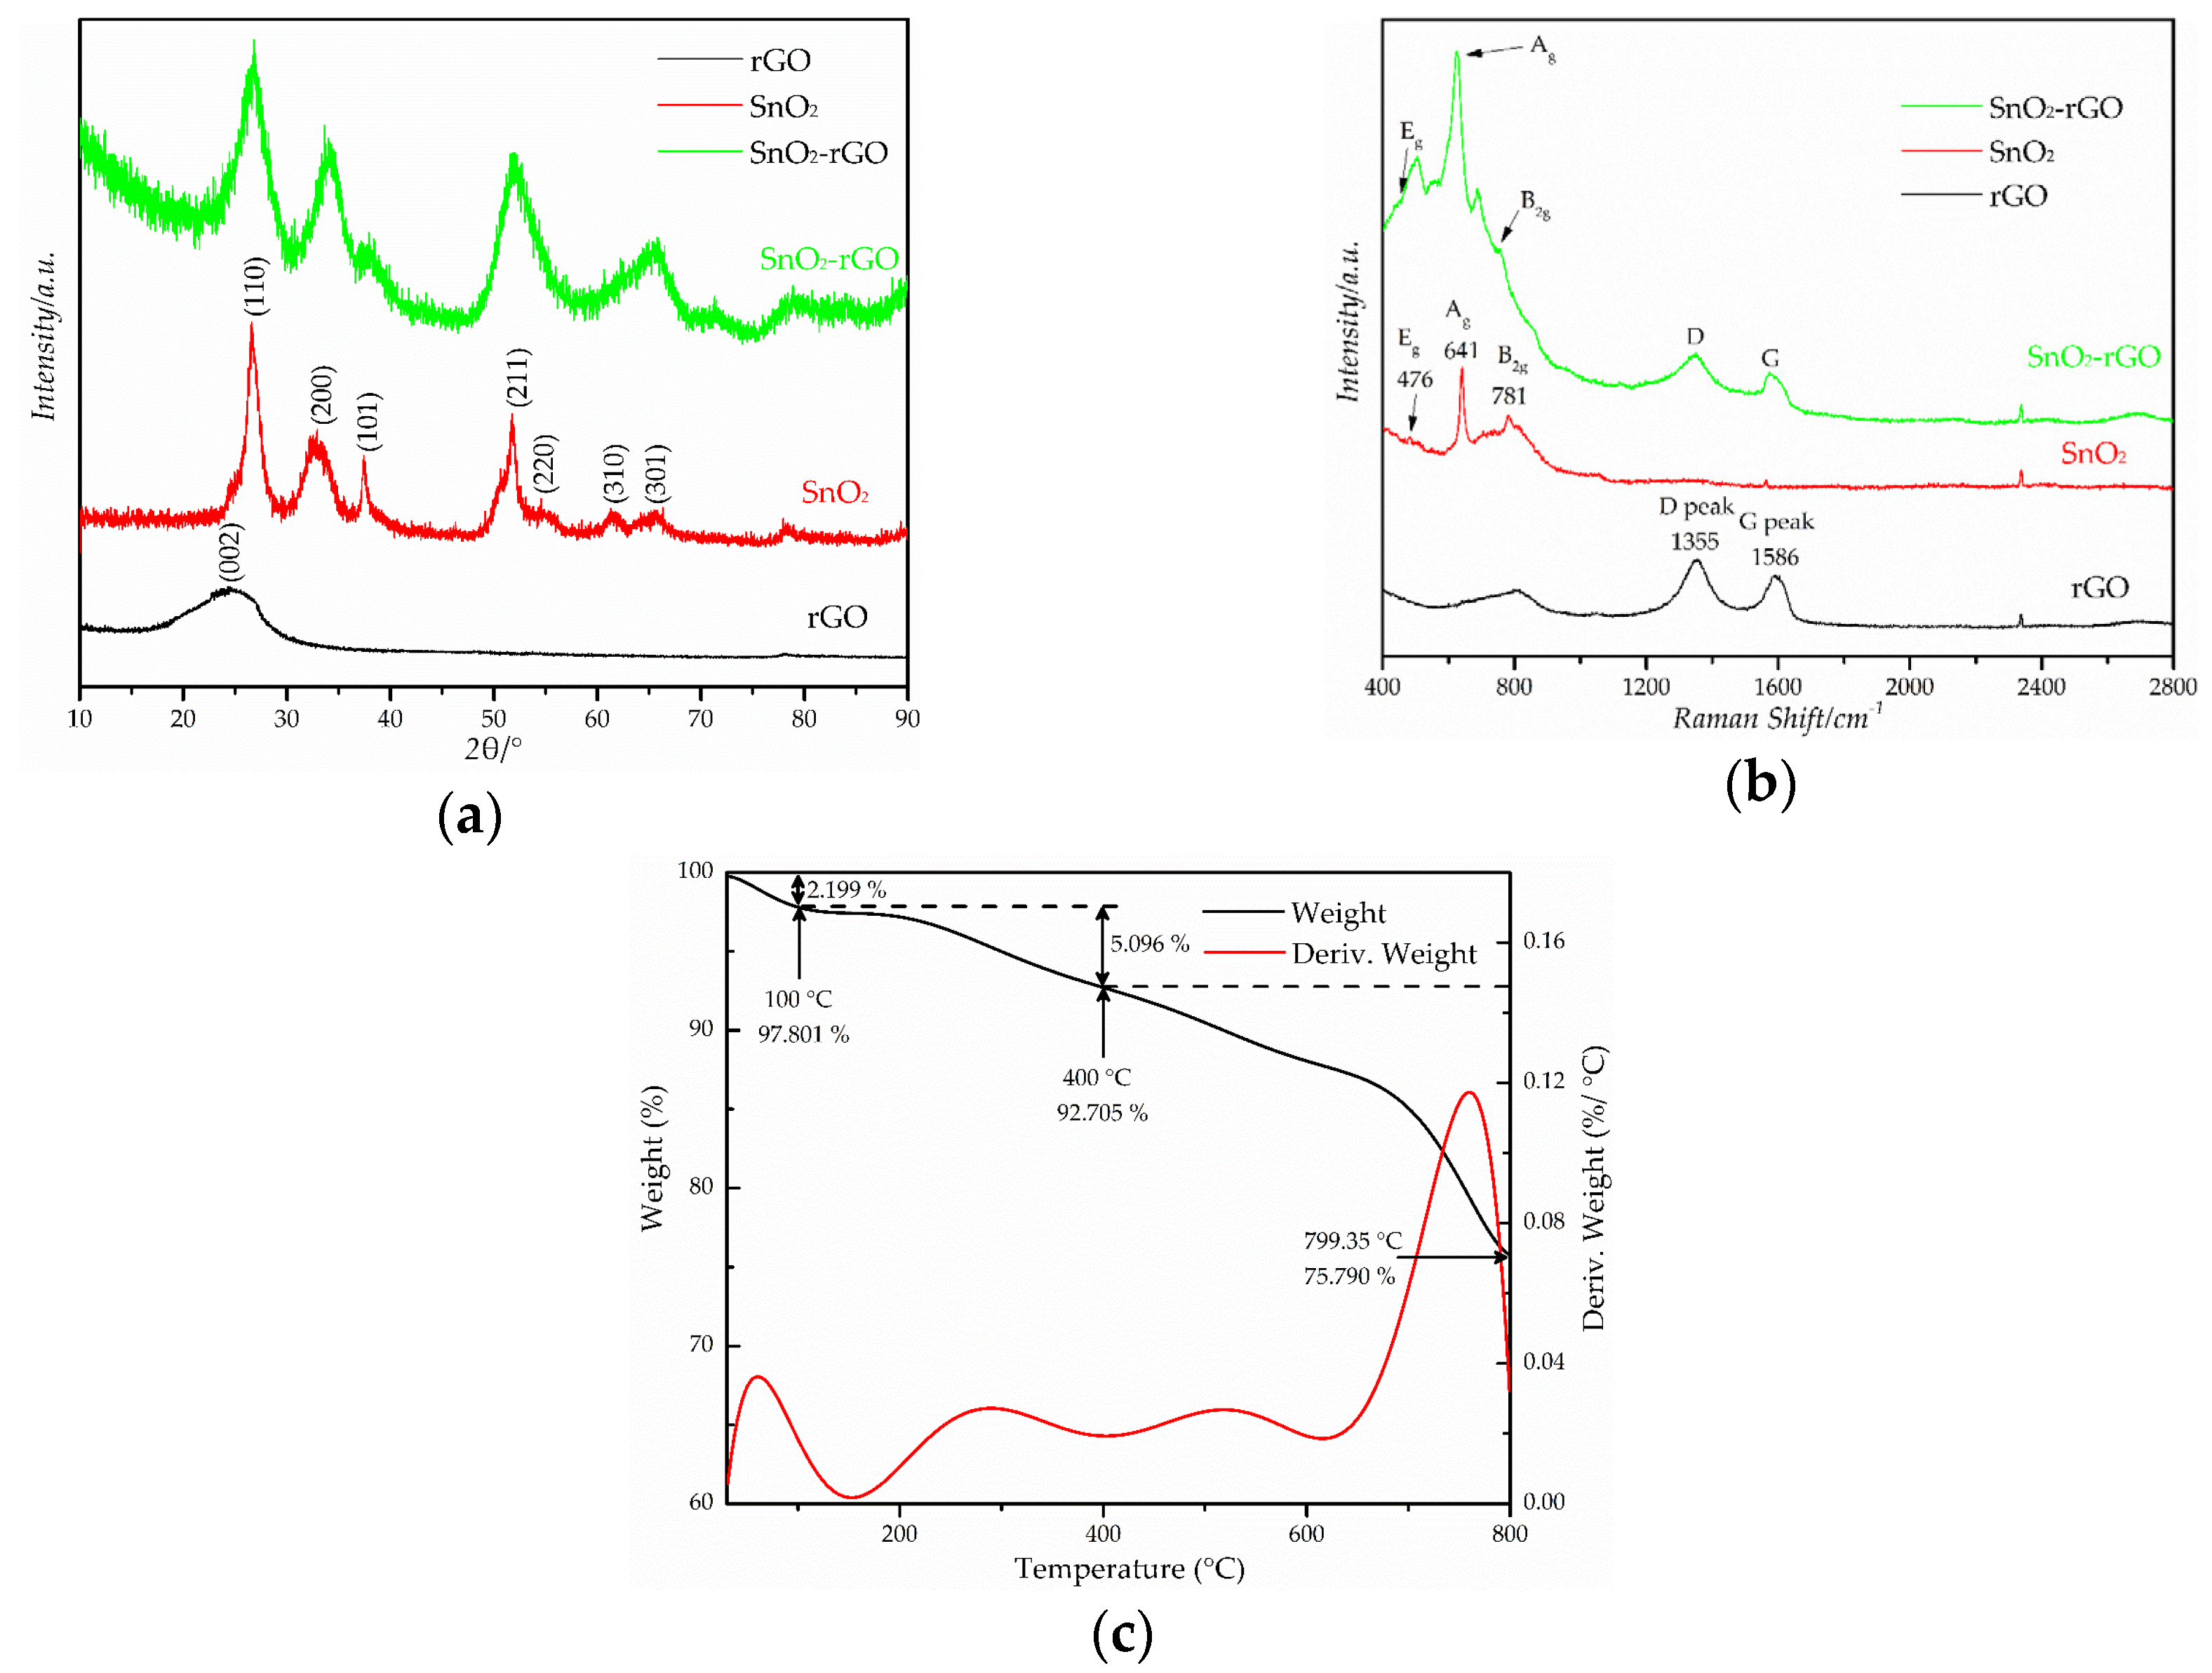
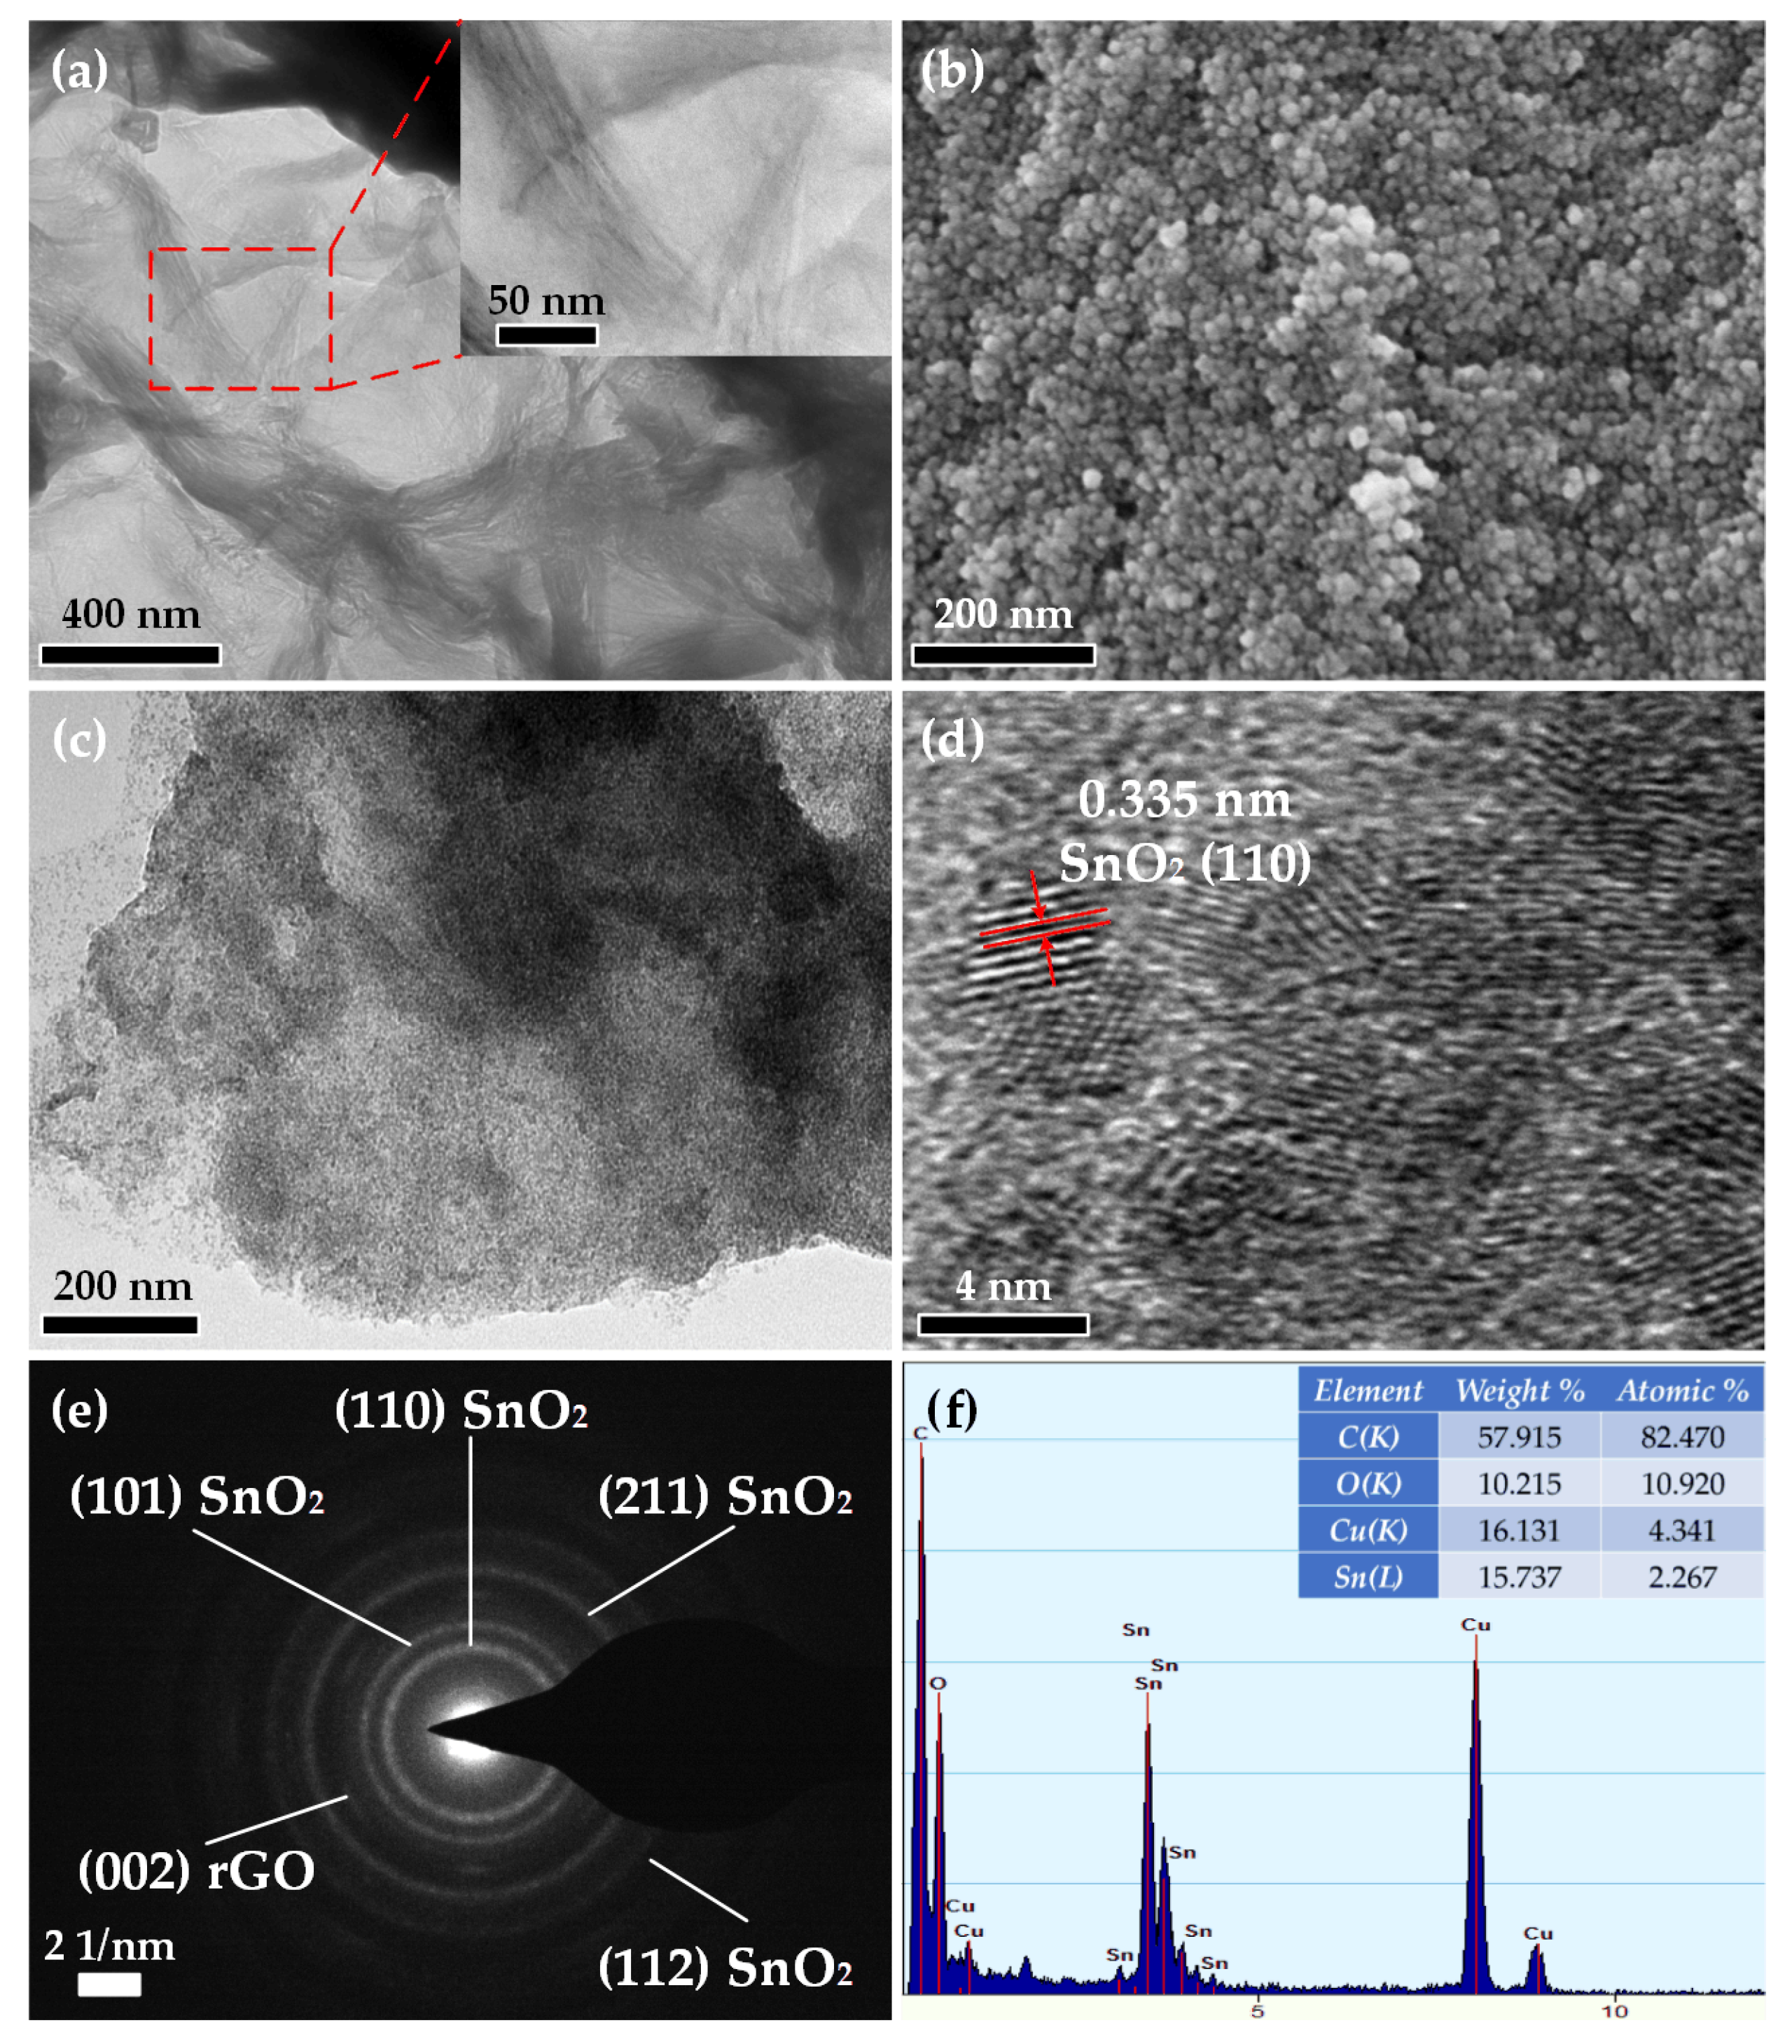
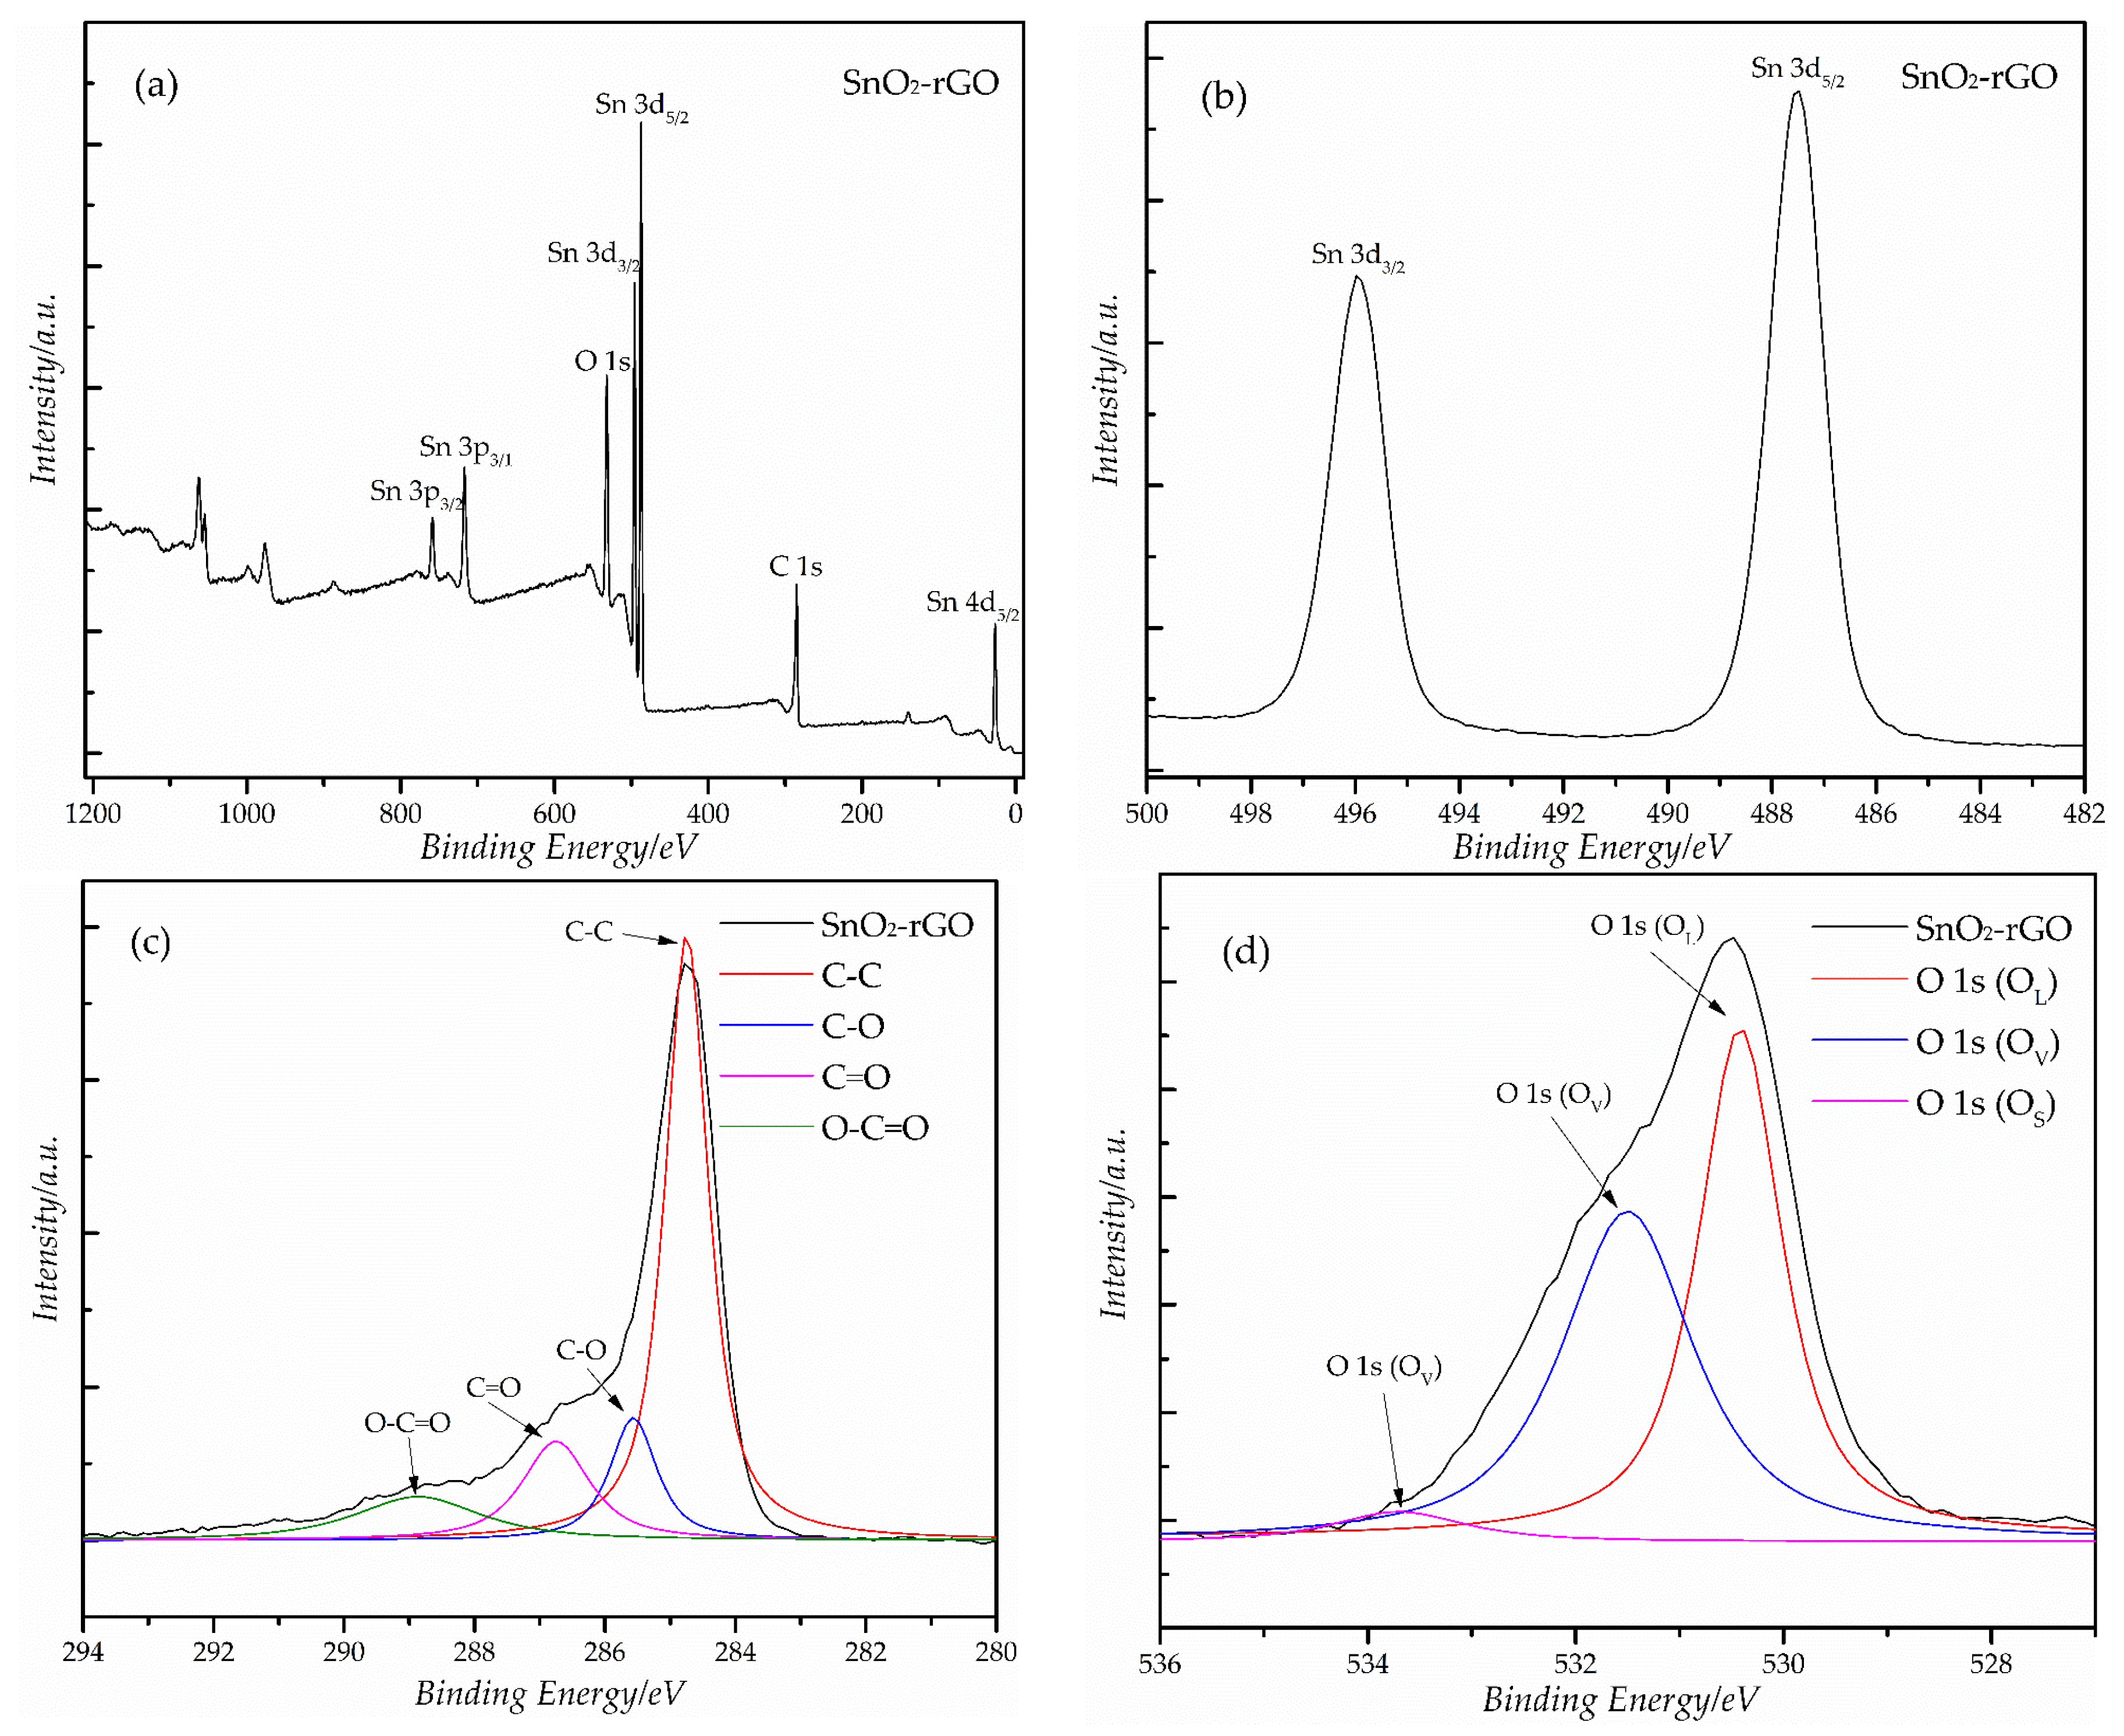
3.1. Structural Characterization

The samples must be characterized before the measurement of gas sensing performance to identify the microstructure and morphology. The XRD patterns of rGO, SnO2 and SnO2–rGO are presented in Figure 3a. It is seen that a broad diffraction peak centered at 2θ = 24.5° with interlayer distance of 3.78 Å of rGO was observed, which is close to the typical (002) diffraction peak of graphite at 2θ = 26.6°. The peak of GO which might appear in the range of 2θ (10°–12°) was not observed, which further indicates that the GO had been almost completely reduced to rGO. Meanwhile, several strong peaks appeared at 2θ of 26.6°, 33.7°, 37.8° and 51.6°, in agreement with the (110), (101), (200) and (211) planes of rutile SnO2 (JCPDS 77-0452). The main diffraction peaks of SnO2–rGO were similar with those of SnO2 and the characteristic peak of rGO is invisible as seen in Figure 3a, probably owing to the fact that the rGO is wrapped by SnO2 nanocrystals through the hydrothermal treatment, or that the weak peak of rGO is swamped by the presence of the strong peak around 26.6° at (110) plane of the SnO2 nanocrystals [27]. Figure 3b shows the Raman spectrum results of SnO2–rGO, which can be used to prove the existence of rGO in the SnO2–rGO nanocomposite. Two representative peaks were observed around at 1355 cm−1 and 1586 cm−1, corresponding with disorder-induced (D) band and tangential (G) band of rGO. Due to the ultrasonic exfoliation and hydrothermal treatment, the GO was reduced and more defects were introduced which enhance the performance of gas adsorption, leading to the D and G band of rGO having some minor peak shifts to 1360 cm−1 and 1608 cm−1 of GO. Moreover, the three typical peaks located at round 472 cm−1, 641 cm−1 and 781 cm−1 can be matched with the Eg, Ag and B2g vibration modes of rutile SnO2 [28]. All these mentioned characteristic peaks appeared in the Raman spectrum of SnO2–rGO. It was confirmed that the as-synthesized SnO2–rGO nanocomposite was made up of rGO and SnO2. The characteristics of combustion of SnO2–rGO were investigated using thermogravimetric analysis (TGA) and the results are as shown in Figure 3c. The first 2.199% mass loss (approximately 100 °C) was due to water solvent molecules absorbed into the reduced GO bulk material. The following 5.096% decrease (400 °C) represents elimination of the remaining functional groups; further decomposition takes place up to 800 °C. Experimental settings were as follows: temperature scanning rate: 5 °C/min; temperature range 30–800 °C, and purging inert gas: N2. SnO2–rGO has good thermal stability in the range of temperatures (100–300 °C).
Figure 4a depicts the TEM and high-resolution TEM (HRTEM) micrographs of rGO. The quality of rGO is good because of its excellent transparency and obvious fold boundary. In Figure 4b, the SnO2 nanoparticles with irregular grain size up to 10 nm in diameter were successfully synthesized. From the TEM image of SnO2–rGO in Figure 4c,d, it can be seen that the SnO2 nanoparticles were uniformly loaded on the rGO nanosheet surface. Meanwhile, the neighboring fringe spacing of the nanoparticle, dispersed on the surface of rGO, was 0.34 nm. This can be attributed to (110) plane of SnO2 nanocrystals, indicating that the SnO2–rGO nanocomposites were prepared. Figure 4e shows the selected area electron diffraction (SAED) pattern of SnO2–rGO; all diffraction rings on this SAED pattern were exactly assigned to the reflections (110), (101), (211), (112) of the rutile SnO2 phase and (002) of rGO, which agree well with the XRD pattern of SnO2–rGO in Figure 3a. The energy dispersive spectroscopy (EDS) spectrum of SnO2–rGO indicated that the Sn element is found in the constituent elements of SnO2–rGO (C, O and Sn) and the content of the Sn element was calculated as 15.737 wt %, further verifying that SnO2 was loaded on the surface of rGO.
To further investigate the composition and chemical state of the element, X-ray photoelectron spectroscopy (XPS) spectra of the SnO2–rGO nanocomposite were carried out and are shown in Figure 5. As depicted in Figure 5a, the peaks of C 1s, O 1s, Sn 4d, Sn 3d and Sn 3p can be observed in survey spectrum. The two peaks with binding energies of 487.5 eV and 496.0 eV corresponded to Sn 3d5/2 and Sn 3d3/2 respectively, which indicated the existence of Sn2+. Figure 5c shows the C 1s spectrum and binding energy of C-C, C-O; C=O and O-C=O are assigned at 284.7 eV, 285.6 eV, 286.8 eV and 288.9 eV, respectively [29]. Figure 5d displays the O 1s spectrum, which has been separated into three peaks at 530.4 eV, 531.5 eV and 533.7 eV. The peak centered at 530.4 eV was attributed to oxidized metal ions (OL) in the lattice of Sn–O. The binding energy at 531.5 eV is ascribed to oxygen vacancies (OV) in the surface of SnO2–rGO. The high binding energy peak located at 533.7 eV originated from the oxygen atoms (OS) chemisorbed on the surface of synthesized materials [30]. Based on above results, it is concluded that the as-synthesized nanocomposites are composed of SnO2 and rGO.

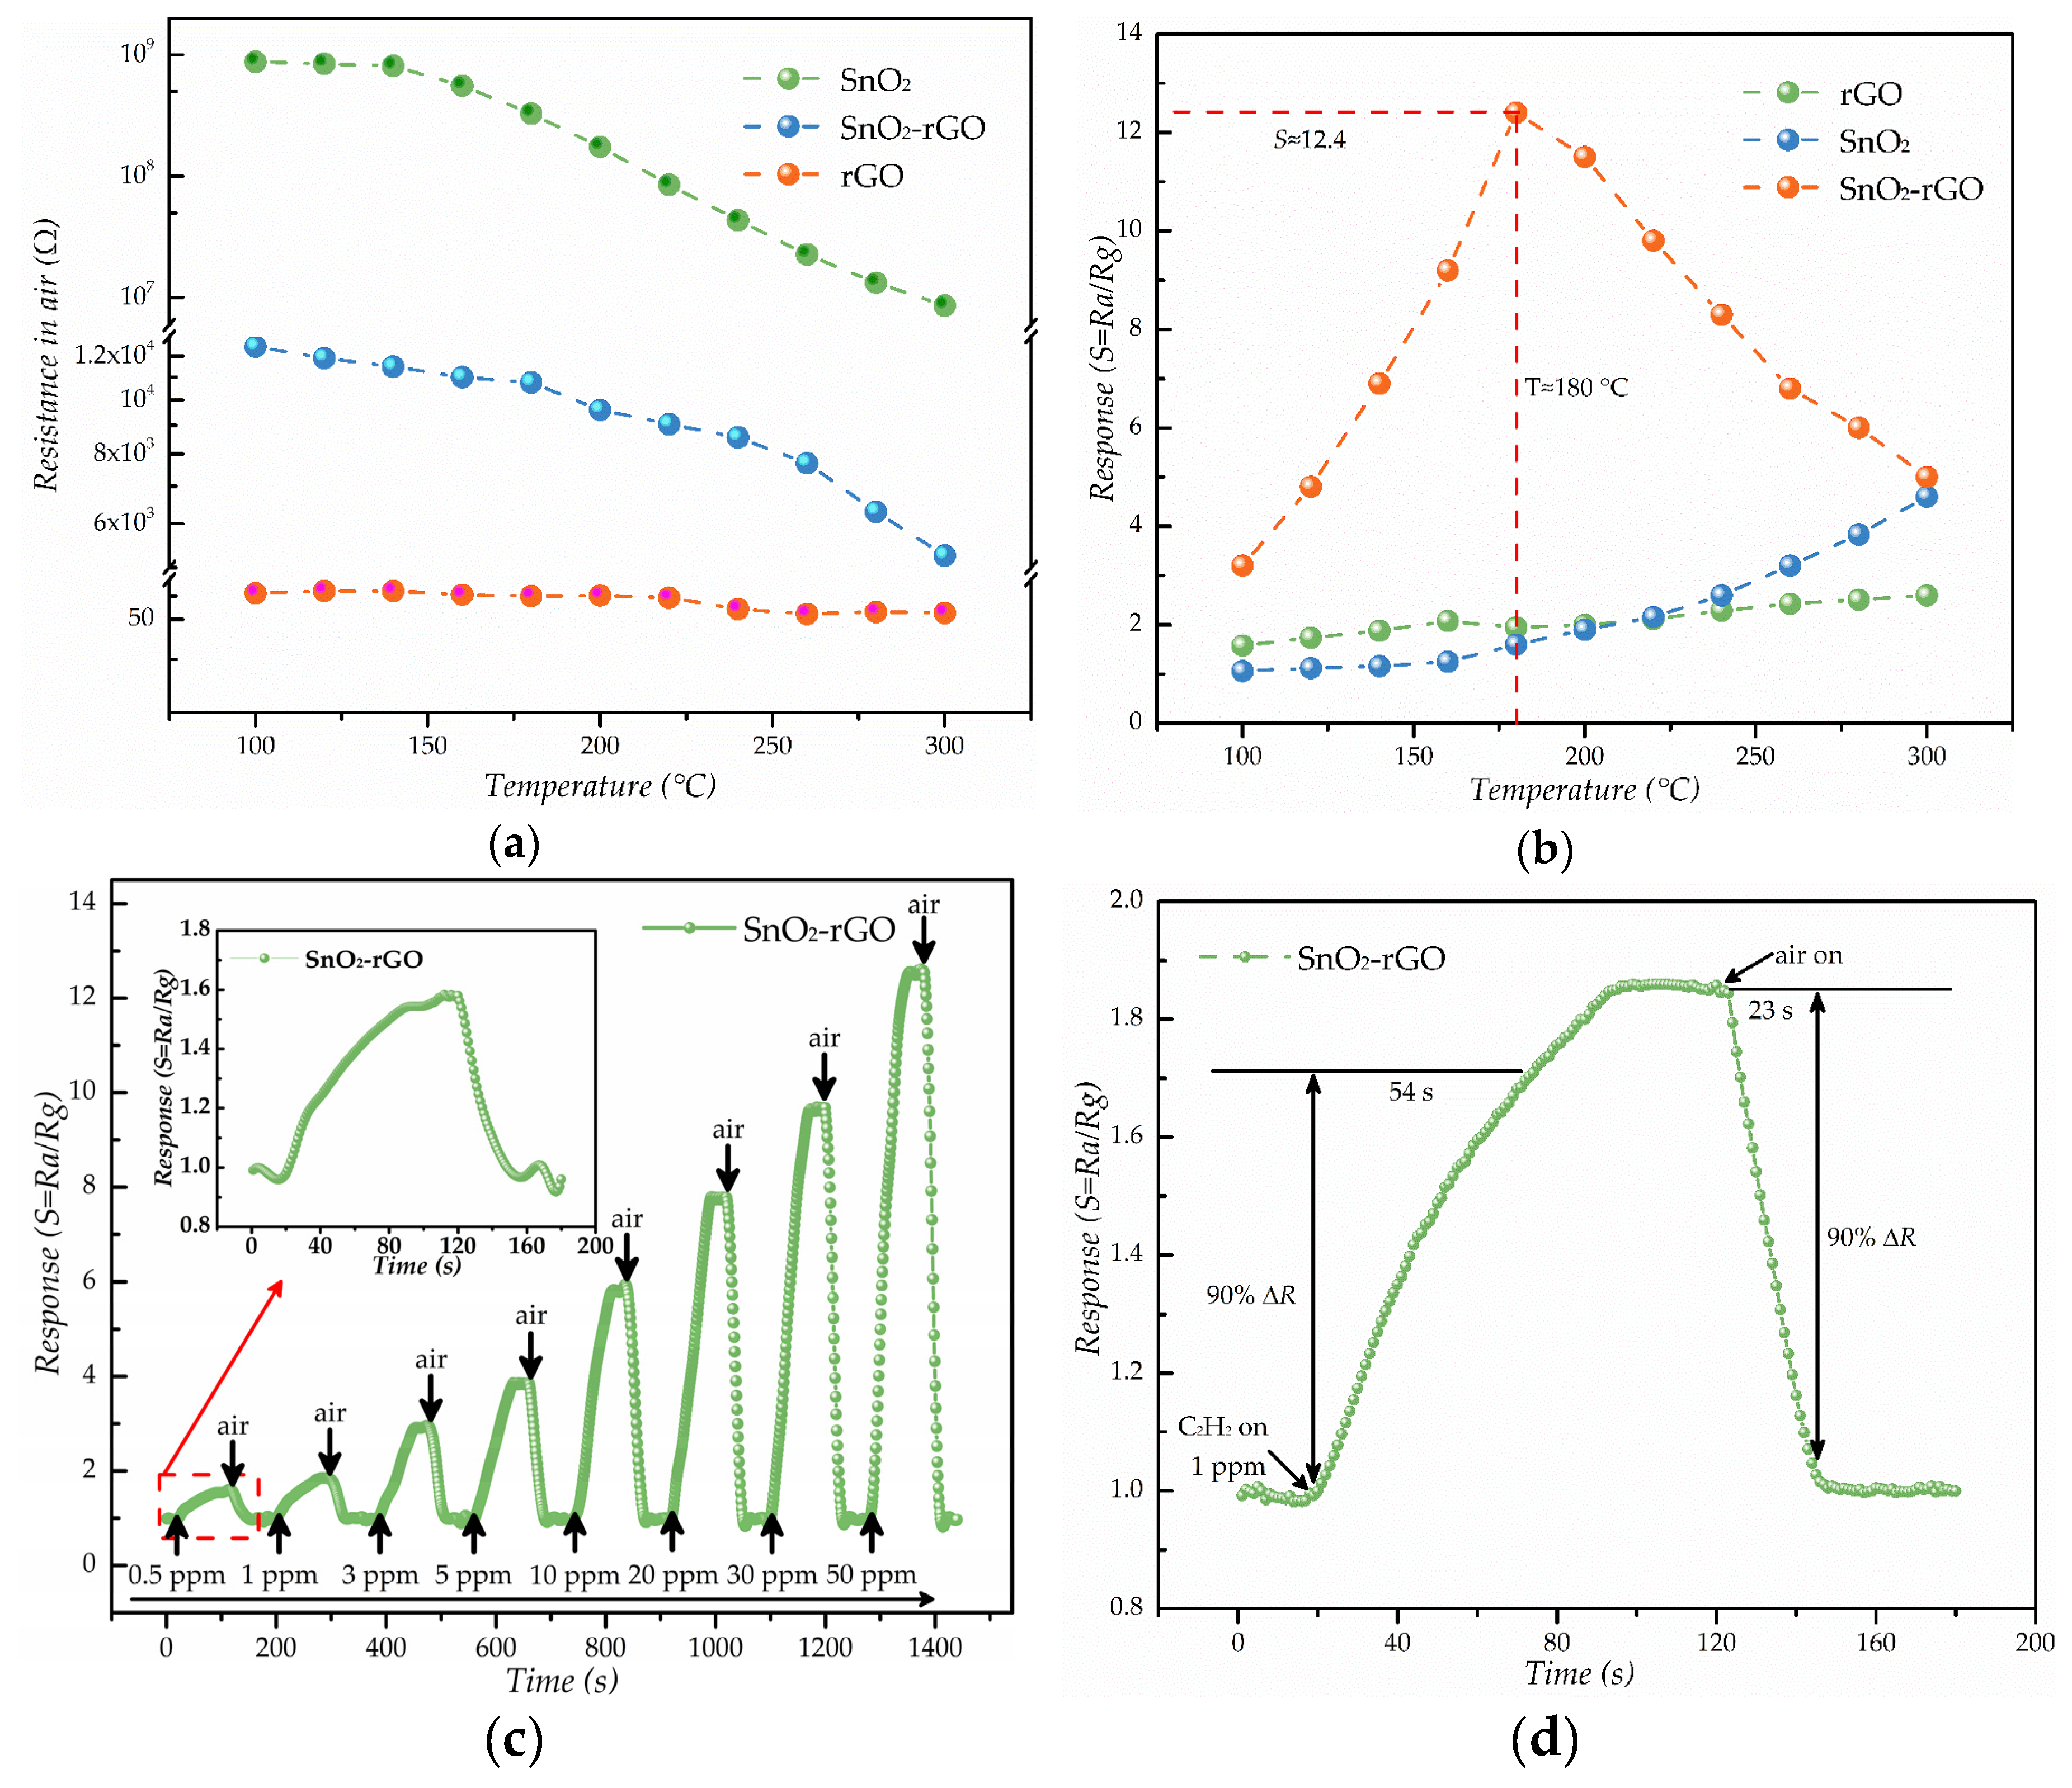
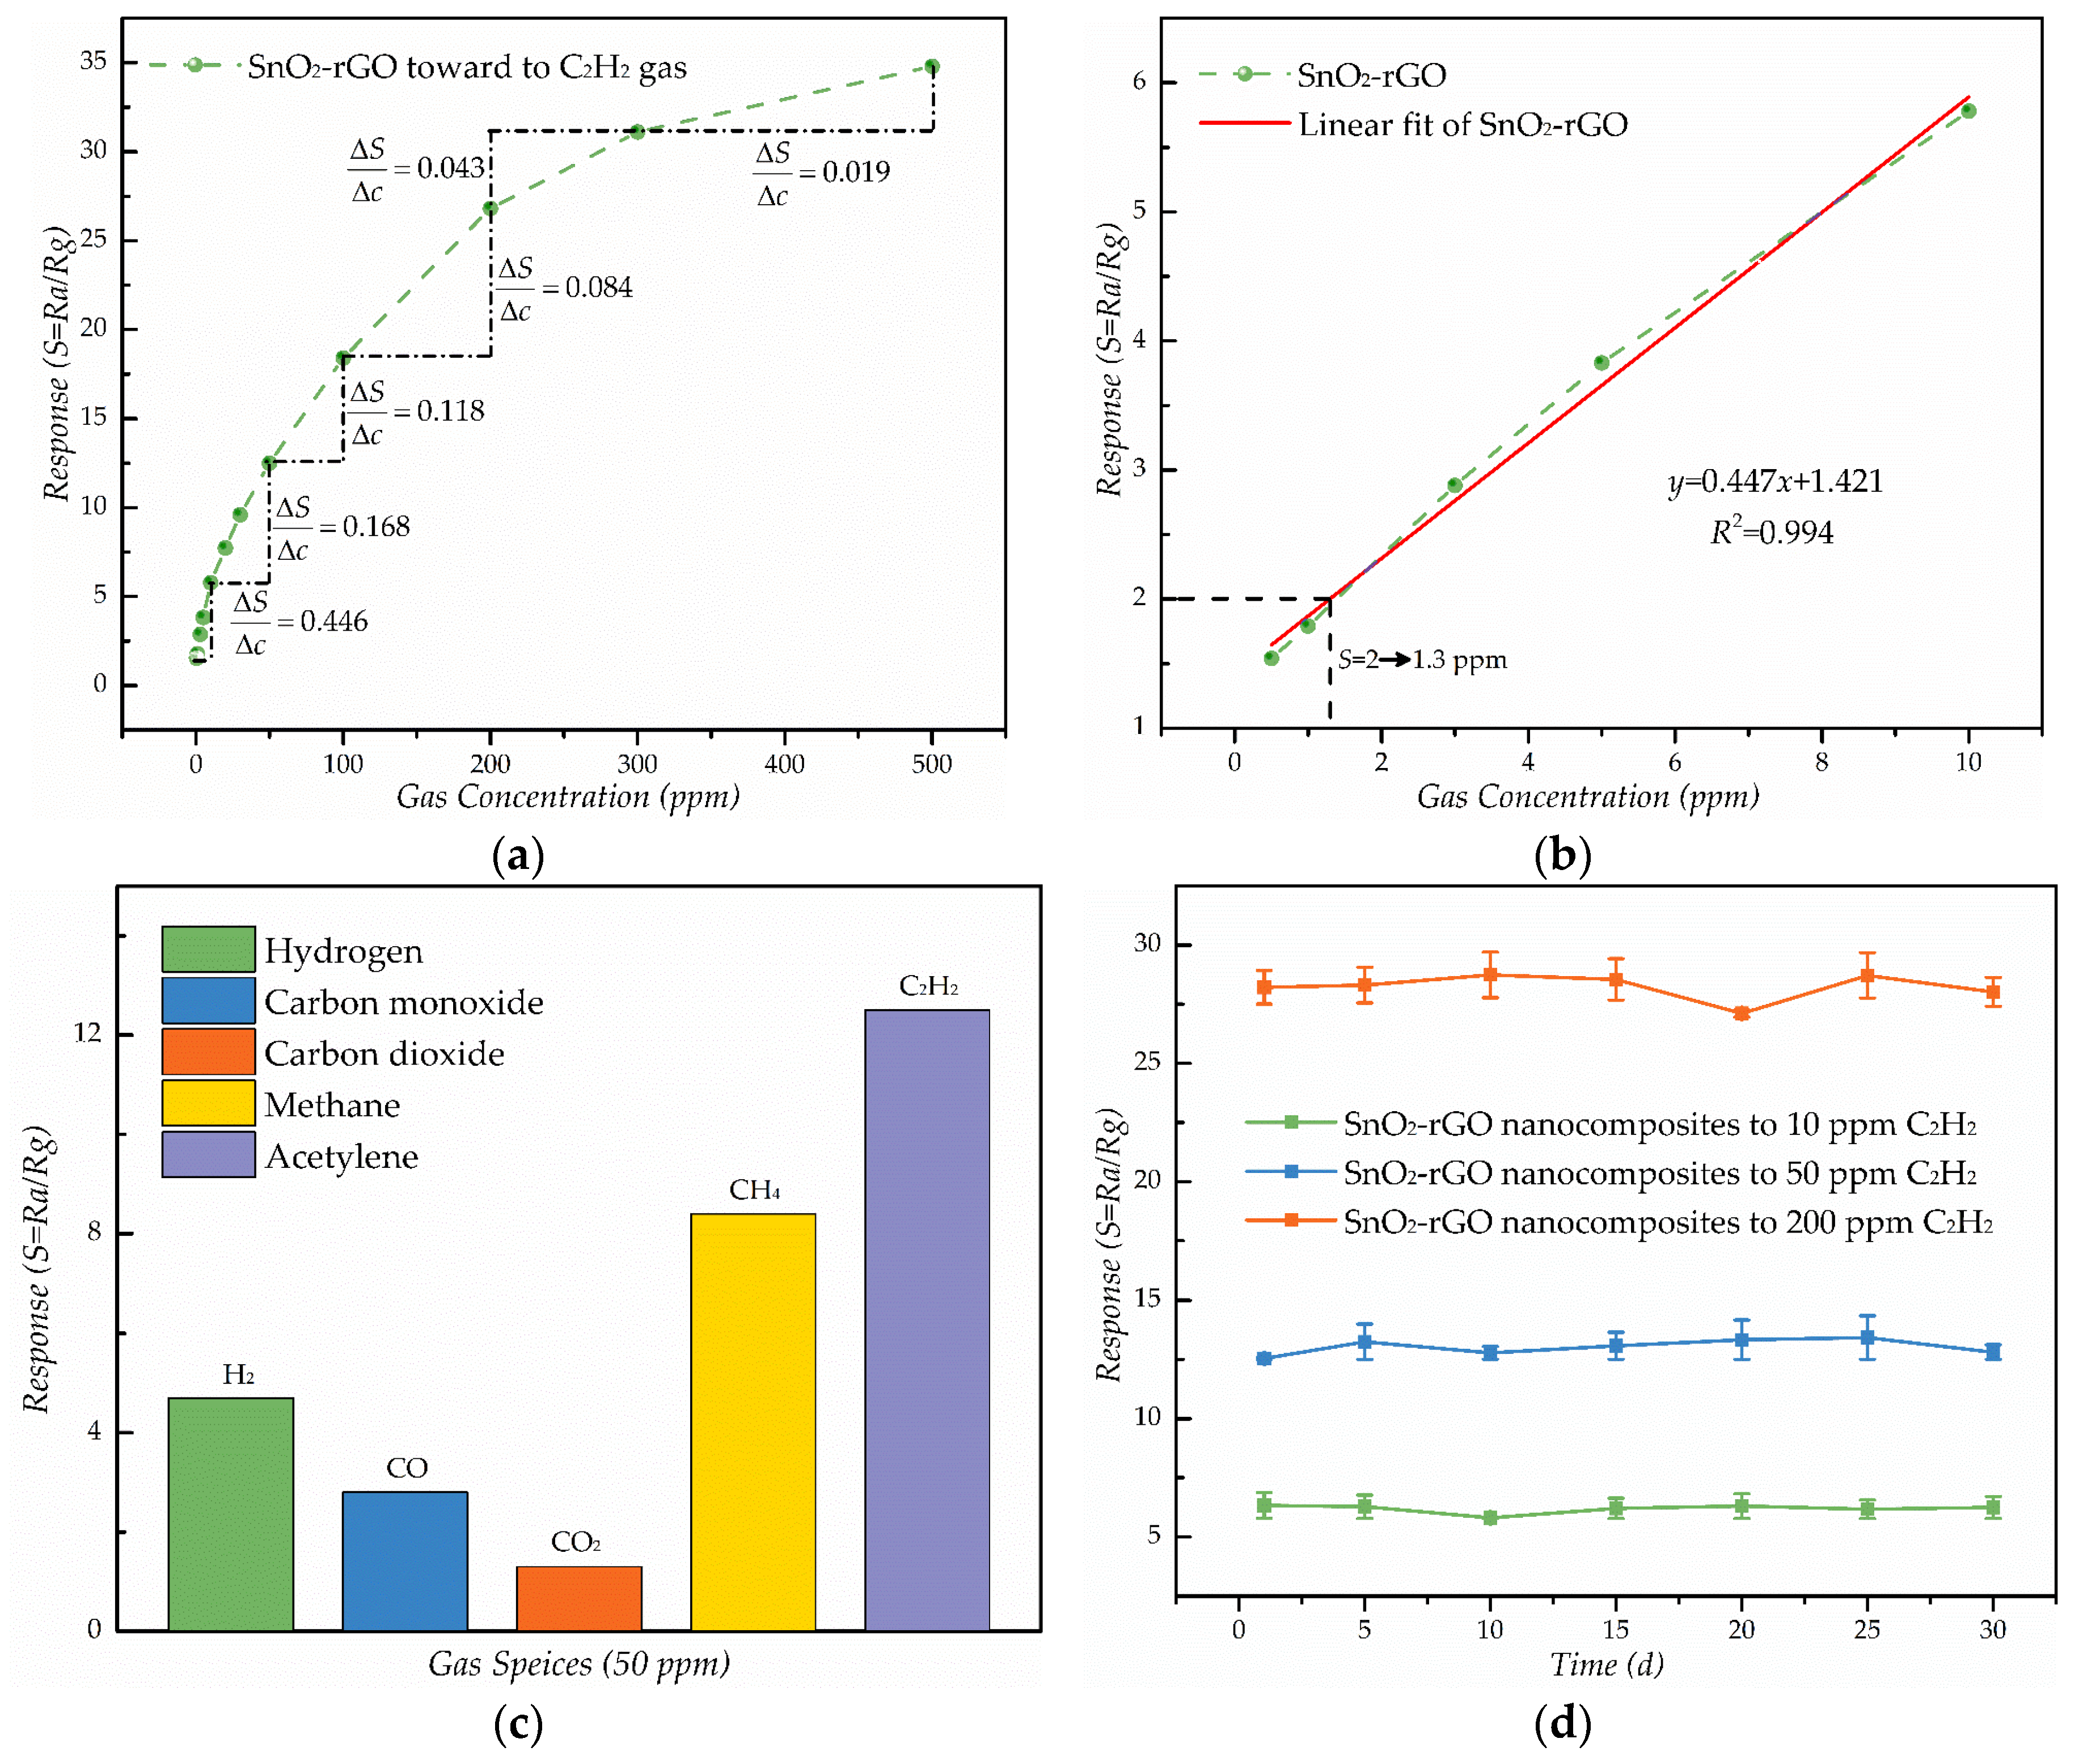
3.2. C2H2 Gas Sensing Properties

C2H2 gas is one of the main fault characteristic gases dissolved in power transformer oil, which can indicate the transformer discharge faults effectively. Thus, we carried out the gas sensing properties of the fabricated gas sensors for C2H2 gas. Figure 6a shows the resistance curve (resistance of the sensor in the air versus temperature) of rGO, SnO2 and SnO2–rGO gas sensors. Then the operating temperatures of rGO, SnO2 and SnO2–rGO gas sensors were investigated at a temperature range of 100 °C to 300 °C, with an interval of 20 °C. Figure 6b shows the relationship between response and temperature for those gas sensors to 50 ppm C2H2 gas. It is obvious that the responses of rGO–SnO2 first ascended and then descended with the temperature increasing, while those of rGO and SnO2 increased slowly in the temperature range of measurement. Although the reduced graphene oxide gas sensor shows a good response to gases at room temperature [31], the SnO2 gas sensor usually works at high temperatures (about 360 °C) [32]. This behavior might be attributed to the potential barrier formed by the chemisorbed oxygen ions (On(ads)) on the SnO2 surface, which prevents the C2H2 molecules from reacting at low temperature. The SnO2 gas sensor at low temperature possibly underwent a small chemical activation (the adsorption–desorption kinetics of test gas on the sensing materials), and showed a small response. At high temperatures, due to the enhanced chemical activation, the adsorbed gas molecules may escape before their reaction, leading to a response drop. Due the presence of SnO2 in the SnO2–rGO nanocomposite, the optimum operating temperature is between that of rGO and SnO2. The operating temperature when the response of SnO2–rGO reached the maximum value about 12.4 was 180 °C, which is called the optimum operating temperature and proved that the introduction of rGO was beneficial to reducing the optimum operating temperatures for the SnO2-based gas sensor.
Figure 6c shows the response-recovery curve of SnO2-rGO to different concentrations of C2H2 gas from 0.5 ppm to 50 ppm at its optimum operating temperature (180 °C). When SnO2–rGO gas sensor was exposed to the C2H2 gas, its response clearly increased. In contrast, the response of SnO2–rGO gas sensor was decreased backed to the initial state after air was delivered into the chamber. To further study the response-recovery performance, the dynamic sensing transient of SnO2–rGO sensor to 1 ppm C2H2 gas was shown in Figure 6d. By definition, the response and recovery times of SnO2–rGO were estimated to be around 54 s and 23 s, respectively.
The response curve of SnO2–rGO gas sensor to various concentrations (from 0.5 ppm to 500 ppm) of C2H2 gas at optimum operating temperatures of 180 °C was plotted in Figure 7a. The response of sensor increased steeply from 0.5 ppm to 10 ppm and then increased slowly from 10 ppm to 500 ppm. Sensitivity is one of the most important parameters, which measures the variation of the response as a function of the variation of the concentration (c). The figure of the sensitivity as shown in Figure 7a can be calculated as the derivative of the response curve of SnO2–rGO. Moreover, Figure 7b shows that response versus concentration maintained good linearity when the gas concentration was below 10 ppm, with R2 = 0.994, and the equation for the response y and concentration x can be depicted as:
y = 0.447x + 1.421
In this case, we defined that the limit of detection is the lowest concentration when the response reached 2. Thus, it can be calculated that when sensing response (y) goes to 2 the concentration (x) goes to 1.3 ppm.
Generally, a chemical sensor may be sensitive not only to its intended chemical for measurement, but also to a number of chemicals that can equally be present in the environment, so selectivity is another important property of gas sensors. The figure of the selectivity can be calculated using Equation (13) presented in [33]. The response of SnO2–rGO gas sensors to 50 ppm different gases (hydrogen, carbon monoxide, carbon dioxide, methane and acetylene) at 180 °C are described in Figure 7c. The highest response is observed for C2H2 sensing performance, which is almost 2.7, 4.5, 9.6 and 1.5 times higher than for H2, CO, CO2 and CH4, respectively. All those results reveal that the SnO2–rGO sensor can be used for C2H2 detection. Better response to C2H2 might be attributed to higher reactivity and smaller bond energy of H-C≡C-H (490 kJ/mol) compared with other test gases. Although the bond energy of CH4 (431 kJ/mol) and H2 (436 kJ/mol) is close to C2H2, interaction strength between the sensing layer and target gas is an effective factor on the sensor response [34]. In the case of the SnO2–rGO gas sensor, H2 and CO may decompose easily at about 200 °C, where the exothermic reactions become impulsive, hence showing higher response [35]. The fabricated sensor did not show a remarkable response toward CO2 due to insufficient interaction strength between sensing layer and exposed gas [36]. Moreover, based on the molecular frontier orbital theory, we calculated the highest occupied molecular (HOMO) and lowest unoccupied molecular (LUMO) values of hydrocarbon gases and conducted response testing of SnO2. The results showed that the ability of losing electron weakens in the following order: C2H4, C2H2, C2H6 and CH4, which is in strong agreement with our experimental data [32]. Generally, sensor selectivity is a complicated problems associated with the intricate film nanostructure and complicated sensing mechanisms. Sensor selectivity may need further investigation with respect to critical applications [37]. Furthermore, the stability of SnO2–rGO sensor upon exposure to 10 ppm, 50 ppm and 200 ppm C2H2 gas was investigated. The measurements lasted for 30 days and responses were tested every 5 days. As shown in Figure 7d, the responses to 10 ppm, 50 ppm and 100 ppm C2H2 gas were kept at an almost constant level. These observed results demonstrate that the proposed sensor has good long-term stability. Lastly, the comparison of the C2H2 gas sensing properties of the SnO2/rGO gas sensor with previously reported results in C2H2 gas sensors using other nanomaterials are shown in Table 1.

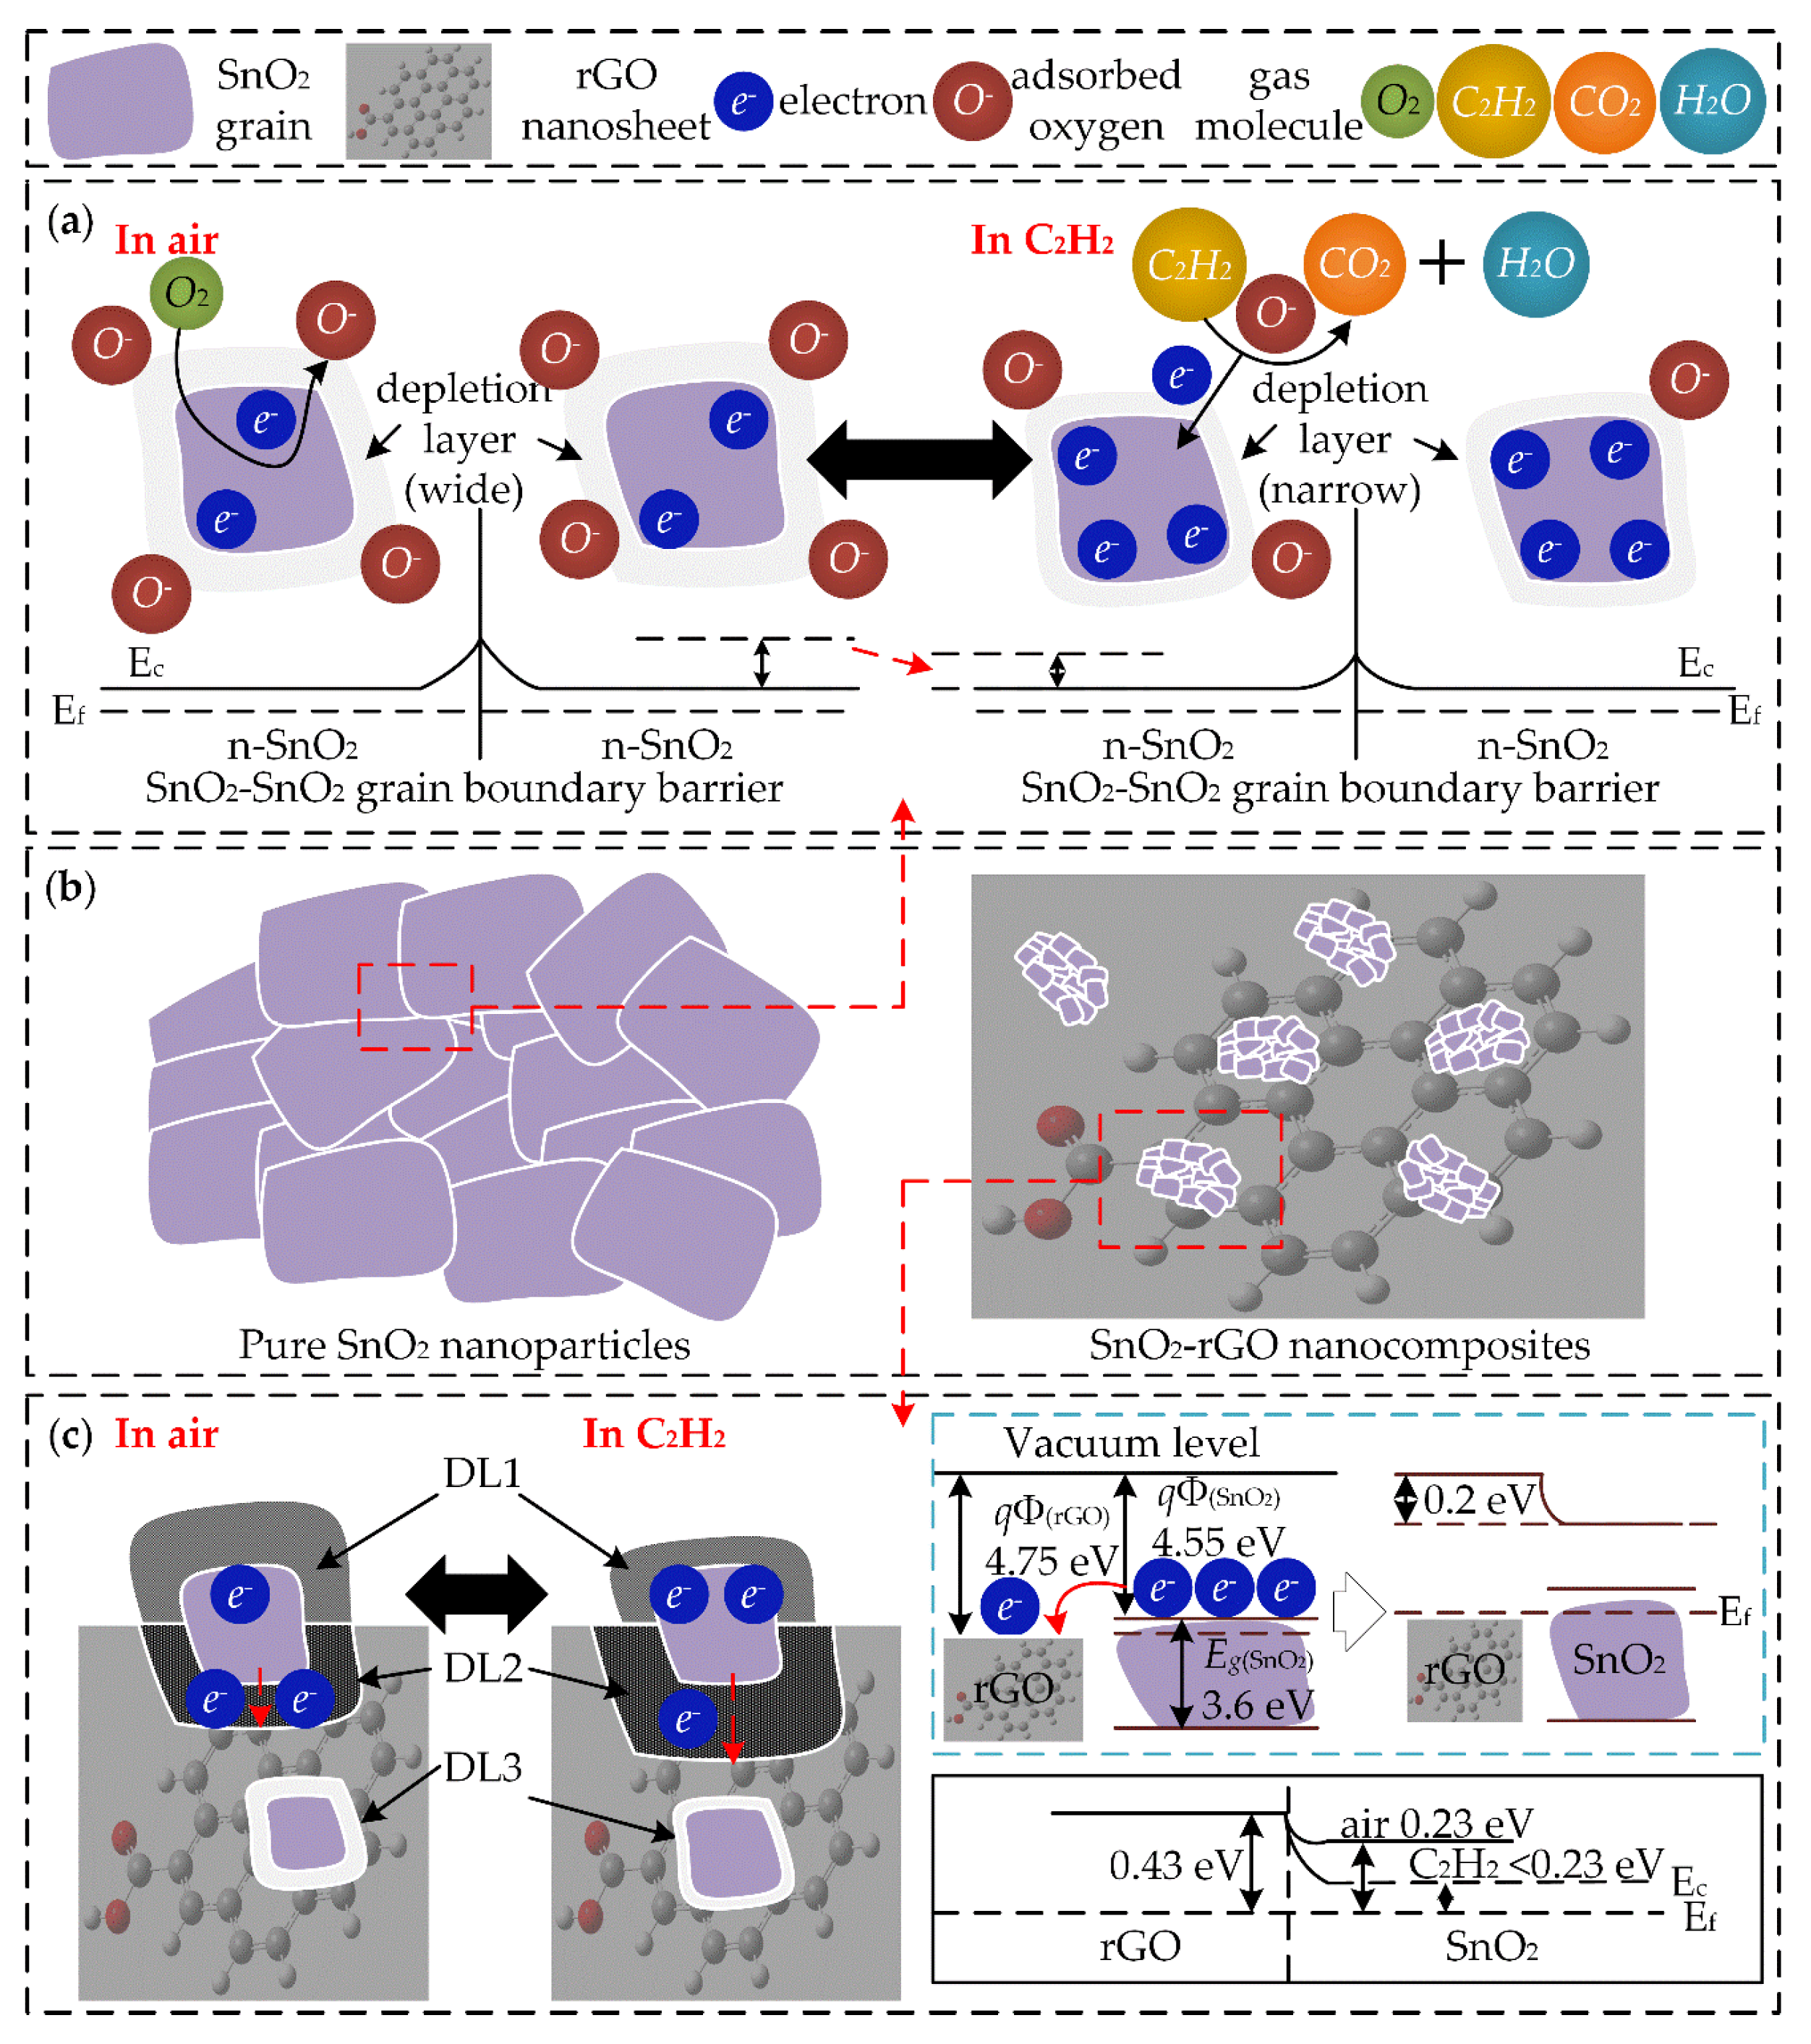
3.3. Gas Sensing Mechanism

According to our experimental results, SnO2–rGO nanocomposites have excellent performance with respect to detection of C2H2, which shows potential for application. The possible sensing mechanism is discussed as follows. Commonly, the sensing mechanism of MO gas sensors is explained by the adsorption–desorption model, the resistance changes of the MOs through the interaction between adsorbed oxygen ions (O2−, O or O2) and target gas molecules. As we know, rGO nanosheets prepared by chemical or thermal treatment will show a p-type semiconductor characteristic [42]. Thus, the heterojunctions (n-n or n-p) can be formed when rGO is composited with MOs. This will affect the gas sensing performance by impacting on the resistances change of the nanocomposites. In order to explain the gas sensing mechanism in SnO2–rGO nanocomposites as thoroughly as possible, several possible mechanisms will be considered, as follows.
Firstly, the nanostructure of as-synthesized SnO2 grains are composed of nanoparticles, as shown in Figure 8b. The adsorption–desorption model and boundary barrier model are described in Figure 8a. As the SnO2 works as a n-type semiconductor characteristic, when the SnO2 grain is exposed to the air, the O2 molecules in air will adsorbed on the surface of the SnO2 grain to form the adsorbed oxygen ions (O2−, O or O2). As the electrons on the surface of SnO2 are captured by O2 molecules, a wide electron depletion layer (DL) is formed. When the SnO2 which contains adsorbed oxygen ions comes into contact with reducing gases, the trapped electrons will release back to the surface of SnO2 and the width of the DL will be reduced. For example, the possible interaction of C2H2 has been proposed in the reference [41] as follows:
O2 + 2e ↔ 2O(ads)
C2H2 + O(ads) → CO2 + H2O + e
Meanwhile, the electron transfer between different SnO2 nanoparticles is an important factor for gas sensing behavior. If the electron in the nanoparticle is to transfer to another, the boundary barrier which is formed by space charge must be overcome. The contact resistance in the interface will affect the resistance of the gas sensor. When the SnO2 is in the air, the electron on the surface of SnO2 will be trapped and the boundary is raised. In contrast, in the reducing gases the electron is released back to the surface and the barrier is lowered. The increase or decrease of the width of the DL and boundary barrier according to the interaction between adsorbed oxygen ions make an important contribution to the sensing performance of SnO2.
Secondly, for SnO2–rGO nanocomposites possessing n-type character, electrons acted as electron carriers. The structure of SnO2–rGO is shown in Figure 8b and the mechanism is investigated in Figure 8c. When it is exposed to air, three types of electron DL may be formed, as shown in Figure 8c. DL1 is the first electron depletion layer, which is formed on the surface of SnO2 nanoparticles owing to the adsorbed oxygen ions [43]; DL2 is the second electron depletion layer, which is formed by the electrons and transfers from the surface of SnO2 to the rGO during the formation of p-n heterojunctions; and DL3 is the third electron depletion layer. It appears in the area where SnO2 is embed in rGO nanosheets and forms the p-n heterojunctions [18]. All these electron depletion layers will prevent the migration of electron, leading to the high-resistance state of the nanocomposites. When the reducing gas is introduced, the width of these three types DLs will undergo different changes. The trapped electrons in the DL1 will be released back to the SnO2, decreasing the width of the DL1; generally, that of DL2 is supposed to be decreased because the reducing gas molecules may be adsorbed on the surface of rGO and donate the electrons to it. However, the work functions of SnO2 and rGO are 4.55 eV and 4.75 eV, respectively. Because the work function of SnO2 is smaller than that of rGO, the electrons in SnO2 will transfer to rGO to equate the Fermi level and form a barrier (0.2 eV), as shown in Figure 8c. While the reducing gas is introduced, the value of (EC-EF) in SnO2 will decrease the barrier for electron transfer from SnO2 to rGO. As a result, the number of electrons in SnO2 will be sufficient, leading to a smaller resistance of SnO2 and a broadened width of DL2. Through the relative resistance change of SnO2 is much larger than that of rGO, the width of DL3 in p-n heterojunctions is reduced. The specific nanostructure of SnO2-rGO nanocomposites which could cause the different types of electron depletion layers has made great contribution to the change of resistance.
Thirdly, the formation of p-n heterojunctions between SnO2 and rGO can help to enhance the gas sensing properties, and includes many other factors. As the rGO is obtained by chemical or thermal treatment of graphene oxide, there may be many oxygen functional groups on the surface of rGO, such as hydroxyl (-OH) and carboxyl (-COOH) which will provide more adsorption sites for the formation of adsorbed oxygen ions and target gas molecules [44,45]. Besides, the introduction of rGO can effectively prevent the aggregation of SnO2 nanoparticles, because there are many overlaps among the SnO2 nanoparticles that must be generated, reducing the exposed active surface [18]. Due to these factors, the resistance variation shows a larger change when compared to individual SnO2 or rGO.
According to the proposed possible mechanisms, we conclude that the SnO2-rGO gas sensing mechanism combines with the effect of the adsorbed oxygen ions and grain boundary barrier of SnO2, the structural characteristics of rGO and the formation of local p-n heterojunctions between SnO2 and rGO. All these sources can be considered as the resistance modulation of the SnO2–rGO nanocomposites. We suggest that the combination of two sensing mechanisms, being related to rGO-SnO2 p-n heterojunctions and structural characteristics of rGO, is responsible for the enhancement of the gas sensing properties of rGO-loaded SnO2. Thus, we can safely conclude that this hybrid sensing mechanism, which combines the effects of high specific surface area and local p-n heterojunctions, is primarily responsible for the enhancement of the sensitivity. In comparison, the adsorbed oxygen ions (O2−, O or O2) and grain boundary barrier of SnO2 will make contributions to the enhancement of the gas sensing properties for most of metal oxide semiconductor-based gas sensor. However, the rGO-SnO2 p-n heterojunctions (change of electron depletion layer), oxygen functional groups and high specific surface area (greater number of adsorption sites) are special characteristics for rGO–SnO2 hybrid materials due to the due to the presence of rGO. Further investigations to study the exact sensing mechanism are needed.

4. Conclusions

This paper demonstrated a high performance C2H2 gas sensor based on a SnO2–rGO nanocomposite, which was synthesized via a facile two-step hydrothermal method. The as-prepared SnO2-rGO nanocomposites were characterized by XRD, Raman, TEM, EDS and XPS. The planar gas sensor was fabricated to investigate the gas sensing properties of C2H2 gas. The gas sensing properties of the as-fabricated planar gas sensor to C2H2 were tested using exposure to various concentrations of C2H2 gas at the optimum operating temperature (180 °C). The C2H2 gas sensor exhibited a good dynamic response (0.5–50 ppm), low limit of detection (1.3 ppm), high response (S = 12.4–50 ppm), fast response–recovery time (54 s, 23 s), good selectivity, long-term stability and maintained good linearity from 0.5 ppm to 10 ppm. Furthermore, the possible gas sensing mechanisms of the SnO2–rGO nanocomposites were summarized and discussed. Our work may contribute to the development of a ppm-level gas sensor for on-line monitoring of dissolved C2H2 gas in transformer oil.

Acknowledgments

This work was supported by the National 111 Project of the Ministry of Education of China (No. B08036) and the Funds for the Excellent Achievements Transformation of Chongqing Universities (No. KJZH17101).

Author Contributions

Lingfeng Jin and Weigen Chen conceived and designed the experiments; Lingfeng Jin and He Zhang performed the experiments; Gongwei Xiao and Chutian Yu analyzed the data; Lingfeng Jin wrote the paper. Lingfeng Jin, Weigen Chen and Qu Zhou reviewed and revised the manuscript. All authors read and approved the manuscript.

Conflicts of Interest

The authors declare no conflict of interest.

References

  1. Saha, T.K. Review of modern diagnostic techniques for assessing insulation condition in aged transformers. IEEE Trans. Dielectr. Electr. Insul. 2003, 10, 903–917. [Google Scholar] [CrossRef] [Green Version]
  2. Arshad, M.; Islam, S.M. Significance of cellulose power transformer condition assessment. IEEE Trans. Dielectr. Electr. Insul. 2011, 18, 1591–1598. [Google Scholar] [CrossRef]
  3. Duval, M. A review of faults detectable by gas-in-oil analysis in transformers. IEEE Electr. Insul. Mag. 2002, 18, 8–17. [Google Scholar] [CrossRef]
  4. Wang, M.; Vandermaar, A.J.; Srivastava, K.D. Review of condition assessment of power transformers in service. IEEE Electr. Insul. Mag. 2002, 18, 12–25. [Google Scholar] [CrossRef]
  5. Bengtsson, C. Status and trends in transformer monitoring. IEEE Trans. Power Deliv. 1996, 11, 1379–1384. [Google Scholar] [CrossRef]
  6. Mor, G.K.; Carvalho, M.A.; Varghese, O.K.; Pishko, M.V.; Grimes, C.A. A room-temperature TiO2-nanotube hydrogen sensor able to self-clean photoactively from environmental contamination. J. Mater. Res. 2004, 19, 628–634. [Google Scholar] [CrossRef]
  7. Wang, L.W.; Kang, Y.F.; Liu, X.H.; Zhang, S.M.; Huang, W.P.; Wang, S.R. ZnO nanorod gas sensor for ethanol detection. Sens. Actuators B-Chem. 2012, 162, 237–243. [Google Scholar] [CrossRef]
  8. Batzill, M.; Diebold, U. The surface and materials science of tin oxide. Progress Surf. Sci. 2005, 79, 47–154. [Google Scholar] [CrossRef]
  9. Myung, N.V.; Mubeen, S.; Mulchandani, A.; Deshusses, M.A. Metal and Metal Oxide Co-Functionalized Single-Walled Carbon Nanotubes for High Performance Gas Sensors. US Patent 15/090,281, 4 April 2016. [Google Scholar]
  10. Cui, Y.; Wei, Q.Q.; Park, H.K.; Lieber, C.M. Nanowire nanosensors for highly sensitive and selective detection of biological and chemical species. Science 2001, 293, 1289–1292. [Google Scholar] [CrossRef] [PubMed]
  11. Wang, C.X.; Yin, L.W.; Zhang, L.Y.; Xiang, D.; Gao, R. Metal oxide gas sensors: Sensitivity and influencing factors. Sensors 2010, 10, 2088–2106. [Google Scholar] [CrossRef] [PubMed]
  12. Gurlo, A. Nanosensors: Towards morphological control of gas sensing activity. SnO2, In2O3, ZnO and WO3 case studies. Nanoscale 2011, 3, 154–165. [Google Scholar] [CrossRef] [PubMed]
  13. Yamazoe, N. New approaches for improving semiconductor gas sensors. Sens. Actuators B-Chem. 1991, 5, 7–19. [Google Scholar] [CrossRef]
  14. Schedin, F.; Geim, A.K.; Morozov, S.V.; Hill, E.W.; Blake, P.; Katsnelson, M.I.; Novoselov, K.S. Detection of individual gas molecules adsorbed on graphene. Nat. Mater. 2007, 6, 652–655. [Google Scholar] [CrossRef] [PubMed] [Green Version]
  15. Yuan, W.J.; Shi, G.Q. Graphene-based gas sensors. J. Mater. Chem. A 2013, 1, 10078–10091. [Google Scholar] [CrossRef]
  16. Zhang, D.Z.; Chang, H.Y.; Li, P.; Liu, R.H. Characterization of nickel oxide decorated-reduced graphene oxide nanocomposite and its sensing properties toward methane gas detection. J. Mater. Sci.-Mater. Electron. 2016, 27, 3723–3730. [Google Scholar] [CrossRef]
  17. Abideen, Z.U.; Katoch, A.; Kim, J.H.; Kwon, Y.J.; Kim, H.W.; Kim, S.S. Excellent gas detection of zno nanofibers by loading with reduced graphene oxide nanosheets. Sens. Actuators B-Chem. 2015, 221, 1499–1507. [Google Scholar] [CrossRef]
  18. Xu, S.P.; Sun, F.Q.; Pan, Z.Z.; Huang, C.W.; Yang, S.M.; Long, J.F.; Chen, Y. Reduced graphene oxide-based ordered macroporous films on a curved surface: General fabrication and application in gas sensors. ACS Appl. Mater. Interfaces 2016, 8, 3428–3437. [Google Scholar] [CrossRef] [PubMed]
  19. Li, X.; Zhao, Y.; Wang, X.; Wang, J.; Gaskov, A.M.; Akbar, S. Reduced graphene oxide (rGO) decorated TiO2 microspheres for selective room-temperature gas sensors. Sens. Actuators B Chem. 2016, 230, 330–336. [Google Scholar] [CrossRef]
  20. Latif, U.; Dickert, F.L. Graphene hybrid materials in gas sensing applications. Sensors 2015, 15, 30504–30524. [Google Scholar] [CrossRef] [PubMed]
  21. Jin, L.F.; Chen, W.G.; Peng, S.Y.; Zhou, Q. Study on gas sensing properties and mechanism of Ag-doped SnO2 gas sensor to H2. In Proceedings of the 2015 IEEE Electrical Insulation Conference (EIC), Seattle, WA, USA, 7–10 June 2015; pp. 407–410.
  22. Li, L.; Yang, H.; Zhao, H.; Yu, J.; Ma, J.; An, L.; Wang, X. Hydrothermal synthesis and gas sensing properties of single-crystalline ultralong ZnO nanowires. Appl. Phys. A 2010, 98, 635–641. [Google Scholar] [CrossRef]
  23. Qi, Q.; Zhang, T.; Yu, Q.; Wang, R.; Zeng, Y.; Liu, L.; Yang, H. Properties of humidity sensing ZnO nanorods-base sensor fabricated by screen-printing. Sens. Actuators B Chem. 2008, 133, 638–643. [Google Scholar] [CrossRef]
  24. Vincenzi, D.; Butturi, M.; Guidi, V.; Carotta, M.; Martinelli, G.; Guarnieri, V.; Brida, S.; Margesin, B.; Giacomozzi, F.; Zen, M. Development of a low-power thick-film gas sensor deposited by screen-printing technique onto a micromachined hotplate. Sens. Actuators B Chem. 2001, 77, 95–99. [Google Scholar] [CrossRef]
  25. Ehsani, M.; Hamidon, M.N.; Toudeshki, A.; Abadi, M.S.; Rezaeian, S. CO2 gas sensing properties of screen-printed La2O3/SnO2 thick film. IEEE Sens. J. 2016, 16, 6839–6845. [Google Scholar] [CrossRef]
  26. DiGiulio, M.; Micocci, G.; Serra, A.; Tepore, A.; Rella, R.; Siciliano, R. Characteristics of reactively sputtered Pt-SnO2 thin films for CO gas sensors. J. Vac. Sci. Technol. a-Vac. Surf. Films 1996, 14, 2215–2219. [Google Scholar] [CrossRef]
  27. Zhang, D.Z.; Liu, J.J.; Chang, H.Y.; Liu, A.M.; Xia, B.K. Characterization of a hybrid composite of SnO2 nanocrystal-decorated reduced graphene oxide for ppm-level ethanol gas sensing application. RSC Adv. 2015, 5, 18666–18672. [Google Scholar] [CrossRef]
  28. Dieguez, A.; Romano-Rodriguez, A.; Vila, A.; Morante, J.R. The complete Raman spectrum of nanometric SnO2 particles. J. Appl. Phys. 2001, 90, 1550–1557. [Google Scholar] [CrossRef]
  29. Zhang, H.; Feng, J.C.; Fei, T.; Liu, S.; Zhang, T. SnO2 nanoparticles-reduced graphene oxide nanocomposites for NO2 sensing at low operating temperature. Sens. Actuators B-Chem. 2014, 190, 472–478. [Google Scholar] [CrossRef]
  30. Li, W.Q.; Ma, S.Y.; Li, Y.F.; Yang, G.J.; Mao, Y.Z.; Luo, J.; Gengzang, D.J.; Xu, X.L.; Yan, S.H. Enhanced ethanol sensing performance of hollow ZnO-SnO2 core-shell nanofibers. Sens. Actuators B-Chem. 2015, 211, 392–402. [Google Scholar] [CrossRef]
  31. Lu, G.; Ocola, L.E.; Chen, J. Reduced graphene oxide for room-temperature gas sensors. Nanotechnology 2009, 20. [Google Scholar] [CrossRef] [PubMed]
  32. Chen, W.; Zhou, Q.; Gao, T.; Su, X.; Wan, F. Pd-doped SnO2-based sensor detecting characteristic fault hydrocarbon gases in transformer oil. J. Nanomater. 2013, 2013. [Google Scholar] [CrossRef]
  33. D’Amico, A.; Di Natale, C.; Sarro, P.M. Ingredients for sensors science. Sens. Actuators B Chem. 2015, 207, 1060–1068. [Google Scholar] [CrossRef]
  34. Gurav, K.; Deshmukh, P.; Lokhande, C. LPG sensing properties of Pd-sensitized vertically aligned zno nanorods. Sens. Actuators B Chem. 2011, 151, 365–369. [Google Scholar] [CrossRef]
  35. Uddin, A.I.; Lee, K.-W.; Chung, G.-S. Acetylene gas sensing properties of an Ag-loaded hierarchical zno nanostructure-decorated reduced graphene oxide hybrid. Sens. Actuators B Chem. 2015, 216, 33–40. [Google Scholar] [CrossRef]
  36. Hosseini, Z.S.; Mortezaali, A. Room temperature H2S gas sensor based on rather aligned ZnO nanorods with flower-like structures. Sens. Actuators B Chem. 2015, 207, 865–871. [Google Scholar] [CrossRef]
  37. Kim, H.-J.; Lee, J.-H. Highly sensitive and selective gas sensors using p-type oxide semiconductors: Overview. Sens. Actuators B Chem. 2014, 192, 607–627. [Google Scholar] [CrossRef]
  38. Liewhiran, C.; Tamaekong, N.; Wisitsoraat, A.; Phanichphant, S. Highly selective environmental sensors based on flame-spray-made SnO2 nanoparticles. Sens. Actuators B Chem. 2012, 163, 51–60. [Google Scholar] [CrossRef]
  39. Qi, Q.; Zhang, T.; Zheng, X.J.; Fan, H.T.; Liu, L.; Wang, R.; Zeng, Y. Electrical response of Sm2O3-doped SnO2 to C2H2 and effect of humidity interference. Sens. Actuators B-Chem. 2008, 134, 36–42. [Google Scholar] [CrossRef]
  40. Tarnaekong, N.; Liewhiran, C.; Wisitsoraat, A.; Phanichphant, S. Acetylene sensor based on Pt/ZnO thick films as prepared by flame spray pyrolysis. Sens. Actuators B Chem. 2011, 152, 155–161. [Google Scholar] [CrossRef]
  41. Uddin, A.; Chung, G.S. Synthesis of highly dispersed ZnO nanoparticles on graphene surface and their acetylene sensing properties. Sens. Actuators B-Chem. 2014, 205, 338–344. [Google Scholar] [CrossRef]
  42. Hotovy, I.; Huran, J.; Siciliano, P.; Capone, S.; Spiess, L.; Rehacek, V. Enhancement of H2 sensing properties of nio-based thin films with a pt surface modification. Sens. Actuators B Chem. 2004, 103, 300–311. [Google Scholar] [CrossRef]
  43. Singkammo, S.; Wisitsoraat, A.; Sriprachuabwong, C.; Tuantranont, A.; Phanichphant, S.; Liewhiran, C. Electrolytically exfoliated graphene-loaded flame-made ni-doped SnO2 composite film for acetone sensing. ACS Appl. Mater. Interfaces 2015, 7, 3077–3092. [Google Scholar] [CrossRef] [PubMed]
  44. Russo, P.A.; Donato, N.; Leonardi, S.G.; Baek, S.; Conte, D.E.; Neri, G.; Pinna, N. Room-temperature hydrogen sensing with heteronanostructures based on reduced graphene oxide and tin oxide. Angew. Chemie Int. Ed. 2012, 51, 11053–11057. [Google Scholar] [CrossRef] [PubMed]
  45. Lin, Q.Q.; Li, Y.; Yang, M.J. Tin oxide/graphene composite fabricated via a hydrothermal method for gas sensors working at room temperature. Sens. Actuators B-Chem. 2012, 173, 139–147. [Google Scholar] [CrossRef]
Figure 1. Schematic diagram of the SnO2–reduced graphene oxide (rGO) nanocomposite planar gas sensor.
Applsci 07 00019 g001
Figure 2. Real image and schematic diagram of the gas sensing analysis measurement system.
Applsci 07 00019 g002
Figure 3. (a) X-ray diffraction (XRD) patterns; (b) Raman spectra of rGO, SnO2 and SnO2–rGO samples; and (c) thermogravimetric analyses (TGA) results of SnO2–rGO nanocomposites.
Applsci 07 00019 g003
Figure 4. (a) Transmission electron microscopy (TEM) micrograph of rGO (the inset shows the HRTEM (high-resolution TEM) image of rGO); (b) Scanning electron microscopy (SEM) image of pristine SnO2 nanoparticles; (c) TEM image; and (d) HRTEM of SnO2–rGO nanocomposites; (e) selected area electron diffraction (SAED) pattern; and (f) the EDS (energy dispersive spectroscopy) spectrum of SnO2–rGO.
Applsci 07 00019 g004
Figure 5. XPS (X-ray photoelectron spectroscopy) spectra of (a) survey of SnO2–rGO; (b) Sn 3d region of SnO2–rGO; (c) C 1s region of SnO2–rGO; and (d) O 1s region of SnO2–rGO.
Applsci 07 00019 g005
Figure 6. Results of C2H2 gas sensing properties: (a) Resistance of the SnO2, rGO and SnO2–rGO gas sensors at different operating temperatures; (b) Response of the rGO, SnO2 and SnO2–rGO gas sensors to 50 ppm C2H2 gas at different operating temperatures; (c) Response under different gas concentrations from 0.5 ppm to 50 ppm for C2H2 of SnO2–rGO at 180 °C; (d) Dynamic sensing transient of SnO2–rGO sensor to 1 ppm C2H2 gas.
Applsci 07 00019 g006
Figure 7. (a) Corresponding response variations of the SnO2–rGO sensor as a function of C2H2 gas concentrations at 180 °C; (b) The limit of detection and the linear relationship between response and concentration; (c) Response of SnO2–rGO gas sensors to 50 ppm different gases (hydrogen, carbon monoxide, carbon dioxide, methane and acetylene) and (d) The stability of SnO2–rGO sensor with respect to 10, 50 and 200 ppm C2H2, respectively.
Applsci 07 00019 g007
Figure 8. (a) Schematic illustration of sensing mechanism of pure SnO2 nanoparticles; (b) structure of SnO2 nanoparticles and SnO2–rGO nanocomposites; and (c) schematic illustration of sensing mechanism of SnO2–rGO nanocomposites.
Applsci 07 00019 g008
Table 1. Comparison of previously reported and our work on C2H2 gas sensors.
Ref.MaterialTemperature (°C)Measuring Range (ppm)Response (S = Ra/Rg)τResponse (s)τRecovery (s)
[38]Pure SnO2300200–10,0006.3 (10,000 ppm)34>10 min
[39]Sm2O3/SnO21801–500063.8 (1000 ppm)317
[40]Pt/ZnO30050–10,00043 (1000 ppm)665
[41]ZnO/rGO 125030–100018.2 (100 ppm)10028
OurSnO2–rGO1800.5–50012.4 (50 ppm)5423
1 rGO: reduced graphene oxide.

