Article

Coordinated Volt/Var Control in Distribution Systems with Distributed Generations Based on Joint Active and Reactive Powers Dispatch

Center of Excellence for Power Systems Automation and Operation, Iran University of Science and Technology, Tehran 1311416846, Iran
*
Author to whom correspondence should be addressed.
Appl. Sci. 2016, 6(1), 4; https://doi.org/10.3390/app6010004
Submission received: 21 August 2015 / Revised: 30 November 2015 / Accepted: 7 December 2015 / Published: 4 January 2016

Abstract

:
One of the most significant control schemes in optimal operation of distribution networks is Volt/Var control (VVC). Owing to the radial structure of distribution systems and distribution lines with a small X/R ratio, the active power scheduling affects the VVC issue. A Distribution System Operator (DSO) procures its active and reactive power requirements from Distributed Generations (DGs) along with the wholesale electricity market. This paper proposes a new operational scheduling method based on a joint day-ahead active/reactive power market at the distribution level. To this end, based on the capability curve, a generic reactive power cost model for DGs is developed. The joint active/reactive power dispatch model presented in this paper motivates DGs to actively participate not only in the energy markets, but also in the VVC scheme through a competitive market. The proposed method which will be performed in an offline manner aims to optimally determine (i) the scheduled active and reactive power values of generation units; (ii) reactive power values of switched capacitor banks; and (iii) tap positions of transformers for the next day. The joint active/reactive power dispatch model for daily VVC is modeled in GAMS and solved with the DICOPT solver. Finally, the plausibility of the proposed scheduling framework is examined on a typical 22-bus distribution test network over a 24-h period.

1. Introduction

1.1. Background and Motivation

The Volt/Var control (VVC) is defined as the regulation of a voltage profile over the distribution feeders and optimum reactive power flows in the system [1,2]. The traditional VVC scheme was employed to find appropriate coordination between the on-load tap changer (OLTC), voltage regulators, and all of the switched shunt capacitors (Sh.Cs) in distribution networks.
Due to the increasing penetration of DGs, it appears reasonable to suppose that some ancillary services, such as reserve and reactive power support, could be provided by DGs in an efficient and economical manner [3,4,5]. Consequently, DGs could incorporate the VVC problem. At the present time, most of the DGs are generally operated at unity or at a fixed power factor for avoiding interference with the other Volt/Var regulation devices connected to distribution systems [5,6]. Since the distribution systems usually have a radial structure, which comprises the distribution lines with low X/R ratios, the active power of DGs has a significant effect on the VVC performance [7]. Generally, VVC in a distribution system can be implemented in a centralized or decentralized manner. Centralized offline control have been implemented to determine dispatching schedules for switched Sh.Cs, OLTC settings at substations and the active/reactive power of DGs for the day ahead, according to an optimization problem based on load demand forecasts [7,8,9,10,11,12], while research on decentralized real-time control have aimed to control the VVC devices based on real-time and local measurements [13,14,15].
Although, much research on the reactive power market in a restructured power system, at the wholesale level, has been performed [16,17,18,19], in few works the potential of expansion of a reactive power market at the distribution level with DGs has been reported [3,20,21]. Additionally, the reactive power capability of DG has not been considered in the previous research on the VVC problem. Therefore, by ever-increasing integration of DGs into the distribution networks, development of a market-based approach for active and reactive power scheduling in distribution systems with DGs is gaining more importance.

1.2. State of the Art

Recently, the concept of the VVC management has been explored from the technical, economic, and environmental perspectives, using either single or multi-objective optimization techniques. Zare et al. [22] have introduced a multi-objective θ-Smart Bacterial Foraging Algorithm for daily VVC problems of distribution systems in the presence of renewable energy resources and considering environmental and economic aspects. A fair remuneration for the reactive power offered by a dispatchable DG was developed in [23]. Then, a cost-based approach has been proposed for VVC in distribution networks based on the costs of reactive power provided by the main grid, DGs, and capacitor banks [23]. A competitive market integration model for DGs located at the distribution level in a pool-based wholesale market has been proposed in [24]. Siano et al. [25] have adopted combined particle swarm optimization and a market-based optimal power flow for optimal allocation of wind turbines in a distribution market environment. A multi-period energy procurement model for a distribution company (Disco) including DGs and interruptible loads in a day-ahead electricity market has been proposed in [26]. Mokryani et al. have presented a probabilistic method to assess the impact of wind turbine integration into distribution networks based on a market environment [27]. In the near future, due to high integration of resources into distribution systems, it will be necessary to schedule both active and reactive power at a distribution level. Sousa et al. [28] have proposed a new multi-objective methodology to manage the optimally-coupled active and reactive power scheduling in a smart distribution system in the presence of the DGs, electric vehicles, and capacitor banks. Samimi et al. [29] have presented a new economical/environmental operational scheduling method based on decoupled day-ahead active and reactive power markets at the distribution level. In the context of the smart grid, four power-demand scheduling scenarios are presented and analyzed in [30] to reduce the peak demand in a smart grid environment. Vardakas et al. [31] have provided a comprehensive review of different demand response (DR) schemes based on the incentives offered to the consumers in order to participate in the DR program.
So far, many studies have focused on the reactive power market and management in power systems. A reactive power market clearing method according to a multi-objective optimization has been presented in [32]. To alleviate market power, a zonal reactive power market has been proposed in [33]. According to the zonal reactive power market, Saraswat et al. [34] have presented a day-ahead reactive power market clearing mechanism based on a multi-objective optimization model. The management of the generator reactive power reserve is adopted as a preventive action for ensuring the voltage stability of the power system [35]. In [36], a coupled active and reactive power market considering joint active and reactive reserve market has been cleared to minimize the costs of simultaneous active and reactive power production, and the costs of energy not supplied. Martinez-Rojas et al. [37] have implemented a particle swarm optimization algorithm combined with a feasible solutions search for optimizing the reactive power dispatch in wind farms.

1.3. Innovative Contribution

In this paper, a new operational scheduling method based on a joint day-ahead energy and reactive power market at the distribution level is presented for the coordinated VVC issue. In line with this purpose, a modified reactive power bidding structure for DGs is developed. Disco buys active and reactive power from a wholesale market and sells them through the suggested market-based model. In the joint active and reactive market, similar to decoupled reactive power market, a DG will be paid for the lost opportunity cost (LOC) if its active power output in the joint market is less than that of the energy-only market. The presented joint active/reactive power market settlement model seeks to minimize the DSO’s total payments that comprise the offered energy cost of generation units and Disco, the reactive power payment function of DGs for their reactive power compensation, and the total payment for reactive power purchased by Disco from the wholesale market. Owing to the presence of control devices, such as DGs, OLTCs, and Sh.Cs, the proposed model for joint market settlement in distribution systems is a Mixed Integer Nonlinear Programming (MINLP) optimization problem. The suggested model is programmed with General Algebraic Modelling Systems (GAMS) and solved with the DICOPT solver.
The main innovative contributions of this paper are summarized as follows:
  • A modified reactive power cost model is introduced for DGs; and
  • A joint active/reactive power market in distribution systems is proposed.
The remainder of this paper is organized as follows:
Section 2 describes reactive power offers of a DG. Section 3, describes the decoupled day-ahead active power market. Proposed joint active/reactive power dispatch framework is introduced in Section 4. Simulation results are reported in Section 5 and, finally, conclusions of this paper are given in Section 6.

2. Reactive Power Offers of a DG

In this section, based on the capability curve of a DG, a generic reactive power cost framework is proposed for DGs. The generic reactive power cost model can be used for various types of DGs, including synchronous machine-based DGs (e.g., gas turbine) and renewable energy sources (RES)-based DGs (e.g., wind turbine or PV). The first type of DGs (dispatchable DGs) are directly connected to the distribution networks, while RES-based DGs are typically connected to the network by means of electronic power converters. The capability curve of a synchronous generator has been shown in Figure 1. This diagram demonstrates the relationship between generated active and reactive power by this generator.
Figure 1. Capability diagram of a synchronous generator.
Applsci 06 00004 g001
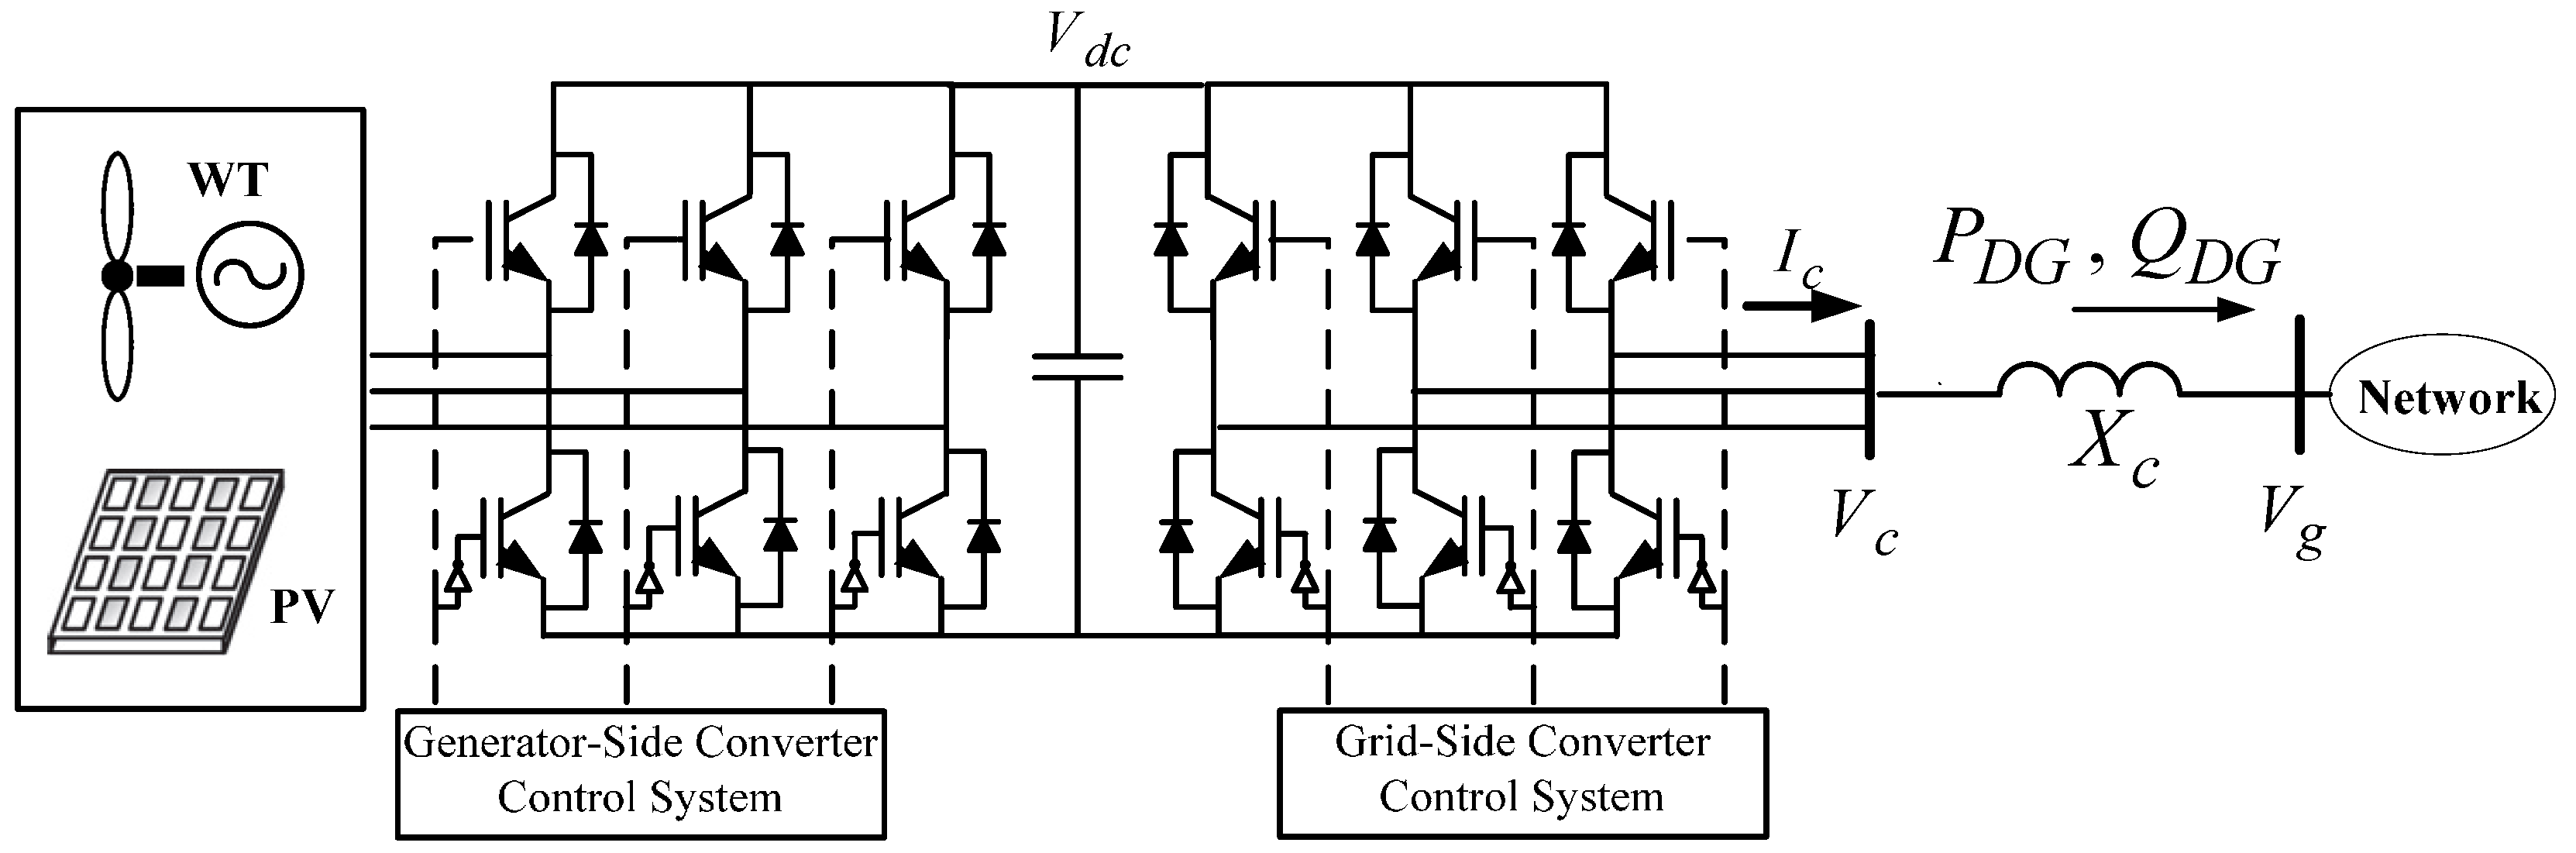
The structure of an inverter-based RES-DG has been shown in Figure 2. The reactance X c is the total reactance of the transformers and grid filters to connect the DG to the system. The converter output powers are restricted by the capability curves of the grid-side converter. The maximum available reactive power of a RES-DG is calculated as follows:
Q D G c a p = m i n   { Q D G c ,   Q D G v }
Q D G c = ( V g I c , m a x ) 2 ( P D G ) 2
Q D G v = ( V g V c , m a x X c ) 2 ( P D G ) 2 V g 2 X c
I c , m a x and V c , m a x are the maximum current output and maximum voltage output of the inverter, respectively. The values of V c , m a x and I c , m a x 
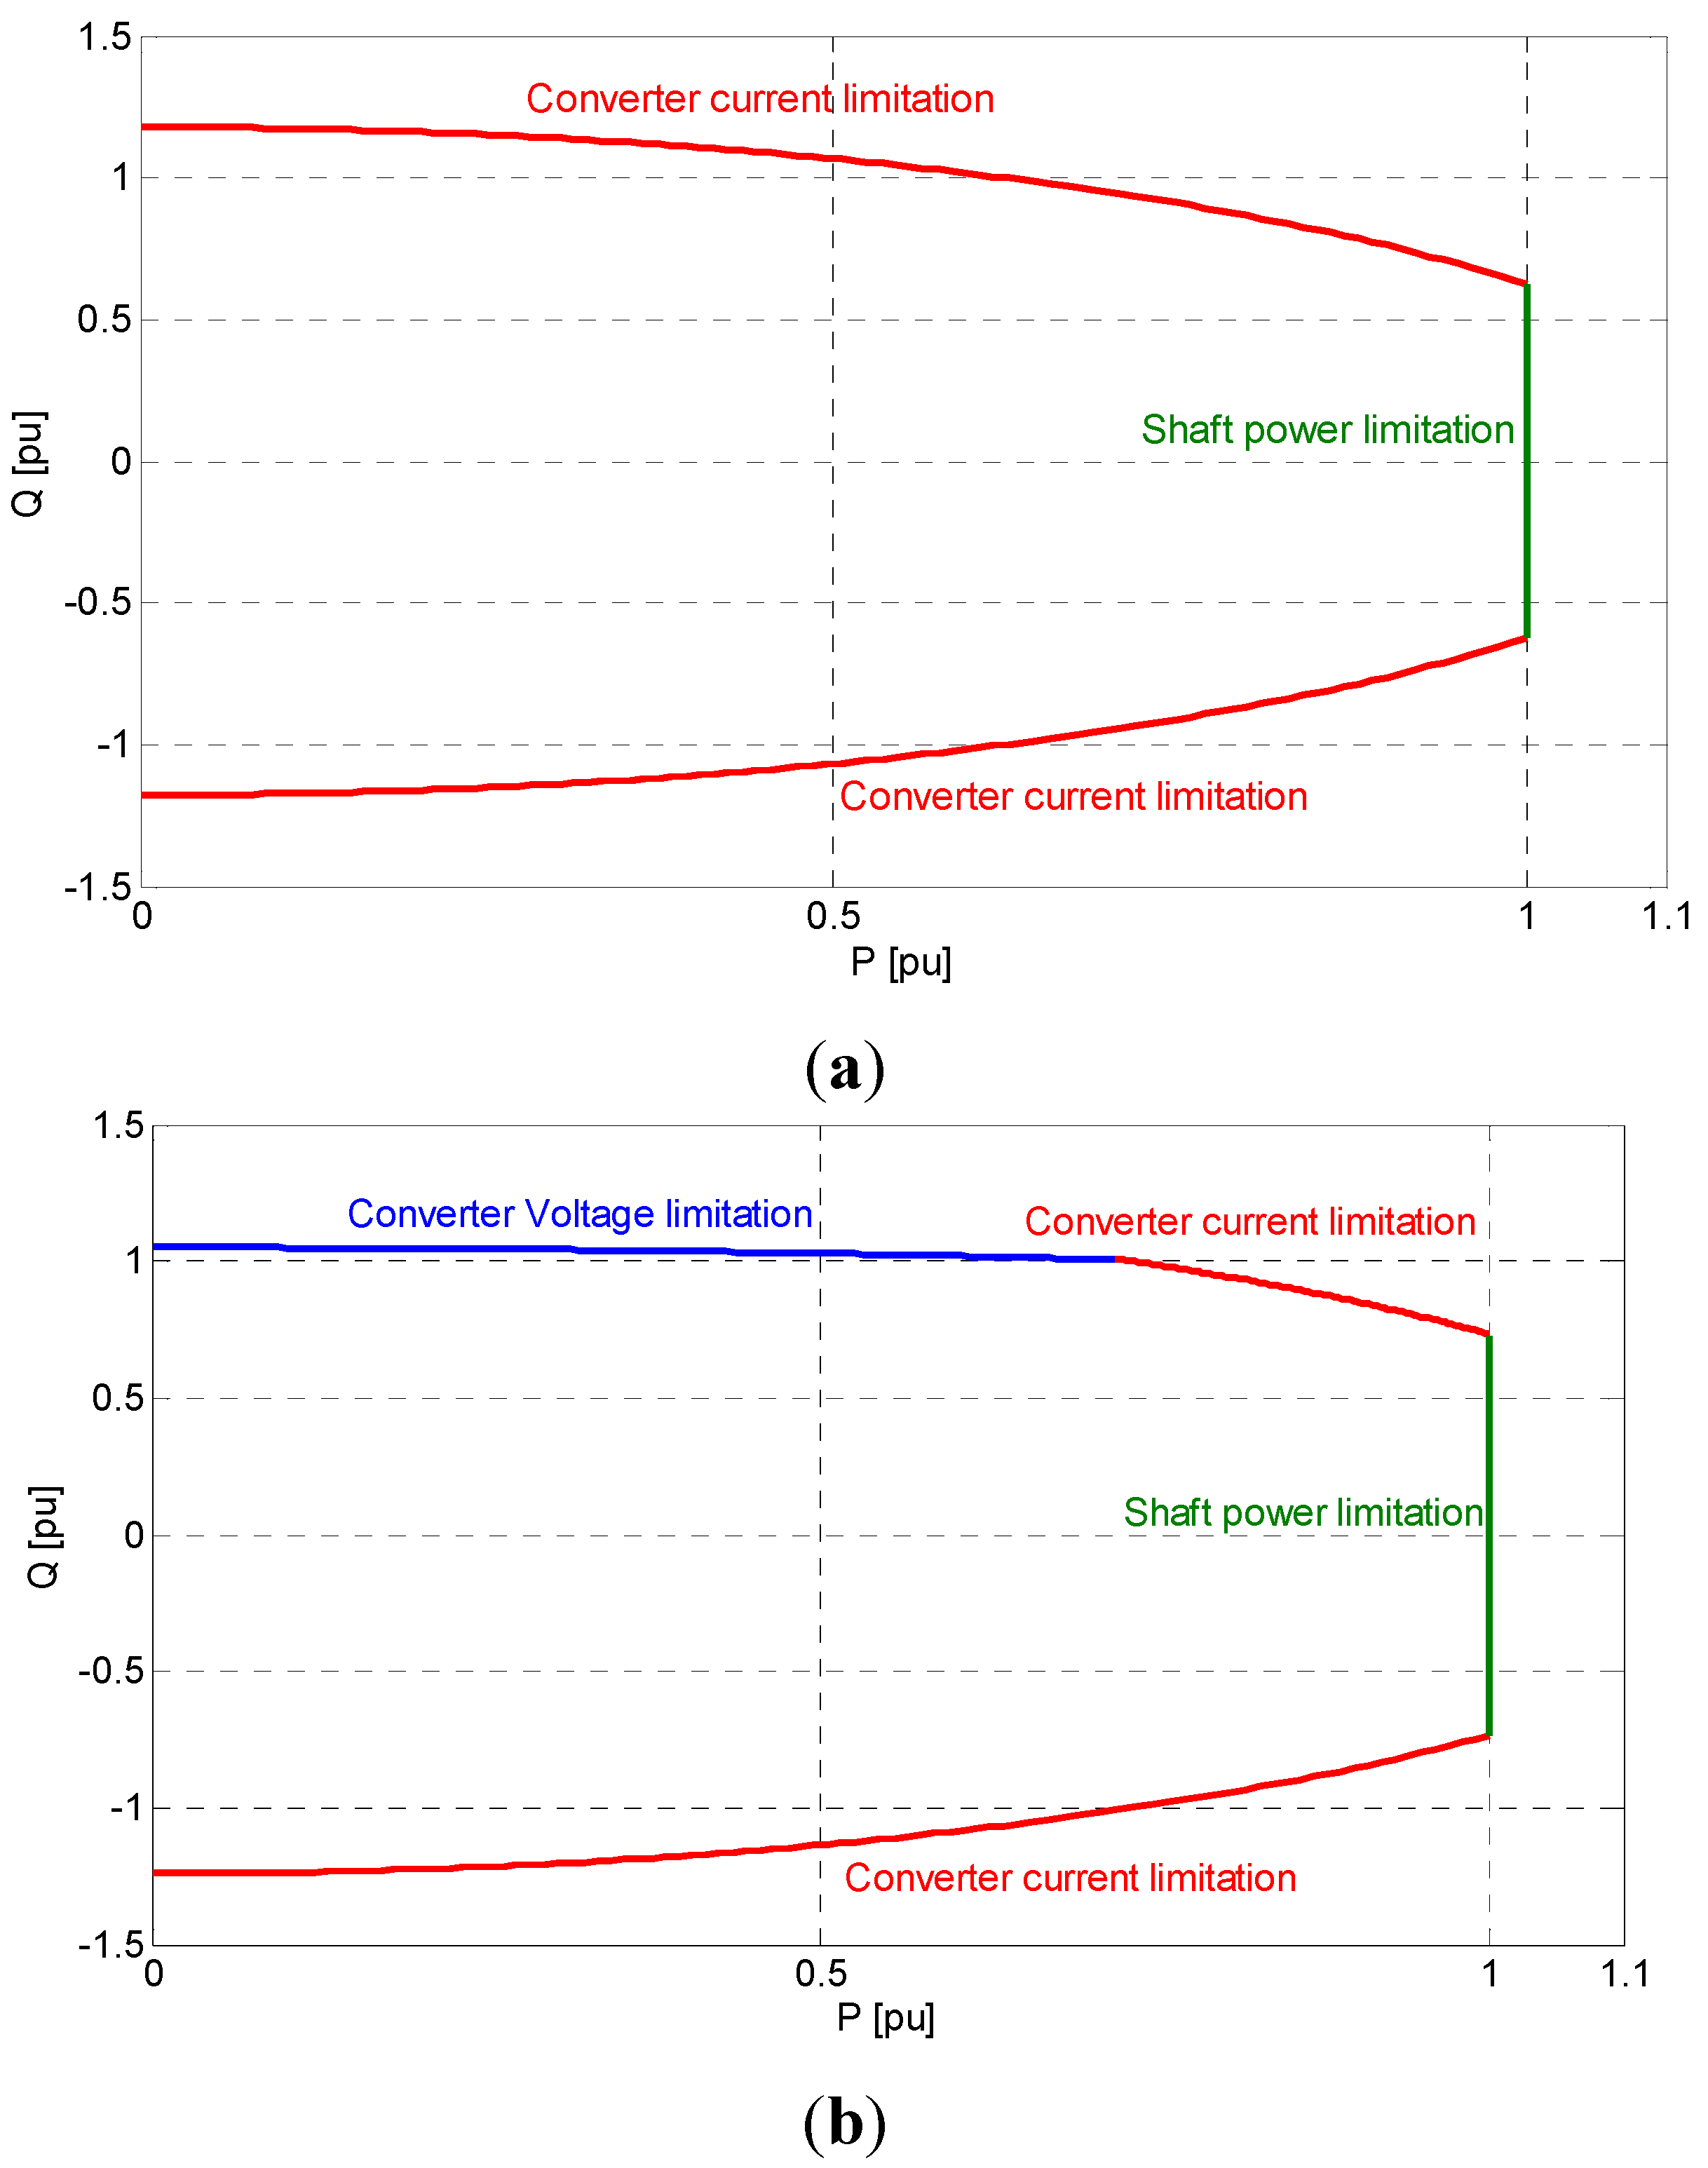
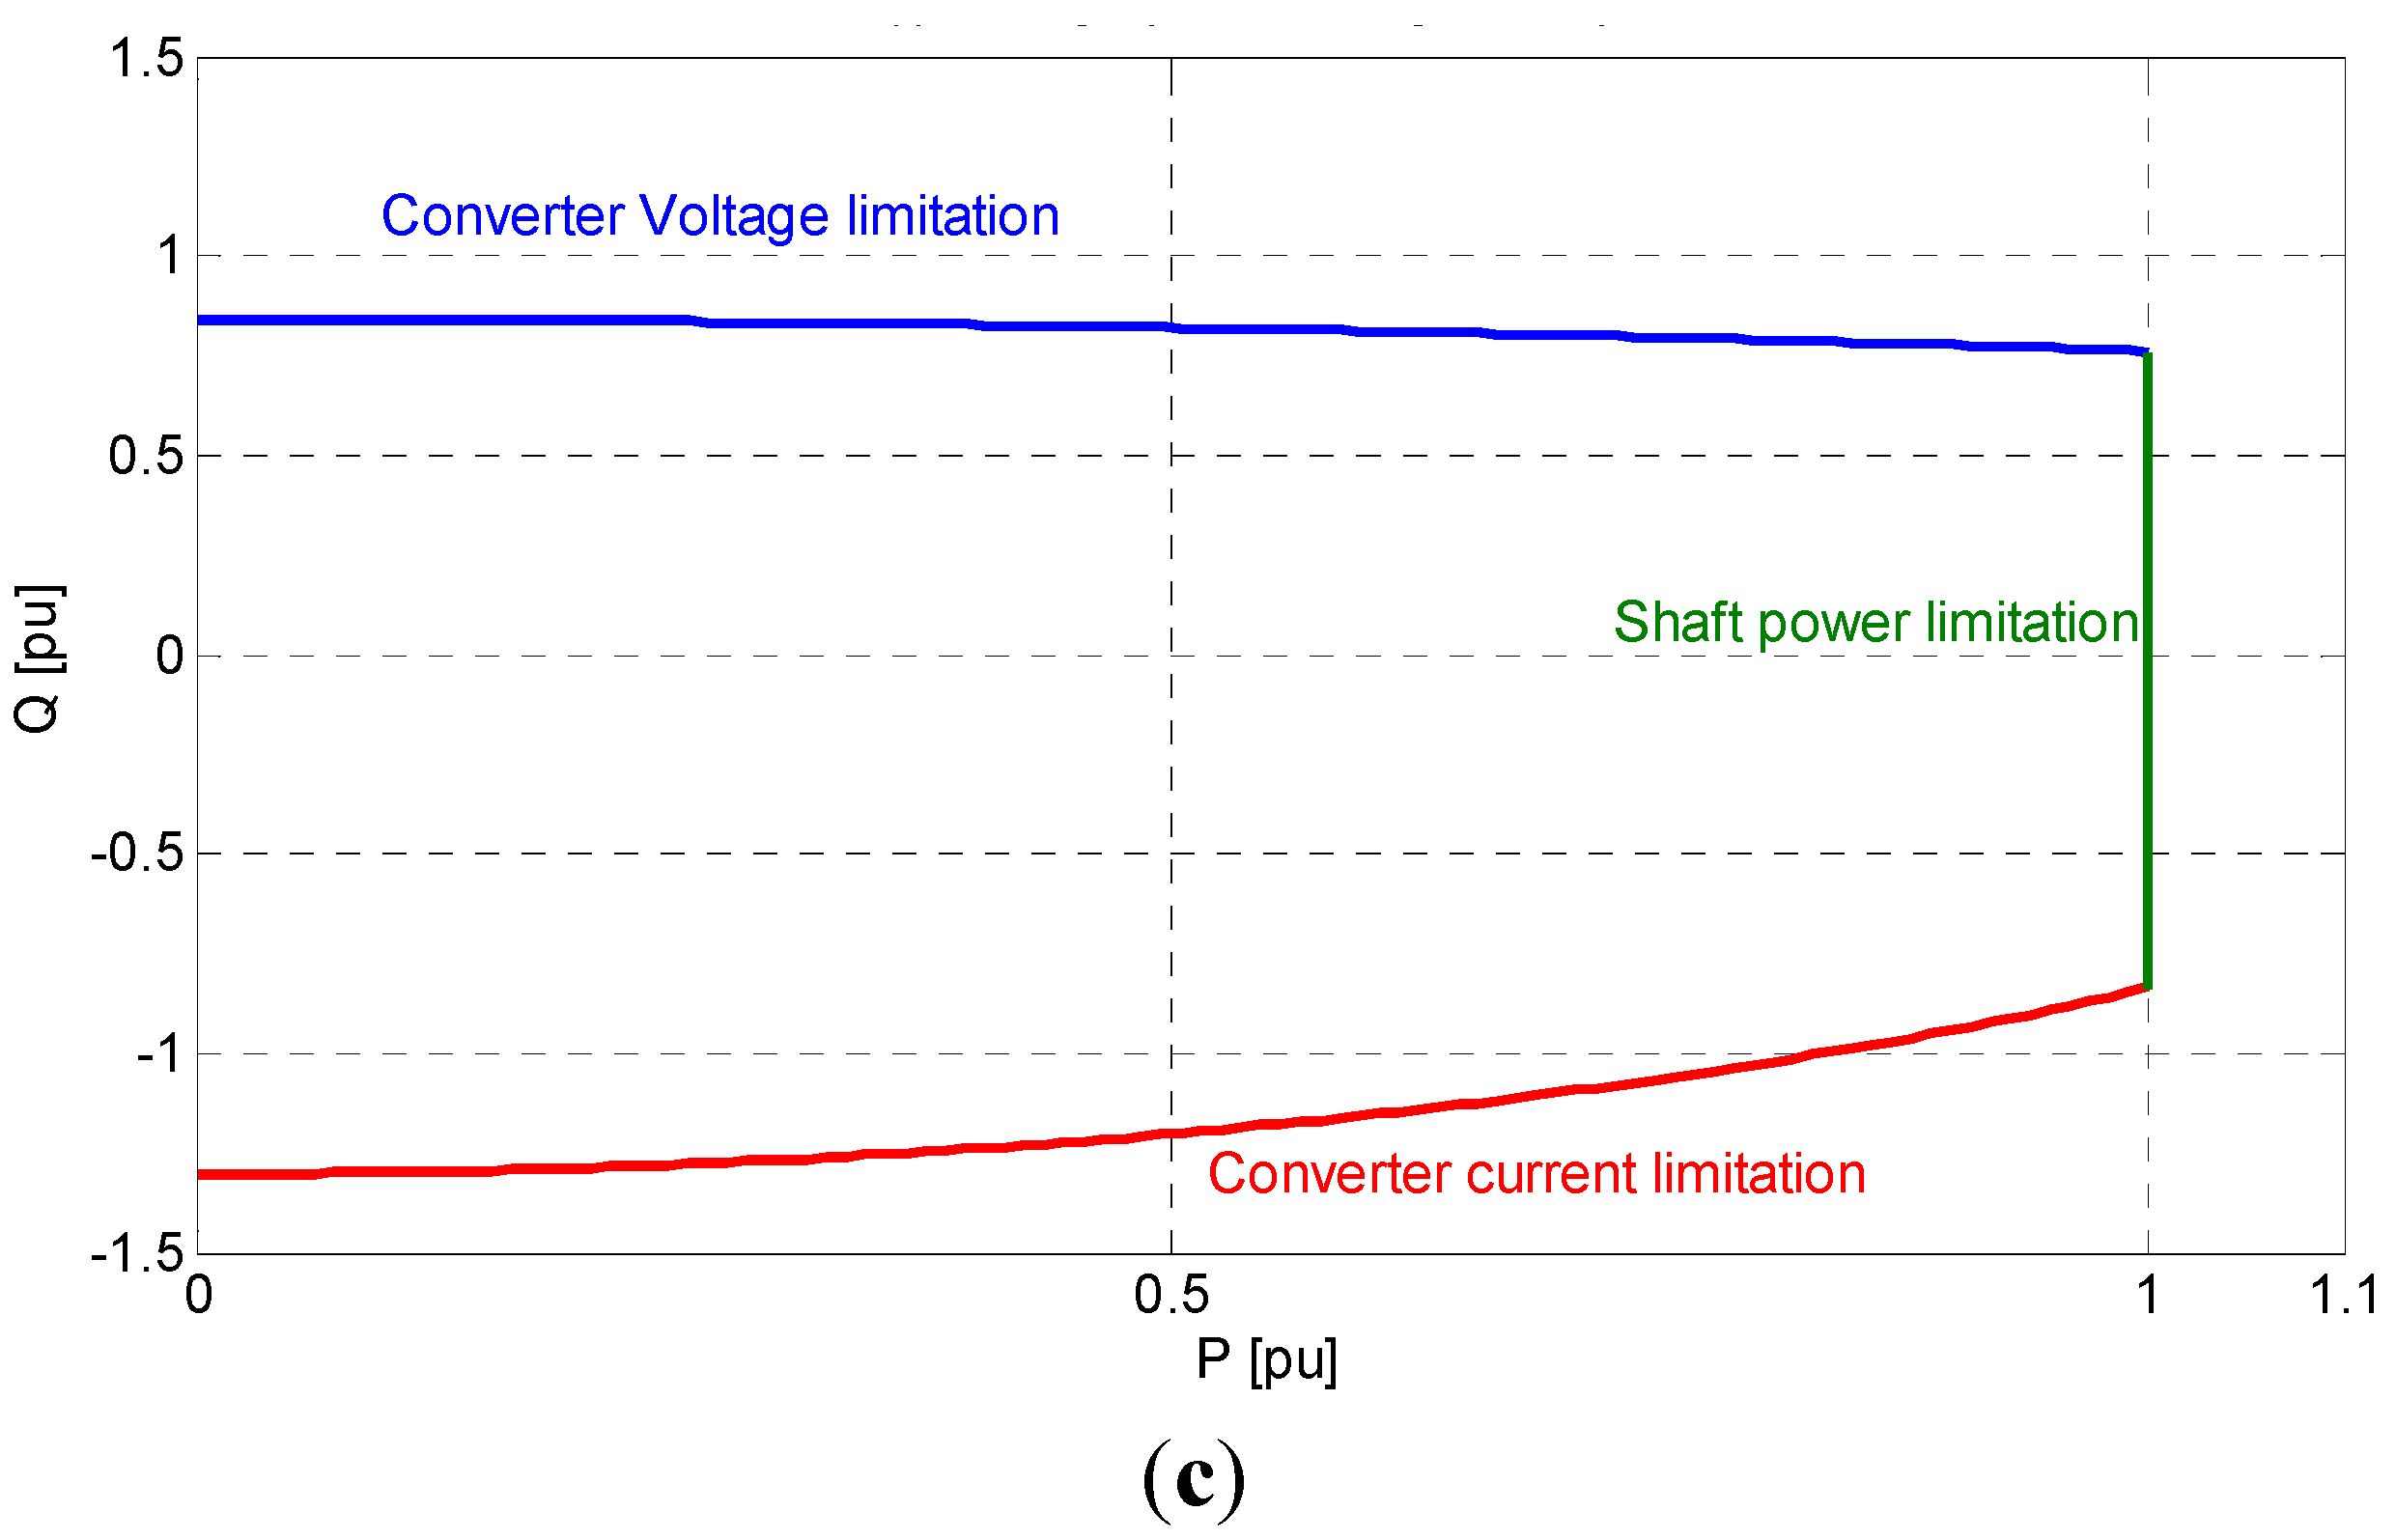
are related to the design of the rated power factor, as well as the upper and lower values of acceptable voltages and frequencies at the grid connection point. The capability curves of a RES-based DG for the design power factor 0.9 and different voltages at the grid connection point ( V g ) are illustrated in Figure 3.
Figure 2. RES-DG with full power back to back converter.
Applsci 06 00004 g002
Figure 3. Capability curves of an inverter-based RES-DG for design pf = 0.95 and different grid voltages. (a) Vg = 0.95 p.u.; (b) Vg =1.0 p.u.; and (c) Vg = 1.05 p.u.
Applsci 06 00004 g003aApplsci 06 00004 g003b
In most distribution systems, the DSO contracts with DGs, which are mandated to provide reactive power requirement according to the grid code. We suppose the grid code requirement to be such that the DG units must operate between a mandatory leading power factor ( p f m a n d ) and lagging p f m a n d at any operating point. Here, without loss of generality, the capability curve of a synchronous machine-based DG is employed to extract a new reactive power bidding structure. Similar formulation can be used for RES-DGs.
According to Figure 1, we can define four operating regions for DG i on the reactive power coordinate at a given initial scheduled active power P A , i as follows:
Region I ( Q m a n d , i A   to Q m a n d , i A ): Reactive power provided in this area is according to the grid code requirement. When a DG operates in this region, it is only paid an availability cost with a price ρ 0 in $/h. This price is a fixed component reflecting the portion of a supplier’s investment cost that can be contributed to reactive power production. Accordingly, the Q payment function (QPF) of DG i in region I is:
Q P F 1 ( D G , i ) = ρ 0 , i
Region II ( Q D G , i m i n   to   Q m a n d , i A ) and Region III ( Q m a n d , i A   to   Q A , i ): In these operation areas, injection and absorption of reactive power have no effect on the initial planned active power. However, these will increase power losses in the windings of the DG. Hence, the reactive power payment to the DG comprises both the availability cost and the losses cost. Two loss payment terms are specified as: the offered price ρ 1 in $/MVArh for operating in the under-excitation mode and the offered price ρ 2 in $/MVArh for operating in the over-excitation mode [18]. Therefore, the QPF of DG i in these regions is expressed as follows:
Q P F 2 ( D G , i ) = ρ 0 , i ρ 1 , i ( Q 2 D G , i + Q m a n d , i A )
Q P F 3 ( D G , i ) = ρ 0 , i + ρ 2 , i ( Q 3 D G , i Q m a n d , i A )
where Q 2 and Q 3 are in the following inequalities:
Q D G , i m i n Q 2 D G , i   Q m a n d , i A
Q m a n d , i A Q 3 D G , i Q A , i
Region IV ( Q A , i   to   Q D G , i m a x ): In this region, the DG has to reduce its initial planned active power production to generate the required reactive power. If the required reactive power from the DG is Q B , the operating point requires shifting back along the capability curve to point ( P B , Q B ) , in which P B < P A . Thus, it deserves to receive an additional payment according to its LOC resulting from the reduced generation of active power, as well as the two other components. In the joint active and reactive market, similar to decoupled reactive power market, a DG will be paid for the LOC if its active power output in the joint market is less than that of the energy-only market. In this study, LOC is paid according to an adjustment bid [38,39,40] offered by the DG. The adjustment bid is used by a generation unit to submit information about the maximum reduction in its initial planned active power obtained in the energy market that it admits, together with the price that it wants to receive for this change. In region IV, if the corresponding change in the active power which has a negative value is represented by P A d j variable, the LOC can be calculated based on multiplying | P A d j | by the adjustment price ( ρ A d j ). Hence, the QPF of DG i in region IV is calculated as:
Q P F 4 ( D G , i ) = ρ 0 , i + ρ 2 , i ( Q 4 D G , i Q m a n d , i B ) + ρ A d j , i | P D G , i A d j | L O C
where P D G , i A d j is defined as follows:
P D G , i A d j = P B , i P A , i
Q 4 is constrained by the following inequalities:
Q A , i Q 4 D G , i Q D G , i m a x
It should be mentioned that P A is initial scheduled active power which will be obtained in the day ahead energy-only market for each DG. According to the above discussion, the following formulation is introduced for the QPF of DG ith:
Q P F D G , i = W 1 , i · ρ 0 , i W 2 , i · ρ 1 , i ( Q 2 D G , i + Q m a n d , i A ) + W 3 , i · ρ 2 , i ( Q 3 D G , i Q m a n d , i A ) + W 4 , i ( ρ 2 , i ( Q 4 D G , i Q m a n d , i B ) + ρ A d j , i | P D G , i A d j | )
W 1 , i ,   W 2 , i ,   W 3 , i , and   W 4 , i are binary numbers. These numbers are employed to represent a limited region on which the DG operates. The two regions III and IV are merged in Equation (13) compared with (12), since both regions have the same operation payment:
Q P F D G , i = W 1 , i · ρ 0 , i W 2 , i · ρ 1 , i ( Q 2 D G , i + Q m a n d , i ) + ( W 3 , i + W 4 , i )   ρ 2 , i ( Q 3 D G , i Q m a n d , i ) + W 4 , i ( ρ A d j , i | P D G , i A d j | )
where, the operation constraints of DG i are:
W 1 , i ,   W 2 , i ,     W 3 , i   ,   W 4 , i { 0 , 1 }
W 1 , i Q m a n d , i Q 1 D G , i W 1 , i Q m a n d , i
W 2 , i   Q D G , i m i n Q 2 D G , i W 2 , i Q m a n d , i
( W 3 , i + W 4 , i ) Q m a n d , i Q 3 D G , i ( W 3 , i + W 4 , i ) Q c a p , i
Q m a n d , i = ( P D G , i ) t a n ( c o s 1 ( p f m a n d ) )
Q D G , i = Q 1 D G , i + Q 2 D G , i + Q 3 D G , i
W 2 , i + W 3 , i +   W 4 , i W 1 , i
In Equation (17), Q cap , i is located on the capability curve border in accordance with P D G , i . Equation (20) ensures that the DG operates in only one of the four defined regions.

3. Decoupled Day-Ahead Active Power Market

In the day-ahead active power market or energy market, an Initial Active Power Dispatch (IAPD) will be achieved based on the forecasted load demand. As discussed in Section 2, this initial dispatch is used to account the LOC of DGs, whereas the active and reactive power dispatches will be finally attained by the proposed joint active and reactive power dispatch model. The energy market is cleared based on the minimization of the electrical energy costs offered by DG units and Disco. To this end, the DGs should submit their hourly selling bids that comprise both quantity and price to the DSO in the day before operation. Moreover, it is supposed that the hourly energy price of the wholesale electricity market for the next 24-h period is forecasted by Disco. Accordingly, the objective function of the energy-only market is the cost of electrical energy during the total scheduling horizon as follows:
Z = h = 1 N h P D i s c o i n i , h · π D i s c o h + h = 1 N h i = 1 N D G P D G , i i n i , h · π D G , i h
The IAPD problem can be modeled by Equations (13)–(16) as follows:
min   Z
subject to:
0 P D i s c o i n i , h P D i s c o m a x
0 P D G , i i n i , h P D G , i m a x
P D i s c o i n i , h + i = 1 N D G P D G , i i n i , h = i = 1 N B u s P D , i h
Equations (23) and (24) denote the limits on the generations and Equation (25) indicates the constraint of demand/supply balance. The result of IAPD is implemented by DSO to determine the LOC of DGs.

4. Proposed Joint Active/Reactive Power Dispatch Model

The DSO purchases its required active and reactive powers from DGs as well as the wholesale electricity market. After receiving the information related to the capability diagram and active and reactive power offers of DGs and Disco, DGs’ adjustment bids and the results of IAPD, the DSO will be able to execute the joint active/reactive power dispatch program. The aim of this program is to optimally determine the active/reactive power values of DGs and Disco, reactive power values of capacitors, as well as tap positions of transformers for the next day. In the proposed model, Disco is considered to play an intermediary role between the wholesale market and distribution system. Here, a coupled active and reactive power market settlement model is presented for a competitive electricity market at the distribution level.

4.1. Objective Function

In the joint active and reactive power market proposed here, the DSO are seeking to minimize the objective function which consists of the offered energy cost of DGs and Disco, the QPF of DGs for their reactive power compensation, and the total payment for reactive power purchased by Disco from the wholesale market as follows:
M i n i m i z e   C O S T E n e r g y + Q P F D G + C O S T Q , D i s c o

4.1.1. Total Energy Cost

The first term is the total cost offered by the Disco and the DG units for their active power production. It can be formulated as follows:
C O S T E n e r g y = h = 1 N h P D i s c o h · π D i s c o h + h = 1 N h i = 1 N D G P D G , i h · π D G , i h

4.1.2. Total QPF of DGs for Reactive Power Compensation

The second term of objective function is the QPF of DGs that should be minimized. The QPF of DGs for reactive power compensation given by Equation (13) will be used as the second term of the objective function by Equation (28):
Q P F D G = h = 1 N h i = 1 N D G Q P F D G , i h = h = 1 N h i = 1 N D G ( W 1 , i h · ρ 0 , i W 2 , i h · ρ 1 , i ( Q 2 D G , i h + Q m a n d , i h ) + ( W 3 , i h + W 4 , i h )   ρ 2 , i ( Q 3 D G , i h Q m a n d , i h ) + W 4 , i h ( ρ A d j , i | P D G , i A d j , h | ) )
where P D G , i A d j , h and   Q m a n d , i h are defined as follows:
Q m a n d , i h = ( P D G , i h ) t a n ( c o s 1 ( p f m a n d ) )
P D G , i A d j , h = { ( P D G , i h P D G , i i n i , h )   i f   P D G , i h < P D G , i i n i , h   0   i f   P D G , i h P D G , i i n i , h

4.1.3. Cost of Reactive Power Provided by Disco

In the competitive electricity markets, Disco generally purchases reactive power from the wholesale market and sells it to its customers at a fixed price as follows:
C O S T Q , D i s c o = h = 1 N h C O S T ( Q D i s c o h ) = | Q D i s c o h | ρ Q , D i s c o h

4.2. Constraints

The objective function (26) should be minimized subjected to the following equality and inequality constraints, besides the operation constraints of DGs discussed in Section 2:
Power flow constraints:
P G , n h P D , n h = | V n h | m = 1 N B u s | V m h | | Y n m | c o s   ( θ n h θ m h φ n m )
Q G , n h Q D , m h = | V n h | m = 1 N B u s | V m h | | Y n m | s i n ( θ n h θ m h φ n m )
Bus Voltage magnitude:
V m i n | V n h | V m a x
Limits of generation capacity of DGs and Disco:
P D i s c o m i n P D i s c o h P D i s c o m a x
P D G , i m i n P D G , i h P D G , i m a x
Limit of reactive power provision by Disco:
Q D i s c o h , m i n Q D i s c o h Q D i s c o h , m a x
Limits of the reduction in the initial scheduled active power of DGs:
| P D G , i A d j , h | x D G , i m a x . P D G , i i n i , h
Limit of transformer tap:
T a p m i n T a p h T a p m a x
Thus, the voltage of substation is calculated as:
V s u b = 1 + T a p h * T a p   r a t i o
Limit of steps of capacitors:
C S t e p i m i n C S t e p i h C S t e p i m a x
The proposed model for joint active/reactive power market settlement in distribution systems is basically a non-convex MINLP optimization problem, due to the presence of the binary variables and the discrete nature of OLTCs and Sh.Cs, as well as the nonlinear power flow constraints. The solution of non-convex MINLP problems is very challenging, because they contain both the integer variables and non-convex functions in the objective or the constraints. Therefore, even when the integer variables are relaxed to be continuous ones, the feasible area is usually non-convex, resulting in many local optimums. DICOPT is a program for solving MINLP problems. This program is based on the extensions of the outer-approximation algorithm for the equality relaxation strategy. The MINLP algorithm inside DICOPT solves a sequence of nonlinear programming (NLP) and Mixed-Integer Programming (MIP) sub-problems.
The structure and time horizon of the proposed joint active and reactive power dispatch model for competitive electricity markets in distribution systems are illustrated in Figure 4 and Figure 5, respectively.
Figure 4. Structure of proposed joint active/reactive power dispatch model.
Applsci 06 00004 g004
Figure 5. Time horizon of proposed joint active/reactive power dispatch model.
Applsci 06 00004 g005

5. Simulation Results

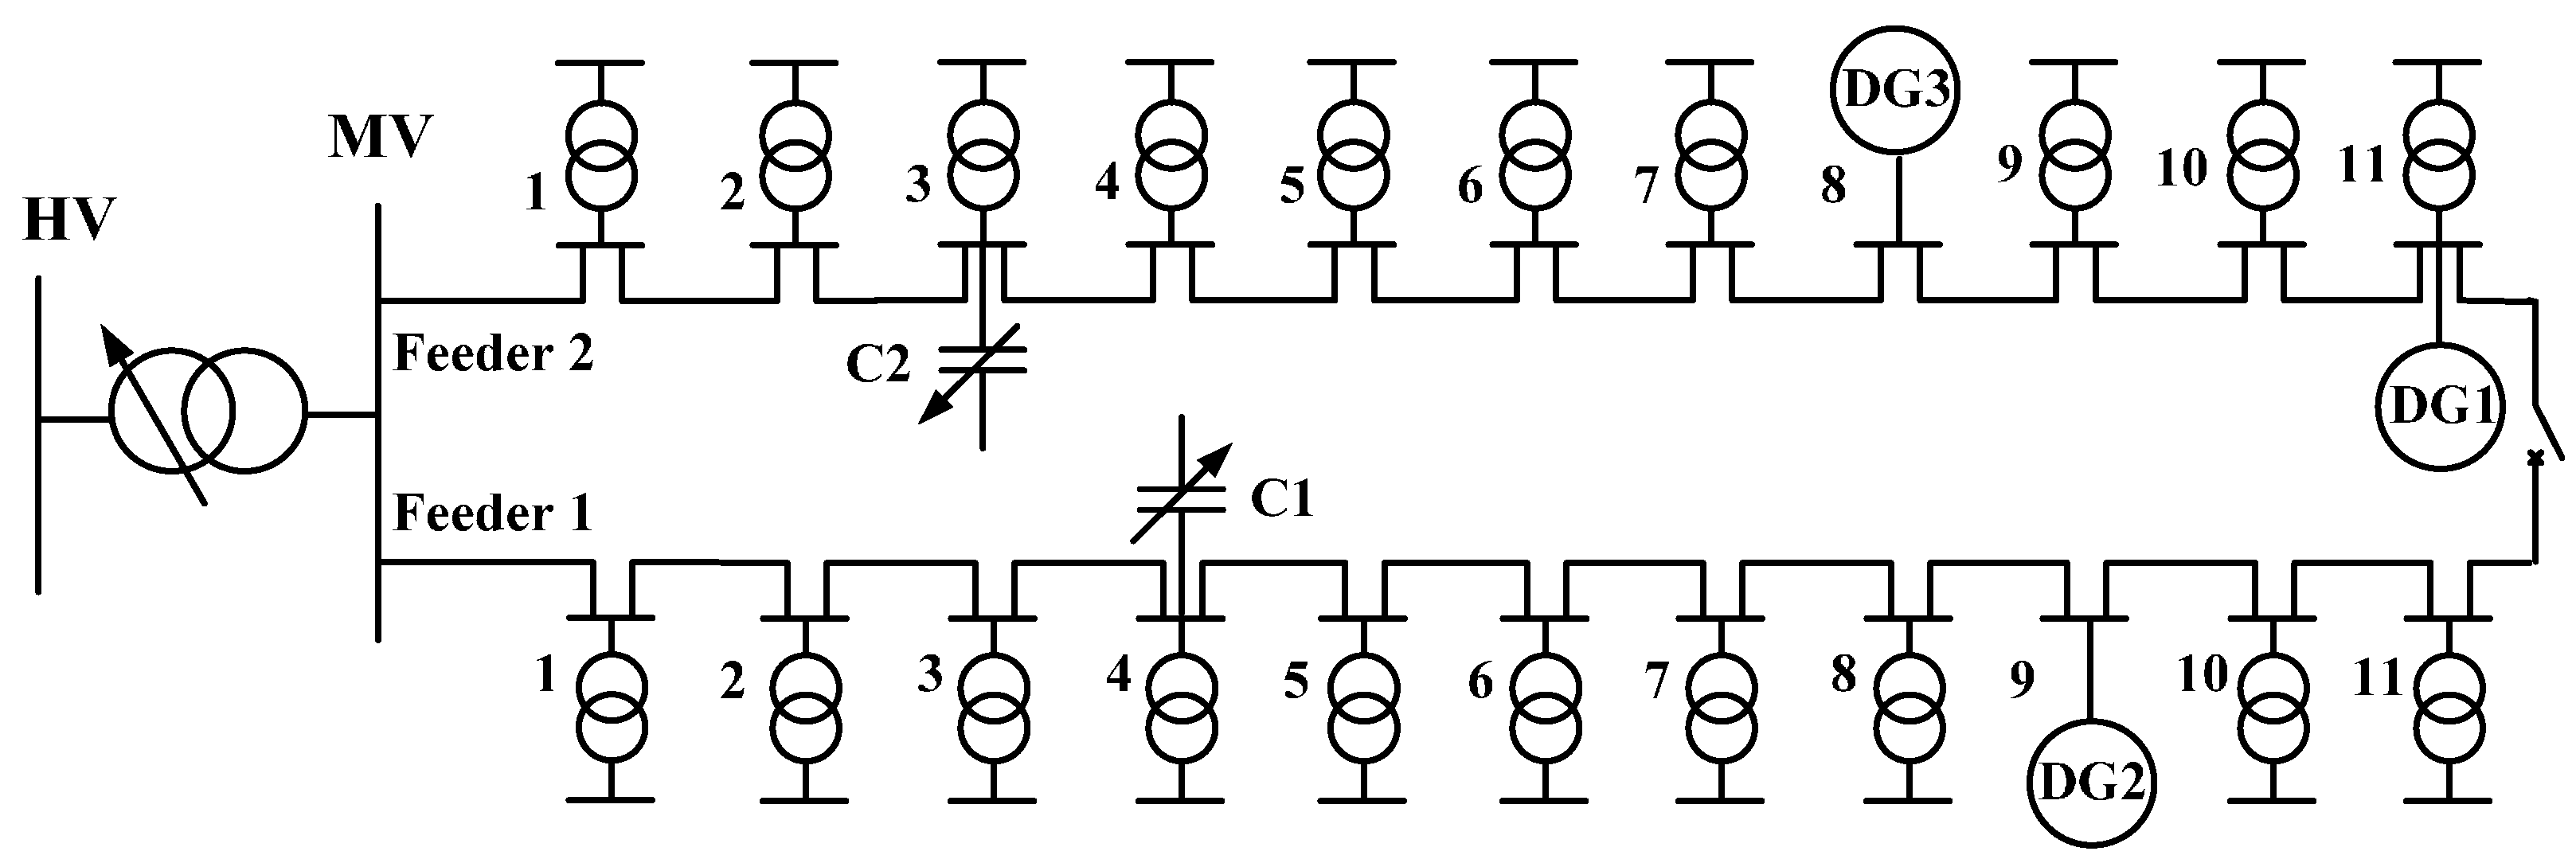
A modified 22-bus 20-kV radial distribution test system [15] with two feeders and three dispatchable DGs is used as a case study to analyze and investigate the proposed method. The single line diagram of the distribution test system has been shown in Figure 6. The lines’ length has been multiplied by 1.5 to create a severe voltage situation. The HV/MV transformer has 11 tap positions ([−5, −4, −3, −2, −1, 0, 1, 2, 3, 4, 5]) and each tap ratio is 0.01 p.u. It is capable of varying the bus voltage at substation between 0.95 and 1.05 pu. Capacitors one and two, with a capacity of 1000 kVAr, have five switching steps of 200 kVAr.
Figure 6. The single line diagram of 22-bus distribution test system.
Applsci 06 00004 g006
Table 1 lists active power bids of DGs including the blocks of offered quantity and energy bid price. Additionally, the hourly wholesale market energy prices which are considered as active bid prices of Disco have been given in Table 2. Table 3 presents the reactive bid prices of DGs to participate in the joint active/reactive power market. The price of reactive power offered by Disco is $16/MVArh. The mandatory power factor ( p f m a n d   ) has been taken to be 0.95.
Table 1. Price-Quantity offer of DGs.
DGHourBlock NumberQuantity (kW)Price ($/MWh)
DG11–24120041
220050
310058
DG21–24140039
240046
320053
DG21–24120042
215050
315067
Table 2. Hourly wholesale market energy price.
HourWholesale Energy Price ($/MWh)HourWholesale Energy Price ($/MWh)
1451350
2451455
3451555
4451658
5451758
6451859
7471964
8472064
9482162
10482257
11502350
12502450
Table 3. Reactive power offer prices of the DG units.
Unit P D G m a x (kW) ρ 0   ($/h) ρ 1 ($/MVArh) ρ 2 ($/MVArh) ρ A d j ($/MWh) x m a x
DG15000.06813138050%
DG210000.08215157850%
DG35000.09517178550%
The initial active power dispatch which is needed to estimate LOC payment of DG units is depicted in Figure 7. The proposed joint active/reactive power market settlement model has been tested on two scenarios as follows:
Scenario 1: Maximum available reactive power of Disco is 3 MVAr.
Scenario 2: Maximum available reactive power of Disco is 2.2 MVAr.
Figure 7. Initial active power dispatch obtained in the day-ahead energy-only market.
Applsci 06 00004 g007

5.1. Scenario 1

The objective function value given by Equation (26) becomes $4827.69, which includes the energy cost of DGs and Disco, QPF of DGs, as well as the cost of reactive power purchased by Disco from the wholesale market. The components of objective function of the joint active and reactive power dispatch model are reported in Table 4.
Table 4. Optimization results of the joint active/reactive power dispatch in Scenario 1.
Components of Objective FunctionDiscoDG1DG2DG3TOTAL
Energy Cost ($)2952.11369.58843.40369.424534.52
Reactive Power Cost ($)206.0421.2938.5927.26293.18
Moreover, the QPF of DGs has been broken down in Table 5. As observed in Table 5, the optimization results reveal that the DGs have not lost any opportunity and the corresponding payments comprise only availability cost and losses cost.
Table 5. The break-down of the QPF of DGs in Scenario 1.
Components of CostDG1DG2DG3
Availability Payment ($)1.631.972.28
Losses Payment ($)19.6636.6324.98
Loss Opportunity Cost (LOC) ($)000
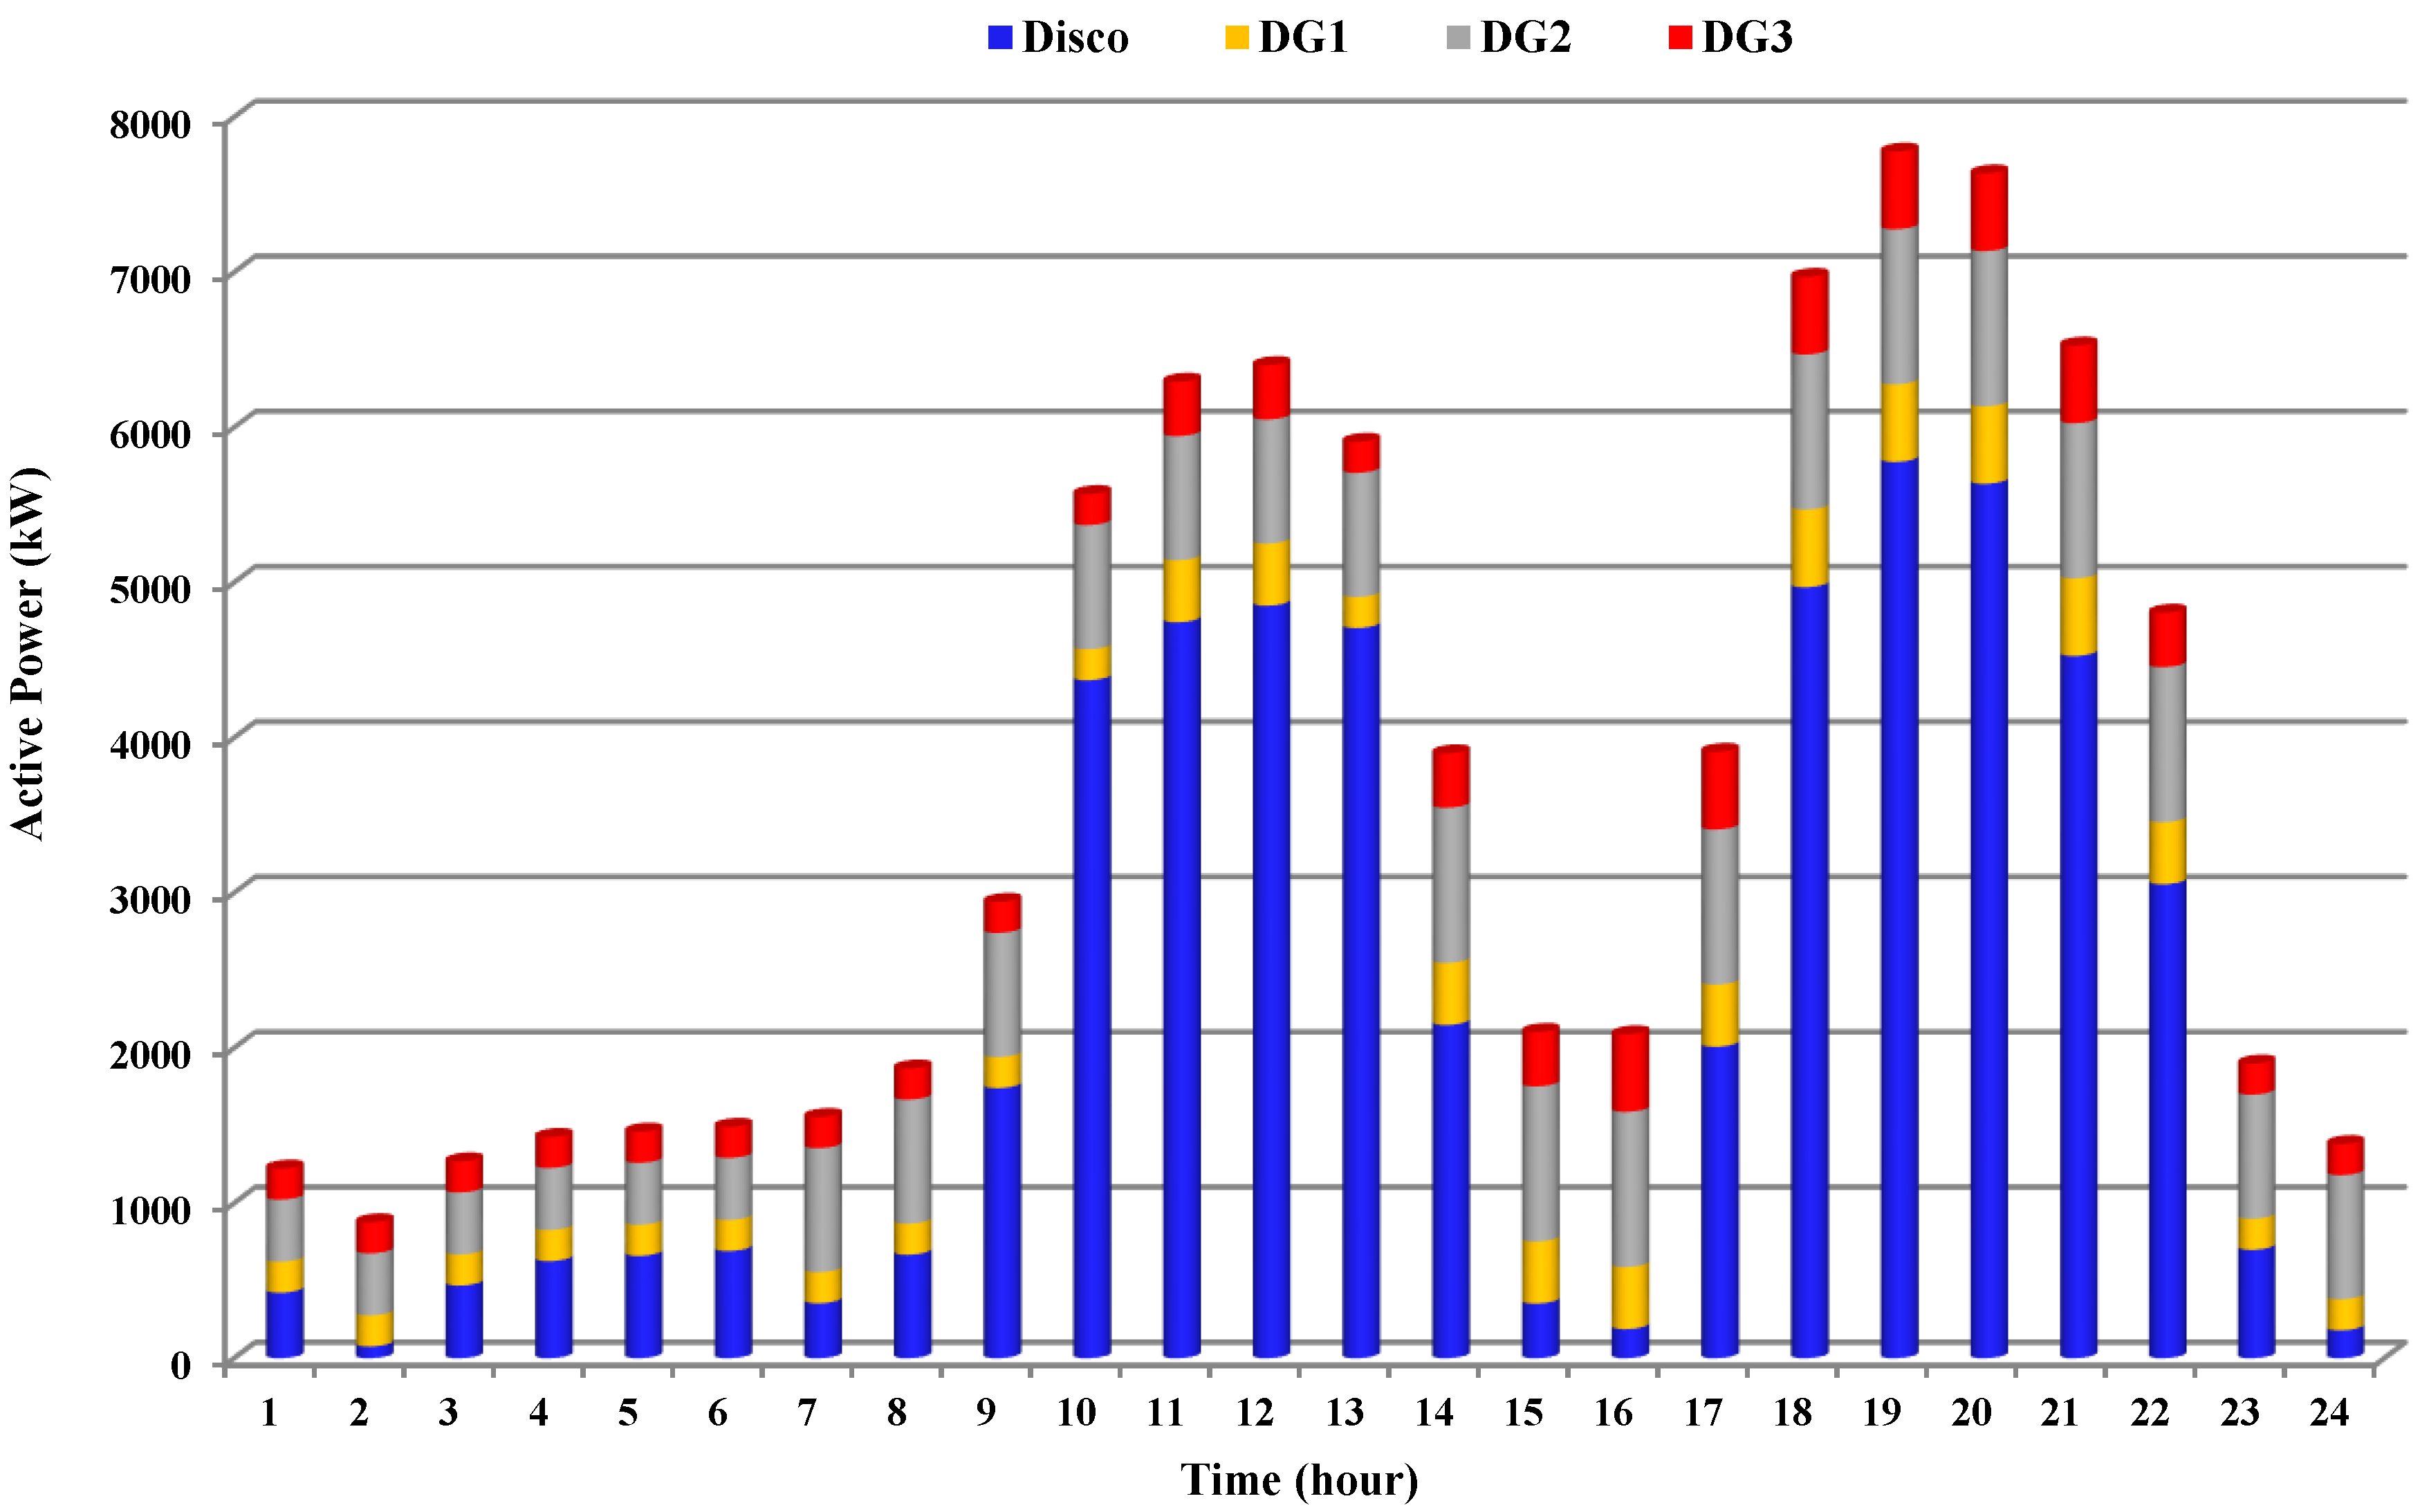
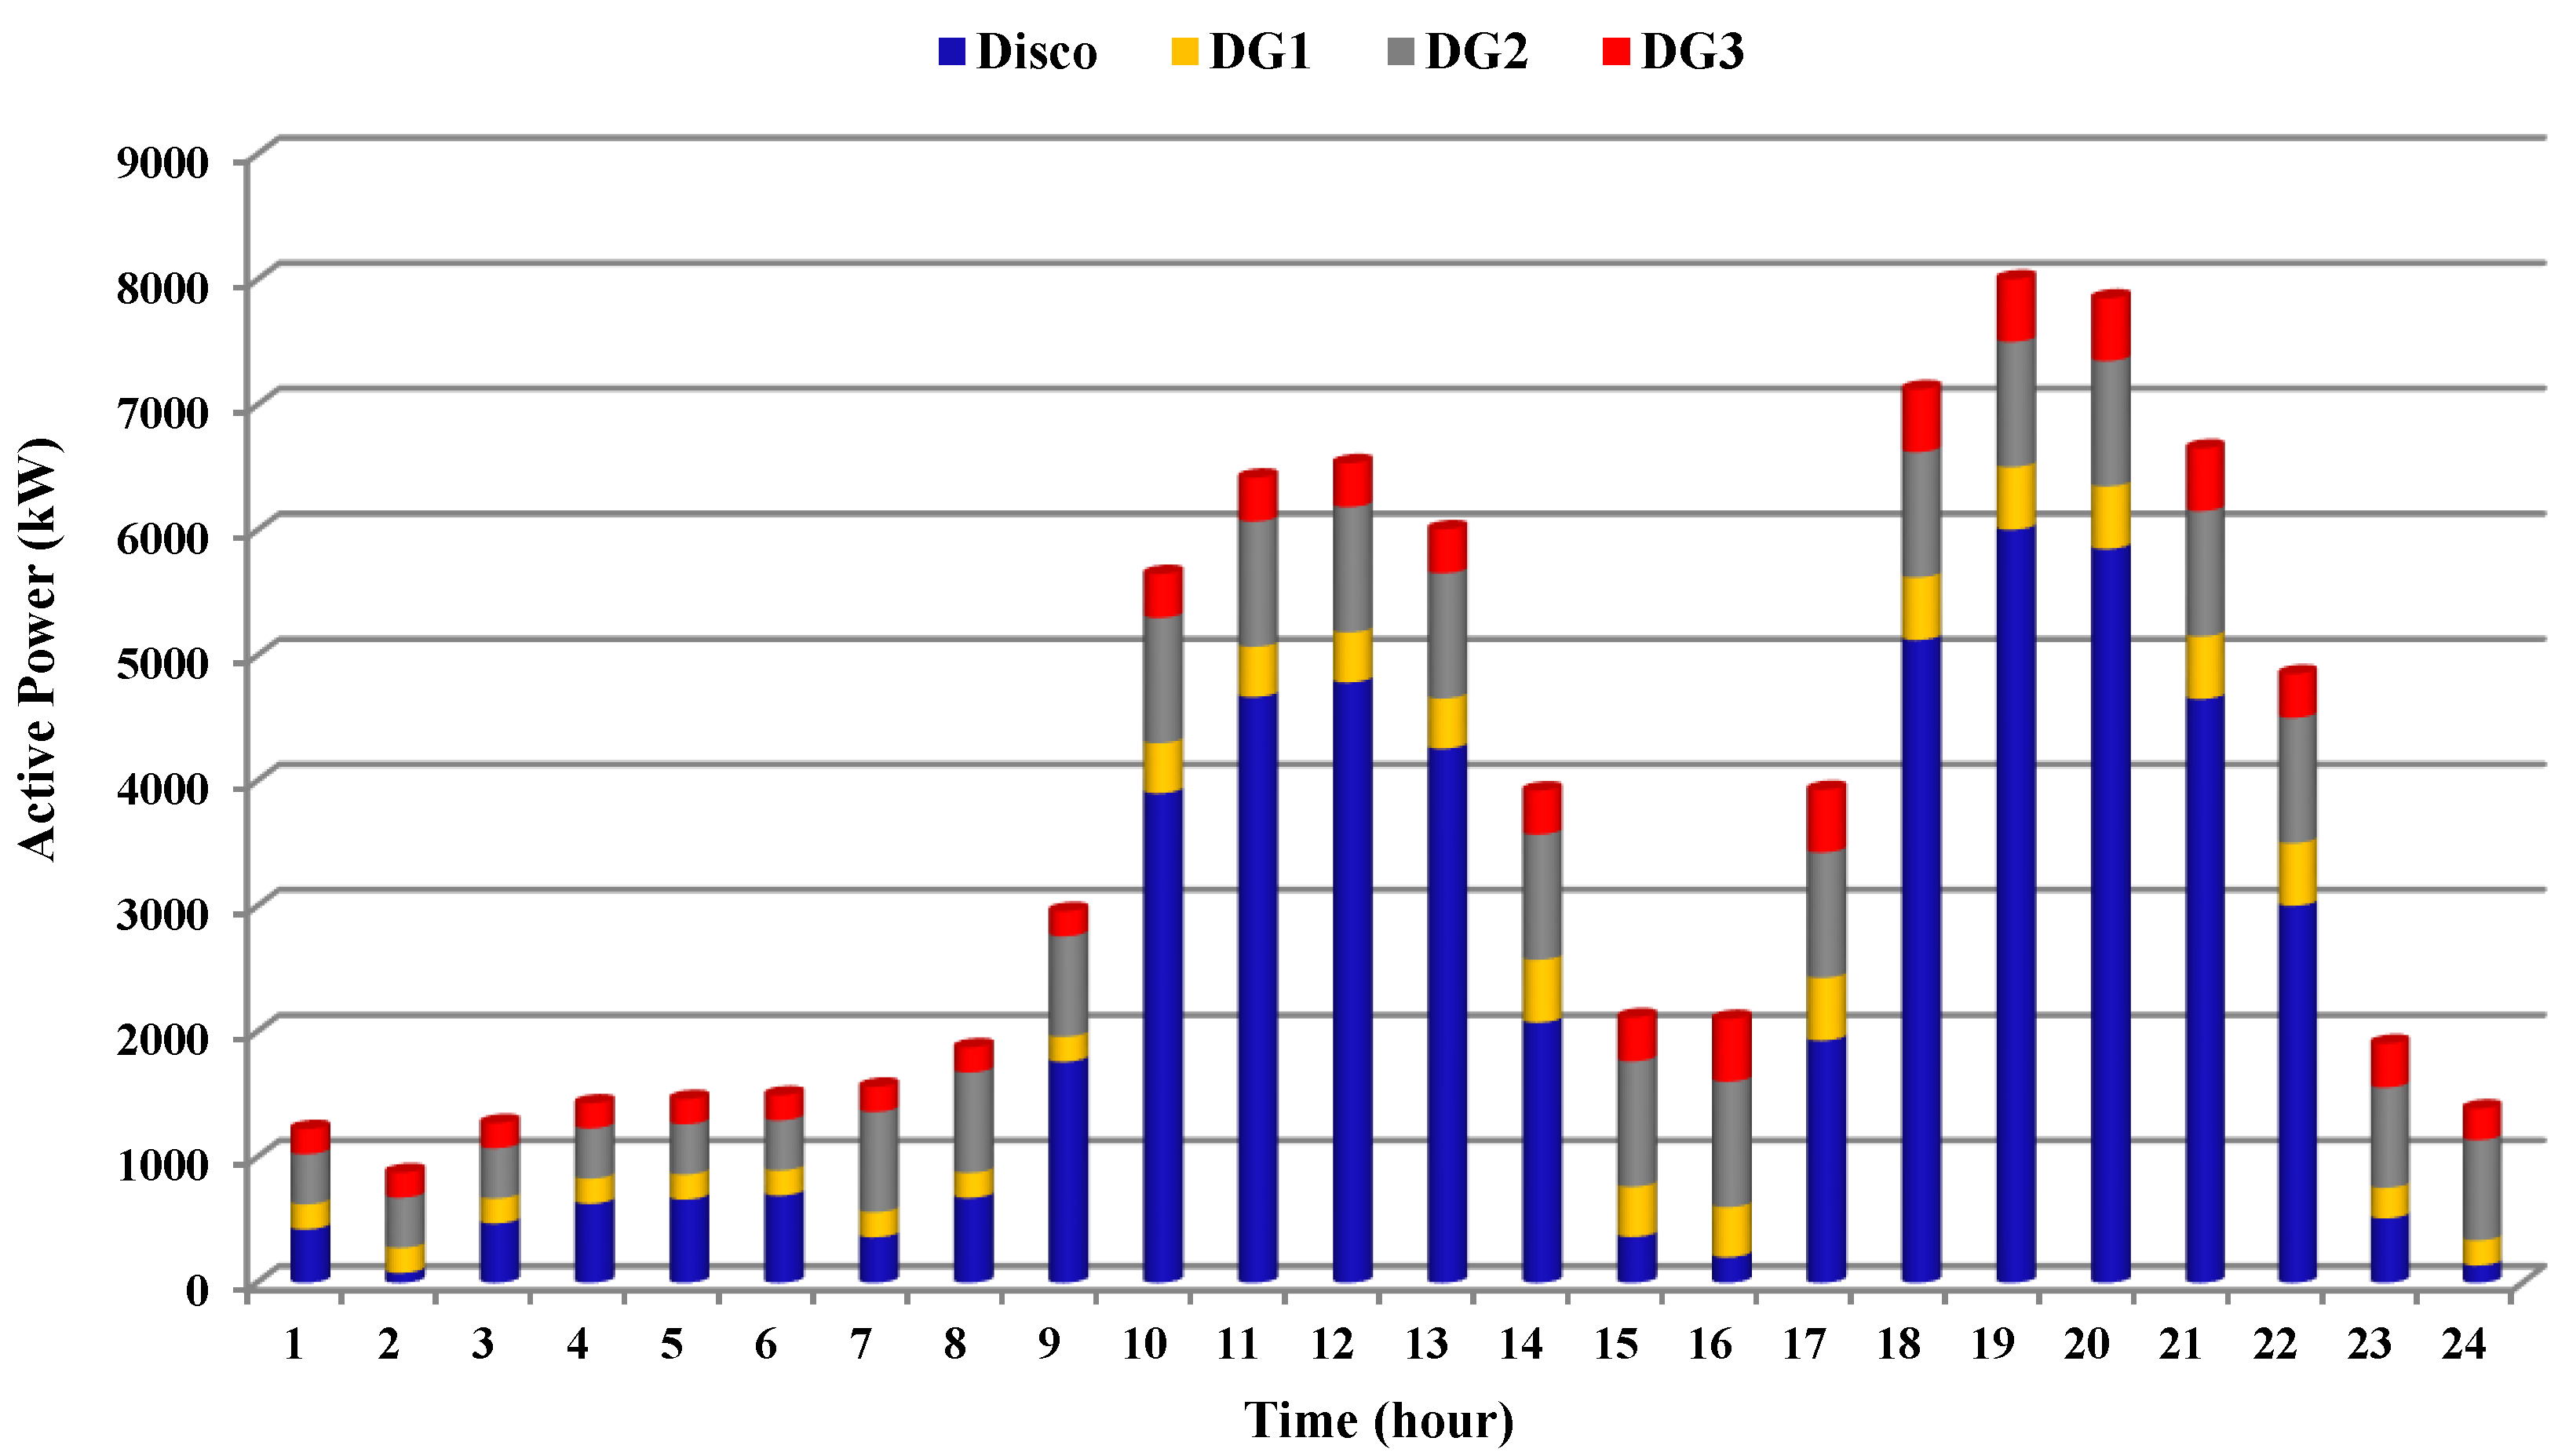
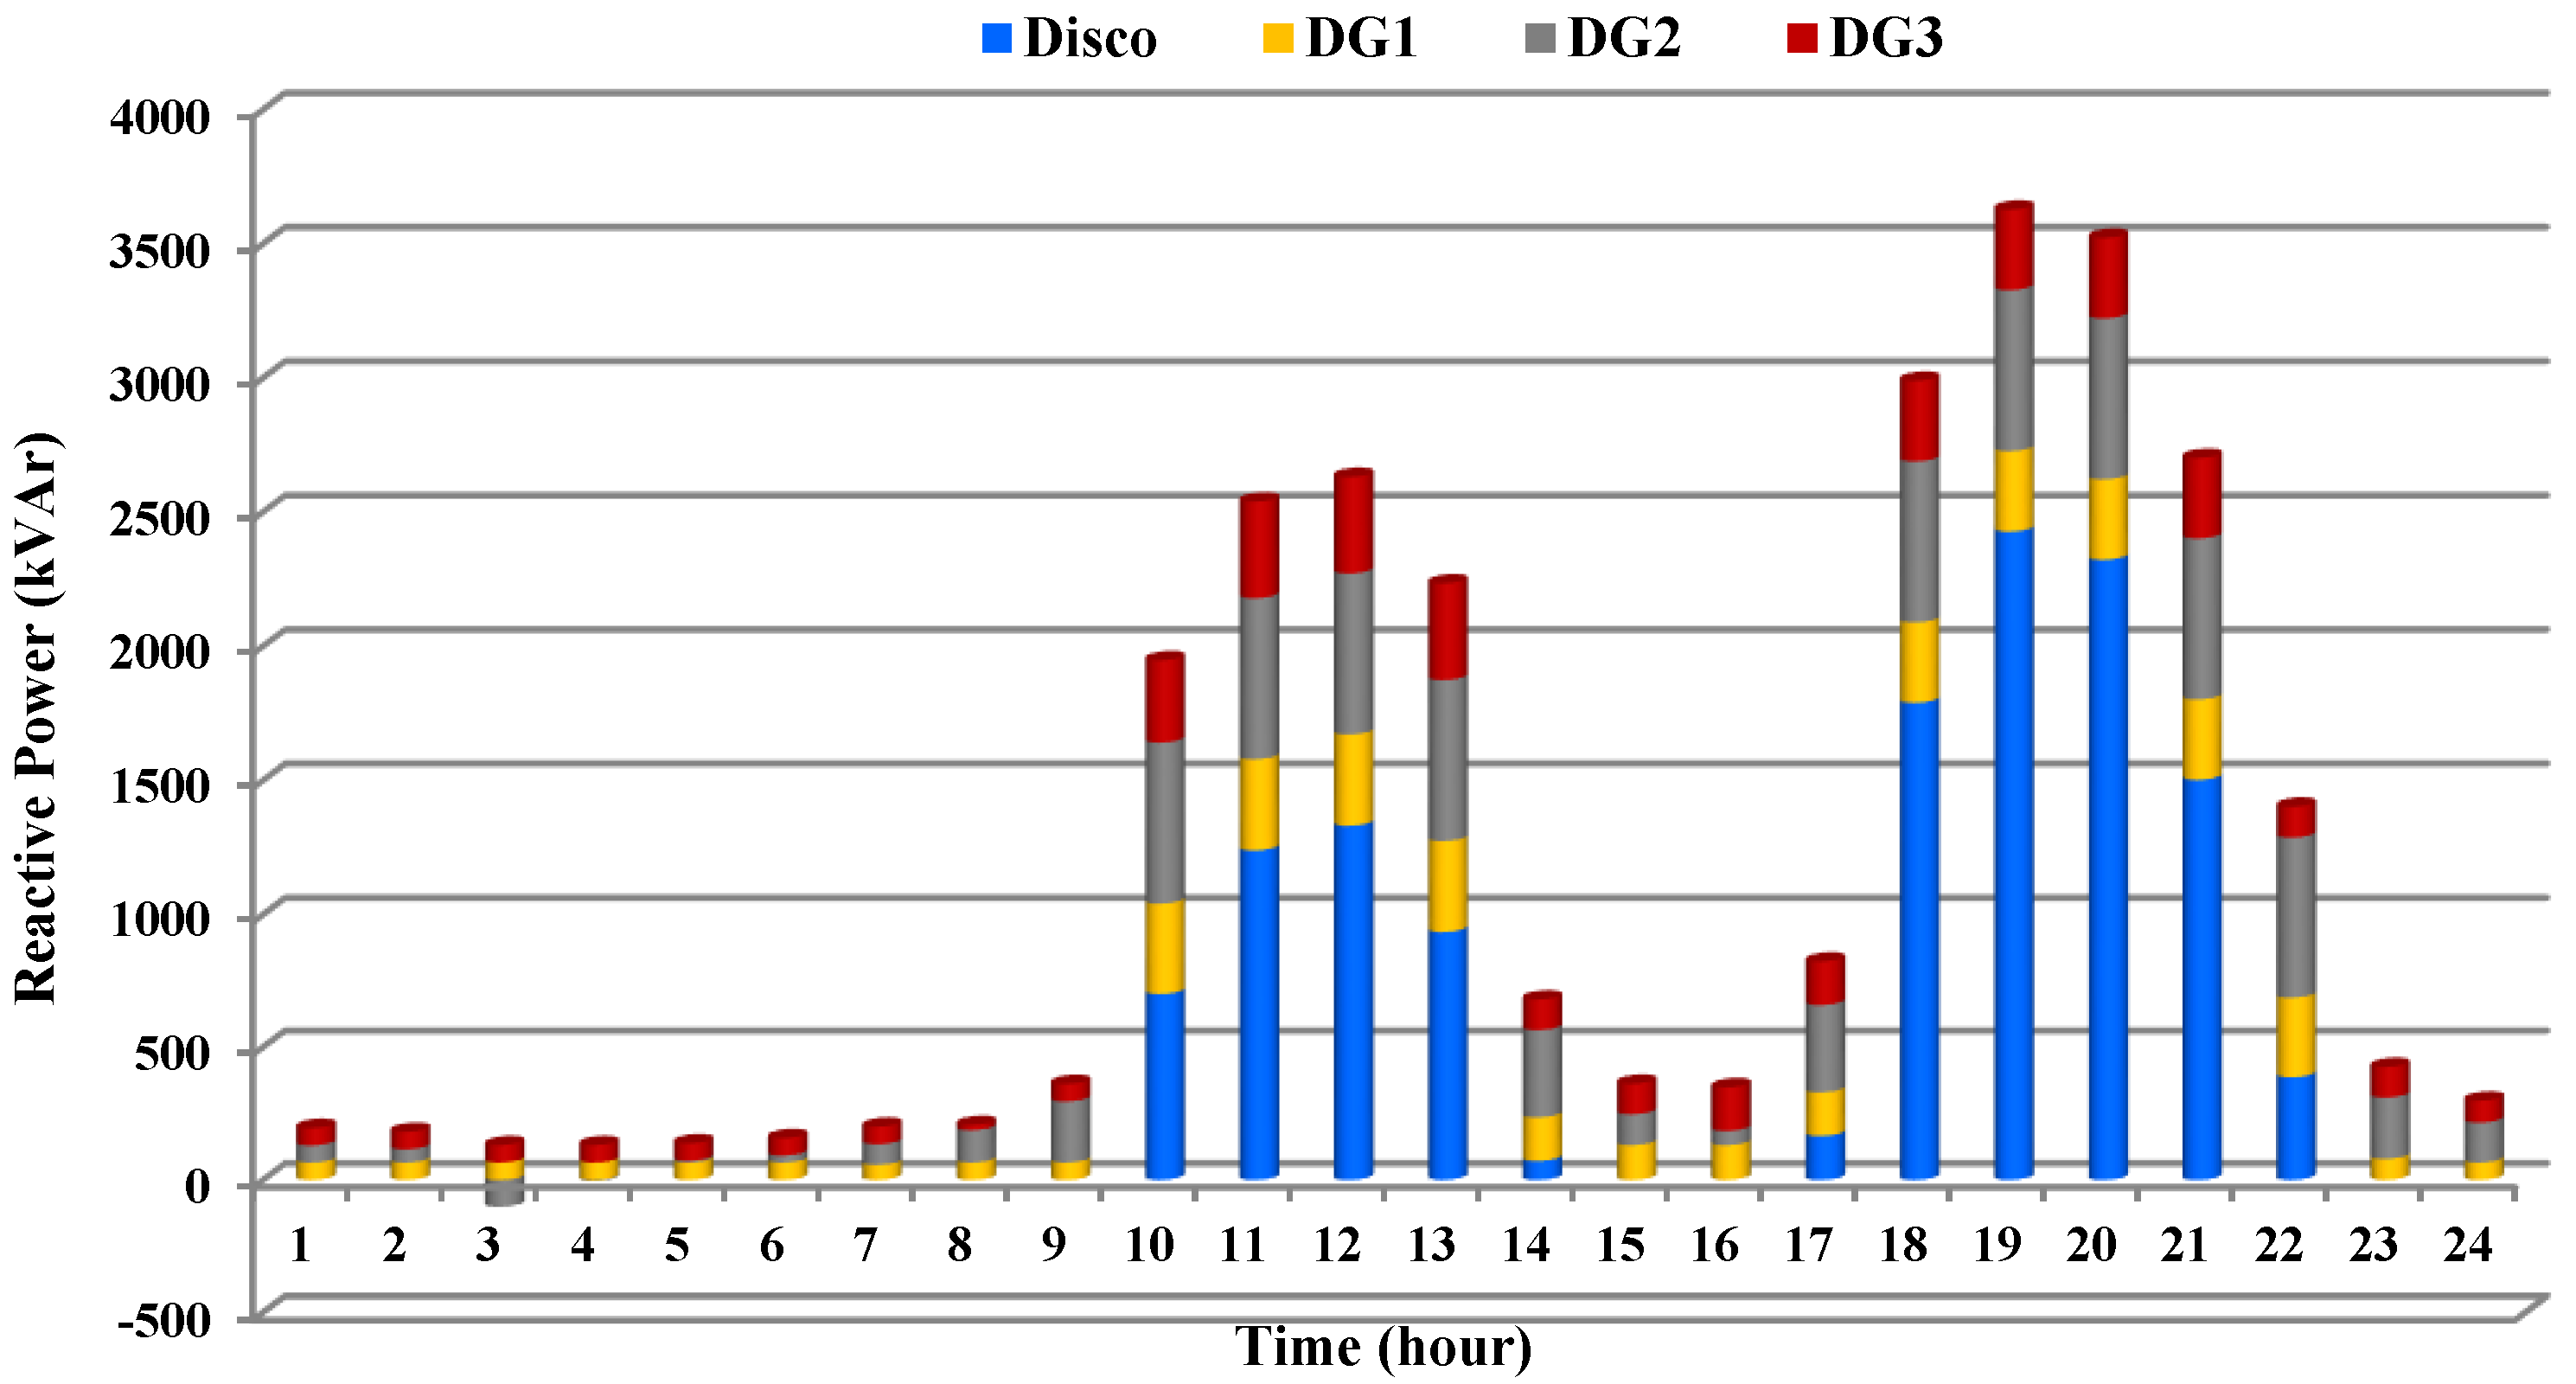
The scheduled active and reactive powers of DGs and Disco are illustrated in Figure 8 and Figure 9, respectively. According to Figure 9, the total reactive power requirement of the system is only delivered by the DGs and capacitors during off-peak hours, i.e., hours 1–9, 15–16, and 23–24. This means that any reactive power will not be purchased from the Disco for the next day during off-peak hours.
Figure 8. Daily optimal active power dispatches of generation units in Scenario 1.
Applsci 06 00004 g008
Figure 9. Daily optimal reactive power dispatches of generation units in Scenario 1.
Applsci 06 00004 g009
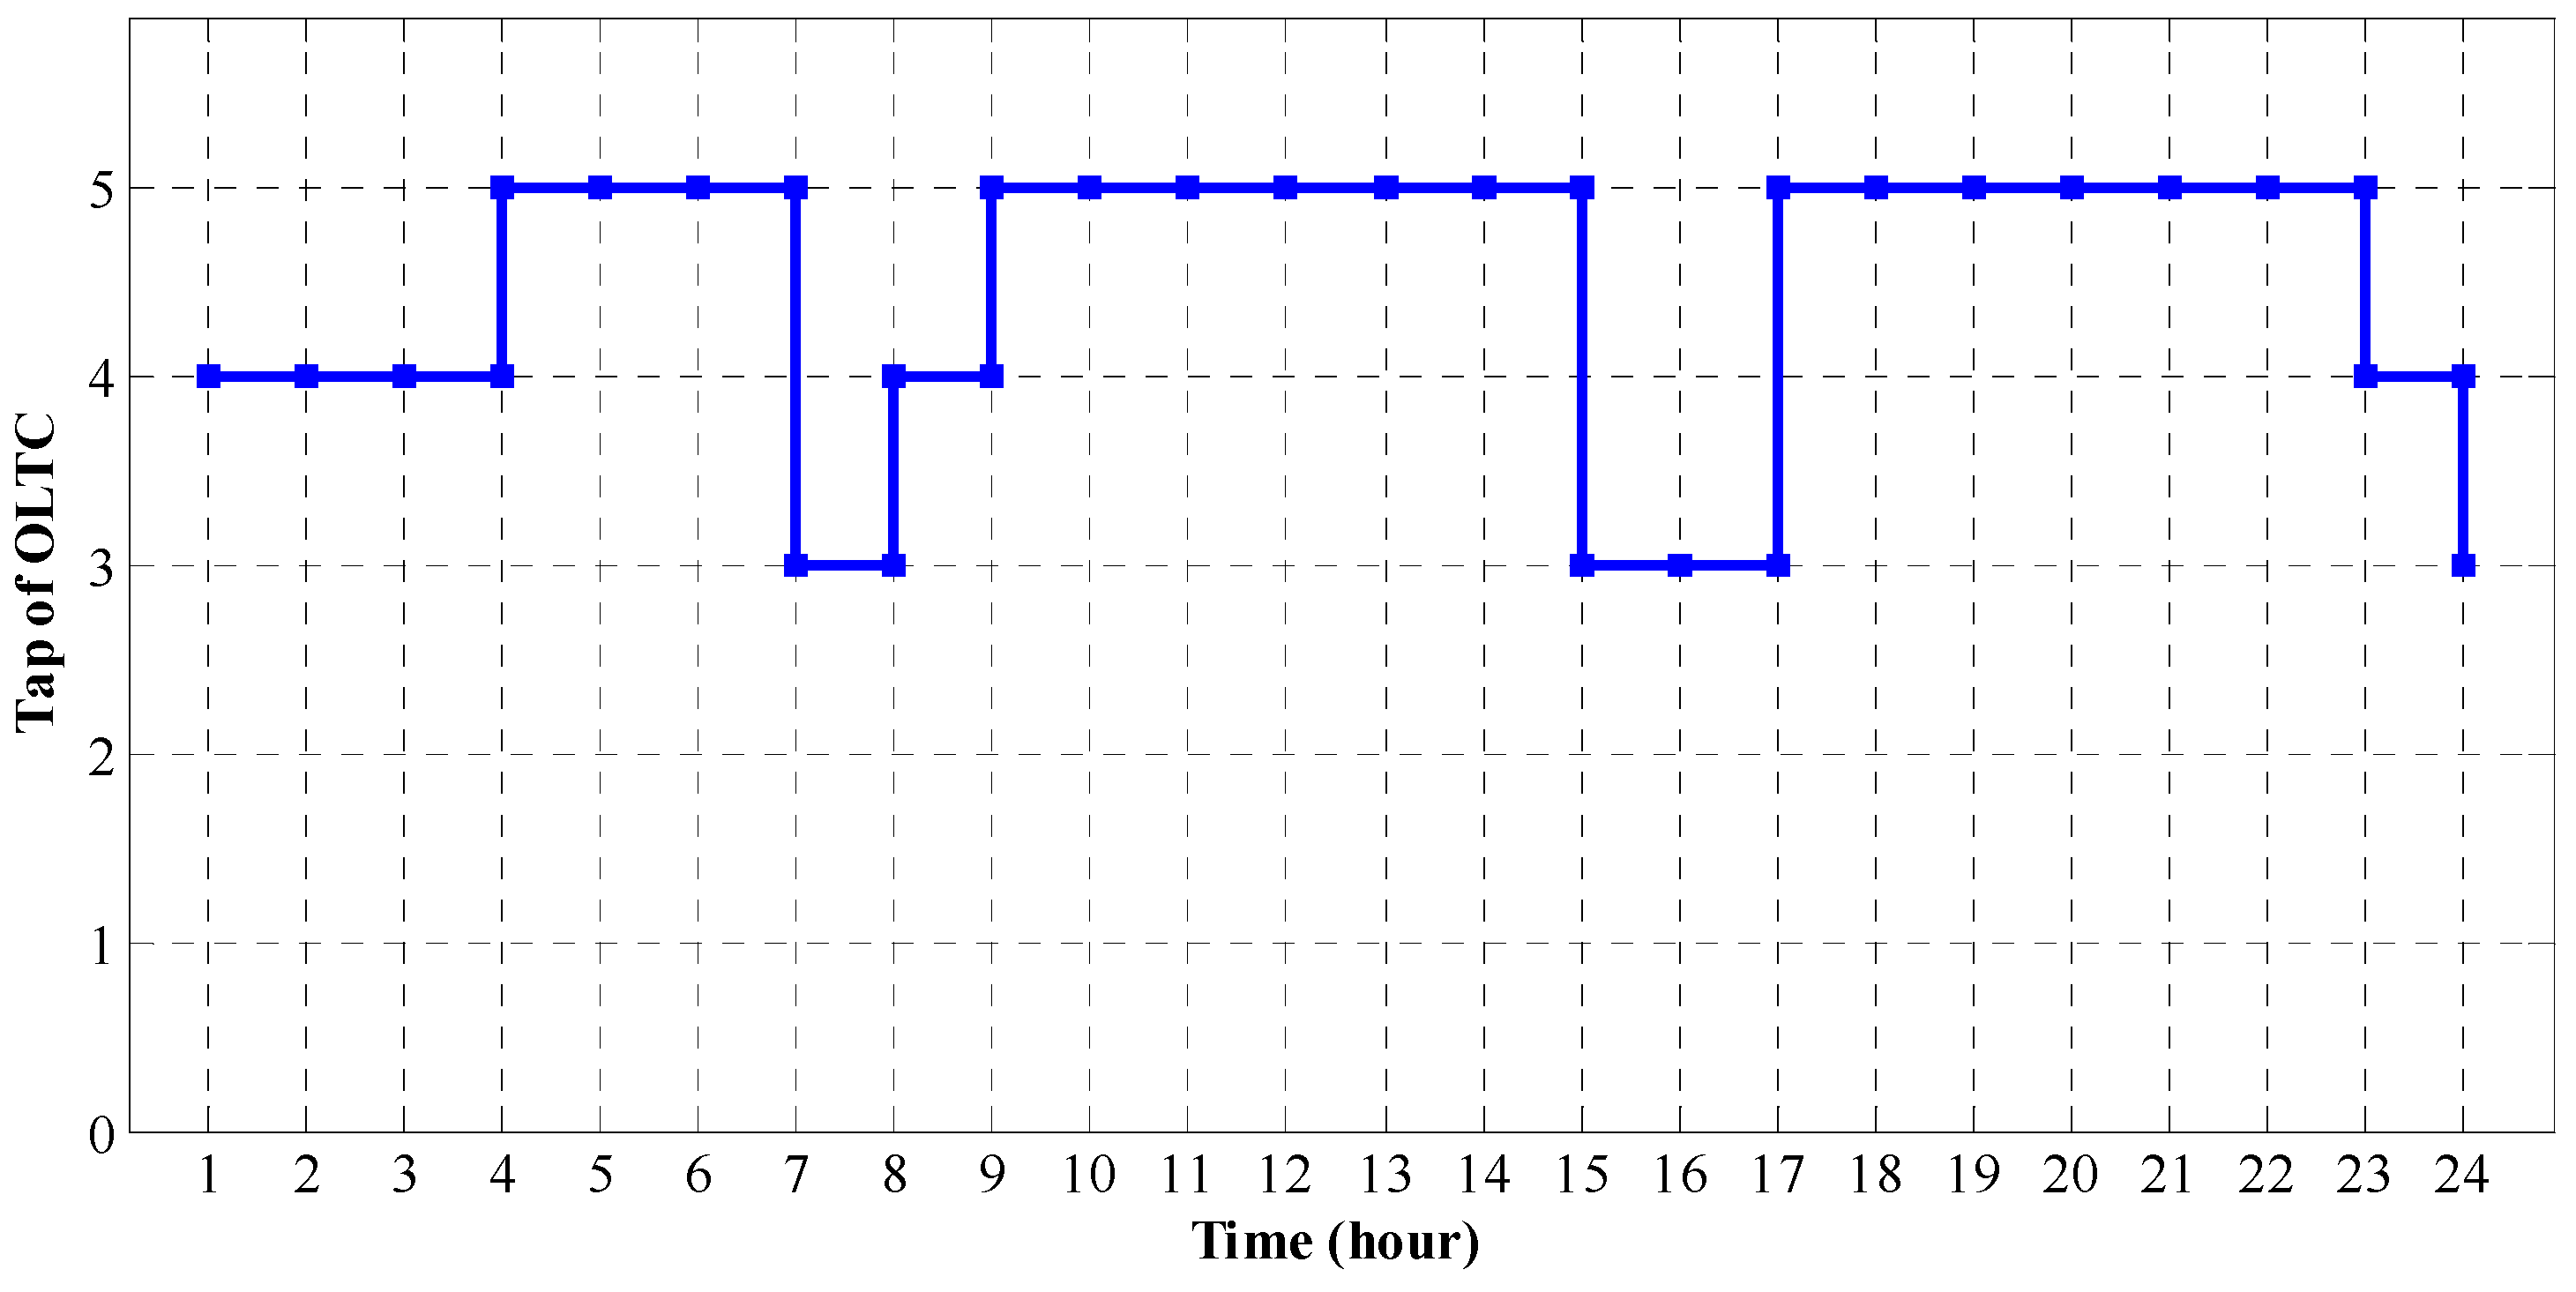
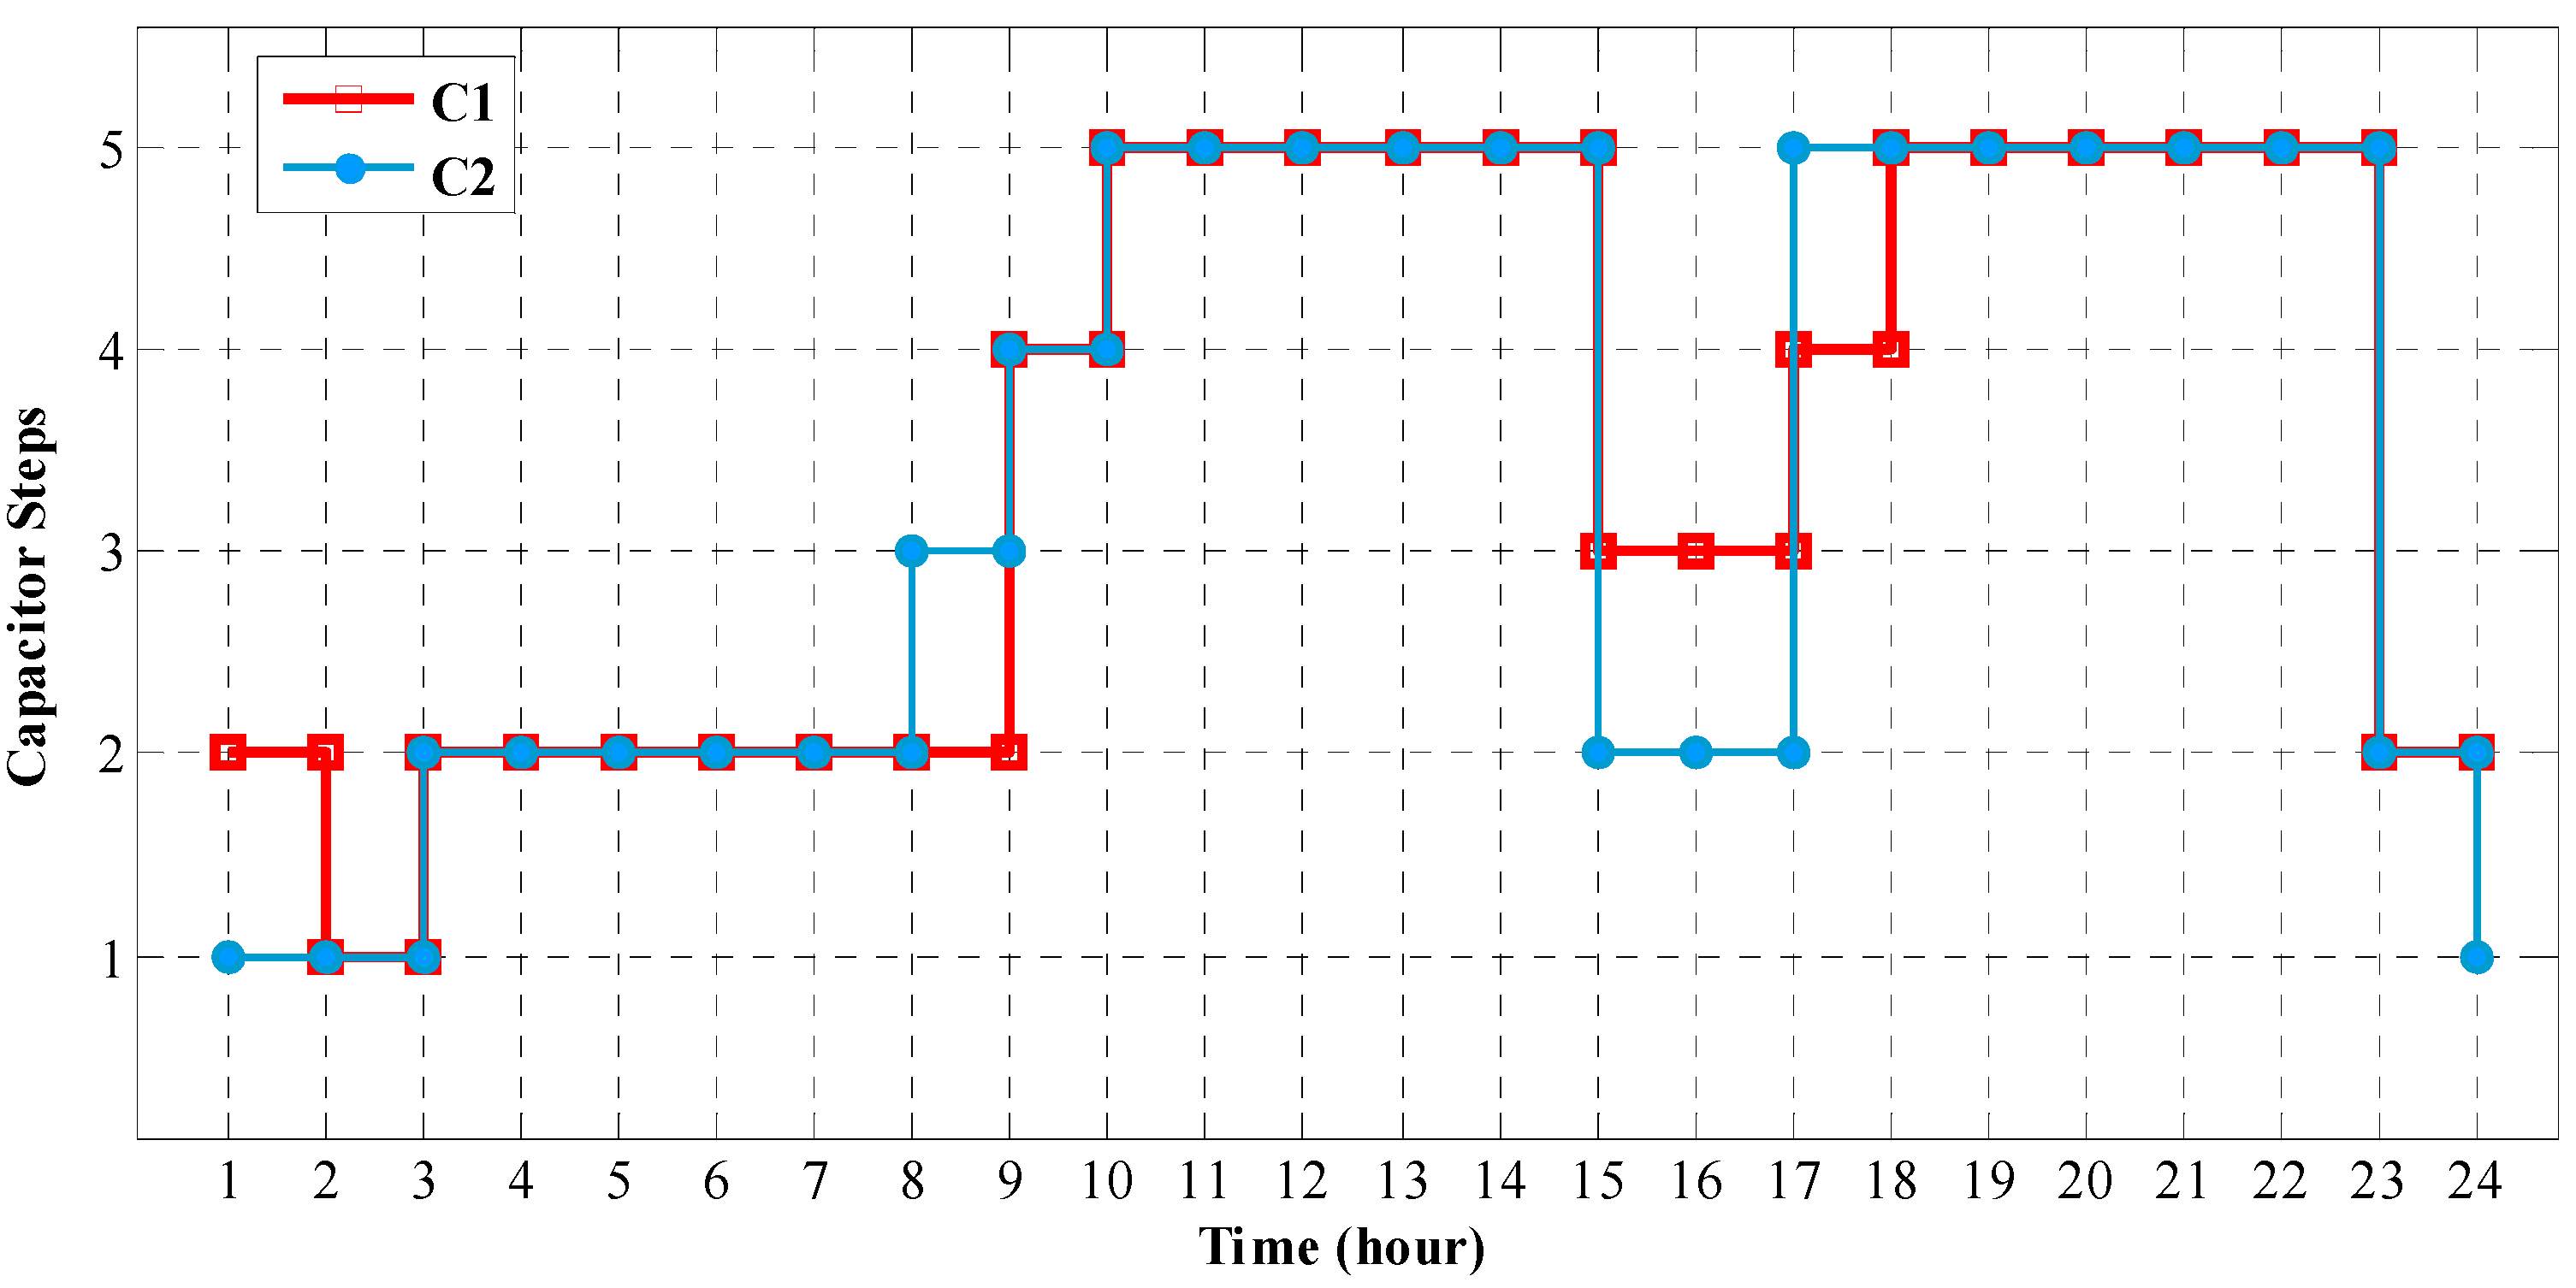
Figure 10 shows the optimal hourly dispatch results of the OLTC. The optimal amount of capacitor steps of C1 and C2 are also given in Figure 11.
Figure 10. Optimal tap positions of OLTC for day-ahead in Scenario 1.
Applsci 06 00004 g010
Figure 11. Optimal dispatches of the capacitors C1 and C2 for day-ahead in Scenario 1.
Applsci 06 00004 g011

5.2. Scenario 2

In this scenario, the maximum available reactive power of Disco is decreased by 2.2 MVAr during the next day. The results of scheduled reactive power of Disco in Scenario 1 demonstrate that a reactive power shortage comes to pass at hours 19–20. Consequently, to compensate this reactive power shortage, DGs are necessary to provide more reactive power compared with the scenario 1. Since the active and reactive powers of DG are coupled via the capability curve, some DGs should reduce scheduled active power for a more reactive power generation. As a result, these DGs should receive the LOC. Table 6 presents the active and reactive power dispatches of generation units at hours 19 and 20 in Scenario 2. The detailed results of cost objective function of the Scenario 2 are presented in Table 7 and Table 8. The objective function is $4935.42 which is higher than Scenario 1. This is due the fact that the QPF of DGs in Scenario 2 comprises the LOC payment as well as two other components. Moreover, due to the operational constraints imposed by Disco, the total energy cost and total reactive power payment are greater comparing to the Scenario 1. It is worth to be mentioned that total payments for the reactive power support by DGs have also increased comparing to the Scenario 1.
Table 6. Optimal active/reactive power dispatches of generation units at hours 19–20 in Scenario 2.
HourDiscoDG1DG2DG3
P (kW)Q (kVAr)P (kW)Q (kVAr)P (kW)Q (kVAr)P (kW)Q (kVAr)
196780.352200316.73373.31622.52750.99350360
206254.652200442.98322.81834.32666.27350360
Table 7. Optimization results of the joint active/reactive power dispatch in Scenario 2.
Components of Objective FunctionDiscoDG1DG2DG3TOTAL
Energy Cost ($)3027.35356.31815.85349.324548.84
Reactive Power Cost ($)200.4242.7986.89356.47386.57
Table 8. The break-down of the QPF of DGs in Scenario 2.
Components of CostDG1DG2DG3
Availability Payment ($)1.631.972.28
Losses Payment ($)21.9442.5628.69
Loss Opportunity Cost (LOC) ($)19.2242.36325.5

6. Conclusions

This paper has presented a new approach based on the joint day-ahead active and reactive power market to schedule active and reactive power in distribution networks in the presence of DGs. In order to encourage DGs to actively participate in the VVC scheme, a multi-component reactive power bidding framework for a DG has been modeled considering the capability curve. Moreover, a new day-ahead active/reactive power market settlement model has been proposed for competitive electricity market in distribution systems. In the proposed scheduling method, active and reactive power markets are settled simultaneously. Due to the coupling between active and reactive power of DGs, in the proposed model, this issue has been addressed by considering the capability diagram of DGs. The optimal solution is searched by a mixed-integer nonlinear programming implemented in GAMS and solved with the DICOPT solver. The methodology has been applied to a 22-bus 20-kV radial distribution test system. The achieved results show the effectiveness of the proposed methodology to minimize the costs and to improve feeders’ voltage profile. It was concluded from the research results that incorporating cost of reactive power support of generation units in the developed model would encourage the DGs to actively contribute in the reactive power support as an ancillary service. In line with this paper, future research is directed to examine the potential of renewable energy resources (solar and wind generation) in VVC problem and to consider the uncertainties related to these generations and market prices in a stochastic programming framework.

Author Contributions

All authors discussed and agreed on the main idea and scientific contribution. Abouzar Samimi did mathematical modeling in the manuscript. Also, Abouzar Samimi performed simulations and wrote simulation sections. Abouzar Samimi and Ahad Kazemi contributed in manuscript writing and revisions.

Conflicts of Interest

The authors declare no conflict of interest.

Nomenclature

NDGtotal number of DGs
Nhtotal number of hours
NBusnumber of buses
LOClost opportunity cost
π D G , i   h   /   π D i s c o h price of the electrical energy offered by the ith DG/Disco for the hth hour
P D i s c o m a x / P D G , i m a x maximum capacity limit of Disco/ith DG
T a p h tap position of OLTC at hth hour
C S t e p i h step position of ith Sh.C at hth hour
T a p m i n ( T a p max ) minimum (maximum) tap position of OLTC
C S t e p i m i n ( C S t e p i m a x ) minimum (maximum) step of ith Sh.C
P G , n h ( P D , n h ) generated (consumed) active power at bus n at hour h
Q G , n h ( Q D , n h ) generated (consumed) reactive power at bus n at hour h
Q c a p , i maximum available reactive power of ith DG in a scheduled active power P D G , i
V n h voltage of bus n at hour h
P D i s c o i n i , h /   P D G , i i n i , h initially scheduled active power of Disco/ith DG at hth hour
P D i s c o h / P D G , i h active power dispatch of Disco/ith DG at hth hour
x D G , i m a x maximum changes regarding the initial active power admitted by ith DG
ρ A d j h D i s c o / ρ A d j h D G , i adjustment price offered by Disco/ith DG at hth hour
Q D i s c o   h / Q D G , i h generated reactive power by Disco/ith DG at hth hour
ρ Q , D i s c o h reactive bid price offered by Disco at hth hour
T a p   r a t i o tap ratio of OLTC

References

  1. Park, J.Y.; Nam, S.R.; Park, J.K. Control of a ULTC considering the dispatch schedule of capacitors in a distribution system. IEEE Trans. Power Syst. 2007, 22, 755–761. [Google Scholar]
  2. Liang, R.H.; Wang, Y.S. Fuzzy-based reactive power and voltage control in a distribution system. IEEE Trans. Power Deliv. 2003, 18, 610–618. [Google Scholar]
  3. Rueda-Medina, A.C.; Padilha-Feltrin, A. Distributed generators as providers of reactive power support—A market approach. IEEE Trans. Power Syst. 2013, 28, 490–502. [Google Scholar]
  4. Kim, Y.J.; Ahn, S.J.; Hwang, P.I.; Pyo, G.C.; Moon, S.I. Coordinated Control of a DG and Voltage Control Devices Using a Dynamic Programming Algorithm. IEEE Trans. Power Syst. 2013, 28, 42–51. [Google Scholar]
  5. Zakariazadeh, A.; Jadid, S.; Siano, P. Economic-environmental energy and reserve scheduling of smart distribution systems: A multiobjective mathematical programming approach. Energy Convers. Manag. 2014, 78, 151–164. [Google Scholar]
  6. Al Abri, R.S.; El-Saadany, E.F.; Atwa, Y.M. Optimal placement and sizing method to improve the voltage stability margin in a distribution system using distributed generation. IEEE Trans. Power Syst. 2013, 28, 326–334. [Google Scholar] [CrossRef]
  7. Niknam, T.; Firouzi, B.; Ostadi, A. A new fuzzy adaptive particle swarm optimization for daily Volt/Var control in distribution networks considering distributed generators. Appl. Energy 2010, 87, 1919–1928. [Google Scholar] [CrossRef]
  8. Niknam, T. A new HBMO algorithm for multiobjective daily Volt/Var control in distribution systems considering distributed generators. Appl. Energy 2011, 88, 778–788. [Google Scholar] [CrossRef]
  9. Madureira, A.G.; Lopes, J.A.P. Coordinated voltage support in distribution networks with distributed generation and microgrids. IET Renew. Power Gener. 2009, 3, 439–454. [Google Scholar] [CrossRef]
  10. Borghetti, A. Using mixed integer programming for the Volt/Var optimization in distribution feeders. Electr. Power Syst. Res. 2013, 98, 39–50. [Google Scholar] [CrossRef]
  11. Paaso, E.A.; Liao, Y.; Cramer, A.M. Formulation and solution of distribution system voltage and VAR control with distributed generation as a mixed integer non-linear programming problem. Electr. Power Syst. Res. 2014, 108, 164–169. [Google Scholar] [CrossRef]
  12. Azimi, R.; Esmaeili, S. Multiobjective daily Volt/Var control in distribution systems with distributed generation using binary ant colony optimization. Turkish J. Electr. Eng. Comput. Sci. 2013, 21, 613–629. [Google Scholar]
  13. Viawan, F.; Karlsson, D. Combined local and remote voltage and reactive power control in the presence of induction machine distributed generation. IEEE Trans. Power Syst. 2007, 22, 2003–2012. [Google Scholar] [CrossRef]
  14. Elkhatib, M.E.; Shatshat, R.E.; Salama, M.M.A. Decentralized Reactive Power Control for Advanced Distribution Automation Systems. IEEE Trans. Smart Grid 2012, 3, 1482–1490. [Google Scholar] [CrossRef]
  15. Homaee, O.; Zakariazadeh, A.; Jadid, S. Real-time voltage control algorithm with switched capacitors in smart distribution system in presence of renewable generations. Int. J. Electr. Power Energy Syst. 2014, 54, 187–197. [Google Scholar] [CrossRef]
  16. Hasanpour, S.; Ghazi, R.; Javidi, M.H. A new approach for cost allocation and reactive power pricing in a deregulated environment. Electr. Eng. 2009, 19, 27–34. [Google Scholar] [CrossRef]
  17. Bhattacharya, K.; Zhong, J. Reactive power as an ancillary service. IEEE Trans. Power Syst. 2001, 16, 294–300. [Google Scholar] [CrossRef]
  18. Zhong, J.; Bhattacharya, K. Toward a competitive market for reactive power. IEEE Trans. Power Syst. 2002, 17, 1206–1215. [Google Scholar] [CrossRef]
  19. Amjady, N.; Rabiee, A.; Shayanfar, H.A. Pay-as-bid based reactive power market. Energy Conver. Manag. 2010, 51, 376–381. [Google Scholar] [CrossRef]
  20. Madureira, A.G.; Lopes, J.A.P. Ancillary services market framework for voltage control in distribution networks with microgrids. Electr. Power Syst. Res. 2012, 86, 1–7. [Google Scholar] [CrossRef]
  21. Samimi, A.; Kazemi, A. A New Approach to Optimal Allocation of Reactive Power Ancillary Service in Distribution Systems in the Presence of Distributed Energy Resources. Appl. Sci. 2015, 5, 1284–1309. [Google Scholar] [CrossRef]
  22. Zare, M.; Niknam, T. A new multi-objective for environmental and economic management of Volt/Var Control considering renewable energy resources. Energy 2013, 55, 236–252. [Google Scholar] [CrossRef]
  23. Caldon, R.; Rossetto, F.; Scala, A. Reactive power control in distribution networks with dispersed generators: A cost based method. Electr. Power Syst. Res. 2003, 64, 209–217. [Google Scholar] [CrossRef]
  24. Jimenez-Estevez, G.A.; Palma-Behnke, R.; Torres-Avila, R.; Vargas, L.S. A Competitive Market Integration Model for Distributed Generation. IEEE Trans. Power Syst. 2007, 22, 2161–2169. [Google Scholar] [CrossRef]
  25. Siano, P.; Mokryani, G. Assessing Wind Turbines Placement in a Distribution Market Environment by Using Particle Swarm Optimization. IEEE Trans. Power Syst. 2013, 28, 3852–3864. [Google Scholar] [CrossRef]
  26. Li, H.; Li, Y.; Li, Z. A Multiperiod Energy Acquisition Model for a Distribution Company with Distributed Generation and Interruptible Load. IEEE Trans. Power Syst. 2007, 22, 588–596. [Google Scholar] [CrossRef]
  27. Mokryani, G.; Siano, P. Combined Monte Carlo simulation and OPF for wind turbines integration into distribution networks. Electr. Power Syst. Res. 2013, 103, 37–48. [Google Scholar] [CrossRef]
  28. Sousa, T.; Morais, H.; Vale, Z.; Castro, R. A multi-objective optimization of the active and reactive resource scheduling at a distribution level in a smart grid context. Energy 2015, 85, 236–250. [Google Scholar] [CrossRef]
  29. Samimi, A.; Kazemi, A.; Siano, P. Economic-environmental active and reactive power scheduling of modern distribution systems in presence of wind generations: A distribution market-based approach. Energy Conver. Manag. 2015, 106, 495–509. [Google Scholar] [CrossRef]
  30. Vardakas, J.S.; Zorba, N.; Verikoukis, C.V. Performance evaluation of power demand scheduling scenarios in a smart grid environment. Appl. Energy 2015, 142, 164–178. [Google Scholar] [CrossRef]
  31. Vardakas, J.S.; Zorba, N.; Verikoukis, C.V. A Survey on Demand Response Programs in Smart Grids: Pricing Methods and Optimization Algorithms. Commun. Surv. Tutor. IEEE 2015, 17, 152–178. [Google Scholar] [CrossRef]
  32. Reddy, S.S.; Abhyankar, A.R.; Bijwe, P.R. Reactive power price clearing using multi-objective optimization. Energy 2011, 36, 3579–3589. [Google Scholar] [CrossRef]
  33. Zhong, J.; Nobile, E.; Bose, A.; Bhattacharya, K. Localized reactive power markets using the concept of voltage control areas. IEEE Trans. Power Syst. 2004, 19, 1555–1561. [Google Scholar] [CrossRef] [Green Version]
  34. Saraswat, A.; Saini, A.; Saxena, A.K. A novel multi-zone reactive power market settlement model: A pareto-optimization approach. Energy 2013, 51, 85–100. [Google Scholar] [CrossRef]
  35. Mousavi, O.A.; Bozorg, M.; Cherkaoui, R. Preventive reactive power management for improving voltage stability margin. Electr. Power Syst. Res. 2013, 96, 36–46. [Google Scholar] [CrossRef]
  36. Ahmadi, H.; Foroud, A.A. Joint energy and reactive power market considering coupled active and reactive reserve market ensuring system security. Arab. J. Sci. Eng. 2014, 39, 4789–4804. [Google Scholar] [CrossRef]
  37. Martinez-Rojas, M.; Sumper, A.; Gomis-Bellmunt, O.; Sudrià-Andreu, A. Reactive power dispatch in wind farms using particle swarm optimization technique and feasible solutions search. Appl. Energy 2011, 88, 4678–4686. [Google Scholar] [CrossRef]
  38. Gomes, M.H.; Saraiva, J.T. Allocation of reactive power support, active loss balancing and demand interruption ancillary services in MicroGrids. Electr. Power Syst. Res. 2010, 80, 1267–1276. [Google Scholar] [CrossRef]
  39. Gomes, M.H.; Saraiva, J.T. A market based active/reactive dispatch including transformer taps and reactor and capacitor banks using Simulated Annealing. Electr. Power Syst. Res. 2009, 79, 959–972. [Google Scholar] [CrossRef]
  40. Gomes, M.H.R.; Saraiva, J.T. Active/reactive bid based dispatch models to be used in electricity markets. Electr. Power Syst. Res. 2008, 78, 106–121. [Google Scholar] [CrossRef]

