
Simulation of Gas Fracturing in Reservoirs Based on a Coupled Thermo-Hydro-Mechanical-Damage Model


1
State Key Laboratory of Eco-Hydraulics in Northwest Arid Region, School of Civil Engineering and Architecture, Xi’an University of Technology, Xi’an 710048, China
2
International Joint Research Laboratory of Henan Province for Underground Space Development and Disaster Prevention, Henan Polytechnic University, Jiaozuo 454003, China
3
College of Energy Engineering, Xi’an University of Science and Technology, Xi’an 710054, China
4
School of Mechanics and Civil Engineering, China University of Mining and Technology, Xuzhou 221116, China
*
Author to whom correspondence should be addressed.
Appl. Sci. 2024, 14(5), 1763; https://doi.org/10.3390/app14051763
Submission received: 19 January 2024
/
Revised: 7 February 2024
/
Accepted: 8 February 2024
/
Published: 21 February 2024
(This article belongs to the Special Issue Rock Mass Characterization: Failure and Mechanical Behavior)
Abstract
:Gas fracturing technology for enhancing rock permeability is an area with considerable potential for development. However, the complexity and variability of underground conditions mean that a variety of rock physical parameters can affect the outcome of gas fracturing, with temperature being a critical factor that cannot be overlooked. The presence of a temperature field adds further complexity to the process of gas-induced rock fracturing. To explore the effects of temperature fields on gas fracturing technology, this paper employs numerical simulation software to model the extraction of shale gas under different temperature conditions using gas fracturing techniques. The computer simulations monitor variations in the mechanical characteristics of rocks during the process of gas fracturing. This analysis is performed both prior to and following the implementation of a temperature field. The results demonstrate that gas fracturing technology significantly improves rock permeability; temperature has an impact on the effectiveness of gas fracturing, with appropriately high temperatures capable of enhancing the fracturing effect. The temperature distribution plays a crucial role in influencing the results of gas fracturing. When the temperature is low, the fracturing effect is diminished, resulting in a lower efficiency of shale gas extraction. Conversely, when the temperature is high, the fracturing effect is more pronounced, leading to a higher shale gas production efficiency. Optimal temperatures can enhance the efficacy of gas fracturing and consequently boost the efficiency of shale gas extraction. Changes in the parameters of the rock have a substantial impact on the efficiency of gas extraction, and selecting suitable rock parameters can enhance the recovery rate of shale gas. This paper, through numerical simulation, investigates the influence of temperature on gas fracturing technology, with the aim of contributing to its improved application in engineering practices.
1. Introduction
With the rapid advancement of China’s modernization process, the challenge of energy supply has become increasingly significant. Current production levels of conventional oil and gas resources are insufficient to meet domestic demands. To resolve this energy crisis, identifying alternative energy sources has emerged as a pressing priority. Shale gas, as a form of clean energy, has abundant reserves within China. Compared to coal, shale gas combustion produces lower emissions of CO2 and other pollutants per unit of energy. As a clean energy source, it facilitates the transition of the energy structure towards cleaner alternatives. The exploration and utilization of shale gas could not only effectively alleviate China’s energy strain but also contribute significantly to the mitigation of environmental pollution. Consequently, the extraction technologies associated with shale gas have attracted extensive attention across the country. Shale gas is contained within the rock matrix, where the rock is typically hard and has low permeability, which significantly complicates the extraction process. In order to efficiently extract shale gas from these rocks with low permeability, various techniques are commonly utilized to enhance permeability [1,2,3]. In light of recent advancements in industrial technology, the integration of horizontal drilling and hydraulic fracturing has emerged as a viable strategy for the exploitation of unconventional energy resources [4,5,6]. The activation of newly generated fractures or pre-existing natural fractures through high-pressure water can vastly improve the permeability of reservoirs. As a crucial technique for enhancing production in oil and gas wells, hydraulic fracturing has a remarkably positive impact on boosting the output of individual wells, owing to its ease of operation, low costs, and outstanding fracturing efficiency. The creation of new fractures or reactivation of pre-existing natural fractures can greatly increase the connectivity within the rock formations, enabling trapped hydrocarbons to flow more freely to the surface. As such, hydraulic fracturing has become an indispensable technology in the oil and gas industry, playing a key role in unlocking previously inaccessible reserves and maximizing the economic value of these resources [7]. Nevertheless, the substantial water requirements associated with hydraulic fracturing have raised a host of environmental concerns. Foremost among these is the potential for significant pollution and ecological degradation of groundwater caused by the use of chemical additives, which can have adverse effects on the local populations’ livelihoods and quality of life [8]. Moreover, the injection of fluids has the potential to generate microfractures within the rock formation, thereby rendering them more susceptible to inter-slip and effectively “lubricating” their mobility [9]. Furthermore, when faults are subjected to excessive pressure, it can easily trigger seismic events. Additionally, the occurrence of water blockage hampers the desorption rate of gas in the reservoir matrix, resulting in decreased extraction efficiency [10]. The implementation of hydraulic measures frequently leads to water infiltration in the coal mass, which can be difficult to eliminate and gives rise to a “water blockage” effect that considerably reduces the permeability of the coal seam. Lastly, hydraulic fracturing encounters difficulties in water-scarce regions. The major shale gas reservoirs in China are predominantly located in arid and semi-arid regions, posing significant limitations on the extensive industrial development of coalbed methane. Consequently, waterless fracturing technologies have emerged as a focal point, with gas fracturing technology attracting widespread attention as an environmentally friendly, waterless fracturing technique.
The enhancement of permeability through gas fracturing involves two primary methods. The first method utilizes liquefied carbon dioxide or liquid nitrogen, which, when heated, undergoes a phase change and expansion, leading to high-pressure gas fracturing that increases permeability. The second method involves the use of a pressure device to directly generate high-pressure gas for fracturing and permeability enhancement. It can be combined with various approaches to create fractures in the reservoir. One example of a technique to increase the flow capacity of the mining area and adjacent strata and facilitate the extraction of coalbed methane is through the application of high-temperature gas, high-pressure gas, or periodic gas impacts [11,12]. The use of gas fracturing can circumvent the detrimental impacts resulting from water presence. Throughout the process of fracturing, the gas has the ability to transition into the gaseous phase, thereby mitigating the effects of capillary pressure. In their research, Cai et al. [13,14] employed nuclear magnetic resonance, acoustic emission (AE), and uniaxial compression tests, and demonstrated that gas fracturing has the potential to stimulate the expansion of micropores and enhance the connectivity of coal pore structures, leading to heightened permeability and decreased strength. Li et al. [15] studied the influence of gas fracturing on microcracks in coal. Zhai et al. [16] investigated the evolution characteristics of pore structure in coal after gas fracturing. Currently, fracturing operations commonly utilize pure gases as fracturing fluids, with CO2, N2, and liquefied petroleum gas (LPG) being the most prevalent options [17,18,19,20]. In recent years, scholars have conducted research on various gas fracturing media.
However, the underground conditions are complex, and different regions have varying geological conditions, which has led to a lack of a comprehensive consensus on gas fracturing technology to date [21,22,23,24,25,26]. Furthermore, the physical and environmental conditions of rocks can impact the effectiveness of gas fracturing, and rocks often exhibit higher temperatures [27,28,29]. Therefore, it is vital to factor in the impact of temperature on the efficiency of gas fracturing, as emphasized in previous research [30,31]. This study aimed to investigate the influence of temperature on gas pressure fracturing. To achieve this, numerical simulations were conducted to simulate and calculate the effects of temperature before and after incorporating the temperature field. Based on this, a thermal-fluid-solid-damage coupled model of reservoir gas fracturing was established using the COMSOL Multiphysics 6.0 in conjunction with research methods. Shale gas was approximated as a type of fluid, following Darcy’s law, and boundary conditions were set around the unit cell, with pressure simulating gas pressure at the wellhead. As time progressed, the gas-induced fracturing cracks gradually extended from the circular orifice to the periphery of the unit cell, eventually leading to failure of the unit cell [32]. Through the aforementioned simulation experiments, we aim to contribute to the research on gas pressure fracturing technology.
2. The Mechanism of Hydraulic Fracturing under Temperature Field
2.1. Mechanical Equilibrium under Temperature Field
The element used for simulation is regarded as an isotropic linear poroelastic medium, and its constitutive relation can be expressed as:
where “K” represents the bulk modulus of the material, “G” denotes the shear modulus of the material, while “μ” refers to the Poisson’s ratio of the material, p is the gas pressure, T is the ambient temperature, is the Kronegger constant, the subscript “i” represents the index, and when “i” equals “j”, it represents the Kronecker delta. α is the Biot coefficient of the material, ε is the strain tensor of the material, σ is the stress tensor on the unit cell, and εg is the volumetric strain that occurs when coalbed gas undergoes adsorption.
In this case, the equilibrium equation and strain-displacement relationship of the element can be expressed as:
In Equation (1), it can be obtained that the volumetric strain of the element body can be expressed by the following formula
where, represents the volumetric strain of the material and is the effective stress of the applied principal stress material, .
Due to the adsorption and desorption of the gas, it is assumed that the volumetric strain of the gas reservoir in this case is defined by:
where, is the content of the gas adsorbed in the gas reservoir and is the volumetric strain coefficient of the gas reservoir when adsorption occurs.
Under the combination of Equations (3)–(5), and then according to the change of stress and pore gas pressure of the gas reservoir, the Navier equation of the gas reservoir under the condition of adsorption can be obtained.
2.2. The Equation for Gas Equilibrium under the Action of a Temperature Field
It is assumed that the numerical simulation model is constructed consisting of a solid matrix containing freely diffusible pore gases and pore spaces. Under these conditions, the mass balance equation for the gas can be expressed as follows:
where, is the amount of gas, is the density of the gas, is the Darcy velocity of the gas, is the gas source, and is the time.
The amount of methane gas in the solid matrix can be described as:
where, is the porosity of the solid matrix, is the density of the gas under the standard condition, is the density of the solid matrix, and is the content of the adsorbed gas.
The content of adsorbed gas Vsg can be calculated by:
In Equation (9), Tar denotes the absolute reference temperature of the rock formation in the absence of stress, while Tt signifies the temperature reference for gas adsorption/desorption experiments. Therefore, (Tar + T) represents the overall temperature of the rock formation. c1 denotes the pressure coefficient, while c2 represents the temperature coefficient.
For ideal gases, it is usually expressed by the ideal gas equation:
where, is the density of the gas, p is the gas pressure, and Mg is the molar mass of the gas.
The density of a gas in the standard state can be deduced from the ideal gas equation, which can be denoted by (11):
The gas flow equation incorporating the non-Darcy Forchheimer model is employed.
where, is the permeability of the medium, is the dynamic viscous velocity of the gas, p is the gas pressure, is the absolute value of the velocity vector, and is the density of the gas mixture. is the drag coefficient, which is dimensionless and represented as:
Equation (12) can be alternatively expressed in a form that aligns with Darcy’s law:
where, is the correction factor to which Darcy’s law applies, which is defined as:
For models that generally include porosity, there are:
Regarding Equation (16), we can perform a transformation to obtain Equations (17) and (18):
where the subscript 0 in the equation represents the initial state of the corresponding variable.
Substituting Equation (4) into Equation (18) yields:
The effective permeability of a gas depends on the gas pressure to which the gas is subjected, as shown in Equation (20)
where, represents the gas permeability under extremely high gas pressure, where the Klinkenberg effect can be neglected. The parameter “b” in the equation is the Klinkenberg factor, which depends on the average free path of gas molecules. The relative mean free path of gas molecules is influenced by factors such as gas pressure, gas temperature, and molar mass. Thus, the factor “b” can be mathematically represented by Equation (21).
The coefficient in the equation has been determined through data research.
The permeability of the rock formations varies as follows:
By substituting Equation (17) through (22) step by step into Equation (16):
2.3. Consideration of Energy Conservation under the Influence of Temperature Field
Ignoring the thermal filtration effect in the calculation, this allows the total heat flux in the rock formation to be defined as:
where, stands for heat flow, Cg is the specific heat constant of the gas at a fixed volume, is the Darcy velocity of the gas, and , , , and are the thermal conductivity, solid and gas components of rock formations, respectively.
During the calculation process, neglecting the mutual conversion between thermal energy and mechanical energy in the rock formation, the thermal balance can be represented as follows:
where Cg and Cs are the thermal constant of a gas and the thermal constant of a solid in a fixed volume, and is the thermal expansion coefficient of a gas when both pore pressure and stress are maintained at constant levels. Kg = p, and = 1/T.
From this, the relationship between the conservation of mass of the solid phase and the gas phase in the rock formation can be obtained.
Considering ≫ and , these two relationships are corrected to get:
3. Model Establishment
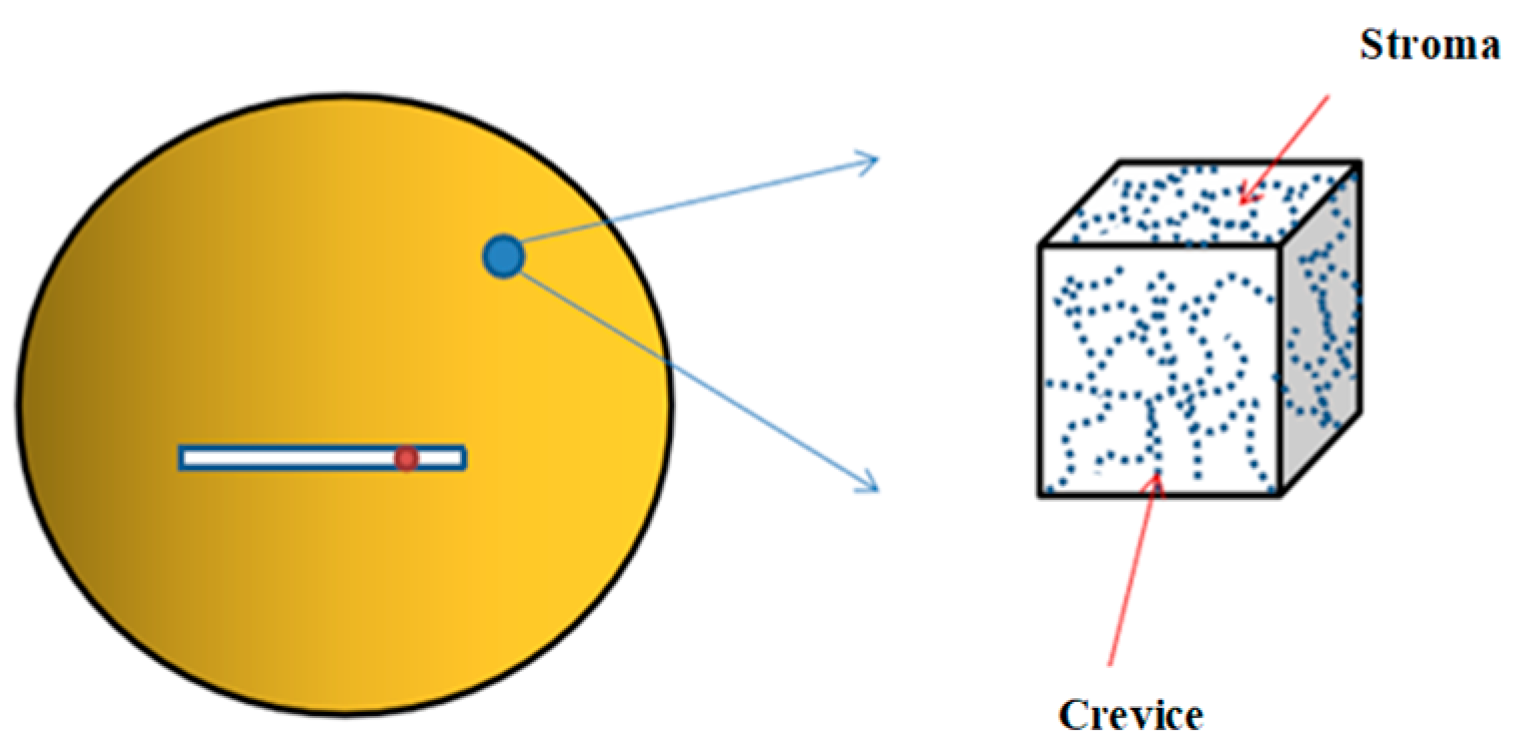
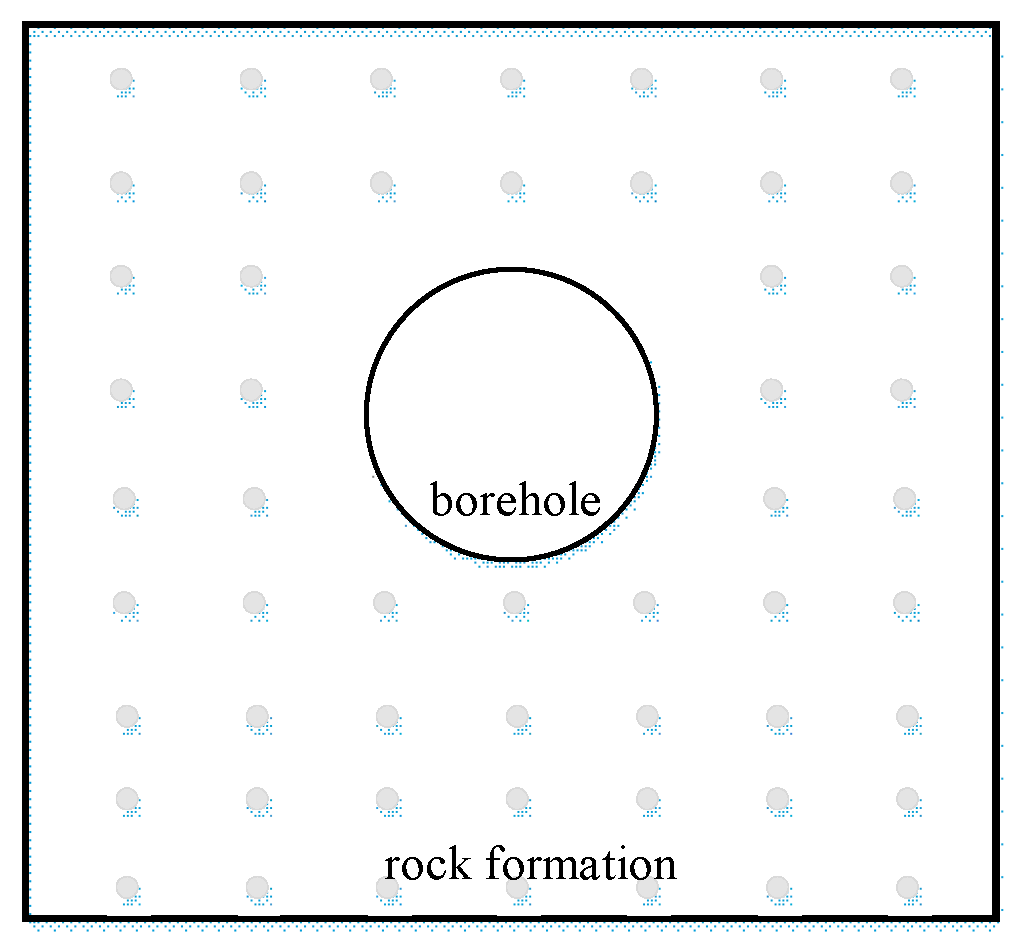
Due to the difficulty of conducting experiments using physical models, the experiment utilizes COMSOL Multiphysics 6.0 to establish a 1 × 1 m cubic unit cell as a substitute for the physical model, as shown in Figure 1. This unit cell contains a circular hole with a radius of 0.1 m to simulate the shale gas reservoir penetrated by a horizontal well due to gas pressure-induced fracturing. The shale gas is approximated as a type of fluid that complies with Darcy’s law. Boundary conditions are set around the unit cell, with pressure simulated at the wellbore perimeter, as shown in Figure 2. As time progresses, the pressure-induced fractures generated by the gas will gradually propagate from the perimeter of the circular hole to the outer periphery of the unit cell, eventually leading to the failure of the unit cell. The shale gas within the unit cell will be gradually extracted as the fractures develop, and the relationship between gas content and instantaneous extraction rate can be obtained through simulation. Furthermore, during the simulation, it is possible to alter parameters such as the rock mass permeability, gas density, and unit cell temperature to obtain data on the speed and process of shale gas extraction under different parameters. This enables the acquisition of comparative data, ultimately revealing the variation patterns in the combined action of fluid and solid during gas pressure-induced fracturing. Based on the specific requirements of this experimental numerical simulation, the physical quantities were selected.
4. Analysis of Numerical Simulation Results
4.1. Variation of Rock Mass Physical Parameters under Pneumatic Fracturing
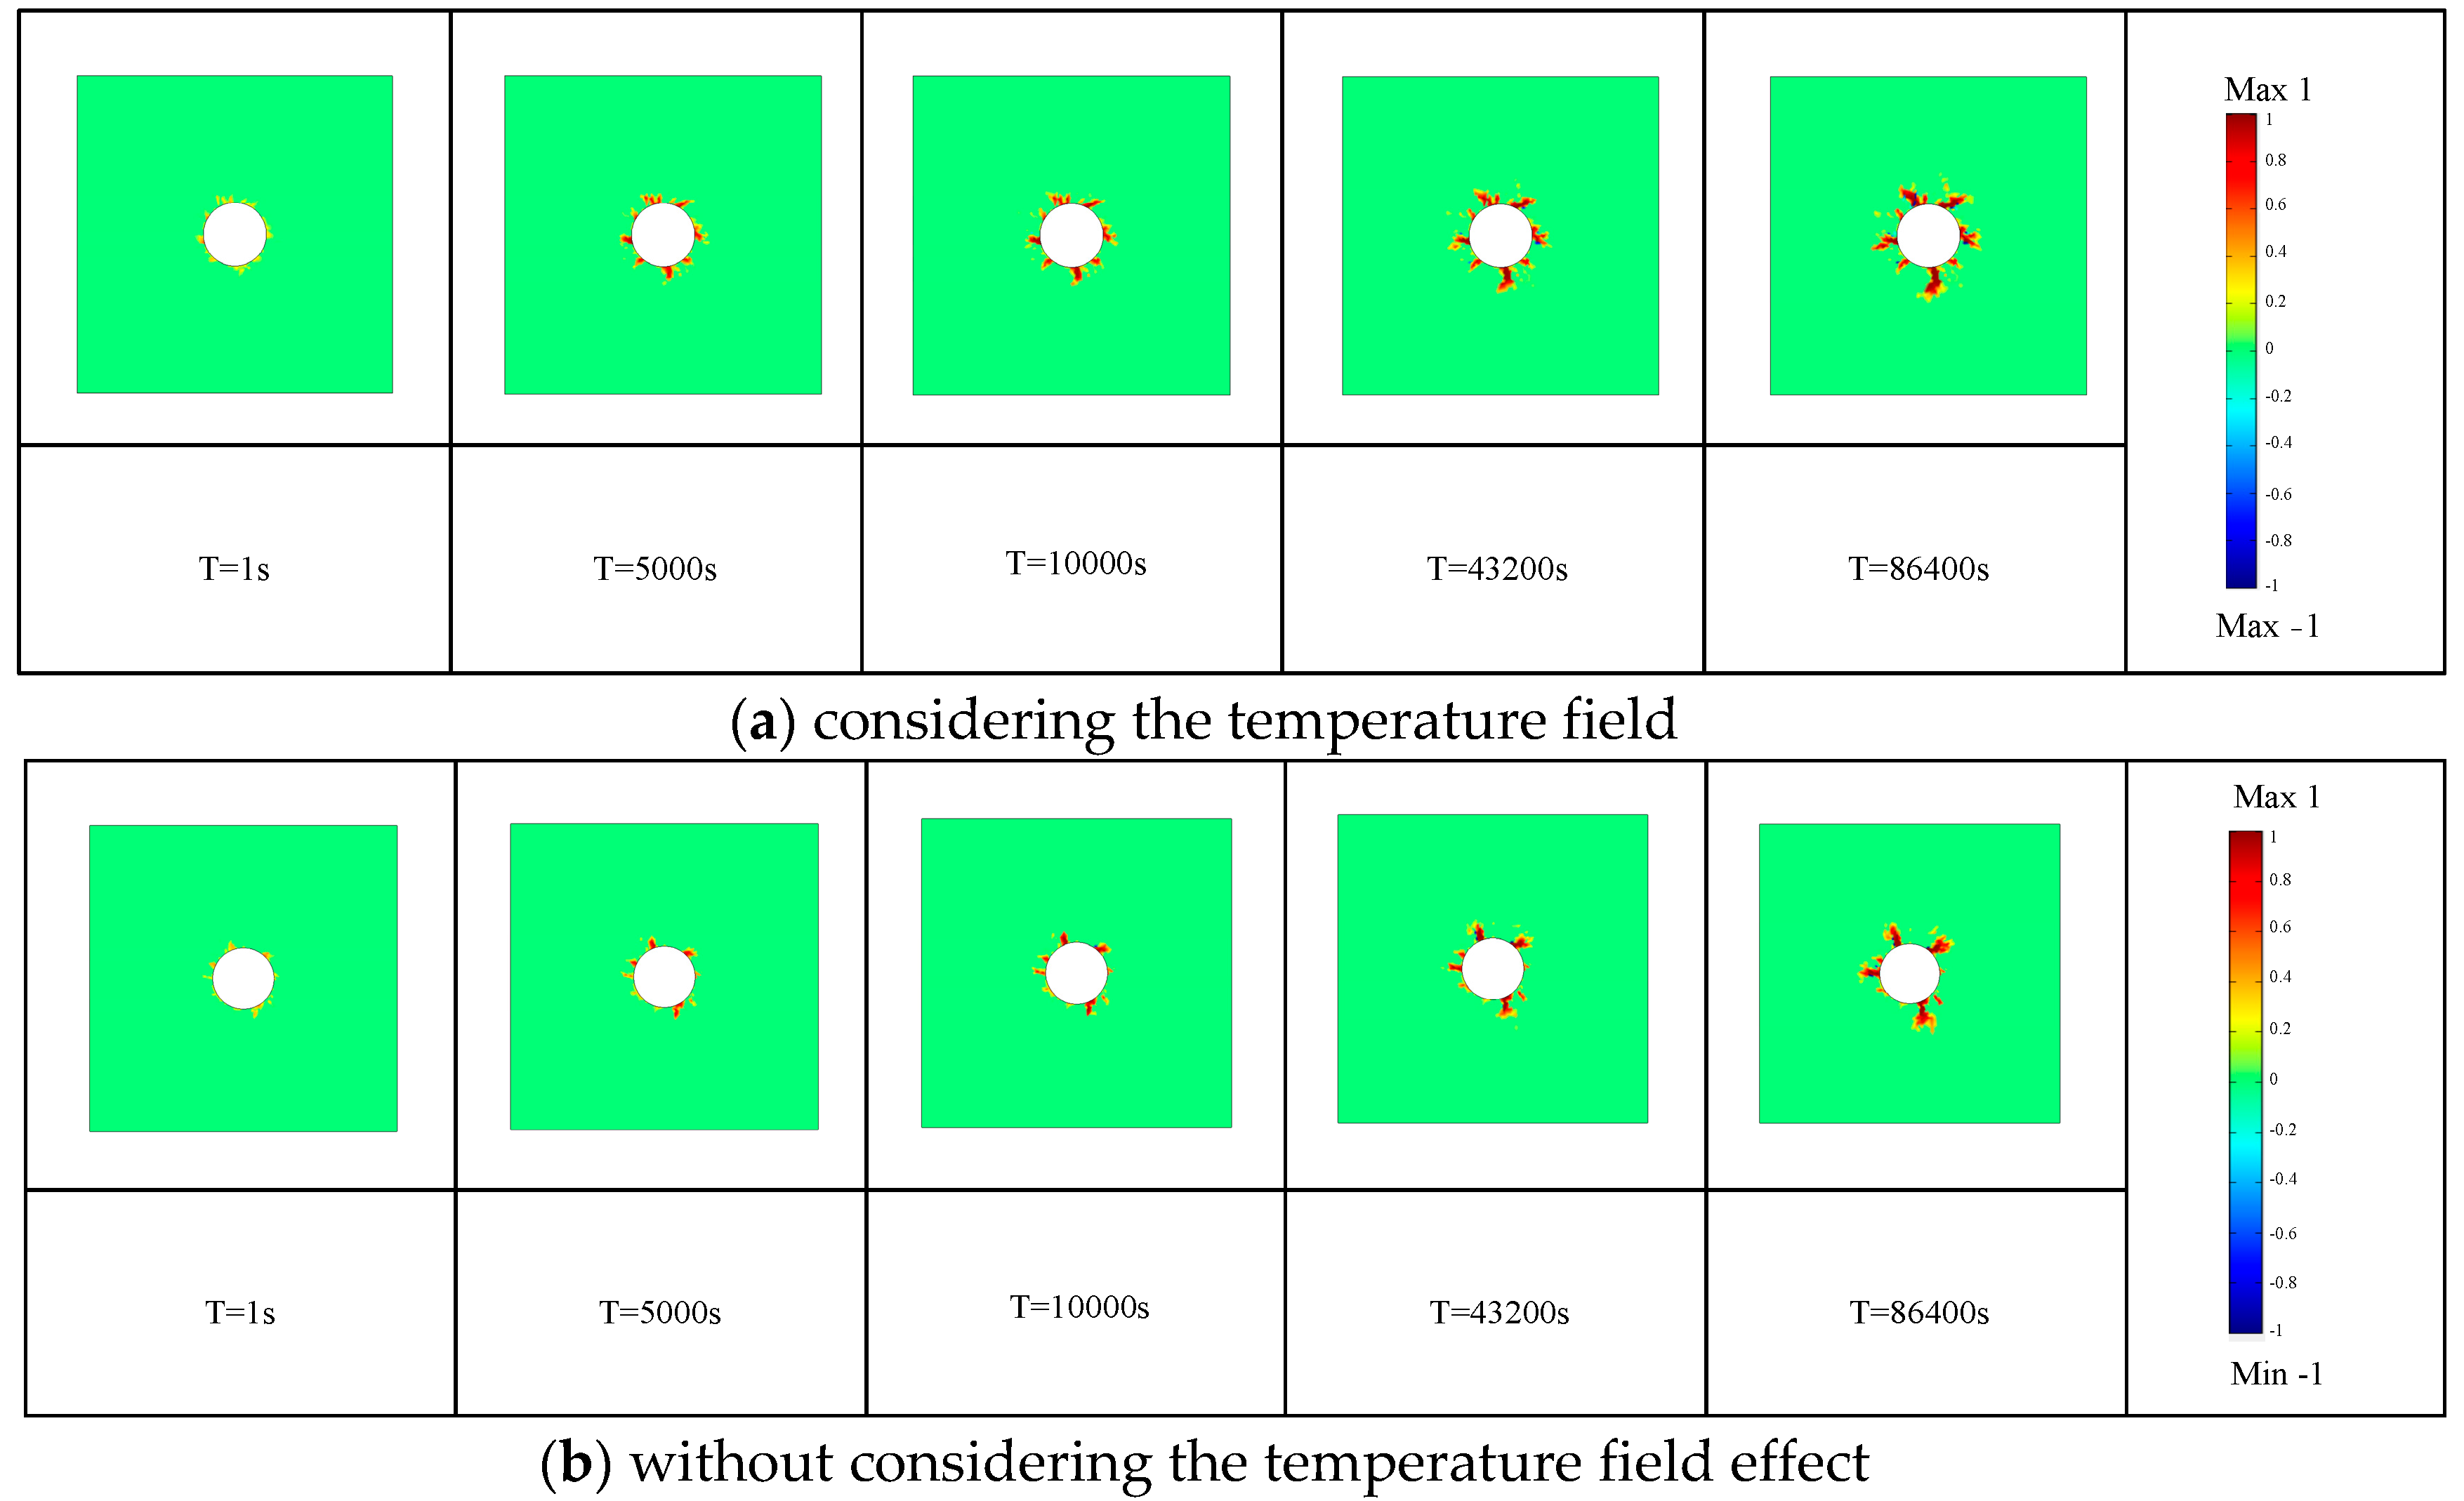
The progressive nature of surrounding rock mass damage around the borehole can be discerned from the observations in Figure 3, where the extent of damage steadily increases over time. Moreover, under the influence of a higher temperature field, the degree of rock damage is significantly greater compared to the case where the temperature field is not considered. This is because of the principle of thermal expansion and contraction. When the temperature is higher, the gas inside the rock mass expands, making the rock mass more susceptible to external gas pressure-induced failure. Under higher temperatures, the gas molecules become more active, and after the rock mass is damaged, these active gas molecules further contribute to the internal damage of the rock mass, promoting the development of internal fractures.
From Figure 4, it can be observed that as time progresses, the tensile stress near the borehole increases gradually, while the compressive stress decreases. Furthermore, considering the temperature field, the first principal stress is larger. This phenomenon arises from the gas fracturing procedure, where a considerable volume of gas is injected into the vicinity surrounding the borehole. Consequently, tensile stress increases while compressive stress decreases. As the rock mass experiences failure, the injected gas facilitates the propagation of internal fractures within the rock mass. As these fractures extend, the stress exerted on the rock mass transforms into tensile stress, resulting in an expansion of the tensile stress range. Under the influence of a higher temperature field, gas molecules become more active, resulting in greater gas pressure for the same gas volume. Consequently, the first principal stress experienced by the rock mass under the temperature field is larger.
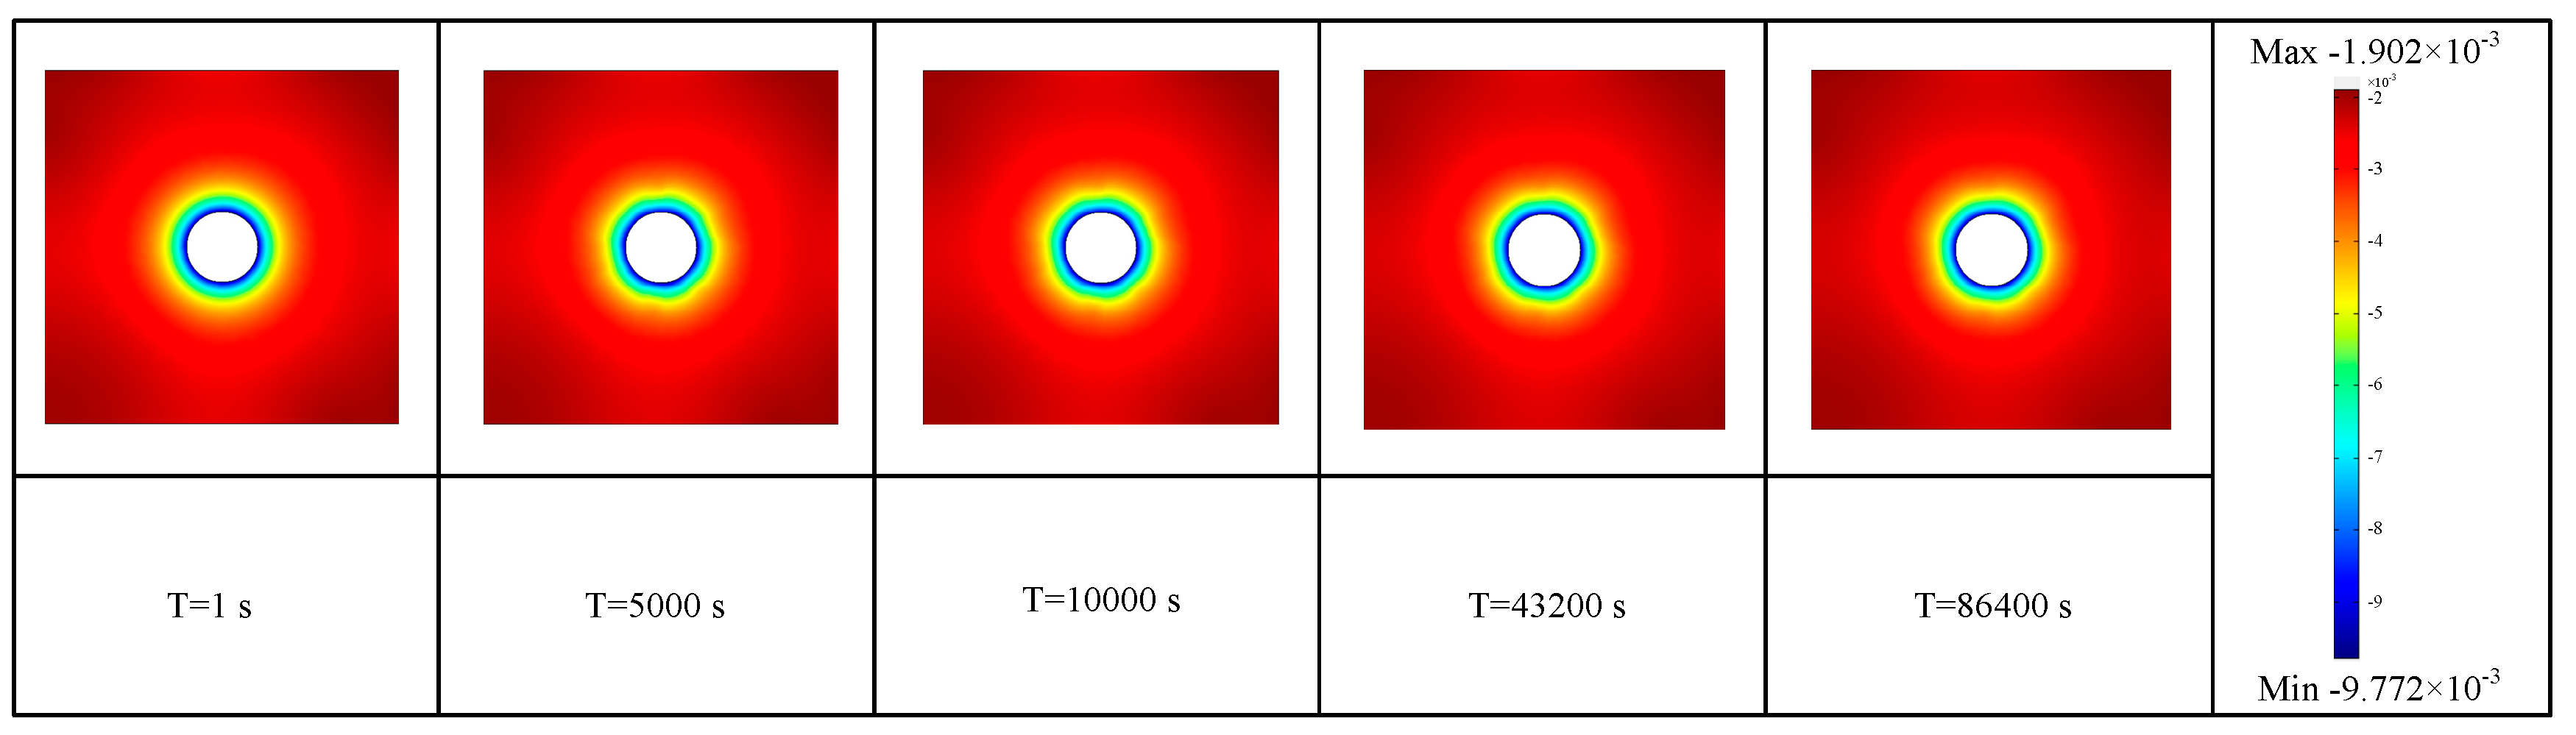
It can be observed from Figure 5 that under the influence of the temperature field, the maximum absolute value of the third principal stress is significantly higher compared to the case without considering the temperature field. This is because the third principal stress, being negative or compressive stress, results in strong gas pressure around the borehole in the rock mass. Although the rock experiences tensile stress during the rock failure process, there is still considerable compressive stress exerted by the gas on the rock. Under the influence of the temperature field, gas molecules become more active, and at the same gas volume, higher temperature leads to greater gas pressure. Therefore, under the temperature field, the maximum absolute value of the third principal stress is higher compared to the case without considering temperature. Additionally, as the gas pressure increases, the internal pressure also increases, resulting in a higher minimum absolute value of the third principal stress within the rock under the temperature field compared to the case without considering temperature. From the graph, it can be observed that the compressive stress around the borehole gradually decreases. This is because as time passes, the surrounding rock mass around the borehole undergoes damage, causing the range of maximum compressive stress on the sample to move inward and decrease in magnitude.
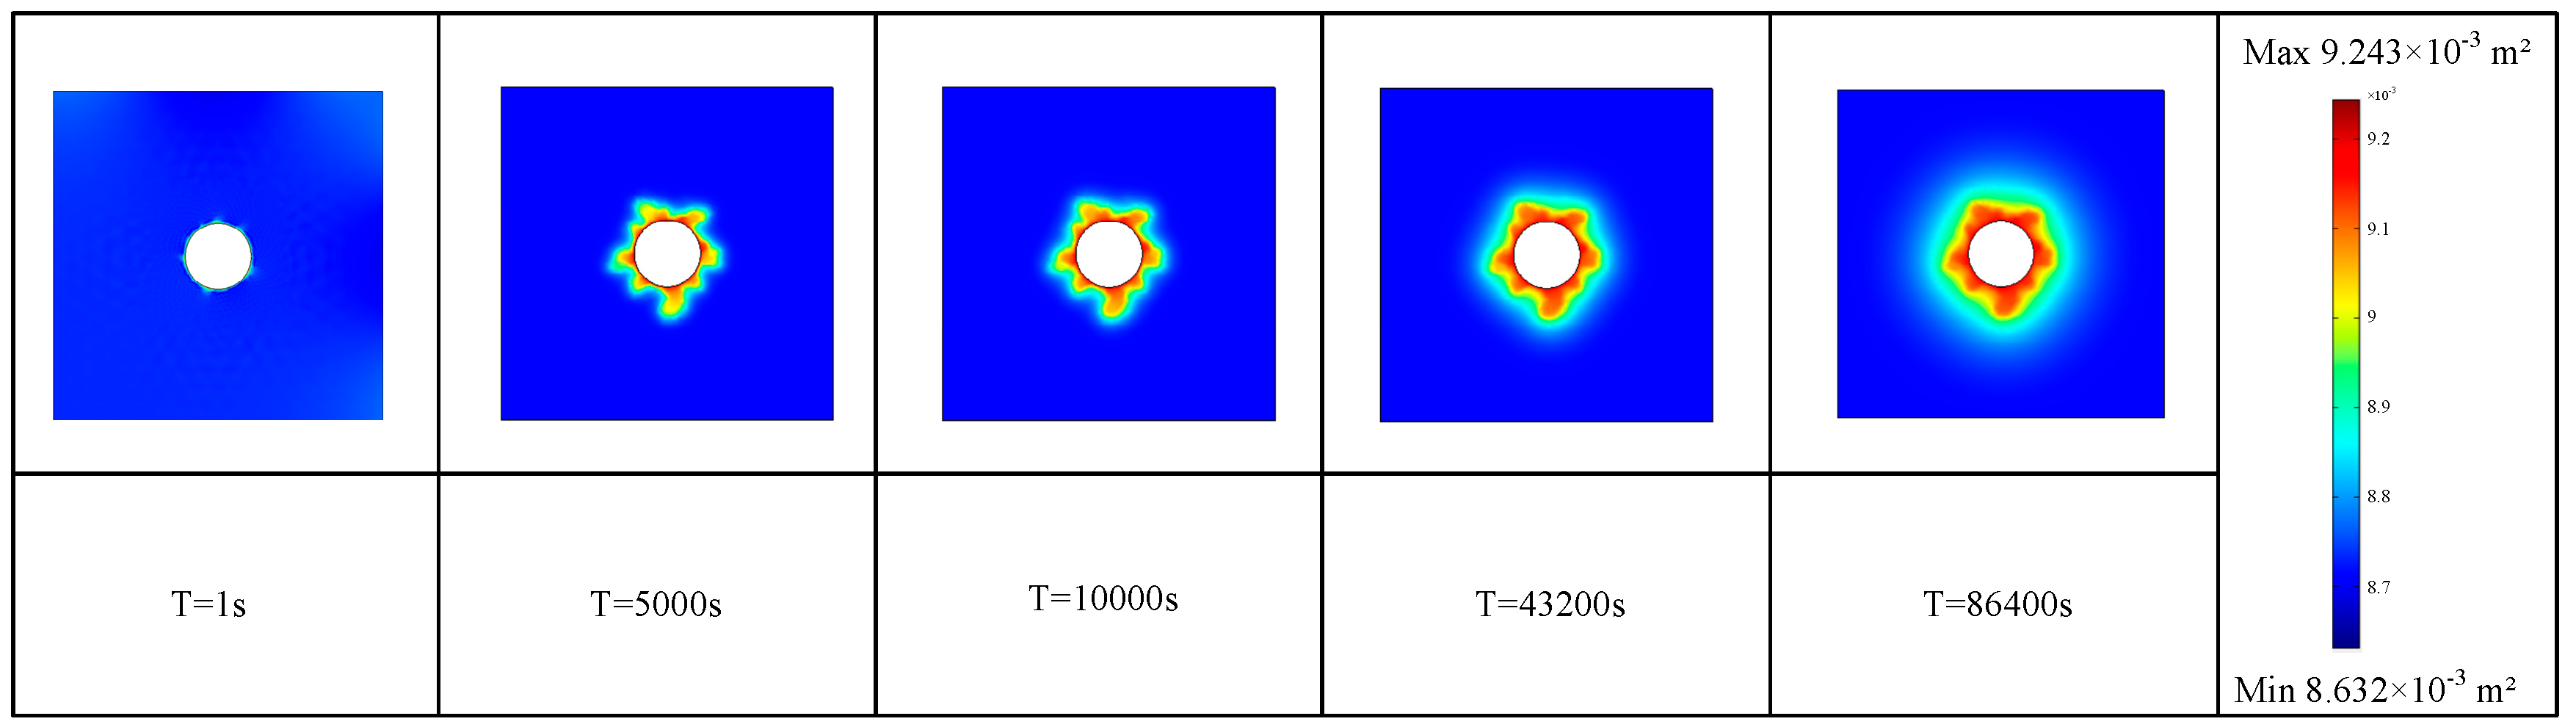
It can be observed from Figure 6 that with the passage of time, the permeability around the borehole is gradually increasing, and under the influence of the temperature field, the permeability around the borehole is even greater, with a broader range of permeability increase. These findings suggest that gas fracturing is an effective method for enhancing rock permeability, increasing gas extraction efficiency within the rock. Moreover, higher temperatures can contribute to improved gas fracturing efficiency and subsequently increase rock permeability.
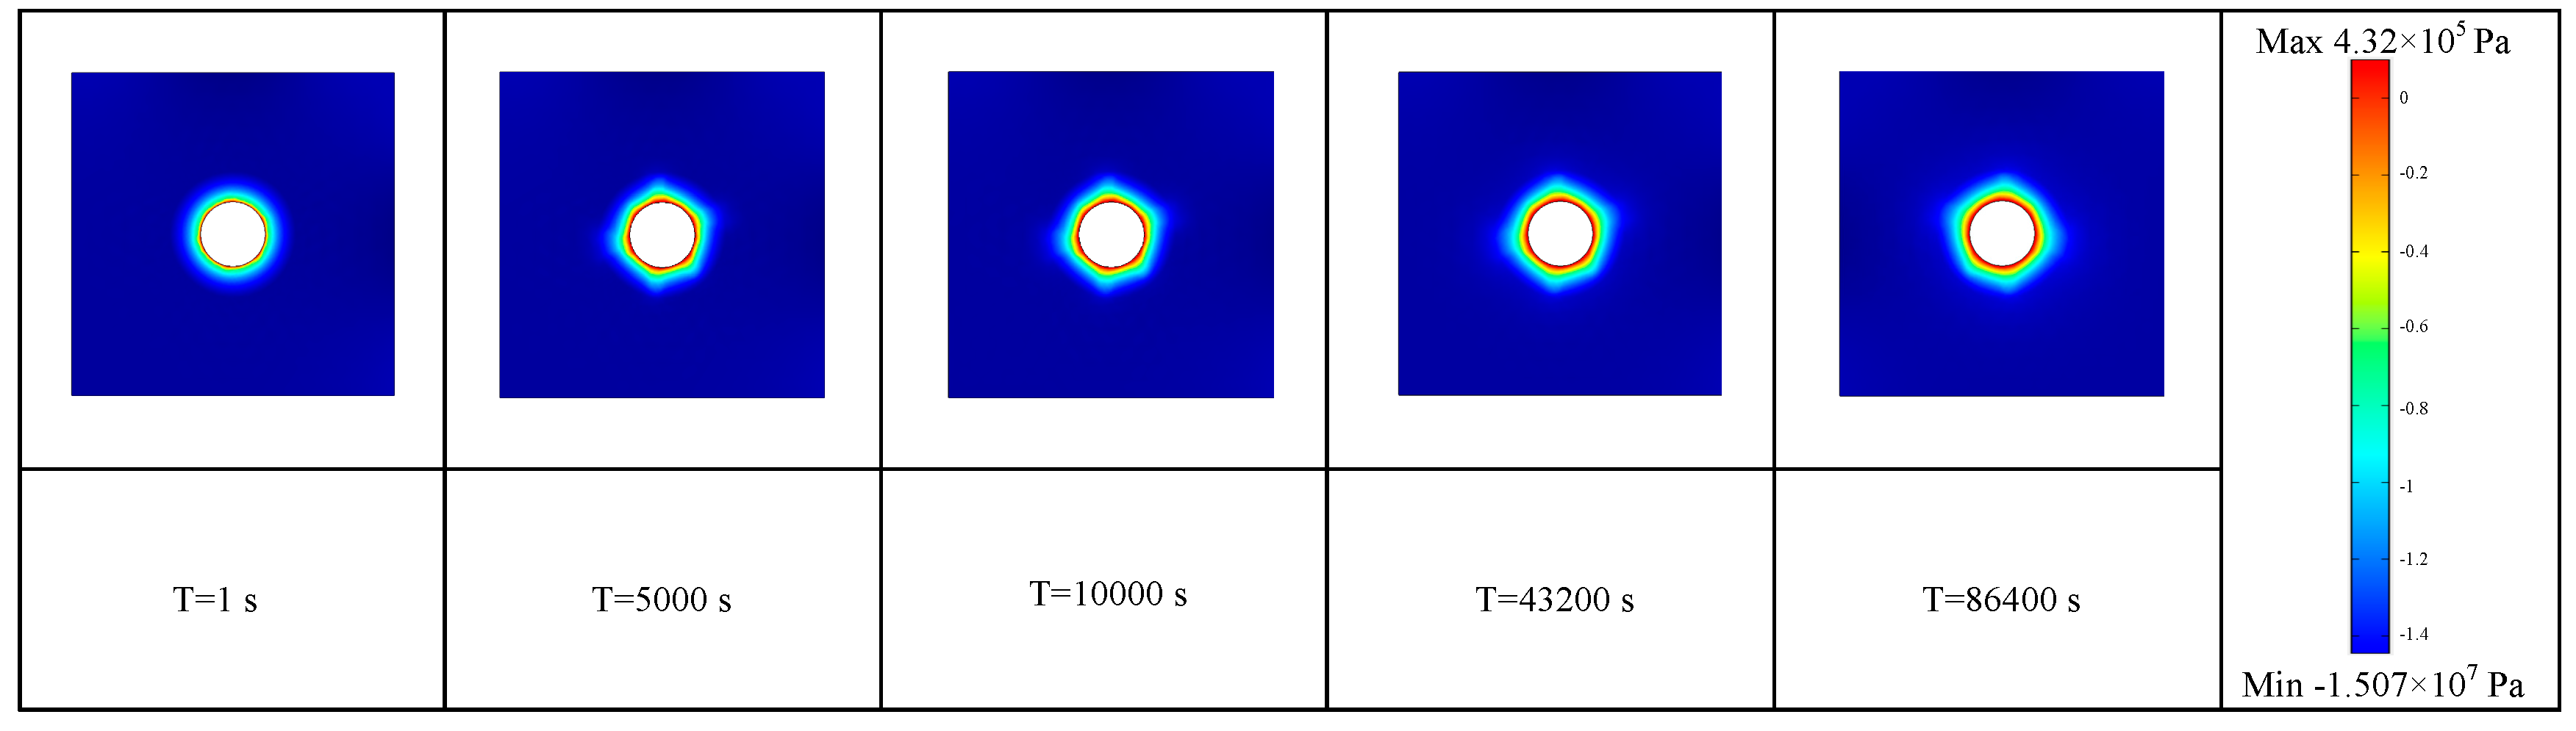
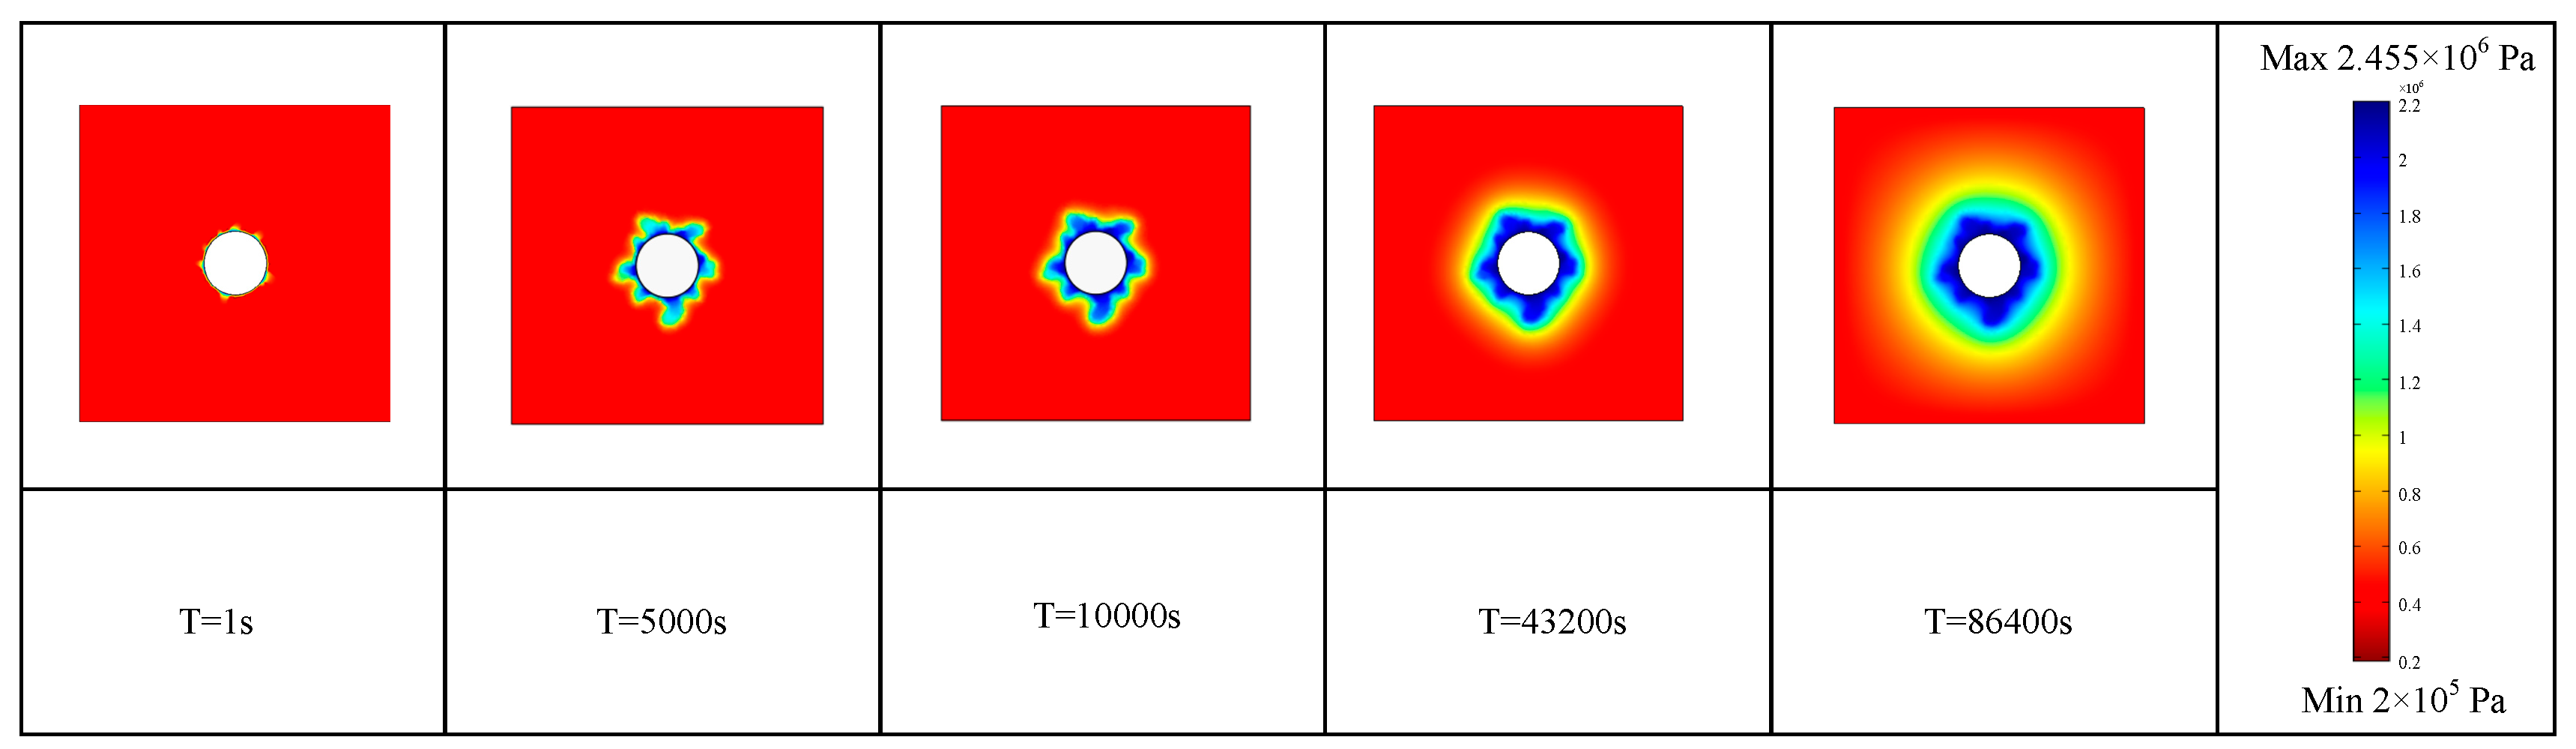
The observation results in Figure 7 indicate that as the degree of rock damage increases, the pressure applied to the borehole gradually increases. In addition, the temperature field has a significant impact, leading to a wider range of pressure increase around the borehole. This is because as the surrounding rock of the borehole is destroyed, the fractured rock mass loses its integrity, resulting in a sharp increase in pressure applied to the surrounding area of the borehole, and the range expands inward. Under the influence of temperature field, the increase in gas molecule activity leads to higher pressure and a larger range of rock damage.
The stress around the borehole decreased significantly after damage evolution compared to before, with a greater reduction range under the influence of the temperature field. This suggests that gas fracturing can cause a significant decline in the mechanical properties of rock and generate more cracks, while higher temperatures can increase the efficiency of gas fracturing and produce better results. Additionally, the figures show that the rock is subjected to greater pressure under the influence of the temperature field than when the temperature field is not considered. This indicates that the temperature field can increase the gas pressure during the fracturing process, thereby achieving better results.
In summary, gas fracturing technology can cause damage to the surrounding rock of the borehole, reduce its compressive strength, and increase its permeability. Furthermore, under the influence of the temperature field, gas fracturing technology can achieve better results.
4.2. Impact of Parameter Variations on the Efficiency of Rock Extraction
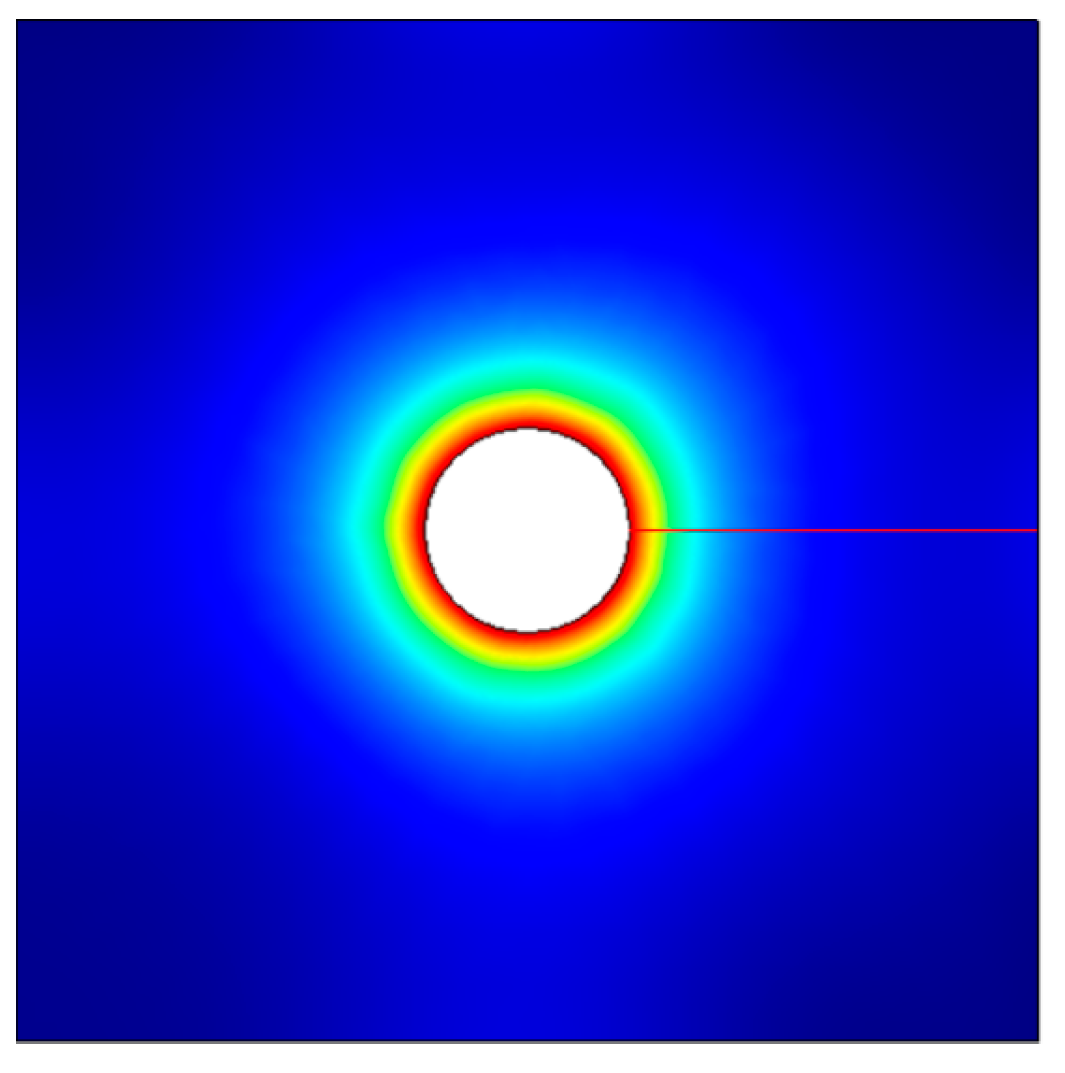
Due to the countless points and lines within the unit cell, it is impossible to sequentially conduct simulation analysis at all positions. Therefore, a straight line was selected along the boundary of the unit cell and the borehole boundary. In this way, the data analysis conducted on this line can represent the simulation situation at any position within the unit cell. The selection of the line segment within the unit cell is shown in the Figure 8.
As shale gas is considered a fluid and follows Darcy’s law, there exists Darcy velocity within the specimen. Since the extraction of shale gas occurs from the wellbore outward, integrating the gas velocity around the wellbore yields the instantaneous gas extraction rate of shale gas. By accumulating the instantaneous extraction rates obtained through integration, the temporal variation of shale gas extraction can be determined.
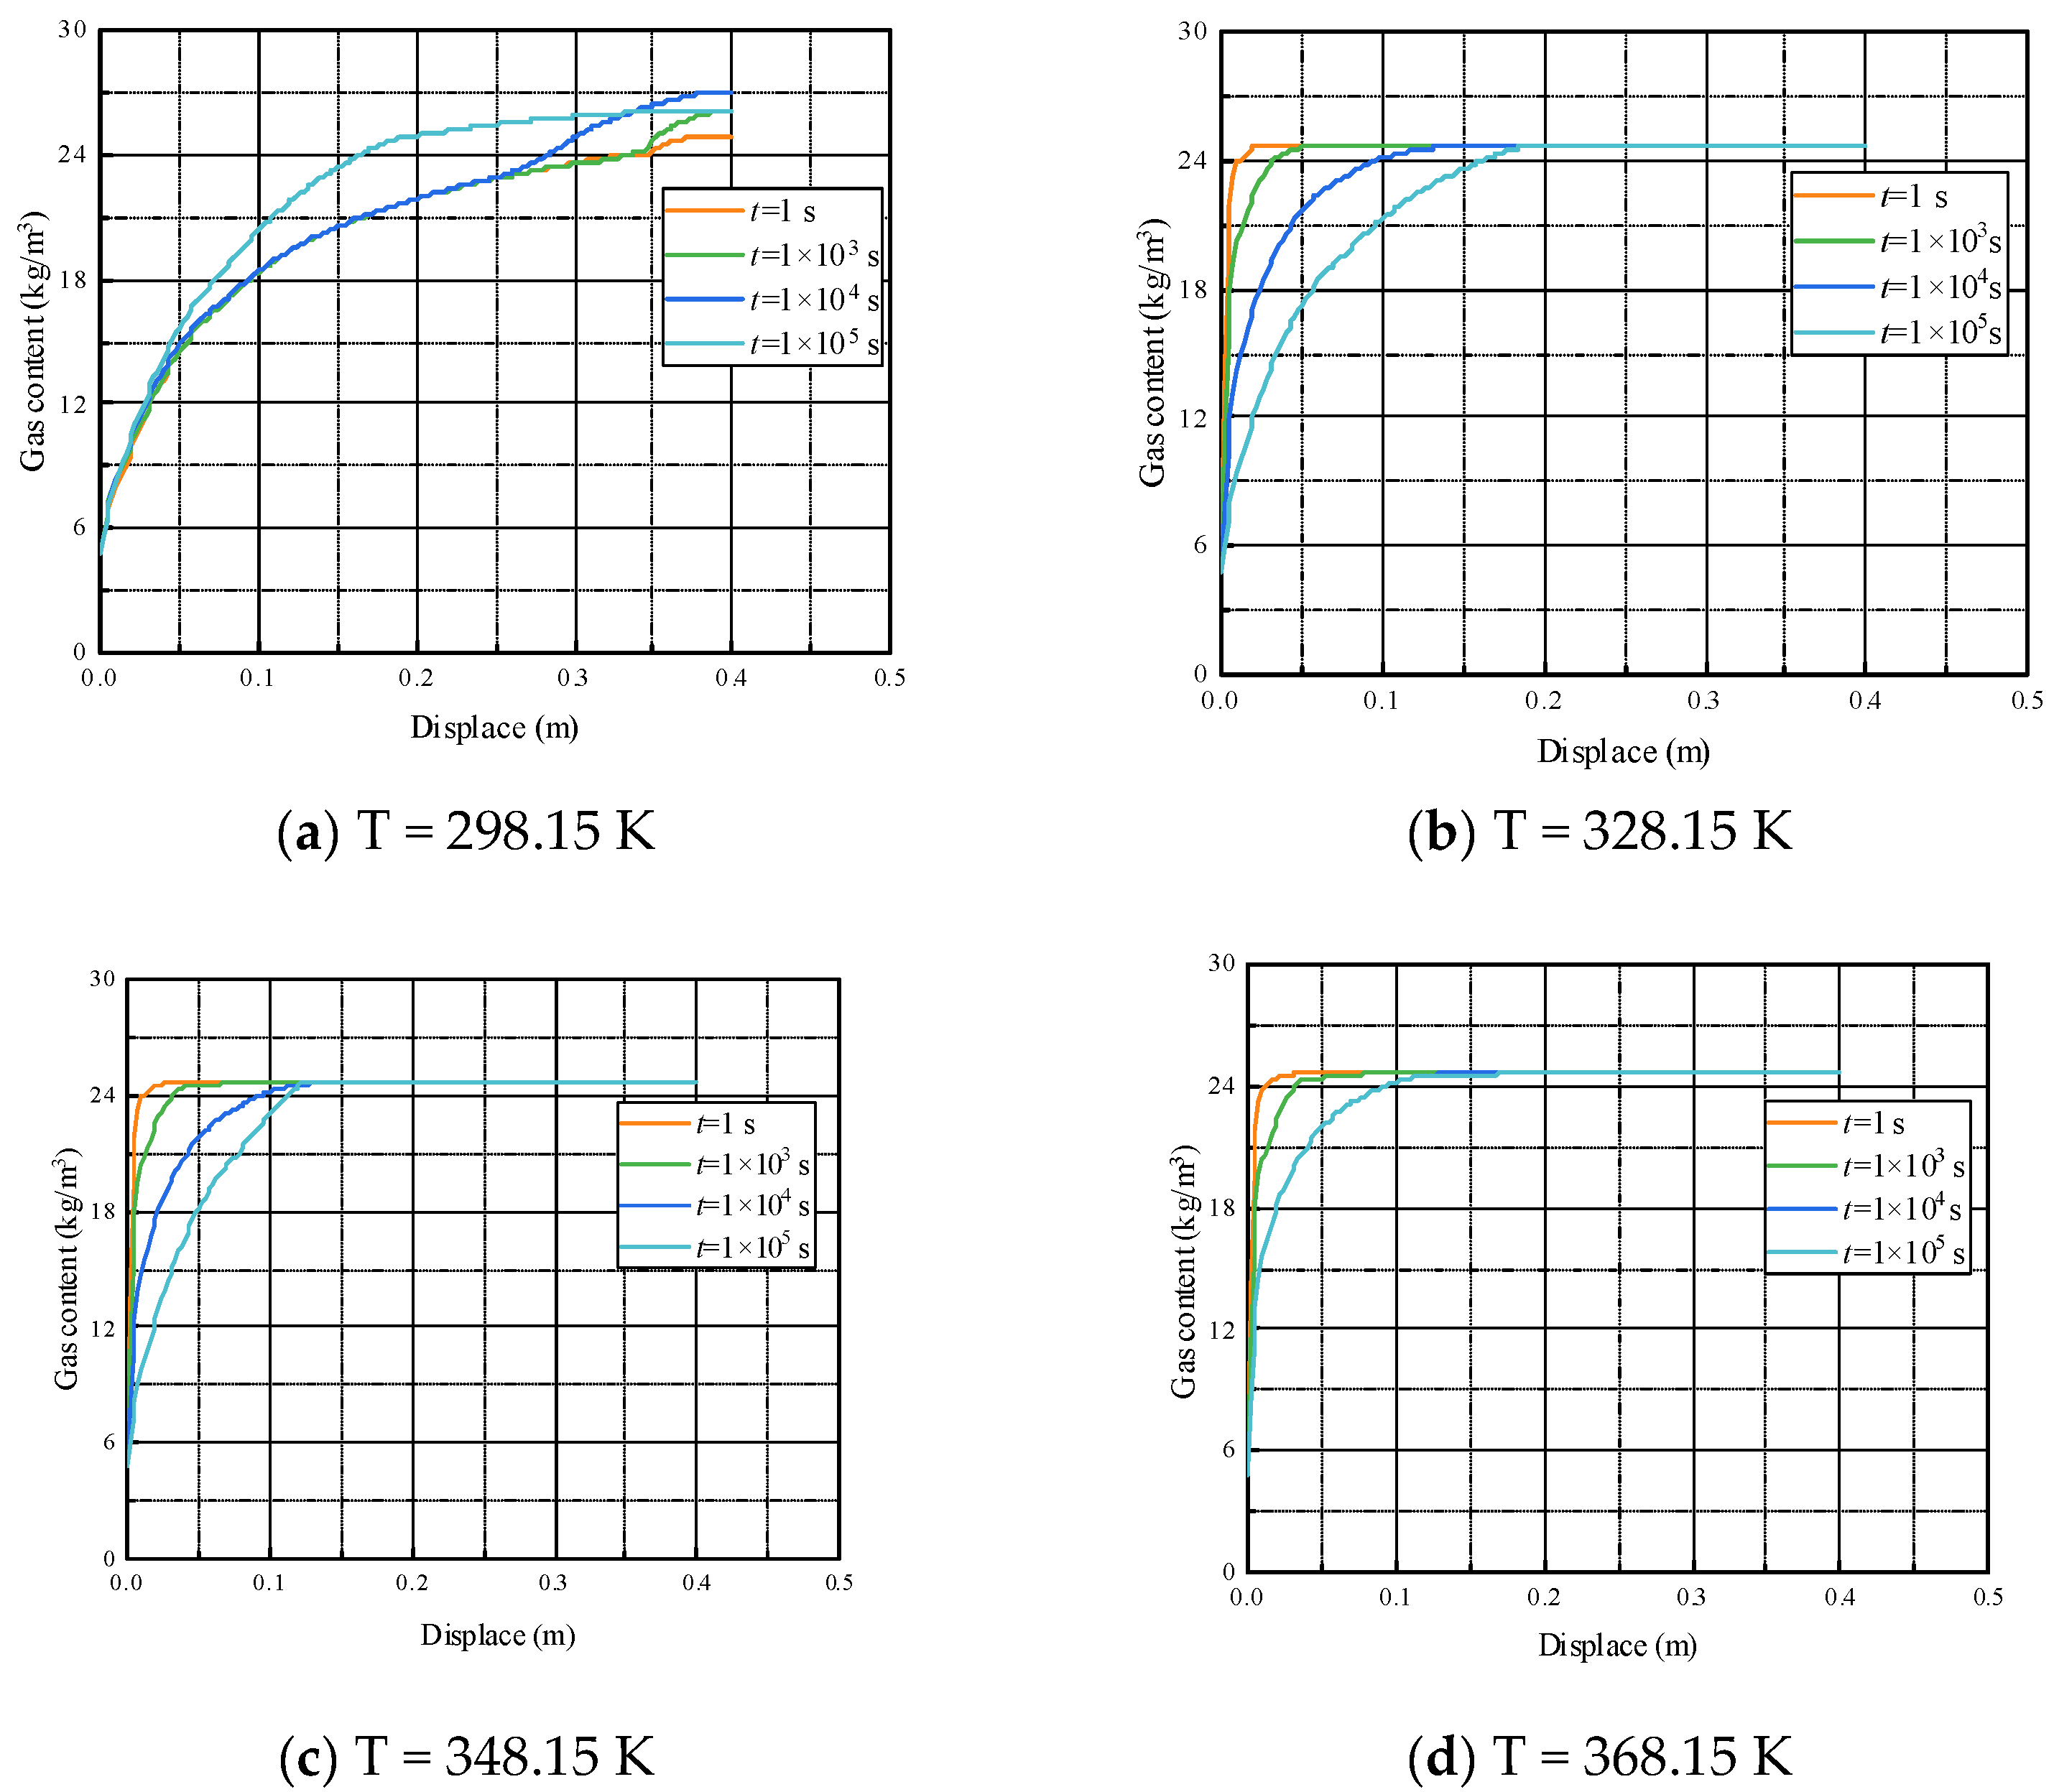
To investigate the influence of different temperatures on shale gas extraction efficiency, this study selected four different temperatures. Simulations and analyses were conducted on the gas content at different positions under various temperatures to demonstrate the effect of temperature on shale gas extraction efficiency from a lateral perspective.
From Figure 9, it can be observed that the gas content of samples varies with position along the wellbore at different temperatures. When the temperature is low, the change in gas content over time at the same position is not significant. However, at higher temperatures, the difference in gas content at the same position but at different times gradually decreases as the temperature rises. Additionally, at higher temperatures, the gas content at the same position and time is higher. This indicates that as the temperature increases, the efficiency of gas fracturing gradually improves. At the same time, the degree of rock fragmentation increases with temperature, leading to an increase in gas permeability. The gas content at the same position and time increases, further demonstrating that temperature can enhance gas fracturing efficiency.
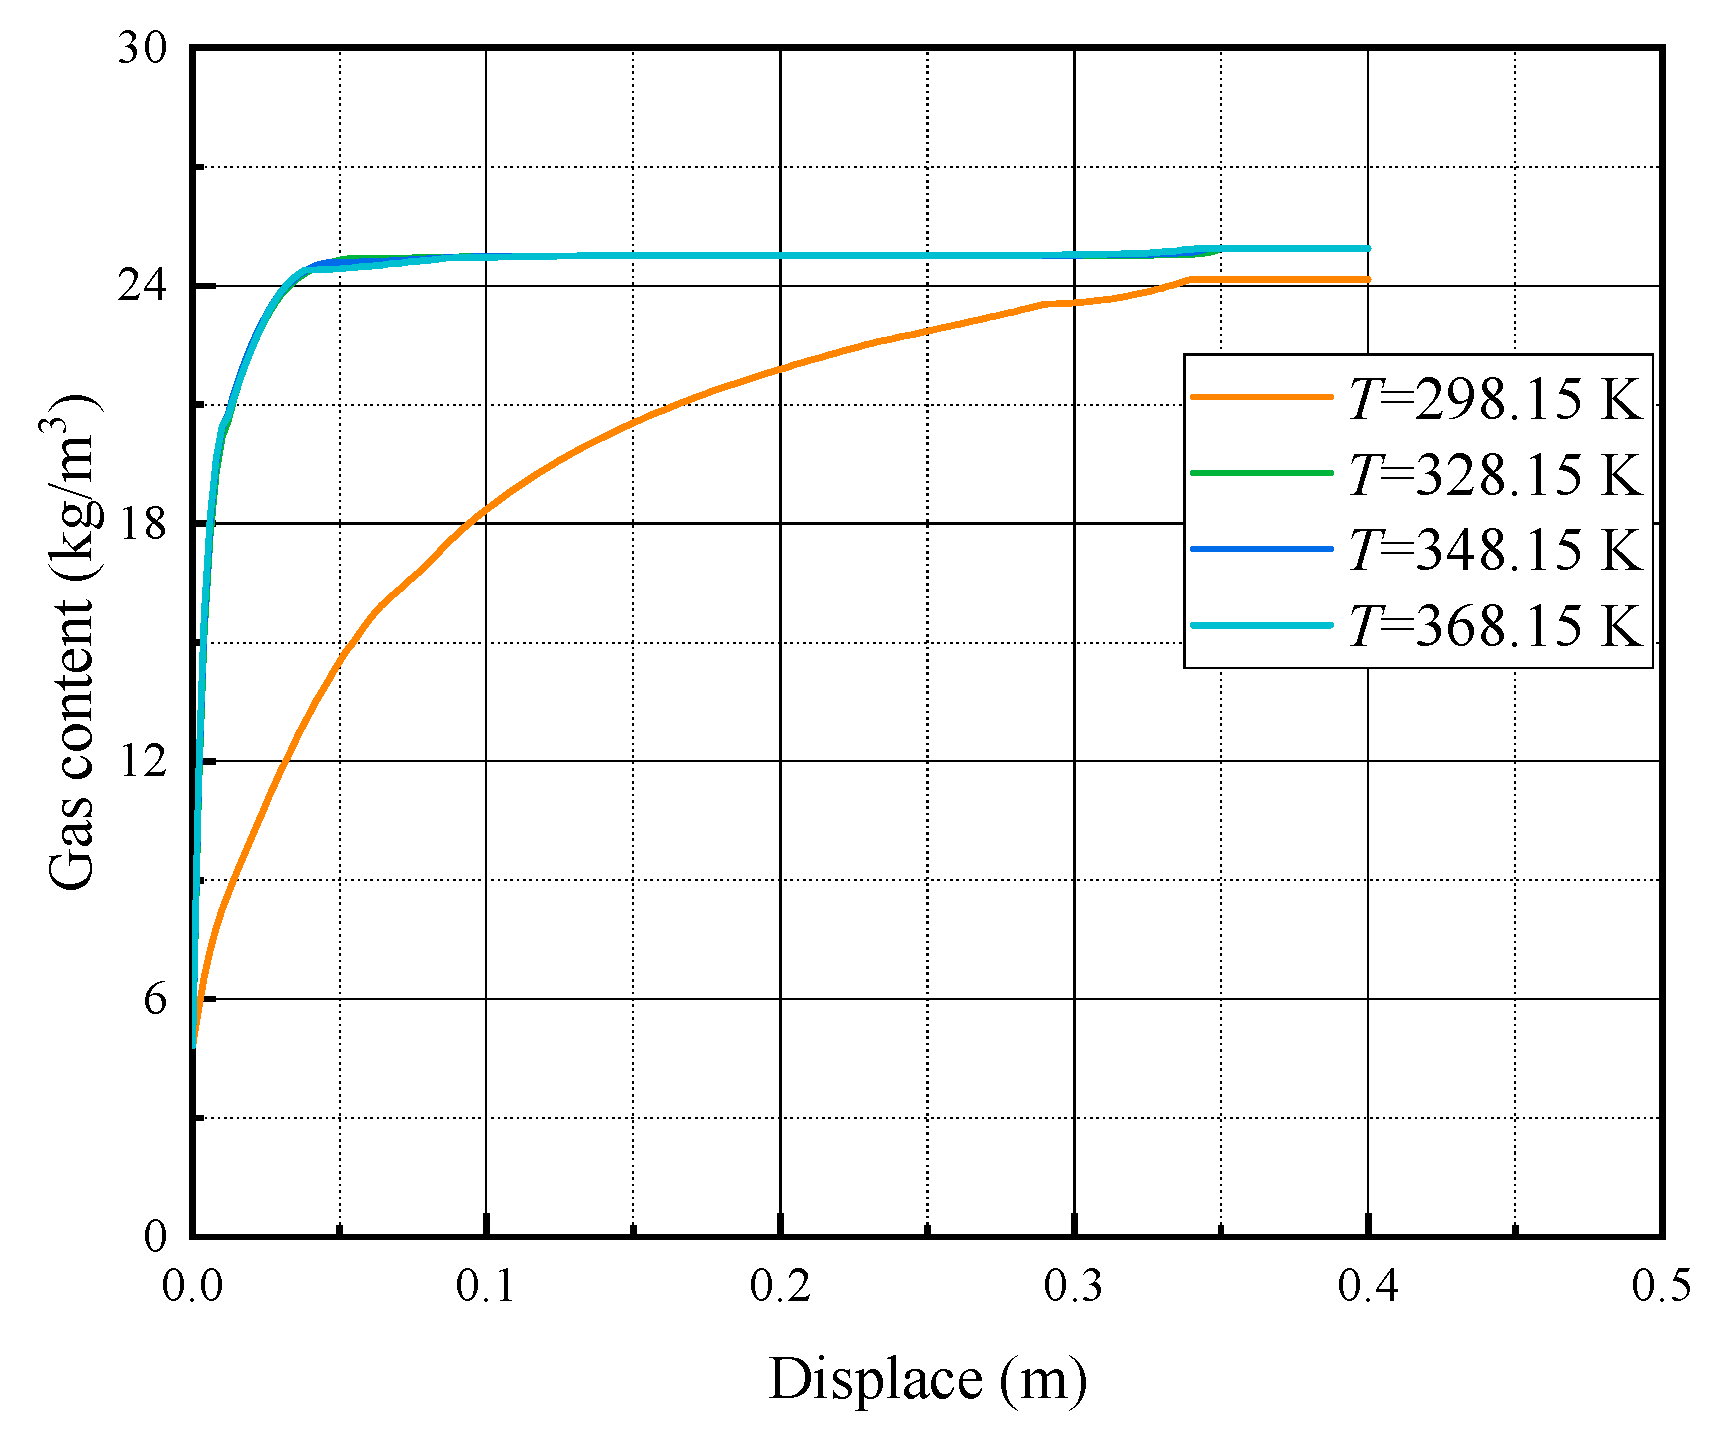
From Figure 10, it can be observed that with increasing temperature, the gas content near the drilling location decreases significantly. However, the gas content near the boundary positions shows an increase. This phenomenon indicates that under the influence of temperature, gas molecules exhibit more active movement as the temperature rises. Therefore, it can be inferred that shale gas extraction can be more efficient in rock formations with higher temperatures.
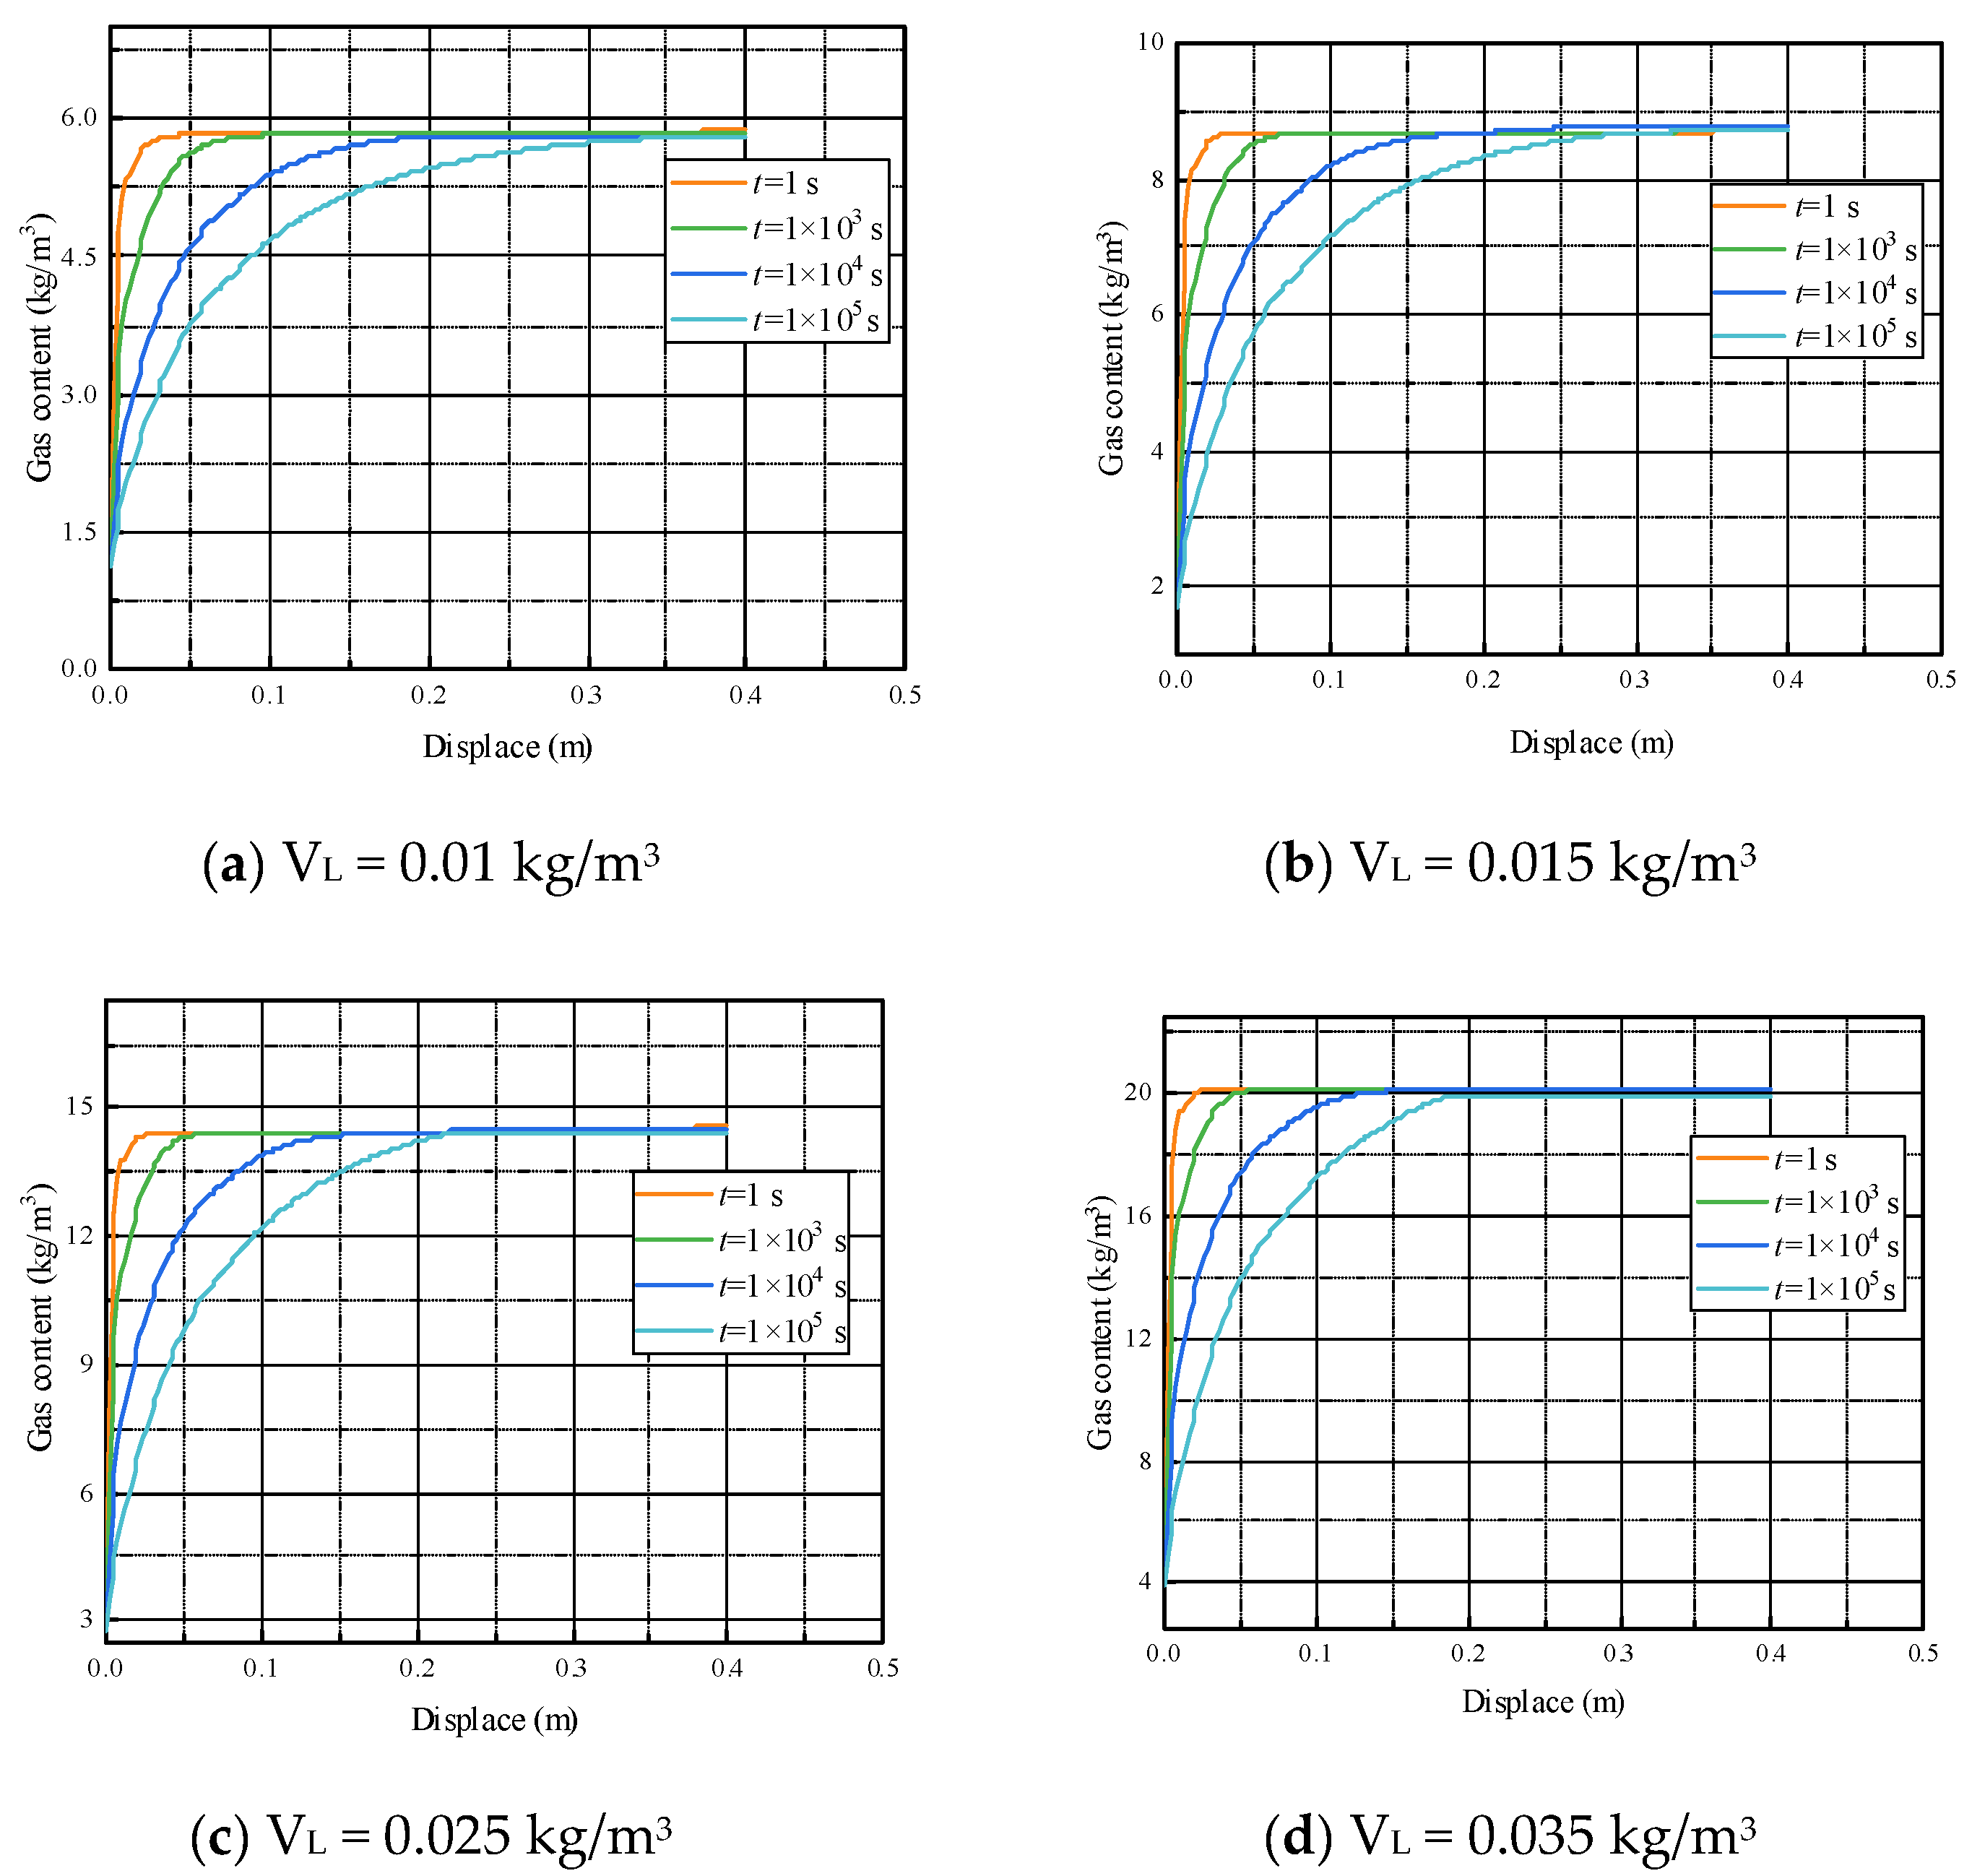
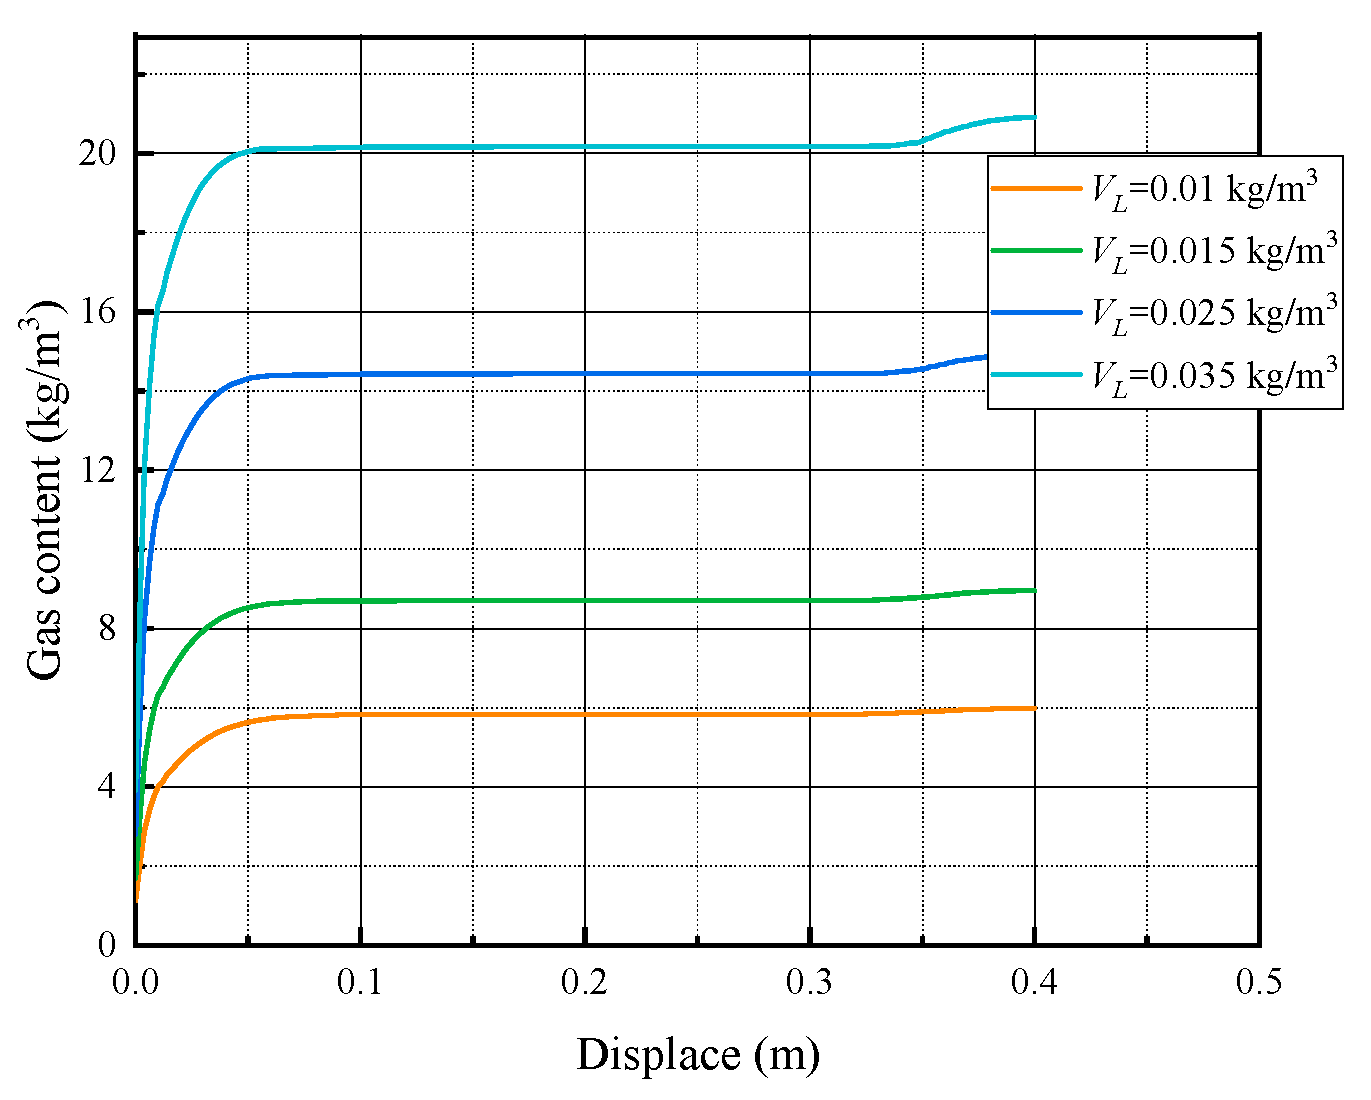
The experimental results indicate that the gas content of the specimens exhibits an upward trend as the analysis position is situated further away from the wellbore, as illustrated in the Figure 11 and Figure 12. Additionally, with an increase in the volumetric constant VL of the specimens, the gas content at the same position also exhibits an upward trend. This indicates that during gas fracturing, the gas surrounding the borehole is rapidly depleted, leading to a significant decrease. However, the gas content within the undisturbed rock mass remains relatively unchanged. Furthermore, it can be inferred that an elevation in the VL value corresponds to increased challenges in gas fracturing, ultimately resulting in a reduction in shale gas extraction efficiency.
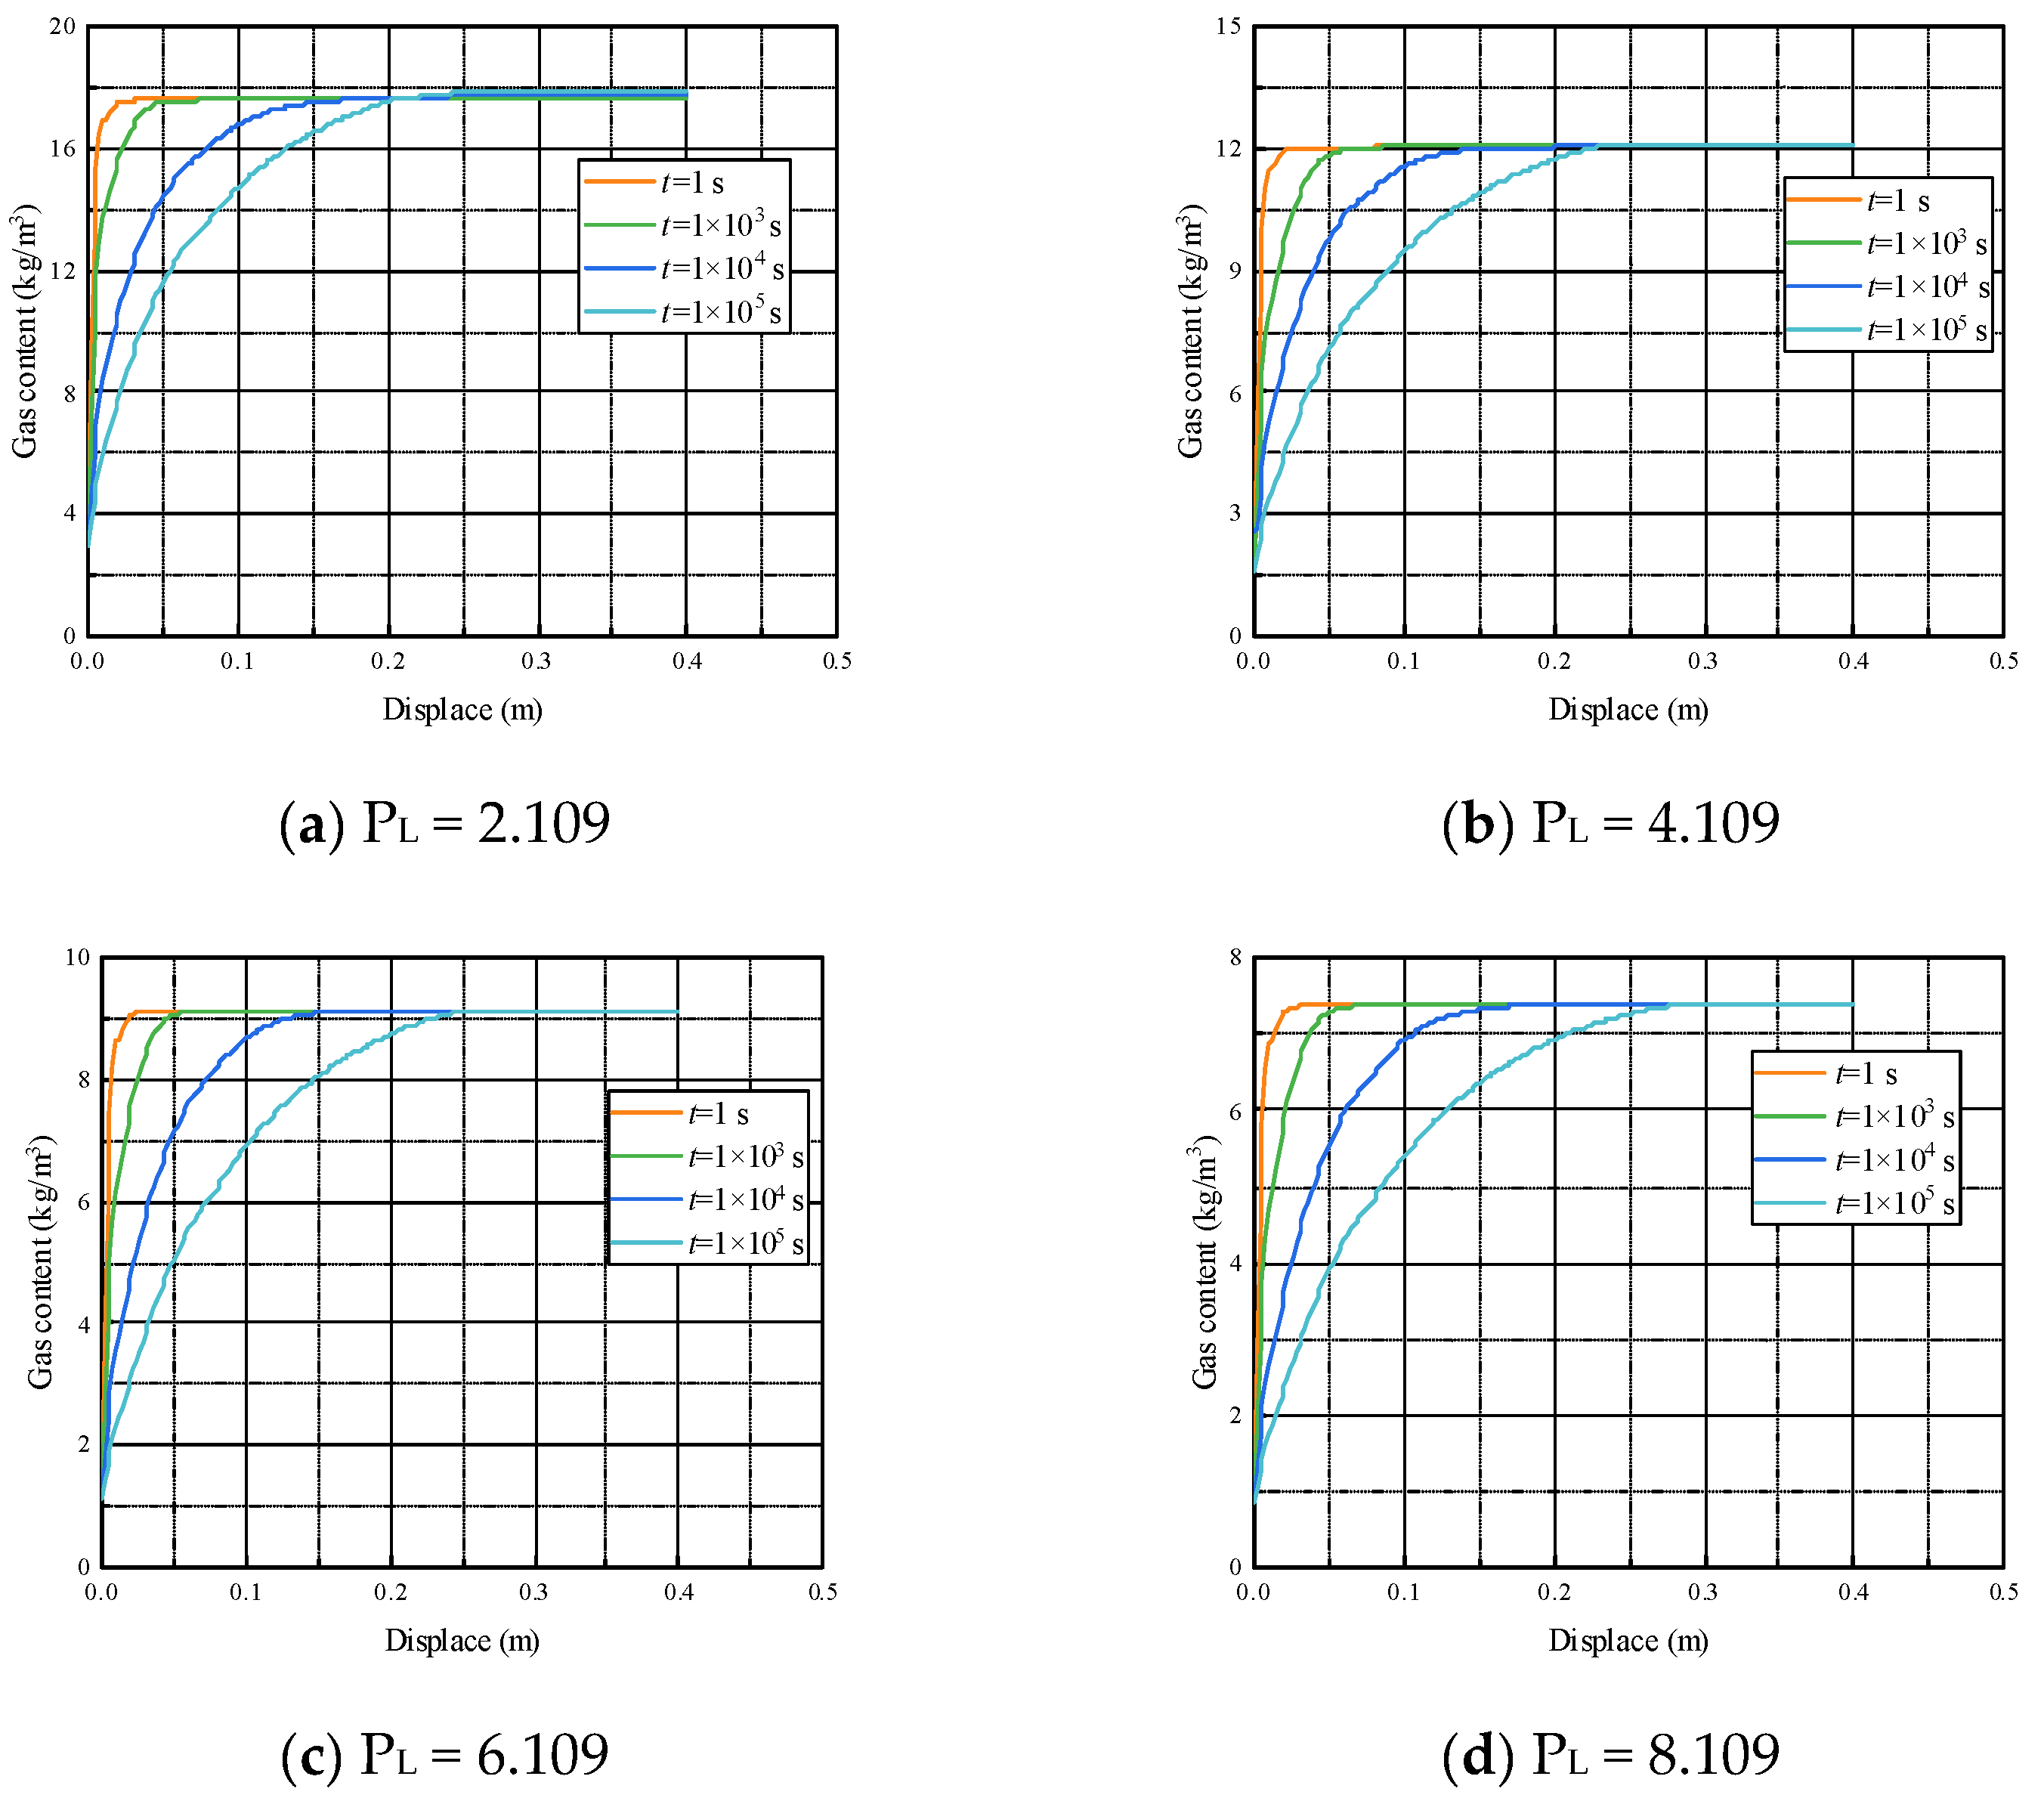
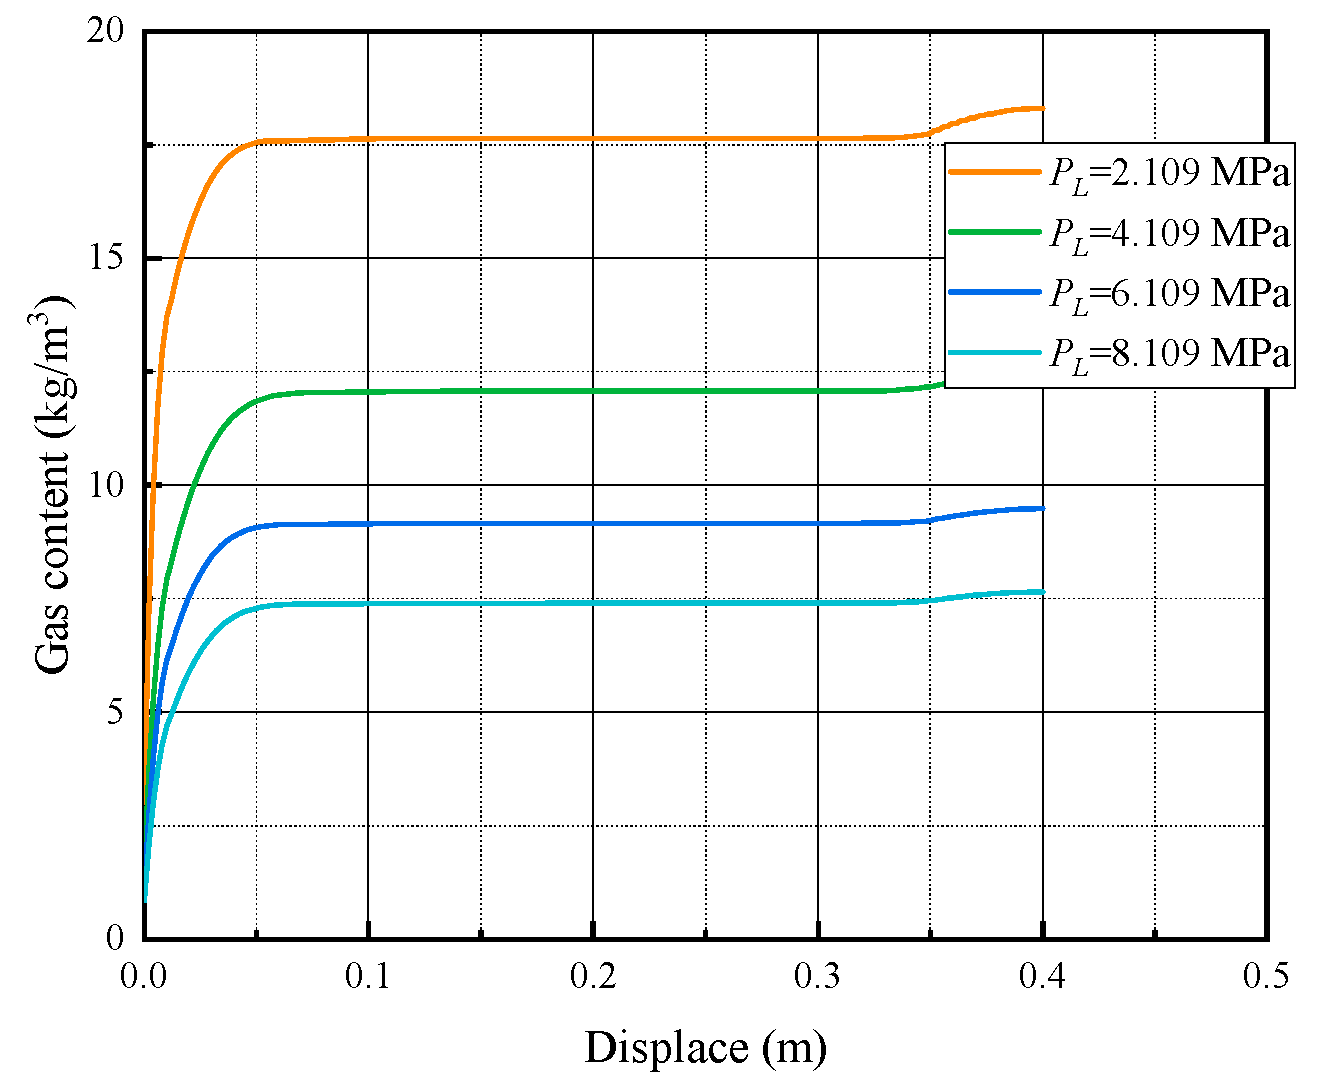
Based on the depicted Figure 13 and Figure 14, it becomes apparent that the gas content of the specimens exhibits a rising tendency as the analysis position distances itself from the wellbore. Conversely, with an increase in the PL parameter of the specimens, the gas content at the same position exhibits a decreasing trend. This is because as the PL value increases, the efficiency of gas fracturing improves, leading to a higher degree of rock damage and an accelerated extraction efficiency of shale gas. Consequently, the gas content within the rock decreases.
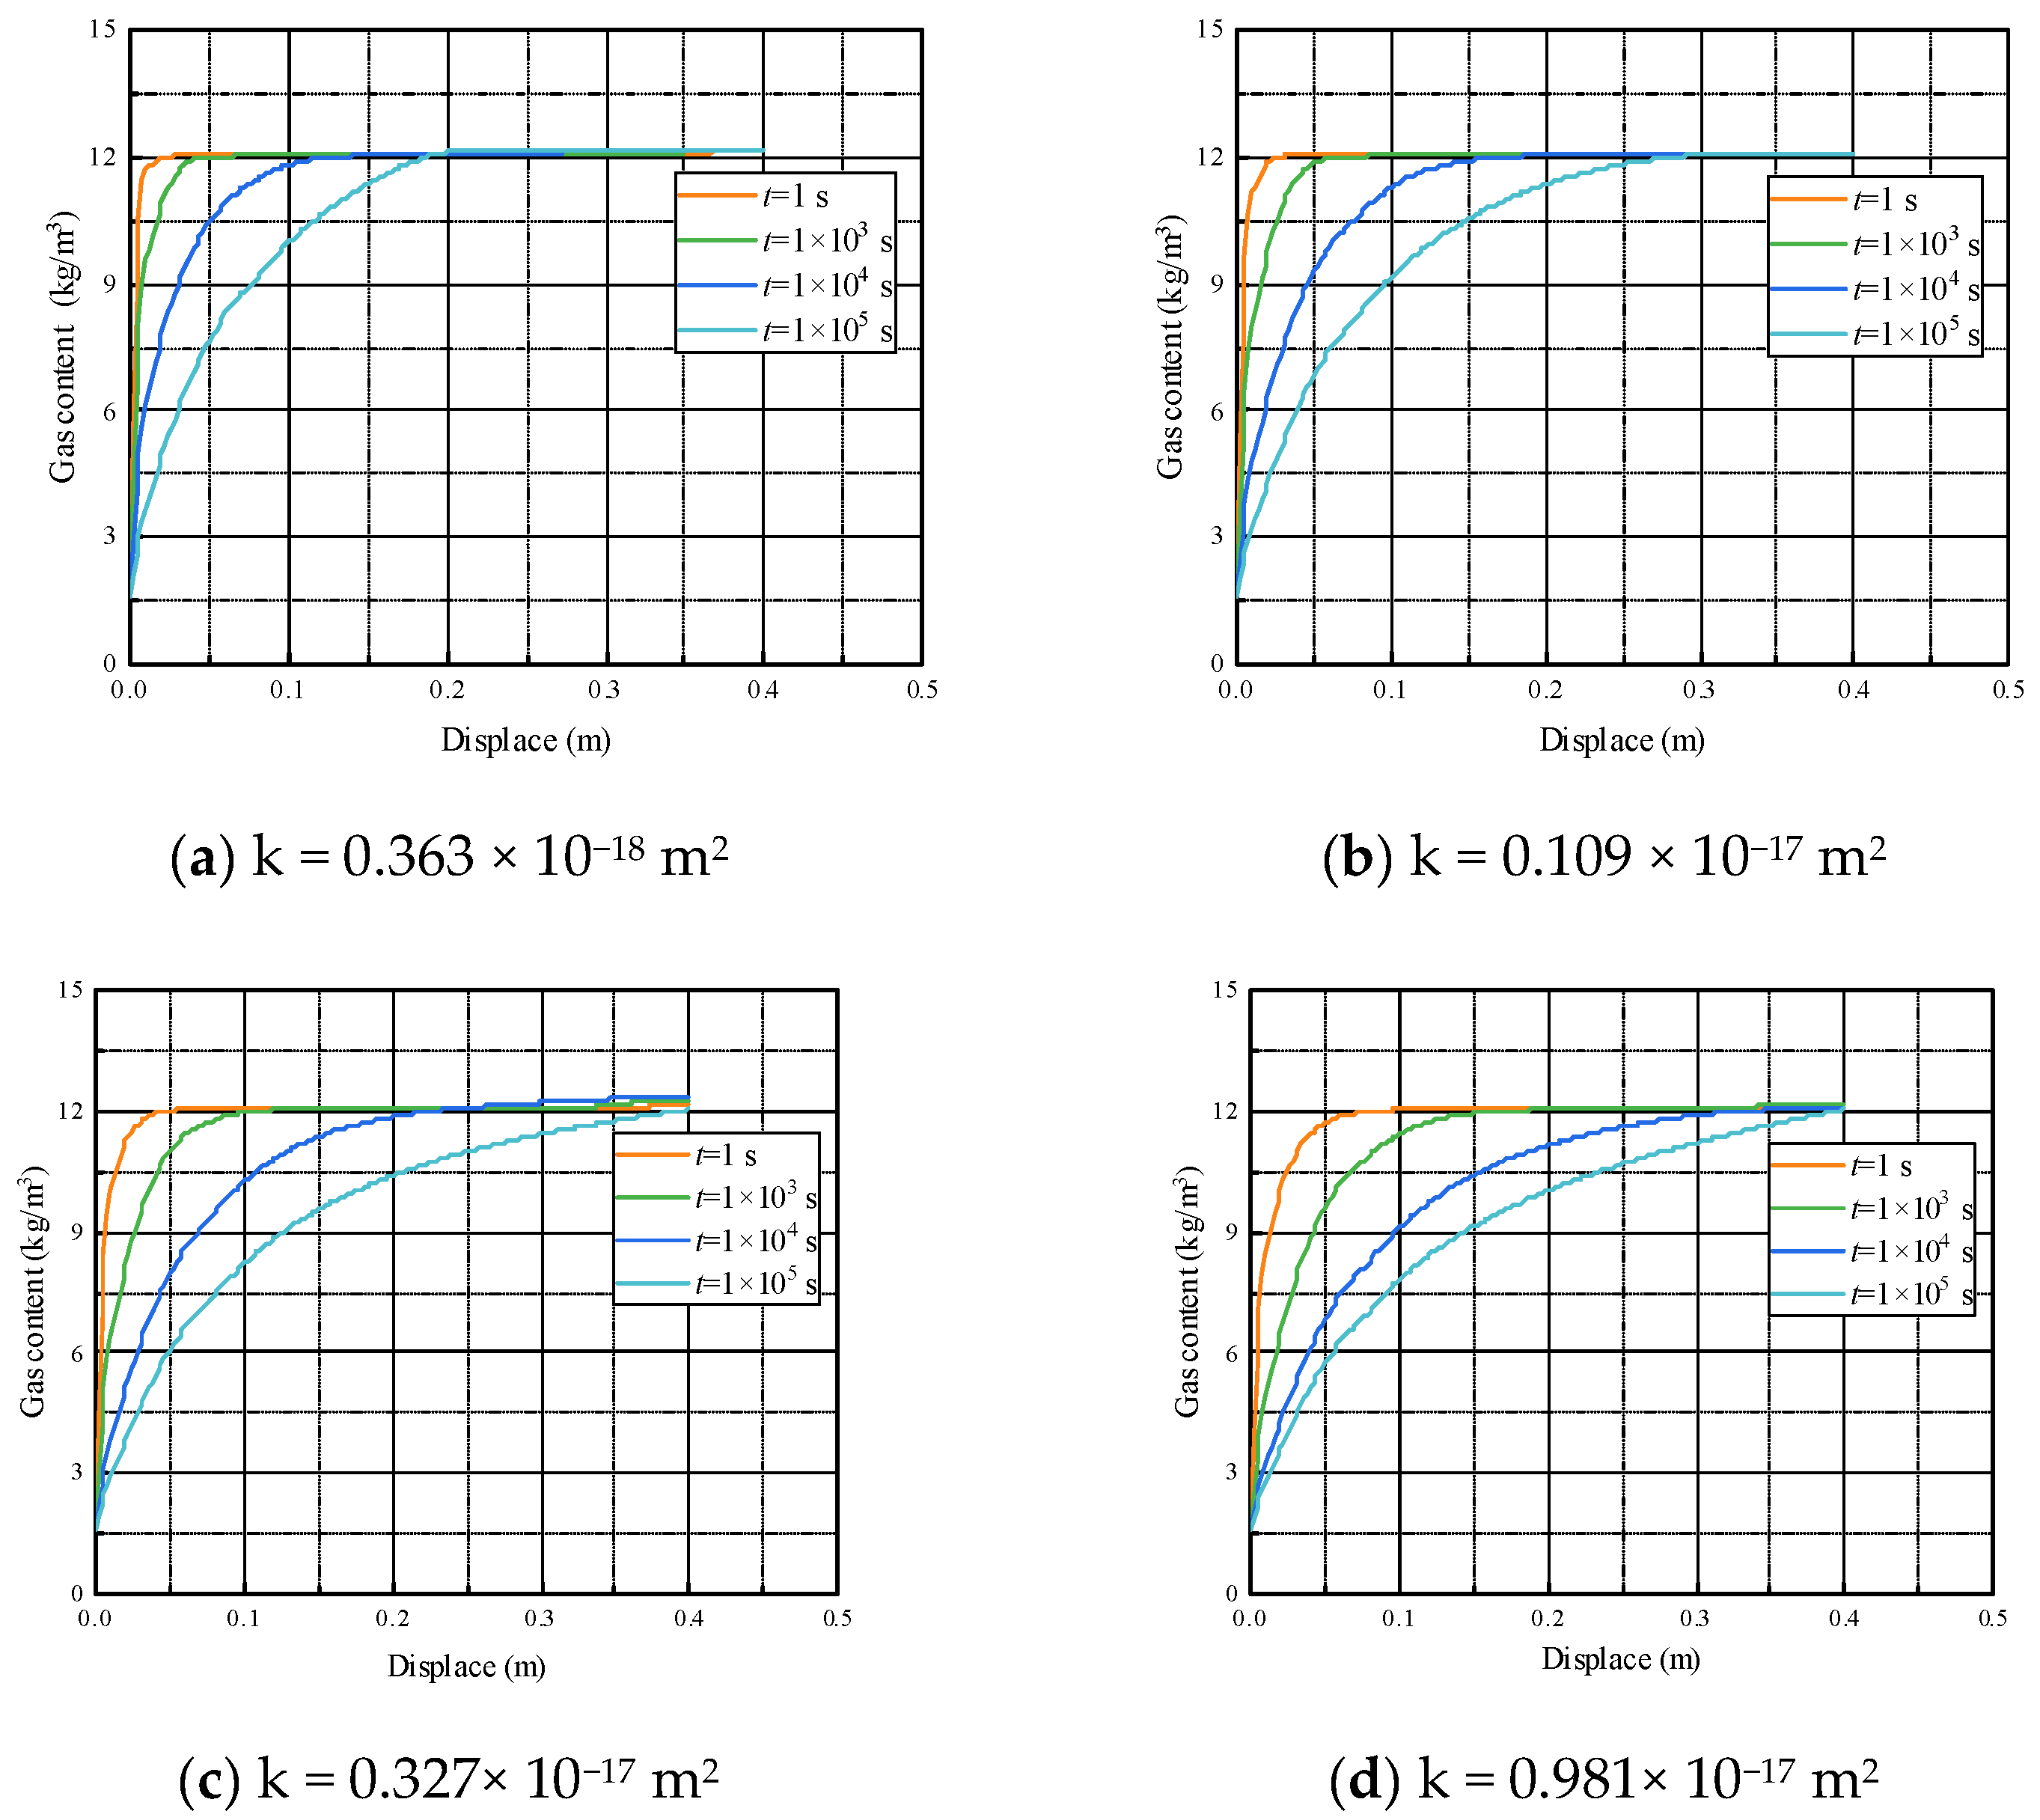
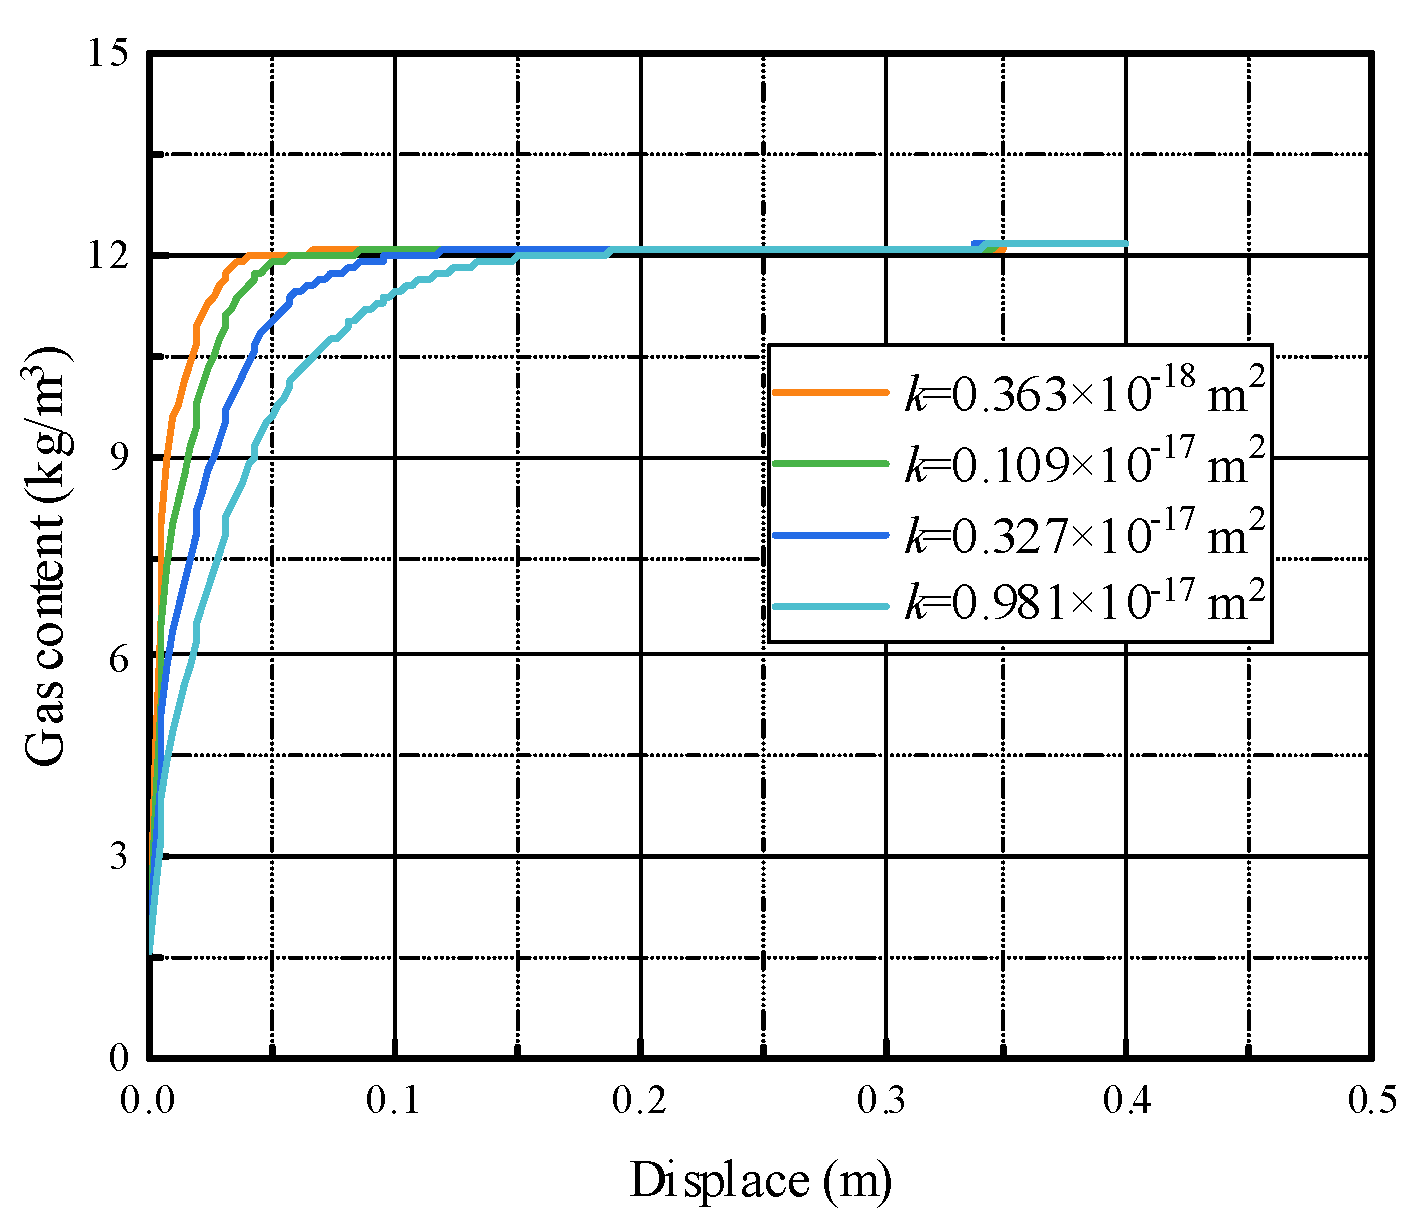
Based on numerical simulation analysis of shale gas content under varying permeability conditions, as shown in Figure 15 and Figure 16, it is evident that the gas content decreases at a specific location with an increase in permeability. This is because a higher permeability indicates a greater number of interconnected pores within the sample. During gas fracturing, a significant amount of gas rushes into these pores, leading to an increase in pore pressure and subsequent expansion of the pores. This expansion results in more interconnected pathways for gas flow. However, it should be noted that samples with initially higher permeability exhibit even higher permeability after gas fracturing, which leads to increased gas leakage at the same location. As a result, the gas content gradually decreases. It is important to note that the decrease in gas content may not follow a linear trend, as other factors such as initial gas content, rock mechanical properties, and the type of fracturing fluid used can also affect the final outcome. Furthermore, studying the distribution of shale gas content under various permeability conditions provides valuable insights into the feasibility and optimization of shale gas extraction processes. Future research should aim to further explore the relationship between permeability and gas content, as well as its implications for overall shale gas extraction efficiency. Additionally, efforts could be directed towards developing innovative techniques to enhance gas content and improve the accuracy of numerical simulations. These endeavors will contribute to the sustainable and efficient exploitation of shale gas resources.
5. Conclusions
- (1)
- The process of gas fracturing involves the propagation of cracks within rock specimens from the borehole towards the interior, eventually leading to complete fracturing. The efficiency of shale gas extraction is significantly affected by variations in rock parameters, and selecting appropriate rock parameters can enhance the extraction efficiency of shale gas.
- (2)
- The thermal aspect significantly influences the efficacy of gas fracturing. Lower temperatures result in poor gas fracturing effects, leading to lower efficiency in extracting shale gas. On the other hand, higher temperatures enhance the effectiveness of gas fracturing, resulting in higher extraction efficiency. Therefore, maintaining an appropriately high temperature can improve gas fracturing efficiency and promote more efficient shale gas extraction. It is important to note that gas fracturing technology can induce damage to the surrounding rocks, reducing their compressive strength while increasing their permeability. Additionally, under the influence of temperature, gas fracturing technology can achieve even better results.
- (3)
- Increasing the volume constant leads to an upward trend in gas content. This indicates that during the gas fracturing process, the gas present around the borehole is extracted, resulting in a significant decrease in gas content. However, the gas content within the undamaged regions of the rock specimen remains relatively stable. This suggests that an increase in the volume constant makes gas fracturing more challenging, consequently reducing the efficiency of shale gas extraction. Conversely, maintaining a constant pressure of the specimen results in an upward trajectory of the instantaneous extraction rate over the same time period. This increase in the pressure constant improves the fracturing effects on the rock, thereby enhancing gas extraction efficiency. Moreover, the increased degree of rock damage indirectly contributes to improved extraction efficiency. Thus, increasing the pressure constant proves beneficial for enhancing gas fracturing efficiency.
Author Contributions
Conceptualization, E.Q., F.X. and Z.C.; Methodology, Y.Z. and Y.X.; Data curation, Z.Z. and M.J. All authors have read and agreed to the published version of the manuscript.
Funding
The authors are grateful to the financial support from the Key Research and Development Program of Shaanxi Province, China (2022ZDLSF07-06 and 2023-YBSF-369), and the Natural Science Basic Research Program of Shaanxi (2022JM-216 and 2022JC-LHJJ-08).
Institutional Review Board Statement
Not applicable.
Informed Consent Statement
Not applicable.
Data Availability Statement
The data used to support the findings of this study are included within the article.
Conflicts of Interest
The authors declare no conflict of interest.
References
- Hemmati-Sarapardeh, A.; Mohagheghian, E. Modeling interfacial tension and minimum miscibility pressure in paraffin-nitrogen systems: Application to gas injection processes. Fuel 2017, 205, 80–89. [Google Scholar] [CrossRef]
- Fahandezhsaadi, M.; Amooie, M.A.; Hemmati-Sarapardeh, A.; Ayatollahi, S.; Schaffie, M.; Ranjbar, M. Laboratory evaluation of nitrogen injection for enhanced oil recovery: Effects of pressure and induced fractures. Fuel 2019, 253, 607–614. [Google Scholar] [CrossRef]
- Rui, Z.; Wang, X.; Zhang, Z.; Lu, J.; Chen, G.; Zhou, X.; Patil, S. A realistic and integrated model for evaluating oil sands development with Steam Assisted Gravity Drainage technology in Canada. Appl. Energy 2018, 213, 76–91. [Google Scholar] [CrossRef]
- Babadagli, T. Evaluation of EOR methods for heavy-oil recovery in naturally fractured reservoirs. J. Pet. Sci. Eng. 2003, 37, 25–37. [Google Scholar] [CrossRef]
- Yang, W.; Wang, H.; Zhuo, Q.; Lin, B.; Zhang, J.; Lu, C.; Lin, M. Mechanism of water inhibiting gas outburst and the field experiment of coal seam infusion promoted by blasting. Fuel 2019, 251, 383–393. [Google Scholar] [CrossRef]
- Zhou, J.; Liu, M.; Xian, X.; Jiang, Y.; Liu, Q.; Wang, X. Measurements and modelling of CH4 and CO2 adsorption behaviors on shales: Implication for CO2 enhanced shale gas recovery. Fuel 2019, 251, 293–306. [Google Scholar] [CrossRef]
- Wang, L.; Yao, B.; Cha, M.; Alqahtani, N.B.; Patterson, T.W.; Kneafsey, T.J.; Miskimins, J.L.; Yin, X.; Wu, Y.-S. Waterless fracturing technologies for unconventional reservoirs-opportunities for liquid nitrogen. J. Nat. Gas Sci. Eng. 2016, 35, 160–174. [Google Scholar] [CrossRef]
- Thomas, L.; Tang, H.; Kalyon, D.M.; Aktas, S.; Arthur, J.D.; Blotevogel, J.; Carey, J.W.; Filshill, A.; Fu, P.; Hsuan, G.; et al. Toward better hydraulic fracturing fluids and their application in energy production: A review of sustainable technologies and reduction of potential environmental impacts. J. Pet. Sci. Eng. 2019, 173, 793–803. [Google Scholar] [CrossRef]
- Li, L.; Tan, J.; Wood, D.A.; Zhao, Z.; Becker, D.; Lyu, Q.; Shu, B.; Chen, H. A review of the current status of induced seismicity monitoring for hydraulic fracturing in unconventional tight oil and gas reservoirs. Fuel 2019, 242, 195–210. [Google Scholar] [CrossRef]
- Tokunaga, T.K. Physicochemical controls on adsorbed water film thickness in unsaturated geological media. Water Resour. Res. 2011, 47, W08514. [Google Scholar] [CrossRef]
- Yang, W.; Zhou, C.; Qin, F.; Li, D. High-energy gas fracturing (HEGF) technology: Research and application. In Proceedings of the European Petroleum Conference, Cannes, France, 16–18 November 1992; p. 24990. [Google Scholar]
- Li, Z.; Xu, H.; Zhang, C. Liquid nitrogen gasification fracturing technology for shale gas development. J. Pet. Sci. Eng. 2016, 138, 253–256. [Google Scholar] [CrossRef]
- Cai, C.; Li, G.; Huang, Z.; Shen, Z.; Tian, S. Rock pore structure damage due to freeze during liquid nitrogen fracturing. Arab. J. Sci. Eng. 2014, 39, 9249–9257. [Google Scholar] [CrossRef]
- Cai, C.; Li, G.; Huang, Z.; Tian, S.; Shen, Z.; Fu, X. Experiment of coal damage due to super-cooling with liquid nitrogen. J. Nat. Gas Sci. Eng. 2015, 22, 42–48. [Google Scholar] [CrossRef]
- Li, H.; Wang, L.; Zhang, C.; Du, W.; Li, J. Experimental study of the fatigue crack extension influences of liquid nitrogen on water cut coal sample. J. Exp. Mech. 2016, 31, 119–126. [Google Scholar]
- Zhai, C.; Qin, L.; Liu, S.; Xu, J.; Tang, Z.; Wu, S. Pore structure in coal: Pore evolution after cryogenic freezing with cyclic liquid nitrogen injection and its implication on coalbed methane extraction. Energy Fuels 2016, 30, 6009–6020. [Google Scholar] [CrossRef]
- Cai, Y.; Ma, Y.; Teng, T.; Xue, Y.; Wang, L.; Cao, Z.; Zhang, Z. Risk Assessment and Analysis of Rock Burst under High-Temperature Liquid Nitrogen Cooling. Water 2024, 16, 516. [Google Scholar] [CrossRef]
- Chen, Z.; Liu, J.; Kabir, A.; Wang, J.; Pan, Z. Impact of various parameters on the production of coalbed methane. SPE J. 2013, 18, 910–923. [Google Scholar] [CrossRef]
- Gensterblum, Y.; Busch, A.; Krooss, B.M. Molecular concept and experimental evidence of competitive adsorption of H2O, CO2 and CH4 on organic material. Fuel 2014, 115, 581–588. [Google Scholar] [CrossRef]
- Wu, C.; Chu, J.; Wu, S.; Hong, Y. 3D characterization of microbially induced carbonate precipitation in rock fracture and the resulted permeability reduction. Eng. Geol. 2019, 249, 23–30. [Google Scholar] [CrossRef]
- Wanniarachchi, W.A.M.; Ranjith, P.G.; Perera, M.S.A. Shale gas fracturing using foam-based fracturing fluid: A review. Environ. Earth Sci. 2017, 76, 91. [Google Scholar] [CrossRef]
- King, G.E. Thirty years of gas shale fracturing: What have we learned? In Proceedings of the SPE Annual Technical Conference and Exhibition, Florence, Italy, 19–22 September 2010. [Google Scholar]
- Barati, R.; Liang, J. A review of fracturing fluid systems used for hydraulic fracturing of oil and gas wells. J. Appl. Polym. Sci. 2014, 16, 131. [Google Scholar] [CrossRef]
- Green, C.A.; Styles, P.; Baptie, B.J. Preese Hall Shale Gas Fracturing Review and Recommendations for Induced Seismic Mitigation; Technical Report; British Geological Survey: London, UK, 2012. [Google Scholar]
- Karra, S.; Makedonska, N.; Viswanathan, H.S.; Painter, S.L.; Hyman, J.D. Effect of advective flow in fractures and matrix diffusion on natural gas production. Water Resour. Res. 2015, 51, 8646–8657. [Google Scholar] [CrossRef]
- Edwards, R.W.; Doster, F.; Celia, M.A.; Bandilla, K.W. Numerical modeling of gas and water flow in shale gas formations with a focus on the fate of hydraulic fracturing fluid. Environ. Sci. Technol. 2017, 51, 13779–13787. [Google Scholar] [CrossRef]
- Eyring, V.; Bony, S.; Meehl, G.A.; Senior, C.A.; Stevens, B.; Stouffer, R.J.; Taylor, K.E. Overview of the Coupled Model Intercomparison Project Phase 6 (CMIP6) experimental design and organization. Geosci. Model Dev. 2016, 9, 1937–1958. [Google Scholar] [CrossRef]
- Striolo, A.; Cole, D.R. Understanding Shale Gas: Recent Progress and Remaining Challenges. Energy Fuels 2017, 31, 10300–10310. [Google Scholar] [CrossRef]
- Tenno, T.; Rikmann, E.; Zekker, I. Modelling the solubility of sparingly soluble compounds depending on their particles size. Proc. Estonian Acad. Sci. 2018, 67, 300–302. [Google Scholar] [CrossRef]
- Middleton, R.S.; Gupta, R.; Hyman, J.D.; Viswanathan, H.S. The shale gas revolution: Barriers, sustainability, and emerging opportunities. Appl. Energy 2017, 199, 88–95. [Google Scholar] [CrossRef]
- Bitzek, E.; Kermode, J.R.; Gumbsch, P. Atomistic aspects of fracture. Int. J. Fract. 2015, 191, 13–30. [Google Scholar] [CrossRef]
- Khan, A.; Naeem, M.; Zekker, I.; Arian, M.B.; Michalski, G.; Khan, A.; Shah, N.; Zeeshan, S.; Haq, H.U.; Subhan, F.; et al. Evaluating groundwater nitrate and other physicochemical parameters of the arid and semi-arid district of DI Khan by multivariate statistical analysis. Environ. Technol. 2023, 44, 911–920. [Google Scholar] [CrossRef] [PubMed]
Figure 1.
Schematic diagram of shale gas reservoir exploitation.

Figure 2.
Establishment of a numerical simulation model for gas pressure-induced fracturing in rock specimens.
Figure 2.
Establishment of a numerical simulation model for gas pressure-induced fracturing in rock specimens.

Figure 3.
Graph of crack damage development in specimens.

Figure 4.
Graph of the variation of the first principal stress with time during the damage process.

Figure 5.
Graph of the variation of the third principal stress with time during the damage process.

Figure 6.
The graph depicting the change in permeability over time during the damage process.

Figure 7.
The graph depicting the change in pressure exerted on the rock specimen over time, without considering the temperature field.
Figure 7.
The graph depicting the change in pressure exerted on the rock specimen over time, without considering the temperature field.

Figure 8.
The entire unit was simulated using a line within the unit cell to represent the overall situation.
Figure 8.
The entire unit was simulated using a line within the unit cell to represent the overall situation.

Figure 9.
The gas content at different positions and times along the wellbore is influenced by varying temperatures.
Figure 9.
The gas content at different positions and times along the wellbore is influenced by varying temperatures.

Figure 10.
The relationship between gas content along the wellbore and different temperatures at the same time.
Figure 10.
The relationship between gas content along the wellbore and different temperatures at the same time.

Figure 11.
The shale gas content at different positions and times along the wellbore varies under different VL values.
Figure 11.
The shale gas content at different positions and times along the wellbore varies under different VL values.

Figure 12.
The relationship between shale gas content in the rock mass and different VL values at the same time.
Figure 12.
The relationship between shale gas content in the rock mass and different VL values at the same time.

Figure 13.
The shale gas content at different positions and times along the wellbore varies under different PL values.
Figure 13.
The shale gas content at different positions and times along the wellbore varies under different PL values.

Figure 14.
Relationship between shale gas content of rock mass specimens at the same time under different PL.
Figure 14.
Relationship between shale gas content of rock mass specimens at the same time under different PL.

Figure 15.
The relationship between the gas content of rock mass specimens at the same time under different permeability.
Figure 15.
The relationship between the gas content of rock mass specimens at the same time under different permeability.

Figure 16.
The relationship between shale gas content of rock mass specimens at the same time under different permeability.
Figure 16.
The relationship between shale gas content of rock mass specimens at the same time under different permeability.

Disclaimer/Publisher’s Note: The statements, opinions and data contained in all publications are solely those of the individual author(s) and contributor(s) and not of MDPI and/or the editor(s). MDPI and/or the editor(s) disclaim responsibility for any injury to people or property resulting from any ideas, methods, instructions or products referred to in the content. |
© 2024 by the authors. Licensee MDPI, Basel, Switzerland. This article is an open access article distributed under the terms and conditions of the Creative Commons Attribution (CC BY) license (https://creativecommons.org/licenses/by/4.0/).
Share and Cite
MDPI and ACS Style
Qi, E.; Xiong, F.; Cao, Z.; Zhang, Y.; Xue, Y.; Zhang, Z.; Ji, M. Simulation of Gas Fracturing in Reservoirs Based on a Coupled Thermo-Hydro-Mechanical-Damage Model. Appl. Sci. 2024, 14, 1763. https://doi.org/10.3390/app14051763
AMA Style
Qi E, Xiong F, Cao Z, Zhang Y, Xue Y, Zhang Z, Ji M. Simulation of Gas Fracturing in Reservoirs Based on a Coupled Thermo-Hydro-Mechanical-Damage Model. Applied Sciences. 2024; 14(5):1763. https://doi.org/10.3390/app14051763
Chicago/Turabian StyleQi, Enze, Fei Xiong, Zhengzheng Cao, Yun Zhang, Yi Xue, Zhizhen Zhang, and Ming Ji. 2024. "Simulation of Gas Fracturing in Reservoirs Based on a Coupled Thermo-Hydro-Mechanical-Damage Model" Applied Sciences 14, no. 5: 1763. https://doi.org/10.3390/app14051763
Note that from the first issue of 2016, this journal uses article numbers instead of page numbers. See further details here.