
Noise Separation Technique for Enhancing Substation Noise Assessment Using the Phase Conjugation Method
1
Electric Power Research Institute of Guangdong Power Grid Co., Ltd., Guangzhou 510080, China
2
School of Naval Architecture, Dalian University of Technology, Dalian 116024, China
*
Author to whom correspondence should be addressed.
Appl. Sci. 2024, 14(5), 1761; https://doi.org/10.3390/app14051761
Submission received: 3 February 2024
/
Revised: 17 February 2024
/
Accepted: 19 February 2024
/
Published: 21 February 2024
Abstract
:The intrinsic noise of different transformers in the same substation belongs to the same type of noise, which is strongly coherent and difficult to separate, greatly increasing the cost of substation noise assessment and treatment. To solve the problem, the present paper proposes a noise separation technique using the phase conjugation method to separate the intrinsic noise signals of different transformers: firstly, the reconstruction of sound source information is realized by the phase conjugation method based on the measurement and emission of a line array; secondly, the intrinsic noise signals of the sound source are obtained by the equivalent point source method. The error of the separation technique is analyzed by point source simulation, and the optimal arrangement form of the microphone line array is studied. A validation experiment in a semi-anechoic chamber is also carried out, and the results prove that the error of separation technique is less than 2dBA, which is the error tolerance of engineering applications. Finally, a noise separation test of three transformers is performed in a substation using the proposed technique. The results show that the proposed technique is able to realize the intrinsic noise separation of each transformer in the substation, which is of positive significance for substation noise assessment and management.
1. Introduction
With the development of society and economy, the demand of urban residents for electricity is growing, more and more substations are constructed near or even in residential areas, and the noise generated by the operation of power equipment in the substations has a serious impact on the daily life of the residents [1]. Noise generated by power equipment can be divided into transformer vibration radiation noise, transformer cooling system noise, corona discharge noise, and other mechanical noise from the operation of mechanical equipment [2,3,4]. And the transformer vibration radiation noise excited by electromagnetic forces can reach up to approximately 90 dBA, making it the primary noise source in substations [2,5,6,7]. For a substation with multiple-transformer equipment, in order to realize vibration and noise reduction, we often need to develop vibration and noise reduction design projects (e.g., high-quality silicon steel sheets are used as the core material during manufacturing, and vibration damping bases or soundproof panels are installed after manufacturing) for transformers one by one, which can effectively reduce transformer radiation noise, but the cost is high [6,8]. If we can separate the radiated noise of multiple transformers with the same spectral characteristics and clarify their noise contributions, we are able to develop vibration and noise reduction design only for the transformer that is the main source of noise, which greatly reduces the cost of substation environmental noise management and is of great significance for the management of substation environmental noise.
At present, there have been many investigations on the separation of different types of substation noise. For example, Li et al. [9] realized the separation of transformer intrinsic vibration noise and other noises using a vibro-acoustic coherent analysis separation technique. Wu et al. [3] used the wavelet packet analysis method combined with spectral subtraction speech enhancement technology to realize the separation of intrinsic noise, cooling device noise, and corona noise. Gosselin et al. [10] developed a new method for measuring the noise emitted by substations, achieving the separation of substation noise from background noise. Guo et al. [11] proposed a method for separating acoustic signals of Ultra-High Voltage (UHV) shunt reactors based on beamforming and uncertain blind source separation. However, the noises separated in the above investigations are noises with obvious spectral differences. The vibration noises generated by multiple transformers in a substation under the same electromagnetic excitation often have the same spectral characteristics, and the strong coherence of noises with the same frequency leads to difficulty in separating them. To our best knowledge, there have been rare papers that show how to separate the same type of noises with same frequency from different transformers.
Phase conjugation (PC) in the frequency domain is equal to time reversal (TR) in the time domain, both of which can realize reverse propagation of acoustic waves and adaptive focusing of acoustic sources. PC or TR is used for acoustic field reconstruction and focusing imaging of acoustic sources [12]. The phase conjugation or time reversal process includes conjugating received frequency-domain signals or reversing received time-domain signals emitted from a source by a receive array and transmitting acoustic signals using the conjugate or time-reversed data as source excitations from a transmit array co-located with the receive array [13] (p. 191). Commonly used phase conjugations are monopolar phase conjugation (PC/M), which is based on sound pressure measurements and constructed with monopole sources; dipolar phase conjugation (PC/D), which is based on sound pressure gradient measurements and constructed with dipole sources; and perfect phase conjugation (PC/P), which is based on sound pressure and its gradient measurements and constructed with monopole and dipole sources [14]. However, it has been rare for PC or TR to be applied in field of noise separation.
In the present paper, Section 2 establishes the noise separation technique using the phase conjugation method. A point source simulation is conducted to analyze the separation errors in Section 3.1. In Section 3.2, we design a verification experiment in a semi-anechoic chamber environment, realize the separation of the same-type noise signals with the same frequency generated by two loudspeakers, and analyze the separation error. Section 3.3 carries out a separation test of intrinsic noise signals from three transformers in a certain substation using the proposed separation technique in Section 2, and it separates the intrinsic noise of each transformer efficiently. Finally, the main results are summarized in Section 4.
2. Methods
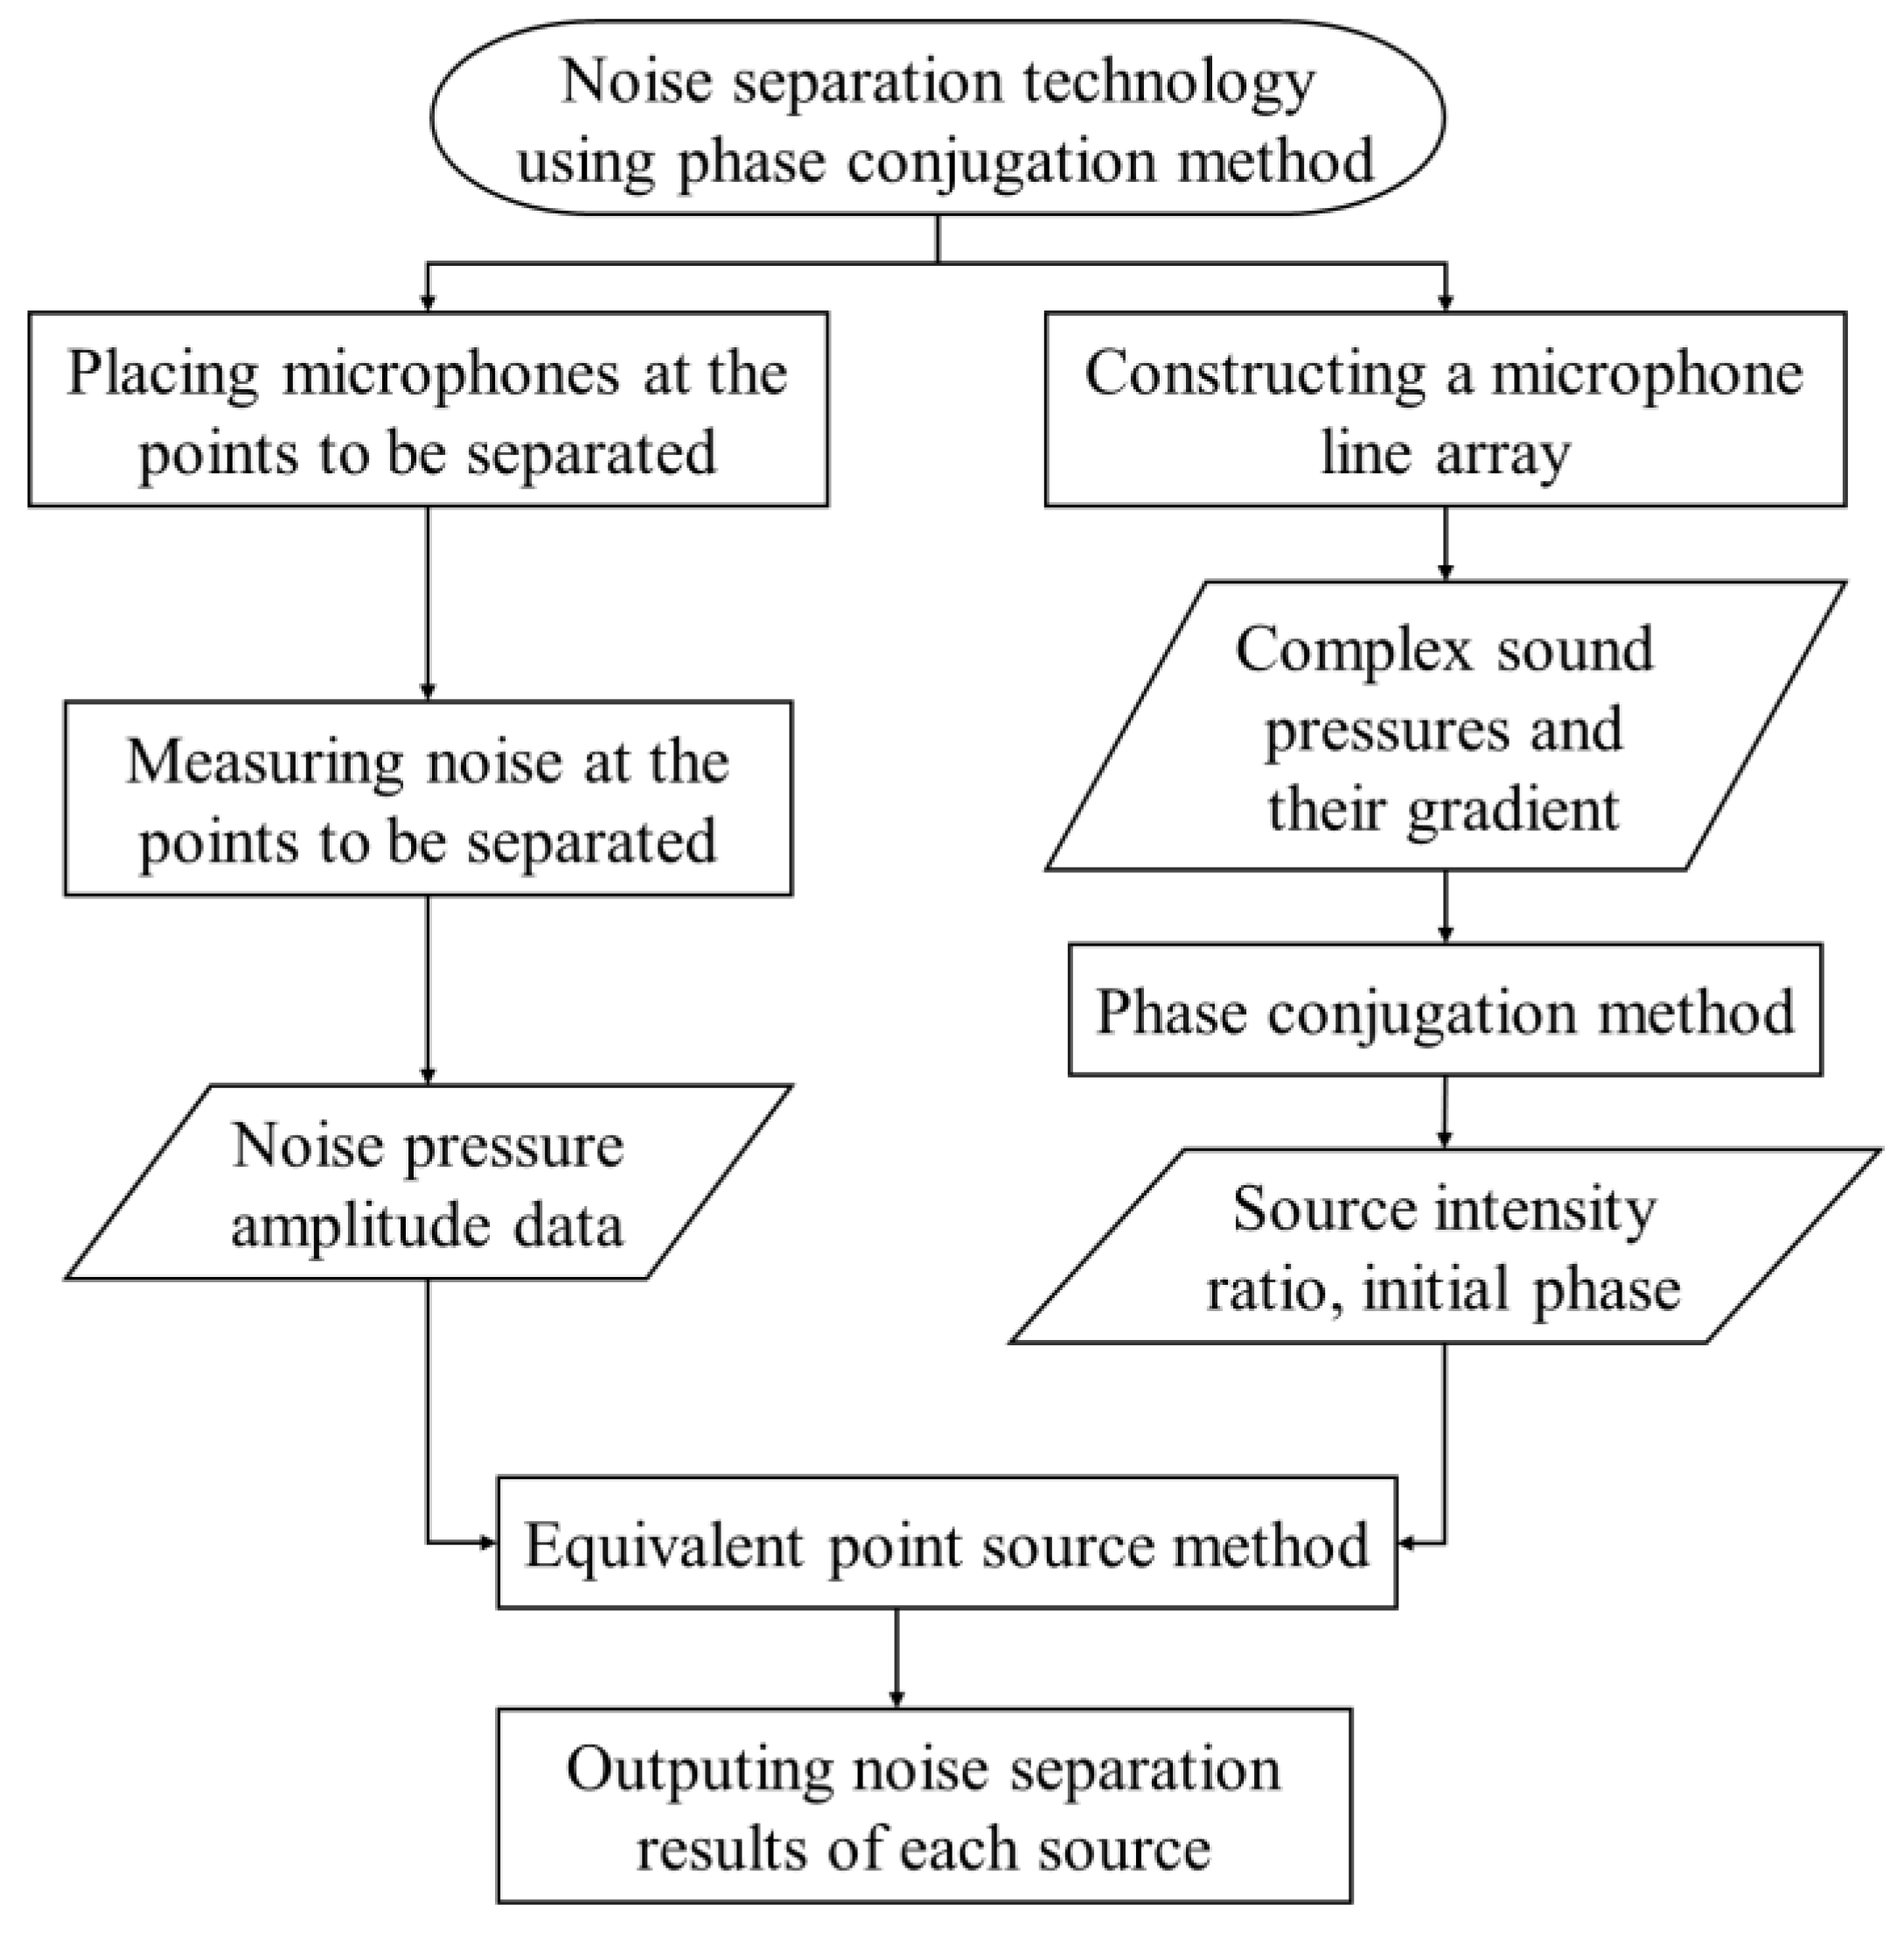
The noise separation technique using the phase conjugation method proposed in this paper is divided into reconstruction of noise source information using the phase conjugation method and calculation of noise signal separation based on the equivalent point source method. Figure 1 illustrates the process of the noise separation technique using phase conjugation:
- A microphone line array is constructed to measure the complex sound pressure and its gradient whose units are both dBA of the sound field generated by noise sources, where is the position of line array with a unit m; , whose unit is rad/s, is the circular frequency; and is the normal unit vector of microphone line array.
- The complex sound pressure and its gradient are processed by the phase conjugation method to obtain sound pressure amplitude and phase information of each noise source, where the ratio of the sound pressure amplitude is the noise source intensity ratio with 1 unit, and the opposite of the sound pressure phase value is the initial phase value of the noise source with rad unit.
- The sound pressure amplitude (dBA) of the points to be separated is measured by microphones placed at these points.
- Sound pressure separation results (dBA) of each source at the points to be separated are obtained by calculating the values in the 2nd and 3rd steps using the equivalent point source method.
The core methods used in the separation technique illustrated in Figure 1 are described below, and they mainly include how to measure complex sound pressure and its gradient, the phase conjugation method, and the equivalent point source method.
- 1.
- How to measure the complex sound pressure and its gradient
A microphone array is used to measure the steady-state sound pressure spectral signals of the radiated sound field of noise sources, and a reference microphone is fixed near the noise sources to measure the steady-state sound pressure spectral signal. The complex sound pressure of the radiated sound field of a noise source is:
where is the sound pressure amplitude obtained by self-spectral analysis of the array microphone ; is the relative phase obtained by cross-spectral analysis between the array and reference microphone ; and are, respectively, sound pressure measured by the array and reference microphones; * is the symbol of complex conjugation; i is the imaginary unit; and (s) is the time.
The sound pressure amplitude and phase can be obtained through above operations, and then the complex sound pressure and its gradient can be obtained by 3 steps. Firstly, the complex sound pressure of the noise source at the measuring microphone array location is measured. Secondly, the measuring microphone array is moved forward or backward by 1 cm and complex sound pressure at the present array location. Finally, the final sound pressure is equal to the mean of and ,, and the final sound pressure gradient is equal to where .
- 2.
- Phase conjugation method
The reason that the time reversal method can realize the reverse propagation and adaptive focusing of acoustic waves is that and are both solutions of the line acoustic wave equation where (m/s) is sound velocity of a medium. Time reversal in the time domain is equivalent to the phase conjugation in the frequency domain, i.e., and are equivalent to and [14].
According to the Helmholtz–Kirchhoff integral equation, the phase conjugation acoustic field is:
where is the noise source location, represents the location of a field point, is the location of an array microphone, means surface microphone array, is the Green function of free acoustic field, and , . Because the actual arrays are discrete, the phase conjugation acoustic field generated by a finite discrete array including elements is:
which is called the PC/P phase conjugation acoustic field. In addition, the PC/D phase conjugation acoustic field is:
and the PC/M phase conjugation acoustic field is:
The research results of [15,16] indicate that the PC/D phase conjugation method achieves the best focusing effect when the distance between the array and the sound source is within the range where the evanescent wave can be measured (, (m) is the minimum wavelength), and the PC/M phase conjugation method achieves better focusing effect when the distance between the array and the sound source is relatively far. Therefore, the PC/D phase conjugation method is used when the distance between the line array and the sources is less than while the PC/M method is adopted in other cases in the paper.
- 3.
- Equivalent point source method
The noise level of a single piece of equipment in a substation generally does not exceed 120 dB. Therefore, it is considered that the noise in the substation satisfies linear acoustic theory [9]. From linear acoustic theory, the total sound pressure at a point can be expressed as a linear superposition of the sound pressures of each source, i.e.:
where (Hz) is the frequency. The noise source sound pressure is , if the noise source is a point source. is equal to and when the source intensity ratio and phase of each source is obtained by the phase conjugation method. We substitute into Equation (6) and take the amplitude on both sides of the equation to obtain the equivalent source intensity (m3/s). Finally, the sound pressures of each source at the points to be separated can be obtained by .
3. Results and Discussion
3.1. Point Source Simulation
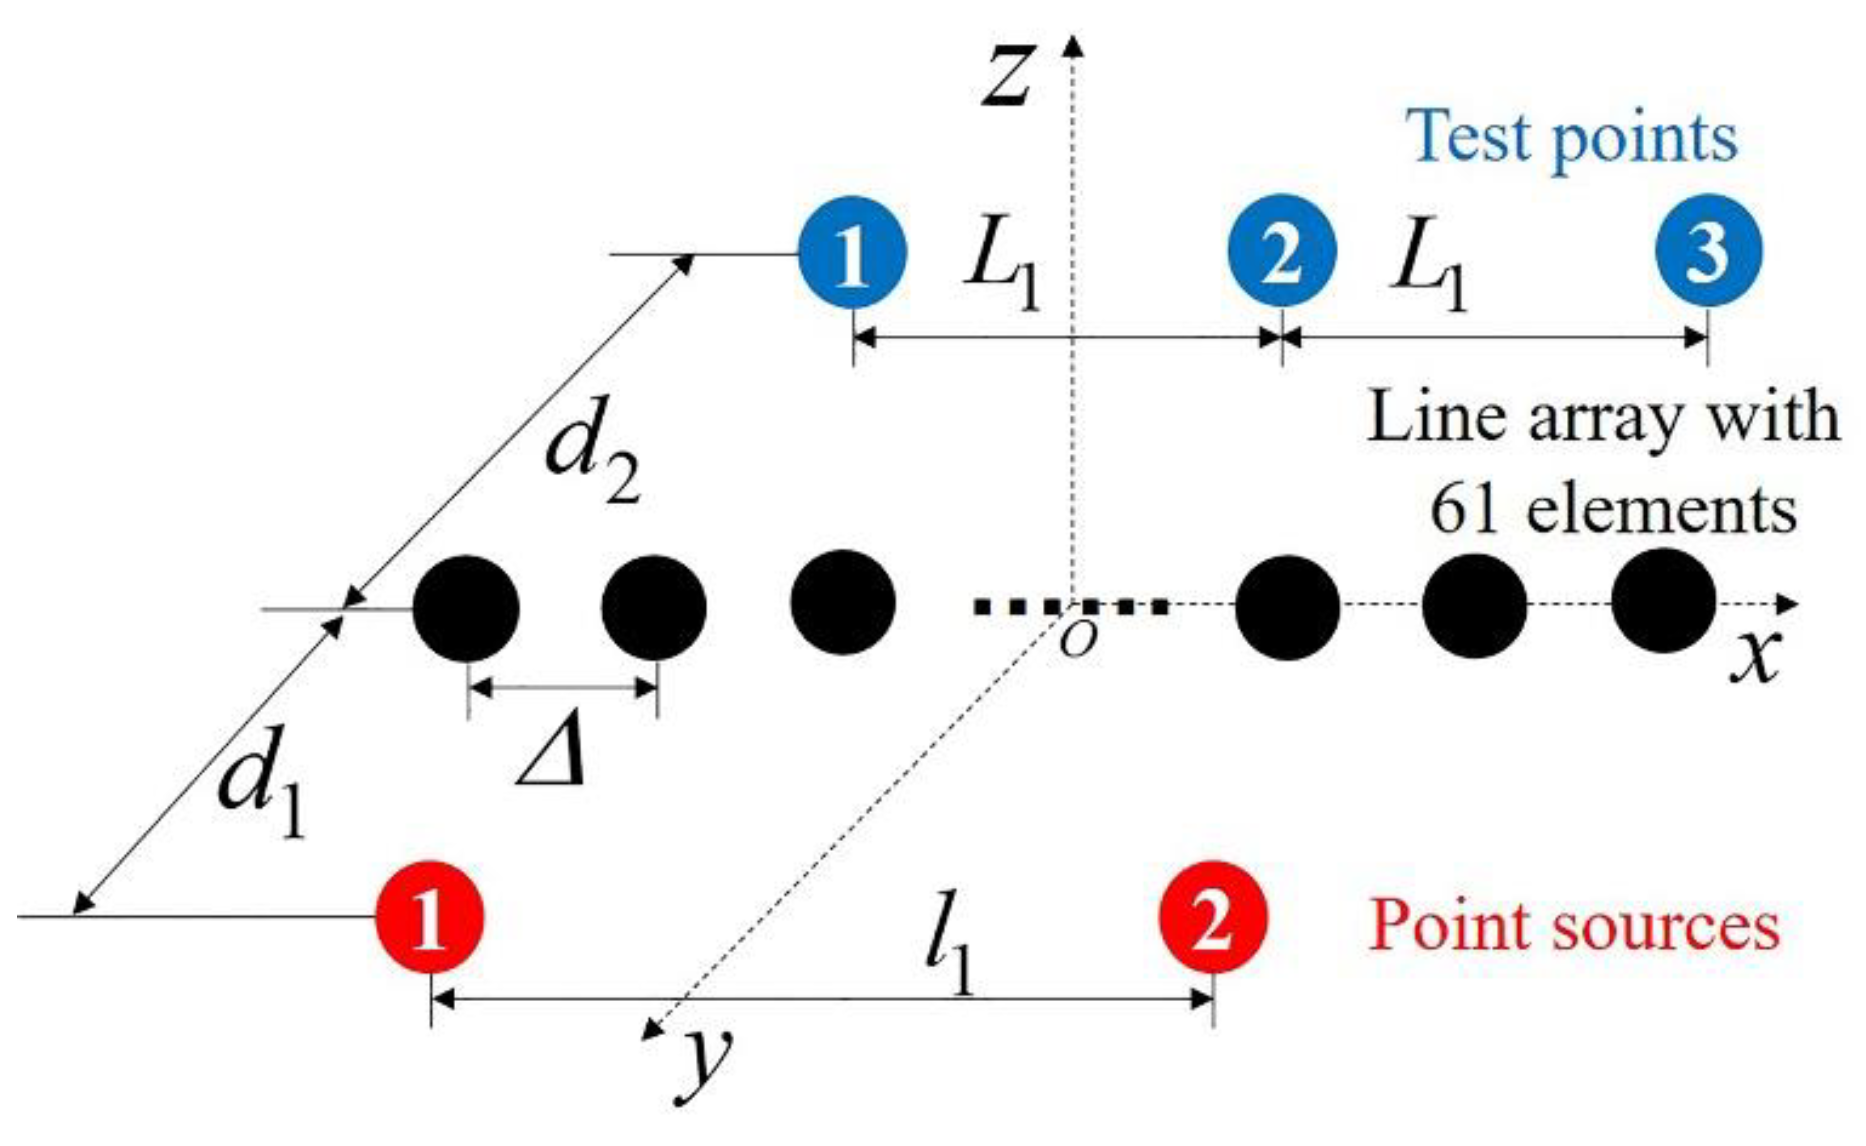
This subsection explains the process and error of the noise separation technique using the phase conjugation method by separating noise pressure caused by the first and second point sources from the total noise pressure generated by two sources at three test points. Figure 2 is the schematic diagram of the point source simulation: the distance of two sources is , which is greater than half of the maximum wavelength of the transformer noise sound wave to ensure the accuracy of phase conjugation and to better meet the requirements of the substation noise analysis environment. The distance of the test points is , and and () are, respectively, array-to-sources and array-to-test-points distances. The line array is composed of 61 microphone elements, the element spacing is , and the array aperture is , which is the best combination of array aperture and elements spacing that minimizes the separation error shown in the figures of page 7. The model shown in Figure 2 simulates acoustic field generated by two point sources in air whose density is and sound velocity is . The first and second point source intensities are and , initial phases are both 0, and frequencies are (step length is 1 Hz). The theoretical solution of the sound field generated by a point source in the air is .
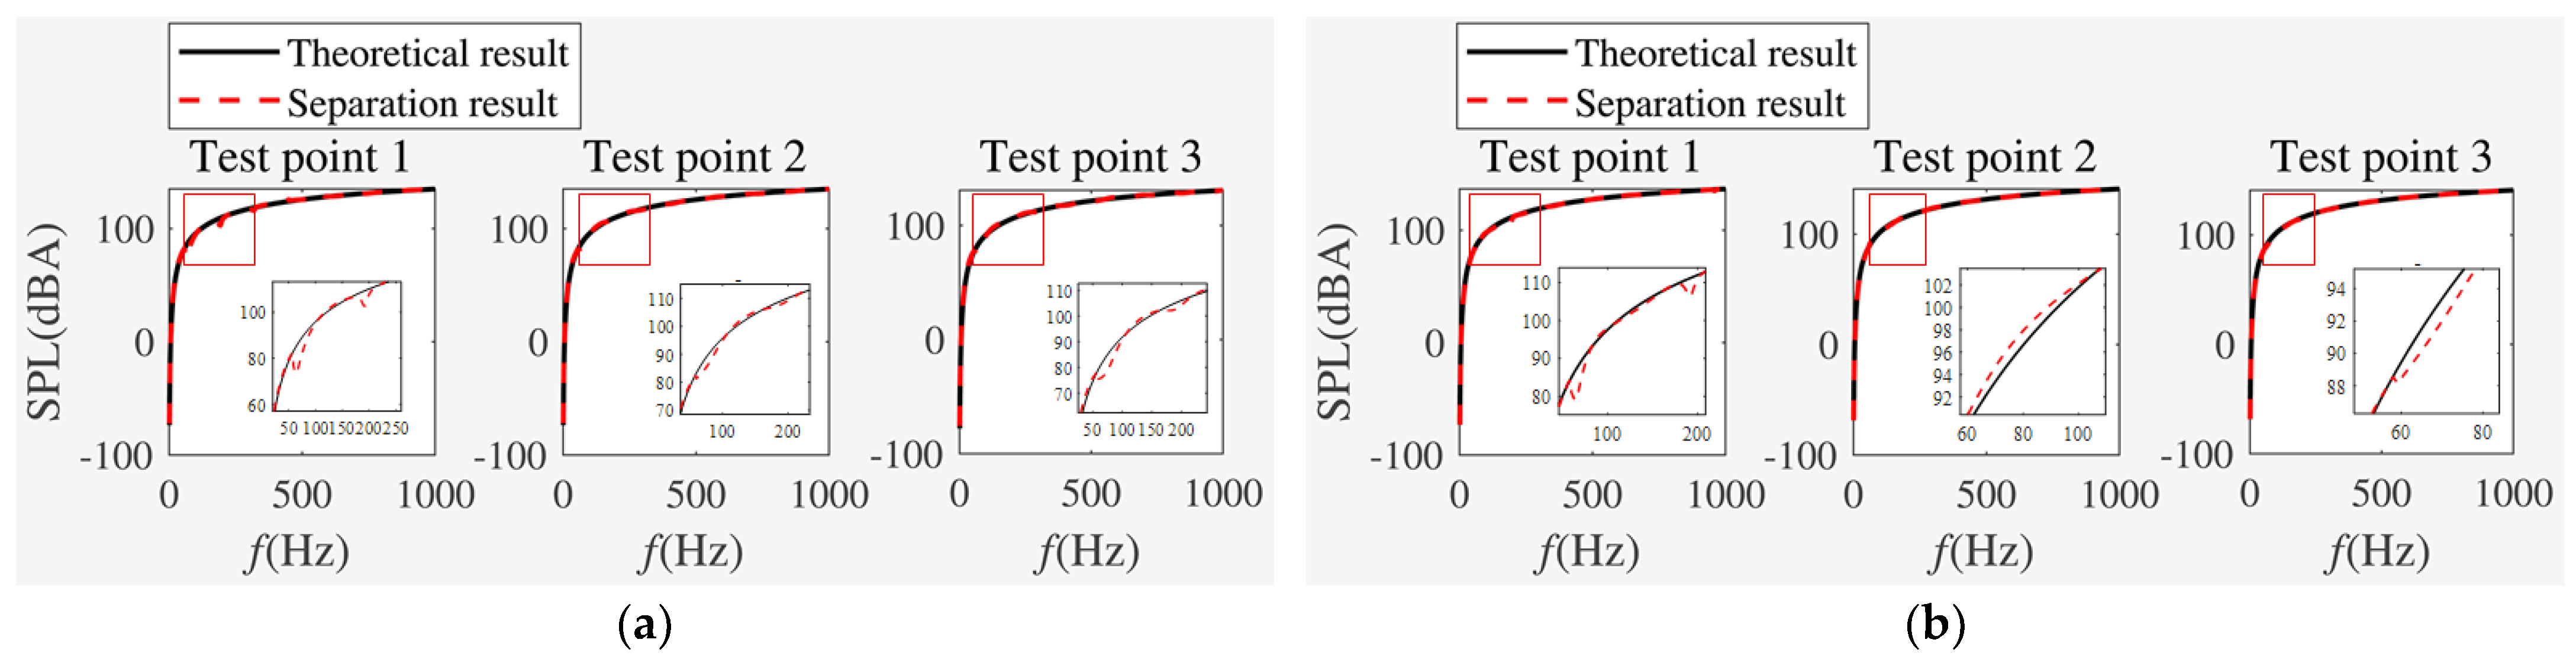
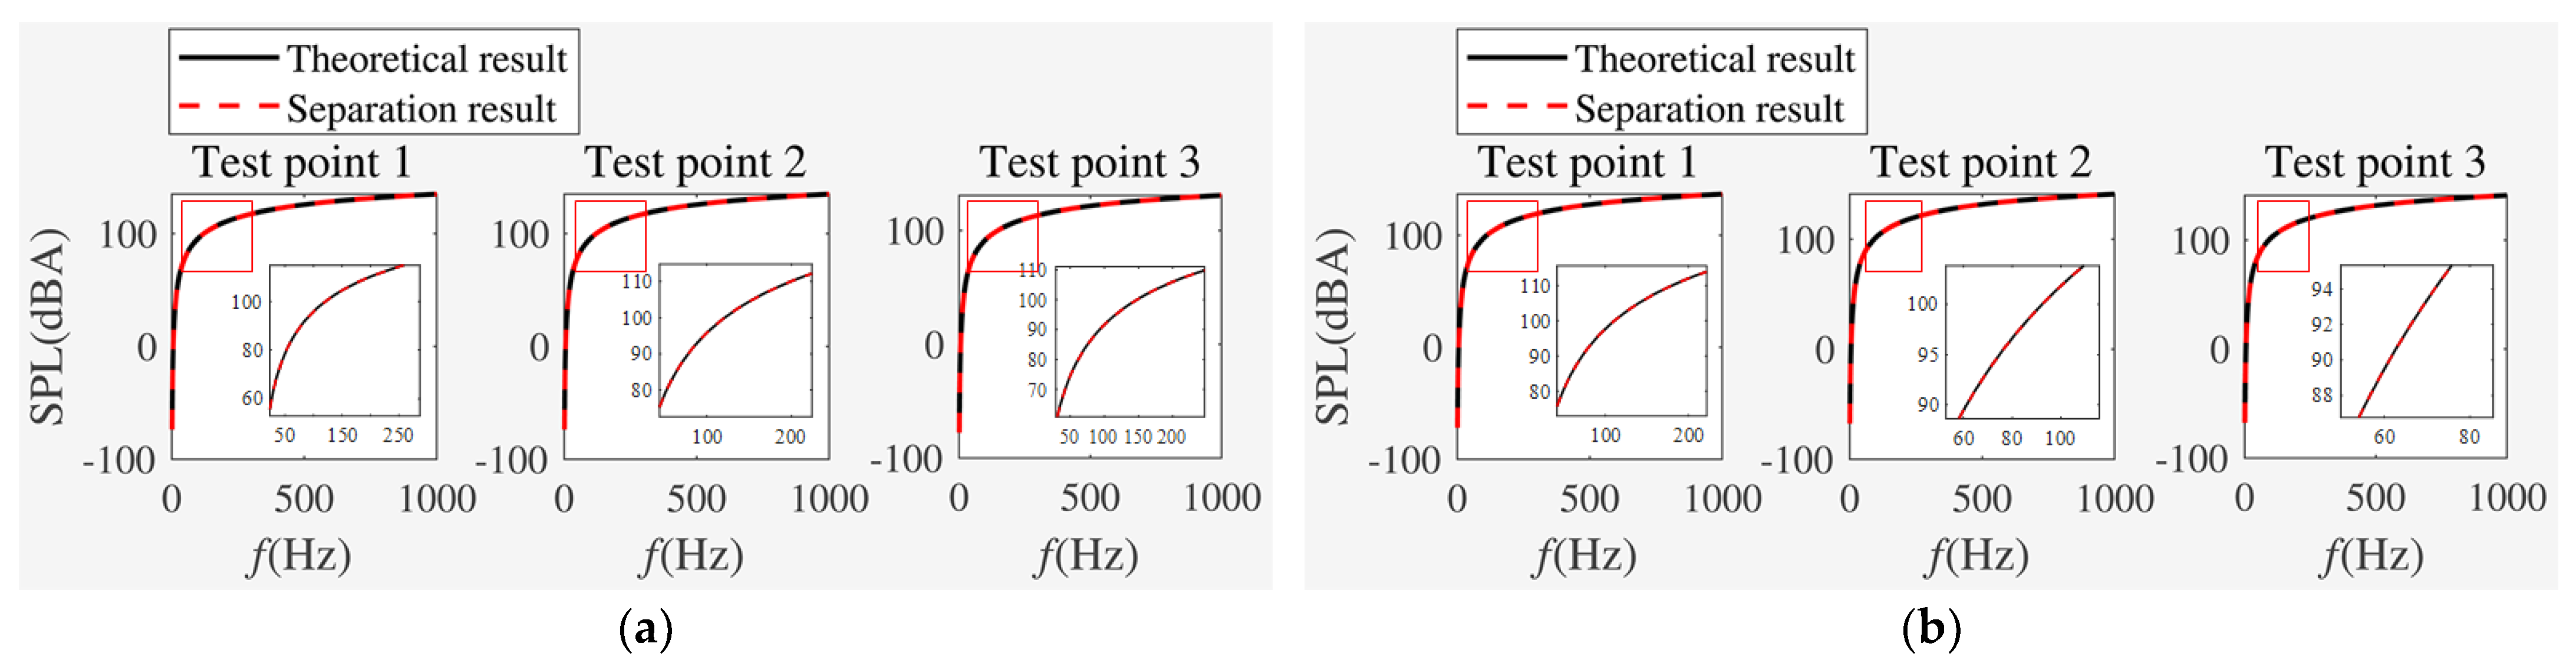
Firstly, we obtain the amplitude and phase of sound pressure and its gradient at the line microphone array according to theoretical solution of a point source in air (simulating the measurement process of the microphone array in an acoustic field), and we reconstruct the source intensity ratio and phase value of the point source using the phase conjugation method. Secondly, the sound pressure amplitudes of three test points are obtained by the theoretical solution of a point source in air, and the sound pressure amplitudes of the first, second, and third test points are obtained by the equivalent point source method. Finally, the theoretical A-weighting SPL (sound pressure level) of point sources 1 and 2 at three test points are compared with those obtained by the separation technique, and the comparison results are shown in Figure 3. It can be seen that the values of the theoretical equation and the separation technique are basically consistent at the analyzed frequencies but still have errors. In order to analyze the reasons for the errors, Figure 4 illustrates the results comparing the A-weighting SPL between the separation technique and the theoretical solution when the source intensity ratio and phase value are taken as the set values (). It can be seen that the A-weighting SPL of the separation technique and theoretical solution are completely consistent, which means that errors between the separation technique and theoretical solution originate from reconstruction errors of point source information using phase conjugation.
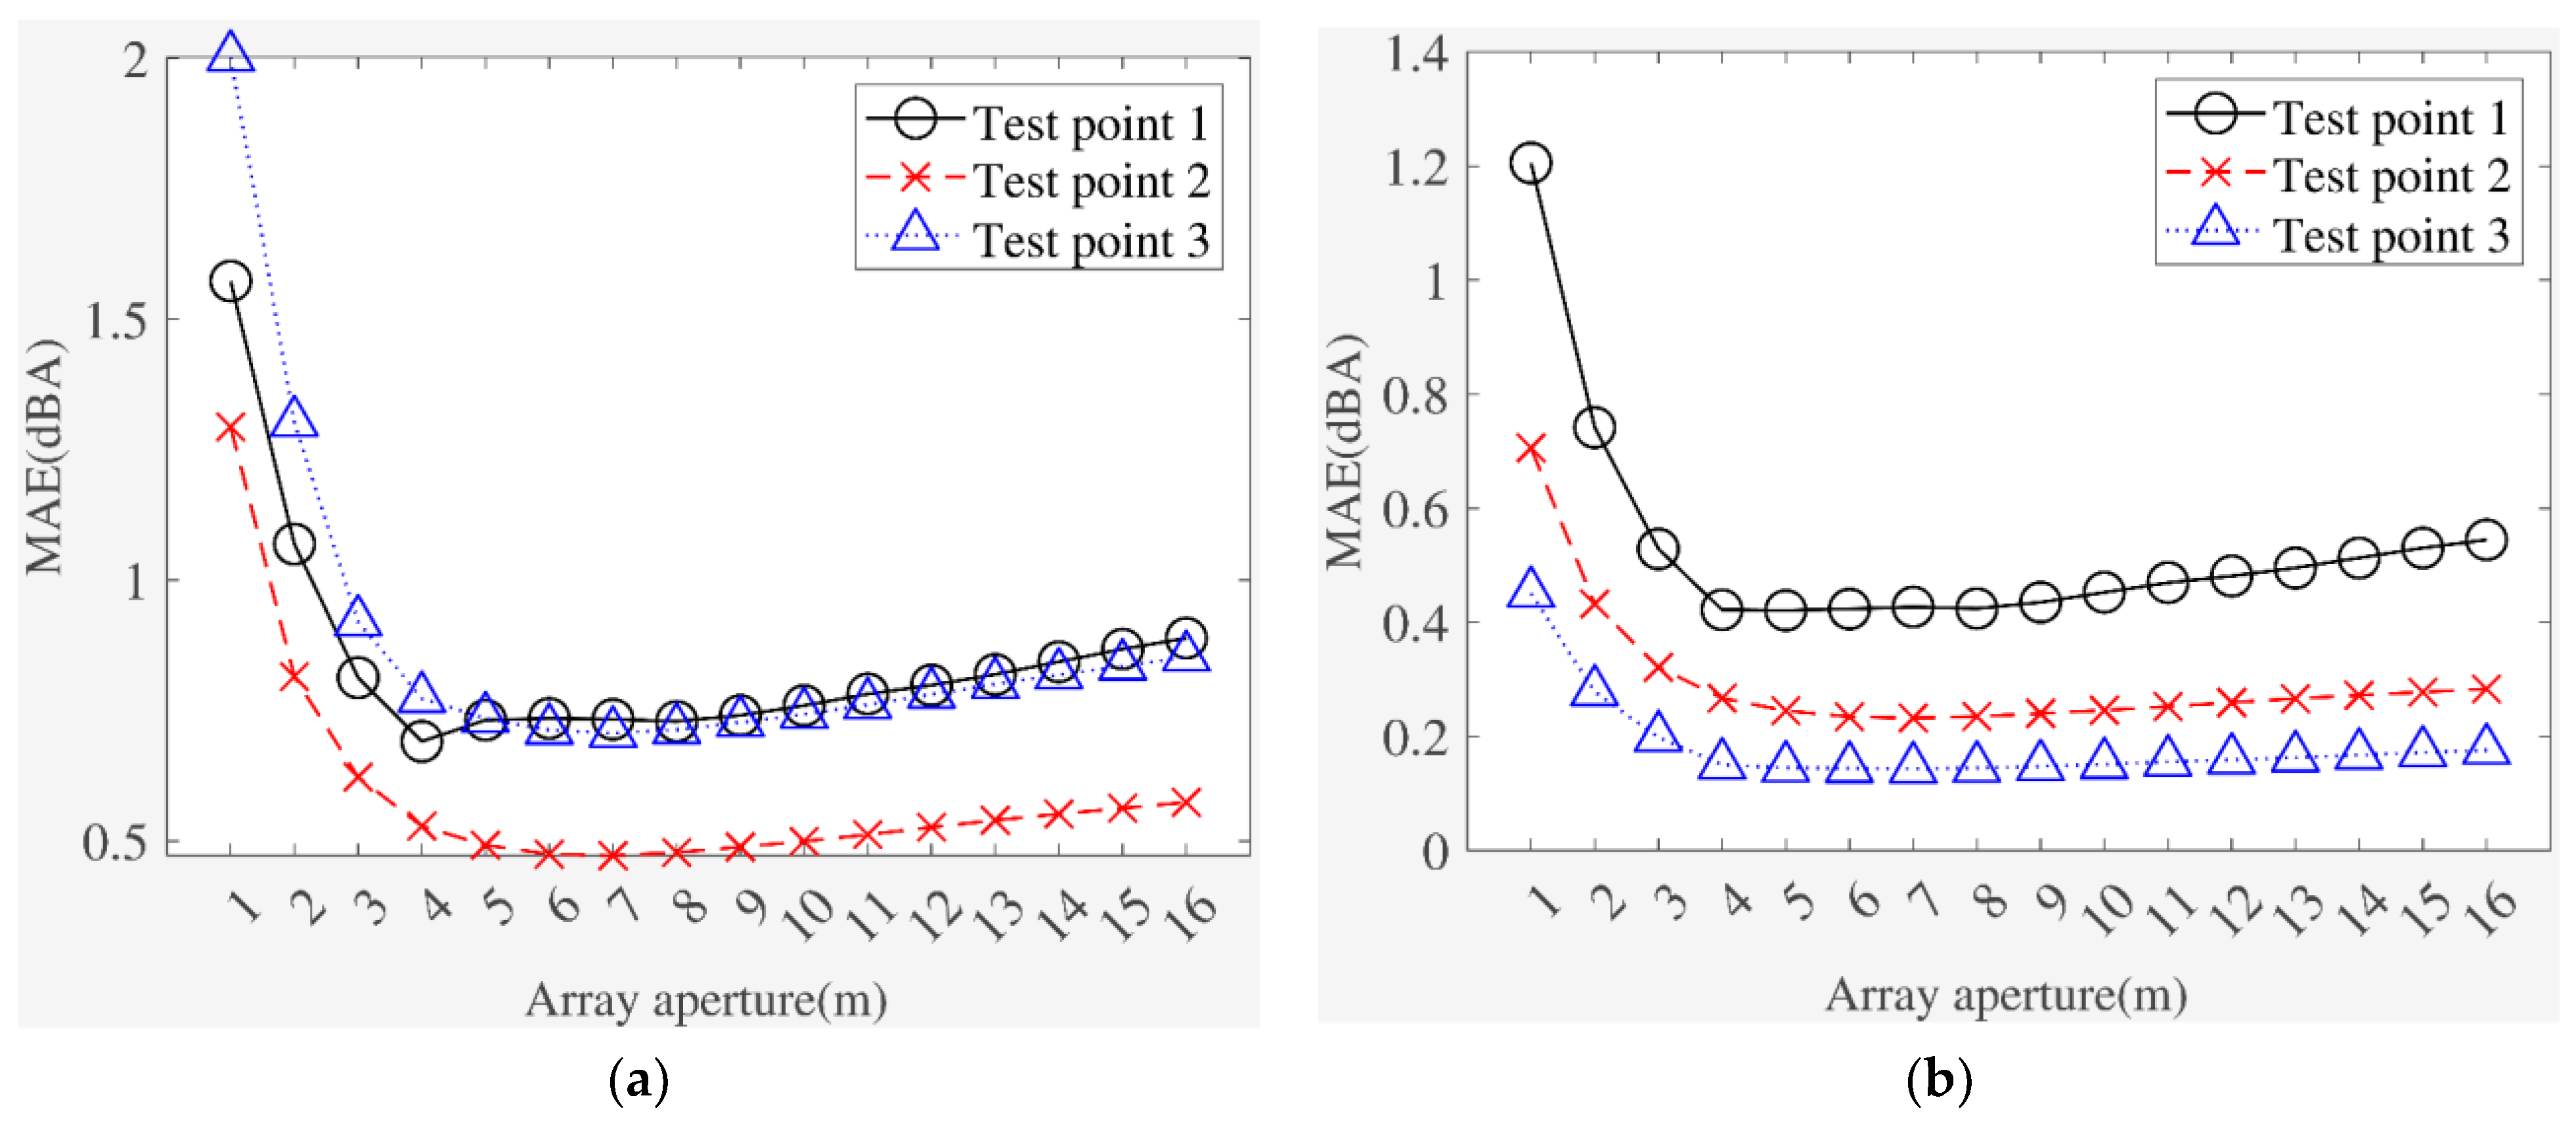
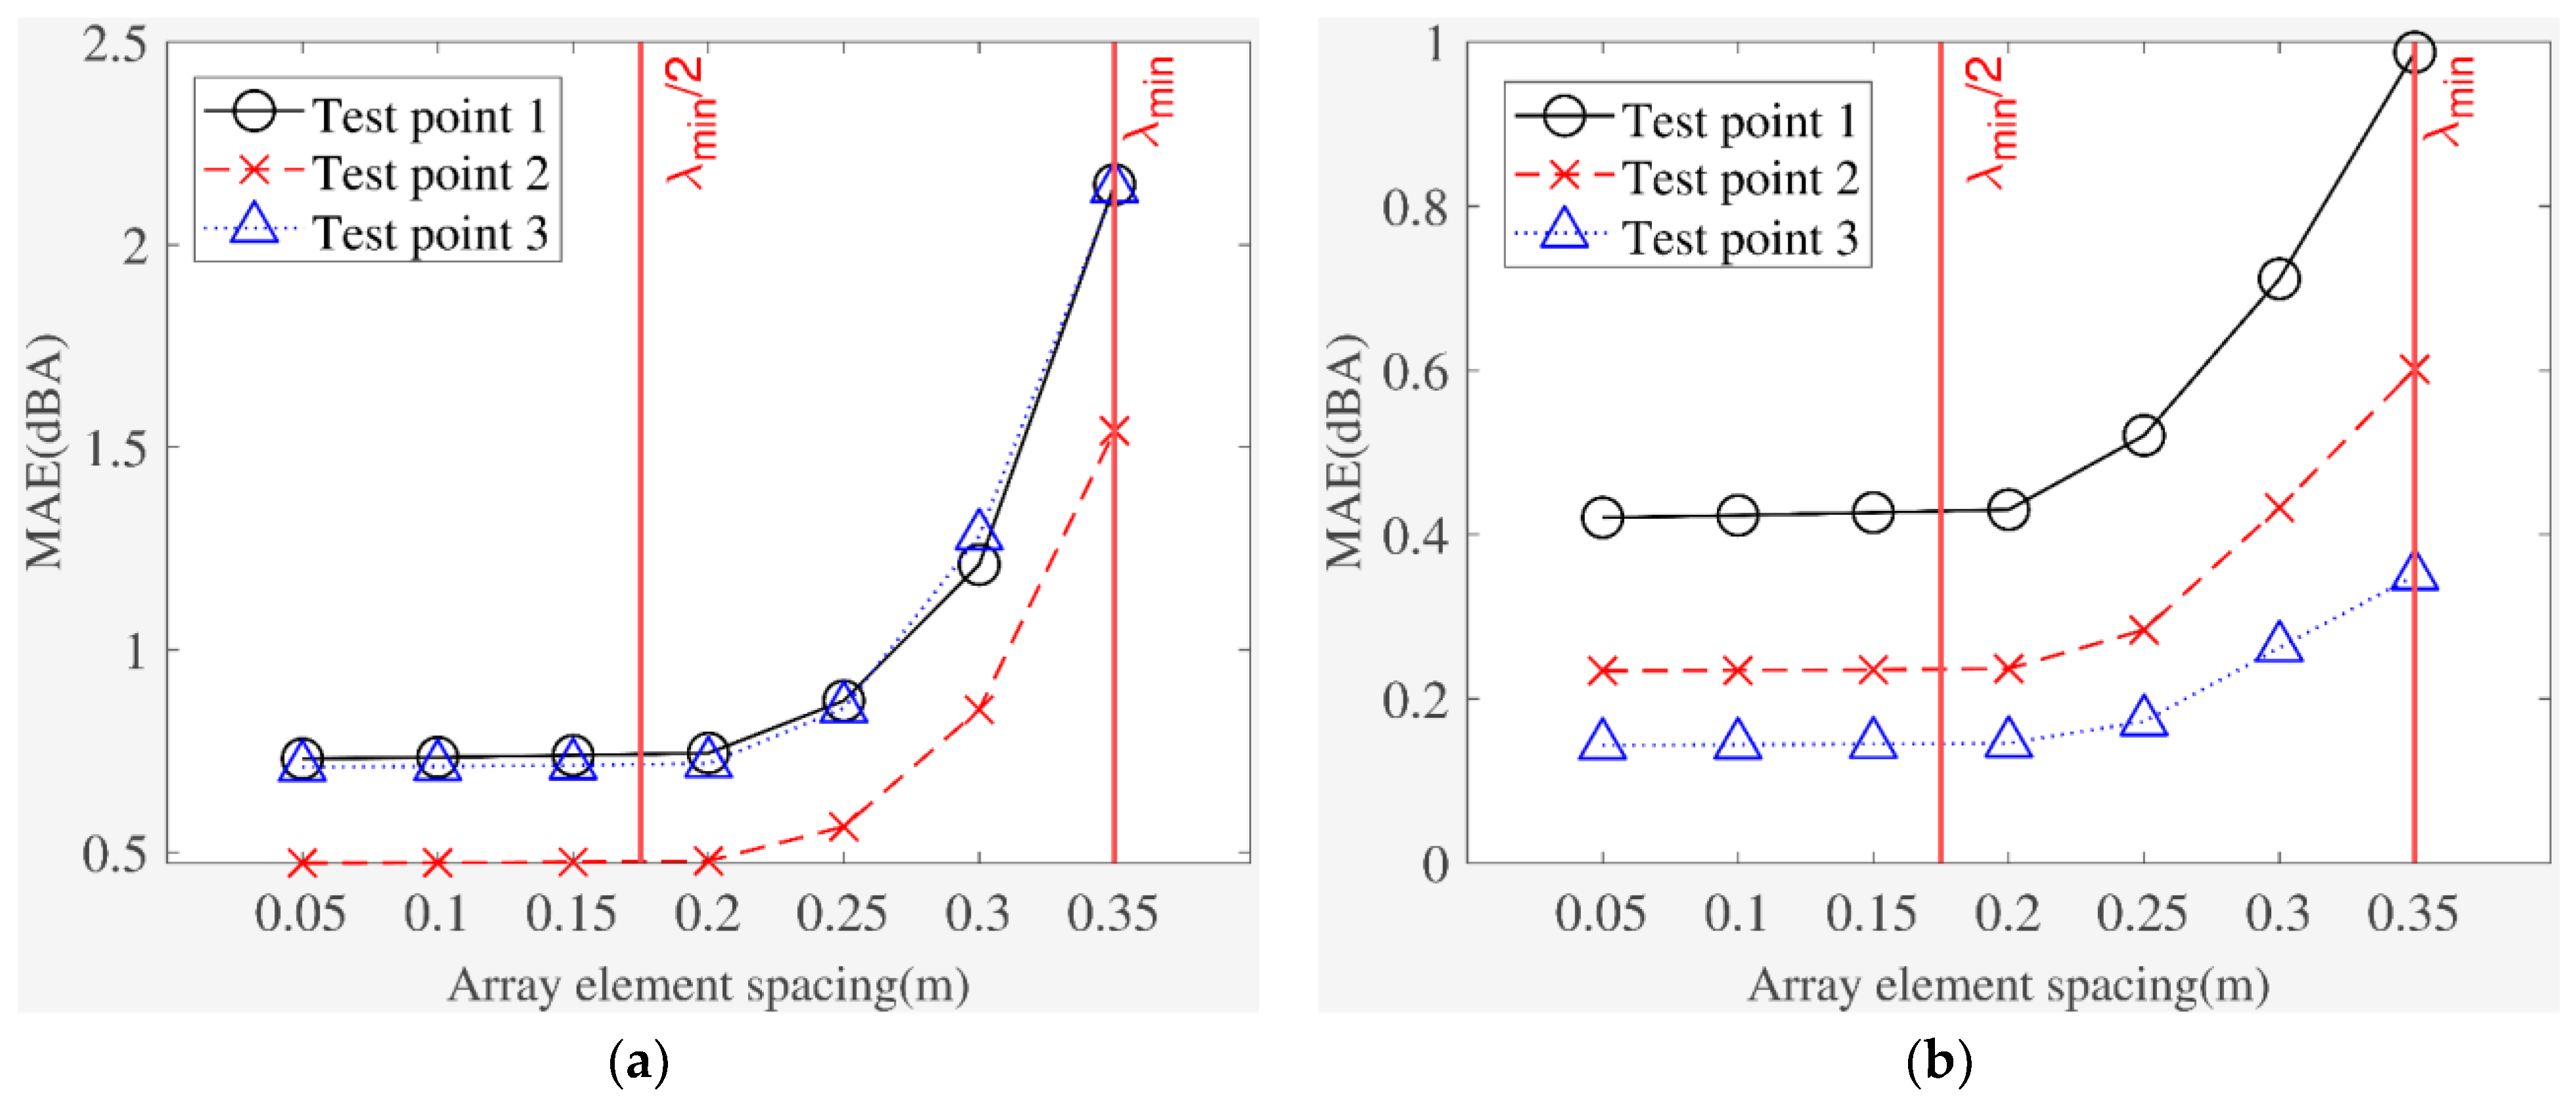
The accuracy of phase conjugation for acoustic field reconstruction and source focusing imaging is related to array aperture and element spacing. Therefore, the present paper investigates the effect of array aperture and element spacing on the error of noise separation technique using the phase conjugation method. The array element spacing is equal to 0.1 m when studying the effect of array aperture, and the array aperture is 6 m when studying the effect of array element spacing. Figure 5 and Figure 6, respectively, show the A-weighting SPL MAE (mean absolute error) variation curves with different array apertures and array element spacings at the analyzed frequencies 1–1000 Hz (step length is 1 Hz) between the separation technique and theoretical values of point sources at three test points.
As can be seen from Figure 5, the MAE first decreases and then increases with the array aperture increases for all point sources and test points, the MAE increases rapidly when the array aperture is smaller than the source distances, and the smallest error appears where the array aperture is 6 m (i.e., 1.5 times the source distances).
As can be seen from Figure 6, the MAE increases, with the array element spacing increasing for all point sources and test points, and the MAE increases rapidly when the element spacing is greater than half-wavelength at a minimum analyzed frequency of .
In practice, we can rarely obtain the best array form (aperture is 1.5 times the sources’ distance and the element spacing is smaller than ), which is restricted by noise source distribution and measuring conditions. We assume that the error tolerance for transformer noise separation in a substation is 2 dBA based on engineering application experience. It can be seen from Figure 5 and Figure 6 that the MAE satisfies the error tolerance when the array aperture is greater than the source distances (i.e., 4 m for this example) and the array element spacing is less than , which is a more practical result.
3.2. Experiment of Noise Source Separation
3.2.1. Experimental Setup in Semi-Anechoic Chamber
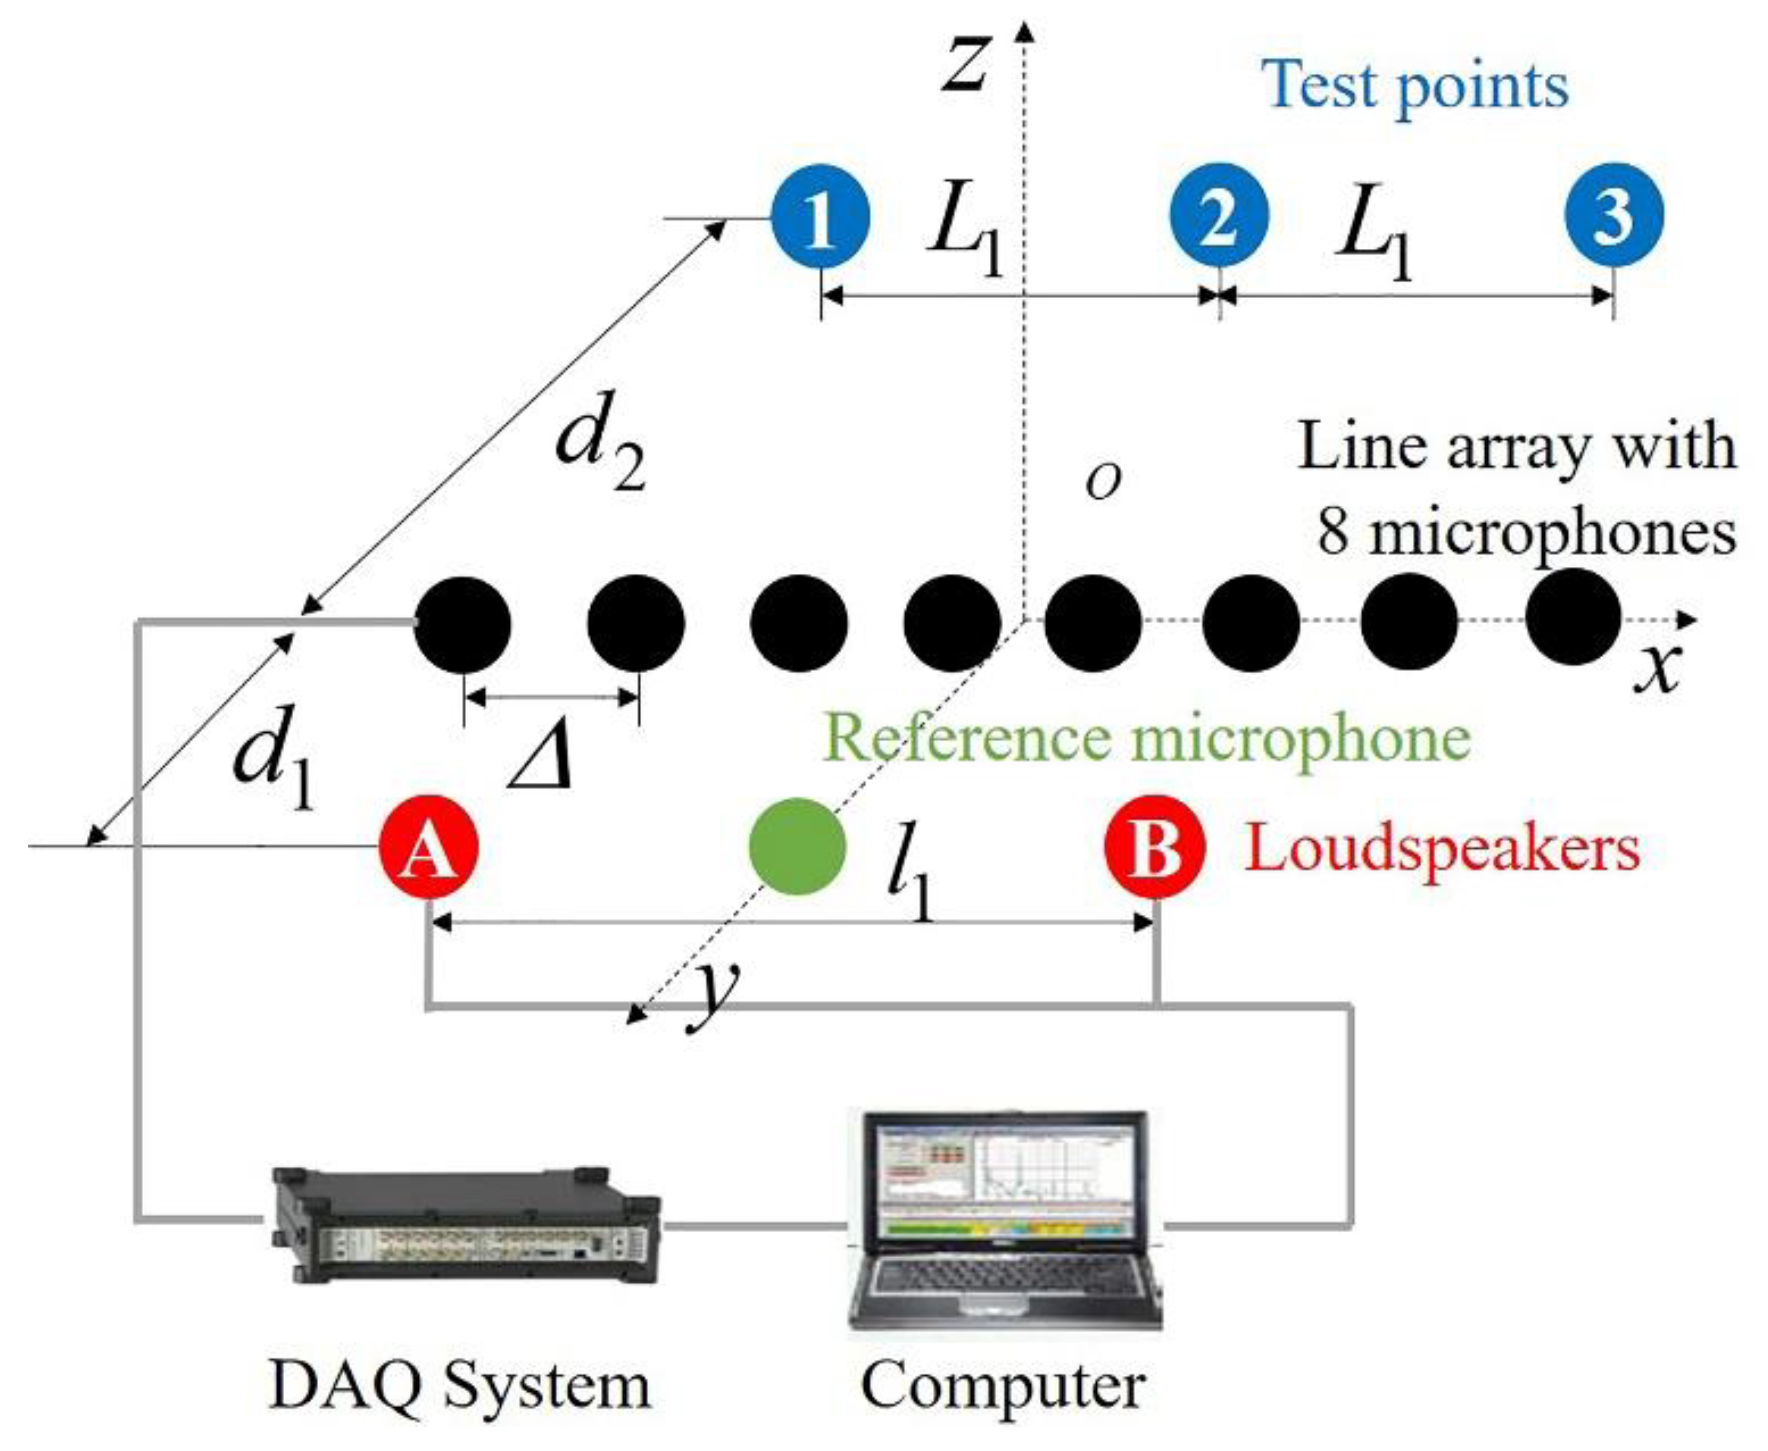
In order to verify the accuracy of the noise separation technique using the phase conjugation method, it is necessary to conduct a validation experiment using sound sources that have known source information and can emit sound independently. In order to simulate the field situation of a substation, we carried out noise separation of two same-type loudspeakers in a semi-anechoic room environment. Table 1 lists the experimental equipment. All the equipment is connected according to the schematic diagram shown in Figure 7, where the source distance is ; the distance of test points is ; and are, respectively, array-to-sources and array-to-test-points distances; the line array is composed of eight microphone elements and the array element spacing is ; and a reference microphone is located in middle position of two loudspeakers.
The noise separation technique using phase conjugation is a method of processing and calculating noise signals in the frequency domain, which is actually a separate processing of individual frequency noise signals. Therefore, the experimental sound source emits a simple harmonic noise at a single frequency 400 Hz. The sounding procedure (MATLAB code) is:
- Fs = 44,100; T = 50; n = Fs*T; t = T*linspace(0,1,n + 1);
- A1 = 10; A2 = 20; f = 400;
- p1 = A1*sin(2*pi*f*t); p2 = A2*sin(2*pi*f*t); and
- p = [p1’ p2’]; sound(p,Fs),
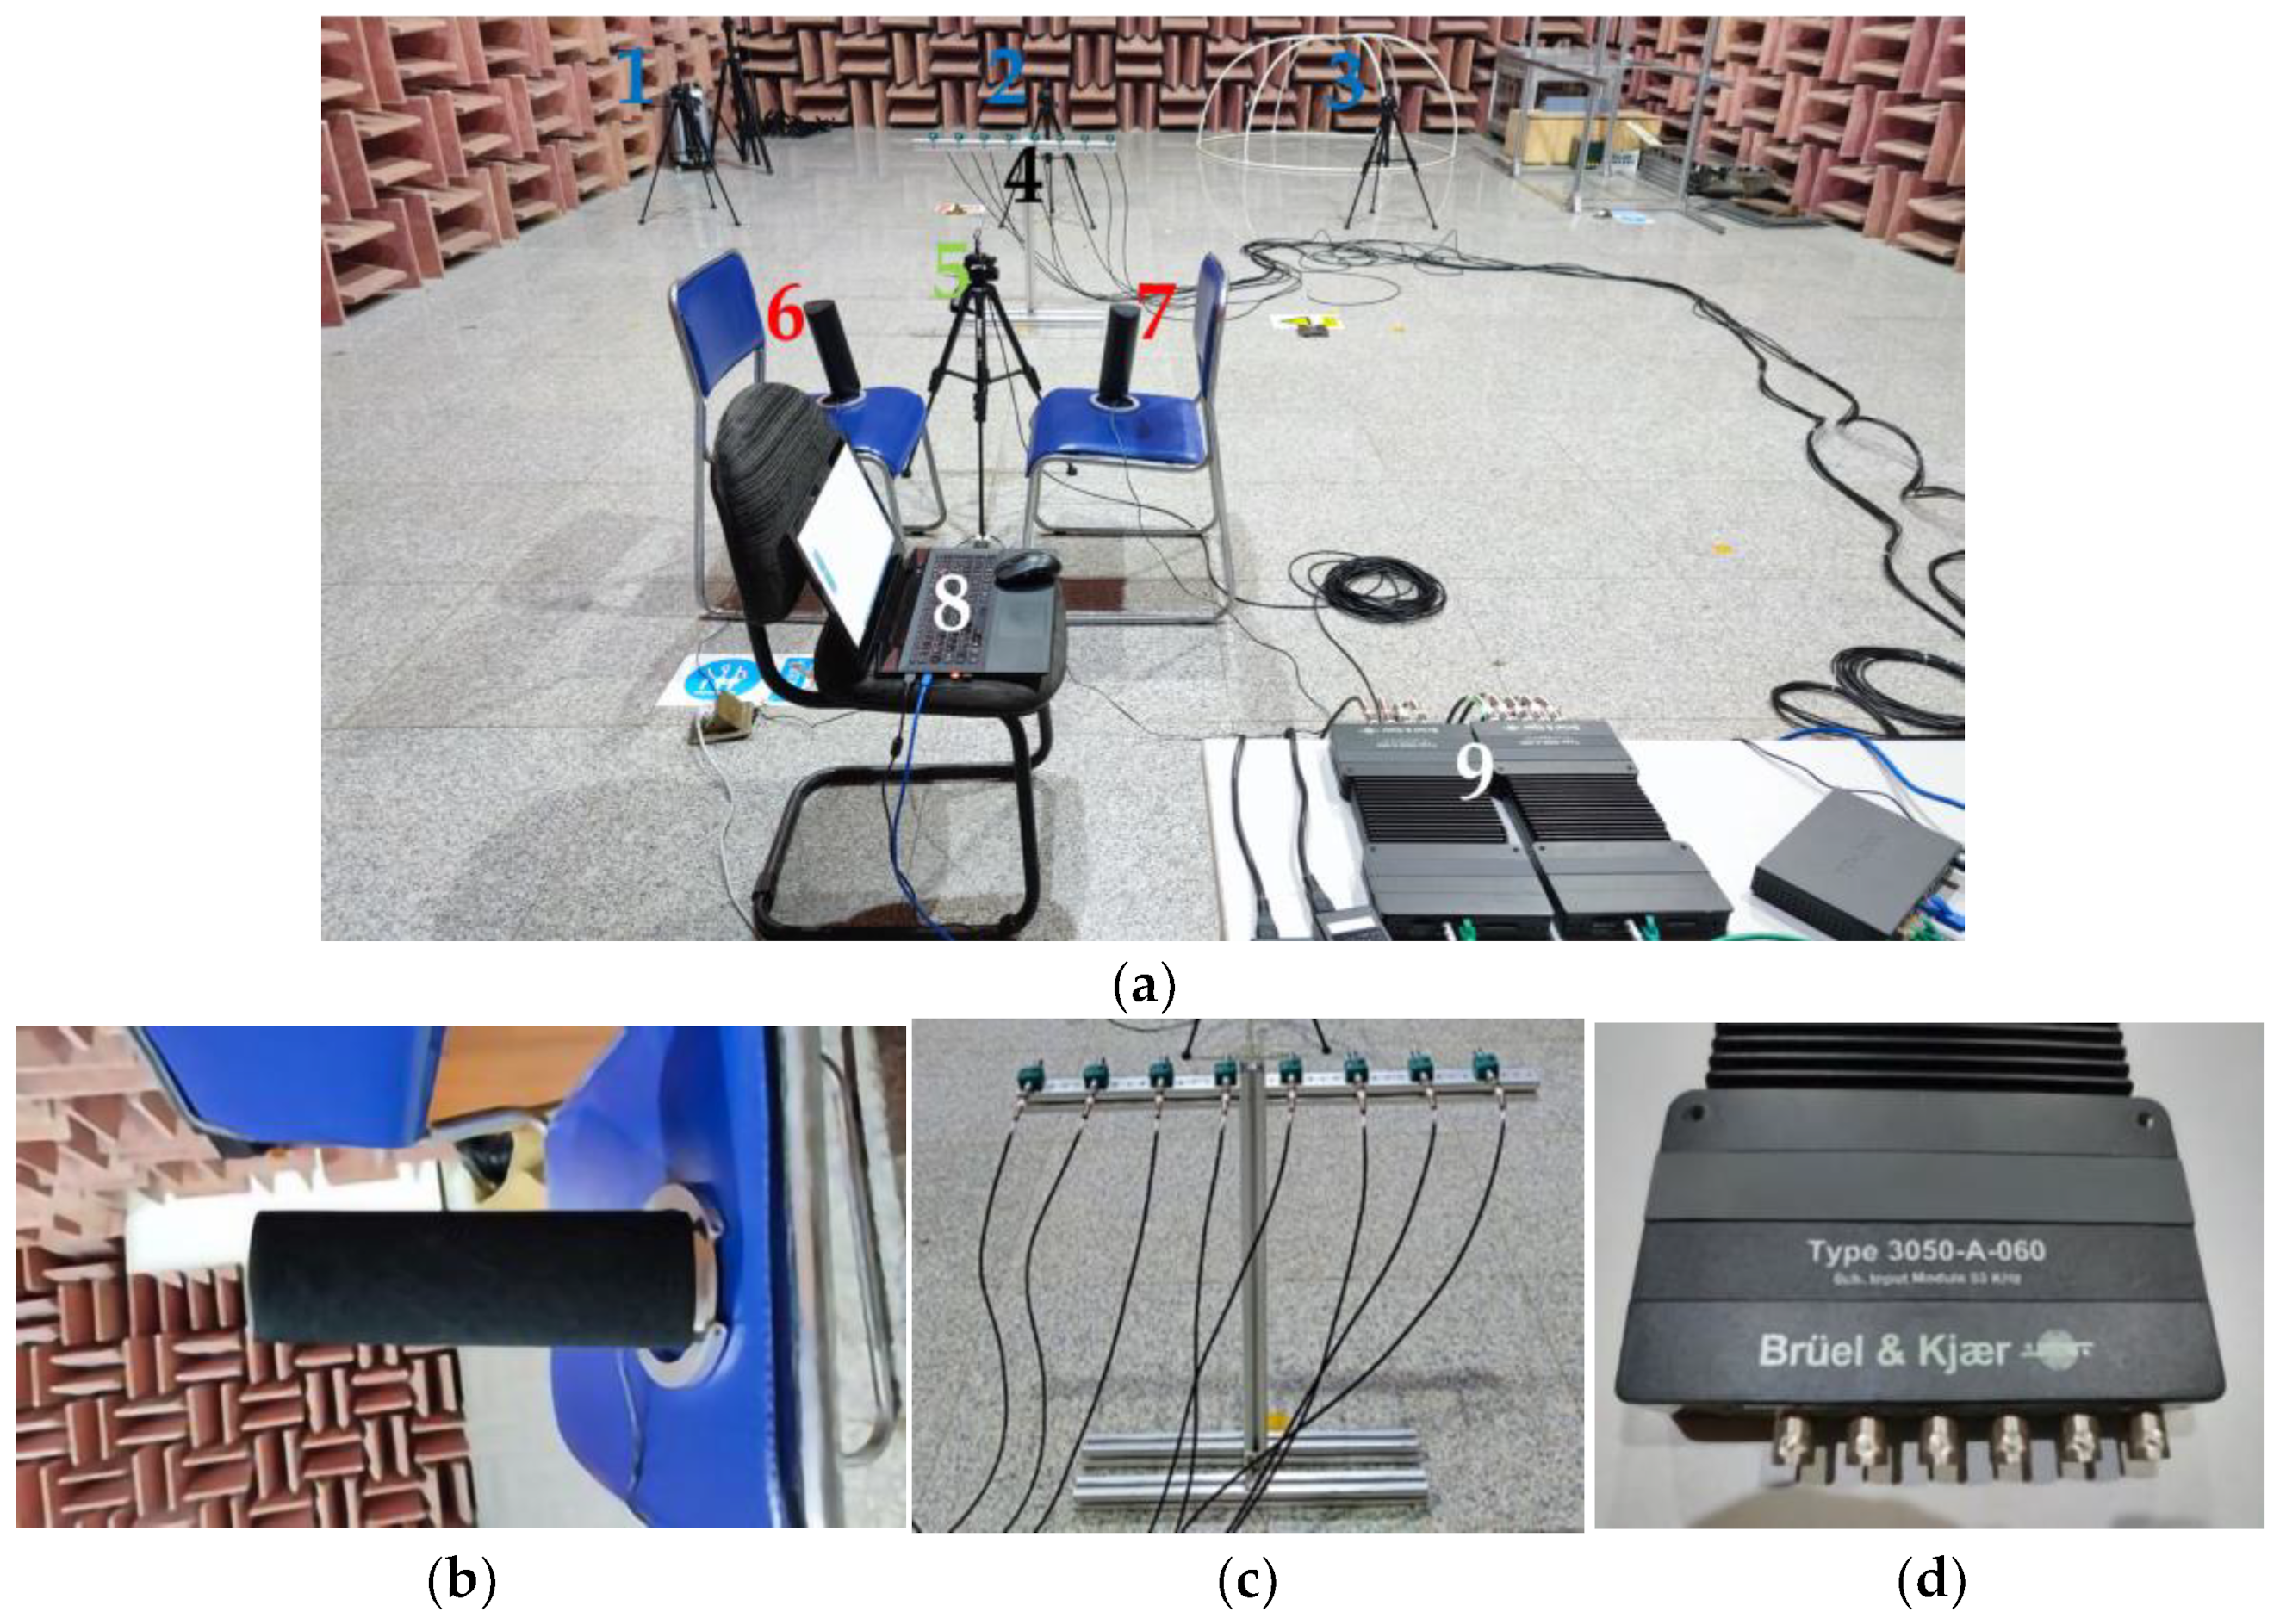
where Fs is the sampling frequency, T is the sounding time, p1 is emitted by loudspeaker A, and p2 is emitted by loudspeaker B. The microphone line array and the reference microphone measure complex sound pressure and its gradients when two loudspeakers act simultaneously, and the test microphones measure sound pressure amplitude at the three test points when two loudspeakers act simultaneously or individually. The experiment scene is shown in Figure 8, where 1, 2, and 3 represent test points; 4 is the line array; 5 is the reference microphone; 6 and 7 are loudspeakers; 8 is a computer; and 9 is the DAQ system.
3.2.2. Analysis of Experimental Results
Firstly, the complex sound pressures and their gradients measured from the line array are processed using phase conjugation to obtain noise source information. Secondly, we separate the sound pressure signals caused by loudspeaker A and B from the sound pressure signal measured by test microphones at three test points when two loudspeakers act simultaneously using the proposed noise separation technique.
Table 2 and Table 3 compare the SPLs obtained by the noise separation technique, measured by three test microphones when loudspeaker A or B works alone. All SPL absolute errors between the measurement values and values from the noise separation technique at the three test points for loudspeakers A and B are less than 2 dBA. Therefore, we think that it is accurate and feasible to separate the noise components of multiple sources using the noise separation technique based on the phase conjugation method within the error tolerance.
3.3. Transformer Noise Separation Test in a Substation
3.3.1. Test Setup
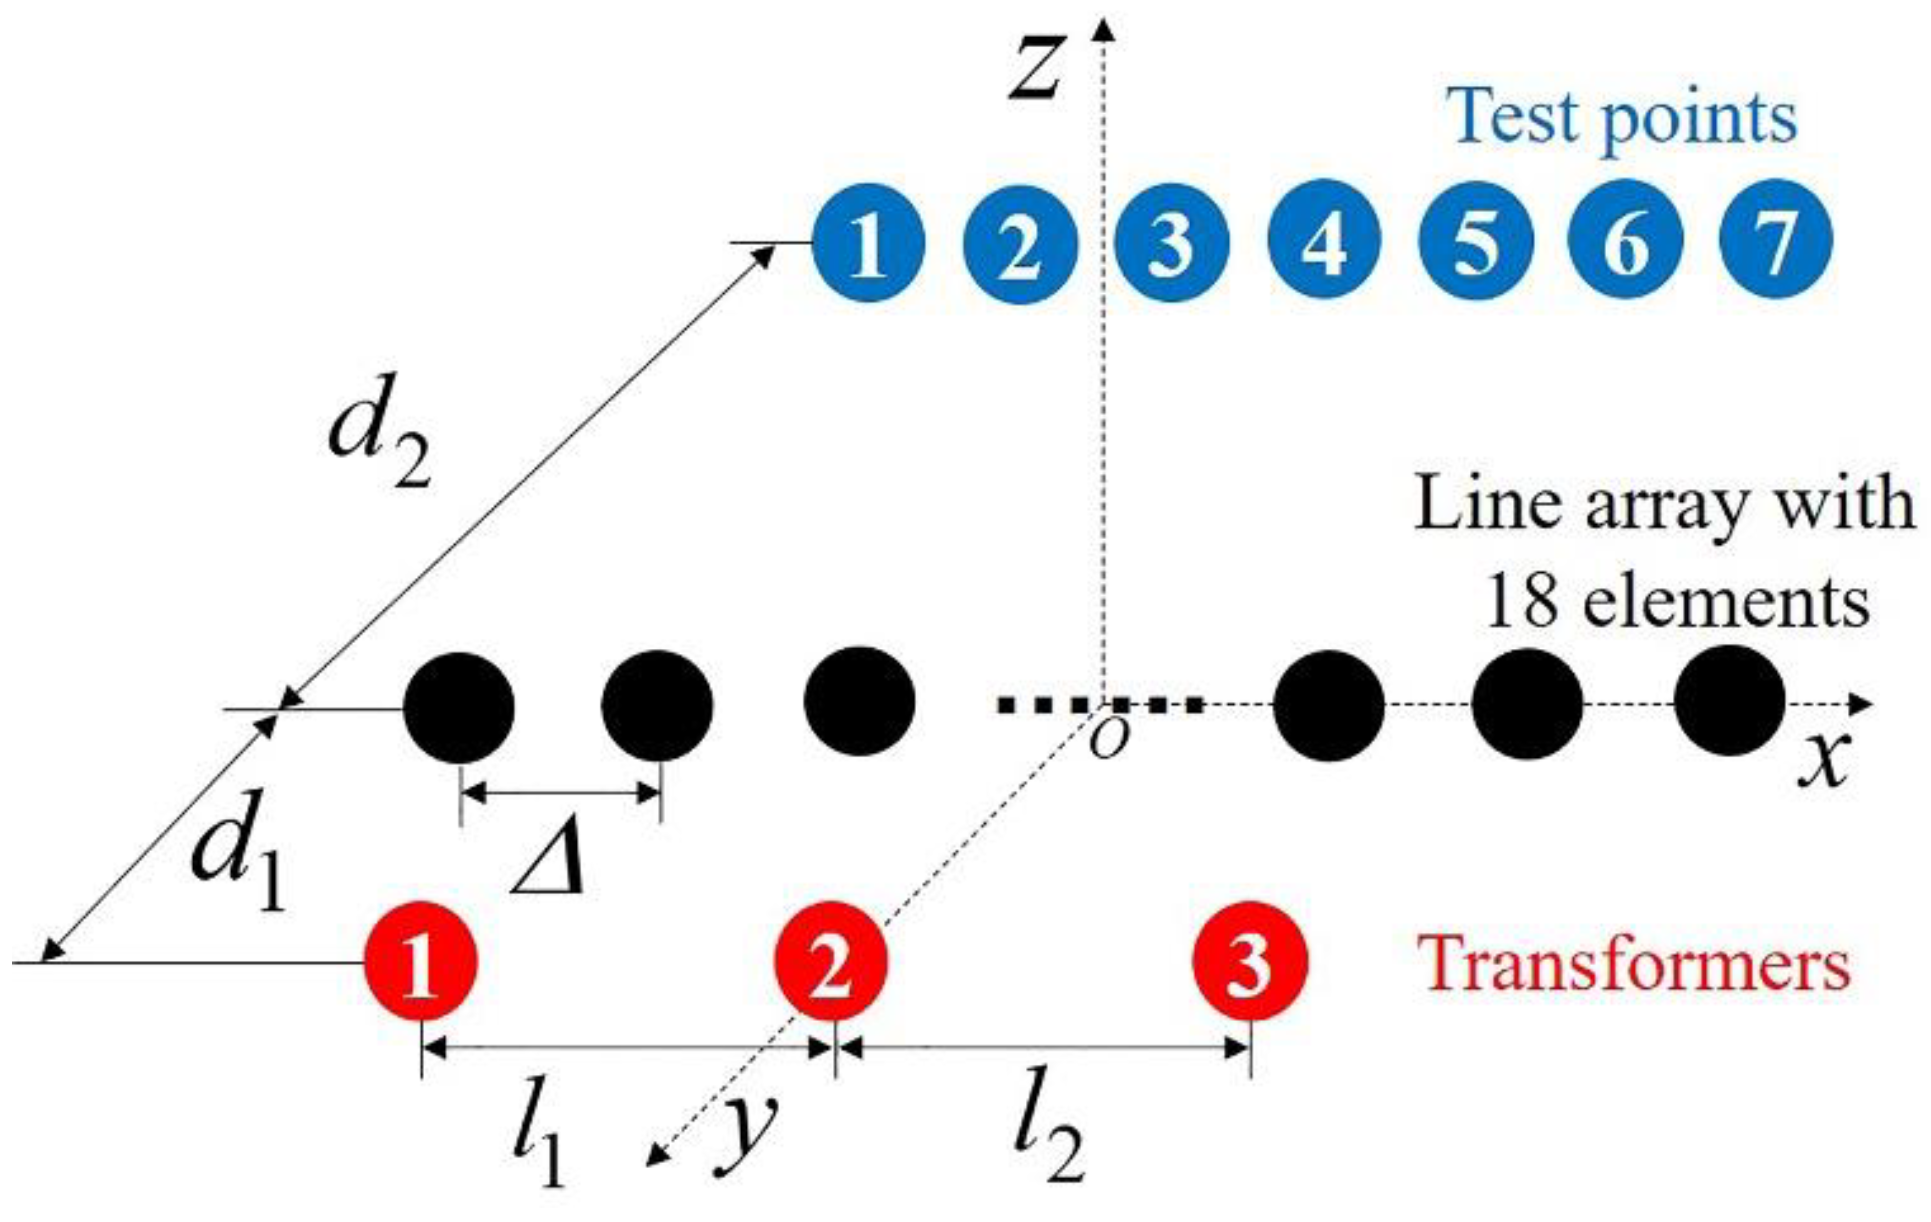
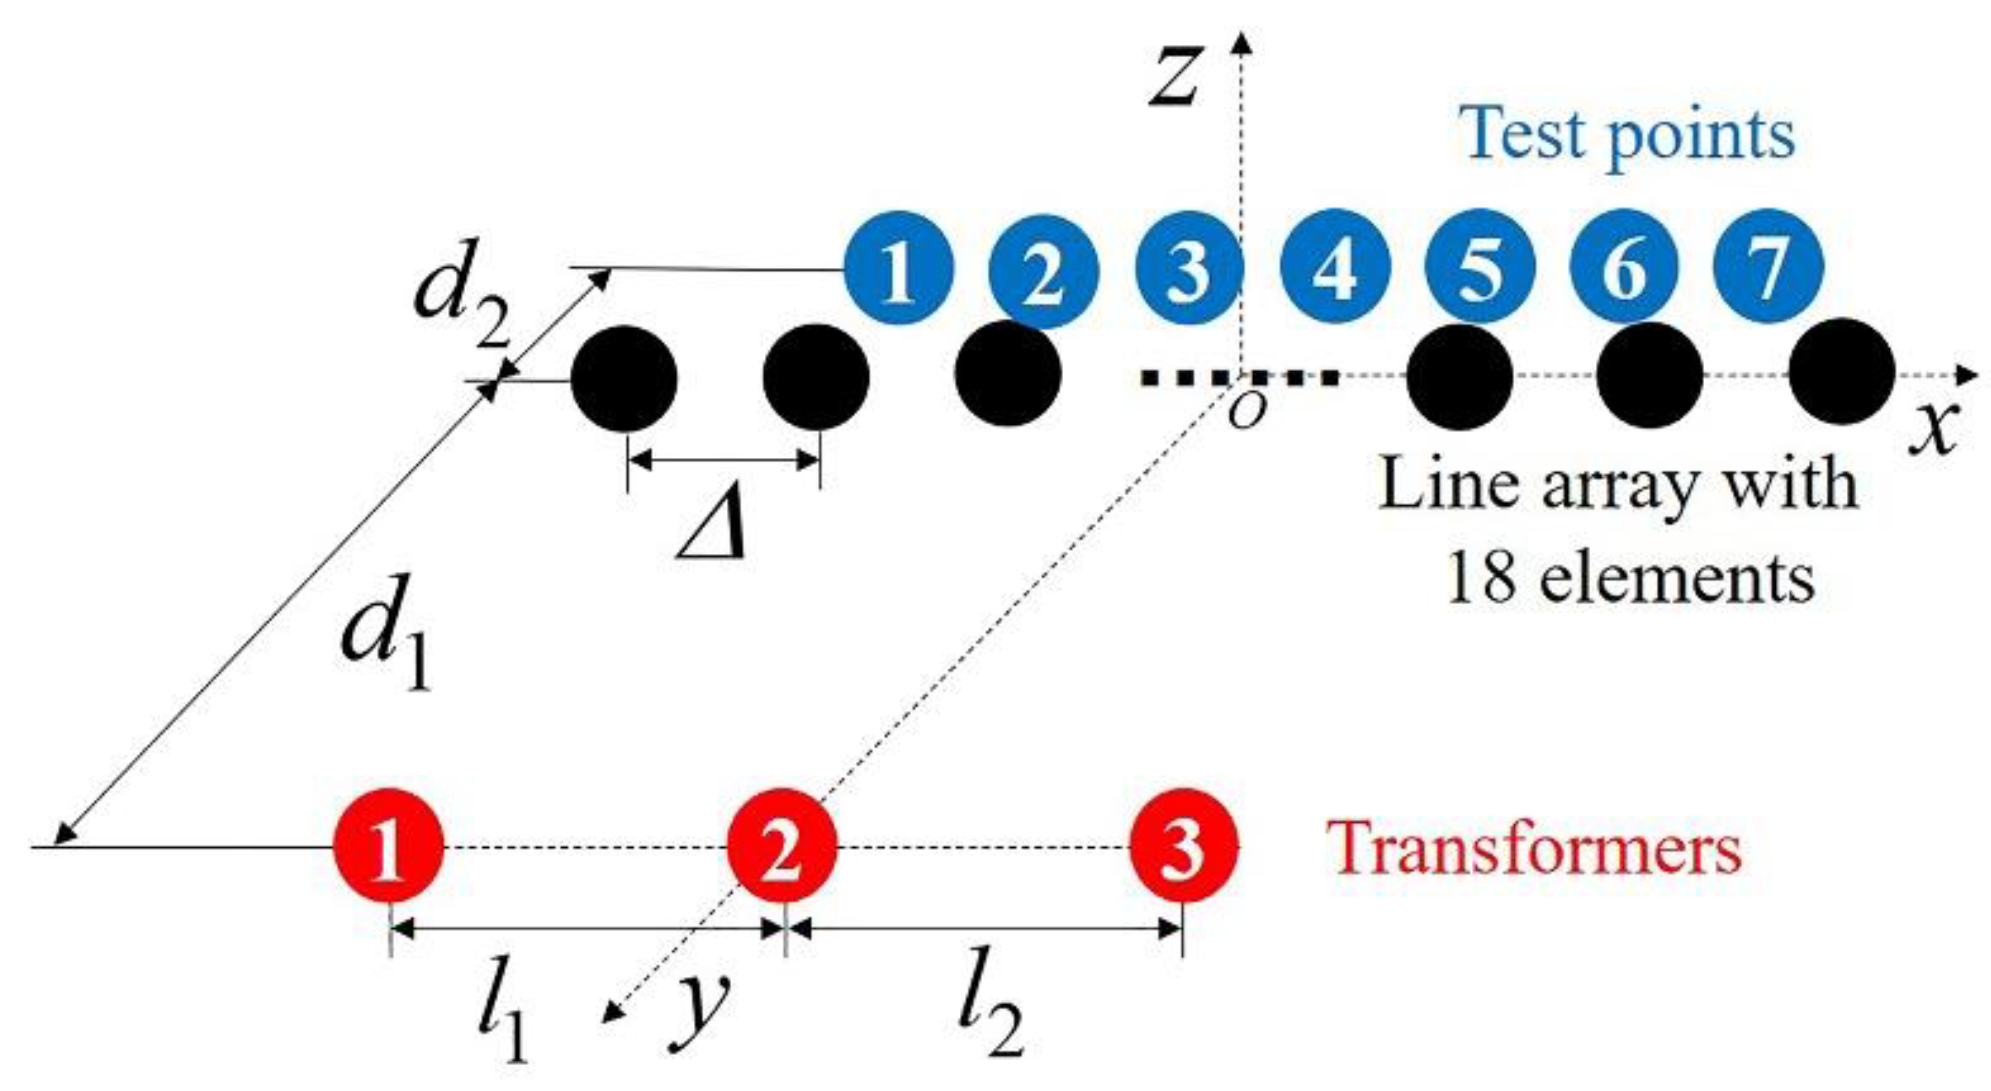
On the basis of point source simulation and experimental validation, we carried out a noise separation test for three transformers in a substation. The three transformers have the same model, with dimensions approximately 5 m × 5 m × 2.5 m, voltage of 110 kV, and power rating of 50,000 kVA. The reasonableness of the separation results is proved by analyzing the noise line spectrum and A-weighting SPL obtained from the separation sound pressure results of three transformers at different test points. The test is divided into two test conditions according to the horizontal distance between the microphone line array and transformers. The schematic diagrams of Condition 1 and Condition 2 are given, respectively, in Figure 9 and Figure 10, where is the distance between the microphone line array and three transformers (2 m in Condition 1, 10 m in Condition 2); is the distance between the microphone line array and test points (8 m in Condition 1, 0 m in Condition 2); the x-coordinates of the seven test points are the same as those of No. 3, 5, 7, 10, 12, 14, and 17 microphones in the line array; is the array element spacing; and and are the distances between the three transformers, which are 15.25 m and 15.72 m, respectively.
The main equipment used in the substation test is shown in Table 4. The above equipment is arranged and connected as shown in Figure 9 and Figure 10 where the line array of 18 microphones is realized by panning a line array of 9 microphones. Figure 11 shows the test scene in the substation. In order to obtain high enough resolution to meet the transformer’s main working frequency, the analysis bandwidth of the B&K PULSE acquisition system is set to 3200 Hz, and the number of frequency lines is set to 3200 (i.e., the frequency resolution of the resulting sound pressure spectrum is 1 Hz). The microphones’ line array measures sound pressure amplitude, phase and sound pressure gradient amplitude, and phase. Seven microphones measure the field noise at seven test points, and the intrinsic noise pressure of the three transformers is obtained by the vibro-acoustic coherent analysis separation technique (more details in Ref. [8]).
3.3.2. Analysis of Test Results
- 1.
- Test accuracy analysis
The test data are calculated and processed using the phase conjugation method and the equivalent point source method to obtain the noise separation results of three transformers at seven test points. Because the working substation cannot be stopped, the test accuracy cannot be verified by operating one transformer individually. Instead, we verified the test accuracy by analyzing the noise line spectra and A-weighting SPL obtained from the separation sound pressure results of three transformers at different test points, and these noise pressure data have to decrease as the distance increases between the test point and source, and vice versa.
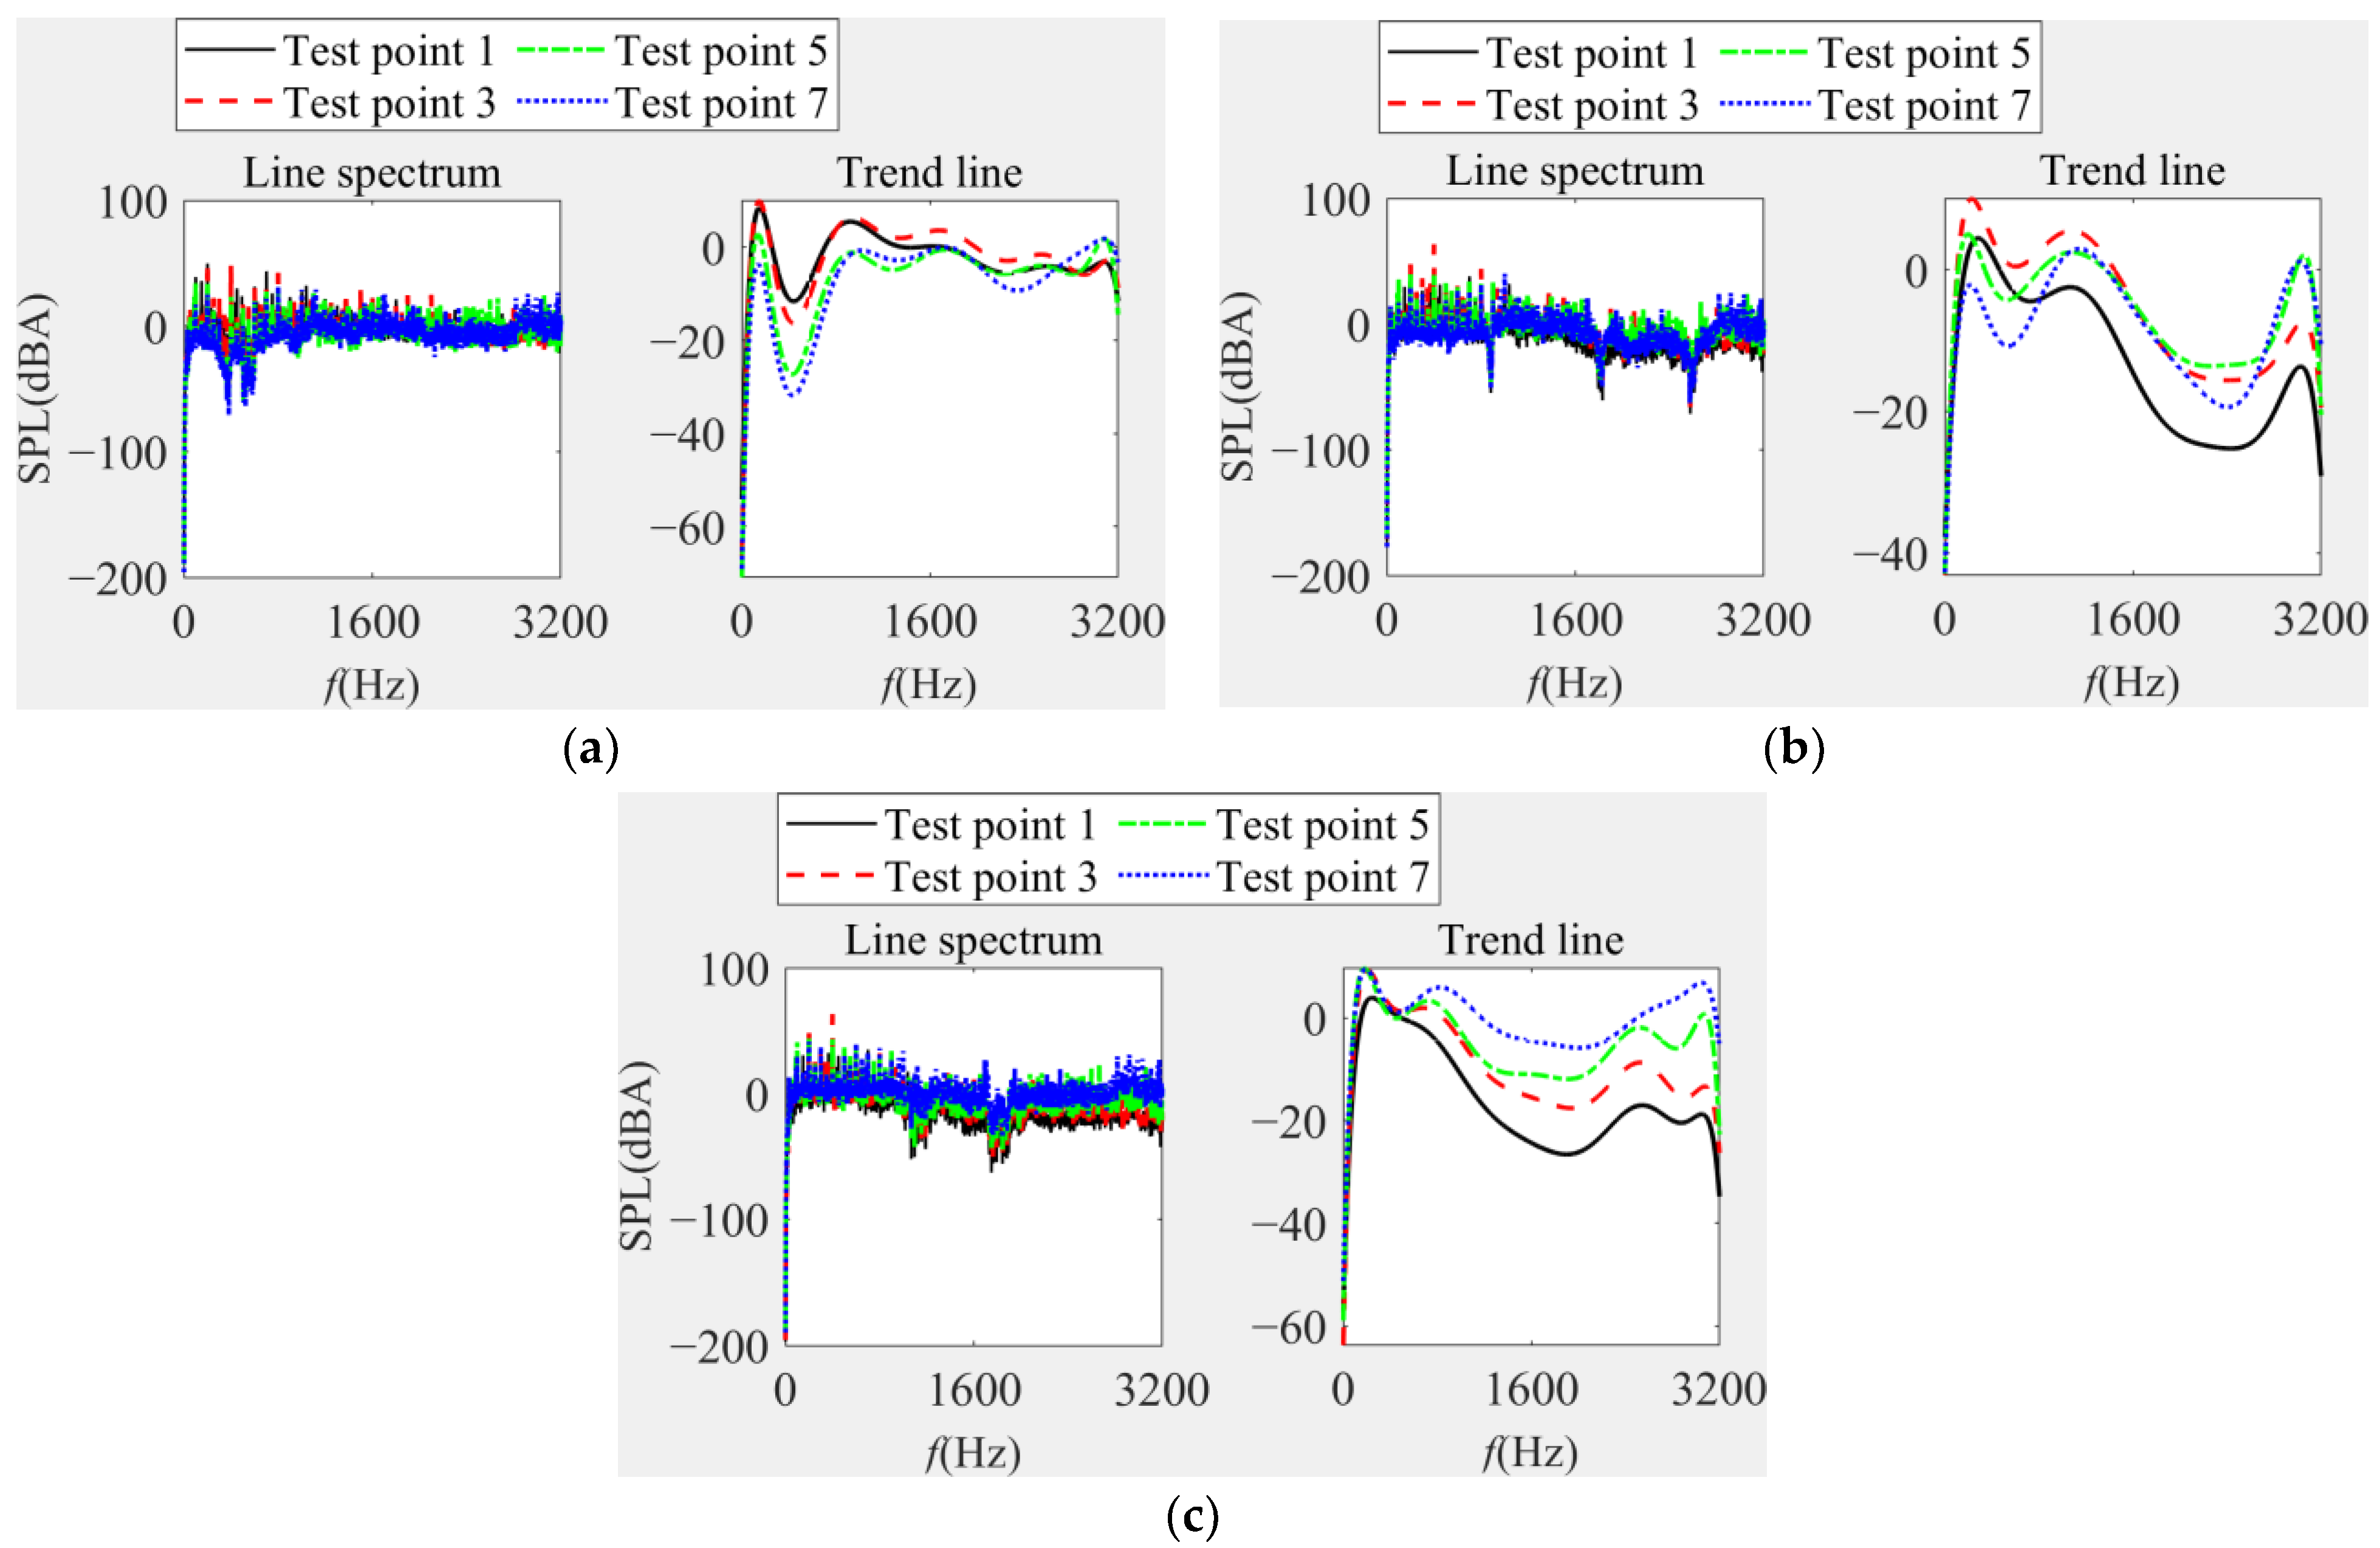
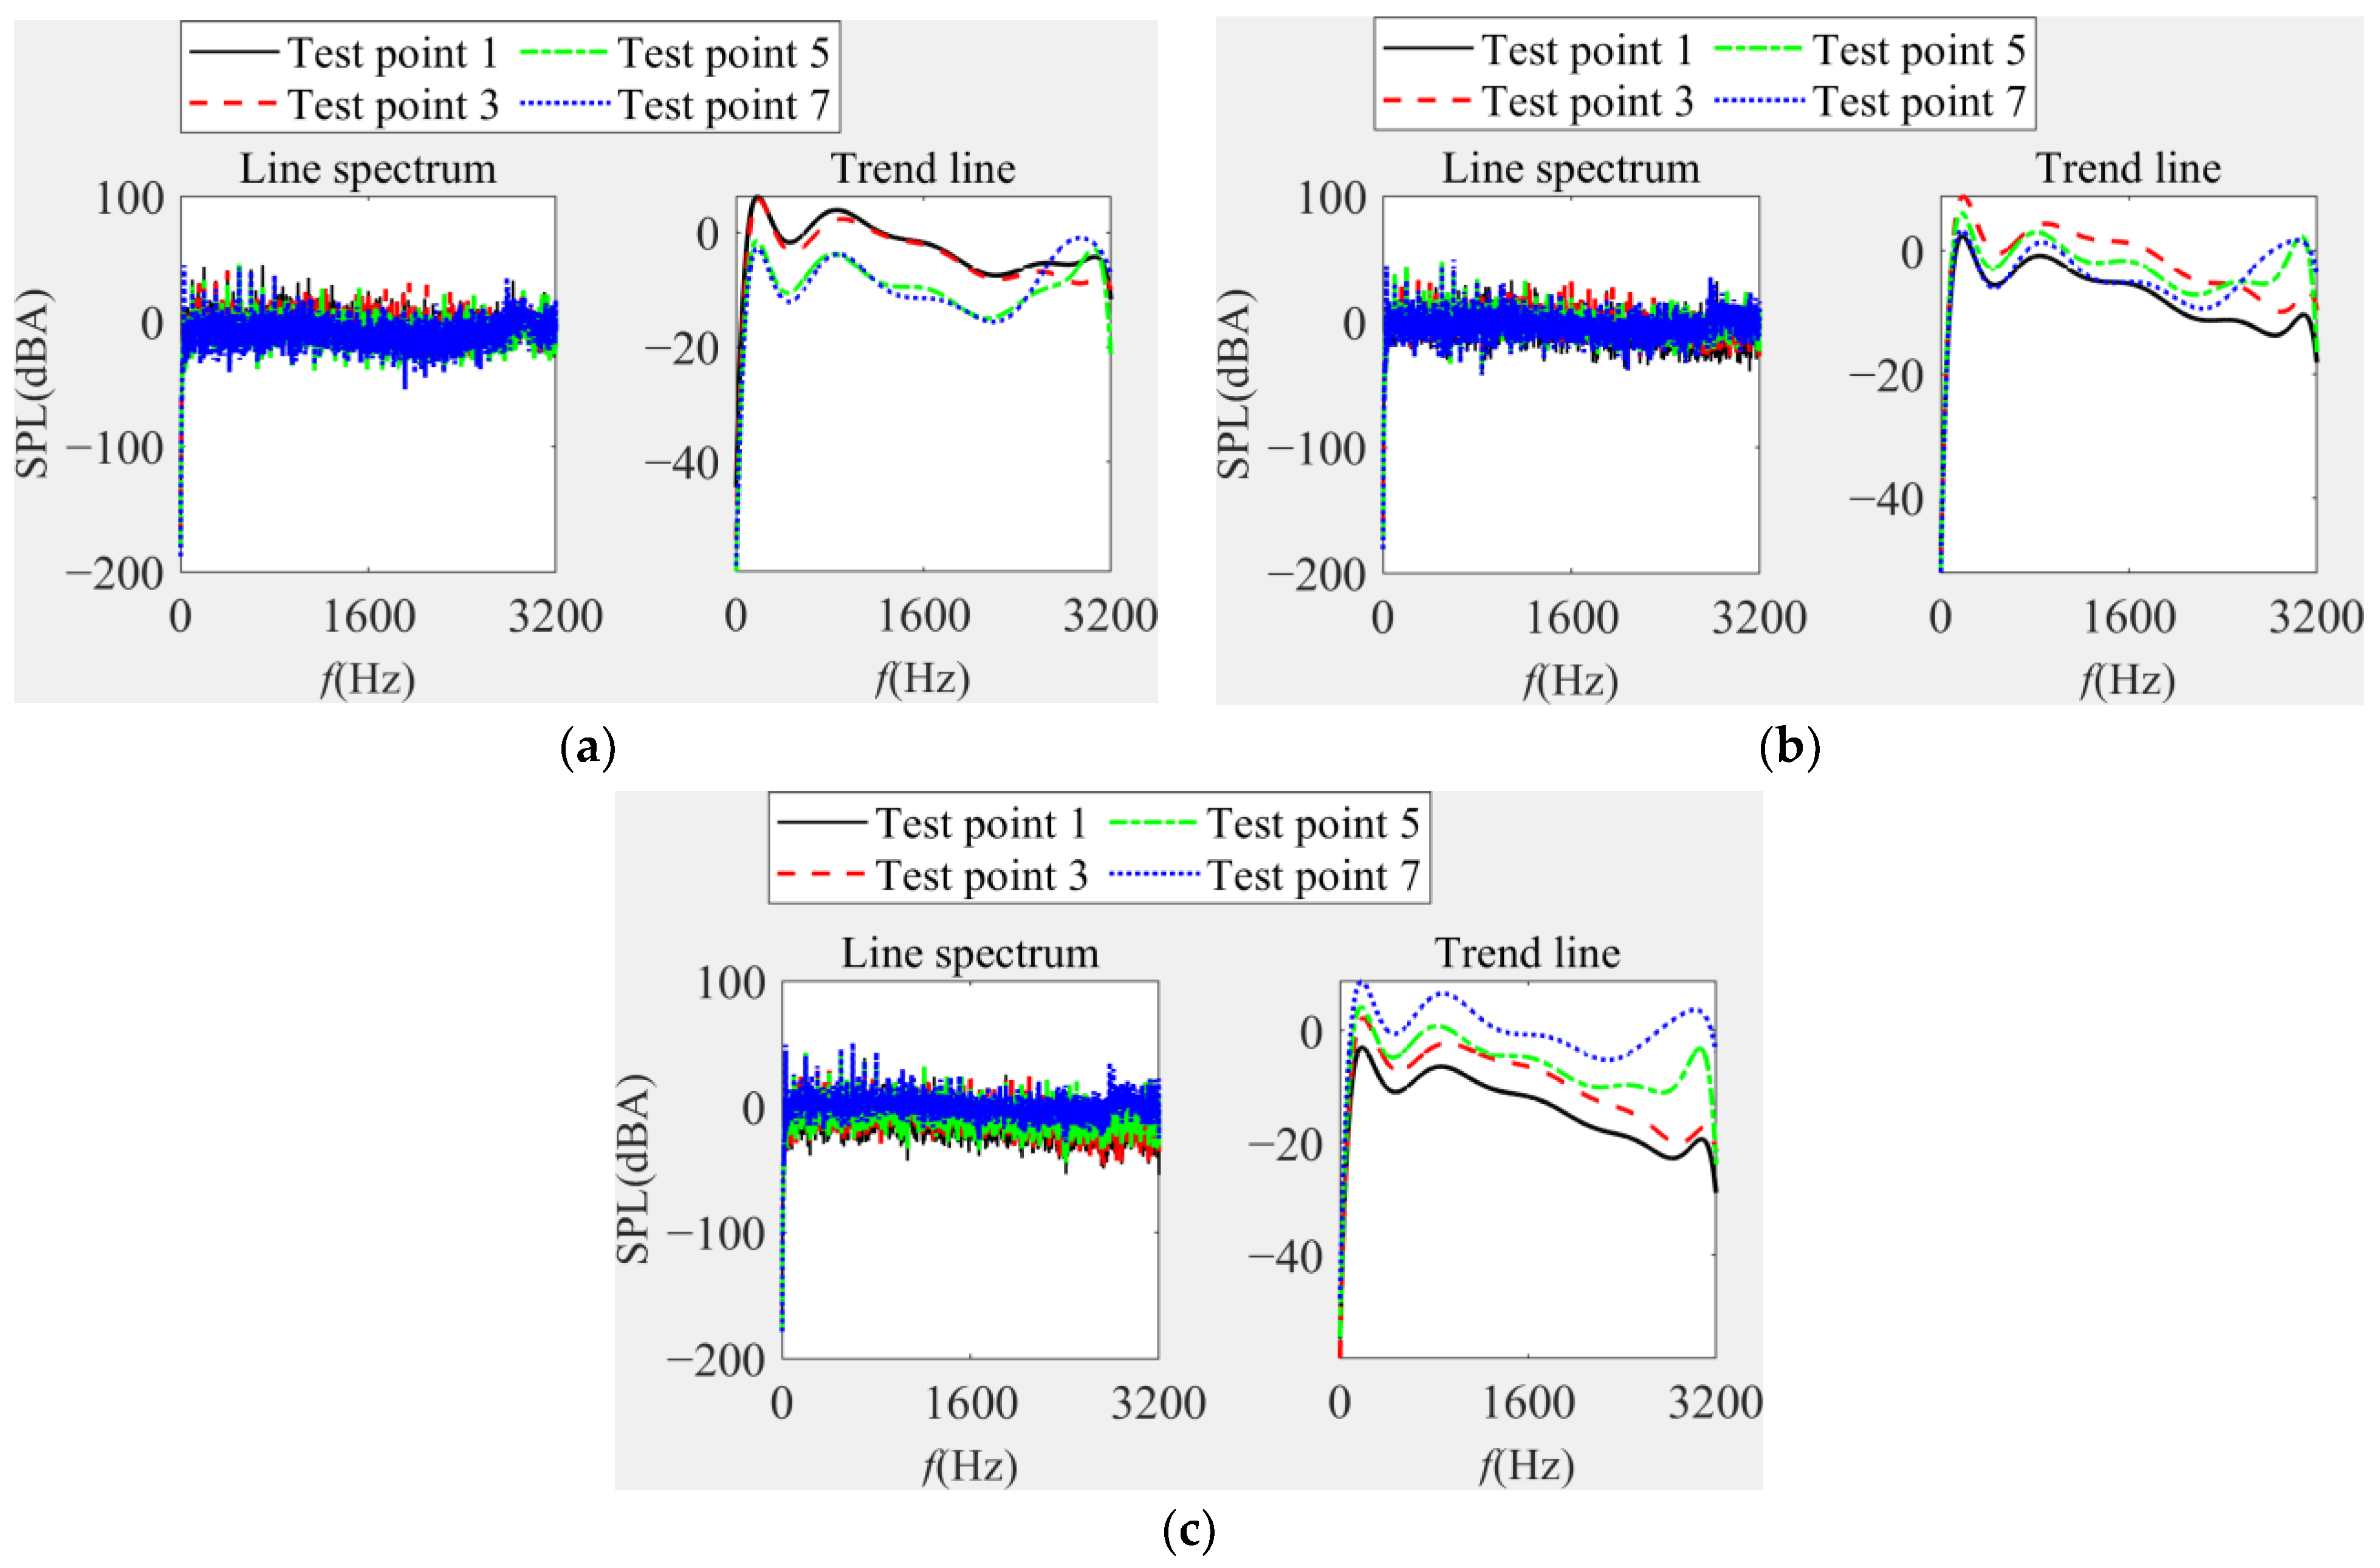
The SPL line spectrums and their trend lines from 0 to 3200 Hz for test points 1, 3, 5, and 7 for three transformers in Conditions 1 and 2 are shown in Figure 12 and Figure 13. We choose test point numbers 1, 3, 5, and 7 to show, in Figure 12 and Figure 13, without limiting generality for the sake of clarity of the line spectrum. It can be seen from Figure 12 that the A-weighting SPL line spectrums and the trend lines of the four test points are intertwined, which means the Condition 1 results do not satisfy the law that noise pressure data have to decrease as the distance between test point and source increases, and vice versa. Figure 13 illustrates that the locations of A-weighting SPL line spectrums and their trend lines are highest at test point 1 but lowest at test point 7 for transformer 1, the locations of line spectrums and trend lines are higher at test points 3 and 5 but lower at test points 1 and 7 for transformer 2, and the locations of line spectrums and trend lines are highest at test point 7 but lowest at test point 1 for transformer 3, which means the Condition 2 results satisfy the law that noise pressure data have to decrease as the distance between test point and source increases, and vice versa.
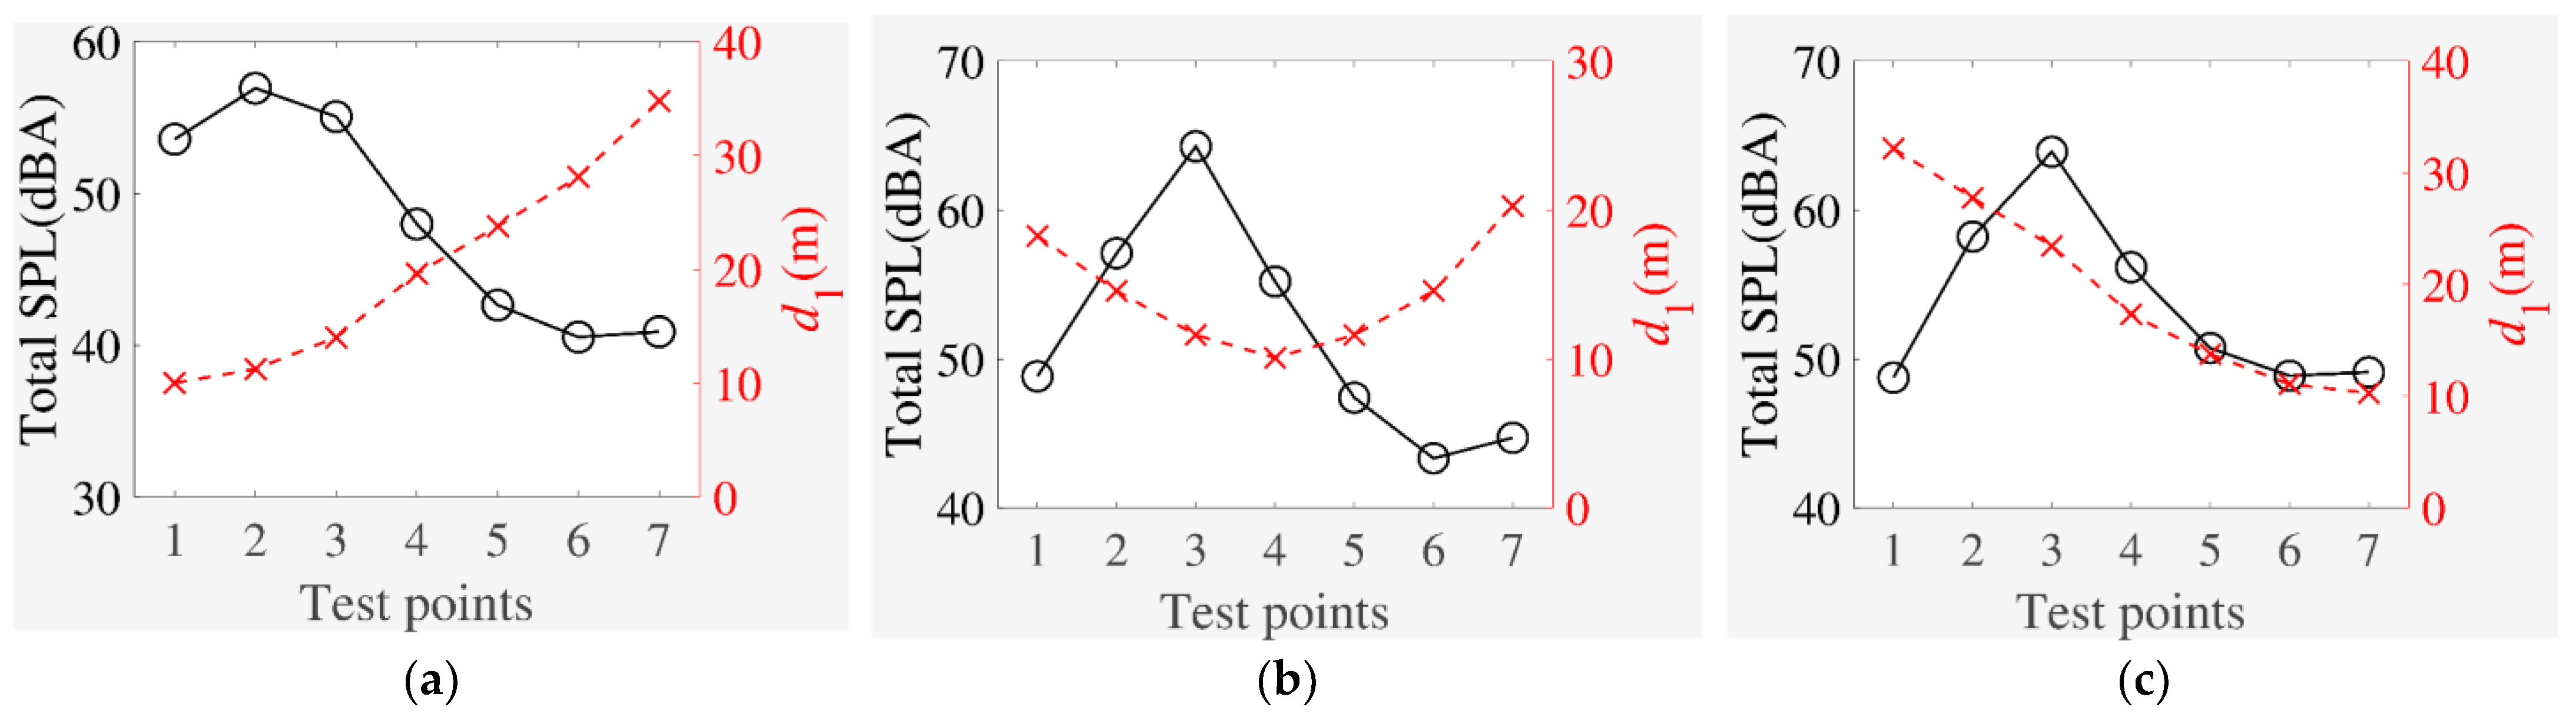
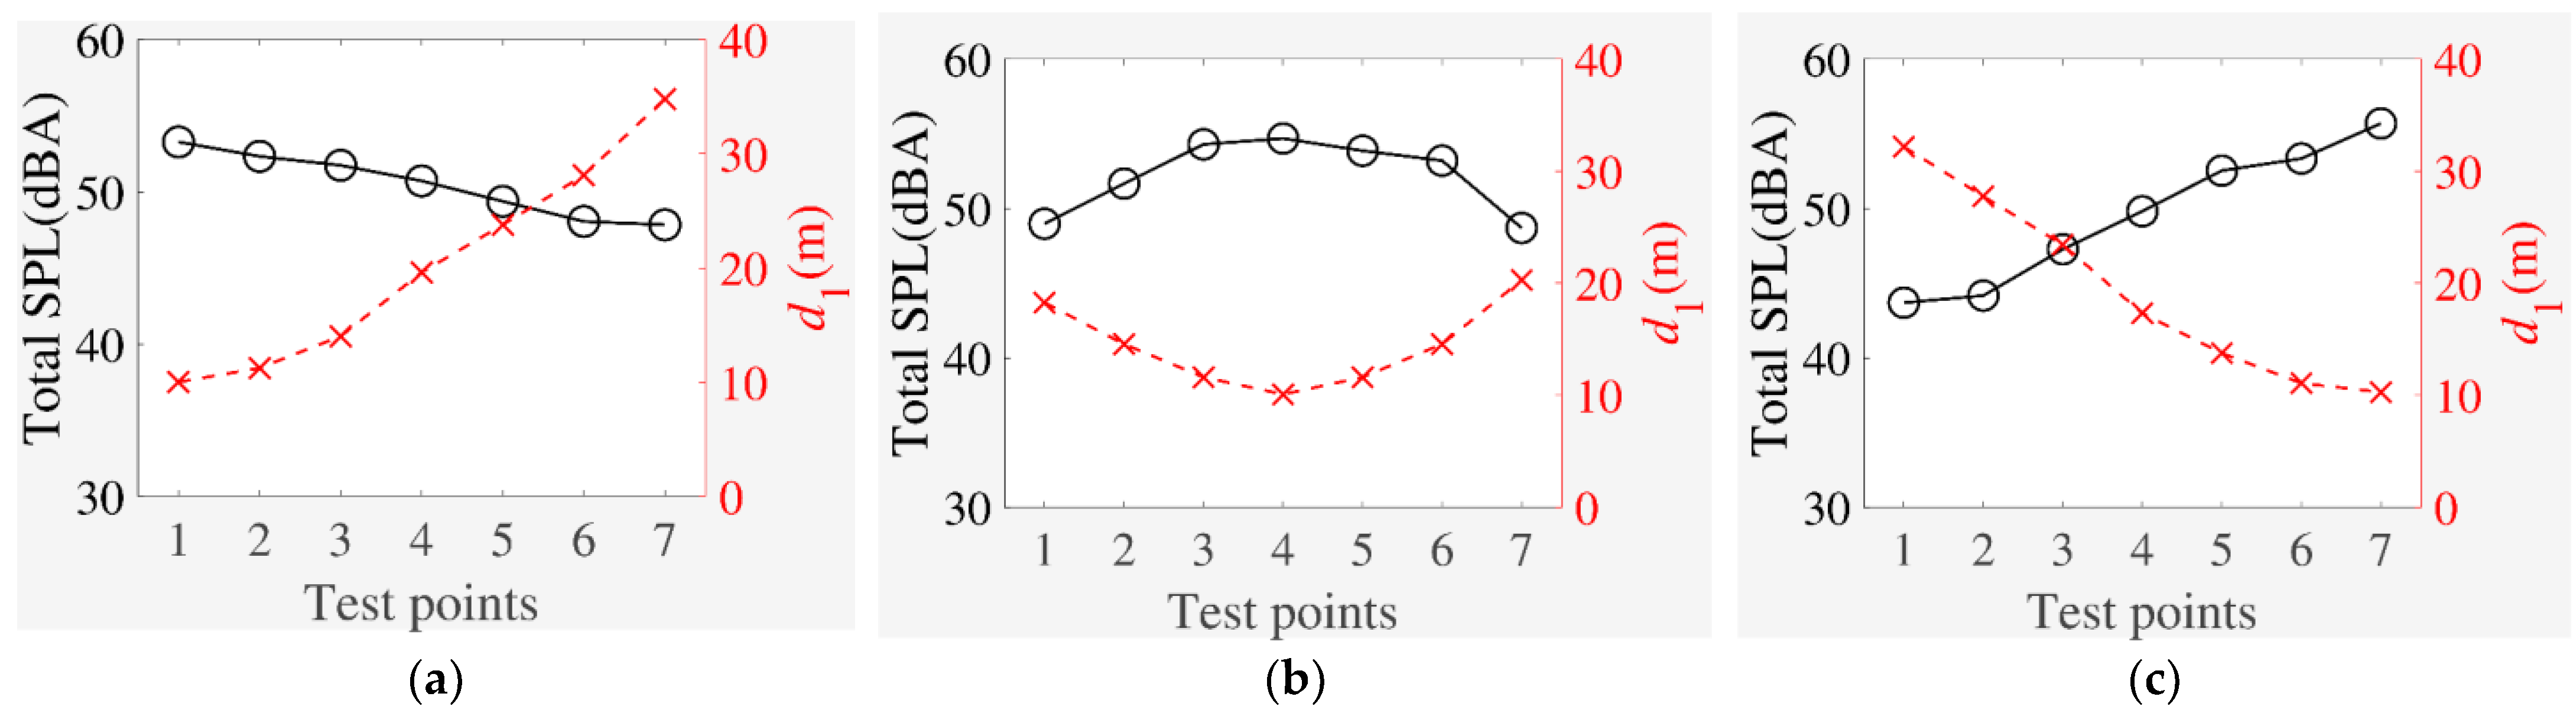
The total A-weighting SPLs of the seven test points and the distances between the seven test points and transformers are shown in Figure 14 and Figure 15. As is known to all, the total A-weighting SPL of an acoustic field point should decrease as the distance between the point and noise sources increases, and vice versa. As can be seen from Figure 14 and Figure 15, all test points in Condition 2 strictly meet the above law. Test points 1 and 2 of transformer 1; test points 3 and 4 of transformer 2; and test points 4, 5, 6, and 7 of transformer 3 in Condition 1 do not meet the above law.
To sum up, the reason why the separation result of Condition 1 is worse is that the distance between the microphone line array and transformers is too close to regard transformers as point sources. The step of considering the transformer as an equivalent point source in the separation technique makes the separation result have a greater error. The separation results of Condition 2 are more in line with the change law of the sound pressure with distance. Therefore, the distance between the microphone line array and the transformer should be selected appropriately according to the transformer’s characteristic size when separating the transformer noise using the phase conjugation-based separation technique.
- 2.
- Application of test results
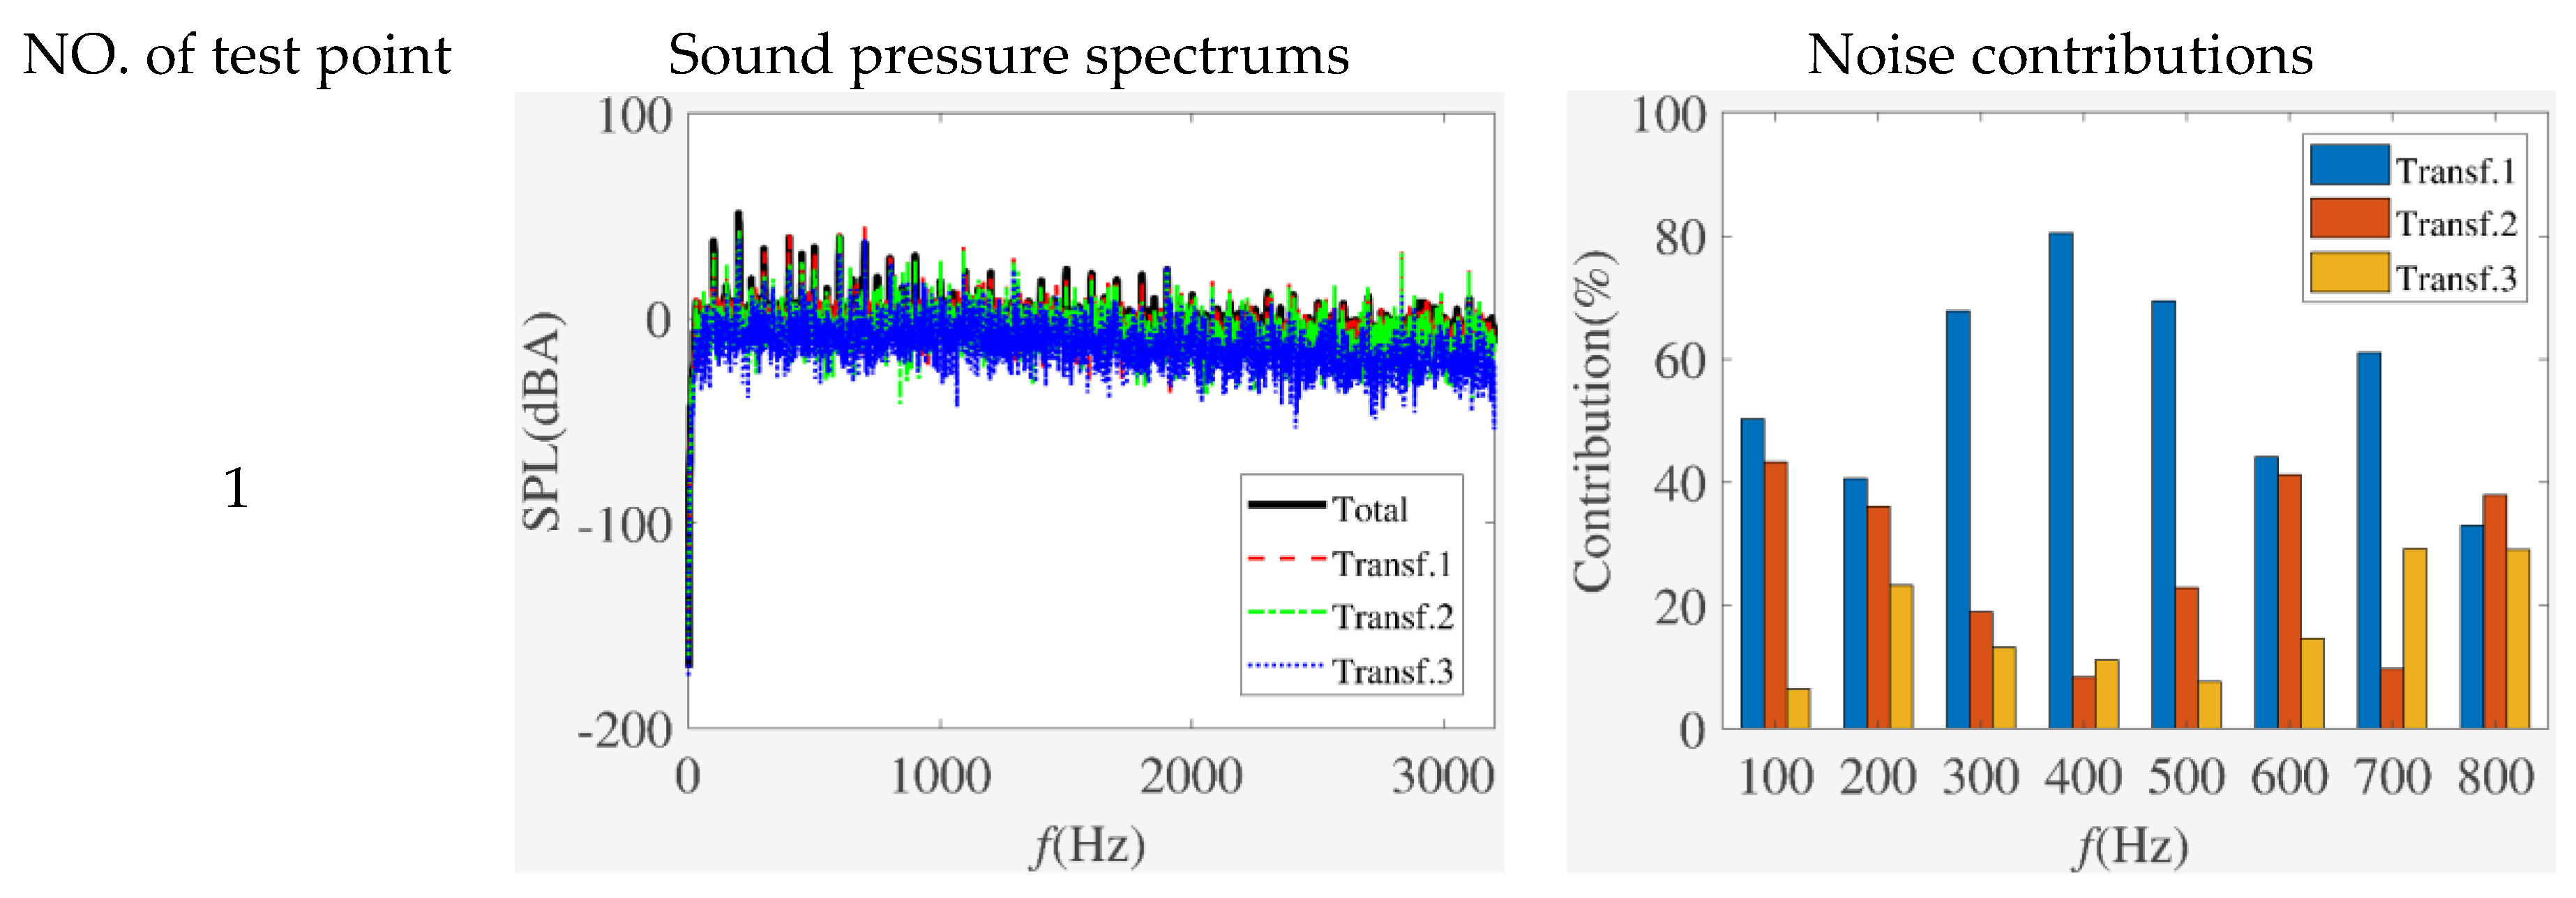
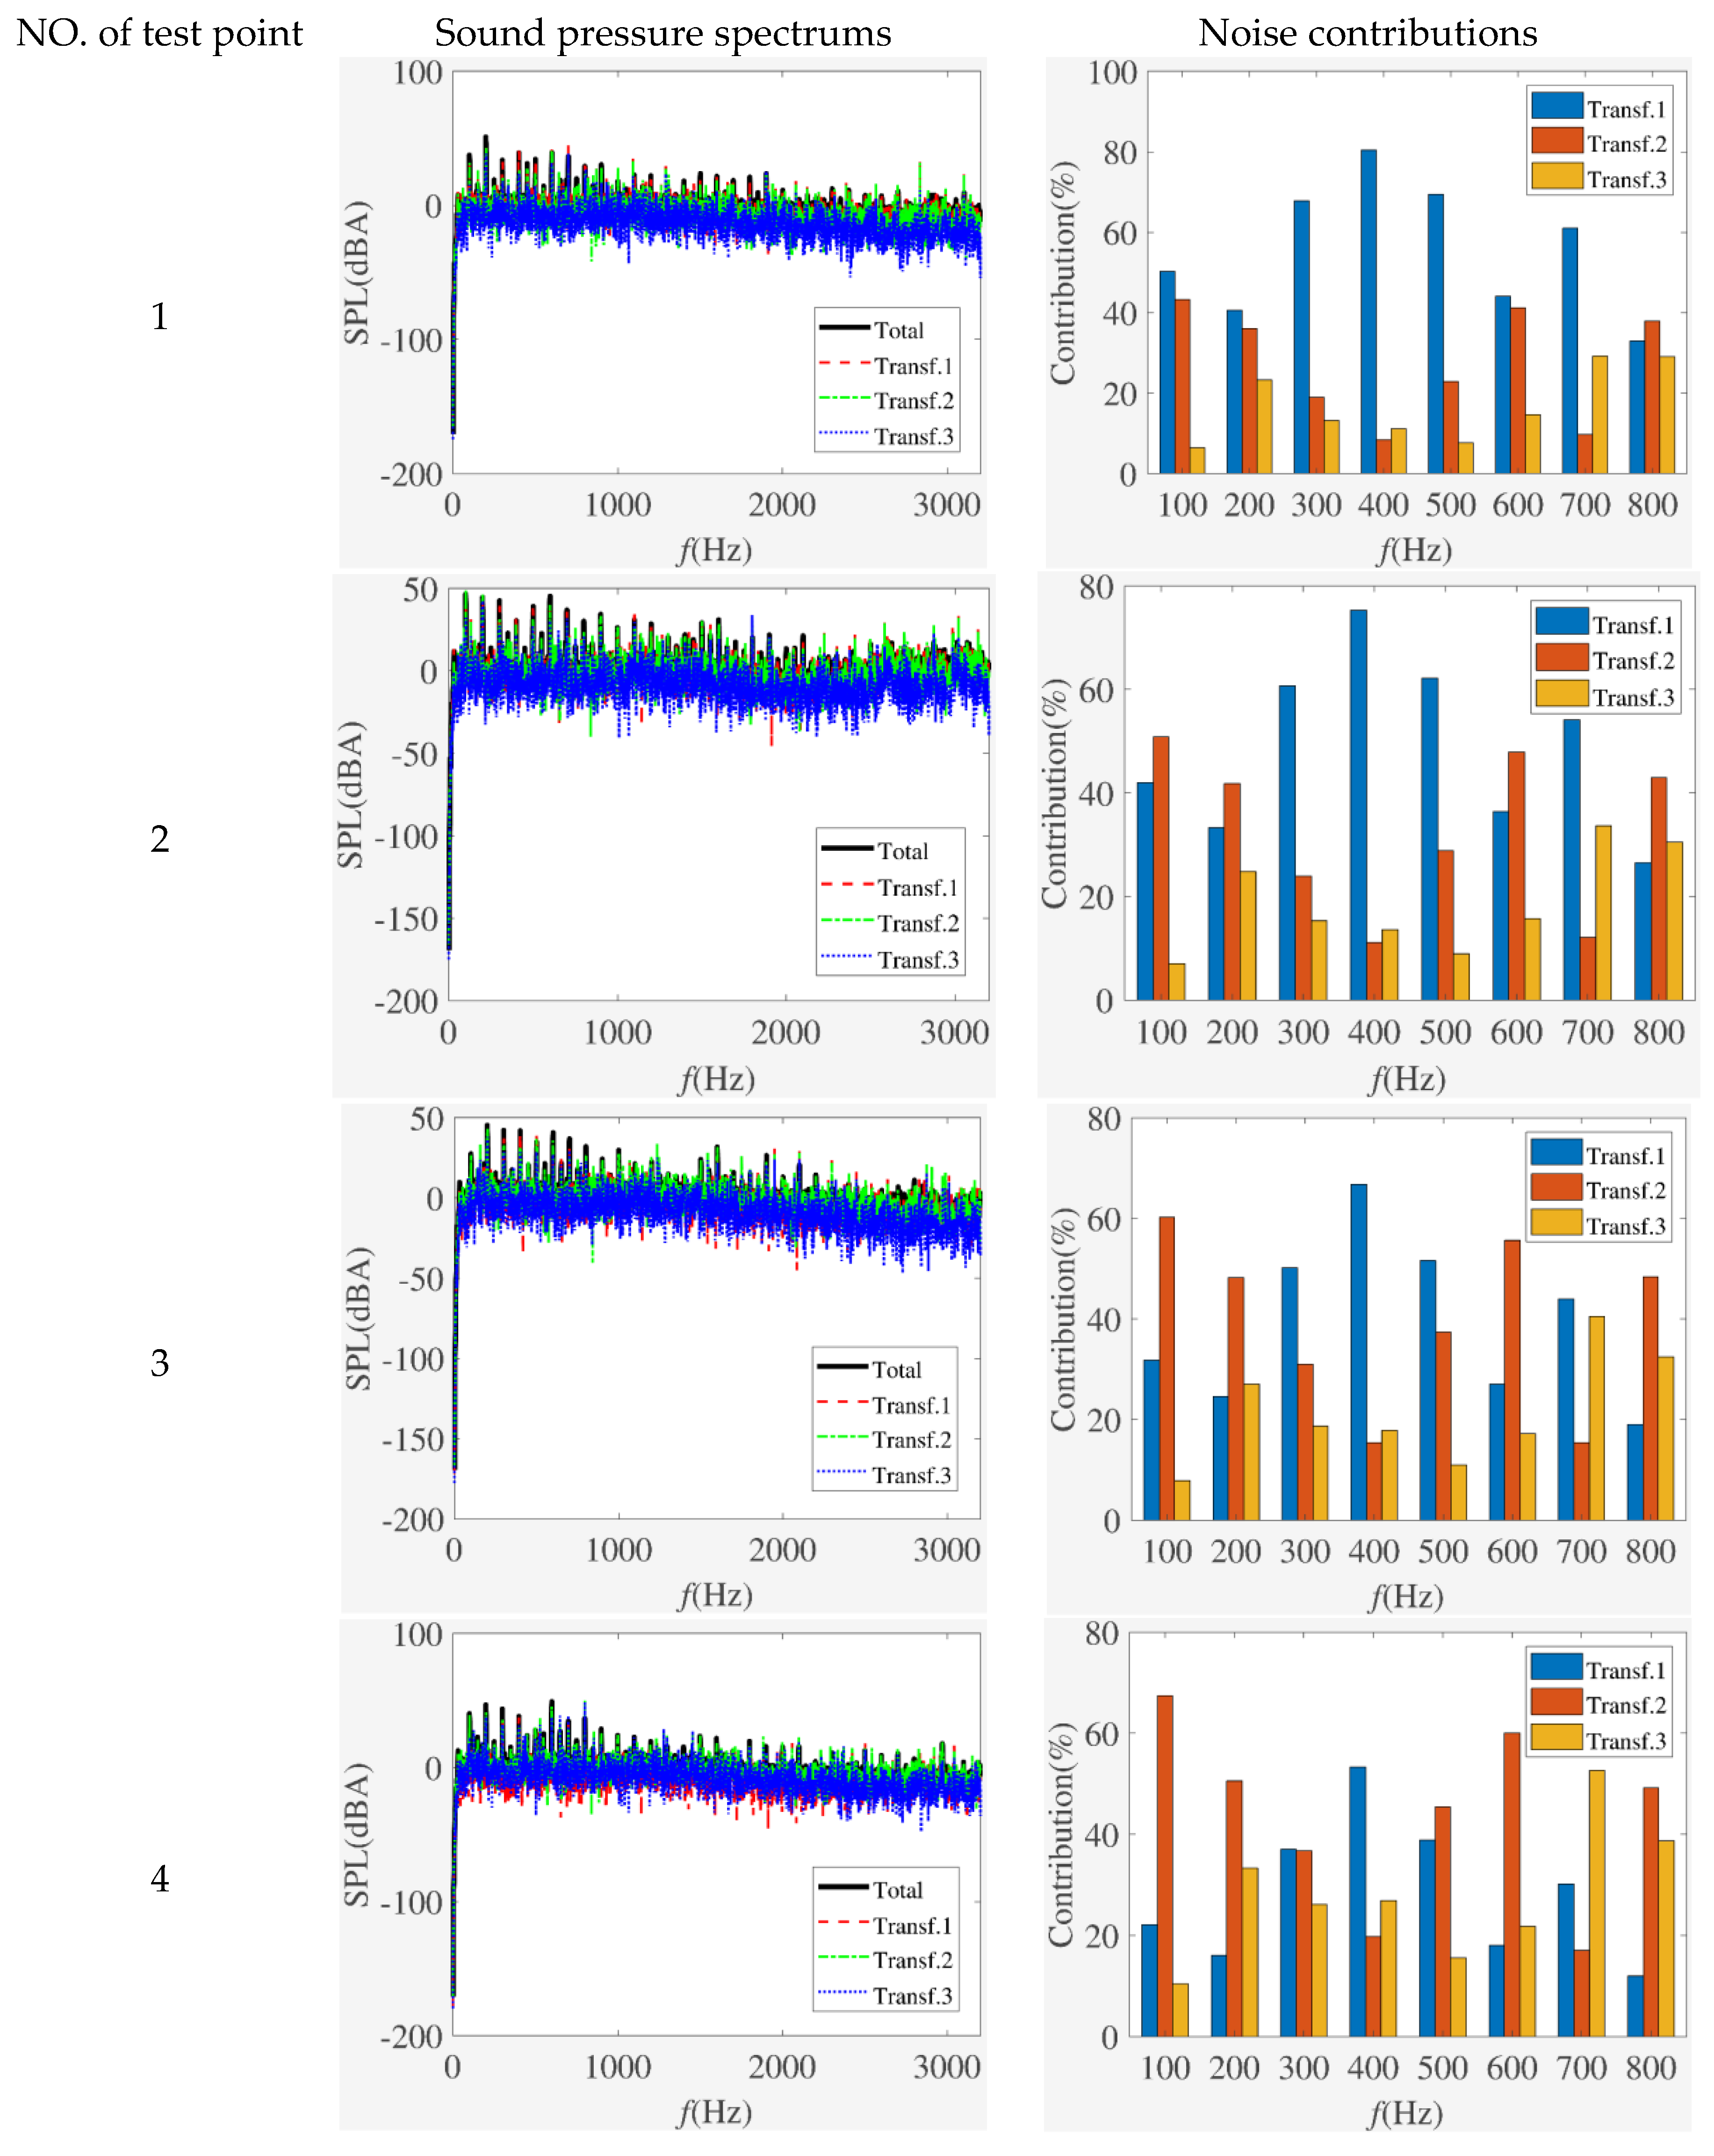
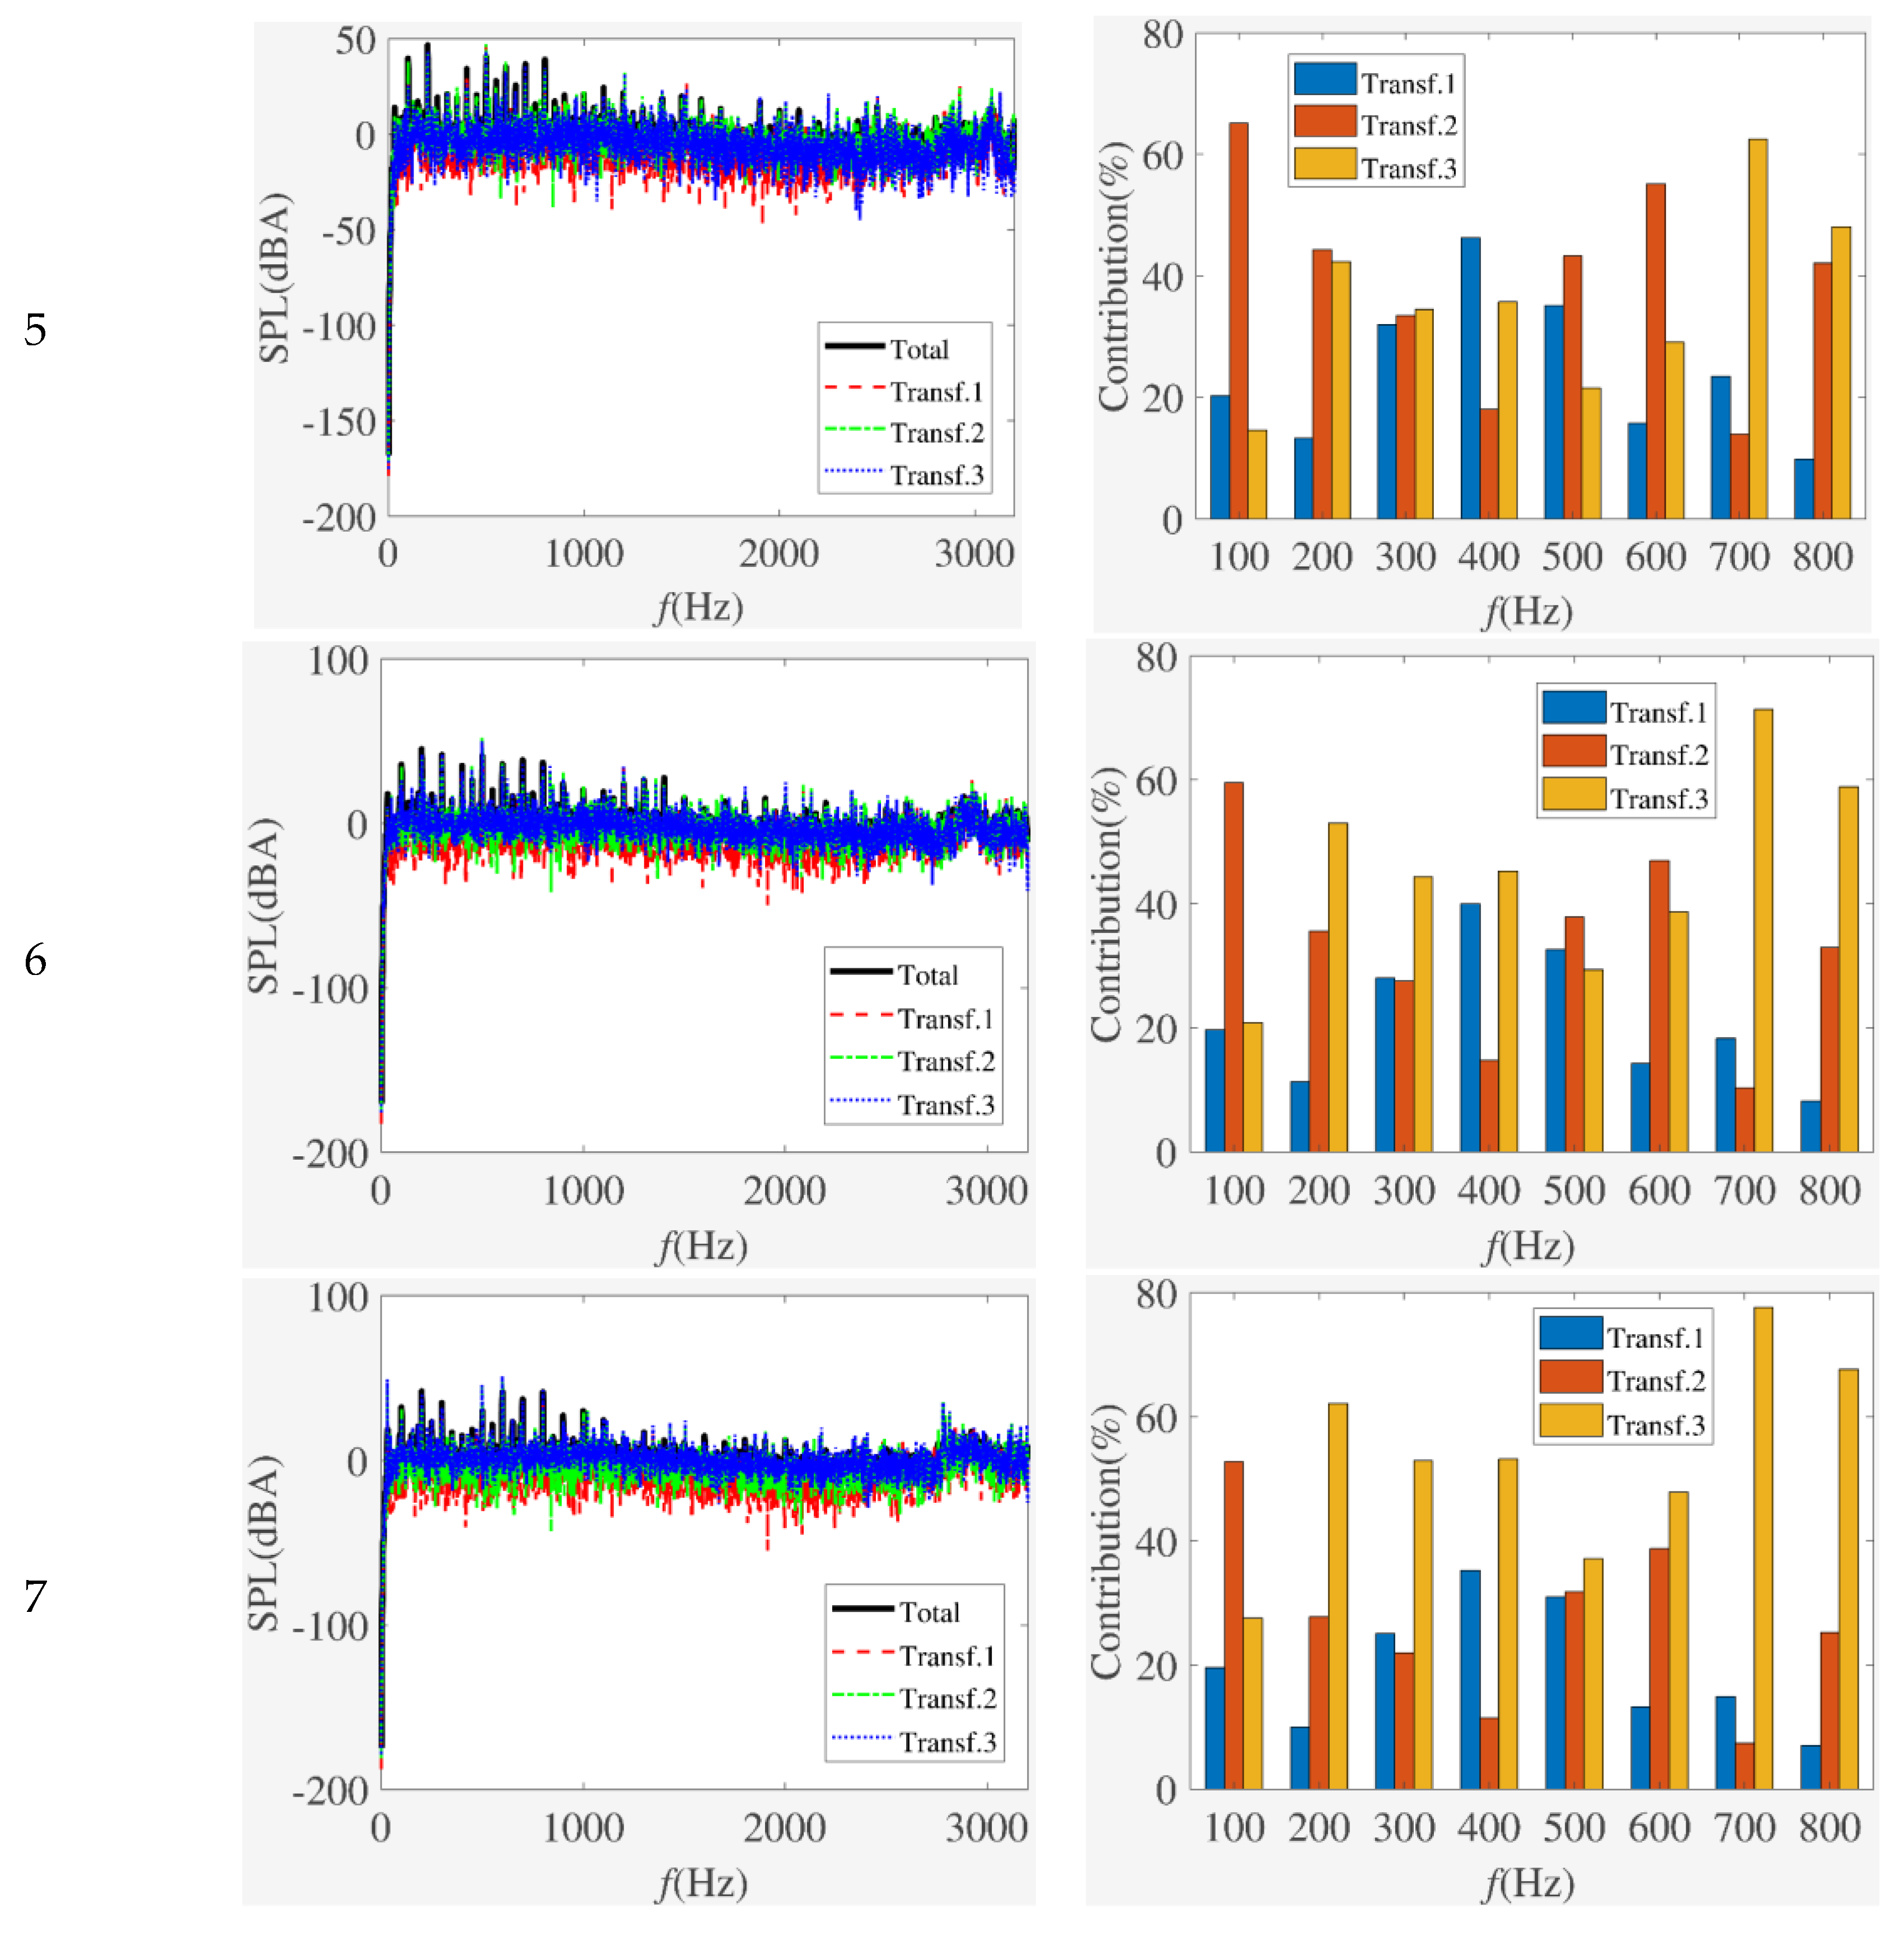
After the noise separation test, we are able to obtain sound pressure spectrums and contributions of each transformer in the substation, which can be used to guide the vibration and noise reduction for the substation. The final noise separation results of three transformers at all seven test points (the total sound pressure spectrums, the separated sound pressure spectrums, and the noise contributions of each transformer in Condition 2) are shown in Figure A1. Figure 16 only illustrates the final noise separation results at test point 1 as an example. Considering the final results, it is possible to quantitatively give the effect magnitude of the three transformers on the noise at any test point among their working frequencies. For example, if the location of test point 1 is a residential building, we should carry out vibration and noise reduction measures to make noise at this location reach a set standard, and then only transformer 1 needs to be designed for vibration and noise reduction because of its maximum noise contribution to test point 1, as illustrated in Figure 16.
In this subsection, a substation noise separation test is carried out using the noise separation technique based on the phase conjugation method proposed in the present paper. Through accuracy and application analysis, the test results prove that this noise separation technique can realize the separation of strong coherent noise signals and contributes analysis of multiple transformers at any location and frequency in the substation. The test results can be used to guide transformer vibration and noise reduction, which can greatly reduce the cost of designing vibration and noise reduction for all transformers one by one because of the inability to separate the noise sources. To sum up, the noise separation technique using the phase conjugation method proposed in this paper is of vital importance for engineering applications regarding substation vibration and noise reduction.
4. Conclusions
The present paper mainly proposes a noise separation technique using the phase conjugation method to overcome the difficulty of separating strong coherent intrinsic noise of multiple transformers in a substation. The accuracy and practicability of the noise separation technique are investigated by point source simulation, noise separation experiment in a semi-anechoic chamber, and a transformer noise separation test in a substation. The main conclusions are:
- Point source simulation reveals that the separation error originates from the reconstruction error of phase conjugation on the source information; gives the optimal phase conjugation array parameters for noise separation, which is that the array aperture is 1.5 times the sources distance and the array element spacing is less than the minimum half-wavelength; and provides practical application advice for phase conjugation array setup, which is that the array aperture is greater than the sources’ distance (i.e., 4 m for this example) and the array element spacing is less than for a 2dBA error tolerance.
- The semi-anechoic chamber noise separation experiment and transformer noise separation test in a substation utilize the noise separation technique proposed in this paper to realize the separation of the respective noise source signals in an ideal laboratory environment and an actual engineering environment. The experimental results satisfy the engineering error requirements, and the test results are in accordance with the distribution law of the noise source sound field, i.e., the accuracy and practicability of the noise separation technique is verified by the experiment and test.
- The test results can be used to guide transformer vibration and noise reduction, which can greatly reduce the cost of designing vibration and noise reduction. The noise separation technique using the phase conjugation method proposed in this paper is of vital importance for engineering applications.
Author Contributions
Conceptualization, S.F. and S.L.; methodology, J.L.; software, J.L.; validation, J.L., L.L. and S.F.; formal analysis, J.L.; investigation, L.L.; resources, S.F. and S.L.; data curation, J.L. and L.L.; writing—original draft preparation, J.L.; writing—review and editing, J.L.; visualization, J.L.; supervision, S.F. and S.L.; project administration, J.L. and L.L.; funding acquisition, S.F. All authors have read and agreed to the published version of the manuscript.
Funding
This research was funded by the Science and Technology Project of China Southern Power Grid (Grant No. GDKJXM20220790).
Institutional Review Board Statement
Not applicable.
Informed Consent Statement
Not applicable.
Data Availability Statement
The original contributions presented in the study are included in the article, further inquiries can be directed to the corresponding author.
Acknowledgments
Thanks for the contributions of Yifan Wang in paper writing and project administration.
Conflicts of Interest
Author Shengping Fan and Linyong Li were employed by the company Electric Power Research Institute of Guangdong Power Grid Co., Ltd. The remaining authors declare that the research was conducted in the absence of any commercial or financial relationships that could be construed as a potential conflict of interest.
Appendix A
Figure A1.
Final noise separation results of 3 transformers at 7 test points in the substation.


References
- Regazzi, R.; Cunha, B.; de Miranda, H.V.; Acosta, J.J.G.; Barbosa, C.R.H.; Frota, M.N.; Souza, J.V.; Gomes, C.A.M. Development and Validation of a Masking System for Mitigation of Low-Frequency Audible Noise from Electrical Substations. Appl. Sci. 2021, 11, 7771. [Google Scholar] [CrossRef]
- Piana, E.A.; Roozen, N.B. On the Control of Low-Frequency Audible Noise from Electrical Substations: A Case Study. Appl. Sci. 2020, 10, 637. [Google Scholar] [CrossRef]
- Wu, X.W.; Zhou, N.G.; Pei, C.M.; Hu, S. Separation Methodology Investigation of the Audible Noise in AC Substations. In Proceedings of the 2015 4th International Conference on Sensors, Measurement and Intelligent Materials, Shenzhen, China, 27–28 December 2016; pp. 834–838. [Google Scholar]
- Li, J.; Li, L.; Zhang, Y.X.; Chu, Z.G.; Fan, X.P. Annoyance evaluation of noise emitted by urban substation. J. Low Freq. Noise Vib. Act. Control 2021, 40, 2106–2114. [Google Scholar] [CrossRef]
- Di, G.Q.; Jiang, H.J.; Chen, C.; Ma, J.A.; Wu, J. A study on the control indices and emission limits of substation noise. Appl. Acoust. 2023, 205, 109275. [Google Scholar] [CrossRef]
- Xu, W.D.; Wang, L.F.; Wang, J.; Zhuang, D.J.; Zhang, J.M.; Zhang, C.; Yang, H.M.; Li, C.B. Research Review on Noise Analysis and Control Technology of Power Transformers. Guangdong Electr. Power 2020, 33, 86–94. [Google Scholar] [CrossRef]
- Yan, W.M.; Li, Z.H.; Zhang, Z.Q.; Chen, C.M. Research of Characteristics and Limits of Low Frequency Noise to High Voltage Power Facilities. Noise Vib. Control 2013, 33, 168–172. [Google Scholar] [CrossRef]
- Lei, X.S.; Wang, X.H.; Wang, Y.F.; Lin, G.; Qin, X.Y.; Hu, R. Simulation Modeling and Vibration Characteristic Analysis for Oil Tank of Flexible DC Transformer. Guangdong Electr. Power 2023, 36, 67–75. [Google Scholar] [CrossRef]
- Li, Z.Y.; Wei, H.Z.; Li, X.L.; Huang, Y. Coherent separation technique of noise in HVDC converter station. Electr. Power 2010, 43, 49–54. [Google Scholar] [CrossRef]
- Gosselin, B.; Fortin, J.C.; Lesperance, A.; Laroche, C. A New Approach for the Measurement of Noise Emitted by Electrical Substations. Noise Control Eng. J. 1993, 41, 357–363. [Google Scholar] [CrossRef]
- Guo, J.Y.; Liu, S.; Yu, K.; Chen, X.M.; Liu, Y.P.; Lu, F.C. An Ultrahigh Voltage Shunt Reactor Acoustic Signal Separation Method Based on Masking Beamforming and Underdetermined Blind Source Separation. IEEE Trans. Instrum. Meas. 2023, 72, 9001008. [Google Scholar] [CrossRef]
- Jackson, D.R.; Dowling, D.R. Phase conjugation in underwater acoustics. J. Acoust. Soc. Am. 1991, 89, 171–181. [Google Scholar] [CrossRef]
- Akhatov, I.; Ando, Y.; Attenborough, K. Springer Handbook of Acoustics, 2nd ed.; Rossing, T.D., Ed.; Springer: New York, NY, USA, 2014; p. 191. ISBN 978-1-4939-0754-0. [Google Scholar]
- de Rosny, J.; Fink, M. Focusing properties of nearfield time reversal. Phys. Rev. A 2007, 76, 065801. [Google Scholar] [CrossRef]
- Fink, M.; Cassereau, D.; Derode, A.; Prada, C.; Roux, P.; Tanter, M.; Thomas, J.L.; Wu, F. Time-reversed acoustics. Rep. Prog. Phys. 2000, 63, 1933. [Google Scholar] [CrossRef]
- Li, S.; Li, T.; Liu, S. Phase-conjugate arrays and phase-conjugated fields produced by the arrays. Chin. J. Ship Res. 2017, 12, 107–115, 133. [Google Scholar] [CrossRef]
Figure 1.
Process of noise separation technique using phase conjugation method.

Figure 2.
Schematic diagram of point source simulation.

Figure 3.
A-weighting SPL comparison results (source intensity ratio and phase obtained by phase conjugation method): (a) point source 1, (b) point source 2.
Figure 3.
A-weighting SPL comparison results (source intensity ratio and phase obtained by phase conjugation method): (a) point source 1, (b) point source 2.

Figure 4.
A-weighting SPL comparison results (source intensity ratio and phase taken as the set values): (a) point source 1, (b) point source 2.
Figure 4.
A-weighting SPL comparison results (source intensity ratio and phase taken as the set values): (a) point source 1, (b) point source 2.

Figure 5.
Influence of array aperture on MAE of separation technique: (a) point source 1, (b) point source 2.
Figure 5.
Influence of array aperture on MAE of separation technique: (a) point source 1, (b) point source 2.

Figure 6.
Influence of array element spacing on MAE of separation technique: (a) point source 1, (b) point source 2.
Figure 6.
Influence of array element spacing on MAE of separation technique: (a) point source 1, (b) point source 2.

Figure 7.
Schematic diagram of experiment equipment connection.

Figure 8.
Experimental scene in semi-anechoic chamber: (a) experimental equipment setup, (b) loudspeaker, (c) line array, (d) DAQ system.
Figure 8.
Experimental scene in semi-anechoic chamber: (a) experimental equipment setup, (b) loudspeaker, (c) line array, (d) DAQ system.

Figure 9.
Test schematic diagram (Condition 1).

Figure 10.
Test schematic diagram (Condition 2).

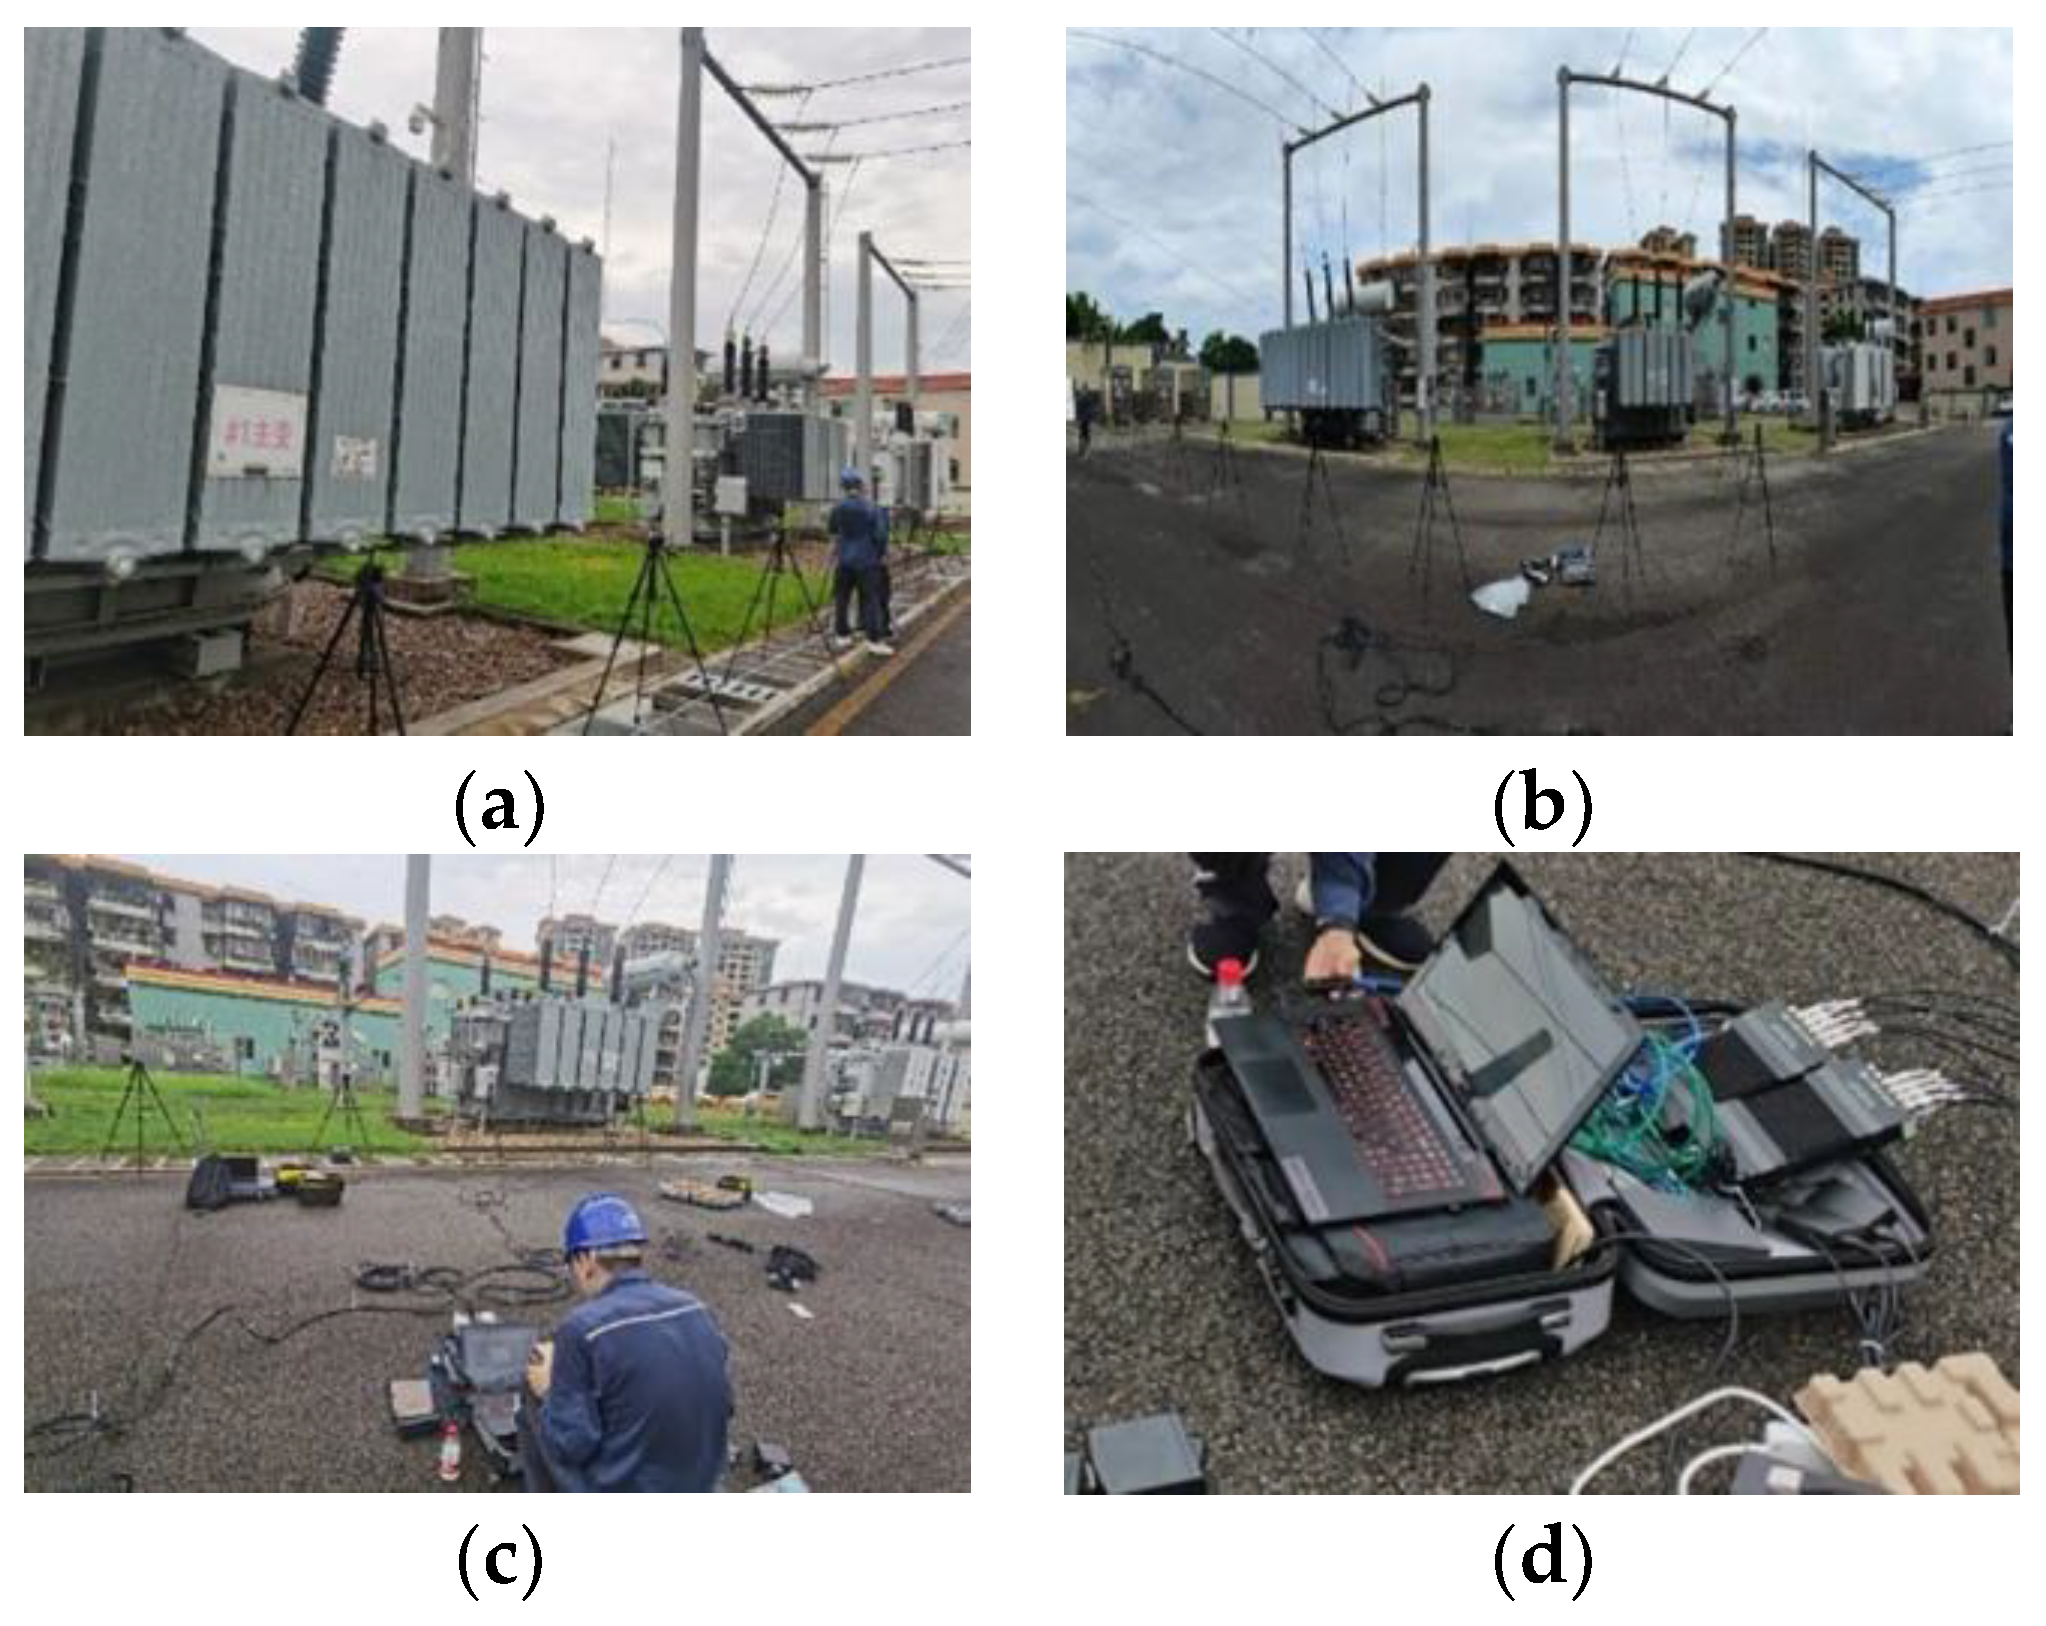
Figure 11.
Test scene in substation: (a) line array setup for Condition 1, (b) line array setup for Condition 2, (c) connection between line array and DAQ system, (d) connection between DAQ system and computer.
Figure 11.
Test scene in substation: (a) line array setup for Condition 1, (b) line array setup for Condition 2, (c) connection between line array and DAQ system, (d) connection between DAQ system and computer.

Figure 12.
Noise separation comparison results of 4 test points (Condition 1): (a) transformer 1, (b) transformer 2, (c) transformer 3.
Figure 12.
Noise separation comparison results of 4 test points (Condition 1): (a) transformer 1, (b) transformer 2, (c) transformer 3.

Figure 13.
Noise separation comparison results of 4 test points (Condition 2): (a) transformer 1, (b) transformer 2, (c) transformer 3.
Figure 13.
Noise separation comparison results of 4 test points (Condition 2): (a) transformer 1, (b) transformer 2, (c) transformer 3.

Figure 14.
Total A-weighting SPL and the test-point-to-source distance of 7 test points (Condition 1): (a) transformer 1, (b) transformer 2, (c) transformer 3.
Figure 14.
Total A-weighting SPL and the test-point-to-source distance of 7 test points (Condition 1): (a) transformer 1, (b) transformer 2, (c) transformer 3.

Figure 15.
Total A-weighting SPL and the test-point-to-source distance of 7 test points (Condition 2): (a) transformer 1, (b) transformer 2, (c) transformer 3.
Figure 15.
Total A-weighting SPL and the test-point-to-source distance of 7 test points (Condition 2): (a) transformer 1, (b) transformer 2, (c) transformer 3.

Figure 16.
Final noise separation results of 3 transformers at test point 1 in the substation.


Table 1.
Experimental equipment.
| No. | Equipment | Manufacturer | Type | Quantities |
|---|---|---|---|---|
| 1 | Loudspeaker | EDIFIER | - | 2 |
| 2 | Microphone | B&K | 4189 | 9 |
| 3 | Microphone stand | - | - | 1 |
| 4 | DAQ (data acquisition) system | B&K | 3050-A-060 | 2 |
| 5 | Wire | - | - | Certain |
| 6 | Computer | - | - | 1 |
| 7 | Derrick crane | - | - | 4 |
Table 2.
A-weighting SPL of experiment and noise separation technique at 3 test points/dBA (loudspeaker A with 400 Hz frequency).
Table 2.
A-weighting SPL of experiment and noise separation technique at 3 test points/dBA (loudspeaker A with 400 Hz frequency).
| No. of Test Point | Experiment | Noise Separation Technique | Absolute Error |
|---|---|---|---|
| 1 | 35.13 | 36.95 | 1.82 |
| 2 | 36.82 | 35.61 | 1.21 |
| 3 | 37.93 | 38.25 | 0.32 |
Table 3.
A-weighting SPL of experiment and noise separation technique at 3 test points/dBA (loudspeaker B with 400 Hz frequency).
Table 3.
A-weighting SPL of experiment and noise separation technique at 3 test points/dBA (loudspeaker B with 400 Hz frequency).
| No. of Test Point | Experiment | Noise Separation Technique | Absolute Error |
|---|---|---|---|
| 1 | 38.95 | 38.25 | 0.70 |
| 2 | 37.64 | 37.38 | 0.27 |
| 3 | 35.00 | 36.77 | 1.77 |
Table 4.
Test equipment in a substation.
| No. | Equipment | Manufacturer | Type | Quantity |
|---|---|---|---|---|
| 1 | Microphone | B&K | 4189 | 11 |
| 2 | DAQ system | B&K | 3050-A-060 | 2 |
| 3 | BNC wire | - | - | Certain |
| 4 | Computer | - | - | 1 |
| 5 | Derrick crane | - | - | 11 |
| 6 | Lan cable | - | - | 3 |
Disclaimer/Publisher’s Note: The statements, opinions and data contained in all publications are solely those of the individual author(s) and contributor(s) and not of MDPI and/or the editor(s). MDPI and/or the editor(s) disclaim responsibility for any injury to people or property resulting from any ideas, methods, instructions or products referred to in the content. |
© 2024 by the authors. Licensee MDPI, Basel, Switzerland. This article is an open access article distributed under the terms and conditions of the Creative Commons Attribution (CC BY) license (https://creativecommons.org/licenses/by/4.0/).
Share and Cite
MDPI and ACS Style
Fan, S.; Liu, J.; Li, L.; Li, S. Noise Separation Technique for Enhancing Substation Noise Assessment Using the Phase Conjugation Method. Appl. Sci. 2024, 14, 1761. https://doi.org/10.3390/app14051761
AMA Style
Fan S, Liu J, Li L, Li S. Noise Separation Technique for Enhancing Substation Noise Assessment Using the Phase Conjugation Method. Applied Sciences. 2024; 14(5):1761. https://doi.org/10.3390/app14051761
Chicago/Turabian StyleFan, Shengping, Jiang Liu, Linyong Li, and Sheng Li. 2024. "Noise Separation Technique for Enhancing Substation Noise Assessment Using the Phase Conjugation Method" Applied Sciences 14, no. 5: 1761. https://doi.org/10.3390/app14051761
Note that from the first issue of 2016, this journal uses article numbers instead of page numbers. See further details here.