Article

Competition between Electron–Phonon and Spin–Phonon Interaction on the Band Gap and Phonon Spectrum in Magnetic Semiconductors

by
Angel T. Apostolov
1,
Iliana N. Apostolova
2 and
Julia M. Wesselinowa
3,*
1
University of Architecture, Civil Engineering and Geodesy, Hristo Smirnenski Blvd. 1, 1046 Sofia, Bulgaria
2
University of Forestry, Kl. Ohridsky Blvd. 10, 1756 Sofia, Bulgaria
3
Faculty of Physics, Sofia University “St. Kliment Ohridski”, J. Bouchier Blvd. 5, 1164 Sofia, Bulgaria
*
Author to whom correspondence should be addressed.
Appl. Sci. 2024, 14(5), 1686; https://doi.org/10.3390/app14051686
Submission received: 19 December 2023 / Revised: 12 February 2024 / Accepted: 16 February 2024 / Published: 20 February 2024

Abstract

:
Using the microscopic s-f model and Green’s function theory, we study the temperature dependence of the band gap energy E g and the phonon energy ω and damping γ of ferro- and antiferromagnetic semiconductors, i.e., with different signs of the s-f interaction constant I. The band gap is a fundamental quantity which affects various optical, electronic and energy applications of the materials. In the temperature dependence of E g and the phonon spectrum, there is a kink at the phase transition temperature T C or T N due to the anharmonic spin–phonon interaction (SPI) R. Moreover, the effect of the SPI R and electron–phonon interaction (EPI) A on these properties is discussed. For I > 0 , R > 0 , E g decreases with increasing SPI and EPI, whereas for I < 0 , R > 0 , there is a competition; E g increases with raising the EPI and decreases for enhanced SPI. For R < 0 , in both cases, the SPI and EPI reduce E g . The magnetic field dependence of E g for the two signs of I and R is discussed. The SPI and EPI lead to reducing the energy of the phonon mode ω = 445 cm−1 in EuO ( I > 0 , R < 0 ), whereas ω = 151 cm−1 in EuSe ( I > 0 , R > 0 ) is enhanced with increasing EPI and reduced with SPI. Both the SPI and EPI lead to an increasing of the phonon damping in EuO and EuSe. The results are compared with the existing experimental data.

1. Introduction

The Kondo lattice model, or s-d(f) exchange model, is widely used to describe the correlation effects in metals (and their compounds) with unfilled d- and f-shells (transition or rare earth metals, for example, CdCr2Se4, HgCr2Se4 or Eu, U chalcogenides, respectively) [1,2,3]. The nature of the ground state in these systems is largely determined by the result of competition between two interactions. On the one hand, the s-d(f) exchange coupling between spins of itinerant s- and localized d(f)-electrons, due to Kondo fluctuations, screens the localized spins and tends to form a non-magnetic ground state. In the opposite direction, an indirect exchange (RKKY) interaction takes place between spins of d(f)-electrons, trying to set a long-range magnetic order which is not necessarily ferromagnetic or antiferromagnetic.
Ferromagnetic semiconductors (FMS) which find applications in spin electronics and informatics are materials exhibiting both ferromagnetic and semiconductor properties [1,4,5]. While traditional electronics are based on the control of charge carriers, FMS allow also control of the quantum spin state, providing an almost complete spin polarization, an important property for spintronics applications [4].
The fundamental element in the theory of the so-called s-f model which is widely accepted as a good description of magnetic 4f- or 5f-systems is the exchange coupling (s-f coupling) between the conduction band electrons and the lattice of localized magnetic moments [1,6,7,8]. The s-f coupling influences the optical, electrical, and magnetic properties of these materials. As first pointed out by Shastry and Mattis [9], the physical properties depend very strongly on the sign of the s-f exchange. In the Eu chalcogenides, the electron spin couples ferromagnetically (FM) to the f spin [2], whereas in the uranium chalcogenides, the s-f coupling seems to be antiferromagnetic (AFM) [10]. For I > 0 , the localized-spin magnetization and the electron-spin polarization increase, whereas for I < 0 , they decrease with increasing the conduction band width [11]. The temperature and carrier concentration dependence of the conduction electron spin polarization for 4f and 5f compounds was discussed in [12,13]. Woolsey and White [14] calculated the electron and magnon lifetime as a function of the doping in the low-temperature spin wave approximation for the FM s-f exchange.
The spin–phonon interaction (SPI) in FMS has been investigated by many authors. Most works have considered the influence of the SPI on the phonon spectrum (but not on the band gap energy), for example, in EuO and EuS [15,16]. Wesselinowa et al. [15] studied the anharmonic spin–phonon and phonon–phonon interaction effects on optical phonon modes and spin wave excitations in FMS.
The band gap is a fundamental quantity which affects various optical, electronic and energy applications of the materials. FMS based on Eu chalcogenides are known for their interesting and different magnetic properties. The band gap variation is from 1.12 eV for EuO, 1.6 eV for EuS to 2.0 for EuTe [1]. Theoretically and experimentally, the influence of the electron–phonon interaction (EPI) on the temperature dependence of the band structure of semiconductors has been studied [17,18,19,20,21].
Raman spectroscopy is a very powerful tool for material analysis. It is used to perform quality control, failure analysis, sample identification, materials characterization, and, in general, to investigate physical and chemical properties. Therefore, it is important to study the influence of different microscopic interactions, such as the SPI and EPI on the phonon spectra. Raman scattering of Eu and U chalcogenides near the magnetic phase transitions is investigated in [22,23,24,25,26]. The effect of the EPI on the temperature dependence of the electronic and phonon spectrum in the FMS CdCr2S4 is discussed in [27]. Zhou et al. [28] have shown experimentally the impact of the EPI on the lattice thermal conductivity at room temperature. The interaction between conduction electrons and localized moments in FMS is investigated in [14,29]. The electron–phonon interaction and phonon frequencies in two-dimensional doped semiconductors are studied by Macheda et al. using a linear-response dielectric-matrix formalism [30].
To our knowledge, most articles consider the influence of the SPI only on the phonon spectrum, whereas the influence of the EPI is studied theoretically and experimentally only on the temperature dependence of the band structure of FMS. Therefore, in order to correctly explain the experimental data, in this paper we investigate for the first time the influence of both interactions, the competition between EPI and SPI, by their influence on the band gap energy and on the phonon spectrum in magnetic semiconductors (FM and AFM) using the s-f model and Green’s function theory.

2. Model and Green’s Functions

The magnetic semiconductors of the europium chalcogenide family, EuO, EuS, EuSe and EuTe (where EuO and EuS are ferro-, EuSe meta-, and EuTe antiferromagnetic semiconductors), are characterized by narrow 4f orbitals as degenerate levels. These materials all show a strong coupling between the electronic and the magnetic properties so that the electrical properties are greatly modified by a change of magnetic state. The ferromagnetism of UTe is itinerant, i.e., the 5f electrons are not fully localized close to the atomic core. We will consider mainly the band gap energy of magnetic semiconductors, such as EuO, EuSe (which are 4f systems) and UTe (5f systems). Therefore, we use the s-f model [2,3], taking into account the spin–phonon and electron–phonon interactions:
H = H m + H e l + H m e l .
The Heisenberg Hamiltonian for the localized f spins, including the strong spin–phonon interaction reported in FMS [31], is given by:
H m = 1 2 i , j J i j S i · S j D z i ( S i z ) 2 g μ B h · i S i 1 2 i , j , k F ¯ ( i , j , k ) Q i S j z S k z 1 4 i , j , r , s R ¯ ( i , j , r , s ) Q i Q j S r z S s z + h . c .
where S i and its z component S i z are spin operators for the localized spins at site i. J i j stands for the spin exchange interaction between the nearest neighbors. D z is the single-site anisotropy parameter of the easy-axis type. h is an external magnetic field. The normal coordinate Q i can be expressed in terms of phonon creation a + and annihilation a operators: Q i = ( 2 ω 0 i ) 1 / 2 ( a i + a i + ) . F ( i , j ) = F ¯ ( i , j ) / [ ( 2 ω 0 i ) 1 / 2 ( 2 ω 0 j ) 1 / 2 ] and R ( i , j , r ) = R ¯ ( i , j , r ) / [ ( 2 ω 0 i ) 1 / 2 ( 2 ω 0 j ) 1 / 2 ( 2 ω 0 r ) 1 / 2 ] designate the amplitudes for the coupling of phonons to the spin excitations in the first and second order, respectively. And h.c. represents the Hermitian conjugate.
The magnetization M for arbitrary spin S is given by:
M = S z = 1 N i ( S + 0.5 ) coth [ ( S + 0.5 ) β E m i ] 0.5 coth ( 0.5 β E m i ) ,
where E m i is the spin wave energy, calculated from Green’s function:
G i j ( t ) = S i + ( t ) ; S j = i Θ ( t ) [ S i + ( t ) , S j ] .
The spin–phonon interaction renormalizes the exchange interaction constant J to
J i j e f f = J i j + 2 F 2 / ( ω o M R ) .
The Hamiltonian of the conduction band electrons H e l , taking into account the interaction between the electron and phonon subsystems, is given by:
H e l = i j σ t i j c i σ + c j σ + i i j k σ A ( i j k ) c i σ + c j σ ( a k + + a k ) + h . c . ,
where t i j is the hopping integral, and c i σ + and c i σ are Fermi-creation and -annihilation operators. A ( i j k ) is the electron–phonon interaction constant.
The Eu and U chalcogenides show a strong coupling between the electronic and the magnetic properties so that the electrical properties are greatly modified by a change of magnetic state. The s-f coupling term H m e l reads
H m e l = i I i S i s i ,
where I is the s-f interaction constant. The spin operators s i of the conduction electrons at site i can be expressed as s i + = c i + + c i , s i z = ( c i + + c i + c i + c i ) / 2 .
In order to investigate the phonon spectrum, we need H p h , which contains the lattice vibrations, including anharmonic phonon–phonon interactions:
H p h = 1 2 ! i ( ω 0 i ) 2 a i a i + + 1 3 ! i , j , r B p h ( i , j , r ) Q i Q j Q r + 1 4 ! i , j , r , s A p h ( i , j , r , s ) Q i Q j Q r Q s ,
where Q i and ω 0 i are the normal coordinate and frequency, respectively, of the lattice mode.
For the phonon properties, we introduce Green’s function
G ˜ i j ( t ) = a i ( t ) ; a j + .
The phonon energy, which is renormalized through the electron–phonon and spin–phonon interactions, is observed as:
ω i j 2 = ω 0 2 2 ω 0 1 N k A i j k 2 ( n ¯ i σ n ¯ j σ ϵ i k σ ϵ j k σ ω 0 + M i M j R i j δ i j 1 2 N r A i j r p h ( 2 N ¯ r + 1 ) B i j p h Q i j δ i j ) ,
with
Q i j = M i M j F i j δ i j 1 N r B i j r p h ( 2 N ¯ r + 1 ) ω 0 M i M j R i j δ i j + 1 N r A i j r p h ( 2 N ¯ r + 1 ) .
The correlation functions of the conduction electrons n ¯ i σ = c i σ + c i σ and the phonons N ¯ i = a i + a i are obtained via the spectral theorem. The phonon damping is also calculated using the method of Tserkovnikov [32].
The band gap energy E g = ϵ + ( k = 0 ) ϵ ( k = k σ ) of FMS is defined as the energy difference between the highest occupied state in the valence band and the lowest unoccupied state in the conduction band. The electronic energies:
ϵ i j ± = ϵ i j σ 2 I S z 2 A 2 ω 0 m n m σ
are observed from Green’s functions g i j σ = c i σ ; c j σ + , σ = ± 1 . ϵ i j is the conduction band energy in the paramagnetic state, n m σ is the occupation number distribution, and S z is the magnetization. The band gap energy is influenced by some interaction constants. It is dependent on the sign of the s-f interaction constant I; it is positive or negative, for example, for EuO or UTe, respectively. The SPI renormalizes the exchange interaction constant J (see Equation (5)) and so modifies the magnetization S z = M in the second term of (12). It must be noted that the anharmonic SPI R can be also positive or negative. The third term describes the effect of the EPI A > 0 , i.e., the influence of the lattice vibration of the itinerant electrons.

3. Numerical Results and Discussion

For the numerical calculations, we use the following model parameters for EuO: J = 0.0001 eV, I = 0.2 eV, T C = 69 K [2], E g = 1.1 eV [1]. For UTe, we use J = 0.0001 eV, I = −0.2 eV, T C = 106 K [33], E g = 0.6 eV [34].

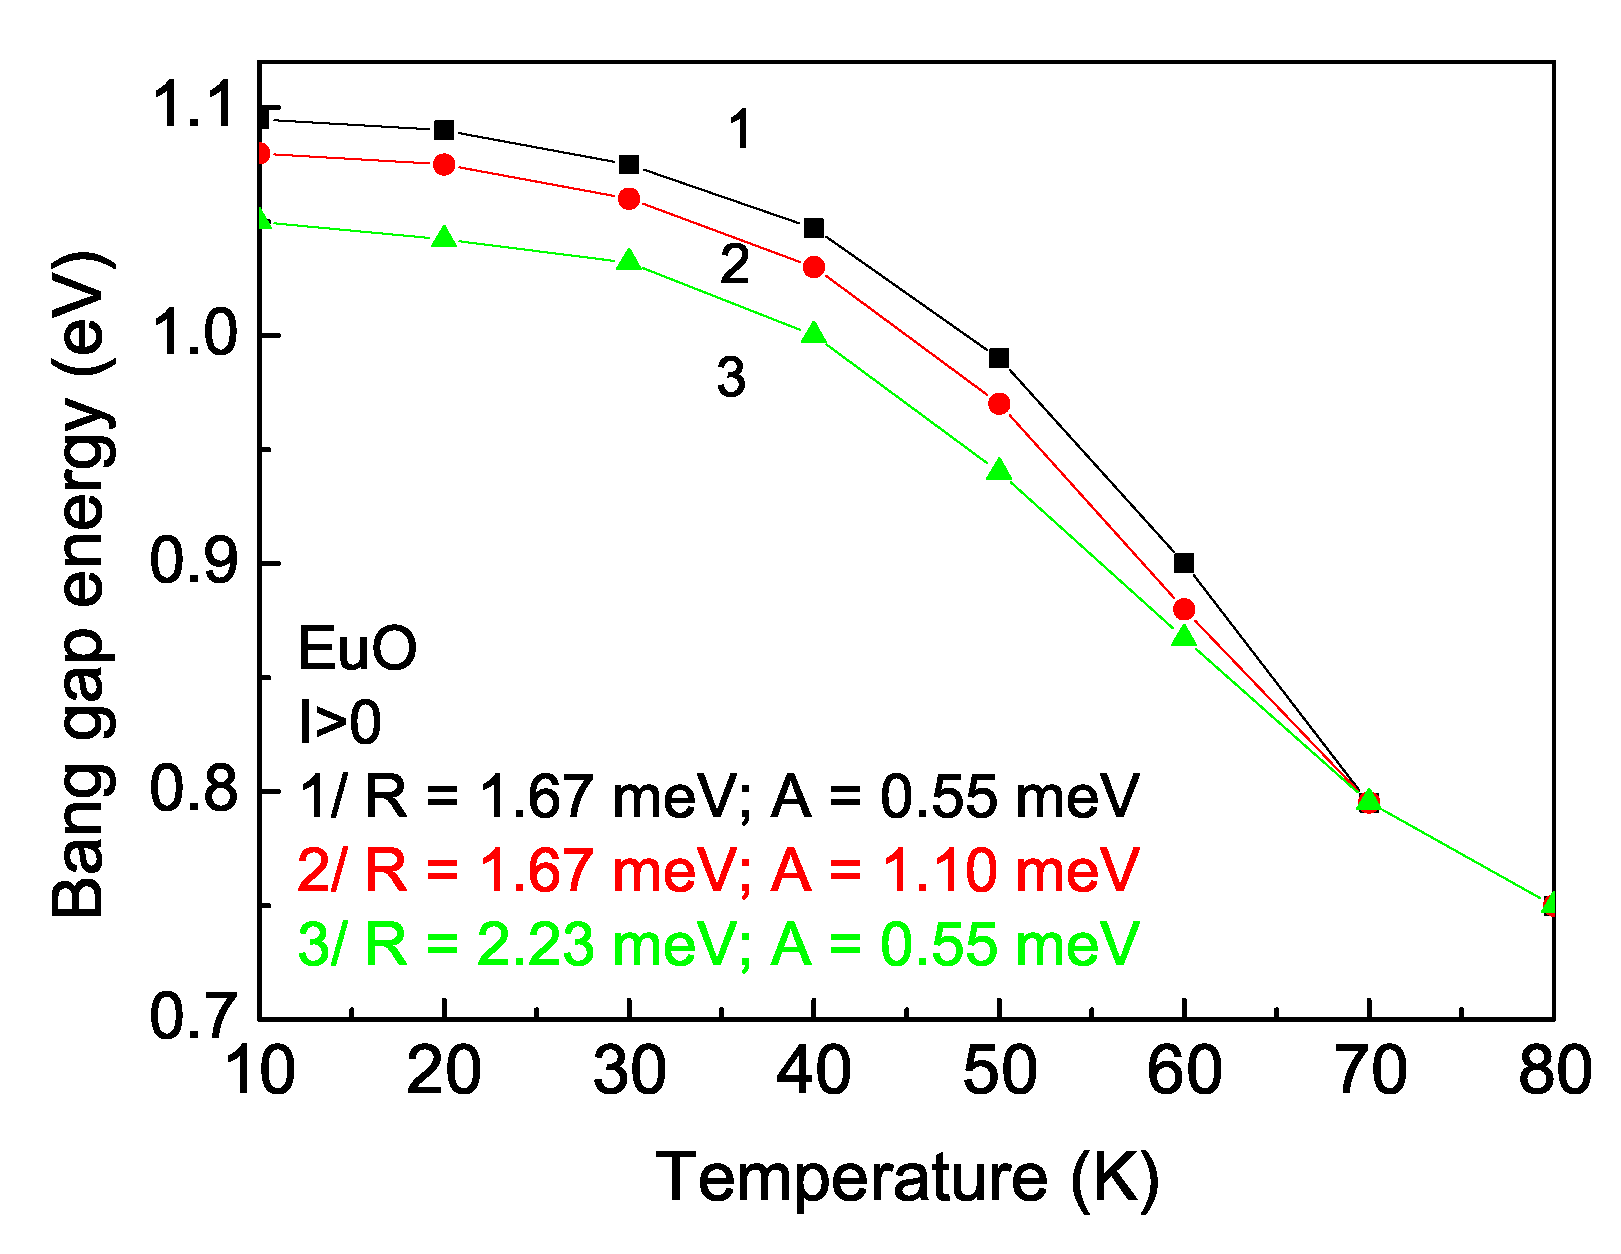
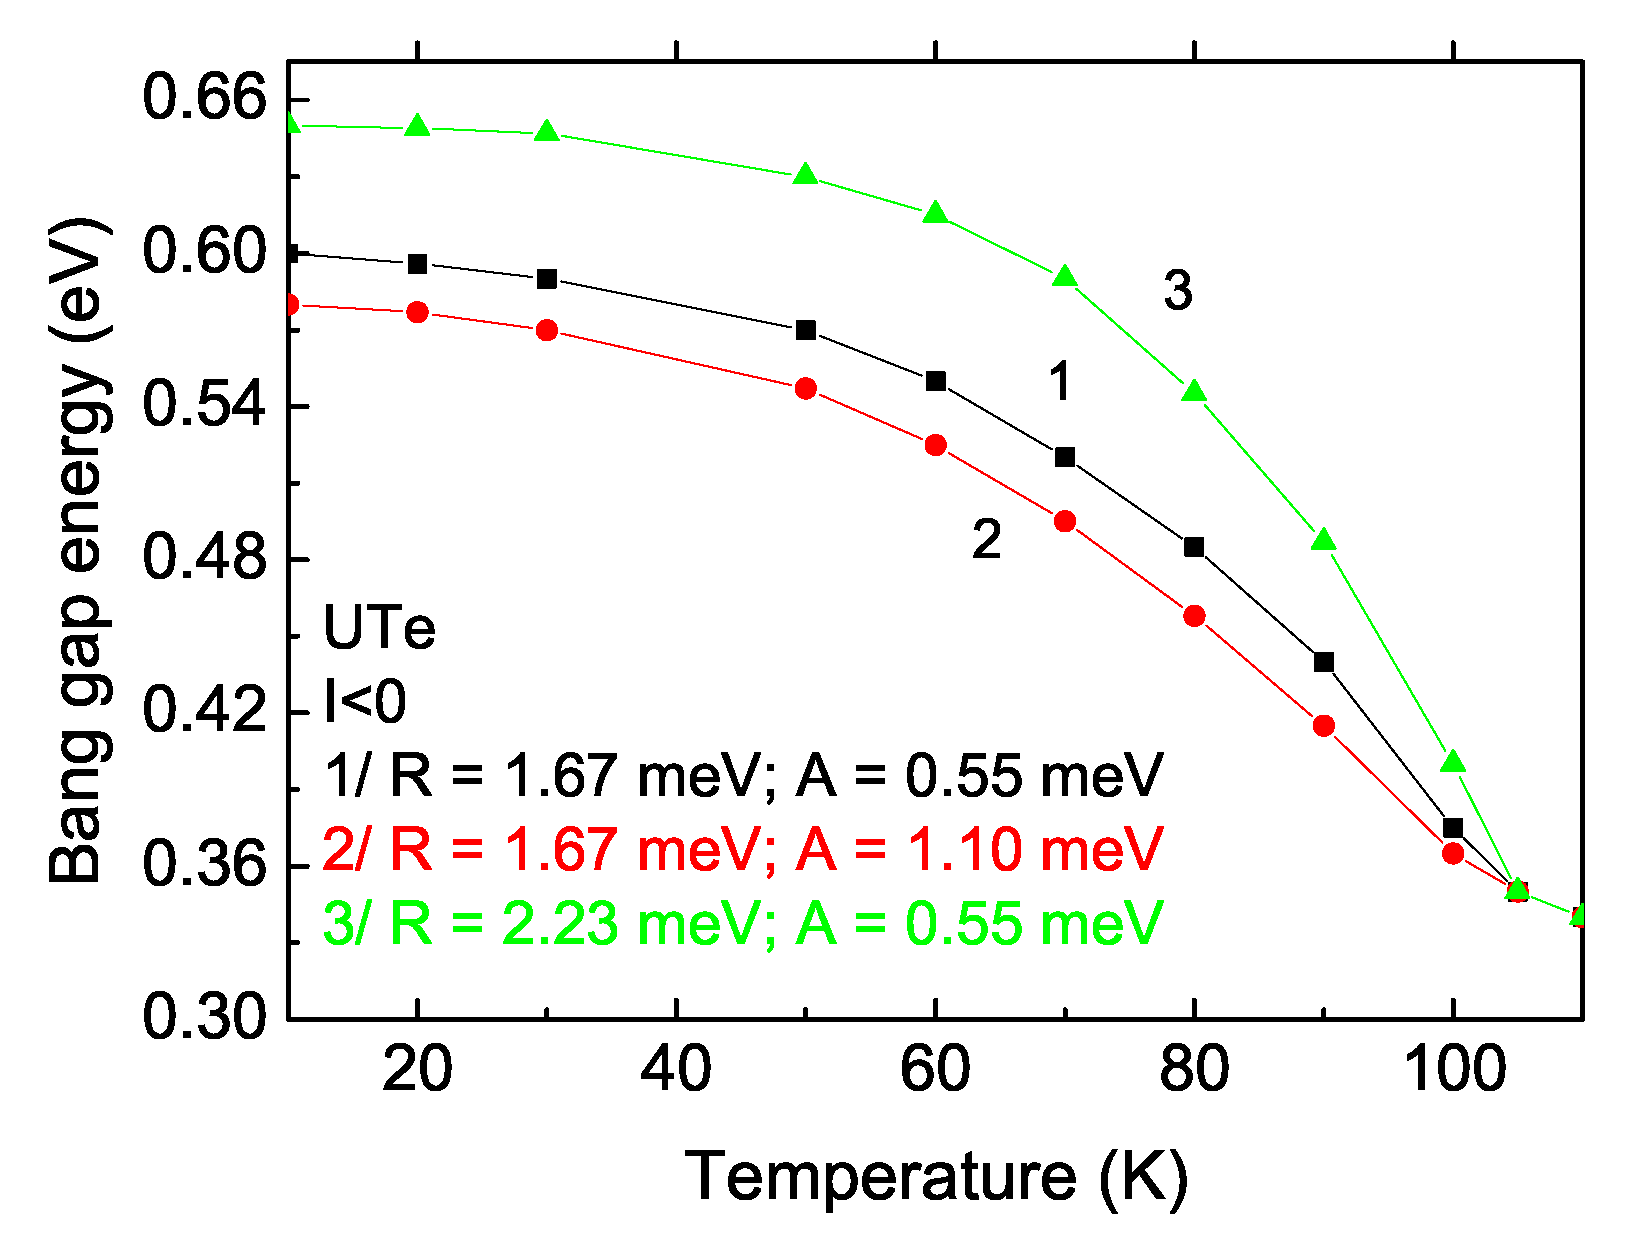
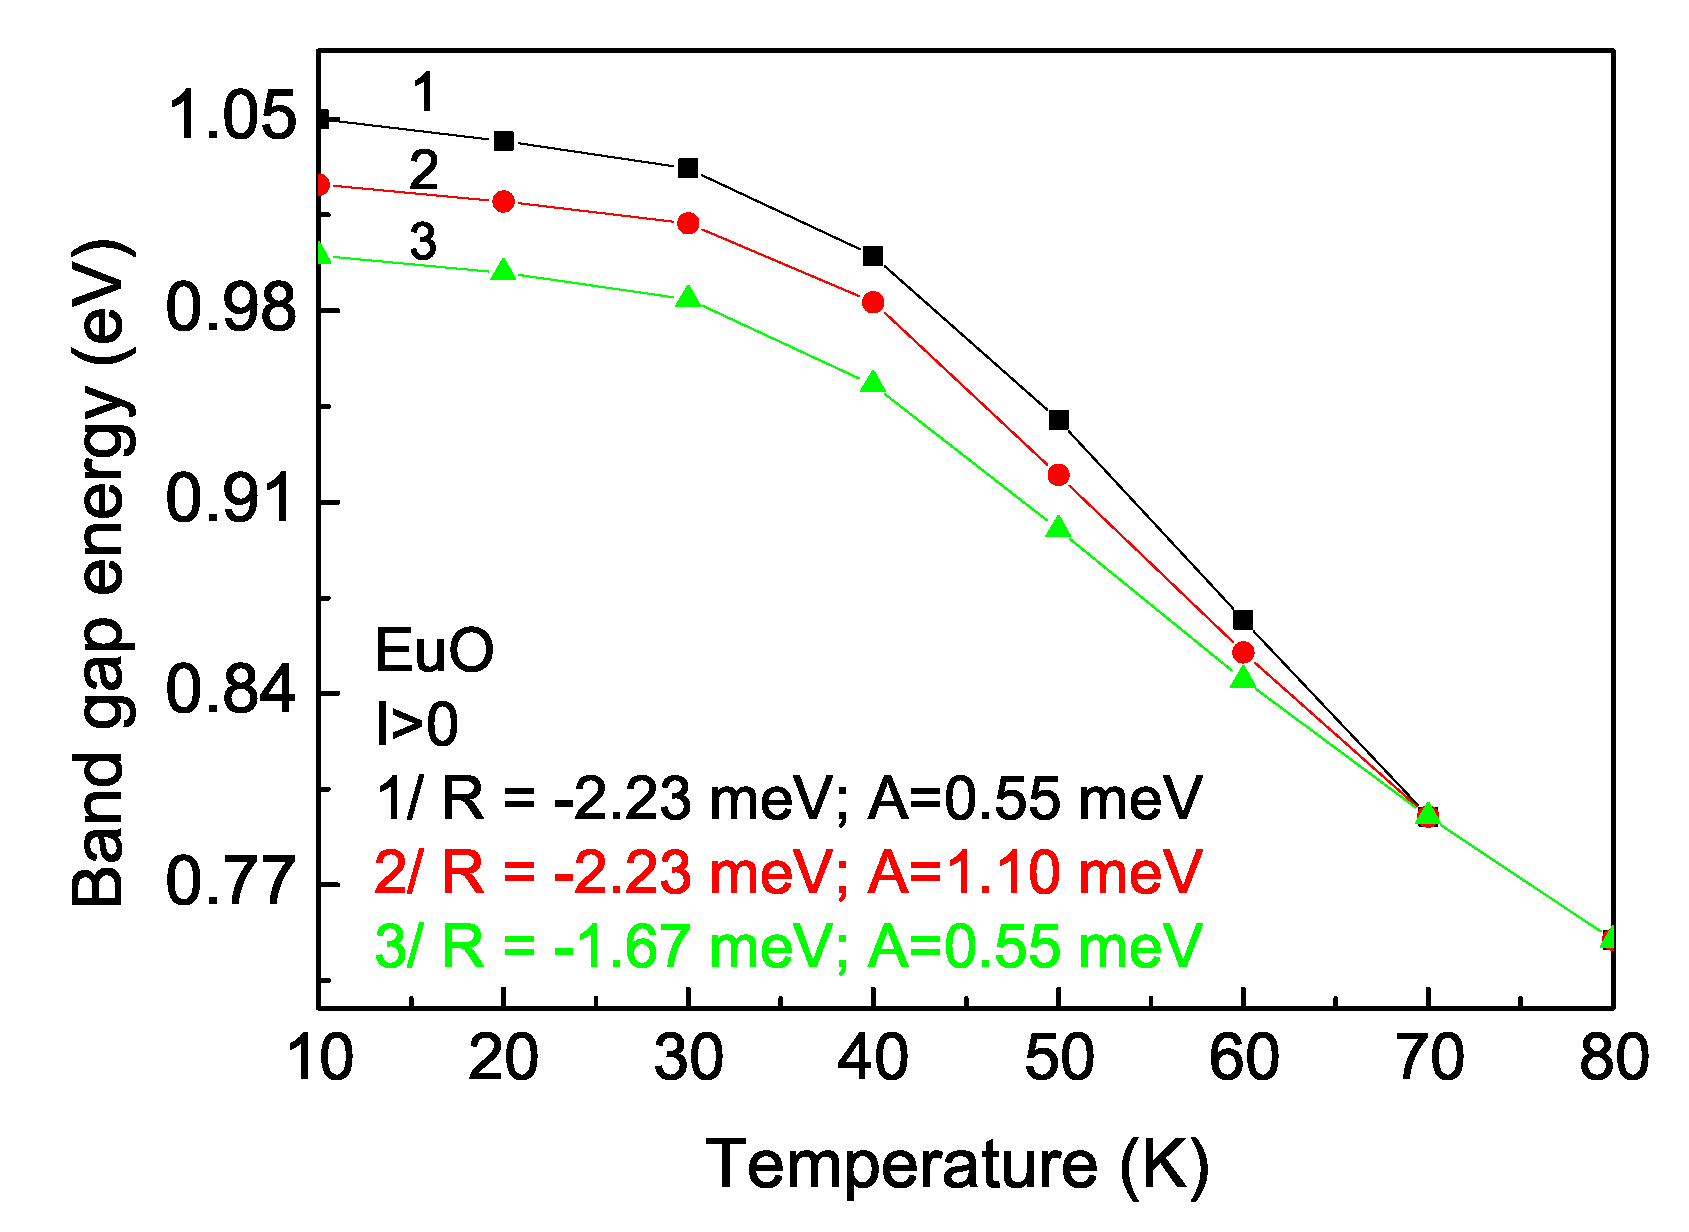
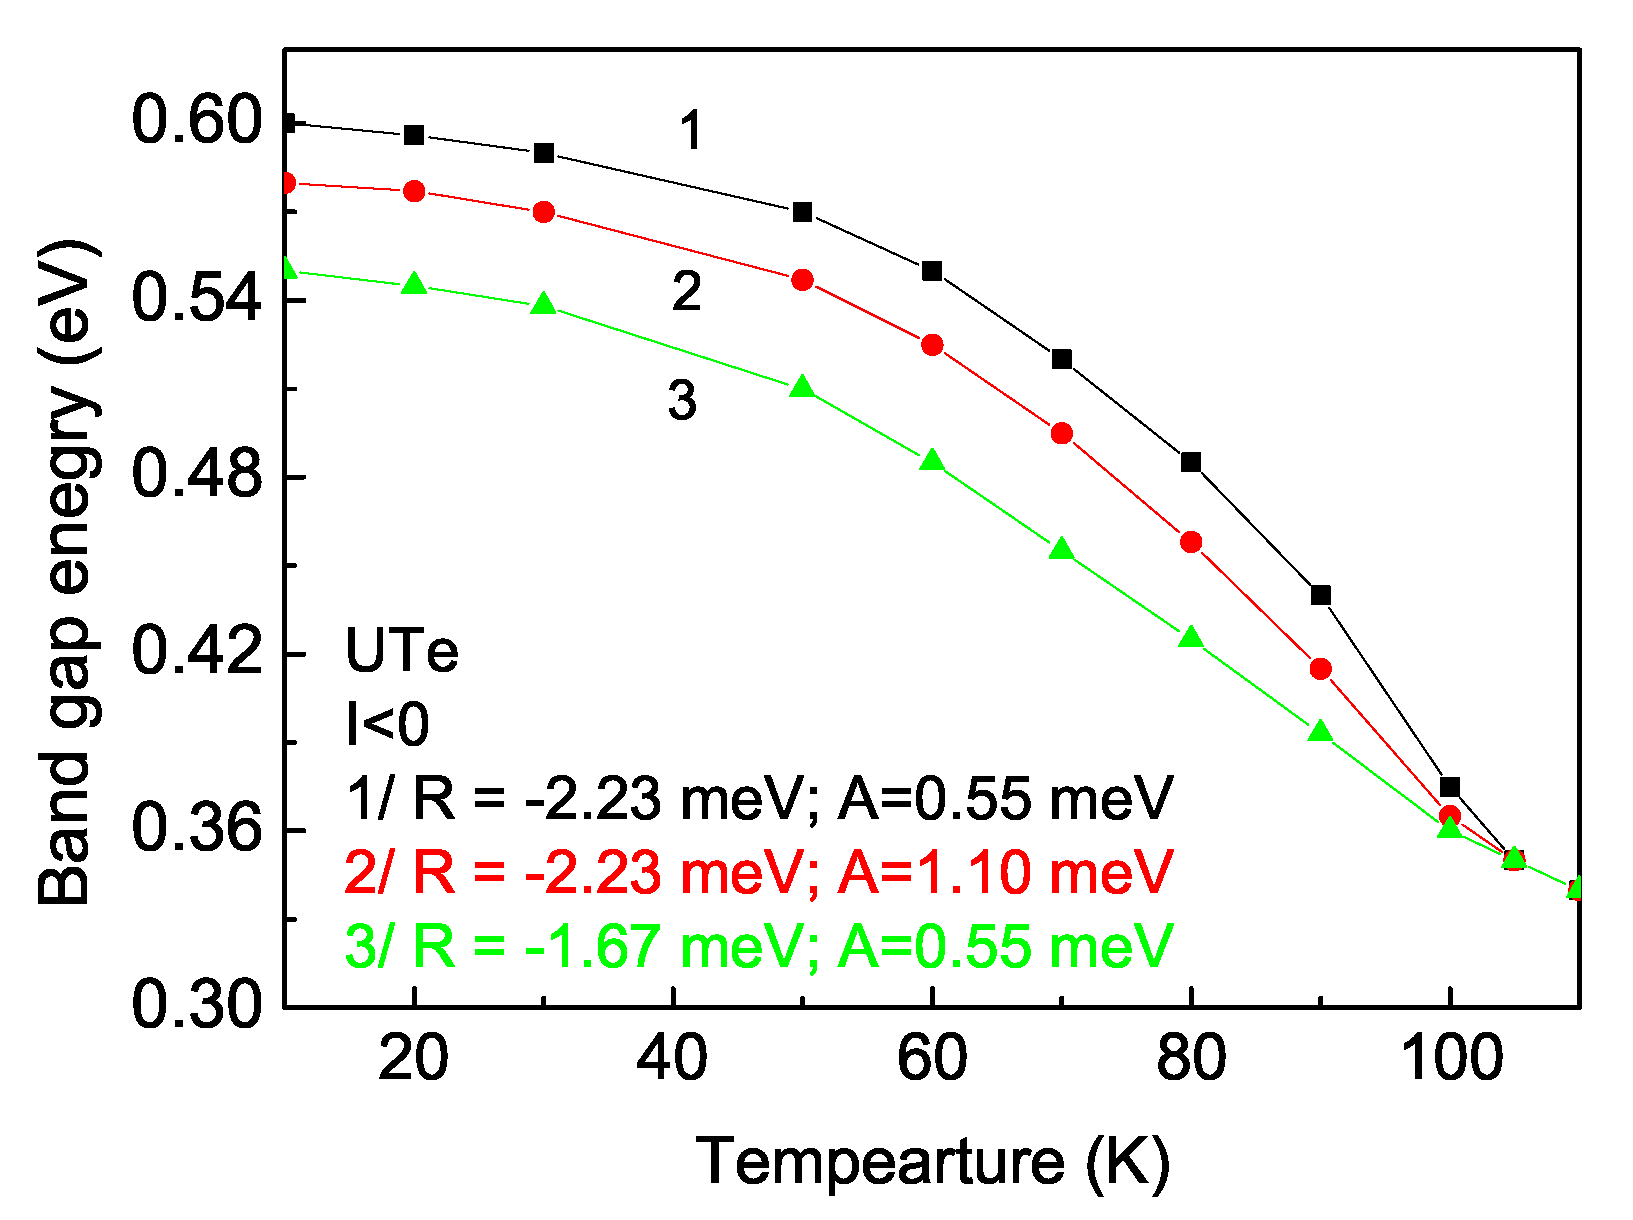
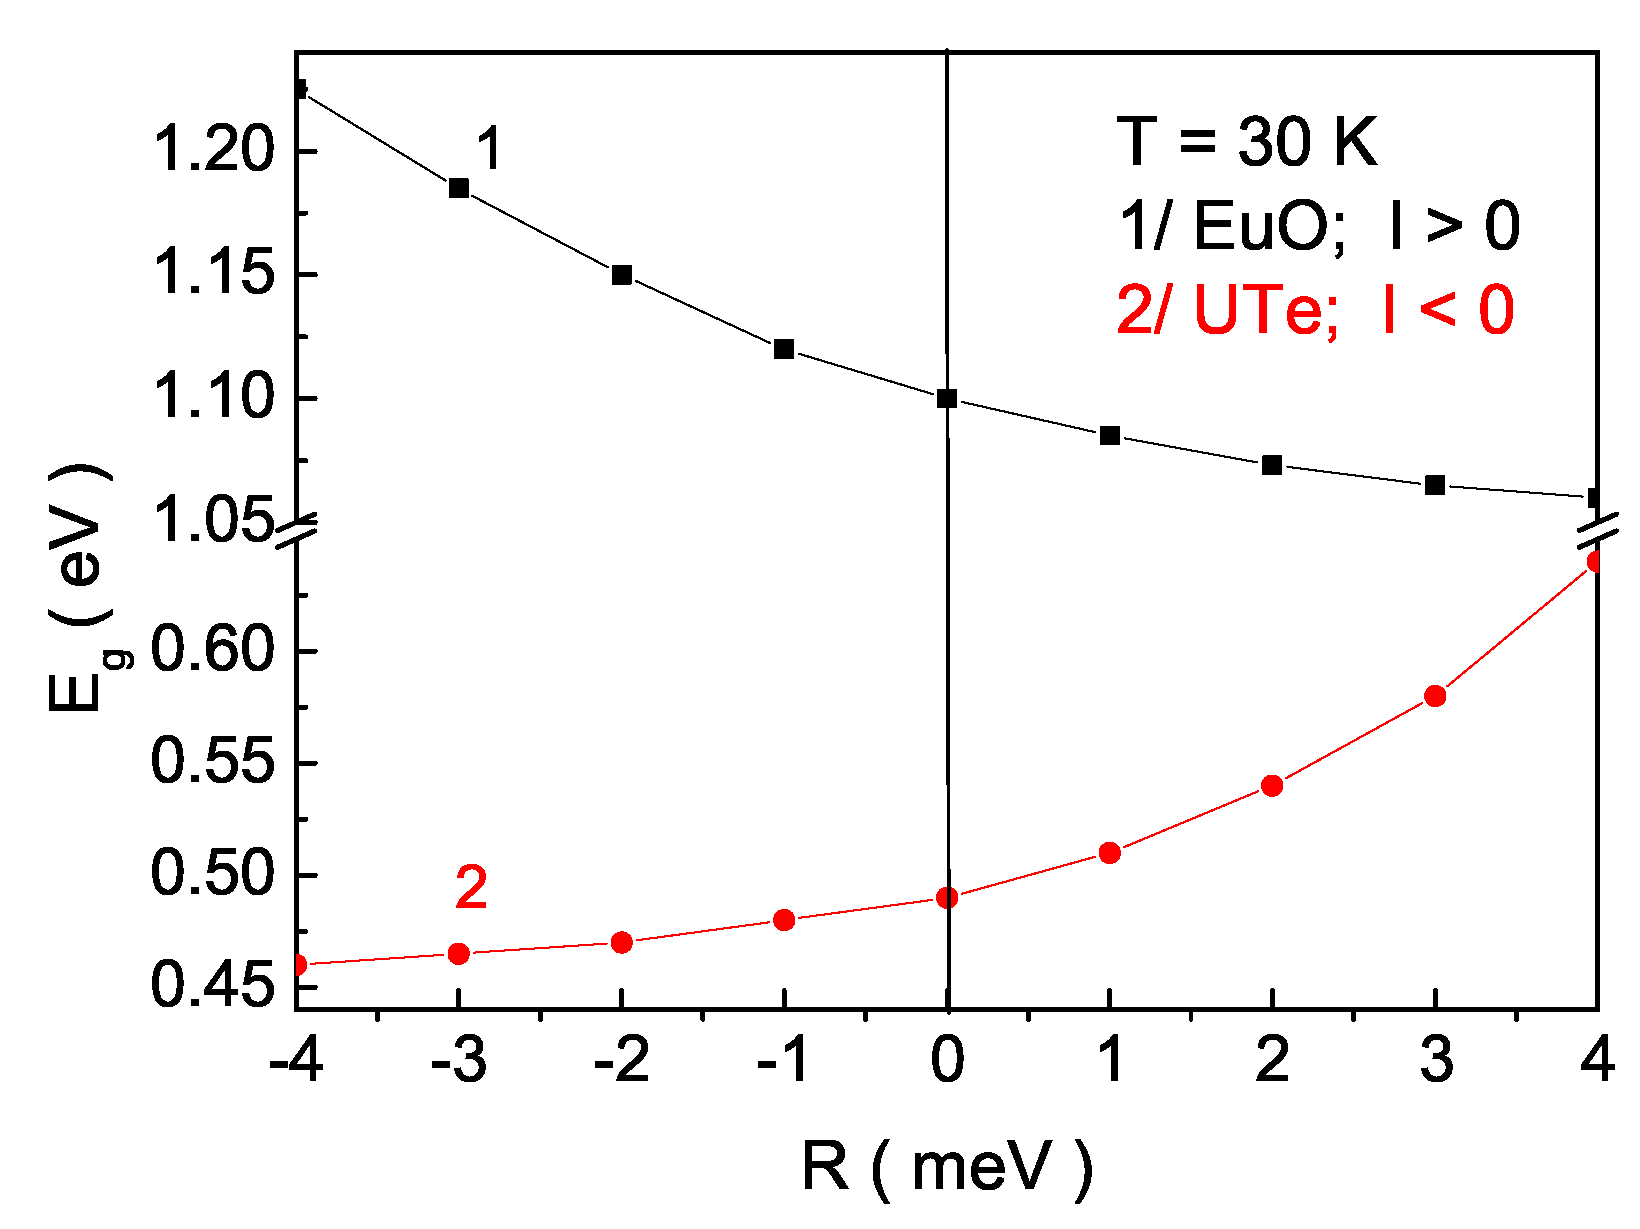
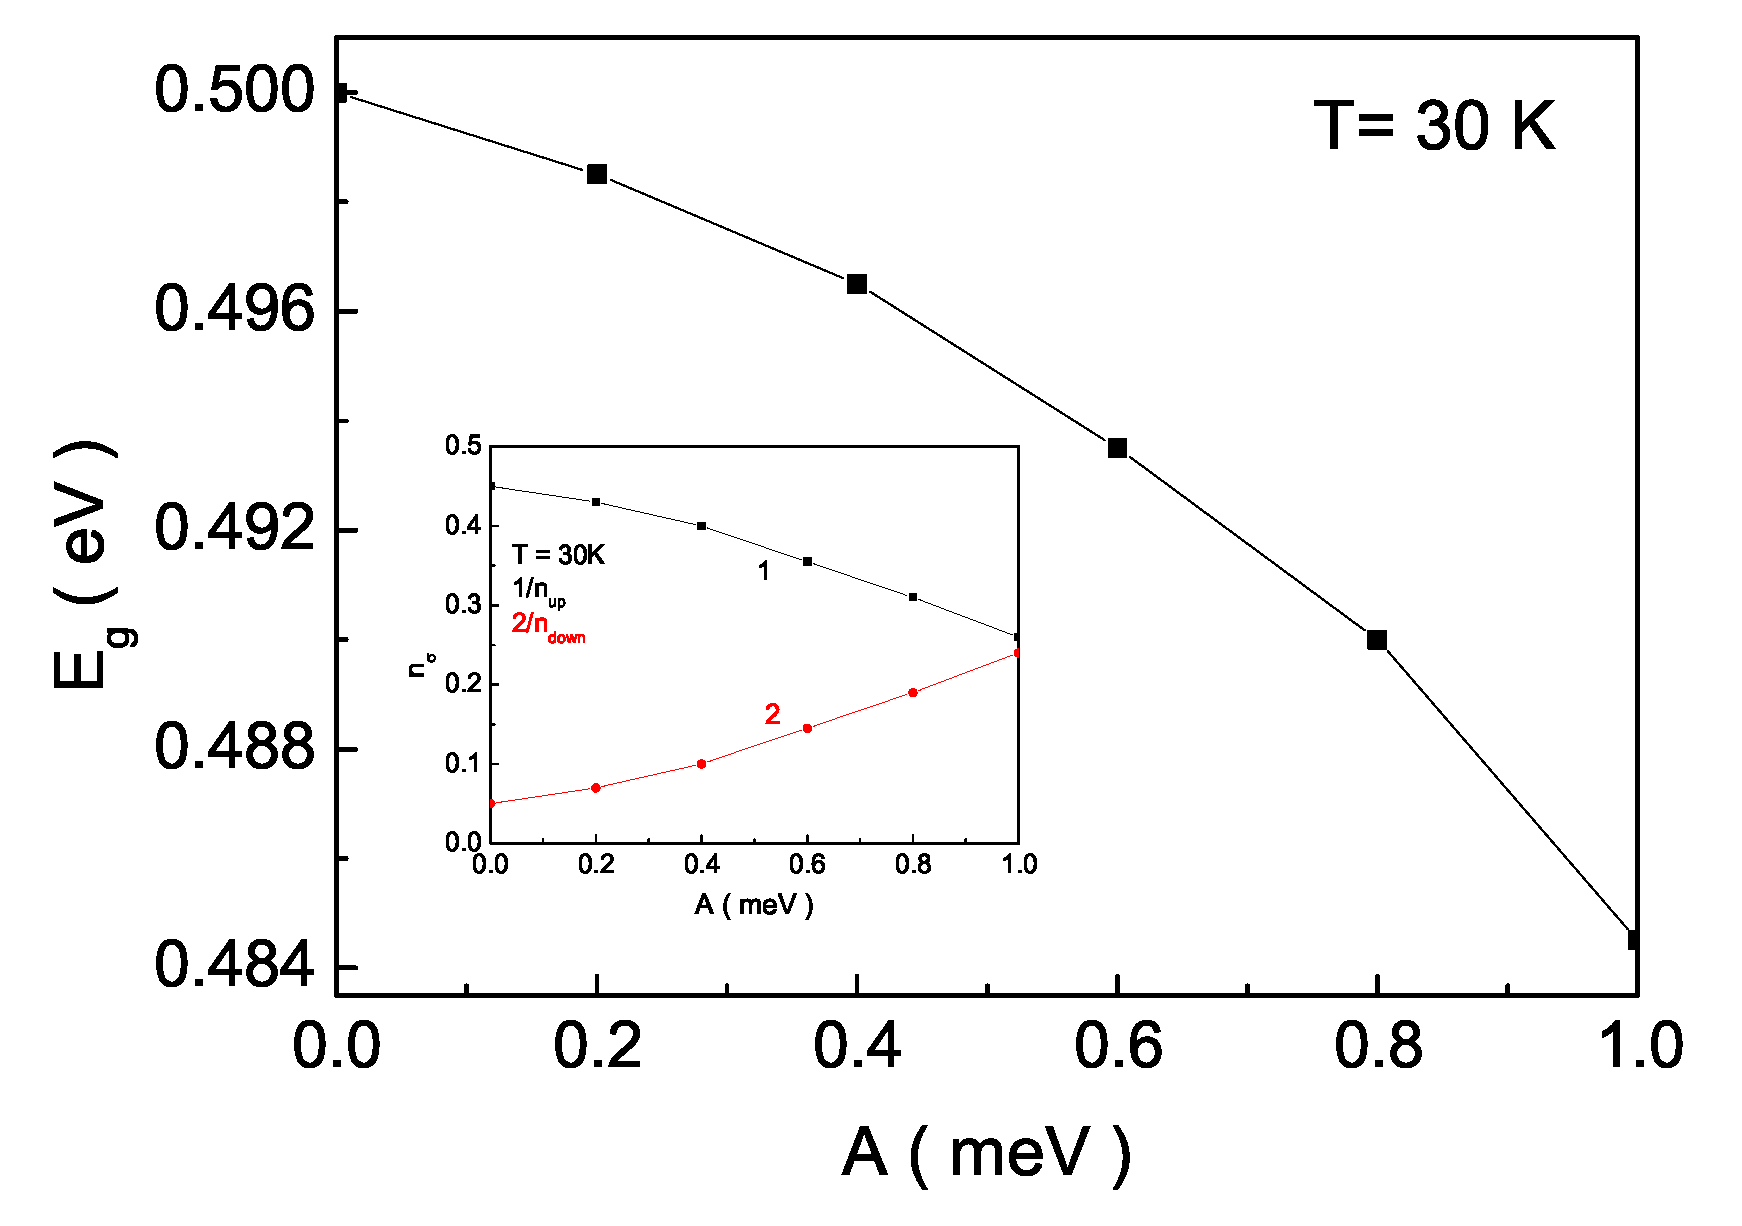
3.1. Dependence of the Band Gap Energy on Temperature, SPI and EPI

The temperature dependence of the band gap is one of the most fundamental properties for semiconductors and has a strong influence on many applications. Let us emphasize that as the temperature increases, the band gap energy of the most semiconductors decreases. But, for example, in lead chalcogenides (PbS, PbSe, PbTe), the direct narrow band gap increases with increasing temperature [35]. Characteristic physical properties of the FMS, for example, the europium chalcogenides mainly come from the s-f interaction from the localized 4f electrons distributed between the conduction band (5d orbitals of Eu) and the valence band (2p (O2−) or 3p (S2−) orbitals). At first, we calculated the temperature dependence of the band gap energy E g of FMS for the case I > 0 , which is appropriate, for example, for EuO with a band gap of 1.12 eV. The results for E g ( T ) are presented in Figure 1. It can be seen that E g decreases with increasing temperature T. The renormalization of the band gap at finite temperatures is due to the lattice expansion and the phonon-induced atomic vibrations. This is related to the renormalization of the magnetic interaction between the magnetic moments due to the SPI and the change of n n when changing the EPI. The band gap is the energy difference between the valence band and the conduction band of a semiconductor. The band gap tends to decrease with increasing temperature because the atomic vibrations increase and the interatomic spacing becomes larger. The interaction between the phonons and the free electrons and holes also affects the band gap. It can be seen from Figure 1 that there is a small kink at the phase transition temperature T C = 69 K due to the anharmonic spin–phonon interaction R. For R = 0 , the kink disappears. Both interactions—EPI and SPI—lead to reducing the band gap energy. The effect of the SPI is largest at low temperatures and vanishes at T C because the magnetization is zero at T C , i.e., the magnetic ordering cannot influence the band gap (see Equation (5) for J e f f ), whereas the EPI contributes also above T C . Boncher et al. [36] reported that the band structure of EuO and EuS is altered by magnetic ordering and is usually interpreted as conduction band splitting of spin-up and -down electrons.
Moreover, we studied the temperature dependence of the band gap energy E g for the case of I < 0 , which can be appropriate for the antiferromagnetic semiconductor UTe. From Figure 2, it can be seen that the band gap E g decreases again with increasing temperature. But there is a competition between the SPI and EPI. With increasing the SPI, the band gap energy E g increases, whereas increasing the EPI leads to reducing E g . The influence of the SPI vanishes again at the phase transition temperature T N = 106 K, whereas that of the EPI remains finite above T N . Unfortunately, there are no experimental data for UTe. Let us emphasize that in the antiferromagnetic semiconductor, MnTe is reported by Bossini et al. [37] to have an enhanced band gap E g with increasing the SPI.
In [15], we investigated the anharmonic spin–phonon and phonon–phonon interaction effects on optical phonon modes and spin wave excitations in FMS. It is shown that in order to explain the softening of the phonon mode, the SPI constant R must be negative, whereas for the hardening, R is positive. Therefore, we calculated the temperature dependence of the band gap energy E g also for R < 0 for the two compounds EuO with I > 0 and UTe with I < 0 . The results are presented in Figure 3 and Figure 4, respectively. It can be seen that by both compounds, EuO ( I > 0 ) and UTe ( I < 0 ), the effects of the SPI and EPI are nearly the same.
The decision of the choice of the sign of R has to be taken from the experimental data, for example, from the magnetic field dependence of the band gap (see Figures 7 and 8). From the results obtained for E g ( h ) by Wachter [38] and Heiss et al. [39], it follows that for EuO ( I > 0 ) and EuTe ( I > 0 ), respectively, the positive sign R > 0 must be taken by the calculation of the influence of the SPI on the band gap width E g . In order to observe correct E g ( h ) behavior for the antiferromagnetic semiconductor MnTe ( I < 0 ) [37], we have to take a negative value of R, R < 0 . This would be appropriate also for UTe.
It can be seen from Figure 5, curve 1, that as the SPI value increases at a fixed temperature for I > 0 (for example, for EuO) the band gap width decreases, i.e., a red shift is observed at the optical absorption edge. We can conclude the following:
1. For negative values of the SPI constant R < 0 , an increase in its absolute magnitude results in a decrease in the effective exchange interaction between the spins. This, at a constant temperature, leads to a reduction in the magnetization value S z as indicated by expression (12). Consequently, there is a shift towards lower energies of the valence zone (VZ) peak and an upward shift of the bottom of the conductivity zone (CZ). This leads to an increase in the width of the band gap E g with increasing R .
2. If R > 0 , an increase in the spin–phonon interaction constant enhances the effective exchange interaction between the spins. This, at a constant temperature, causes an increase in the magnetization S z (see Equation (12)). Consequently, there is a downward shift of the VZ peak and a shift towards higher energies of the bottom of the CZ. This results in a reduction in the band gap E g .
From Figure 5, for curve 2, it can be seen that with increasing the SPI value at a fixed temperature for I < 0 (for example UTe), the width of the band gap E g increases, i.e., a blue shift is observed at the optical absorption edge. We have observed the following:
1. For negative values of the SPI constant ( R < 0 ), as previously noted, an increase in its absolute magnitude will decrease the magnetization value S z . According to Equation (12), this results in a shift towards lower energies of the VZ peak and an upward shift of the bottom of the CZ. This leads to a decrease in the width of the band gap E g with increasing R .
2. If R > 0 , as the value of the SPI constant increases, the magnetization value S z increases, too. This leads to a shift towards higher energies of the bottom of the CZ and a downward shift of the VZ peak. This results in an increase in the width of the band gap E g with enhancing R.
Figure 6 shows that by increasing the EPI constant A at a fixed temperature, the band gap width E g decreases. From Equation (12), we can obtain the expression which determines the influence of A on the band gap width E g . It has the form ( 2 A 2 / ω 0 ) ( n n ) , where n and n are the number of conduction electrons in the spin-up and spin-down bands, respectively. ( n n ) as a function of A decreases with increasing the EPI constant (see Inset in Figure 6), which explains the decrease in E g as A increases. It is logical to expect that the thermal fluctuations in the system would lead to a decrease in the energy gap between the two subbands of the up and down spins.
It can be seen from Figure 5 and Figure 6 that in the case of I > 0 , the SPI and EPI have the same influences on the band gap width. The increase in the values of R and A leads to a decrease in E g , i.e., to a red shift of the optical absorption edge. For I < 0 , however, the two interactions are in competition, and depending on which of them prevails, we can expect both an increase and a decrease in E g with increasing the R and A values, i.e., the possibility of both red and blue shift of the optical absorption edge.
Let us emphasize that in a previous paper [40], we discussed the influence of the Coulomb interaction v on the band gap width and observed that increasing v E g decreases. Within the framework of this article, this means the following:
1. When I > 0 and R < 0 , they will still have the same influence on the width of the band gap, i.e., an increase in R and v will result in a blue shift of the absorption edge. Conversely, when R > 0 , with its increasing, both mechanisms will be in competition, leading to the observation of both blue and red shifts.
2. For I < 0 , regardless of the sign of the SPI, both mechanisms will contribute to an increase in the width of the band gap and to the appearance of a blue shift.

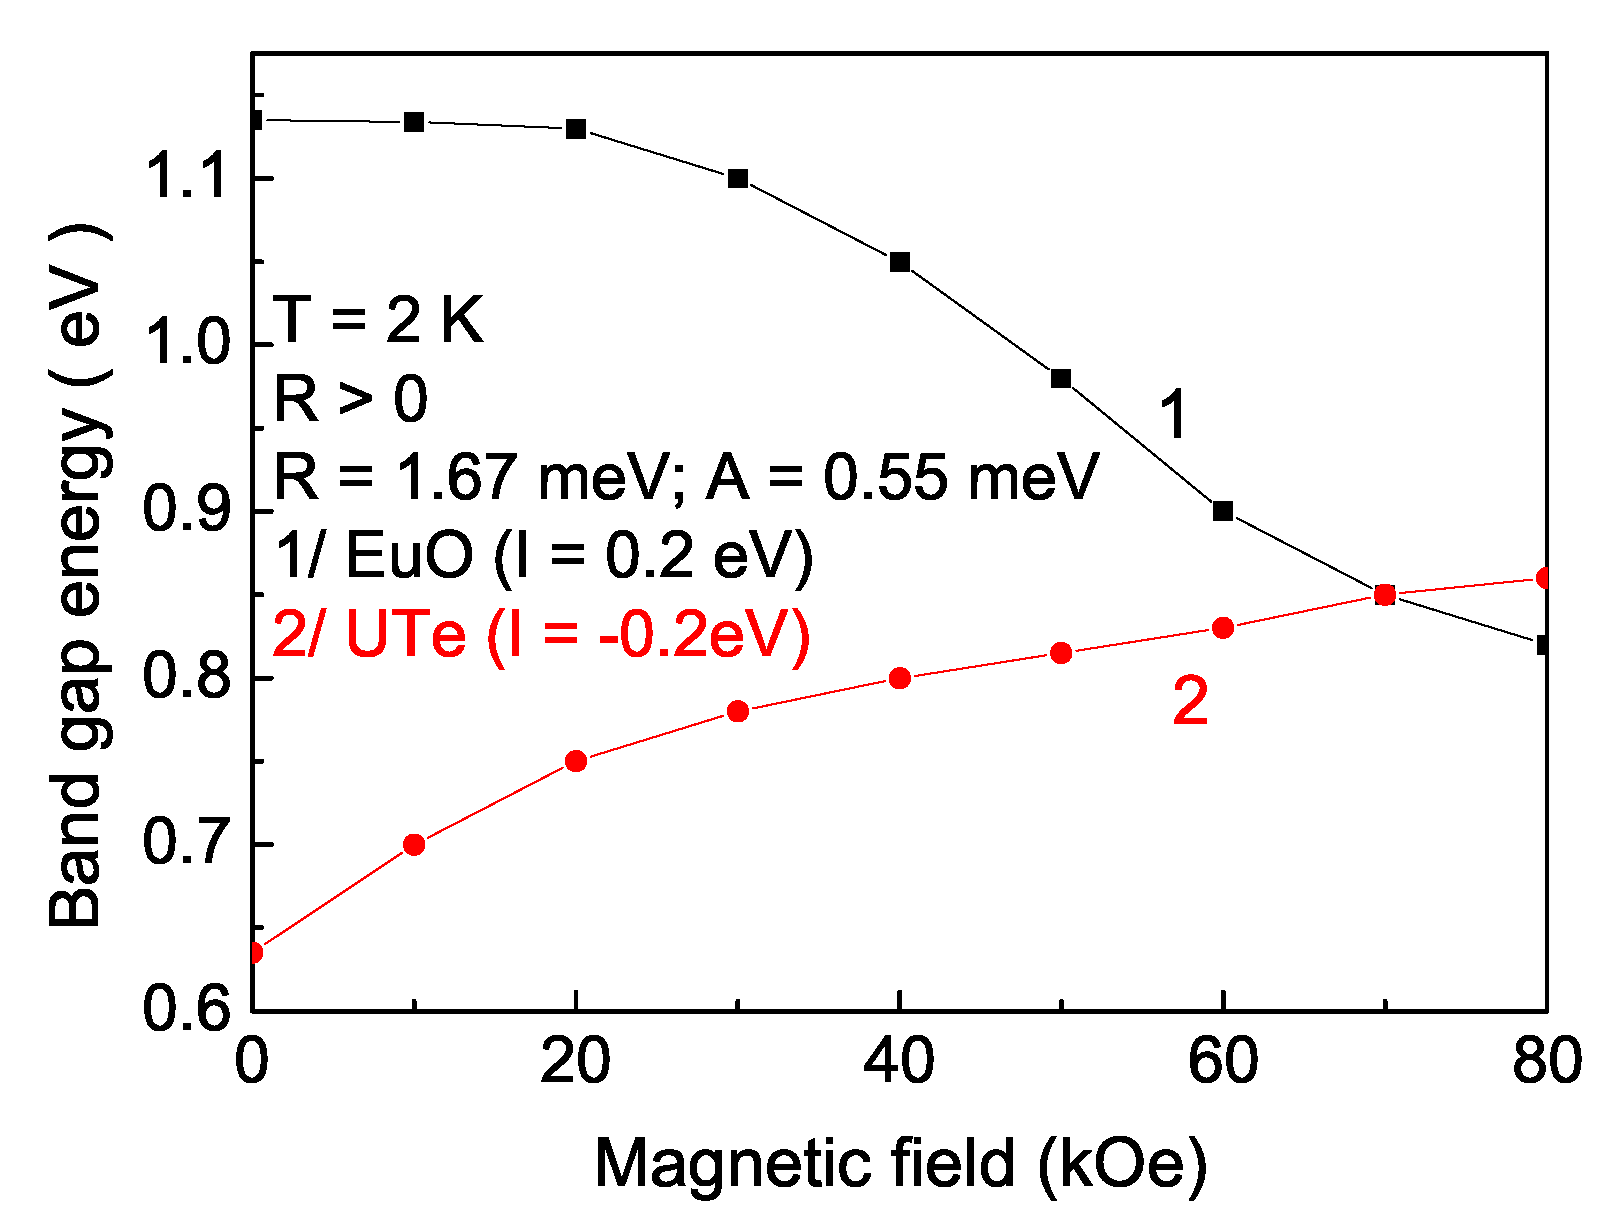
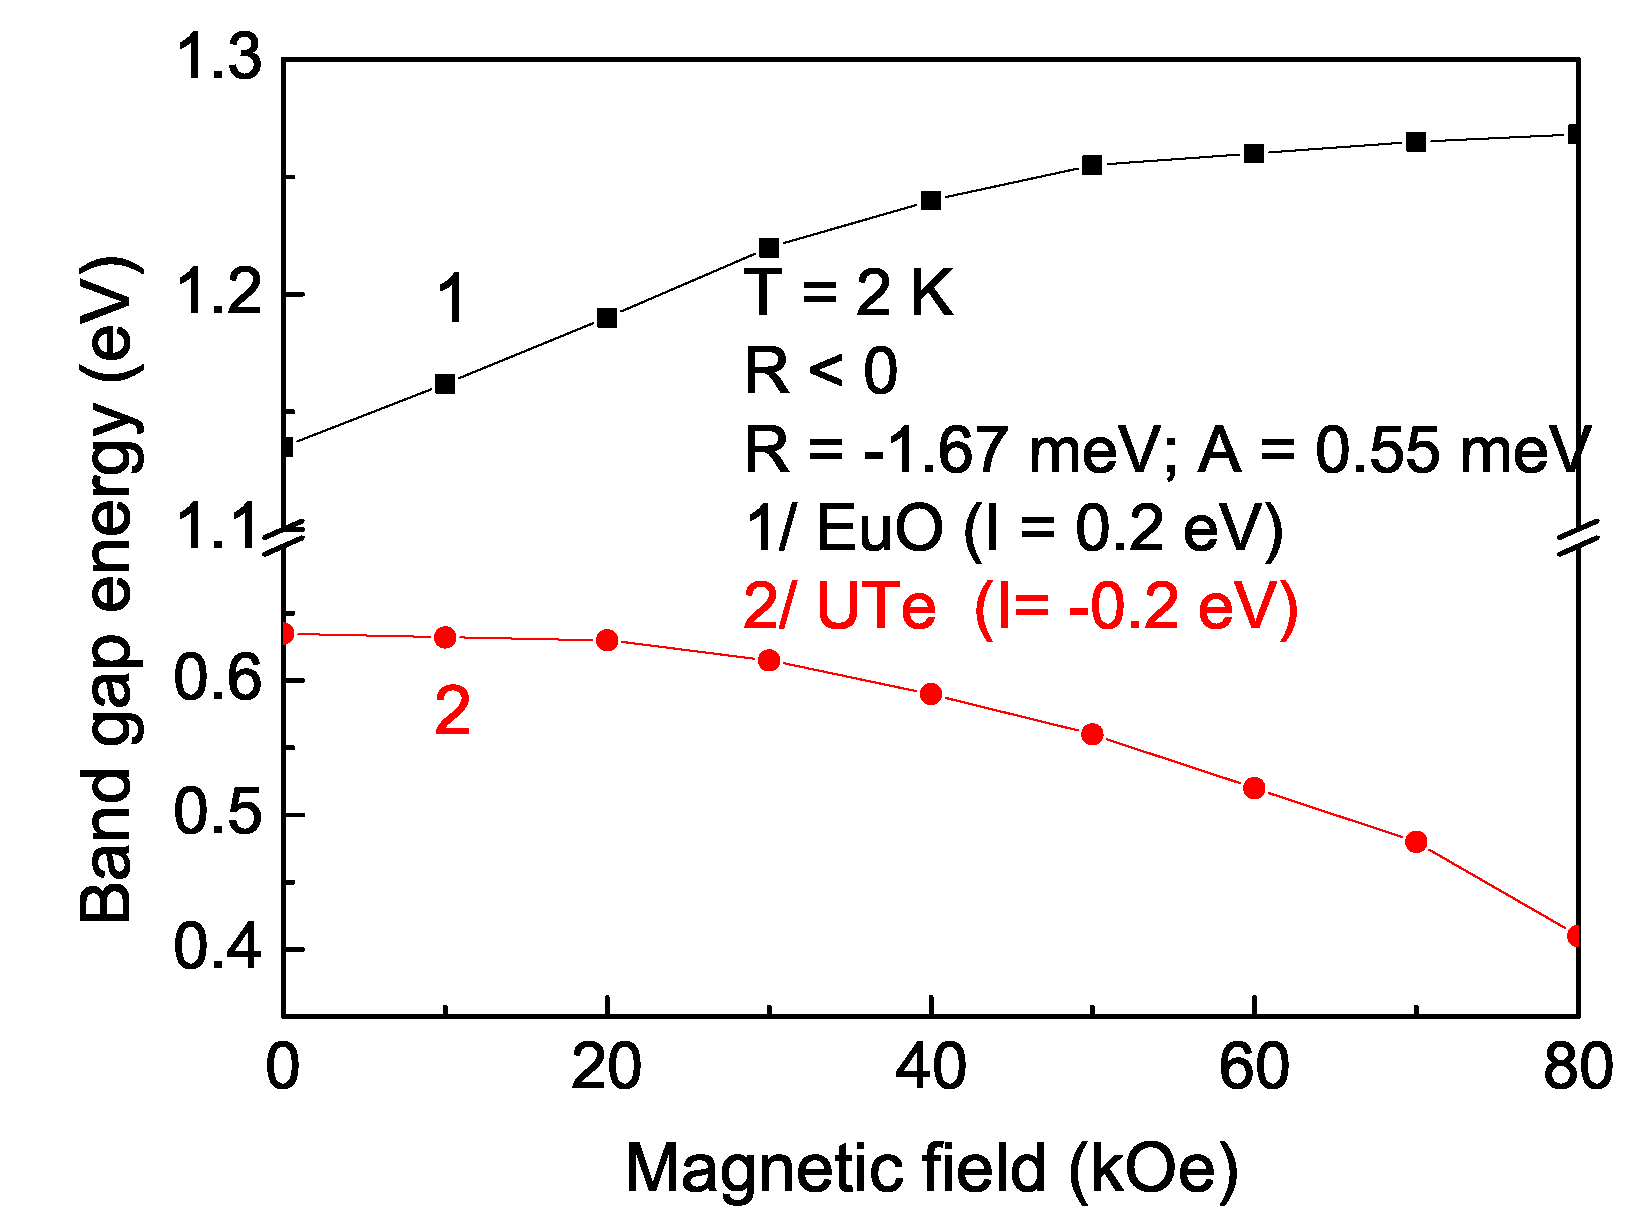
3.2. Magnetic Field Dependence of the Band Gap Energy

The difference between ferro- and antiferromagnetic semiconductors can be seen also in the magnetic field dependence of the band gap energy E g . Let us emphasize that the effect of a magnetic field on the energy band gap of an ordinary semiconductor is probably negligible, but for a FMS it is not so. This can be seen from Figure 7 and Figure 8. The results are in full agreement with the conclusions made above and show the importance of accounting for the SPI for the behavior of E g applying an external magnetic field. We observe that the band structure is altered by the magnetic ordering and can be interpreted as conduction band splitting of spin-up and -down electrons. For R > 0 , the magnetization increases with increasing the magnetic field h, but due to the different sign of the s-d interaction constant I in Equation (12), we observe a decrease in E g with increasing h for the case I > 0 (Figure 7, curve 1, EuO) and an increase for I < 0 (Figure 8, curve 1, UTe). For the case of negative SPI R, we obtain the opposite result (see curve 2 in Figure 7 and Figure 8). Heiss et al. [39] have reported that in EuTe ( I > 0 [41]), at low temperatures, the band gap energy E g decreases with increasing magnetic field h, which is in agreement with our result for EuO and the experimental data of Wachter [38] (Figure 7, curve 1). Let us emphasize that in EuTe, the ferromagnetic s-f interaction I competes with the antiferromagnetic super-exchange J which is very small, nearly negligible [41]. Bossini et al. [37] have reported a blue-shift of the band gap in the antiferromagnetic semiconductor MnTe ( I < 0 ) due to the establishment of the magnetic order, which could be explained with a negative R value. This could be valid also for UTe (Figure 8, curve 2).

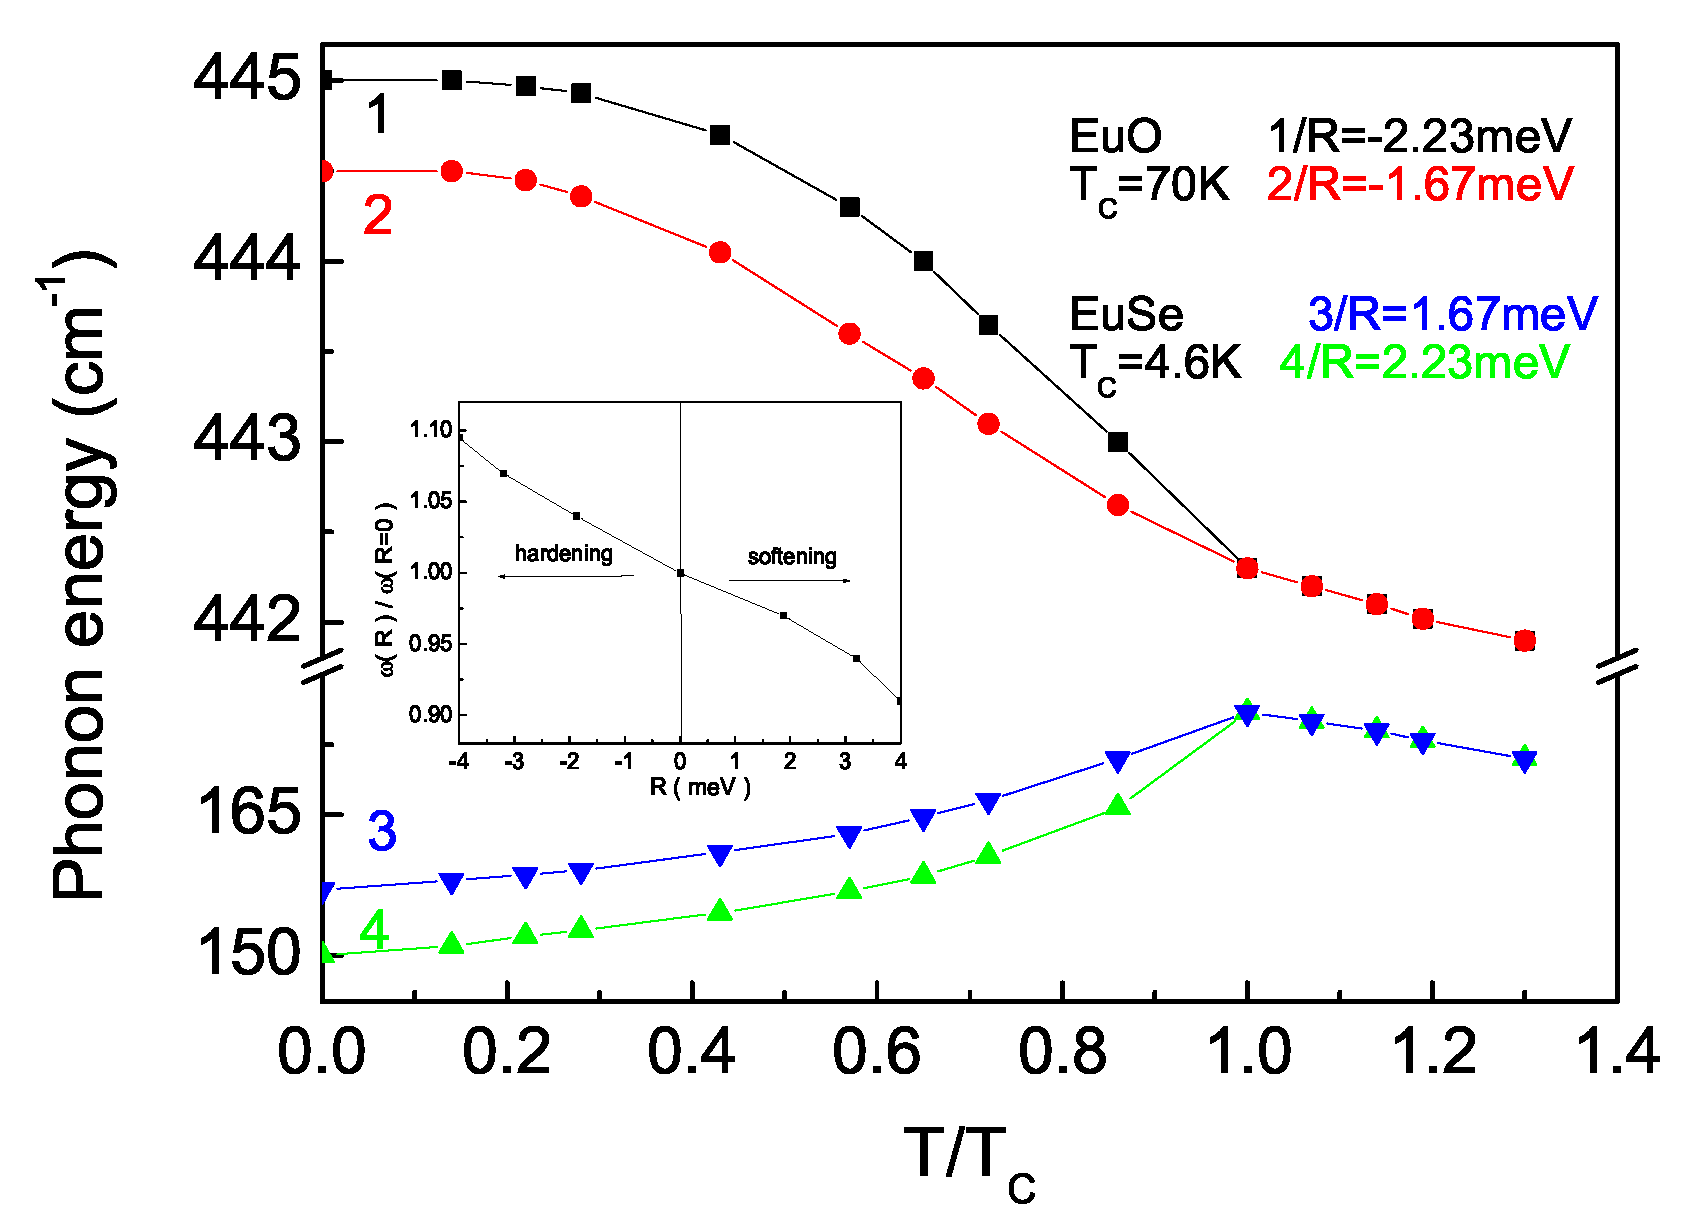
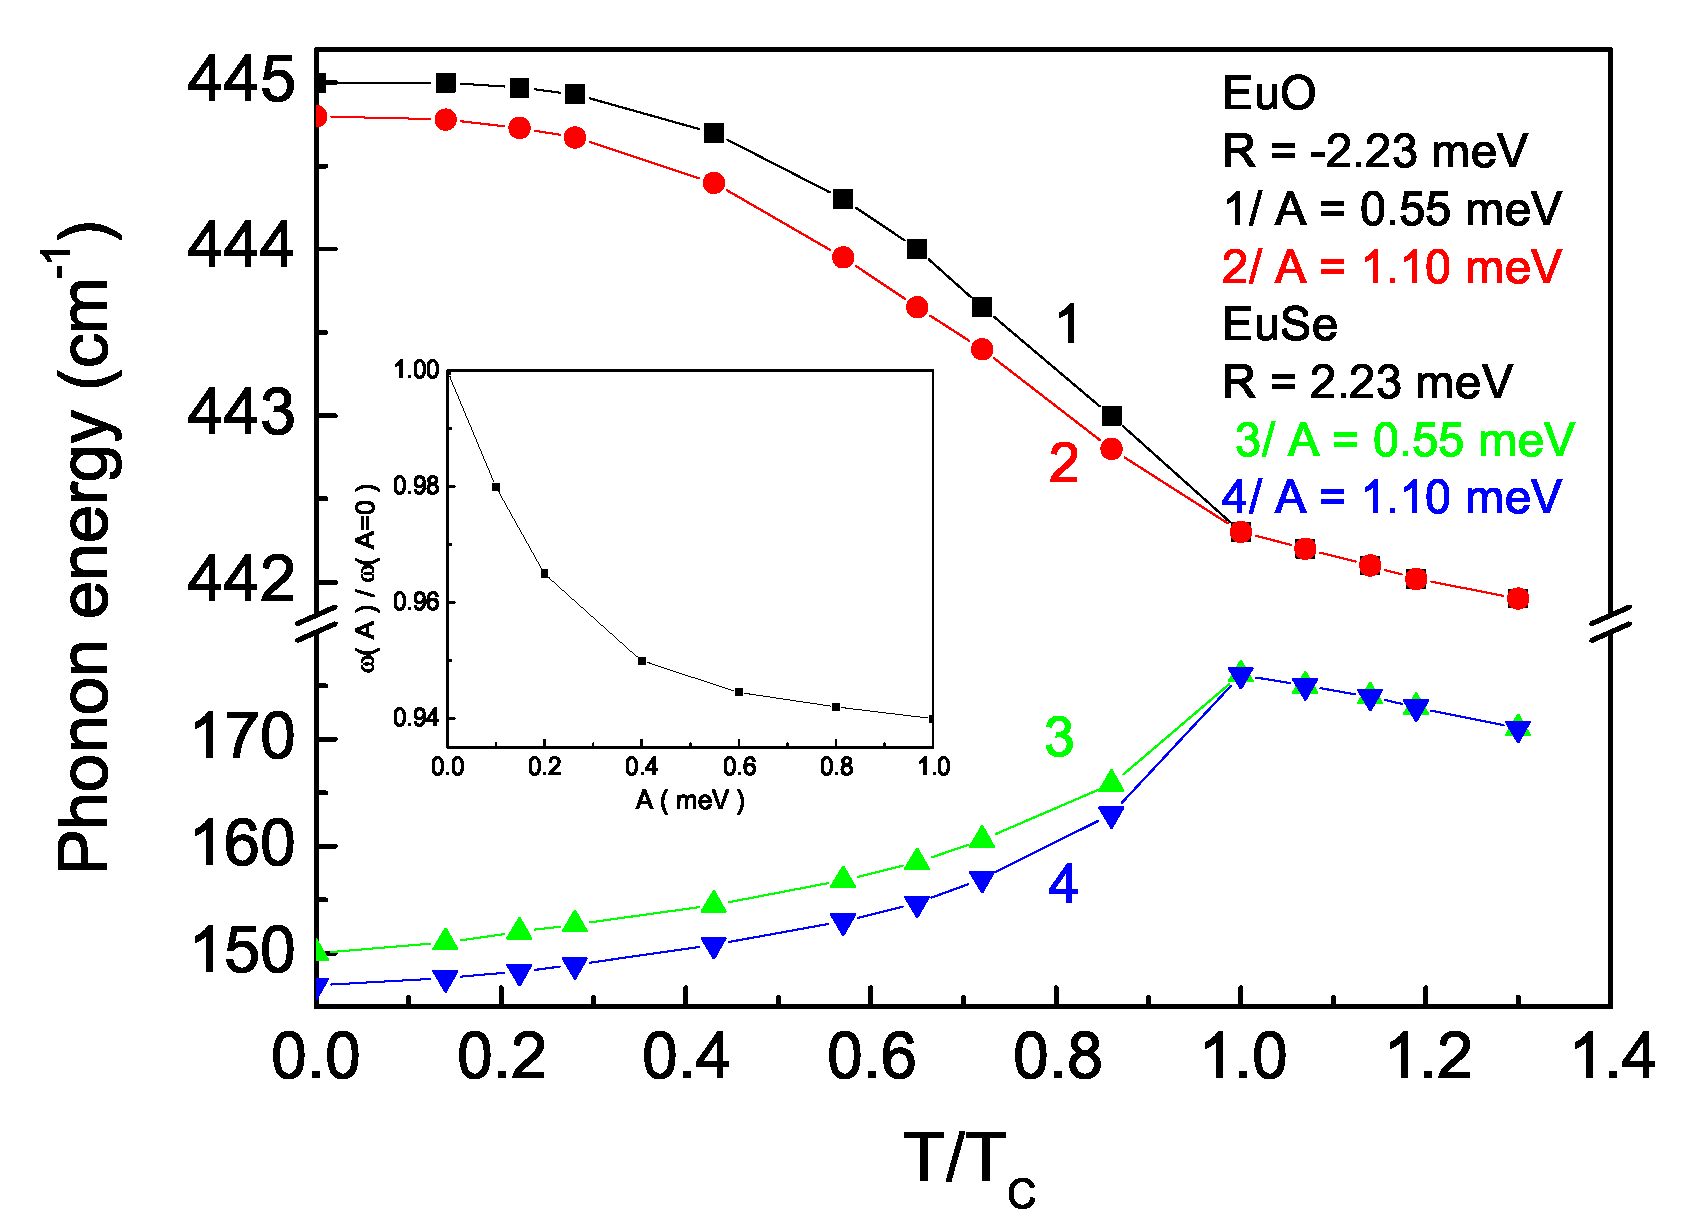
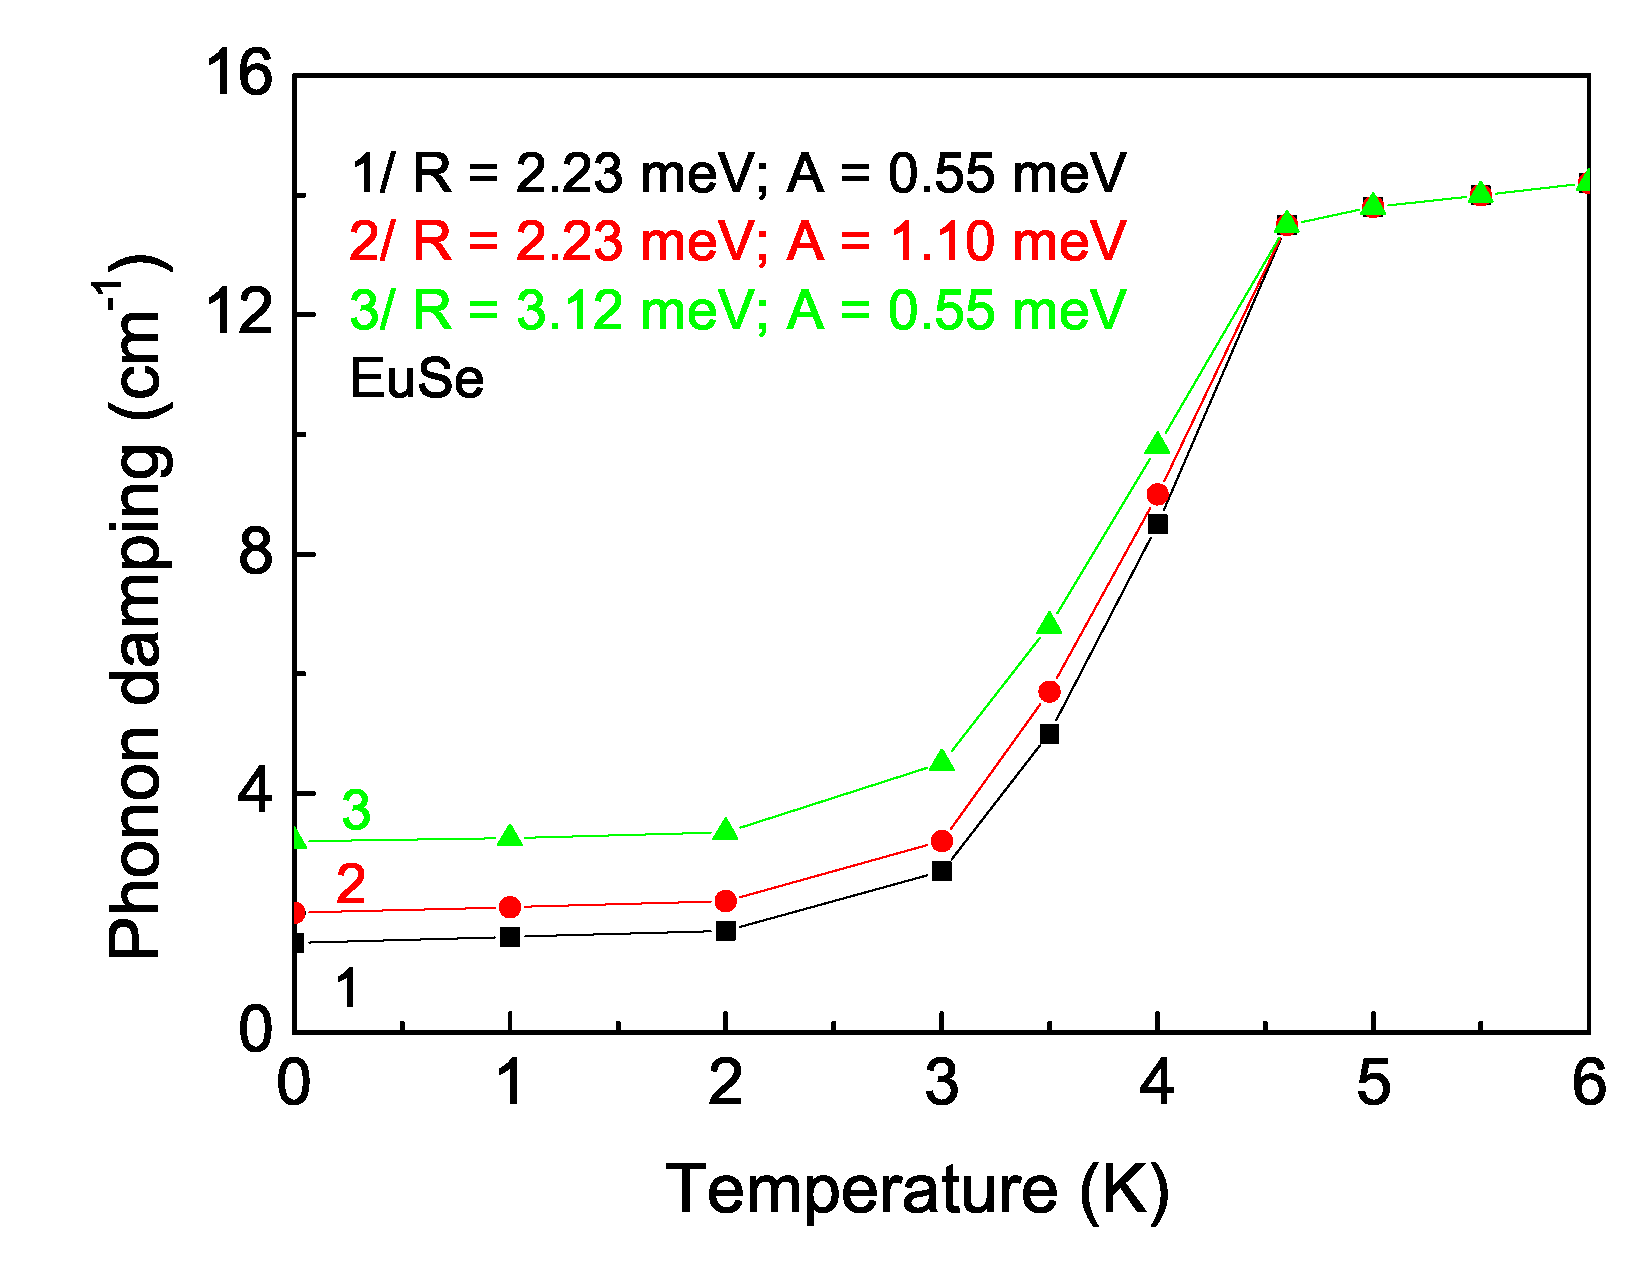
3.3. Influence of the SPI and EPI on the Phonon Spectrum of FMS

As a next step, we will study the influence of the EPI and SPI on the phonon spectra. Therefore, we have calculated from Equation (10) the temperature dependence of the phonon energy of the phonon mode ω = 445 cm−1 for EuO [42]. It can be seen from Figure 9, curves 1 and 2, that the phonon energy decreases with increasing temperature in accordance with the experimental data [42,43]. We have taken for EuO the SPI R < 0 [15]. At the Curie temperatures T C = 69 K, there is an anomaly due to the anharmonic SPI R. We have studied the phonon energy changing both interactions. Increasing the SPI and EPI leads to reducing ω (see Figure 9 and Figure 10, curves 1 and 2). The contribution from the SPI is largest at low temperatures and vanishes near the phase transition temperature T C (where the magnetization M is zero), whereas the EPI remains finite for temperatures above T C , T > T C .
We have calculated from Equation (10) also the temperature dependence of the phonon energy of the phonon mode ω = 151 cm−1 for EuSe [44] for R > 0 [15] and observed a different contribution of the SPI and EPI compared to EuO. The results are presented in Figure 9 and Figure 10, curves 3 and 4. It can be seen that the phonon energy increases with increasing temperature T. At the phase transition temperature T C = 4.6 K, there is a kink due to the anharmonic SPI. Decreasing the SPI leads to increasing the phonon energy ω , whereas increasing the EPI reduces it. This can be seen also from the analytical expression for the phonon energy (see Equation (10)). The SPI contribution is important at lower temperatures; it vanishes at the phase transition temperature T C . The EPI is small at low temperatures but remains finite at higher temperatures as well as above T C . Let us emphasize that our results are in very good agreement with the experimental data of Safran et al. [23]. This is evidence that our model and method are appropriate for describing the properties of FMS.
In systems with strong SPI, an anomalous temperature behavior of the phonon modes is characteristic. In the Inset in Figure 9, we present the dependence of the renormalized phonon modes for T = 30 K. For R < 0 with increasing R at a fixed temperature, a hardening of the phonon mode is observed, i.e., the phonon energy increases, whereas for R > 0 with increasing R at fixed temperature, a softening of the phonon mode is obtained, i.e., it decreases. The SPI renormalizes the phonon mode (see Equation (10)).
The increase in the value of the EPI A leads to a softening of the phonon mode (see Inset in Figure 10). Thus, in the case of R < 0 , the two mechanisms are in competition in order of their influence on the lattice oscillations. By R > 0 , both mechanisms lead to the softening of the phonon mode.
In the last Figure 11, the temperature dependence of the phonon damping γ for EuSe is shown, which represents the full width at half maximum (FWHM) of the Raman line. It can be seen that the damping γ increases with increasing temperature T. Let us emphasize that the damping γ increases with T for both cases R > 0 and R < 0 because it is proportional to R 2 . There is again a kink at T C due to the anharmonic SPI R. The SPI and EPI contribute additively to the damping γ , i.e., both contribute to the broadening of the Raman lines, the SPI more at low temperatures, vanishing at the phase transition temperature T C , and the EPI more at higher temperatures and above T C .

4. Conclusions

The influence of the SPI and EPI on the band gap energy E g and the phonon energy ω and damping γ of Eu and U chalcogenides is discussed for different temperatures. For I > 0 , R > 0 E g decreases with increasing SPI and EPI, whereas for I < 0 , R > 0 , there is a competition; E g increases with raising the EPI and decreases for enhanced SPI. The magnetic field dependence of E g for ferro- and antiferromagnetic semiconductors and different signs of R is observed.
The temperature dependence of the phonon energy and damping is calculated for the phonon modes ω = 445 cm−1 in EuO ( R < 0 ) and ω = 151 cm−1 in EuSe ( R > 0 ). By softening the phonon mode, the SPI and EPI lead to reducing ω in EuO, whereas by hardening ω , EuSe is enhanced with increasing EPI and reduced with SPI. Both the SPI and EPI lead to the increasing of the phonon damping γ in EuO and EuSe.
It should be noted that, recently, two-dimensional magnetic semiconductors such as iron and ruthenium trihalides were determined to be important for application in spin-based devices.The effects of SPI and EPI on the properties of these 2D systems will be considered in a future paper.

Author Contributions

Conceptualization, J.M.W.; Software, I.N.A.; Formal analysis, A.T.A.; Investigation, A.T.A., I.N.A. and J.M.W.; Writing—original draft, J.M.W. All authors have read and agreed to the published version of the manuscript.

Funding

A.T.A. and I.N.A. acknowledge financial support by the Bulgarian National Science Fund (contract number KP-06 PN68/17/BG-175467353-2022-04-0232).

Institutional Review Board Statement

Not applicable.

Informed Consent Statement

Not applicable.

Data Availability Statement

Derived data supporting the findings of this study are available from the corresponding author upon reasonable request. The data are not publicly available due to privacy.

Conflicts of Interest

The authors have no conflicts to disclose.

References

  1. Nagaev, E.L. Physics of Magnetic Semiconductors; Mir: Moscow, Russia, 1983. [Google Scholar]
  2. Nolting, W. Theory of ferromagnetic semiconductors. Phys. Stat. Solidi B 1979, 96, 11. [Google Scholar] [CrossRef]
  3. Komarov, K.K.; Dzebisashvili, D.M. Effective indirect multi-site spin–spin interactions in the s–d(f) model. J. Magn. Magn. Mater. 2017, 440, 57–59. [Google Scholar] [CrossRef]
  4. Tanaka, M. Recent progress in ferromagnetic semiconductors and spintronics devices. Jpn. J. Appl. Phys. 2021, 60, 010101. [Google Scholar] [CrossRef]
  5. Orlov, A.F.; Kulemanov, I.V.; Parkhomenko, Y.N.; Perov, N.S.; Semisalov, A.S. Development of Ferromagnetic Semiconductors for Applications in Spin Electronics: State and Outlook. Russ. Microelectr. 2012, 41, 443–452. [Google Scholar] [CrossRef]
  6. Gilliland, S.J.; Sans, J.A.; Sanchez-Royo, J.F.; Almonacid, G.; Garcia-Domene, B.; Segura, A.; Tobias, G.; Canadell, E. Role of p-d and s-d interactions in the electronic structure and band gap of Zn1-xMxO(M = Cr, Mn, Fe, Co, Ni, and Cu): Photoelectron and optical spectroscopy and first-principles band structure calculations. Phys. Rev. B 2012, 86, 155203. [Google Scholar] [CrossRef]
  7. Yuan, L.-D.; Deng, H.-X.; Li, S.-S.; Wei, S.-H.; Luo, J.-W. Unified theory of direct or indirect band-gap nature of conventional semiconductors. Phys. Rev. 2018, 98, 245203. [Google Scholar] [CrossRef]
  8. Dalpian, G.; Wei, S.-H. Electron-mediated ferromagnetism and negative s-d exchange splitting in semiconductors. Phys. Rev. B 2006, 73, 245204. [Google Scholar] [CrossRef]
  9. Shastry, B.S.; Mattis, D.C. Theory of the magnetic polaron. Phys. Rev. B 1981, 24, 5340. [Google Scholar] [CrossRef]
  10. Reihl, B.; Martensson, N.; Eastman, D.E.; Arko, A.J.; Vogt, O. Resonant photoemission as a tool to study f and d electrons in actinide compounds. Phys. Rev. B 1982, 26, 1842. [Google Scholar] [CrossRef]
  11. Wesselinowa, J.M. The s-f model with AFM s-f exchange. J. Phys. C Solid State Phys. 1987, 20, L7–L11. [Google Scholar] [CrossRef]
  12. Nolting, W.; Oles, A.M. Temperature and carrier concentration dependence of the excitation spectrum of 5f-compounds. Phys. B+C 1980, 102, 140. [Google Scholar] [CrossRef]
  13. Bulk, G.; Nolting, W. Many-body effects in antiferromagnetic 4f-systems. Phys. Status Solidi (B) 1987, 140, 261–271. [Google Scholar] [CrossRef]
  14. Woolsey, R.B.; White, R.M. Electron-Magnon Interaction in Ferromagnetic Semiconductors. Phys. Rev. B 1970, 1, 4474. [Google Scholar] [CrossRef]
  15. Wesselinowa, J.M.; Apotolov, A.T. Anharmonic effects in ferromagnetic semiconductors. J. Phys. Condens. Matter 1996, 8, 473–488. [Google Scholar] [CrossRef]
  16. Wesselinowa, J.M. Influence of the spin-phonon interaction on the dynamical properties of ferromagnetic semiconducting thin films. J. Phys. Condens. Matter 2005, 17, 6687–6700. [Google Scholar] [CrossRef]
  17. Ziman, J.M. The effect of free electrons on lattice conduction. Philos. Mag. 1956, 1, 191–198. [Google Scholar] [CrossRef]
  18. Cardona, M.; Gopalan, S. Temperature dependence of the band structure of semiconductors: Electron-phonon interaction. In Progress in Electron Properties of Solids; Physics and Chemistry of Materials with Low-Dimensional Structures; Doni, E., Girlanda, R., Parravicini, G.P., Quattropani, A., Eds.; Springer: Dordrecht, The Netherlands, 1989; Volume 10, pp. 51–64. [Google Scholar]
  19. Bhosale, J.J.; Ramdas, A.K.; Burger, A.; Munoz, A.; Romero, A.H.; Cardona, M.; Lauck, R.; Kremer, R.K. Temperature dependence of band gaps in semiconductors: Electron-phonon interaction. Phys. Rev. B 2012, 86, 195208. [Google Scholar] [CrossRef]
  20. Olguin, D.; Cardona, M.; Cantarero, A. Electron-phonon effects on the direct band gap in semiconductors: LCAO calculations. Solid State Commun. 2002, 122, 575–589. [Google Scholar] [CrossRef]
  21. Zhang, Y.; Wang, Z.; Xi, J.; Yang, J. Temperature-dependent band gaps in several semiconductors: From the role of electron-phonon renormalization. J. Phys. Condens. Matter 2020, 32, 475503. [Google Scholar] [CrossRef] [PubMed]
  22. Jha, P.K.; Sanyal, S.P. Lattice dynamics of uranium chalcogenides and pnictides. Phys. Rev. B 1992, 46, 3664. [Google Scholar] [CrossRef]
  23. Safran, S.A.; Silberstein, R.P.; Dresselhaus, G.; Lax, B. Raman scattering in Europium chalcogenides near magnetic phase transitions. Solid State Commun. 1979, 29, 339–343. [Google Scholar] [CrossRef]
  24. Safran, S.A.; Dresselhaus, G.; Silberstein, R.P.; Lax, B. Raman scattering in EuSe and EuTe near magnetic phase transitions. J. Magn. Magn. Mater. 1979, 11, 403–407. [Google Scholar] [CrossRef]
  25. Sakai, O.O.; Tachiki, M. Theory of Raman scattering in Europium-chalcogenides. J. Phys. Chem. Solids 1978, 39, 269–283. [Google Scholar] [CrossRef]
  26. Jha, P.K.; Sanya, S.P. Lattice vibrational properties of uranium chalcogenides. Phys. B 1995, 216, 125–131. [Google Scholar] [CrossRef]
  27. Wesselinowa, J. Electron-Phonon Interaction in Ferromagnetic Semiconductors. Phys. Status Solidi (B) 1984, 123, 585. [Google Scholar] [CrossRef]
  28. Zhou, J.J.; Shin, H.D.; Chen, K.; Song, B.; Duncan, R.A.; Xu, Q.; Maznev, A.A.; Nelson, K.A.; Chen, G. Direct observation of large electron-phonon interaction effect on phonon heat transport. Nat. Commun. 2020, 11, 6040. [Google Scholar] [CrossRef] [PubMed]
  29. Ciechan, A.; Boguslawski, P. Theory of the sp-d coupling of transition metal impurities with free carriers in ZnO. Sci. Rep. 2021, 11, 3848. [Google Scholar] [CrossRef] [PubMed]
  30. Macheda, F.; Sohier, T.; Barone, P.; Mauri, F. Electron-phonon interaction and phonon frequencies in two-dimensional doped semiconductors. Phys. Rev. B 2023, 107, 094308. [Google Scholar] [CrossRef]
  31. Pradip, R.; Piekarz, P.; Bosak, A.; Merkel, D.G.; Waller, O.; Seiler, A.; Chumakov, A.I.; Rueffer, R.; Oles, A.M.; Parlinski, K.; et al. Lattice Dynamics of EuO: Evidence for Giant Spin-Phonon Coupling. Phys. Rev. Lett. 2016, 116, 185501. [Google Scholar] [CrossRef]
  32. Tserkovnikov, Y.A. Decoupling of chains of equations for two-time Green’s functions. Teor. Math. Phys. 1971, 7, 511. [Google Scholar] [CrossRef]
  33. Vogt, O. Magnetization measurements on single crystals of uranium chalcogenides and pnictides. Phys. B 1980, 102, 206. [Google Scholar] [CrossRef]
  34. Shishidou, T.; Oguchi, T. Band-theoretical prediction of magnetic anisotropy in uranium monochalcogenides. Phys. Rev. B 2000, 62, 11747. [Google Scholar] [CrossRef]
  35. Cao, J.; Querales-Flores, J.D.; Fahy, S.; Savic, I. Thermally induced band gap increase and high thermoelectric figure of merit of n-type PbTe. Mater. Today Phys. 2020, 12, 100172. [Google Scholar] [CrossRef]
  36. Boncher, W.; Dalafu, H.; Rosa, N.; Stoll, S. Europium chalcogenide magnetic semiconductor nanostructures. Coord. Chem. Rev. 2015, 289–290, 279–288. [Google Scholar] [CrossRef]
  37. Bossini, D.; Terschanski, M.; Mertens, F.; Springholz, G.; Bonanni, A.; Uhrig, G.S.; Cinchetti, M. Exchange-mediated magnetic blue-shift of the band-gap energy in the antiferromagnetic semiconductor MnTe. New J. Phys. 2020, 22, 083029. [Google Scholar] [CrossRef]
  38. Wachter, P. The optical electrical and magnetic properties of the europium chalcogenides and the rare earth pnictides. CRC Crit. Rev. Solid State Mater. Sci. 1972, 3, 189. [Google Scholar] [CrossRef]
  39. Heiss, W.; Kirchschlager, R.; Springholz, G.; Chen, Z.; Debnath, M.C.; Oka, Y. Magnetic polaron induced near-band-gap luminescence in epitaxial EuTe. Phys. Rev. B 2004, 70, 035209. [Google Scholar] [CrossRef]
  40. Apostolova, I.N.; Apostolov, A.T.; Wesselinowa, J.M. Band Gap Energy of Ion-Doped Multiferroic NaFeO2 Nanoparticles. Phys. Status Solidi RRL 2023, 2300159. online published. [Google Scholar] [CrossRef]
  41. Subkhangulov, R.R.; Henriques, A.B.; Rappl, P.H.O.; Abramof, E.; Rasing, T.; Kimel, A.V. All-optical manipulation and probing of the d–f exchange interaction in EuTe. Sci. Rep. 2014, 4, 4368. [Google Scholar] [CrossRef]
  42. Guenterodt, G.; Zeyer, R. Light Scattering in Solids IV. Top. Appl. Phys. 1984, 54, 203. [Google Scholar]
  43. Goian, V.; Gopalan, V.; Held, R.; Bousquet, E.; Ghosez, P.; Spaldin, N.A.; Kamba, S. Making EuO multiferroic by epitaxial strain engineering. Commun. Mater. 2020, 1, 74. [Google Scholar] [CrossRef]
  44. Silberstein, R.P.; Safran, S.A.; Dresselhaus, M.S. First- and second-order Raman scattering in EuSe near TN. J. Magn. Magn. Mater. 1979, 11, 408–411. [Google Scholar] [CrossRef]
Figure 1. Temperature dependence of the band gap energy E g of EuO with J = 0.0001 eV, I = 0.2 eV, S = 7/2, T C = 69 K for different R > 0 and A values.
Applsci 14 01686 g001
Figure 2. Temperature dependence of the band gap energy E g of UTe with J = 0.0001 eV, I = −0.2 eV, S = 7/2, T C = 106 K for different R > 0 and A values.
Applsci 14 01686 g002
Figure 3. Temperature dependence of the band gap energy E g of EuO with J = 0.0001 eV, I = 0.2 eV, S = 7/2, T C = 69 K for different R < 0 and A values.
Applsci 14 01686 g003
Figure 4. Temperature dependence of the band gap energy E g of UTe with J = 0.0001 eV, I = −0.2 eV, S = 7/2, T C = 106 K for different R < 0 and A values.
Applsci 14 01686 g004
Figure 5. (Color online) Dependence of the band gap energy E g on the spin–phonon interaction constant R, T = 30 K for (1) EuO, I = 0.2 eV, and (2) UTe, I = −0.2 eV.
Applsci 14 01686 g005
Figure 6. (Color online) Dependence of the band gap energy E g on the electron–phonon interaction constant A for T = 30 K. Inset: The number of conduction electrons in the spin-up ( n ) and spin-down ( n ) bands as function of A for T = 30 K.
Applsci 14 01686 g006
Figure 7. (Color online) Magnetic field dependence of the band gap energy for (1) EuO (I = 0.2 eV) and (2) UTe (I = −0.2) for R > 0 , T = 2 K.
Applsci 14 01686 g007
Figure 8. (Color online) Magnetic field dependence of the band gap energy for (1) EuO (I = 0.2 eV) and (2) UTe (I = −0.2) for R < 0 , T = 2 K.
Applsci 14 01686 g008
Figure 9. (Color online) Temperature dependence of the phonon energy for the mode ω = 445 cm−1 for EuO for different spin–phonon interaction constants R < 0 (curves 1,2) and for ω = 153 cm−1 for EuSe for different R > 0 . Inset: Dependence of the phonon energy on R for T = 30 K.
Applsci 14 01686 g009
Figure 10. Temperature dependence of the phonon energy for the mode ω = 445 cm−1 for EuO for different electron–phonon interaction constants A (curves 1,2) and for ω = 153 cm−1 for EuSe (curves 3,4). Inset: Dependence of the phonon energy on A for T = 30 K.
Applsci 14 01686 g010
Figure 11. Temperature dependence of the phonon damping for the mode ω = 153 cm−1 for EuSe for different R > 0 and A values.
Applsci 14 01686 g011
Disclaimer/Publisher’s Note: The statements, opinions and data contained in all publications are solely those of the individual author(s) and contributor(s) and not of MDPI and/or the editor(s). MDPI and/or the editor(s) disclaim responsibility for any injury to people or property resulting from any ideas, methods, instructions or products referred to in the content.

