

Minimizing the Limitations in Improving Historical Aerial Photographs with Super-Resolution Technique


1
Geomatics Engineering Program, Graduate School, Istanbul Technical University, Istanbul 34469, Türkiye
2
Department of Geomatics Engineering, Tokat Gaziosmanpasa University, Tokat 60250, Türkiye
3
Department of Geomatics Engineering, Istanbul Technical University, Istanbul 34469, Türkiye
4
Department of Geomatics Engineering, Kocaeli University, Kocaeli 41040, Türkiye
*
Author to whom correspondence should be addressed.
Appl. Sci. 2024, 14(4), 1495; https://doi.org/10.3390/app14041495
Submission received: 31 December 2023
/
Revised: 2 February 2024
/
Accepted: 10 February 2024
/
Published: 12 February 2024
(This article belongs to the Special Issue Geo-Processing of Historical Aerial Images)
Abstract
:Compared to natural images in artificial datasets, it is more challenging to improve the spatial resolution of remote sensing optical image data using super-resolution techniques. Historical aerial images are primarily grayscale due to single-band acquisition, which further limits their recoverability. To avoid data limitations, it is advised to employ a data collection consisting of images with homogeneously distributed intensity values of land use/cover objects at various resolution values. Thus, two different datasets were created. In line with the proposed approach, images of bare land, farmland, residential areas, and forested regions were extracted from orthophotos of different years with different spatial resolutions. In addition, images with intensity values in a more limited range for the same categories were obtained from a single year’s orthophoto to highlight the contribution of the suggested approach. Training of two different datasets was performed independently using a deep learning-based super-resolution model, and the same test images were enhanced individually with the weights of both models. The results were assessed using a variety of quality metrics in addition to visual interpretation. The findings indicate that the suggested dataset structure and content can enable the recovery of more details and effectively remove the smoothing effect. In addition, the trend of the metric values matches the visual perception results.
1. Introduction
Super-resolution (SR) techniques are used to improve low-quality images by turning them into high-resolution (HR) data. Information considered to be in the HR image but lost in the low-resolution (LR) one is restored [1,2,3]. The studies carried out for this purpose have moved to another dimension with the use of deep learning (DL) models. DL-based SR models [4,5] have shown significant development after the Super-Resolution Convolutional Neural Network (SRCNN) was proposed in 2014 [6]. Over the years, linear learning [6,7,8], residual learning [9,10,11], recursive learning [12,13,14], adversarial networks [15,16], and attention structures [17,18] have been used for resolution enhancement purposes on various datasets [4]. While many models [19,20] have aimed to achieve close or better performance values with a lighter structure than their predecessors, others have prioritized the quality of the end product directly, and do not rely on the number of parameters [10,21]. The majority of SR studies have used the T91 [22] and DIV2K [23] datasets for training, with the Set5 [24] and Set14 [25] datasets being used for testing purposes. In addition, datasets have been diversified with applications conducted by different disciplines. Several datasets have been created to solve real-world problems [26,27]. As models are built on frequently used common datasets, they do not always produce the expected results in independent applications with different scene characteristics [27,28].
When real-world problems are focused within the scope of SR, datasets containing remotely sensed images and magnetic resonance images [29] come to the fore. These include both those can be directly used [30,31,32] and those that have been created by researchers specifically for relevant studies [26,33]. While satellite images are most commonly favored as remotely sensed images for resolution improvement, aerial photographs obtained by platforms such as UAVs and aircraft have been used as well [34]. A common element of these datasets that distinguishes them from others is their focus on solving real-world problems. Significant progress has been achieved in applications including both commonly used datasets and those focusing on solving real-world challenges. The images enhanced with SR techniques have been brought very close to their HR equivalents. In particular, the Enhanced Deep Super-Resolution (EDSR) [10] network has been a turning point in the temporal hierarchy of SR approaches. Successful results have been achieved even at high scale factors with the Residual Dense Network (RDN) [35], providing better performance than the EDSR model with fewer parameters, as well as with the attention structures [17,18] built on these models. Thus, there is not much room left for a purely algorithm-based approach using current datasets to show significant progress compared to previous studies.
One of the dilemmas in SR studies in the literature is the distinguishability level between the images used in the training phase and those to be increased in the test phase. In many studies, the LR images presented to be enhanced are to some extent interpretable and analyzable. In this respect, studies using satellite images have made a difference in terms of SR. There are studies that directly use models created on commonly used datasets in optical images [36] as well as SR approaches specifically designed for enhancing satellite images [37,38]. Although some studies aim to improve the details that can already be distinguished in LR images [33], others that use satellite images such as Landsat and Sentinel may be insufficient for high-level detail extraction and scene analysis [39]. In particular, enhancing Landsat images, which provide older data compared to Sentinel, has allowed the expansion of time intervals for multi-temporal land use/cover (LULC) change detection studies. Previous research reported higher accuracy in classifications conducted with the enhanced images [40].
Differing from satellite images, another group of optical data in need of enhancement is historical aerial photographs obtained with photogrammetric techniques. In general, a historical aerial photograph for which the visual interpretation capacity can be increased with SR techniques can be considered as LR. The quality of a historical aerial photograph is conditioned by the scenario as well as by environmental, lighting, and atmospheric conditions [41]. It is possible to lose information when converting these photographs from hard copy versions to digital form through scanning procedures. Thus, in addition to the SR problems that satellite images bear, historical aerial photographs have additional restrictions. One of the factors that further limits the use of historical aerial photographs compared to other optical images and their improvement using SR techniques is the number of spectral bands. In the literature, the images used in SR studies consist of multispectral data. SR models simultaneously improve the available RGB spectral bands in multispectral images; moreover, as of today, attention structures are able to combine the prominent features of each band, increasing the quality of the resulting images. Furthermore, the use of infrared bands in enhancing LR images is possible. However, this is not likely in most historical aerial photographs, as they have only a single band.
Another limiting factor is the lack of color information in historical aerial photo-graphs, which is one of the distinguishing features used for differentiating earth objects. When two objects that are identical or similar in shape and size are both grayscale, their difference diminishes. In addition to the similarities in the same LULC details, the resemblance of these details is a situation that negatively affects the SR model’s ability to train different features. This makes it harder to recover information possibly lost in the LR image. Theoretically, a single band image is the same as being grayscale. The reason why it is considered separately as a limiting factor in this study is that the number of bands is directly related to the running of the algorithm; however, the color information creates distinguishability of objects and differences among them. To avoid repetition, only the term grayscale is used for the data used in the rest of the study.
Other factors that make the improvement of historical aerial photographs more challenging are the current image quality and the limitation of the original image in terms of LULC diversity due to the acquired time. Because old dates are involved, certain LULC classes in current datasets may be limited or absent in historical photographs. In addition, HR and LR image pairs for historical aerial photographs are not exactly similar to the datasets present in the literature. A historical aerial photograph which is considered to be theoretically HR may be objectively LR compared to current optical images. Therefore, it is theoretically more difficult for a model to learn the difference between two attributes and recover the lost information.
The literature is lacking a detailed study on improving grayscale historical aerial photographs within the scope of this research, which is important for solving real-world problems related to the past. Historical aerial photographs can be traced back 100 years; as it spans such a large time range, this data group is extremely useful for long-term monitoring of the environment. When this monitoring includes change detection applications where historical data should be analyzed together with current and high spatial resolution datasets, they need to be improved spatially in order to achieve more reliability. In essence, improved historical data should enable efficient visual interpretation and, if necessary, detailed object extraction. However, restrictive factors arising from the nature of the data make it difficult for the SR model to learn the relationships between HR-LR pairs. As a result, the smoothing effect becomes evident in the improved image. In order to use these images effectively in the mentioned applications, these factors must be minimized and edge details must be preserved as much as possible. In this context, a separate solution approach for each restrictive factor is put forward. The most basic DL-based SR model was applied to historical aerial photographs in order to reveal the feasibility of the solutions. The enhanced images were comparatively analyzed using various image quality assessment techniques to demonstrate that better qualitative and quantitative information can be obtained with the proposed approach, which is simple yet functional.
2. Materials and Methods
2.1. Dataset
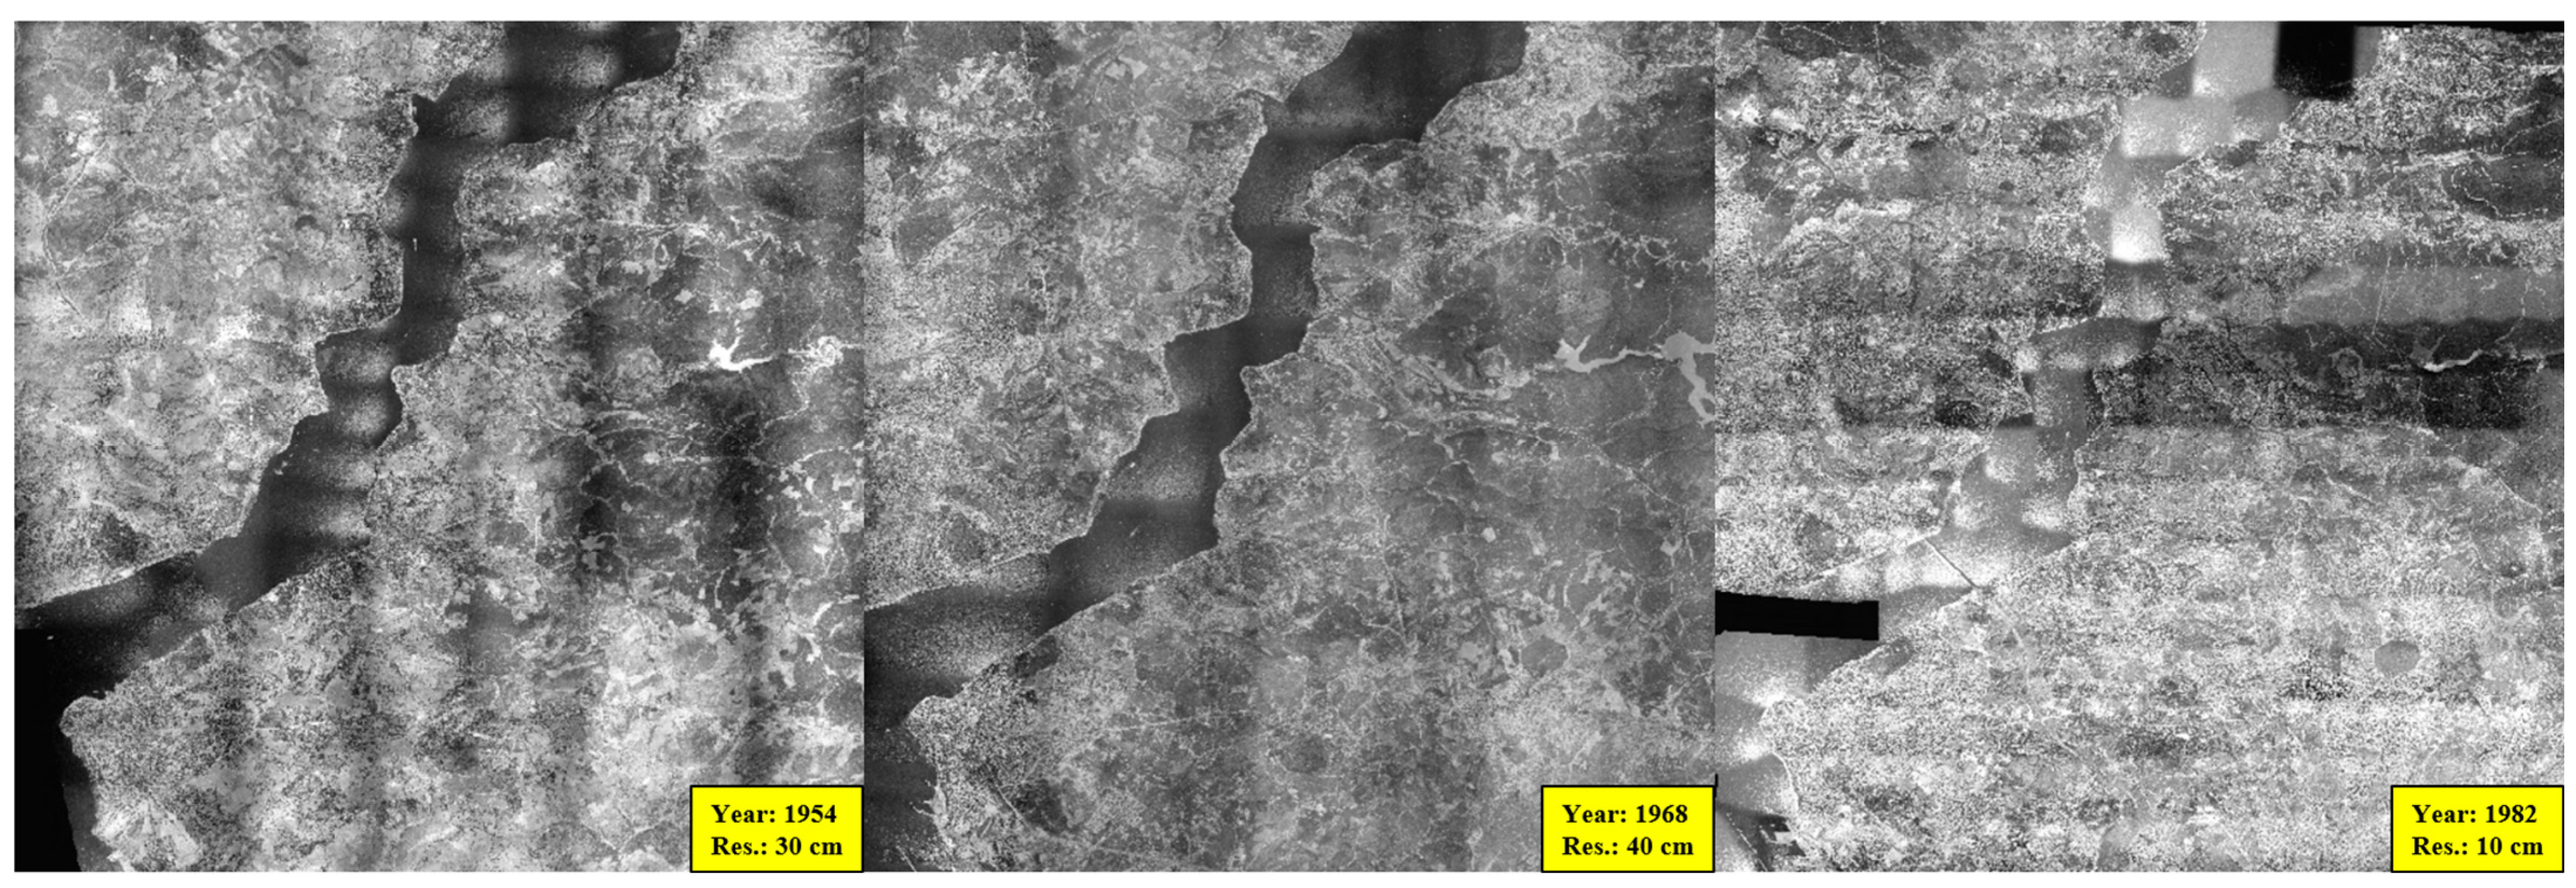
The province of Istanbul was selected as the study area, as it exhibits land cover (LC) diversity throughout time and reduces the obstacles by upgrading historical aerial photographs within the context of SR. Historical orthophoto images with varying dates and spatial resolution were provided by the General Directorate of Mapping, affiliated with the Ministry of National Defense, Republic of Türkiye. These orthophotos are grayscale images, as presented in Figure 1. The resolutions of these orthophotos are different from each other, as they were produced from photographs taken with different photogrammetric techniques in various years. Data with ground sampling intervals of 10 cm, 30 cm, and 40 cm were used. Because the computational cost of generating data over the entire orthophoto in tiff format is high, all orthophotos were divided into four equal parts. Among these, the one from 1982 had a higher resolution than the others; thus, each four parts were divided again into four more equal parts.
Four different LC categories were determined: bare land, farmland, residential areas, and forested regions. The image from 1954 mainly consists of bare land and forestry. The image from 1968 contains more residential areas than the image from 1954. The image from 1982 contains more residential areas than the others, and is rich in other categories as well. The orthophoto images included in the training and testing were derived from the identical parts extracted from each orthophoto. The random clipping approach was used to create photos with a maximum overlap rate of 10%. Thus, the shifting approach to data augmentation was used between the randomly cropped photographs, and the image similarity was preserved to a specified level to prevent the data group from overfitting. Because the orthophoto from 1982 was much richer in terms of content than the others, most of the photographs were derived from it. The 1954 and 1968 images were fewer in number, as they are from older years and have fewer pixels covering same area. The amount of data was increased by additionally applying horizontal and vertical flipping to the images derived from the 1954 and 1968 orthophotos. An important nuance when creating a training set from this type of data is the number of images. Although the aforementioned criteria and geometric transformations exist, the limiting factors mentioned previously increase the visual similarity as the number of photographs increases. Therefore, the total number of images included in training was limited to 1000, the majority of which belonged to 1982. Numerically, 700 images belonged to 1982 and the rest belonged to the other years.
2.2. Minimizing the Restrictions
Within the scope of this study, two datasets were created, dataset-1 and dataset-2. The first was created to minimize restrictive effects based on the proposed approach, while the other had the same number of images but was structurally shallower, and was created to concretely demonstrate the positive contributions of the proposed approach. One of the constraints is that the images contain a single band. Because DL-based SR models work on multi-band images, three-band images were obtained by adding two copies of each image to the existing one. Although this situation makes the images artificially multispectral in the dataset, it does not do so in terms of content. The main purpose of this process was to run the SR model without errors during training. Although the images contain three bands, the richness that cannot be provided in terms of content is provided with the approach depicted in Figure 2.
Photographs from different years covering the same regions were used together. Due to the changes in LC over time, photographs from different years represent various content with a single band. A region that appears as a residential area within the same region in the 1968 and 1982 images might have been a bare land in 1954. In such cases, two spectral variations were obtained for regions representing the same content in the dataset. As a result, the limitation arising from the number of bands in historical aerial photographs is overcome by digitally converting them into three bands and representing the same regions separately with images derived for different years.
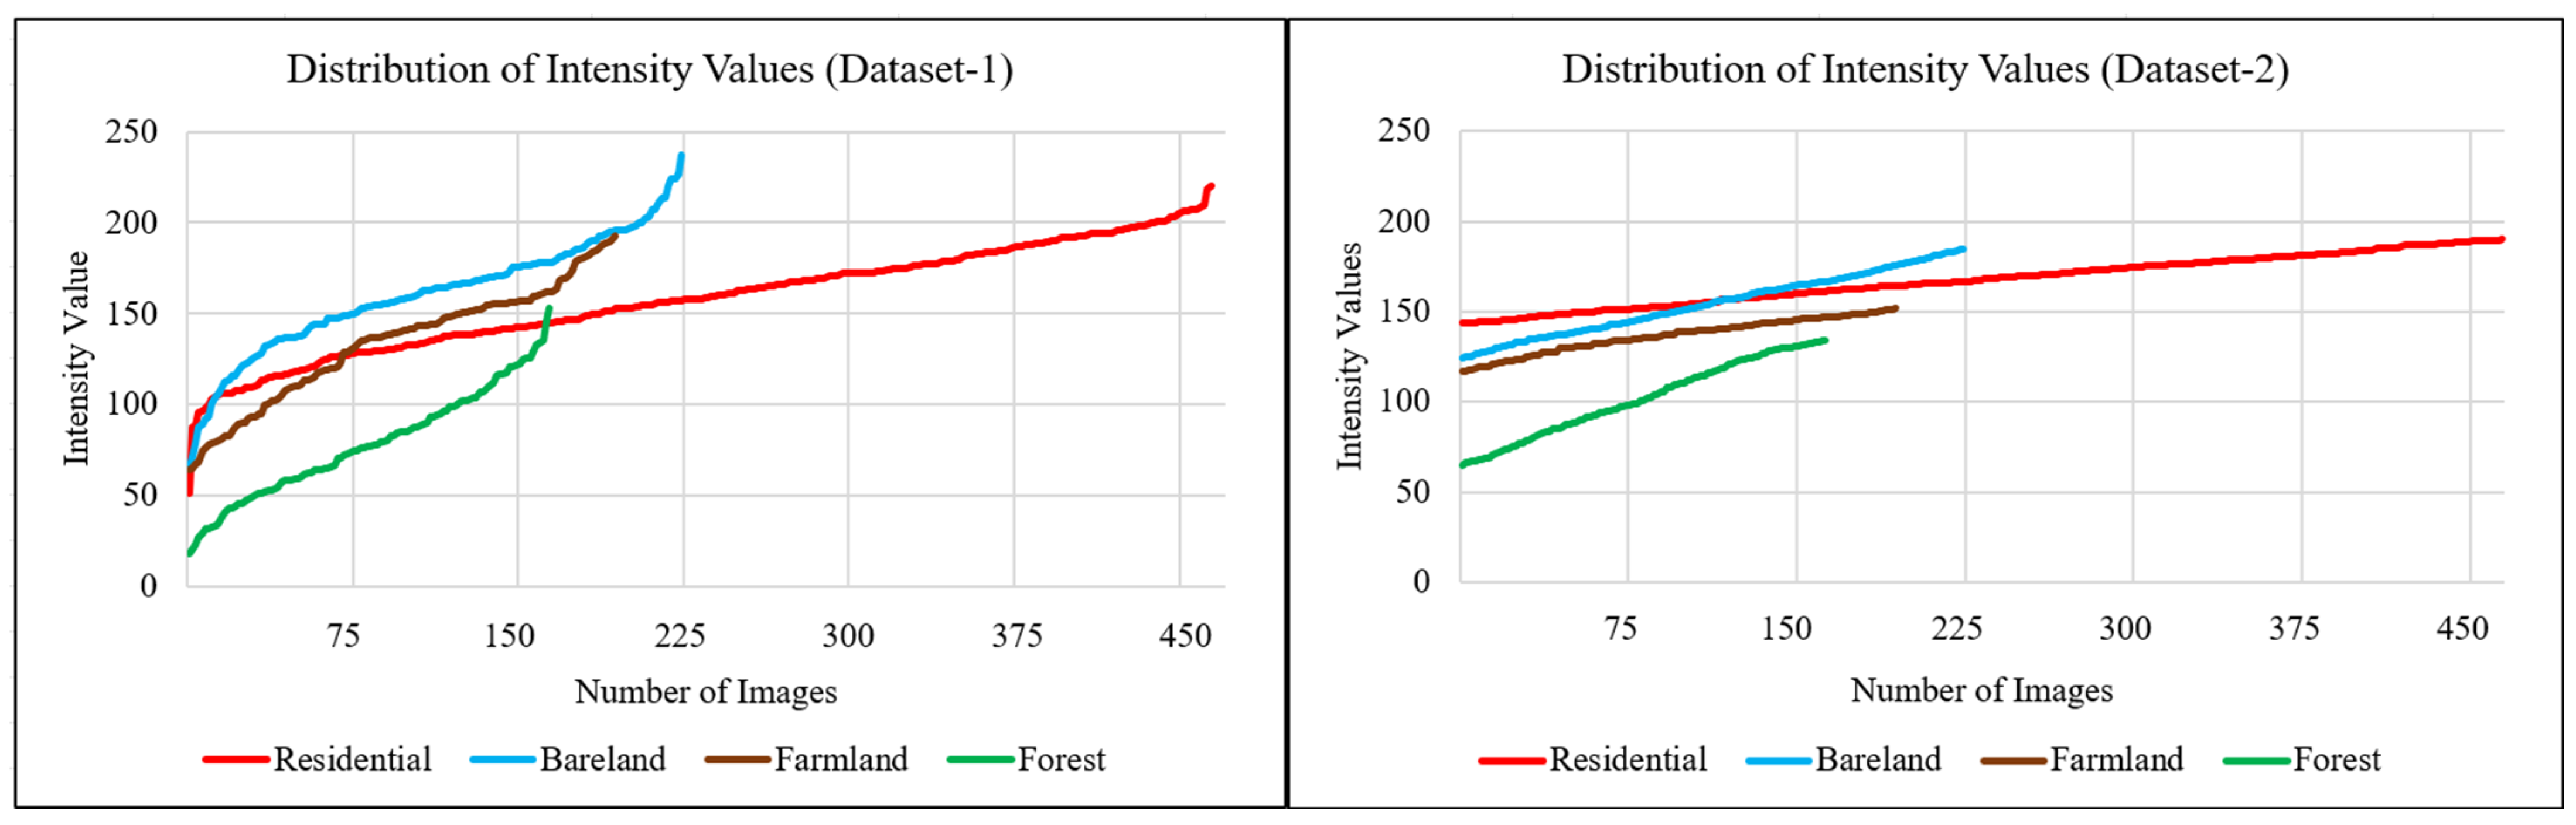
In the dataset to be used in SR studies, differences between photographs have an effect of increased distinguishability. Apart from the differences in the distribution of LC within the area covered by the photograph, color information is a factor that makes the images different from each other. Because the images used in the study are single bands, there is no color diversity as in multispectral images. This causes different photographs to display higher similarity than color images even though they contain different regions. To minimize this limitation, intensity values were used. The brightness value in multispectral images, which is the numerical equivalent of color information, is replaced by intensity values in grayscale images. These values were used to control details and brightness adjustments in grayscale images. For this reason, apart from the distribution of LC, intensity values were taken as the basic factor affecting distinguishability in the grayscale images. Although forestry areas generally have low intensity values, photographs of forestry with an average brightness value greater than 128 for an 8-bit image were included in the dataset. Similarly, although farmland areas in historical images mostly had high intensity values, photographs of agricultural areas with low intensity values on average were included in the dataset. The need to provide distinguishability due to the lack of color information was minimized by creating photographs that contain homogeneous intensity values. A visual depiction of the intensity distributions of the images in both datasets is presented in Figure 3.
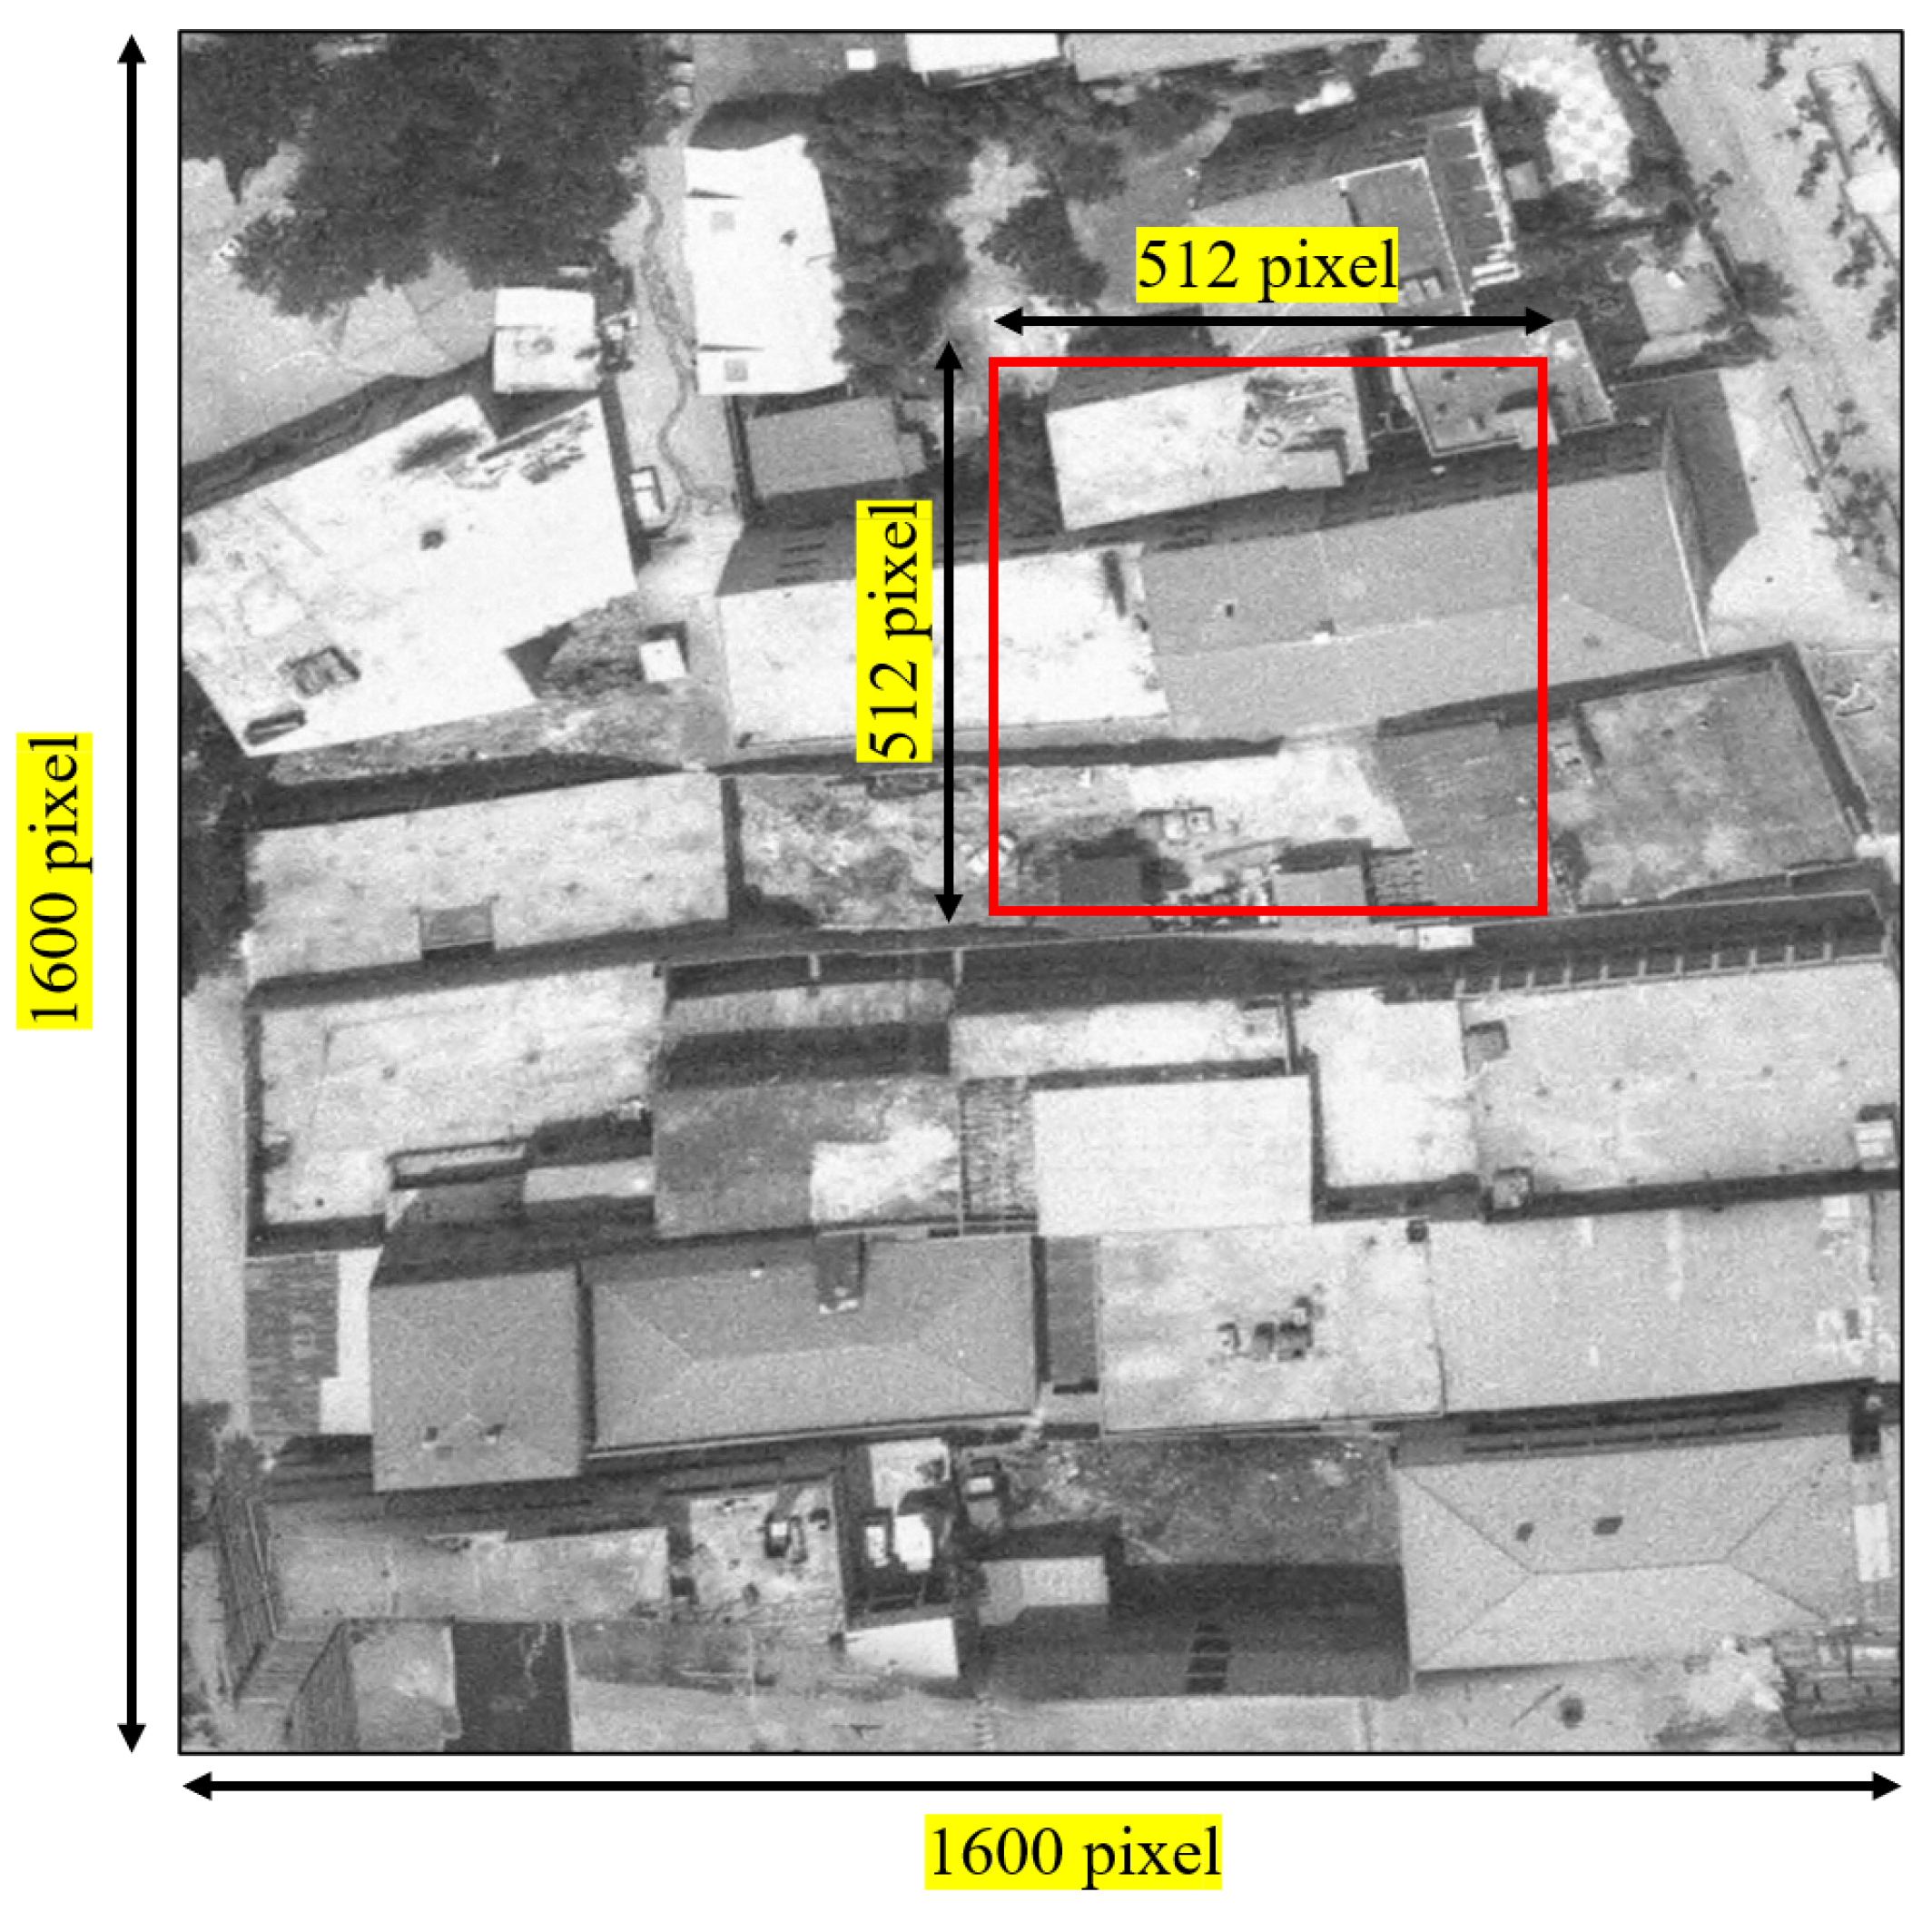
Another limitation of historical aerial photography is that there are not enough available HR-LR pairs, both numerically and in quality, to cover the different land cover classes required for SR applications. The quality of HR images and the LR images derived from them makes learning the relationship between image pairs difficult. Even LR images derived from images considered HR in many commonly used datasets, such as T91 [22], DIV2K [23], Set5 [24], and Set14 [25], bear a higher level of discrimination than those used in this study. This is the result of the technological possibilities available with the hardware of the period. In addition, due to the date of the obtained data, older images may be inadequate in terms of LC classes. Farmland areas are fewer in photographs from more recent years, whereas residential areas are smaller in images from earlier years due to urbanization over time. To minimize this effect, higher-dimensional images were used compared to the images in the optical datasets referred in the literature. The images in dataset-1 vary in size, and are larger than those in dataset-2. In dataset-2, all image dimensions are 512 × 512, while the dimensions in the first dataset vary between 1200 × 1200 and 2400 × 2400. As such, although the size of the input image for training is much smaller (256 for HR and 64 for LR when the scale factor is 4), the diversity in the region where each kernel travels has been increased in the cropped images. A visual photo presenting the difference between the images in both datasets is presented in Figure 4.
In light of the aforementioned constraints and suggestions to minimize these constraints, two different datasets were created. In one of them, photographs from different years were used together, the images were cropped so that the intensity values were distributed homogeneously, and the size of the images was kept high. In the other, only images from 1982 were used, and photographs from 1954 and 1968 were not included. In addition, the intensity values were kept within a more limited range and the size of all cropped images was limited to 512 × 512.
2.3. Super-Resolution Implementation
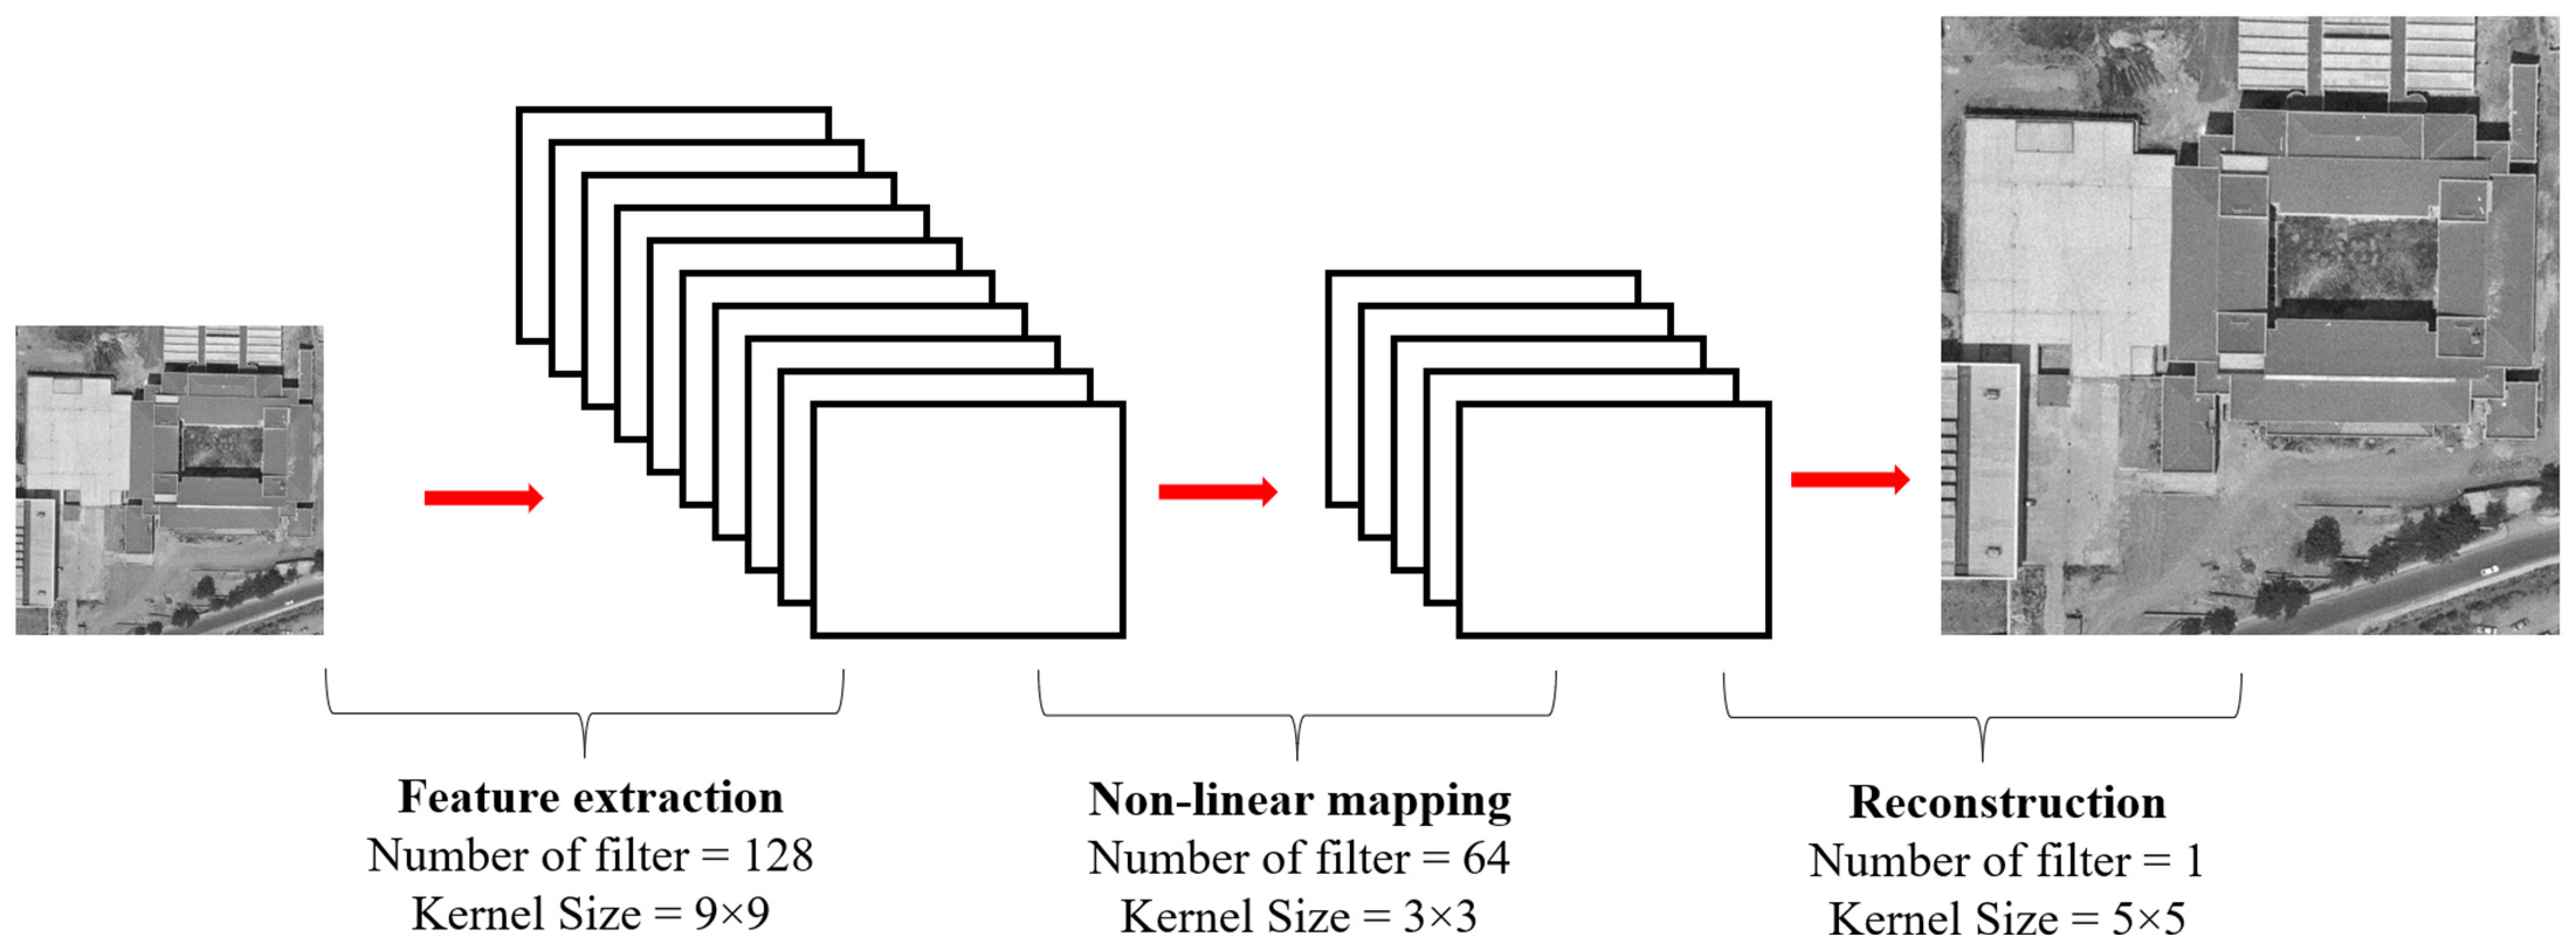
There are many models [1,2,3,4,5] used in SR studies. In deep learning-supported applications, the process that started with linear learning continued with residual learning, and has continued with recursive learning, adversarial learning, and attention structures. In a number of studies, the advantages of different learning strategies have been used together. Global and local residual learning have been applied separately as residual learning, then evaluated together [42,43]. With the modifications made in the design of the models and hyperparameters, higher performance values supported by visual interpretation can be obtained, and higher performance values can be achieved with lightweight models. CNN-based SR studies, which started with SRCNN in 2014, have achieved high performance values both visually and metrically with the available data. Regardless of the approach being considered, almost all studies make comparisons with SRCNN, as it is a turning point for SR. Because the aim of this study is to reveal the improvability of historical aerial photographs and overcome their limitations rather than to show the superiority of one model over another, the SRCNN model was used directly. No changes were made to the hyperparameters to achieve better results. Dropout, batch normalization, or regularization techniques such as L1 or L2 were not included in the model to prevent overfitting or underfitting. It is thought that it is more realistic to use the model as provided in order to minimize the constraints arising from the dataset. In addition, the ability of the proposed dataset design to cope with the smoothing effect, which is frequently mentioned for SRCNN and similar models, was determined. The simplified architecture of the SRCNN model is presented in Figure 5.
The SRCNN model transforms an LR input image into an HR output image using learned weights. SRCNN generally consists of three main layers. The input layer accepts a low-resolution input image. The feature extraction layers apply various convolution and activation operations to extract features from the LR input image. These layers use learned filters to capture features in the image. The reconstruction layer creates a HR output image using feature extractions [6]. This process allows the LR image to gain more detail and clarity. As the activation function, ReLU was used in the first two layers and linear was used in the last layer. The filter numbers were 128, 64, and 1, respectively, while the kernel sizes were set to 9, 3, and 5. The training process was conducted for a scale factor of 4, whereas the input sizes for the HR-LR pair were set to 256 and 64. ADAM was used as the optimization algorithm with a value of 0.01. Early stopping was used during training to prevent overfitting and to make the training process more effective. Implementation and testing of the model were carried out in the Google Colab environment.
3. Results and Discussions
In addition to visual interpretation, various image quality metrics were used for the test images improved by the trained model in SR studies, although based on statistical analysis results that are not positively supported by visual interpretation become inadequate especially in solving real-world problems [44], meaning that the image with a higher quality metric is not always visually better [15].
The most commonly used image quality metrics in SR studies are the Root Mean Squared Error (RMSE) [45], Peak Signal-to-Noise Ratio (PSNR) [46], and Structural Similarity Measure Index (SSIM) [47]. The RMSE value is a metric used to measure the similarity or difference of pixel values between two images. RMSE with a positive value and a smaller value indicates that two images are closer or similar to each other [44,48]. RMSE is the square root of MSE, and is calculated accordingly:
where:
Yi represents the value of the data point in HR;
Xi represents the value of the data point in the test image;
n represents the total number of data points.
PSNR measures the representativeness of the image. The higher the PSNR value, the higher the similarity between two images and the better the quality is considered. However, PSNR has a disadvantage in that it does not reflect the quality perceived by the human eye [48,49]. It is usually expressed in dB (decibels), and is calculated by the formula below:
where:
PSNR = 10 × log10((M2)/MSE)
M represents the maximum possible value of pixel values;
MSE (Mean Squared Error) represents the mean square error between the HR and the test image.
SSIM attempts to measure the structural similarity between two images, and ex-presses this similarity as a score. It takes a value in the range [0, 1], where 1 indicates the highest similarity and best quality while 0 indicates the lowest similarity and worst quality. Its calculation includes three components: luminance similarity, contrast similarity, and structural similarity. Luminance similarity measures the similarity between the luminance components of two images, and includes differences in pixel values and contrast. Contrast similarity measures the similarity between the contrast components of two images, and refers to the standard deviation of pixel values. Structural similarity measures the similarity of two images, and involves the correlation and similarity of pixel values. By combining these three components, SSIM produces an overall similarity score [47,48]. The higher the SSIM score between two images, the higher the similarity and quality.
Universal Image Quality Index (UIQI) [49] is another metric used to evaluate image quality. This metric determines the quality of an image using brightness and contrast distortion as well as correlation loss. Unlike pixel-based metrics, it can produce negative values. Although it adopts a similar approach to SSIM, UIQI focuses mainly on color-based features, while SSIM considers more details and fine features [47,48].
The fifth metric used in the study is the Bhattacharyya distance value [50], which is a statistical metric that measures the similarity or difference between two probability distributions. It is used to evaluate overlap or separate distributions. Values range from 0 to ∞, with a smaller Bhattacharyya distance indicating that two distributions are more similar and a larger distance indicating more dissimilarity or separation. Both images are represented in a color space. They are separated into color components and a histogram is calculated for each color component. The histograms show the distribution of the pixel values of each color component, and are normalized by scaling each histogram to a sum of 1. After this stage, using the histograms of the two images, the Bhattacharyya distance is calculated according to the following formula:
where:
H1 and H2 are the histograms;
h1i and h2i are histogram values for the region.
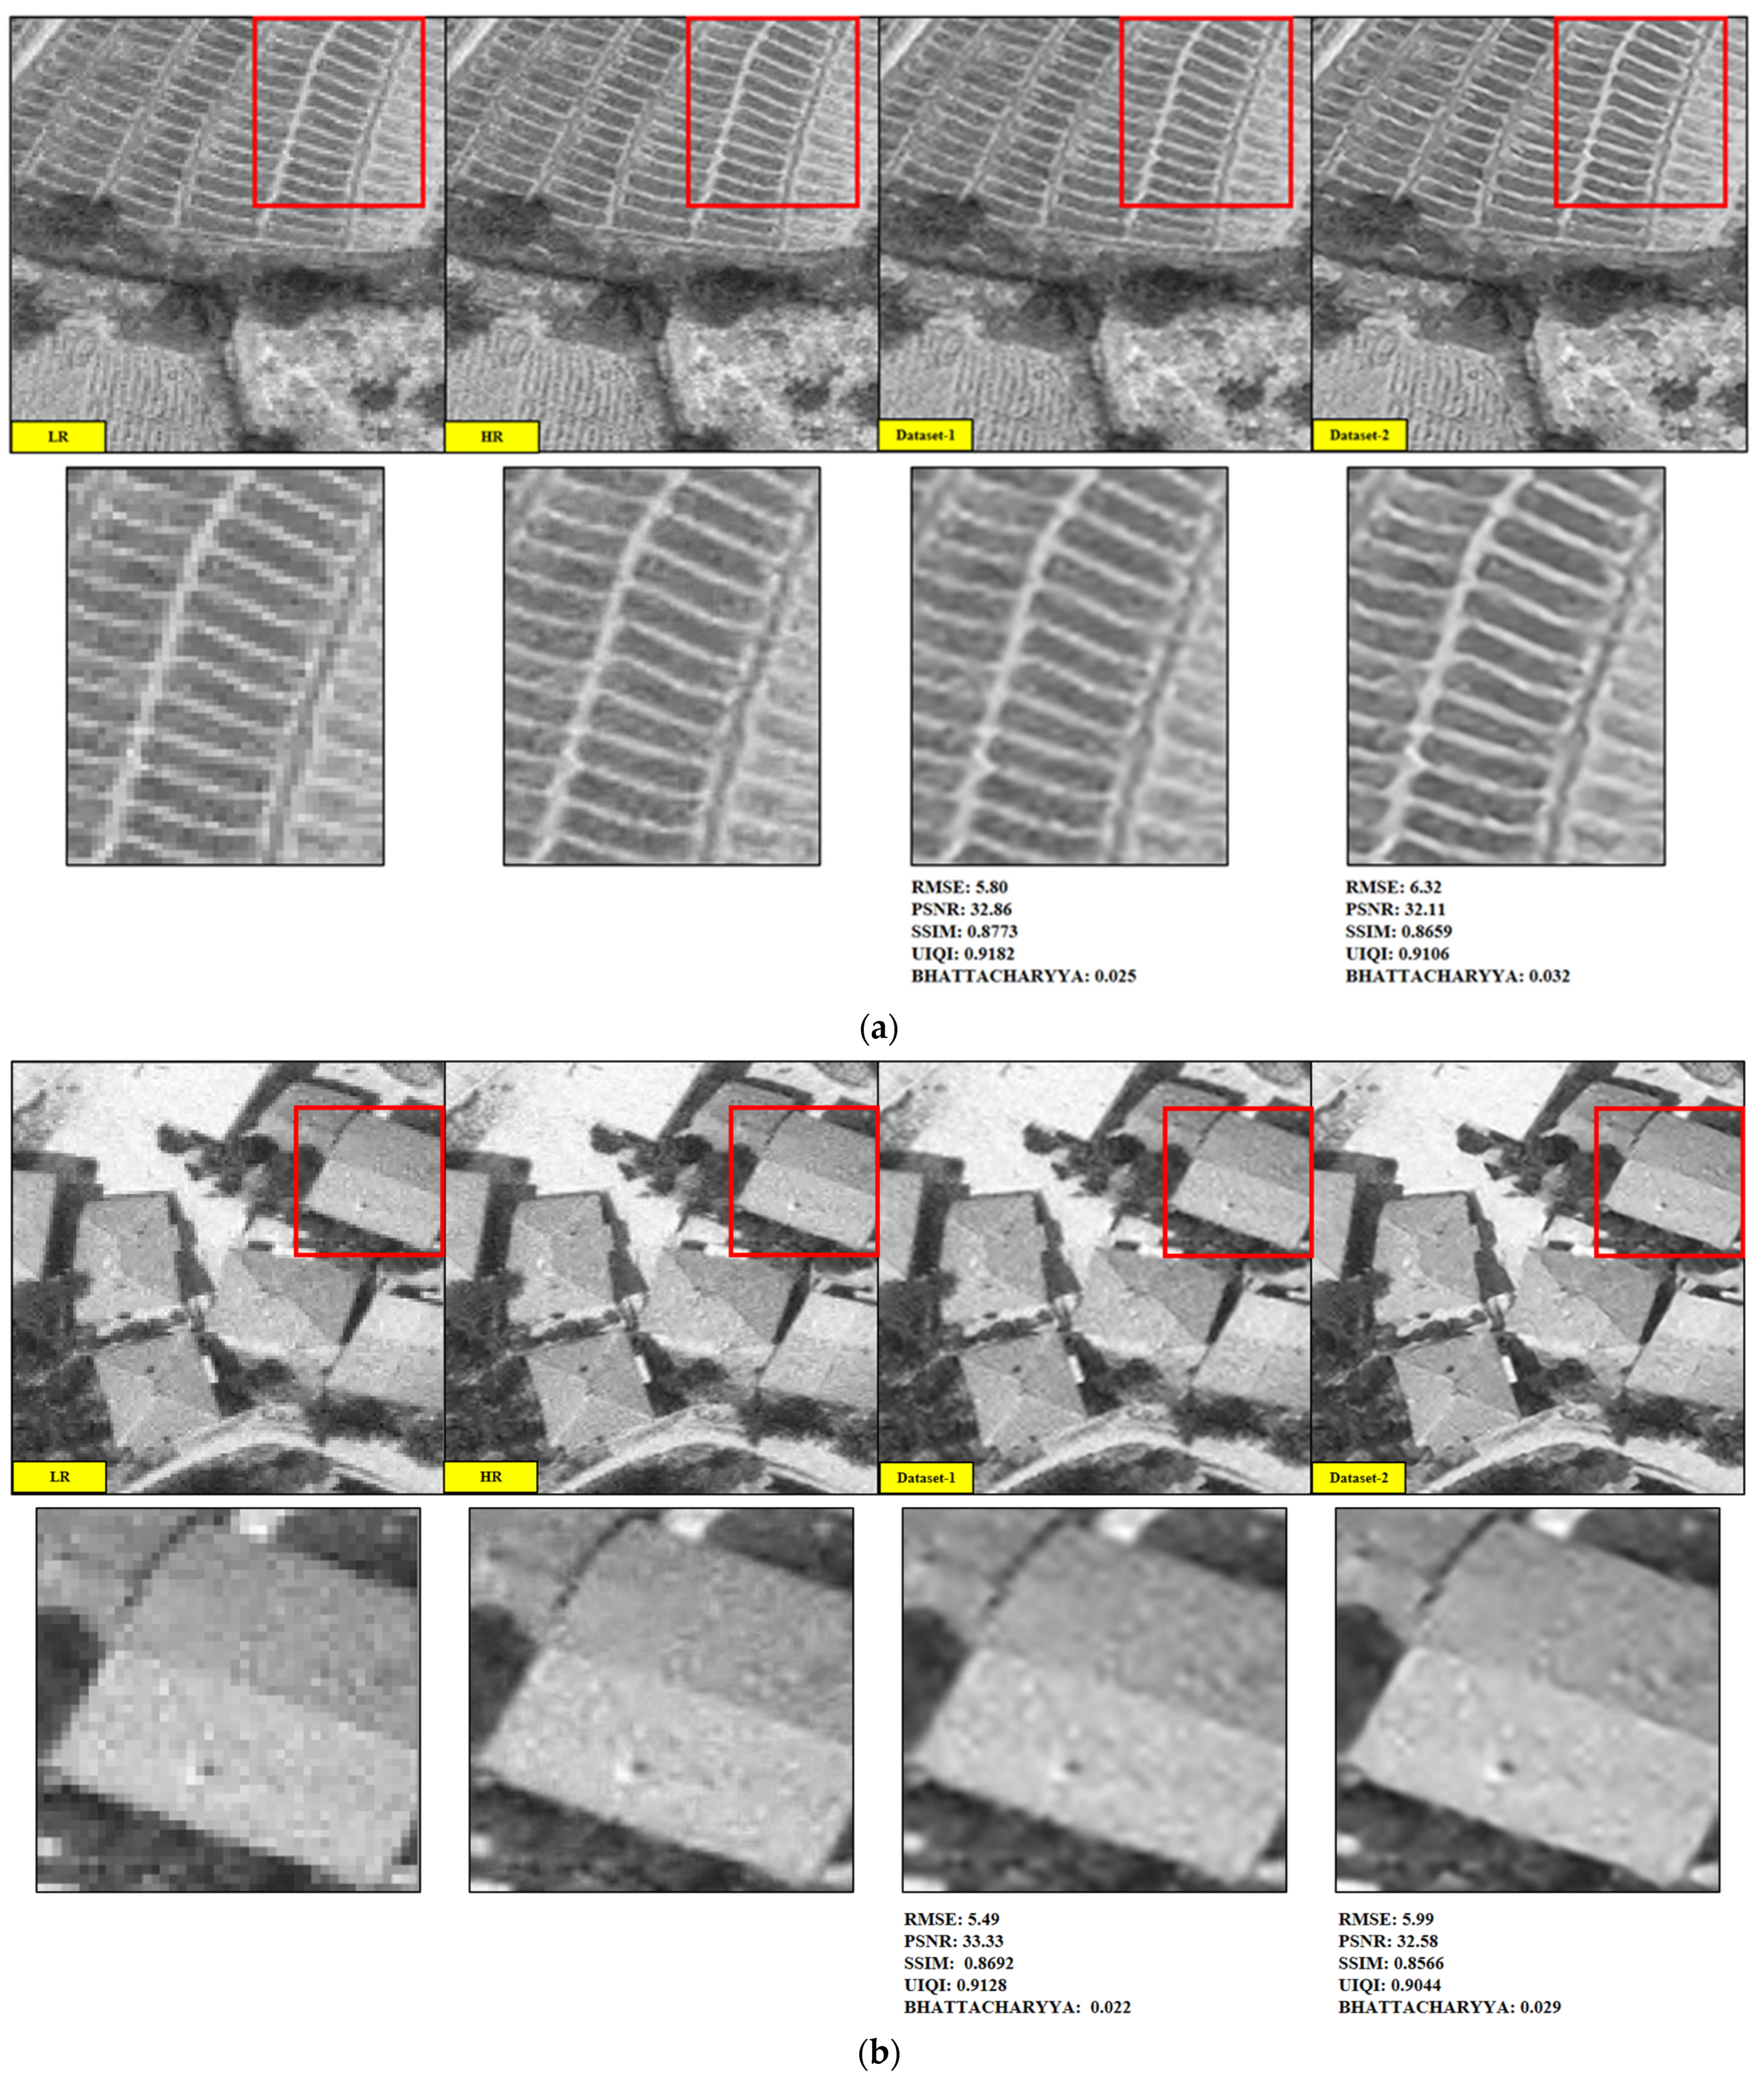
Examples of test images improved using the model trained with two different datasets are presented in Figure 6a,b. Metric values obtained for the test images are illustrated as examples. The average of the metric values obtained for all test images are provided in Table 1.
The SR application was carried out with a scale factor of 4. Images of different sizes in the training dataset were arranged as 256 × 256 and accepted as HR. The four times smaller versions of these with the interpolation technique were accepted as LR with a size of 64 × 64. Depending on these values, the SR application was performed on two different datasets. Dataset-1 included the approach recommended in this study. Dataset-2 kept the brightness values within a limited range and contains cropped images of size 512 × 512. When the LR image, HR image, and improved images are evaluated based on visual interpretation, it can be clearly seen that dataset-1 is closer to the HR images. The negative effect that occurs in the images improved in SR studies involves a smoothing effect. The proposed approach aims to obtain higher metric values by minimizing this effect. When the images enhanced with dataset-2 are examined in both images, it can easily be observed visually that they contain more of a smoothing effect than the images enhanced with dataset-1. At this point, it is suggested specifically for historical aerial photographs that the same region has to be represented by images from different years and features extracted from three different bands. The intensity values of the images vary in a wide range, meaning that they are distributed homogeneously, and the image sizes that have to be included in the training phase are larger than those used in the literature, leading to a positive impact on the results. However, the smoothing effects which remain present in dataset-1 can further be eliminated with models using different learning strategies.
When the results based on image quality metrics are examined, the values obtained in both improved test images exert consistent results with visual interpretation. The differences between the mutually obtained values for the improved images are lower than those obtained in the literature. However, this is an expected situation, as a single model was used on different datasets. In addition, as the scale factor increases in SR studies, the metric values presented by different models grow closer to each other [1,2,3,4,5]. The differences between PSNR and SSIM values for the two enhanced images in Figure 6 would be greater if the scale factor was 2. In this study, 4 was used as the scale factor, as suggestions for solving a real-world problem were presented. This is one of the reasons why the differences between the metric values were relatively low. In historical aerial photographs, the distortion amount detected when downsampling the original HR image to LR was more than the distortions observed when conducting the same downsampling on natural images such as Set5 [24] and Set14 [25]. This situation limits the features that the model can learn during training. Therefore, the ability to improve the test image may have been limited.
Consequently, there was positive progress both in pixel-based metrics and in metrics that underline structural similarity. The conducted study is distinguished by the use of the UIQI and Bhattacharyya metrics, which are not used in most SR studies. The results for the UIQI metric showed a similar trend to the SSIM. However, the differences between the values obtained for the two scenarios are less than in SSIM. This may be because the range covered by UIQI values is wider. Because UIQI can be used with a color-sensitive approach, it can be used more efficiently to colorize grayscale aerial photographs. Compared to Bhattacharyya, it was determined that UIQI can be used in the evaluation of enhanced grayscale aerial photographs. Considering all test photographs, it was found that the Bhattacharyya measure was not sensitive enough to the current dataset, despite the fact that both metrics produced favorable findings. Lower Bhattacharyya distance values were obtained in some of the images where the smoothing effect was more prominent, with the exception of the test images provided as examples. In this scenario, lower metric distances suggest a greater similarity between the two images. Furthermore, it is currently not feasible to effectively assess this metric in historical aerial pictures due to the fact that the distance values fall within a relatively limited range.
4. Conclusions
In this study, historical orthophoto images of a single region from different years were used and an attempt was made to create a dataset based on these images. The fact that the data were grayscale increased the similarity between the different photographs we produced. Objects which are normally in separate categories in other optical datasets used in the literature were grouped under four main classes due to the restriction caused by the lack of color information. Images in each class were converted from single-band to three-band to run the SR model. The different features offered by each band in a multispectral image were obtained with images of different years and with different spatial resolutions containing the same region. We tried to achieve the contribution of color information, which allows the model to learn different features during training, using intensity values distributed over a wide range. These approaches were applied to minimize the restrictions and reduce the smoothing effect on the improved images obtained with the SR model. Image quality metrics validated the proposed approach for improving grayscale historical aerial photographs. In the future, the diversity of data categories containing historical photographs can be increased by evaluating different datasets obtained from different sources to achieve better results in both metric values and visual evaluation. As another type of optical data, satellite images may be included in studies of historical photographs in grayscale form by applying extra distorting effects. Other datasets may contain images created separately for airports, railways, and industrial zones. Such structures may not have existed at the time when historical aerial photographs were obtained. In addition to enriching the dataset in terms of content, DL-based coloring algorithms can be applied on historical aerial photographs for better learning.
Author Contributions
Conceptualization, A.H.I.; methodology, A.H.I. and U.A.; writing—original draft preparation, A.H.I.; writing—review and editing, U.A. and O.A.; supervision, D.Z.S. All authors have read and agreed to the published version of the manuscript.
Funding
This research received no external funding.
Institutional Review Board Statement
Not applicable.
Informed Consent Statement
Not applicable.
Data Availability Statement
The historical orthophoto images presented in this study is confidential and may be provided only with restrictions by the responsible data provider institution (General Directorate of Mapping). The other models and codes generated in the study are available from the corresponding author upon reasonable request.
Acknowledgments
The authors are grateful to the General Directorate of Mapping for sharing the orthophoto images used within the scope of the study.
Conflicts of Interest
The authors declare no conflicts of interest.
References
- Anwar, S.; Khan, S.; Barnes, N. A deep journey into super-resolution: A survey. ACM Comput. Surv. 2020, 53, 1–34. [Google Scholar] [CrossRef]
- Li, K.; Yang, S.; Dong, R.; Wang, X.; Huang, J. Survey of single image super-resolution reconstruction. IET Image Process. 2020, 14, 2273–2290. [Google Scholar] [CrossRef]
- Wang, Z.; Chen, J.; Hoi, S.C.H. Deep learning for image super-resolution: A survey. IEEE Trans. Pattern Anal. Mach. Intell. 2020, 43, 3365–3387. [Google Scholar] [CrossRef]
- Ooi, Y.K.; Ibrahim, H. Deep learning algorithms for single image super-resolution: A systematic review. Electronics 2021, 10, 867. [Google Scholar] [CrossRef]
- Ha, V.K.; Ren, J.C.; Xu, X.Y.; Zhao, S.; Xie, G.; Masero, V.; Hussain, A. Deep learning based single image super-resolution: A survey. Int. J. Autom. Comput. 2019, 16, 413–426. [Google Scholar] [CrossRef]
- Dong, C.; Loy, C.C.; He, K.; Tang, X. Learning a deep convolutional network for image super-resolution. In Proceedings of the European Conference on Computer Vision, Zurich, Switzerland, 6–12 September 2014. [Google Scholar] [CrossRef]
- Dong, C.; Loy, C.C.; Tang, X. Accelerating the super-resolution convolutional neural network. In Proceedings of the European Conference on Computer Vision, Amsterdam, The Netherlands, 11–14 October 2016. [Google Scholar] [CrossRef]
- Caballero, J.; Ledig, C.; Aitken, A.; Acosta, A.; Totz, J.; Wang, Z.; Shi, W. Real-time video super-resolution with spatio-temporal networks and motion compensation. In Proceedings of the IEEE Conference on Computer Vision and Pattern Recognition, Honolulu, HI, USA, 21–26 July 2017. [Google Scholar] [CrossRef]
- Kim, J.; Lee, J.K.; Lee, K.M. Accurate image super-resolution using very deep convolutional networks. In Proceedings of the IEEE Conference on Computer Vision and Pattern Recognition, Las Vegas, NV, USA, 27–30 June 2016. [Google Scholar] [CrossRef]
- Lim, B.; Son, S.; Kim, H.; Nah, S.; Lee, K.M. Enhanced deep residual networks for single image super-resolution. In Proceedings of the IEEE Conference on Computer Vision and Pattern Recognition Workshops, Honolulu, HI, USA, 21–26 July 2017. [Google Scholar] [CrossRef]
- Lan, R.; Sun, L.; Liu, Z.; Lu, H.; Su, Z.; Pang, C.; Luo, X. Cascading and enhanced residual networks for accurate single-image super-resolution. IEEE Trans. Cybern. 2021, 51, 115–125. [Google Scholar] [CrossRef]
- Kim, J.; Lee, J.K.; Lee, K.M. Deeply-recursive convolutional network for image super-resolution. In Proceedings of the IEEE Conference on Computer Vision and Pattern Recognition, Las Vegas, NV, USA, 27–30 June 2016. [Google Scholar] [CrossRef]
- Tai, Y.; Yang, J.; Liu, X. Image super-resolution via deep recursive residual network. In Proceedings of the IEEE Computer Vision and Pattern Recognition, Honolulu, HI, USA, 21–26 July 2017. [Google Scholar] [CrossRef]
- Wei, W.; Yongbin, J.; Yanhong, L.; Ji, L.; Xin, W.; Tong, Z. An advanced deep residual dense network (DRDN) approach for image super-resolution. Int. J. Comput. Intell. Syst. 2019, 12, 1592–1601. [Google Scholar] [CrossRef]
- Ledig, C.; Theis, L.; Huszár, F.; Caballero, J.; Cunningham, A.; Acosta, A.; Aitken, A.; Tejani, A.; Totz, J.; Wang, Z.; et al. Photo-realistic single image super-resolution using a generative adversarial network. In Proceedings of the IEEE Computer Vision and Pattern Recognition, Honolulu, HI, USA, 21–26 July 2017. [Google Scholar] [CrossRef]
- Wang, X.; Yu, K.; Wu, S.; Gu, J.; Liu, Y.; Dong, C.; Qiao, Y.; Loy, C.C. ESRGAN: Enhanced super-resolution generative adversarial networks. In Proceedings of the European Conference on Computer Vision, Munich, Germany, 8–14 September 2018. [Google Scholar] [CrossRef]
- Zhang, Y.; Li, K.; Li, K.; Wang, L.; Zhong, B.; Fu, Y. Image super-resolution using very deep residual channel attention networks. In Proceedings of the European Conference on Computer Vision, Munich, Germany, 8–14 September 2018. [Google Scholar] [CrossRef]
- Dai, T.; Cai, J.; Zhang, Y.; Xia, S.T.; Zhang, L. Second-order attention network for single image super-resolution. In Proceedings of the IEEE Computer Vision and Pattern Recognition, Long Beach, CA, USA, 15–20 June 2019. [Google Scholar] [CrossRef]
- Kim, S.; Jun, D.; Kim, B.-G.; Lee, H.; Rhee, E. Single image super-resolution method using CNN-Based lightweight neural networks. Appl. Sci. 2021, 11, 1092. [Google Scholar] [CrossRef]
- Gendy, G.; He, G.; Sabor, N. Lightweight image super-resolution based on deep learning: State-of-the-art and future directions. Inf. Fusion 2023, 94, 284–310. [Google Scholar] [CrossRef]
- Anwar, S.; Barnes, N. Densely residual laplacian super-resolution. IEEE Trans. Pattern Anal. Mach. Intell. 2020, 44, 1192–1204. [Google Scholar] [CrossRef]
- Yang, J.; Wright, J.; Huang, T.S.; Ma, Y. Image super-resolution via sparse representation. IEEE Trans. Image Process. 2010, 19, 2861–2873. [Google Scholar] [CrossRef]
- Agustsson, E.; Timofte, R. NTIRE 2017 challenge on single image super-resolution: Dataset and study. In Proceedings of the IEEE Computer Vision and Pattern Recognition Workshops, Honolulu, HI, USA, 21–26 July 2017. [Google Scholar] [CrossRef]
- Bevilacqua, M.; Roumy, A.; Guillemot, C.; Mla, M. Low-complexity single-image super resolution based on nonnegative neighbor embedding. In Proceedings of the British Machine Vision Conference, Surrey, UK, 3–7 September 2012. [Google Scholar]
- Zeyde, R.; Elad, M.; Protter, M. On single image scale-up using sparse-representations. In Proceedings of the International Conference on Curves and Surfaces, Avignon, France, 24–30 June 2010. [Google Scholar] [CrossRef]
- Wang, P.; Bayram, B.; Sertel, E. A comprehensive review on deep learning based remote sensing image super-resolution methods. Earth-Sci. Rev. 2022, 232, 104110. [Google Scholar] [CrossRef]
- Benecki, P.; Kawulok, M.; Kostrzewa, D.; Skonieczny, L. Evaluating super-resolution reconstruction of satellite images. Acta Astronaut. 2018, 153, 15–25. [Google Scholar] [CrossRef]
- Zhu, X.X.; Tuia, D.; Mou, L.; Xia, G.-S.; Zhang, L.; Xu, F.; Fraundorfer, F. Deep learning in remote sensing: A comprehensive review and list of resources. IEEE Geosci. Remote Sens. Mag. 2017, 5, 8–36. [Google Scholar] [CrossRef]
- Mahapatra, D.; Bozorgtabar, B.; Garnavi, R. Image super-resolution using progressive generative adversarial networks for medical image analysis. Comput. Med. Imaging Graph. 2019, 71, 30–39. [Google Scholar] [CrossRef]
- Xia, G.; Hu, J.; Hu, F.; Shi, B.; Bai, X.; Zhong, Y.; Zhang, L.; Lu, X. AID: A benchmark data set for performance evaluation of aerial scene classification. IEEE Trans. Geosci. Remote Sens. 2017, 55, 3965–3981. [Google Scholar] [CrossRef]
- Zou, Q.; Ni, L.; Zhang, T.; Wang, Q. Deep learning based feature selection for remote sensing scene classification. IEEE Geosci. Remote Sens. Lett. 2015, 12, 2321–2325. [Google Scholar] [CrossRef]
- Dai, D.; Yang, W. Satellite image classification via two-layer sparse coding with biased image representation. IEEE Geosci. Remote Sens. Lett. 2010, 8, 173–176. [Google Scholar] [CrossRef]
- Deeba, F.; Dharejo, F.A.; Zhou, Y.; Ghaffar, A.; Memon, M.H.; Kun, S. Single image super-resolution with application to remote-sensing image. In Proceedings of the Global Conference on Wireless and Optical Technologies, Malaga, Spain, 6–8 October 2020. [Google Scholar] [CrossRef]
- Panagiotopoulou, A.; Grammatikopoulos, L.; El Saer, A.; Petsa, E.; Charou, E.; Ragia, L.; Karras, G. Super-resolution tech-niques in photogrammetric 3D reconstruction from close-range UAV imagery. Heritage 2023, 6, 2701–2715. [Google Scholar] [CrossRef]
- Zhang, Y.; Tian, Y.; Kong, Y.; Zhong, B.; Fu, Y. Residual dense network for image super resolution. In Proceedings of the IEEE Conference on Computer Vision and Pattern Recognition, Salt Lake City, UT, USA, 18–23 June 2018. [Google Scholar] [CrossRef]
- Liebel, L.; Korner, M. Single-image super resolution for multispectral remote sensing data using convolutional neural networks. Int. Arch. Photogramm. Remote Sens. Spat. Inf. Sci. 2016, XLI-B3, 883–890. [Google Scholar] [CrossRef]
- Huang, N.; Yang, Y.; Liu, J.; Gu, X.; Cai, H. Single-image super-resolution for remote sensing data using deep residual-learning neural network. In Proceedings of the International Conference on Neural Information Processing, Guangzhou, China, 14–18 November 2017. [Google Scholar] [CrossRef]
- Ren, C.; He, X.; Qing, L.; Wu, Y.; Pu, Y. Remote sensing image recovery via enhanced residual learning and dual-luminance scheme. Knowl.-Based Syst. 2021, 222, 107013. [Google Scholar] [CrossRef]
- Pouliot, D.; Latifovic, R.; Pasher, J.; Duffe, J. Landsat super-resolution enhancement using convolution neural networks and Sentinel-2 for training. Remote Sens. 2018, 10, 394. [Google Scholar] [CrossRef]
- Shermeyer, J.; Van Etten, A. The effects of super-resolution on object detection performance in satellite imagery. In Proceedings of the IEEE Conference on Computer Vision and Pattern Recognition Workshops, Long Beach, CA, USA, 16–17 June 2019. [Google Scholar] [CrossRef]
- Wang, X.; Yi, J.; Guo, J.; Song, Y.; Lyu, J.; Xu, J.; Yan, W.; Zhao, J.; Cai, Q.; Min, H. A review of image super-resolution approaches based on deep learning and applications in remote sensing. Remote Sens. 2022, 14, 5423. [Google Scholar] [CrossRef]
- Lei, S.; Shi, Z.; Zou, Z. Super-resolution for remote sensing images via local–global combined network. IEEE Geosci. Remote Sens. Lett. 2017, 14, 1243–1247. [Google Scholar] [CrossRef]
- Ozturk, O.; Isik, M.S.; Kada, M.; Seker, D.Z. Improving road segmentation by combining satellite images and LiDAR data with a feature-wise fusion strategy. Appl. Sci. 2023, 13, 6161. [Google Scholar] [CrossRef]
- Keshk, H.M.; Abdel-Aziem, M.; Ali, A.S.; Assal, M.A. Performance evaluation of quality measurement for super-resolution satellite images. In Proceedings of the Science and Information Conference, London, UK, 27–29 August 2014. [Google Scholar] [CrossRef]
- Girod, B. What’s wrong with mean-squared error? In Digital Images and Human Vision; MIT Press: London, UK, 1993; pp. 207–220. [Google Scholar]
- Naidu, V.P.S. Discrete cosine transform-based image fusion. J. Commun. Navig. Signal Process. 2012, 1, 35–45. [Google Scholar]
- Wang, Z.; Bovik, A.; Sheikh, H.R.; Simoncelli, E.P. Image quality assessment: From error visibility to structural similarity. IEEE Trans. Image Process. 2004, 13, 600–612. [Google Scholar] [CrossRef]
- Greeshma, M.S.; Bindu, V.R. Super-resolution quality criterion (SRQC): A super-resolution image quality assessment metric. Multimed. Tools Appl. 2020, 79, 35125–35146. [Google Scholar] [CrossRef]
- Medda, A.; DeBrunner, V. Color image quality index based on the UIQI. In Proceedings of the IEEE Southwest Symposium on Image Analysis and Interpretation, Denver, CO, USA, 26–28 March 2006. [Google Scholar] [CrossRef]
- Goudail, F.; Réfrégier, P.; Delyon, G. Bhattacharyya distance as a contrast parameter for statistical processing of noisy optical images. J. Opt. Soc. Am. A 2004, 21, 1231–1240. [Google Scholar] [CrossRef]
Figure 1.
Orthophotos and historical photographs used for the study.

Figure 2.
Eliminating single-band situation.

Figure 3.
Intensity distributions of dataset-1 (left) and dataset-2 (right).

Figure 4.
Training image example in dataset-1 (1600 × 1600) and dataset-2 (512 × 512).

Figure 5.
SRCNN design.

Figure 6.
(a) Comparison between LR, HR, and improved images and (b) comparison between LR, HR, and improved images.
Figure 6.
(a) Comparison between LR, HR, and improved images and (b) comparison between LR, HR, and improved images.


Table 1.
Average values based on quality metrics.
| Quality Metric | Dataset-1 | Dataset-2 |
|---|---|---|
| RMSE | 5.46 | 5.87 |
| PSNR | 33.40 | 32.80 |
| SSIM | 0.8714 | 0.8604 |
| UIQI | 0.9143 | 0.9070 |
| BHATTACHARYYA | 0.023 | 0.026 |
Disclaimer/Publisher’s Note: The statements, opinions and data contained in all publications are solely those of the individual author(s) and contributor(s) and not of MDPI and/or the editor(s). MDPI and/or the editor(s) disclaim responsibility for any injury to people or property resulting from any ideas, methods, instructions or products referred to in the content. |
© 2024 by the authors. Licensee MDPI, Basel, Switzerland. This article is an open access article distributed under the terms and conditions of the Creative Commons Attribution (CC BY) license (https://creativecommons.org/licenses/by/4.0/).
Share and Cite
MDPI and ACS Style
Incekara, A.H.; Alganci, U.; Arslan, O.; Seker, D.Z. Minimizing the Limitations in Improving Historical Aerial Photographs with Super-Resolution Technique. Appl. Sci. 2024, 14, 1495. https://doi.org/10.3390/app14041495
AMA Style
Incekara AH, Alganci U, Arslan O, Seker DZ. Minimizing the Limitations in Improving Historical Aerial Photographs with Super-Resolution Technique. Applied Sciences. 2024; 14(4):1495. https://doi.org/10.3390/app14041495
Chicago/Turabian StyleIncekara, Abdullah Harun, Ugur Alganci, Ozan Arslan, and Dursun Zafer Seker. 2024. "Minimizing the Limitations in Improving Historical Aerial Photographs with Super-Resolution Technique" Applied Sciences 14, no. 4: 1495. https://doi.org/10.3390/app14041495
Note that from the first issue of 2016, this journal uses article numbers instead of page numbers. See further details here.