
Life Cycle Cost Estimation and Analysis of Transformers Based on Failure Rate

School of Energy Power and Mechanical Engineering, North China Electric Power University, Beijing 102206, China
*
Author to whom correspondence should be addressed.
Appl. Sci. 2024, 14(3), 1210; https://doi.org/10.3390/app14031210
Submission received: 29 December 2023
/
Revised: 20 January 2024
/
Accepted: 29 January 2024
/
Published: 31 January 2024
(This article belongs to the Section Applied Physics General)
Abstract
:Transformers, as the hub equipment of the power system, are highly valued by engineering and scientific researchers in production practice and scientific research. The goal of transformer research is to ensure the safe operation of transformers while considering their economic benefits, arrange transformer inspections reasonably to reduce inspection costs, and save labor and maintenance costs reasonably. This study first provides a brief analysis of the life cycle cost of transformers. The life cycle of transformers is divided into initial cost, operating cost, maintenance cost, fault cost, and scrap cost. Based on the distribution of transformer failure rate, the corresponding life cycle cost of transformers is calculated. Taking 110 kV transformers as an example, the differences in the impact of key factors on the full life cycle cost are analyzed to achieve high quality, high reliability, economically optimal equipment procurement.
1. Introduction
With the dynamic advancement of the social economy, electricity has emerged as a pivotal energy source intricately tied to the essential well-being of the national economy and the sustenance of both economic progress and the welfare of the populace. Major power companies shoulder the responsibility of upholding national energy security, fostering the recovery of the real economy, and enhancing the overall quality of life [1]. With the rapid development of power system infrastructure, the requirements for power equipment are also increasing. The traditional equipment management method only focuses on immediate benefits, resulting in poor efficiency in equipment asset management. This model is not suitable for the needs of contemporary development [2]. The novel power equipment management technology focuses on the operation status of the entire life cycle. The life cycle is defined as the time interval between the product concept stage and the product disposal stage, which refers to the time interval between the entire process of product conception, design, manufacturing, installation, commissioning, operation, maintenance, repair, and scrapping [3]. Hence, this innovative power equipment asset management technology has broad prospects in various application scenarios.
Substation equipment occupies a critical role within the power grid system, where both its safety and economic considerations hold paramount significance. Among the most important power equipment is the power transformer. The investment decision on power transformers directly bears on the investment cost, social benefits, and competitiveness of power companies in the face of market-oriented reform. As the power sector invests in the construction of substations, the financial aspect becomes a crucial factor alongside safety considerations [4]. Consequently, there is a collective effort from engineering personnel, scholars, and experts to tirelessly explore and research optimal solutions for substation equipment management. The rapid economic growth in China has led to a substantial increase in electricity consumption for both industrial production and daily life. This surge in demand necessitates the expansion of the power grid, resulting in a proportional growth in substation equipment and its associated facilities [5]. The ongoing energy transition has changed the architecture of electricity networks in ways such that conventional power transformers are not able to cope with the new required functionalities. Solid-state transformers (SSTs) have emerged as a superior alternative to conventional transformers and are regarded as the building block of the future smart grid. David Cervero [6] analyzed and summarized the future trends and challenges of SST technology being more widely implemented in the power grid. Saniya Khan [7] discussed the application and recent applications of SSTs as a substitute for low-frequency transformer (LFTs), and explored the future challenges of the real-time implementation of SSTs and proposed research directions. Nuno Santos [8] focused on researching high-frequency transformers in solid-state transformers, especially the steps of designing and optimizing high-frequency transformers and their equivalent models based on the required characteristics. The efficient management of substation equipment not only demands the implementation of effective technical monitoring and analysis of the equipment, but also necessitates judicious management strategies and economically prudent personnel allocation to optimize cost savings. The advancement in transformer condition-based maintenance, and the scientific and economic management of transformers are intricately linked to the examination of transformer failure rates and the analysis of the life cycle cost of transformers [9]. Electric power construction not only needs to consider the initial construction cost of the project, but also needs to comprehensively consider the operation and maintenance costs [10]. On the basis of ensuring power supply safety and reliability, investment costs should be minimized to the greatest extent possible [11]. Due to the complex structure and multiple types of faults in power transformers, scholars at home and abroad have classified the faults of power transformers into different types based on their properties. (1) According to the main structure of transformers, power transformer faults are divided into winding faults, iron core faults, insulation oil faults, and accessory faults. (2) According to the division of transformer fault-prone areas, transformer faults are divided into insulation faults, iron core faults, and tap changer faults. (3) From the circuit division of transformers, transformer faults can be divided into circuit faults, magnetic circuit faults, and oil circuit faults. In the study of fault statistics based on a large number of transformers, a three-layer fault tree model corresponding to transformers was established with transformer structure as the main auxiliary and transformer prone fault areas. Transformer faults are divided into seven categories: lead fault, winding fault, iron core fault, bushing fault, oil conservator fault, tap switch fault, and other faults. For each fault category, causal logical relationships are searched and corresponding bottom events assigned from a large number of fault events, and the occurrence of bottom events leads to the occurrence of intermediate events. Subsequently, the probability importance analysis in fault tree analysis is used to assign corresponding weights to each bottom event, and then the transformer failure rate is obtained through probability statistics of the event and the corresponding top event calculation formula. The corresponding distribution of transformer failure rate is drawn through the estimation model of transformer failure rate, the maintenance interval of the transformer is determined based on the distribution map, and the corresponding full life cost of the transformer is further calculated. Finally, a more accurate estimate of the full life cycle cost is obtained, which assists in transformer selection and arrangement of transformer maintenance during substation construction.
Life cycle cost (LCC) pertains to the comprehensive expenditure incurred by a system or equipment over its entire life cycle, encompassing the direct, indirect, and recurring costs associated with its design, research and development, manufacturing, utilization, maintenance, and support [12]. This encompasses all one-time and related expenses until the eventual decommissioning of the system or equipment. The culmination of all these one-time and interrelated costs provides a comprehensive understanding of the economic implications involved in the entire life cycle of the system or equipment, shaping decision-making processes and financial planning until its eventual retirement. LCC management has three major characteristics: full system, full cost, and full process. Among them, the whole system refers to the comprehensive consideration of costs in different stages such as planning, design, infrastructure, and operation, with the overall benefits as the starting point, in order to seek the best solution. Full cost is the consideration of all costs that may arise, seeking a balance between appropriate availability and full cost. The entire process is to consider the entire life cycle from planning and design to scrapping, and it is required to ensure the application of the LCC method from an institutional perspective. As far back as 1904, Sweden [13] laid the groundwork for the comprehensive consideration of life cycle costs in railway construction. It was not until 1947, however, that the United States formally instituted the value analysis method, marking the inaugural application of the LCC concept in both technical and economic analyses [14]. Despite these early initiatives, it took until the latter half of the 20th century for the global community to recognize and earnestly delve into the significance of LCC. This period witnessed extensive and profound research, leading to the widespread adoption of the LCC concept across diverse sectors such as transportation, construction, energy, aerospace, and electricity. The ensuing years have seen its integration into a plethora of applications, demonstrating the enduring impact of this approach on informed decision making and sustainable development. As we step into the 21st century, scholars have extended the application of the entire life cycle concept across diverse domains. Notably, American scholar D. Senthil Kumaran [15] has introduced the concept of life cycle environmental cost analysis (LCECA). This approach transcends the conventional focus solely on the product’s direct costs, delving into both the direct and indirect environmental implications throughout its lifespan. Accompanying this concept are sophisticated calculation models designed to enhance the cost-effectiveness of a product’s production process while concurrently minimizing its environmental footprint. This innovative perspective underscores a commitment to sustainable practices by addressing both economic efficiency and environmental impact in tandem.
The LCC theory made its debut in China in 1987, initially finding application in the navy, subsequently extending to the air force and the second artillery force. Primarily, the military pioneered the practical implementation of this theory. It is noteworthy that the exploration of life cycle cost theory in China commenced relatively late. The full integration of the life cycle cost concept into the Chinese landscape took place in 2008 when the State Grid Corporation of China adopted the approach and initiated research on corresponding methodologies [16,17]. This marked a pivotal moment, guiding nationwide maintenance efforts across power systems at all levels. Domestic scholars are gradually considering LCC in their research on power systems. Although the research on LCC started relatively late in China, many domestic scholars have actively proposed a large number of cost control solutions for LCC based power systems. This has laid a solid foundation for the future development of China’s power industry. The LCC theory has achieved considerable results in research and application both domestically and internationally, but inevitably has some limitations and shortcomings, especially in cases where more emphasis is placed on the theoretical research of LCC and there is a lack of practical application. Practical cases of LCC application in the power industry in China are even rarer [18]. To ensure the smooth achievement of expected benefits in power engineering, it is first necessary to do a good job in project cost calculation and analysis, as well as project management. However, many large- and medium-sized power companies have found that there are still many problems in cost management analysis in the planning and construction of new substations. The many shortcomings in analysis and the outdated management thinking mode remain in the traditional design or construction mode, only focusing on the operating costs of the substation construction stage, without truly focusing on the analysis of the completion settlement stage, decision control stage, and operation preparation stage, resulting in a lack of systematic rationality in the process of the project cost–benefit analysis [19].
The traditional equipment management method only focuses on immediate benefits, and the efficiency of equipment asset management is low, which can no longer adapt to the development of the times. Full life cycle cost management, with a development perspective, regards the activities of power grid equipment throughout its entire life cycle as the management object, avoiding short-sighted behavior. Therefore, this new type of power grid equipment asset management technology has broad application prospects. Therefore, the research work of this article is guided by the theory of the entire life cycle, considering the dynamic changes in funds over time, and proposes a reasonable equipment cost prediction and analysis method, which can quickly provide reference direction for reasonable investment planning, provide analysis basis for effective resource allocation, and avoid the problem of project cost exceeding budget.
2. Materials and Methods
This study focuses on analyzing the basic data on equipment operation provided by a northern power company from 2016 to 2021 and collected procurement information of transformers of the same model provided by the same supplier in different years, mainly including material costs, outsourcing maintenance costs, labor costs, operating costs, etc. It is crucial to ensure the accuracy and completeness of data before fitting the full life cost of equipment. The calculation data used in this study are the basic data of various asset equipment obtained by the northern power company from PMS, EPR, ECP, and other systems. The main function of a 110 kV transformer is to convert high voltage in the power grid into low voltage, or convert low voltage into high voltage, in order to meet the voltage needs of different users. The 110 kV transformers account for a very high proportion of equipment so, in this study, we selected equipment with this voltage level as the case study object for analysis. The 110 kV transformers play an important role in the power system, as they can meet the voltage requirements of users, achieve long-distance power supply, ensure the stability of the power system, store energy, and achieve energy conservation and emission reduction. This study takes a typical equipment transformer as an example. The specific parameters of the transformer are shown in Table 1.
2.1. Life Cycle Cost Analysis
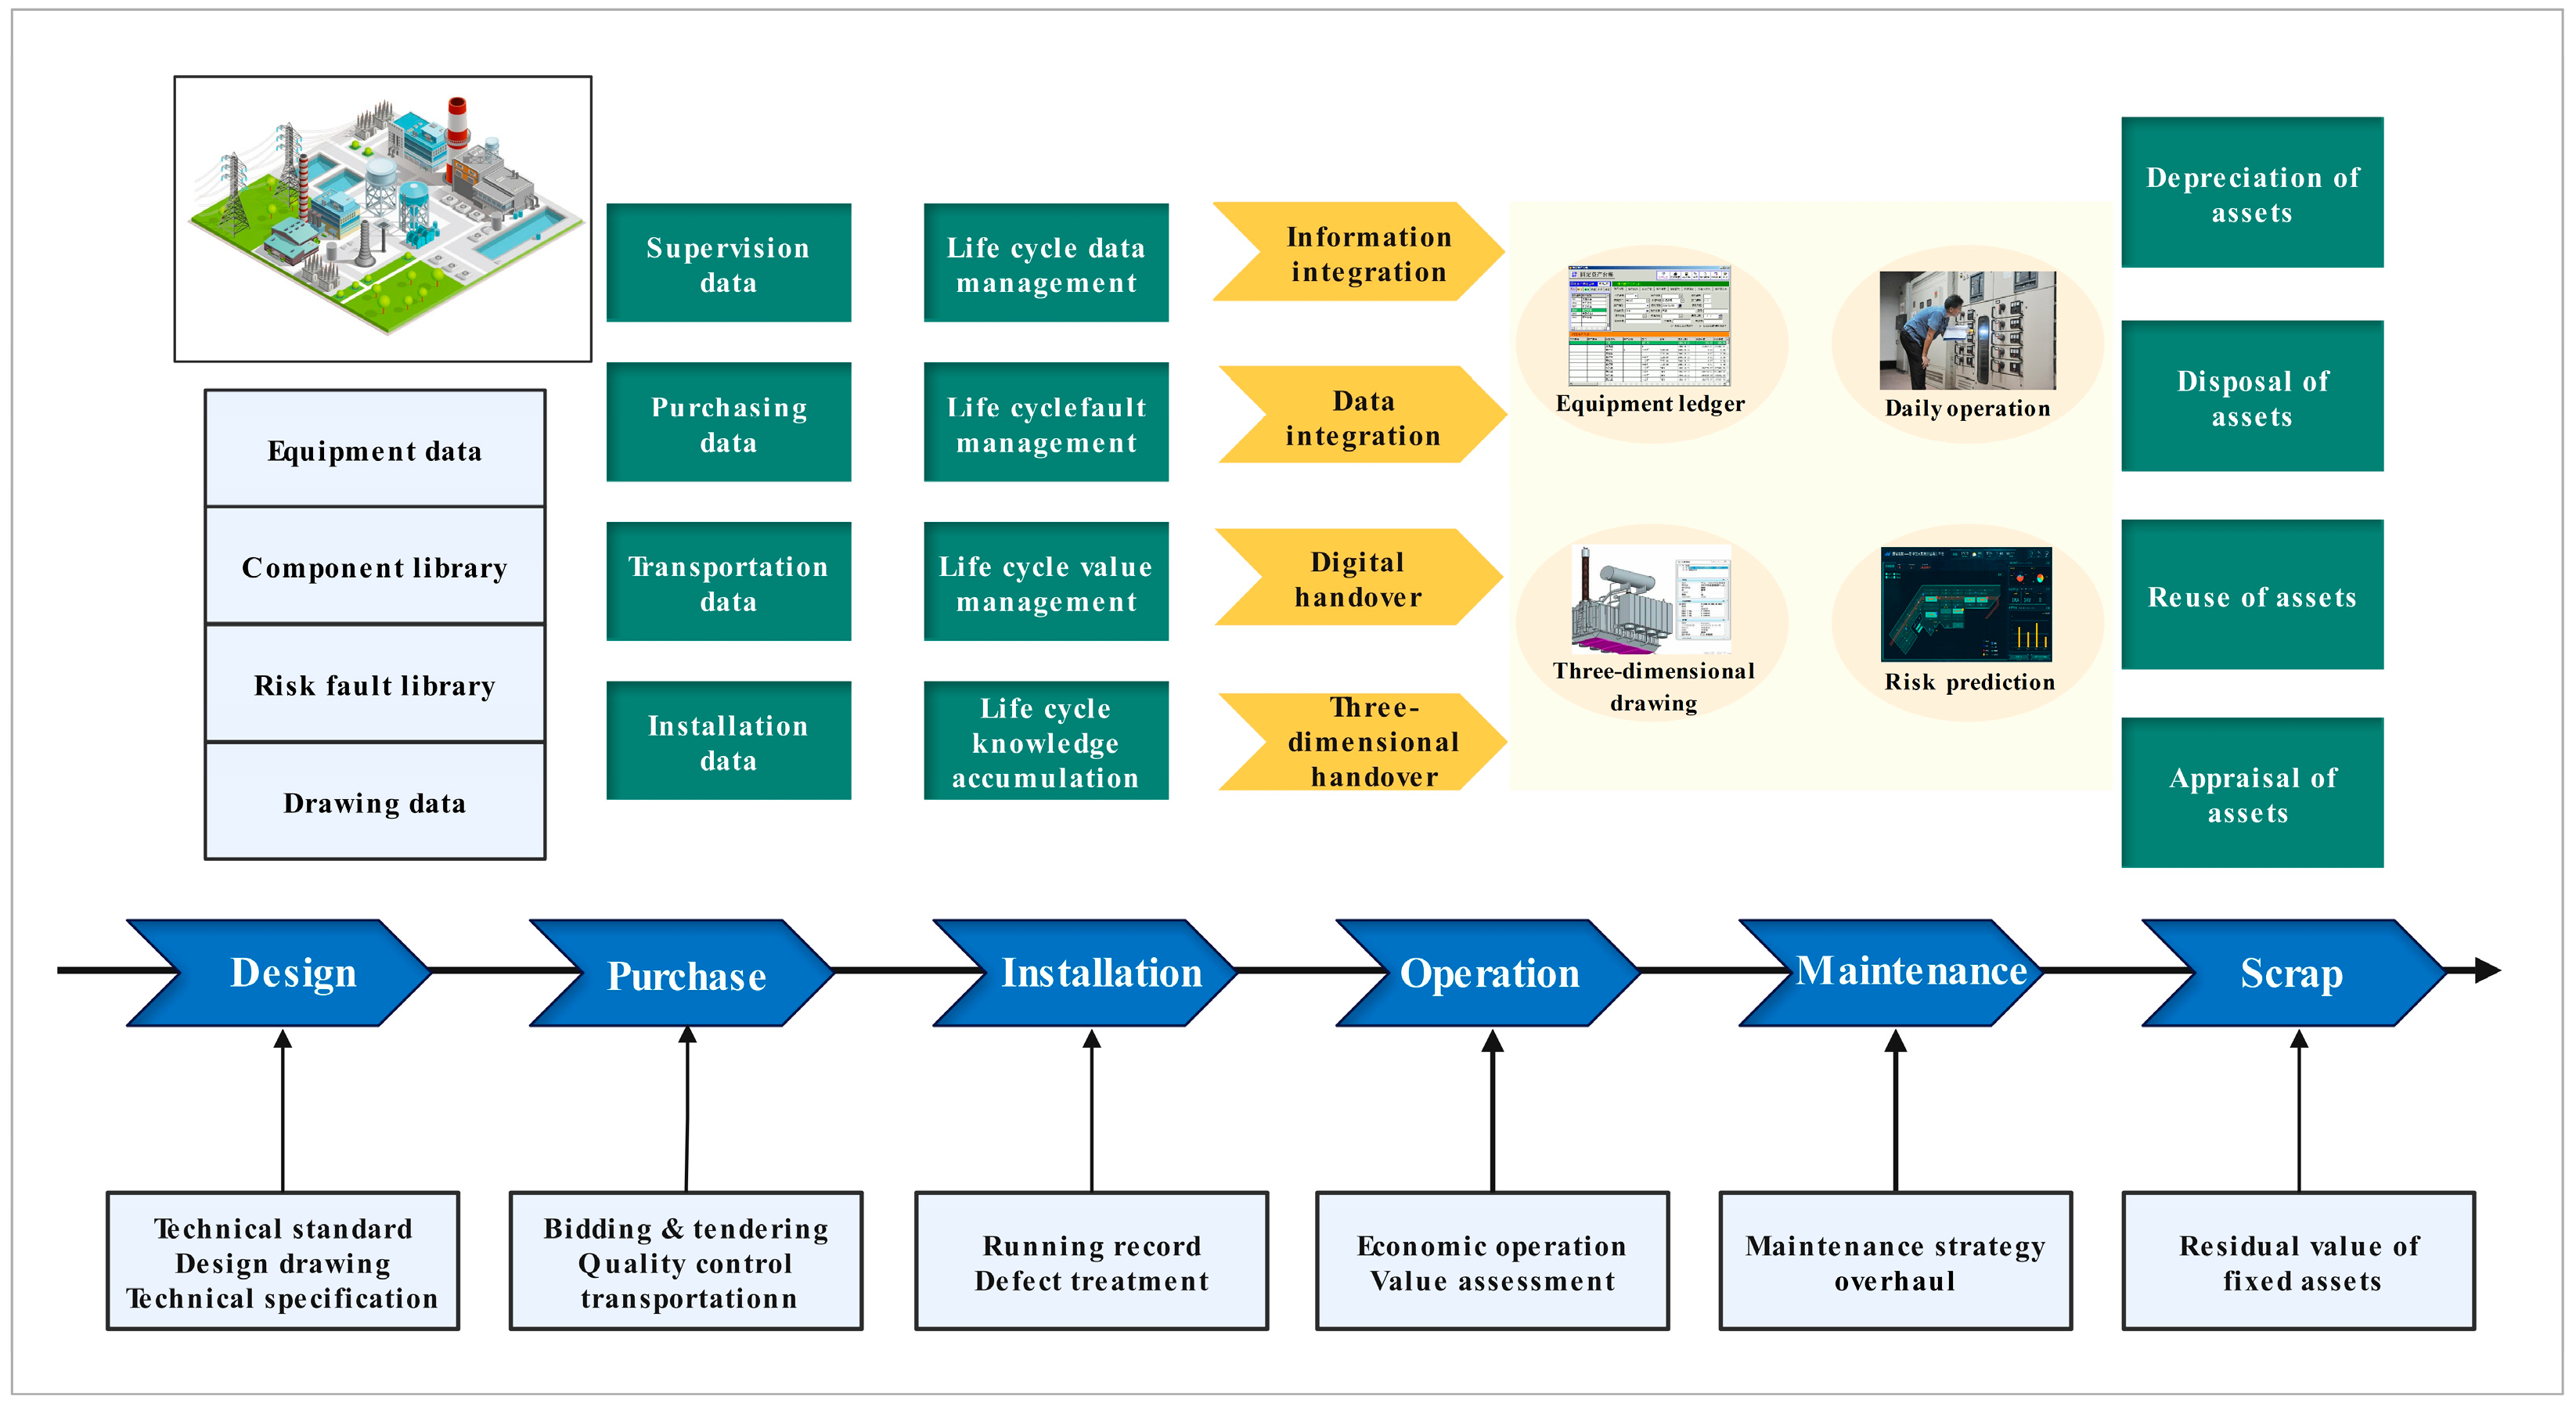
The life cycle of electrical equipment includes the entire process of equipment from design planning to transportation to designated locations for installation and operation, as well as various maintenance, technical improvements, troubleshooting, and decommissioning during use. Any link in the entire life cycle requires a certain amount of expenditure and the sum of these expenses is called the life cycle cost. This cost is no longer a single acquisition cost; it includes other direct costs and various indirect costs beyond the acquisition cost [14]. The specific diagram is shown in Figure 1.
The paradigm of life cycle cost management has ushered in a transformative shift in the decision-making processes of enterprises, steering away from solely prioritizing the initial investment cost of individual equipment. This approach transcends the conventional focus on one-time procurement expenses and embraces a more comprehensive perspective, accounting for the entirety of costs incurred throughout the operational lifespan of the equipment. In doing so, life cycle cost management recognizes that the true economic impact extends beyond the initial investment, encompassing a spectrum of expenses entailed during the equipment’s operational tenure [20]. This nuanced consideration empowers enterprises to make more informed and sustainable procurement and selection decisions, strategically factoring in the holistic financial implications over the entire life cycle of the equipment. The best advantage from the comprehensive cost-effectiveness of the equipment is found, so that the power equipment we ultimately purchase can obtain the lowest cost option throughout the entire life cycle while meeting the availability of production and operation. Fueled by the growing emphasis on energy conservation and market development, power industry enterprises are actively advocating for the study of equipment life cycle cost. This approach aims to harmonize power demand with the judicious allocation of resources and expenses.
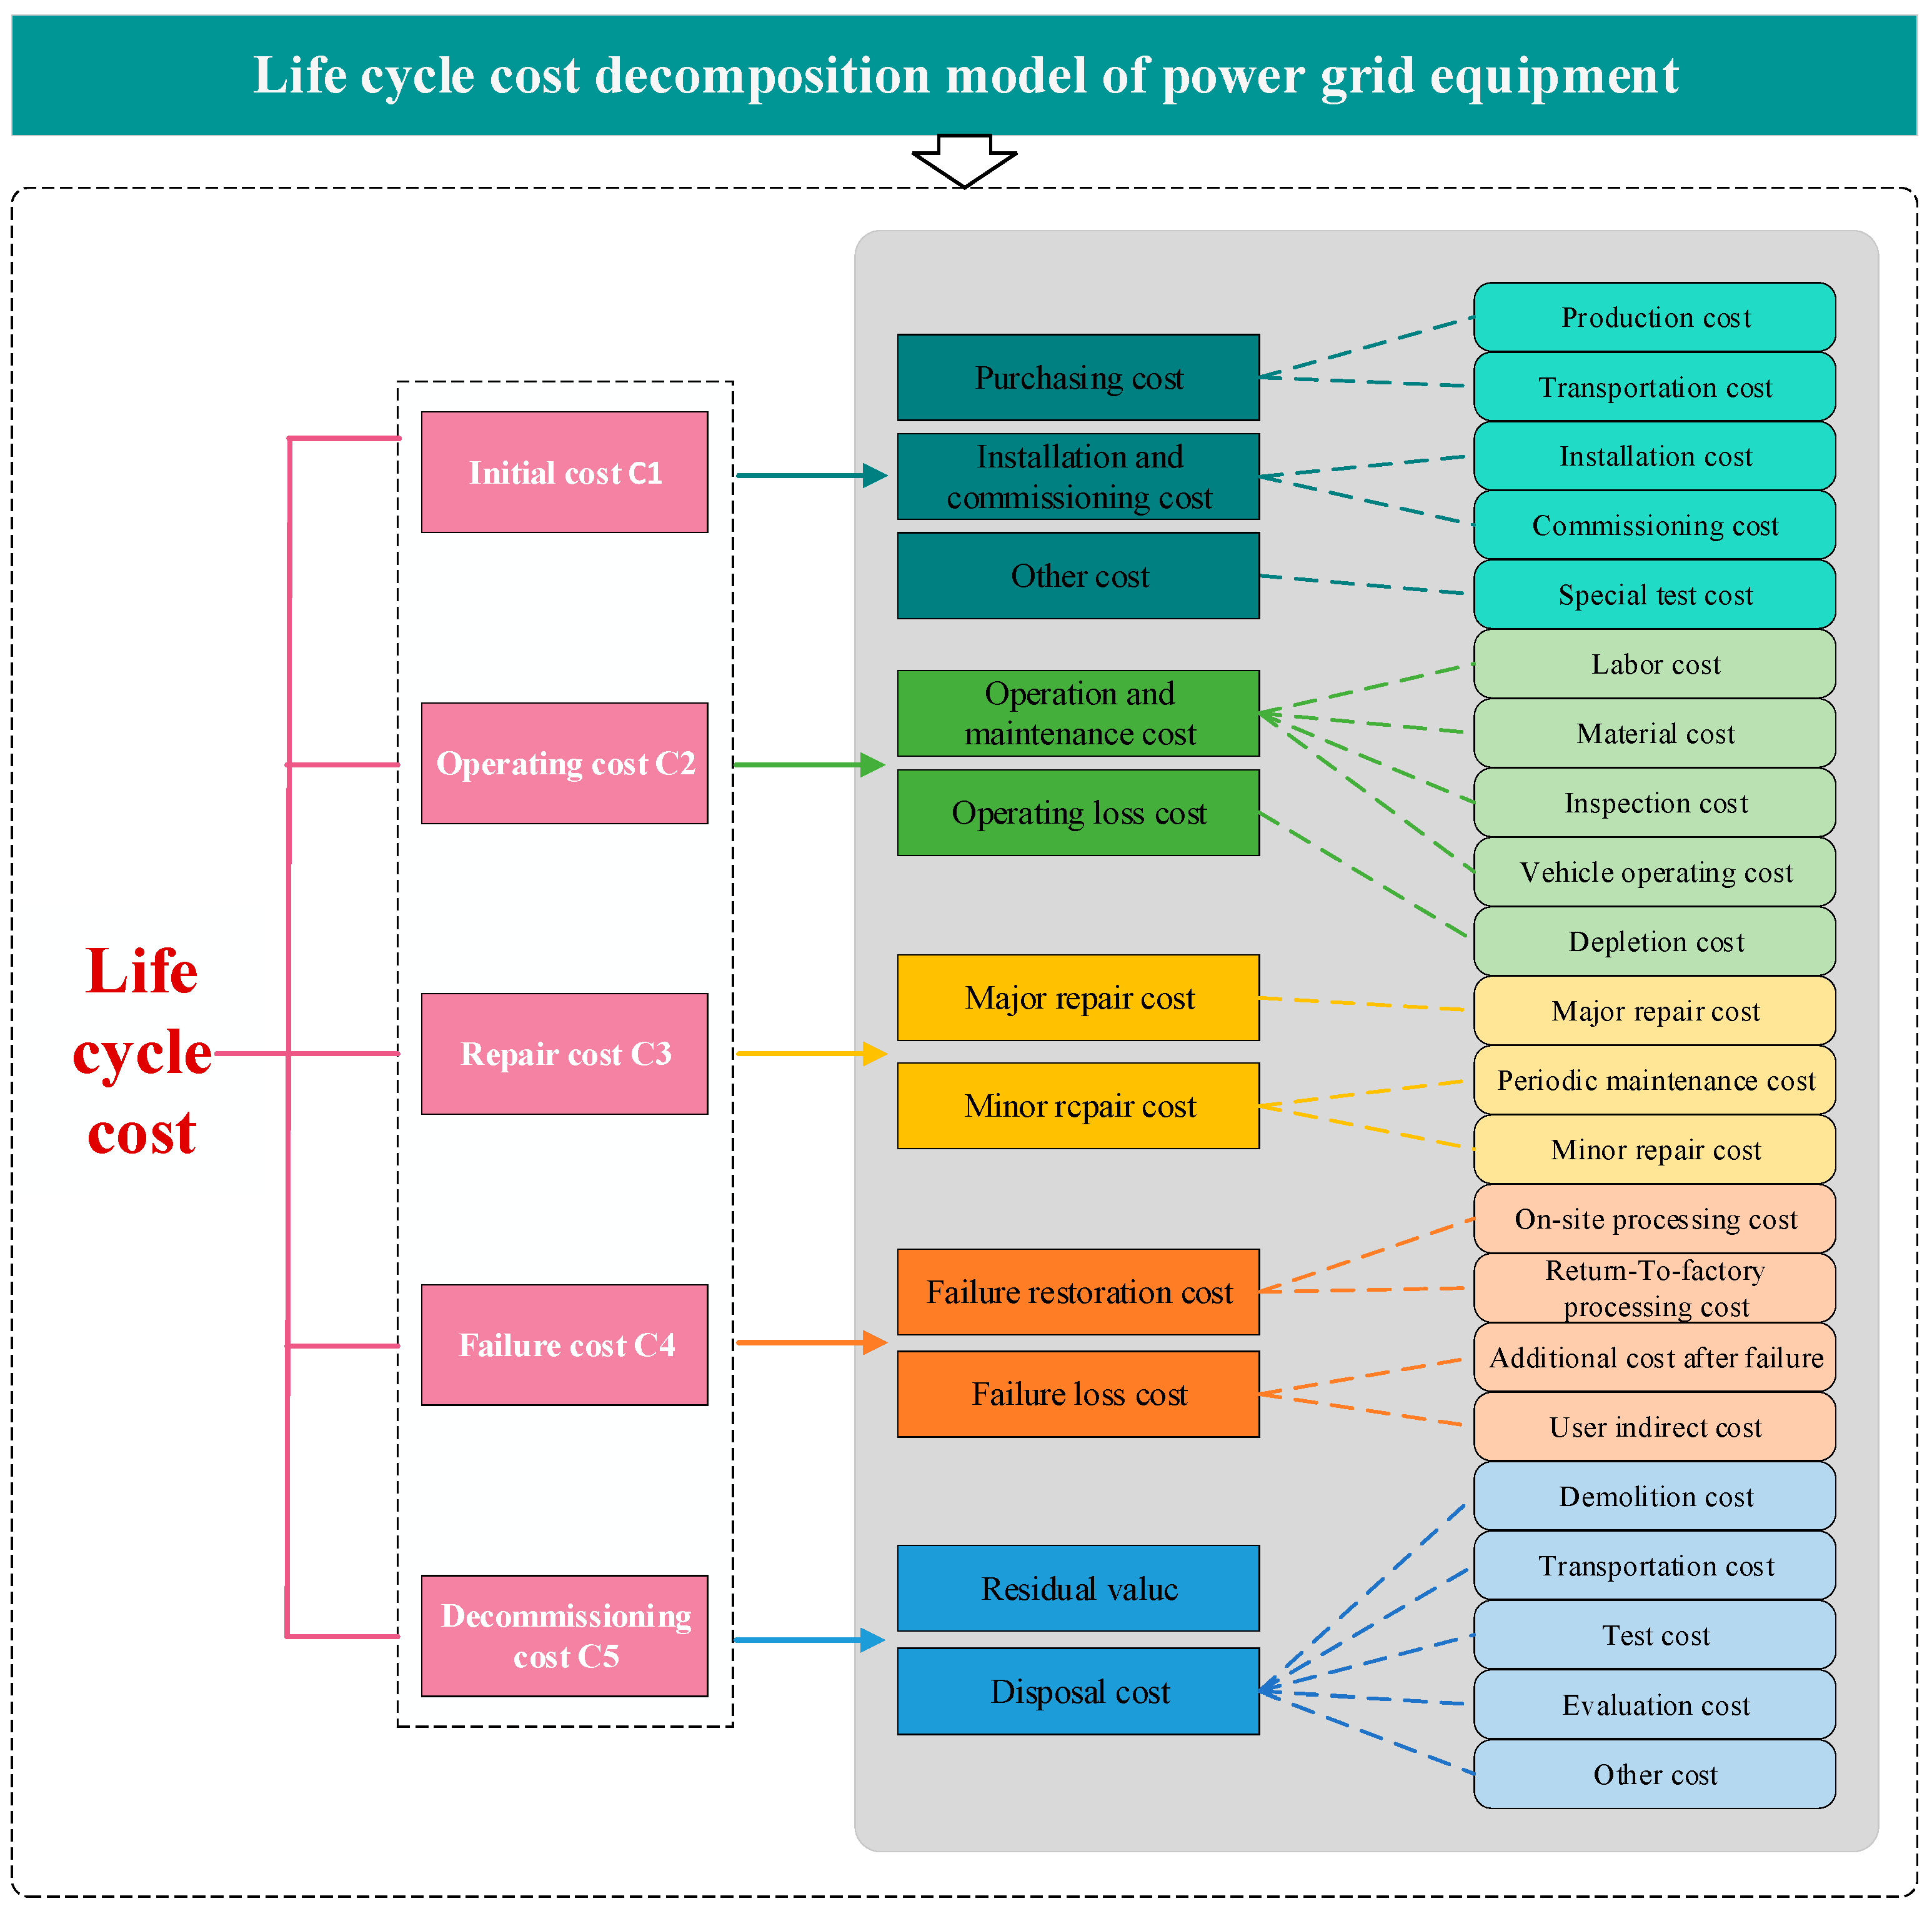
In this study, we use transformers as an example to construct a life cycle cost measurement model. According to LCC theory, in order to clarify the cost types of the entire life cycle of assets, and achieve quantitative analysis and application of production costs, LCC calculation divides costs into five stages for calculation: initial investment, operation and maintenance, maintenance, failure, and recovery disposal costs. The specific calculation formula is as follows:
- (1)
- Initial cost C1
The initial investment cost of transformers is the cost expenditure before the equipment is put into operation. This article will make LCC costs more comprehensive and refined, and divide the initial investment cost into procurement and construction costs, installation and debugging costs, and other expenses. The cost estimation model is as follows [21]:
where Cep is the equipment purchase cost; Cic is the installation and commissioning cost; and Coc is other cost. The purchase cost of equipment mainly includes the bid winning price, and the installation and debugging cost mainly includes the owner’s transportation cost, construction and installation cost, and debugging cost. It can usually be calculated at 6.2% [22] of the equipment purchase cost, while other costs mainly include equipment debugging cost, which can be calculated at 11.8% [22] of the equipment purchase cost.
- (2)
- Operating cost C2
The operating cost refers to the cost of maintaining the normal operation of the transformer during its lifespan from operation to scrapping, including energy consumption cost and maintenance cost. For the cost of operating maintenance, factors such as labor compensation, maintenance costs, and insurance premiums have been considered as CPI increases, and the model has been improved. The operating cost model is as follows [22]:
where Col is the operation loss cost, and Com is operation and maintenance cost. The specific mathematical model of the machine operation and maintenance cost is as follows [21]:
where P0 is the no-load loss; Pw is the load loss; Pf is the auxiliary loss; is the average load rate, which can take a value of 70%; Pr is the comprehensive electricity prices, the general value of which is CNY 0.56/kW·h; is the annual load loss rate, with a value of 0.608; Com(t) is the cost of equipment operation and maintenance in year; R is the social discount rate; and r is the rate of inflation.
- (3)
- Repair cost C3
The repair cost includes both major and minor repairs. The cost of each inspection and maintenance includes the equipment, material fees, and service fees that the supplier needs to provide for the activity. This also includes the owner’s equipment, material costs, and labor costs in this activity [21].
where λ(t) is the failure probability of the power transformer and p(t) is the probability of power transformer major repair; then, 1 − p(t) is the probability of minor repair. Cmaj(t) represents the average cost of a major repair; Cmin(t) represents the average cost of a minor repair; N indicates the operating years; tmaj is the power transformer overhaul cycle; µ is the overhaul ratio rate of increase in cases; and indicates taking not greater than , the largest integer.
- (4)
- Failure cost C4
The cost of transformer failure refers to the cost of losses caused by power shortage or power interruption due to transformer failure, including failure recovery costs and failure loss costs. The cost of failure recovery includes the cost of removing failure equipment, transporting failure transformers, and installing new equipment. The cost of failure losses is an indirect loss caused by power outages, damage to the company’s reputation, and social impact and responsibility, which can be converted based on multiple electricity prices [21].
where α is the value of the average interrupted power supply of the user, which varies with the region where the user is located; W indicates that equipment failure interrupts the power supply; T is the annual failure interruption power supply time of the equipment; λ(t) is the annual average number of equipment failures; Cr is the average repair cost of failure equipment; MTTR is the mean time to repair; and Cd represents the compensation cost for unit power outage time.
- (5)
- Decommissioning cost C5
The decommissioning cost of transformers mainly includes the cost of scrapping and the residual value of transformers. Scrap cost refers to the labor, equipment costs, transportation costs, and environmental protection costs incurred during transformer retirement disposal. Residual value refers to the recoverable cost of a transformer after being scrapped. As transformers are material intensive products, their value mainly depends on the consumption of main materials such as silicon steel sheets, copper materials, and transformer oil. The residual value of a transformer after being scrapped is very high, usually reaching 5% of the purchase cost.
where Cdd is the decommissioning disposal cost before conversion; Csc is the scrap cost; and Ccz is the residual value when the equipment is decommissioned.
According to the status of most power companies, referring to LCC-related theories and expert discussion conclusions, the cost decomposition principles for each stage have been established as shown in Figure 2. The initial investment cost C1 is calculated based on the bidding results of the same type of equipment in the previous year and the investment estimation of the plan. Due to the unified accounting and indivisibility of operation and maintenance costs (C2 + C3), they will be merged and calculated. Failure cost C4 refers to a series of expenses incurred due to a power outage or emergency shutdown caused by a failure, which requires immediate restoration of operational status. C4 draws inspiration from the quantitative results of production costs and calculates the cost expenses incurred by similar equipment in recent years. If the relevant operation records of failure repair costs and maintenance costs are consolidated and cannot be separated, the failure disposal cost can be merged into the maintenance cost (C3). The disposal cost C5 of decommissioning can be collected through the ERP and ECP system waste material disposal modules. Decommissioning disposal cost refers to the cost incurred during the decommissioning or scrapping of equipment, which is mainly composed of equipment scrap cost and equipment salvage value. Under normal circumstances, the equipment scrap cost is 32% of the installation and commissioning cost. The salvage value is calculated at 5% of the purchase cost.
2.2. Failure Tree Analysis
Failure tree analysis (FTA) is a systematic and quantitative risk assessment and reliability analysis method mainly used in engineering, aerospace, nuclear energy, chemical, healthcare, and other fields to identify and evaluate the likelihood and risks of potential failures, accidents, or events within a system or process [23]. Failure tree analysis is typically applied to study complex systems or processes where significant events or accidents may occur. These events can be equipment failures, safety incidents, system failures, and so on.
In failure tree analysis, basic events are irreducible events that serve as the starting points for the analysis. Basic events can represent specific failure modes, failure conditions, or the occurrence of a particular event. Failure trees are represented using a tree-like structure where the root node represents the event of interest (e.g., system failure), and branches depict various possible pathways leading to that event. The relationships between pathways are described using logical gates such as AND gates (indicating that all branch events must occur) and OR gates (indicating that at least one branch event must occur) [24]. FTA is used not only for qualitative analysis but also for quantitative analysis. By assigning probabilities or probability distributions to each basic event, it is possible to calculate the probability of a specific event occurring within the system or process. This helps assess system reliability and risk. Through the analysis of the failure tree, it is possible to assess the risk level of specific events within the system or process. This aids in identifying potential risk factors and taking preventive measures to reduce or eliminate these risks.
The failure mode analysis method analyzes various failure situations of all components that make up the system one by one and determines their impact on the entire system [25]. The failure severity analysis method is a support for the failure mode analysis method, which comprehensively considers the failure rate and corresponding failure consequences of a failure to evaluate the degree of harm of a certain failure mode. Failure tree analysis collects a large number of failure relationships and analyzes the causal relationships of events from top to bottom, establishing a logical AND/OR relationship between events and ultimately establishing a failure analysis structure. Failure tree analysis is widely recognized as a simple, effective, and most promising method in safety and reliability engineering [26].
The main research content of this article is to draw the corresponding distribution of transformer failure rate through more accurate estimation of transformer failure rate, so as to determine the maintenance interval of the transformer based on the transformer distribution map and further calculate the corresponding full life cost of the transformer. Finally, a more accurate estimation of the life cycle cost can be obtained to assist in transformer selection during substation construction arrangement of transformer maintenance and determination of the optimal retirement period for transformers.
3. Results
3.1. Failure Rate Analysis
Through data analysis, we have learned that many power companies still use a more frequent regular maintenance mode. Regular maintenance itself does not consider the condition of power equipment, including its own condition and the surrounding natural environment, and only arranges regular maintenance of transformers based on historical data over the years [27]. Disoperation by personnel during the maintenance process can easily cause damage to the transformer, which may lead to a decrease in the service life of the transformer. Moreover, due to the blindness of regular maintenance, it is easy to waste manpower and financial resources [28]. At present, the power grid is in a stage of rapid expansion and the quality of the corresponding first-line inspection personnel of the power company is still uneven, with fewer excellent first-line inspection personnel. Based on the above reasons, it is necessary for enterprises to change their previous regular maintenance mode to condition-based maintenance mode. The development of condition-based maintenance requires the progress of online monitoring and diagnosis technology, and the reasonable evaluation of transformer status.
Therefore, the analysis and estimation of transformer failure rate is particularly crucial. Accurate analysis of transformer failure rates and prediction of future transformer failure rates can enable power companies to arrange inspection personnel in a timely and reasonable manner, saving a lot of unnecessary inspection costs, and manpower and resources [29]. At the same time, accurate analysis of the transformer failure rate can reasonably plot the distribution of the transformer failure rate over time, which provides a technical basis for introducing life cycle cost management and operating transformers [30]. In this study, based on the fitted distribution of transformer failure rates, the maintenance and failure costs of the transformer throughout its entire life cycle are estimated.
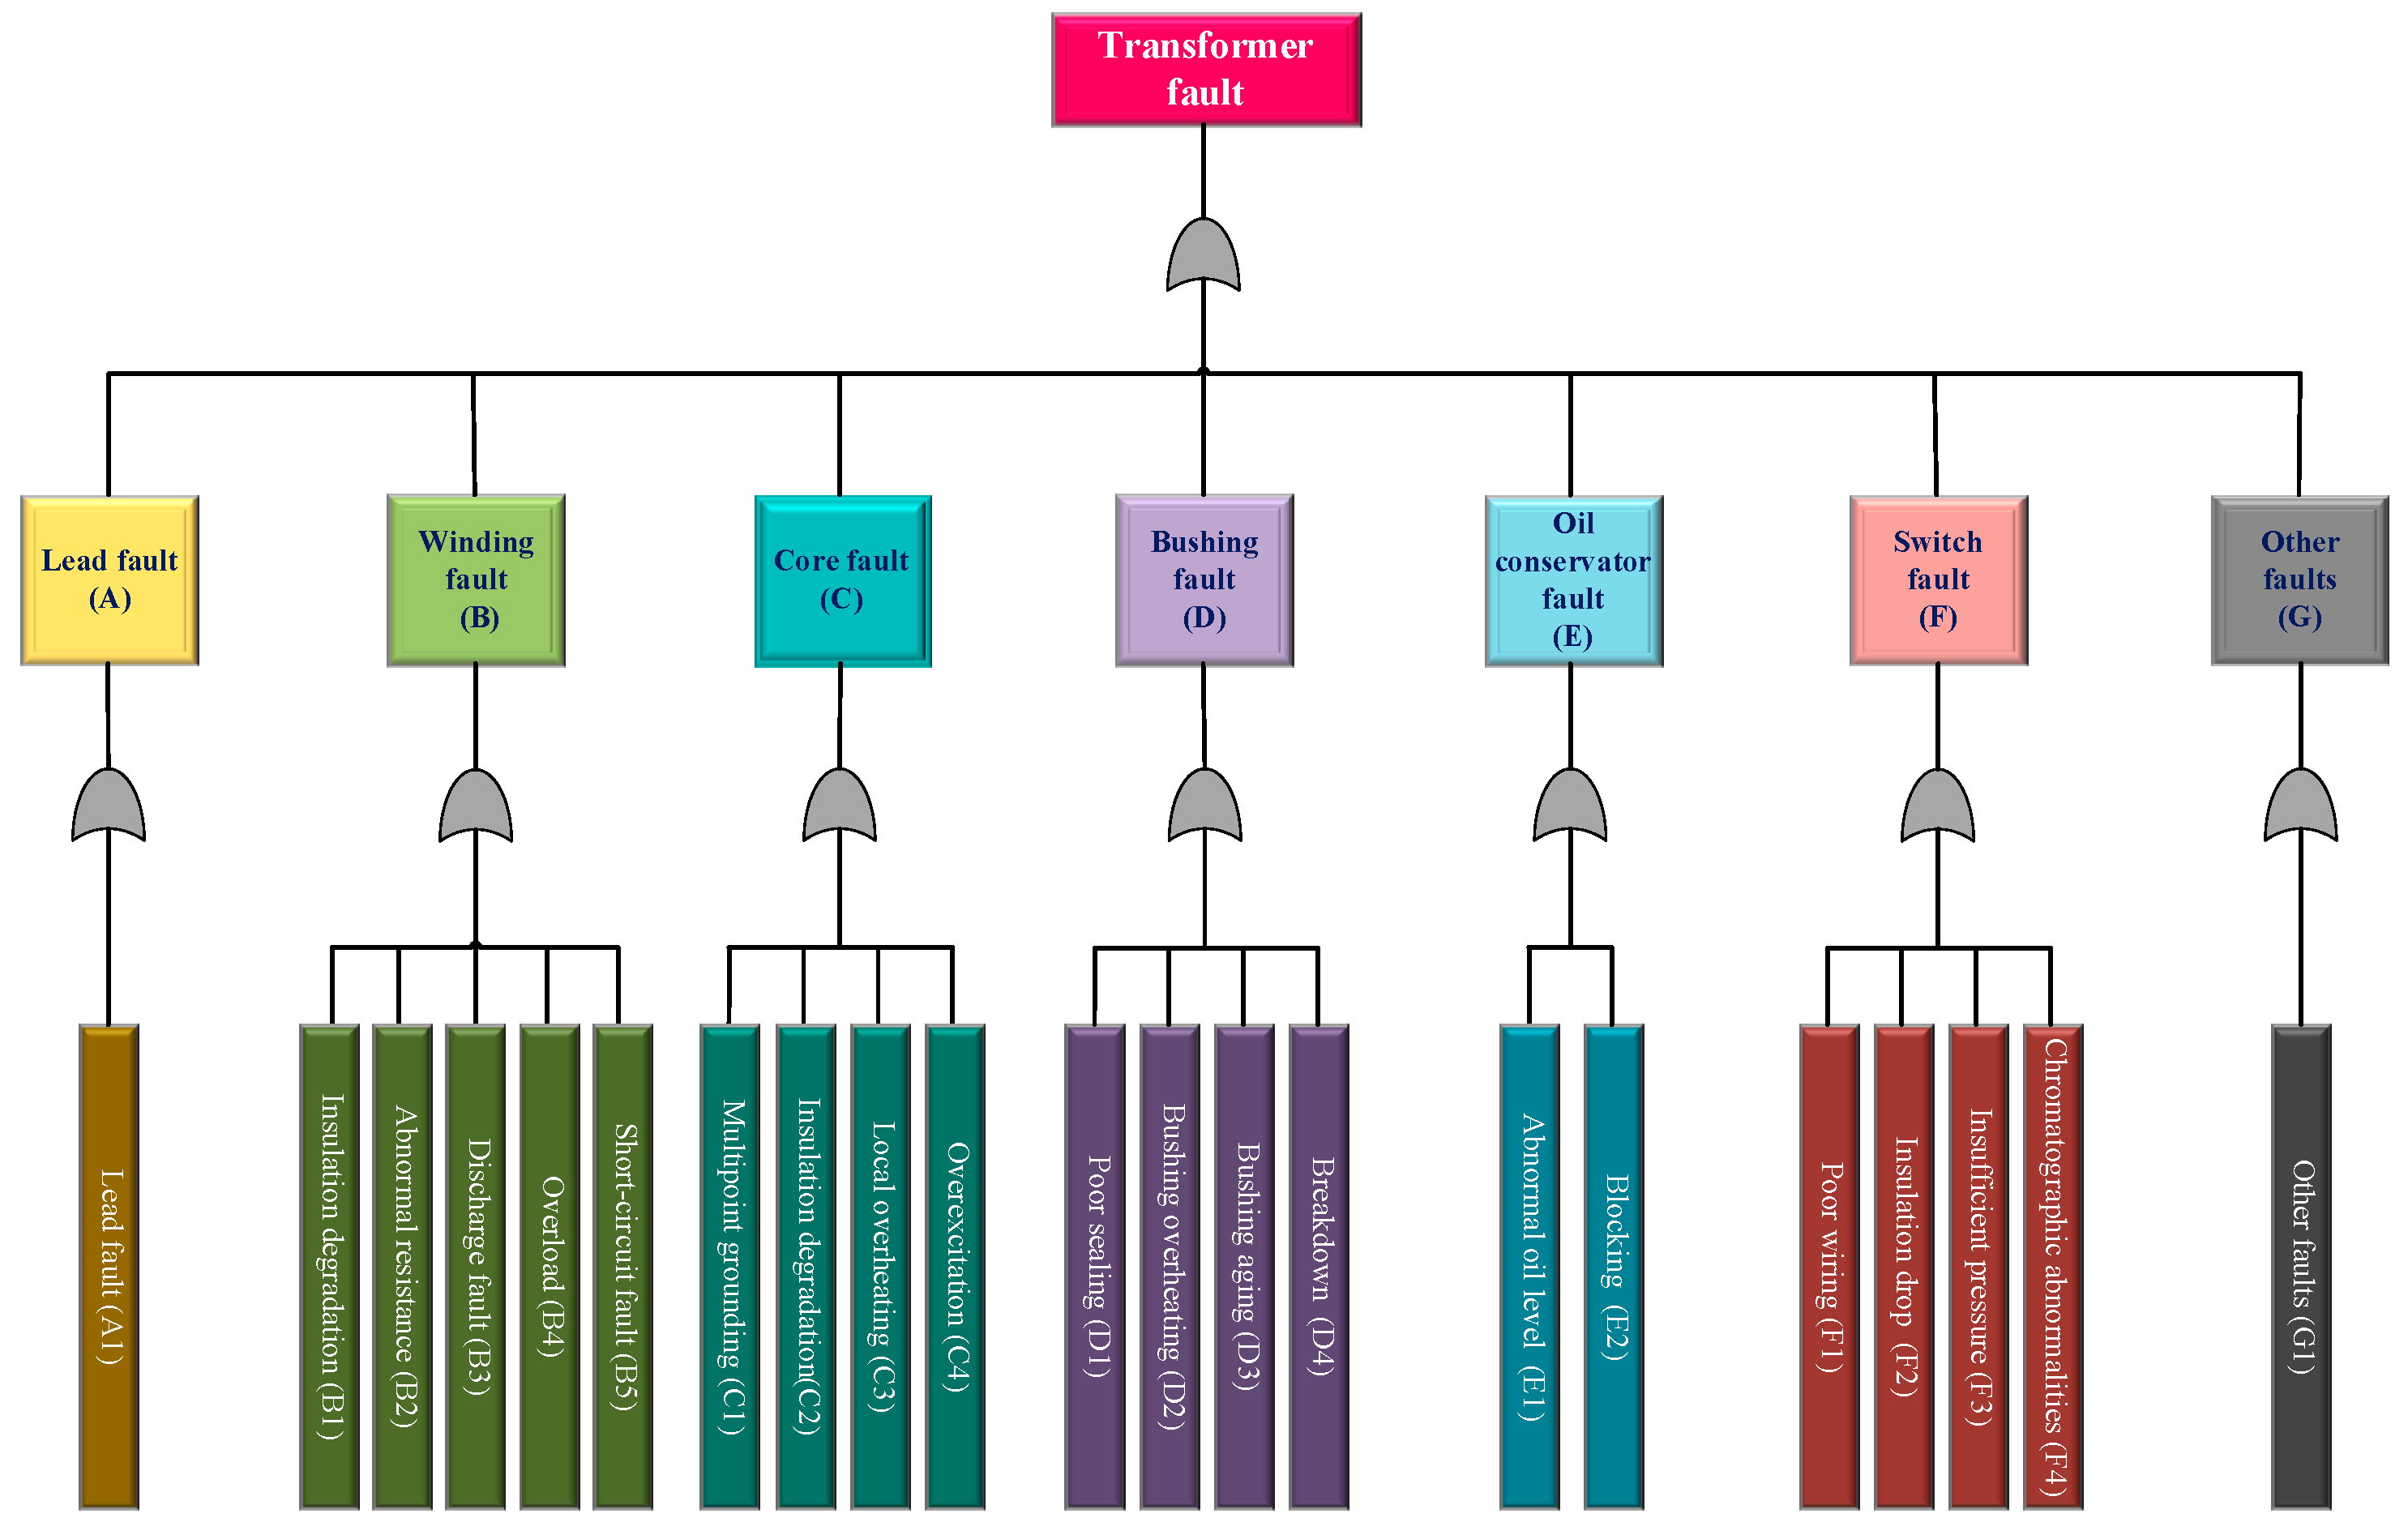
In this study, we combined other scholars’ classification methods for transformer failures and followed the analysis steps and principles of failure trees. Considering the vulnerability areas of transformers, it treats the occurrence of transformer failures as the top event, denoted as “T”. The transformer failures are categorized into several major types, including lead failures, winding failures, bushing failures, on-load tap changer failures, cooling system failures, protective device failures, and core failures, totaling seven major categories [31]. For these seven major failure categories, further subdivisions are made based on the structural characteristics of various components. Failure events that cannot be subdivided further are referred to as the bottom events of the failure tree. After analyzing and obtaining all these events, a transformer failure tree is established based on the logical relationships between them.
The occurrence of each bottom event will lead to the occurrence of intermediate events, and the occurrence of each intermediate event will lead to the occurrence of top events. Therefore, the logical relationship of each level of event is an AND gate relationship, that is, the occurrence of each bottom event will lead to the occurrence of its top event. Finally, the logical relationship of each event in the failure tree is obtained, resulting in the schematic diagram of the failure tree shown in Figure 3.
In reliability engineering, there are various models that describe the failure rate of electrical equipment, and commonly used models include the exponential model, normal model, will model, etc. According to statistical analysis, it can be seen that the transformer has just been put into operation. There will be a brief period of high failure rate during use, followed by a period of over 10 years of maintenance. In a low failure rate operating state, the failure rate has been increasing exponentially year by year. These three periods can be summarized as the failure period, accidental failure period, and failure loss period, and meet the classic bathtub curve. In this study, the Weber distribution is considered as the theoretical basis of the reliability analysis and life test, the distribution is used as a descriptive function of the transformer failure rate distribution, and the parameters to be estimated are estimated in the Weber distribution.
Based on the actual operational and maintenance data of the transformer and the data on defects and failures, determine the parameters and distribution functions of the assumed distribution. The failure rate of transformers based on Weibull distribution can be written as [32]:
where k is the shape parameter and is the scale parameter. When k < 1, the failure shows a downward trend; when k = 1, the failure rate is constant; and, when k > 1, the failure rate shows an upward trend.
The Levenberg Marquardt algorithm [33] can provide numerical solutions for minimizing numerical nonlinearity (local minimization). This algorithm can combine the advantages of the Gaussian Newton algorithm and gradient descent method by modifying parameters during execution, and improve the shortcomings of both (such as the absence of the inverse matrix of the Gaussian Newton algorithm or the initial value being too far from the local minimum). Assume the form of an unknown nonlinear relationship is expressed as follows:
where x represents the independent variable and a represents the parameter to be estimated.
Firstly, we need to expand the nonlinear relationship based on Taylor’s formula. Substitute in the i-th observation value: . And assign an initial value to all parameters a: . This results in the following expression:
According to the principle of least mean squares, let the Q function be the following:
Let the Q function take the partial derivative of all unknown parameters and set the partial derivative to 0. We obtain an iterative form of the equation system, substitute a set of initial parameter values a and corresponding resistance factor d, set the corresponding pre- and post-iteration stop thresholds, and, when the accuracy requirements are met, stop the iteration. We can consider the last iteration value as the estimated value of the parameter.
The operation and maintenance methods of transformers and the occurrence of failures will directly affect their operational reliability, maintenance costs, and maintenance costs, thereby affecting the entire life cycle cost. The growth rate of equipment operation and maintenance costs may change over time. In some years, cost growth may be relatively slow, while in other years it may accelerate. These changes may be influenced by equipment usage, maintenance quality, or other external factors. Drawing a trend chart of equipment operation and maintenance costs over time is helpful in analyzing the overall trend and possible patterns of data. By analyzing the trend of data and using the method of data fitting, the operation and maintenance costs of equipment under different operating years are predicted. Based on statistical and historical data, using the corresponding failure-rate-based calculation method mentioned above, the corresponding transformer failure rates of different service ages can be obtained by repeating the calculation process. By analyzing the probability importance score in failure tree analysis, corresponding weights are assigned to each bottom event, and then the transformer failure rate is obtained by calculating the probability statistics of the event and the corresponding top event formula. After fitting using the Marquard method, the corresponding parameters k = 4.551 and = 28.1820 are obtained. Therefore, there is a corresponding distribution of failure rates:
3.2. Life Cycle Cost Fitting
According to LCC theory, in order to clarify the cost types of the entire life cycle of assets, and achieve quantitative analysis and application of production costs, LCC calculation divides costs into five stages for calculation: initial investment, operation and maintenance, maintenance, failure, and recovery disposal costs. The measurement of equipment life cycle cost is a comprehensive issue that needs to consider multiple stages such as equipment procurement, operation, maintenance, and scrapping. It takes a long time (usually 20–30 years) to complete the collection of life cycle costs, and the data that companies can effectively collect is generally within 10 years, which cannot provide detailed data on equipment procurement, operation, maintenance, and recycling throughout the entire life cycle. In the absence of complete and reliable historical data, it is difficult to accurately evaluate past costs and predict future costs. In the measurement of full life cycle costs, it is necessary to quantify various costs, including direct and indirect costs. The incompleteness, inaccuracy, and inconsistency of historical data directly affect the accuracy of the evaluation, modeling, and measurement of the entire life cycle cost. As can be seen from the above, establishing a complete cost measurement model for the entire life cycle of equipment under nonsound information, and obtaining effective and reliable LCC fitting curves is one of the difficulties in this study.
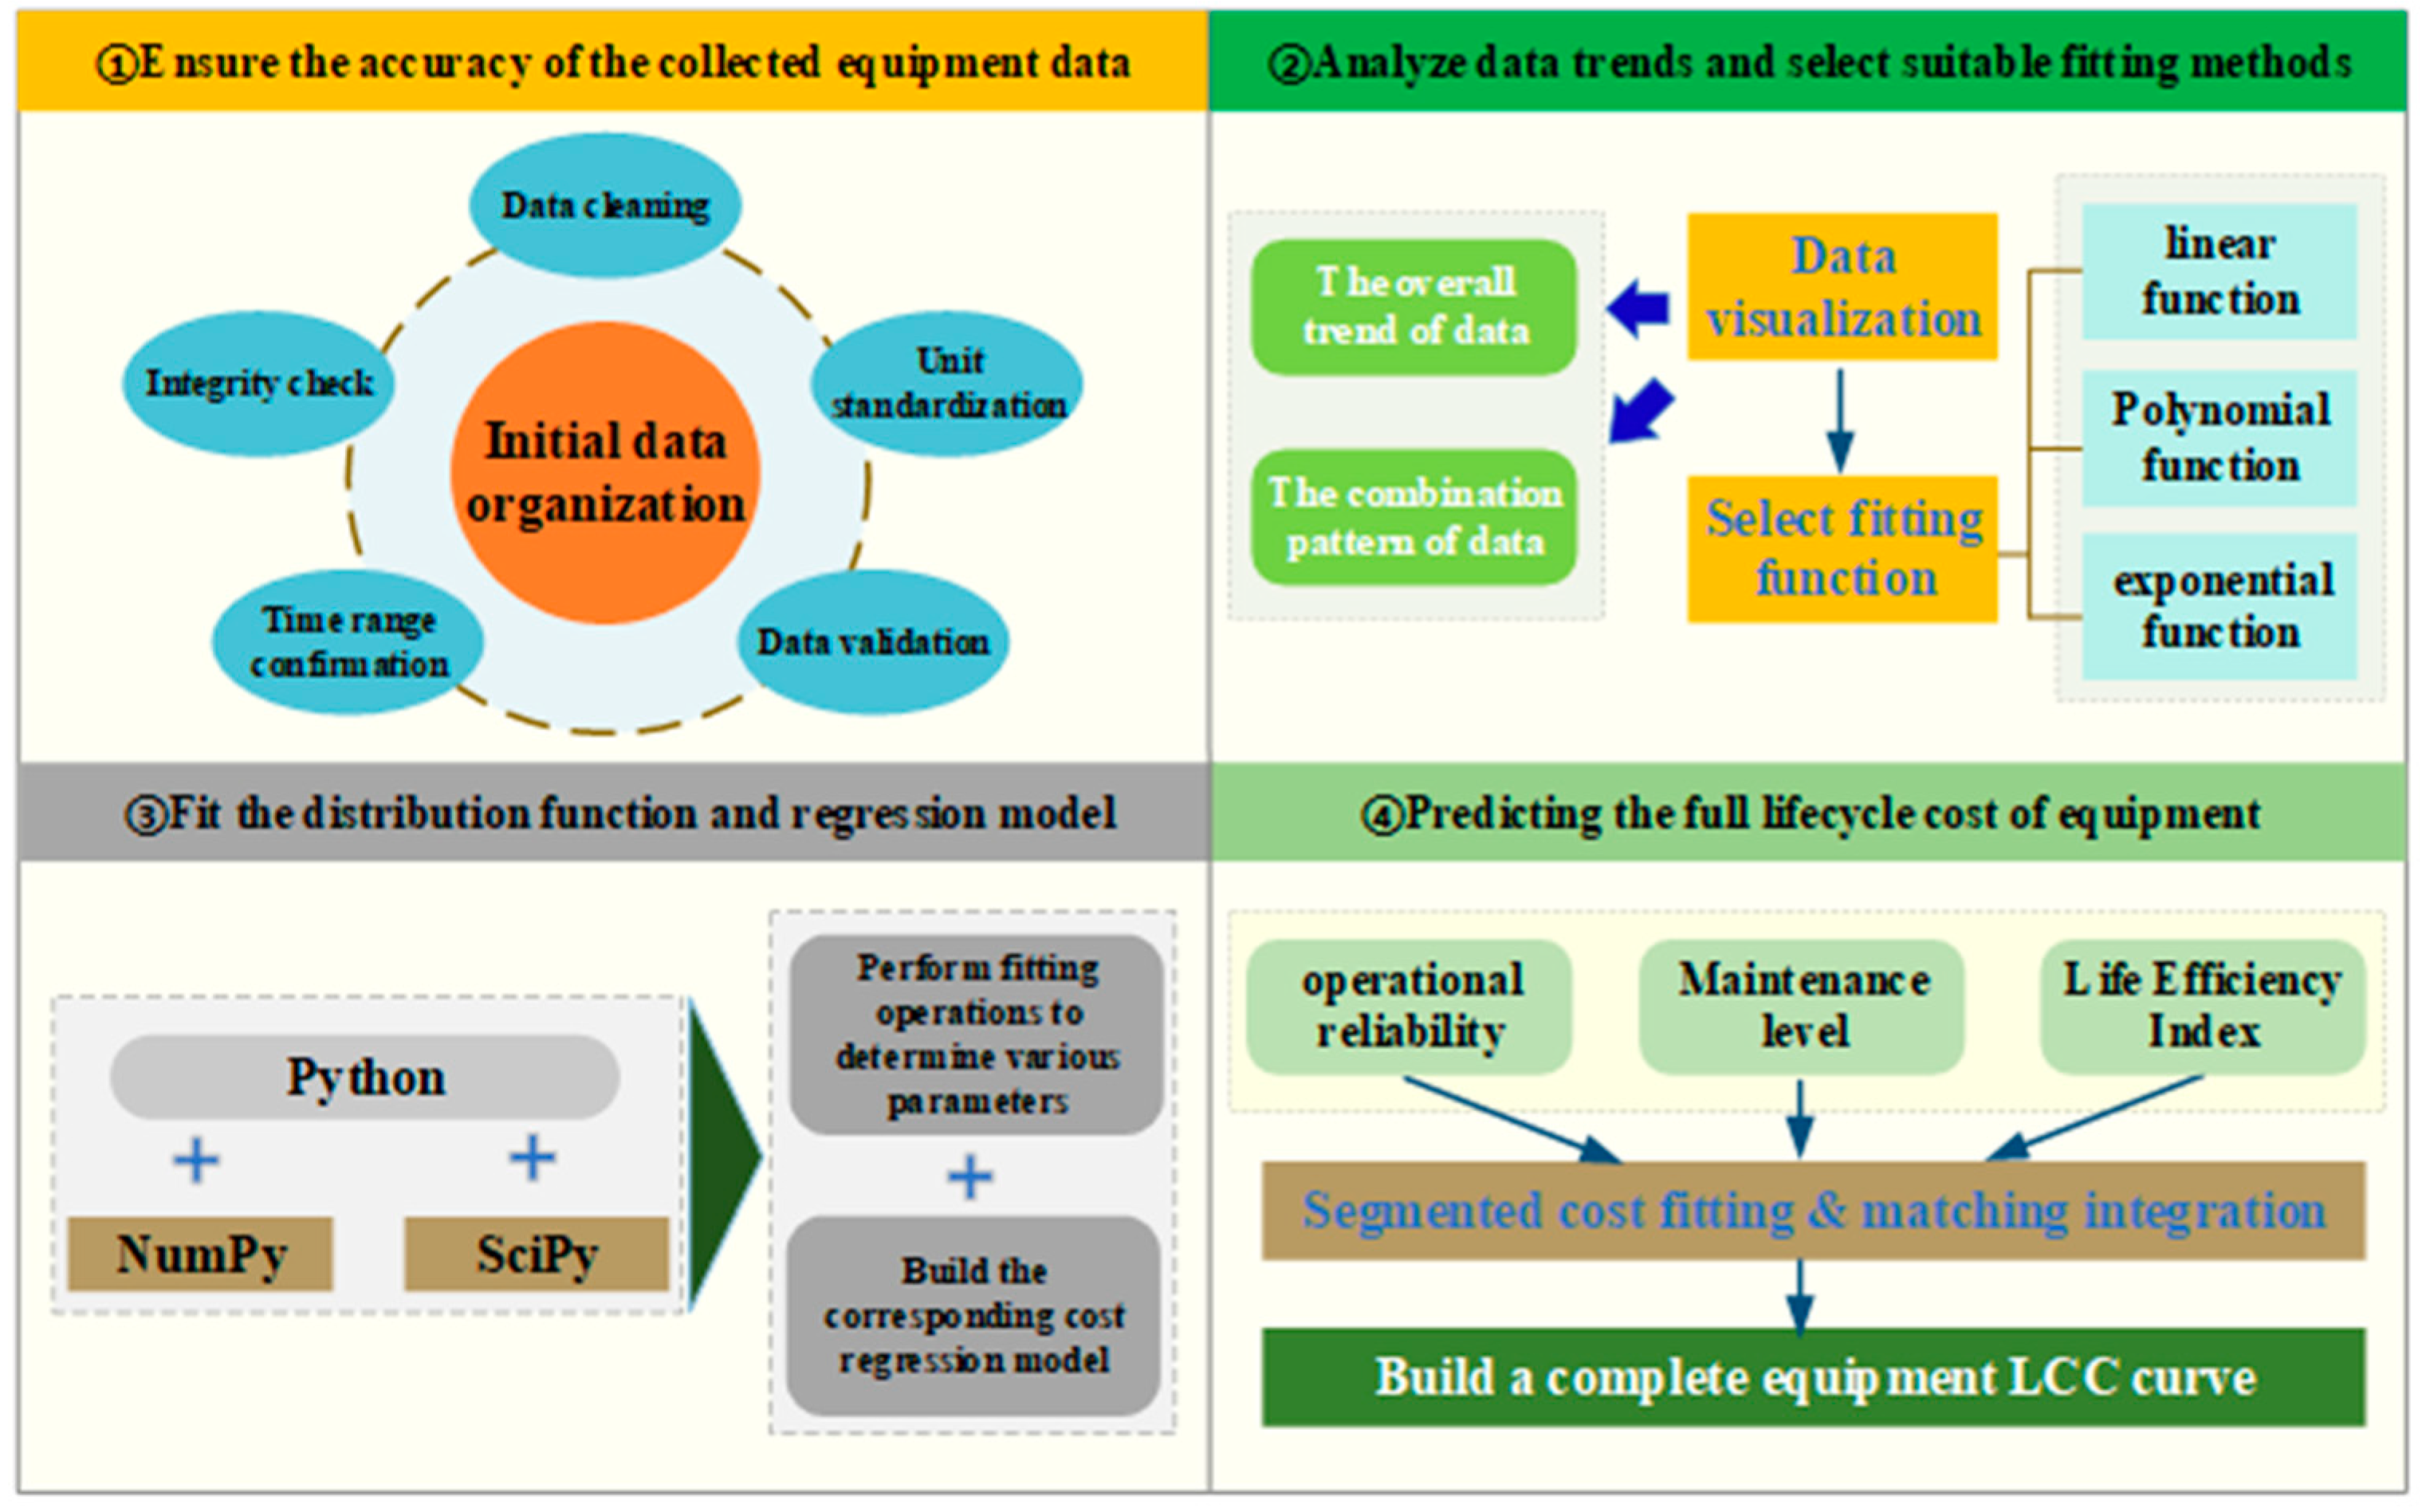
As shown in Figure 4, the research route of this study includes organizing data, analyzing data, fitting data, and predicting costs. Based on detailed data provided by a northern company for 2016–2021, we analyzed the overall trend and possible patterns of equipment operating, maintenance and failure costs over time. Based on the characteristics and trends of the data, we selected an appropriate fitting function to fit the functions of equipment operating, maintenance, and failure costs over time, in order to measure the life cycle cost of the transformer.
Firstly, we processed the data provided by a northern power company from 2016 to 2021 to ensure the reliability and accuracy of subsequent data analysis. (1) Integrity check: we checked for any missing years or data points to ensure that the dataset is complete. (2) Data cleaning: we cleaned up any outliers or erroneous data in the data, including duplicate records, outliers, or data points that did not match the actual situation. (3) Unit standardization: we ensured that all cost data adopted unified units and measurement standards. (4) Data validation: we compared the data with other reliable data sources or related records to verify the accuracy of the data. (5) Time range confirmation: we ensured that the time range of the data matched the required analysis period. By following the above steps, we ensured the accuracy of the collected equipment operation and maintenance cost data, and laid a solid foundation for subsequent analysis and fitting work.
Subsequently, we plotted the corresponding distribution map of the transformer failure rate and the trend chart of operating costs, maintenance costs, and failure costs (C2 + C3 + C4) over time by estimating the transformer failure rate. This helps to observe the overall trend and possible patterns of the data, thereby determining the maintenance interval and various maintenance costs of transformers. And, based on the characteristics and trends of the data, we selected an appropriate fitting function and further calculated the corresponding transformer life cost.
Then, we used the programming language Python to perform fitting operations, select the most suitable parameters, and construct a cost fitting model. Finally, we used the fitting model to predict the operating costs, maintenance costs, and failure costs (C2, C3, C4) of the entire life cycle of the equipment. Based on the equation of the model and the expected service life of the equipment, we calculated the estimated values of C2, C3 and C4. Finally, the LCC calculation formula LCC = C1 + C2 + C3 + C4 + C5 is used to predict the equipment’s life cycle cost.
Based on the predicted transformer failure rate and maintenance cost distribution over the years, the maintenance and failure cost of the transformer throughout its life cycle (C2 + C3 + C4) were obtained. Then, the assembly cost of each category was matched and integrated. The life cycle cost of a typical transformer was predicted under the constraints of operation reliability, maintenance level, and life efficiency index. The specific cost prediction results are shown in Table 2.
4. Discussion
Generally speaking, the initial procurement cost of transformer equipment with high voltage level, large rated capacity, and large size and weight is often relatively high. However, in the evaluation of the life cycle cost, we need to consider multiple factors, including procurement cost, operating cost, maintenance cost, and waste disposal cost.
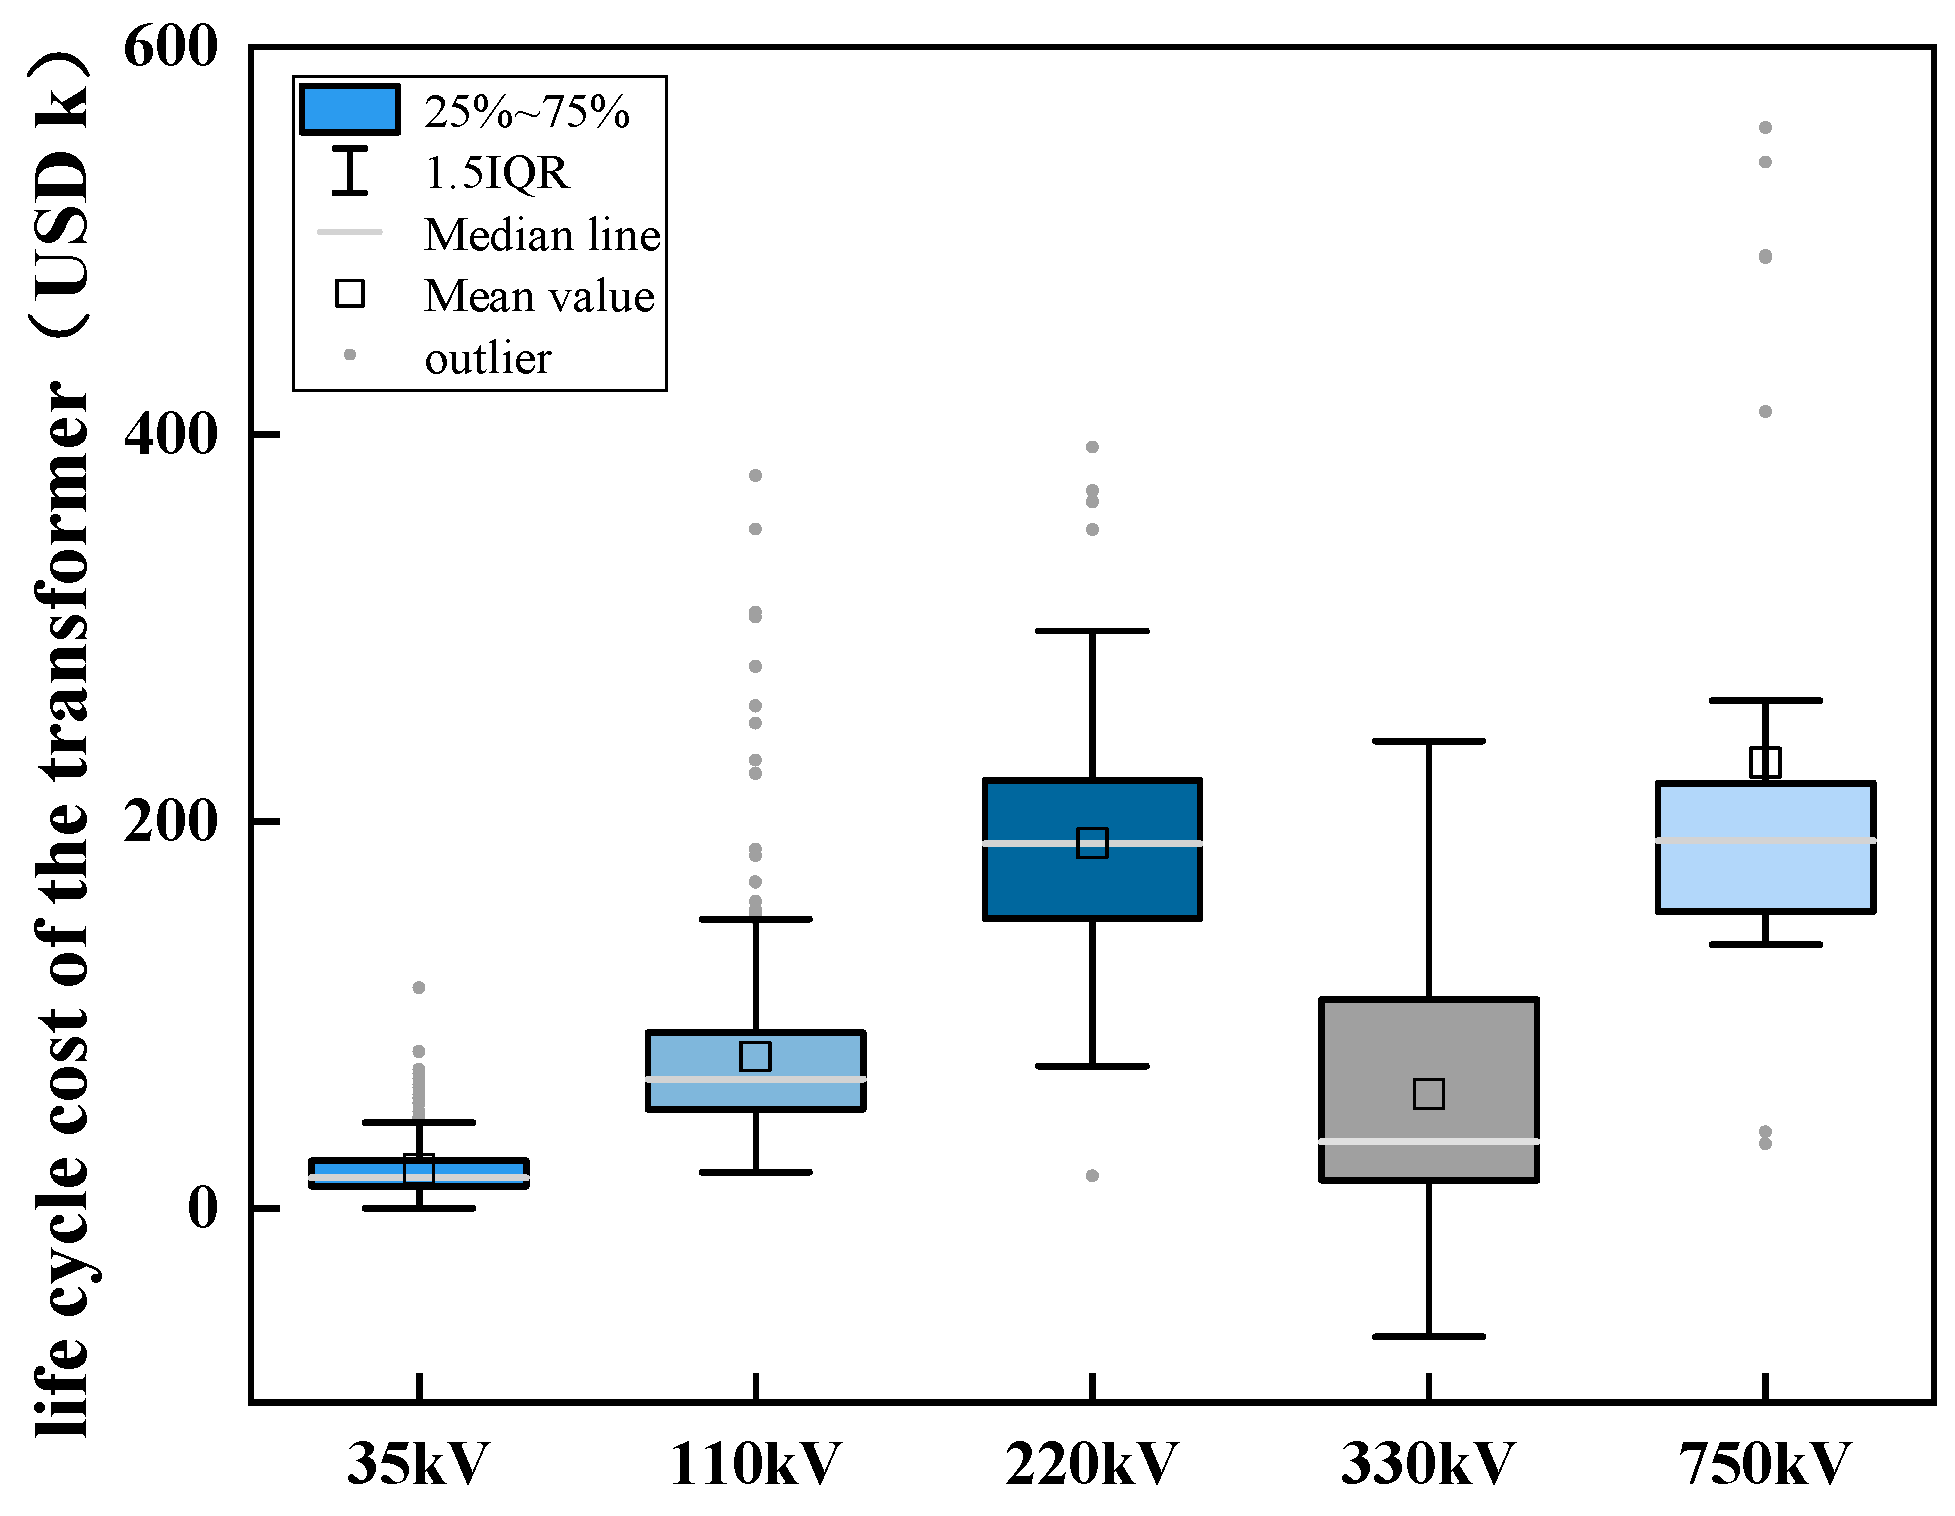
Therefore, we first compared the full life cost of five transformers and observed the trend in changes in full life cost under different voltage levels. Figure 5 more clearly shows the cost differences of transformers with different voltage levels. The following figure reflects the predicted value of the life cycle cost of transformers, which can be used to determine the fluctuation range and average value of the corresponding equipment’s life cycle cost. The fluctuation of the life cycle cost of transformers indicates that these costs may vary under different practical applications and operating conditions. This volatility may be caused by factors such as specific requirements of the power grid, changes in power load, and differences in maintenance and repair costs. The average value reflects the comprehensive analysis results of a large number of data points and can be used as a reference indicator for evaluating the cost-effectiveness of transformers.
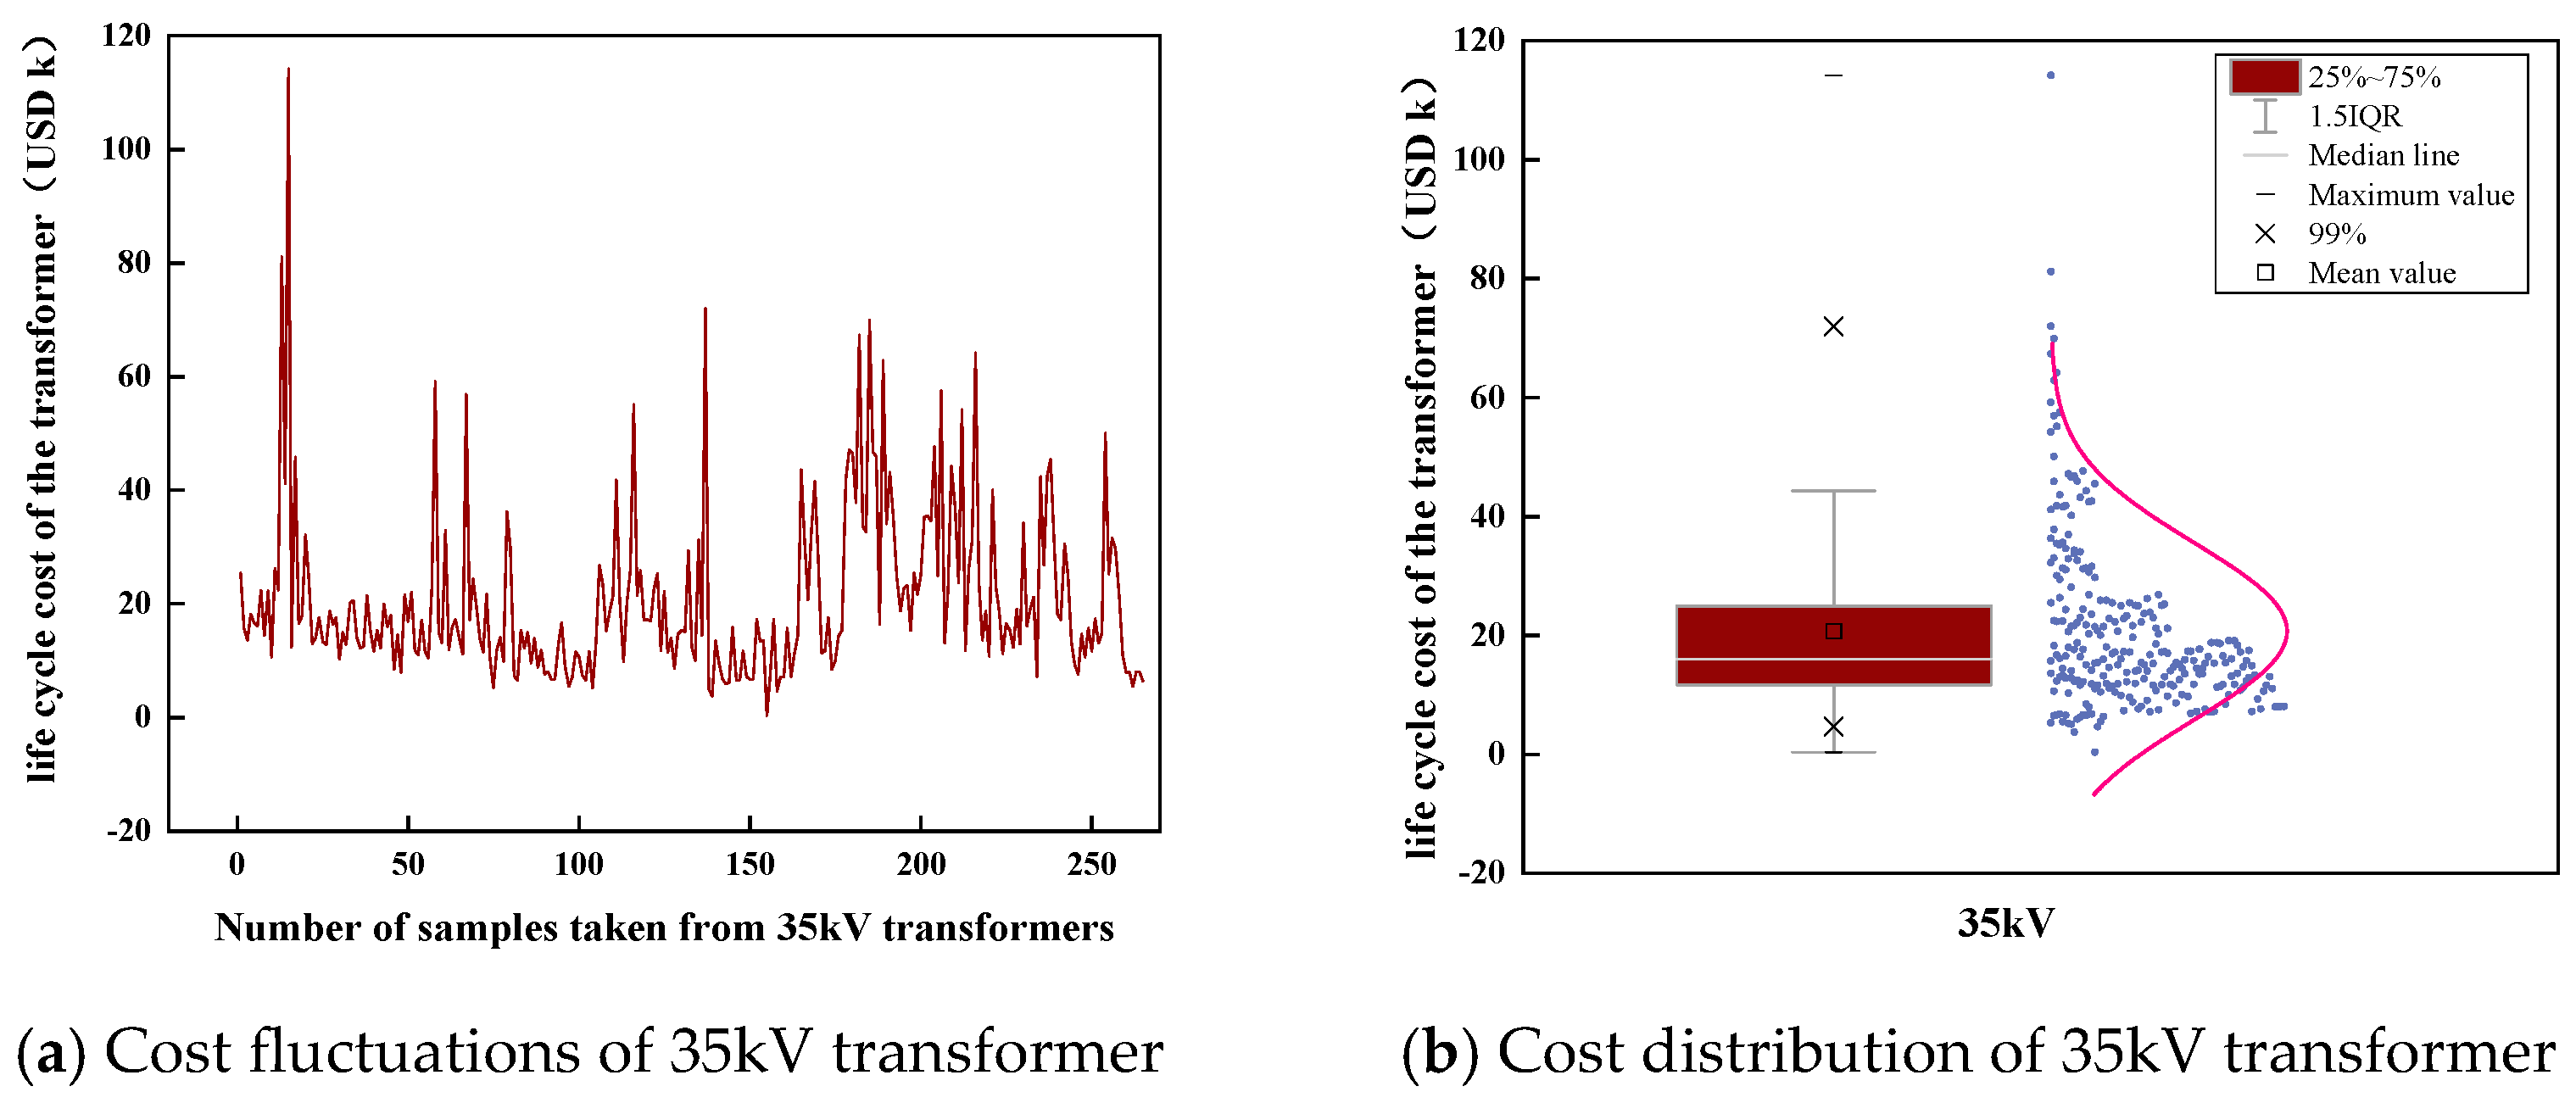
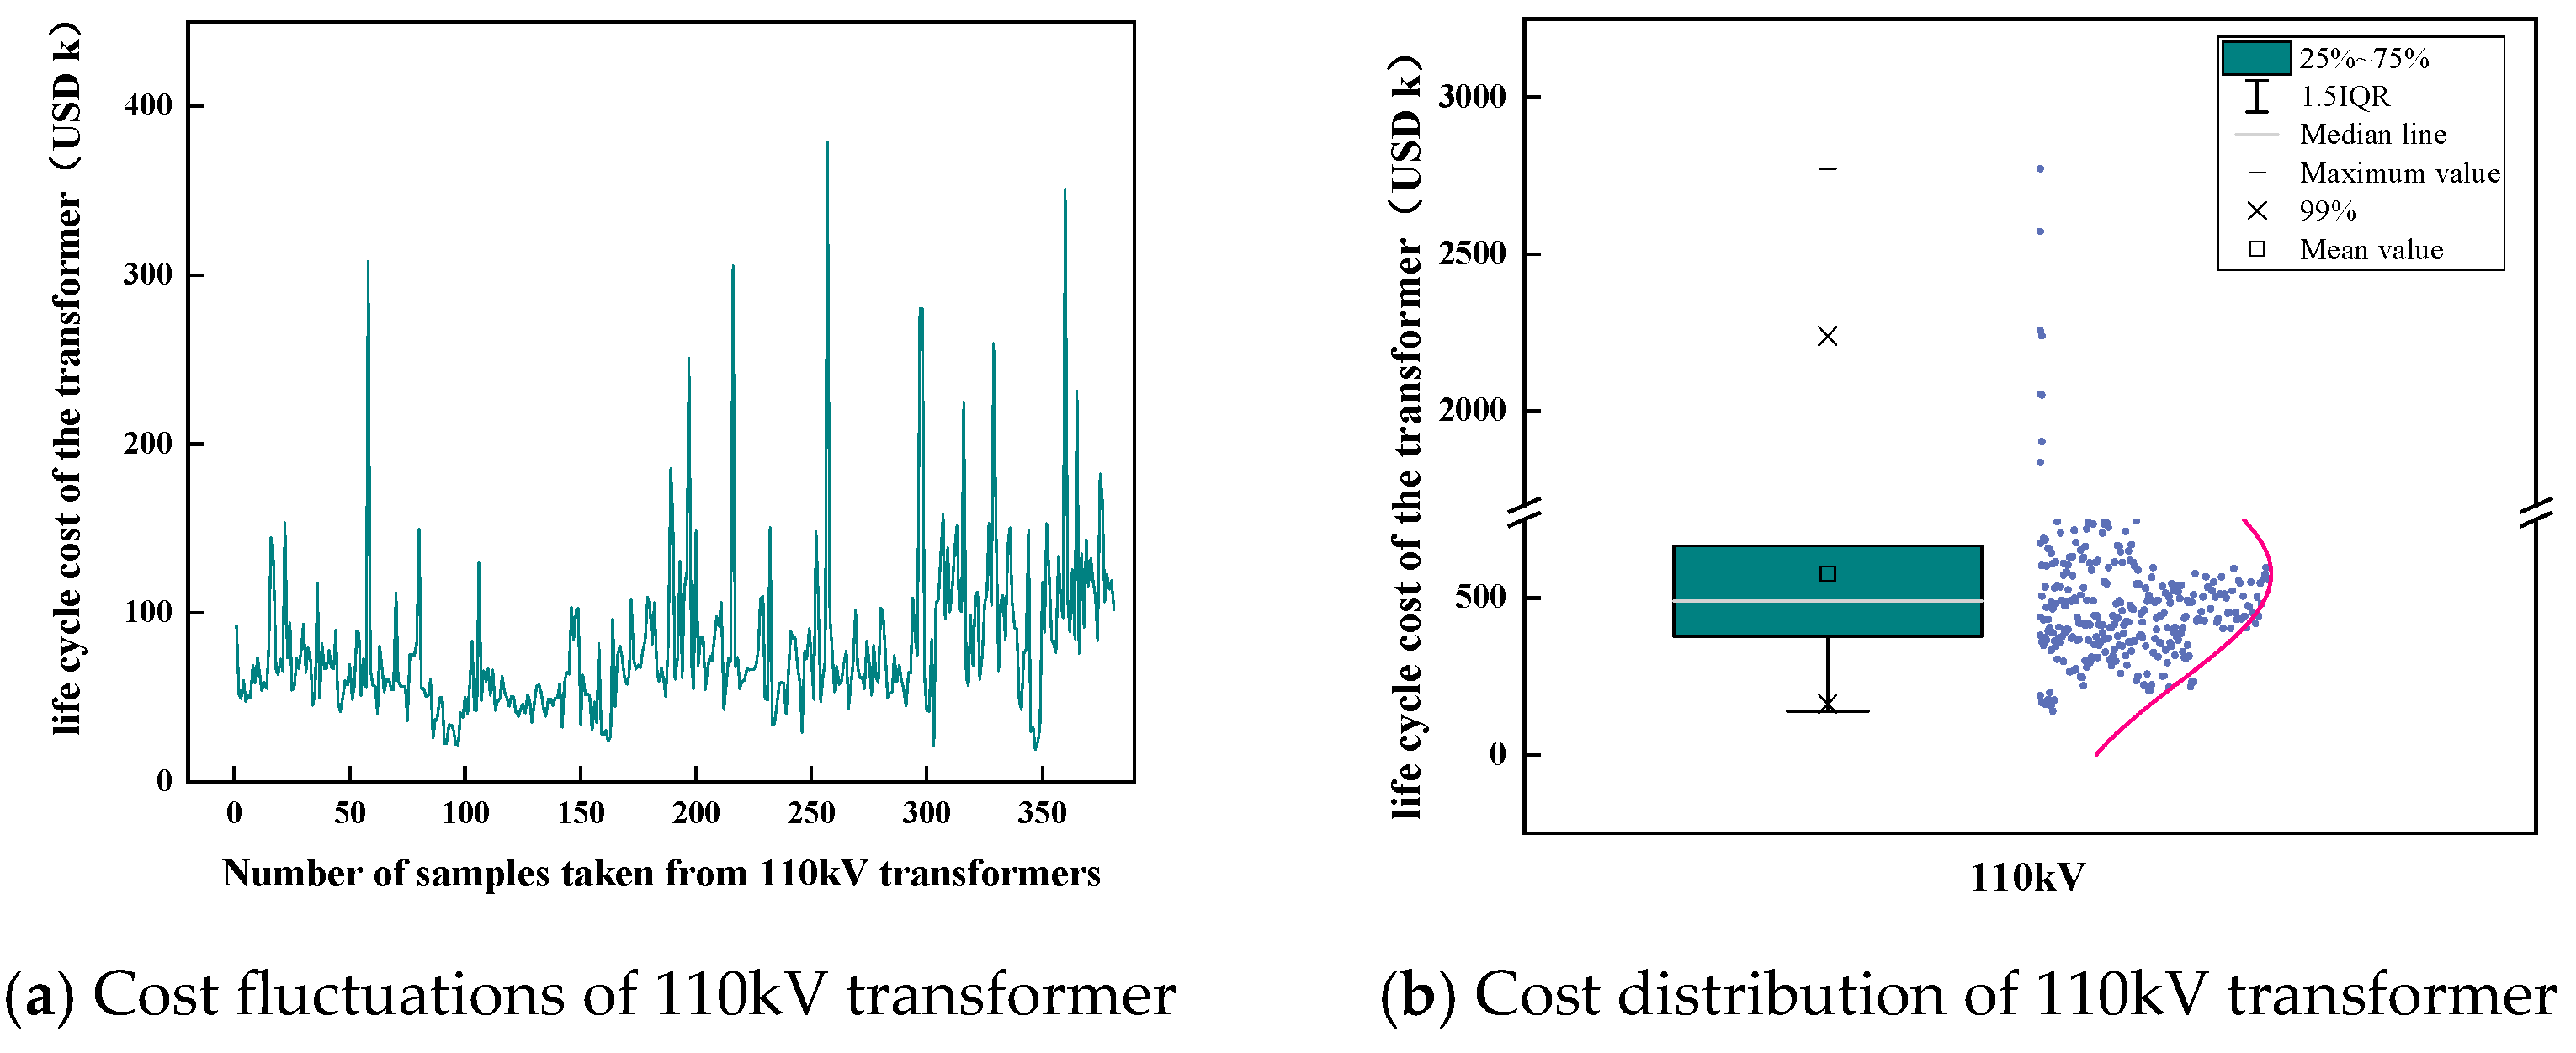
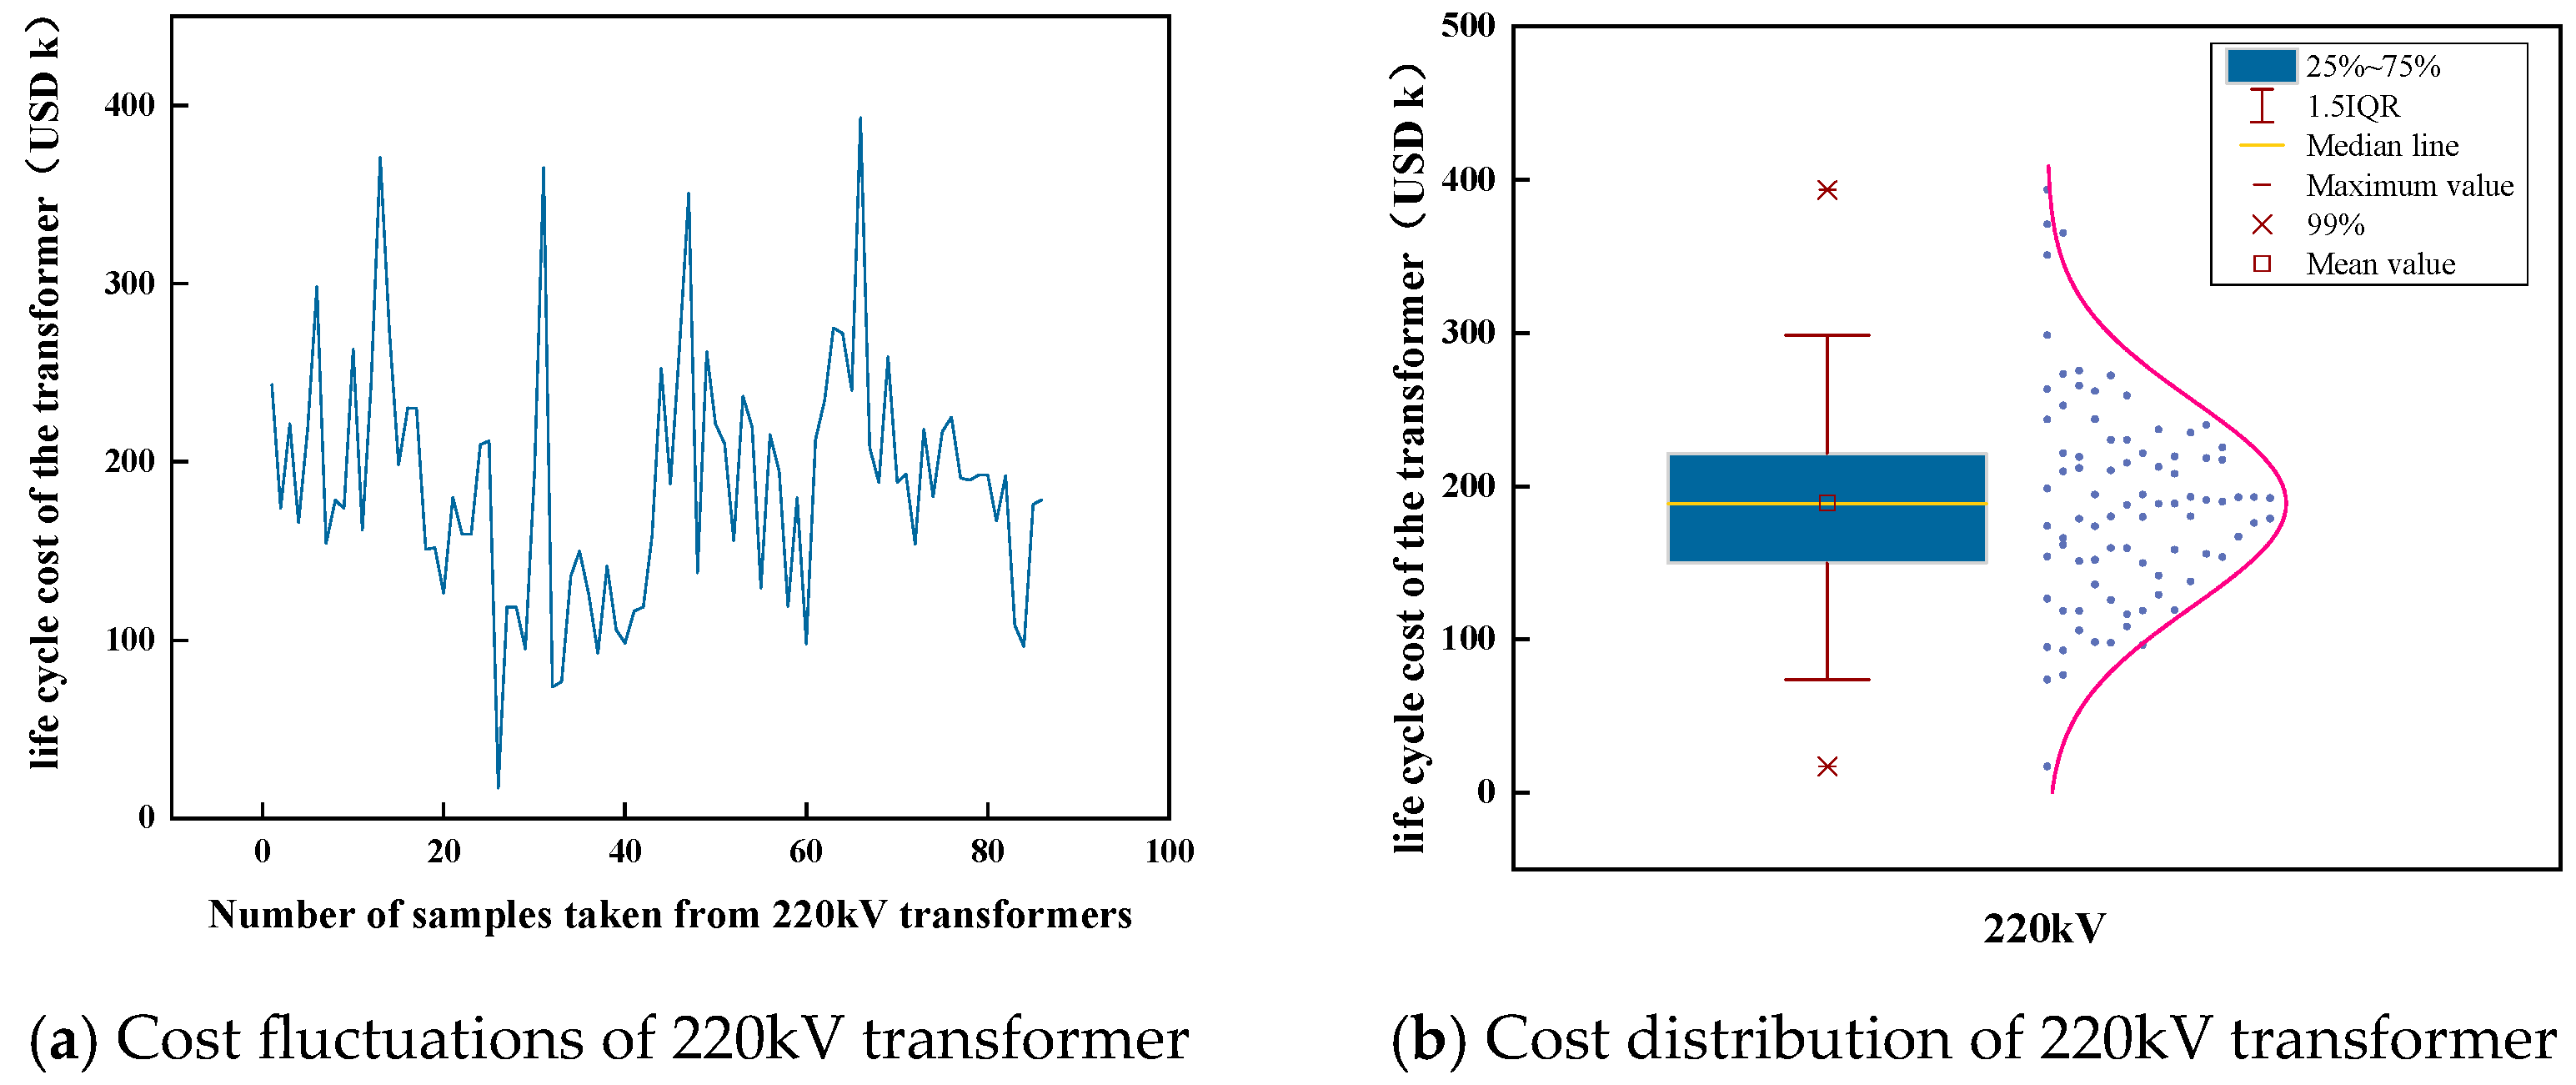
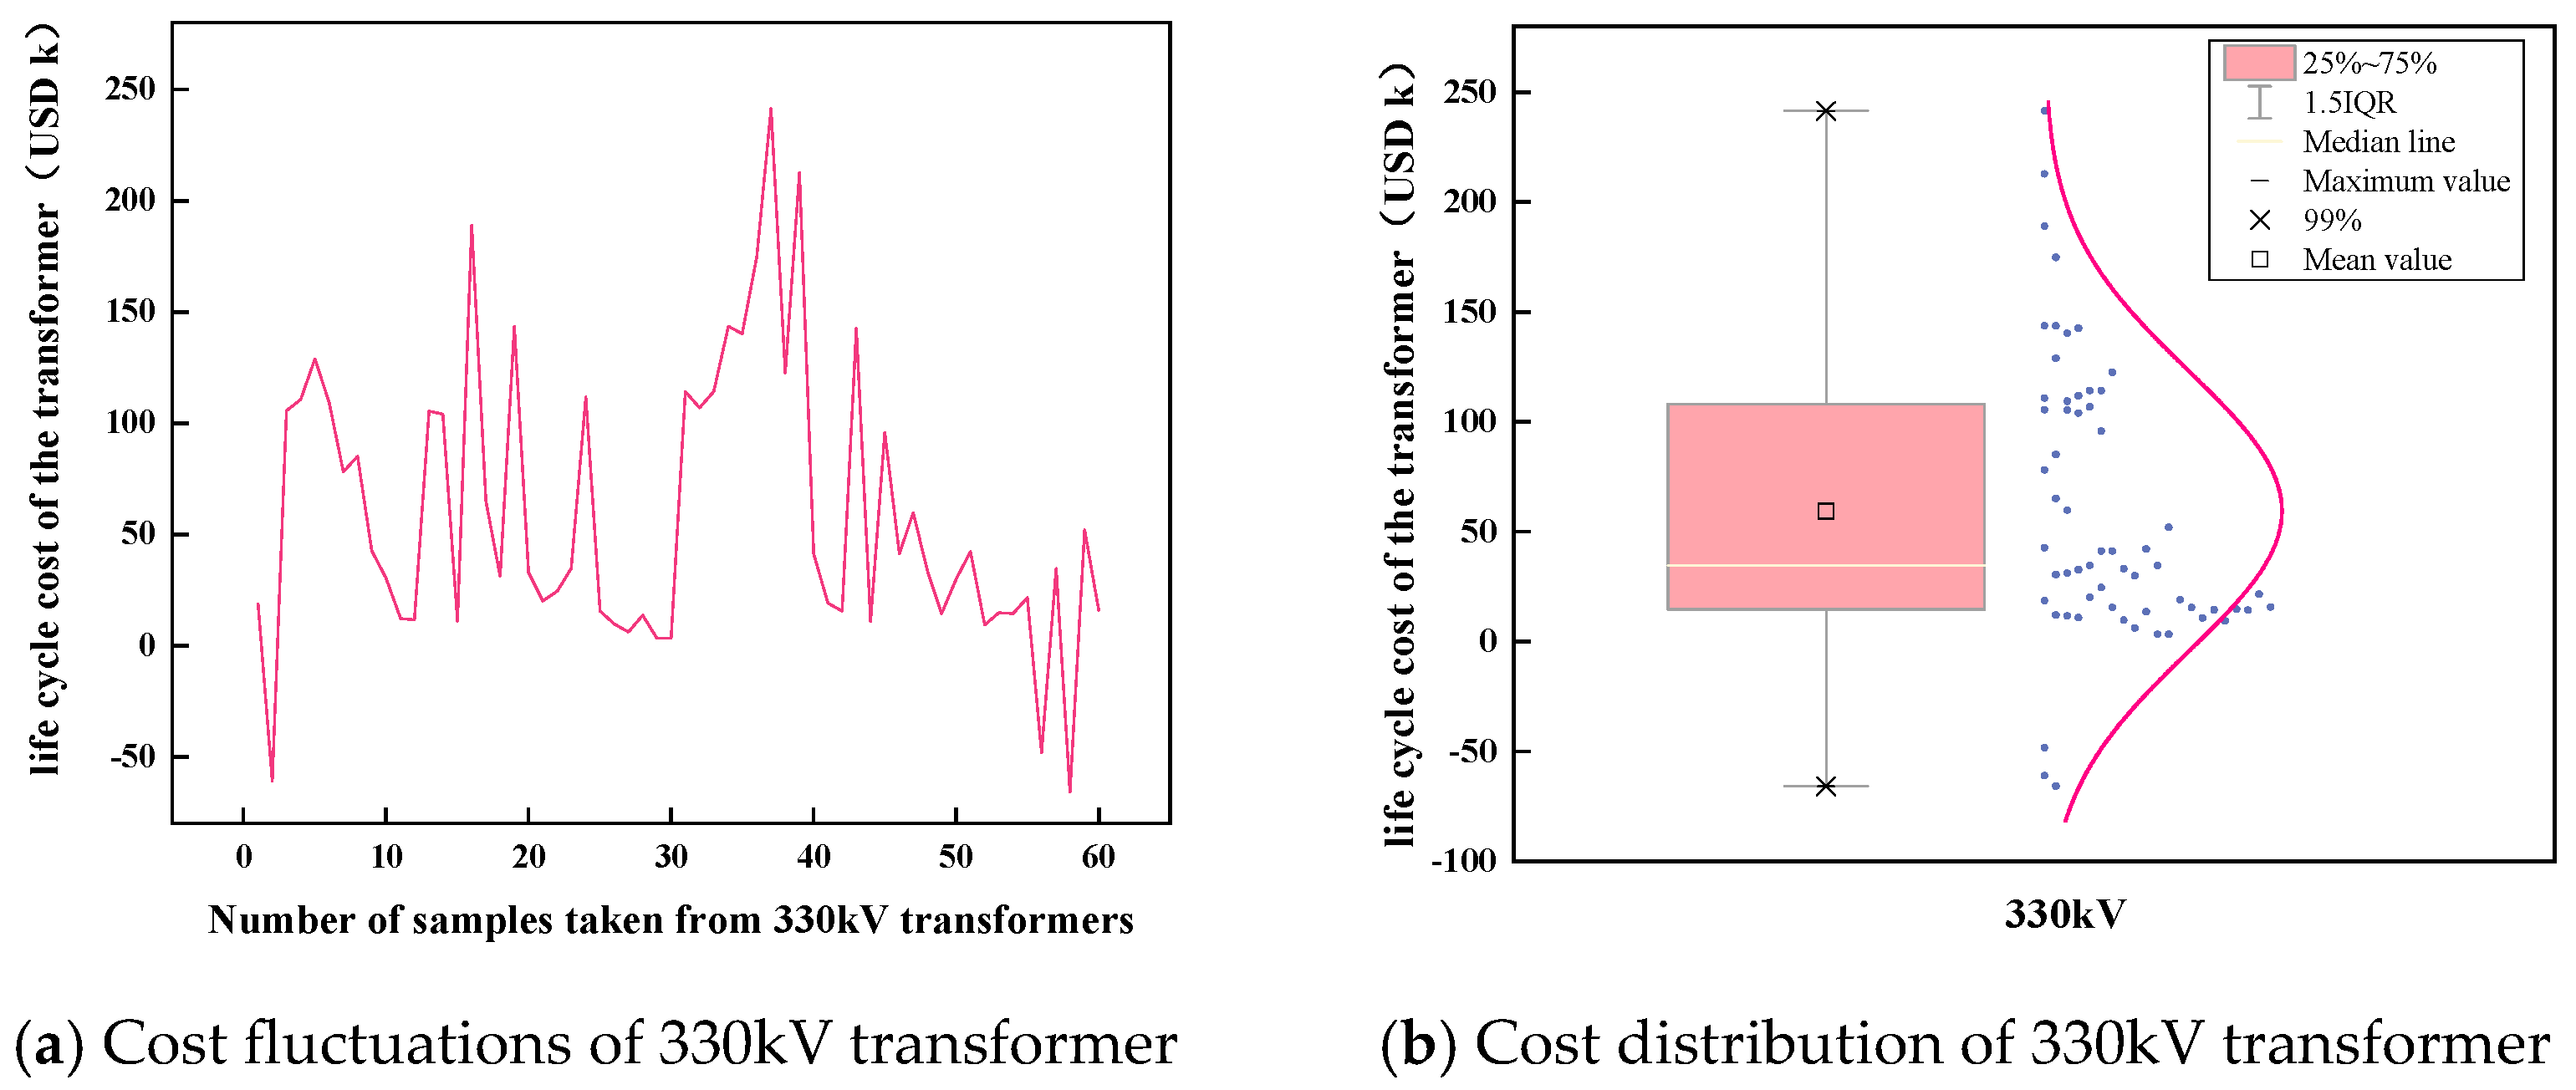
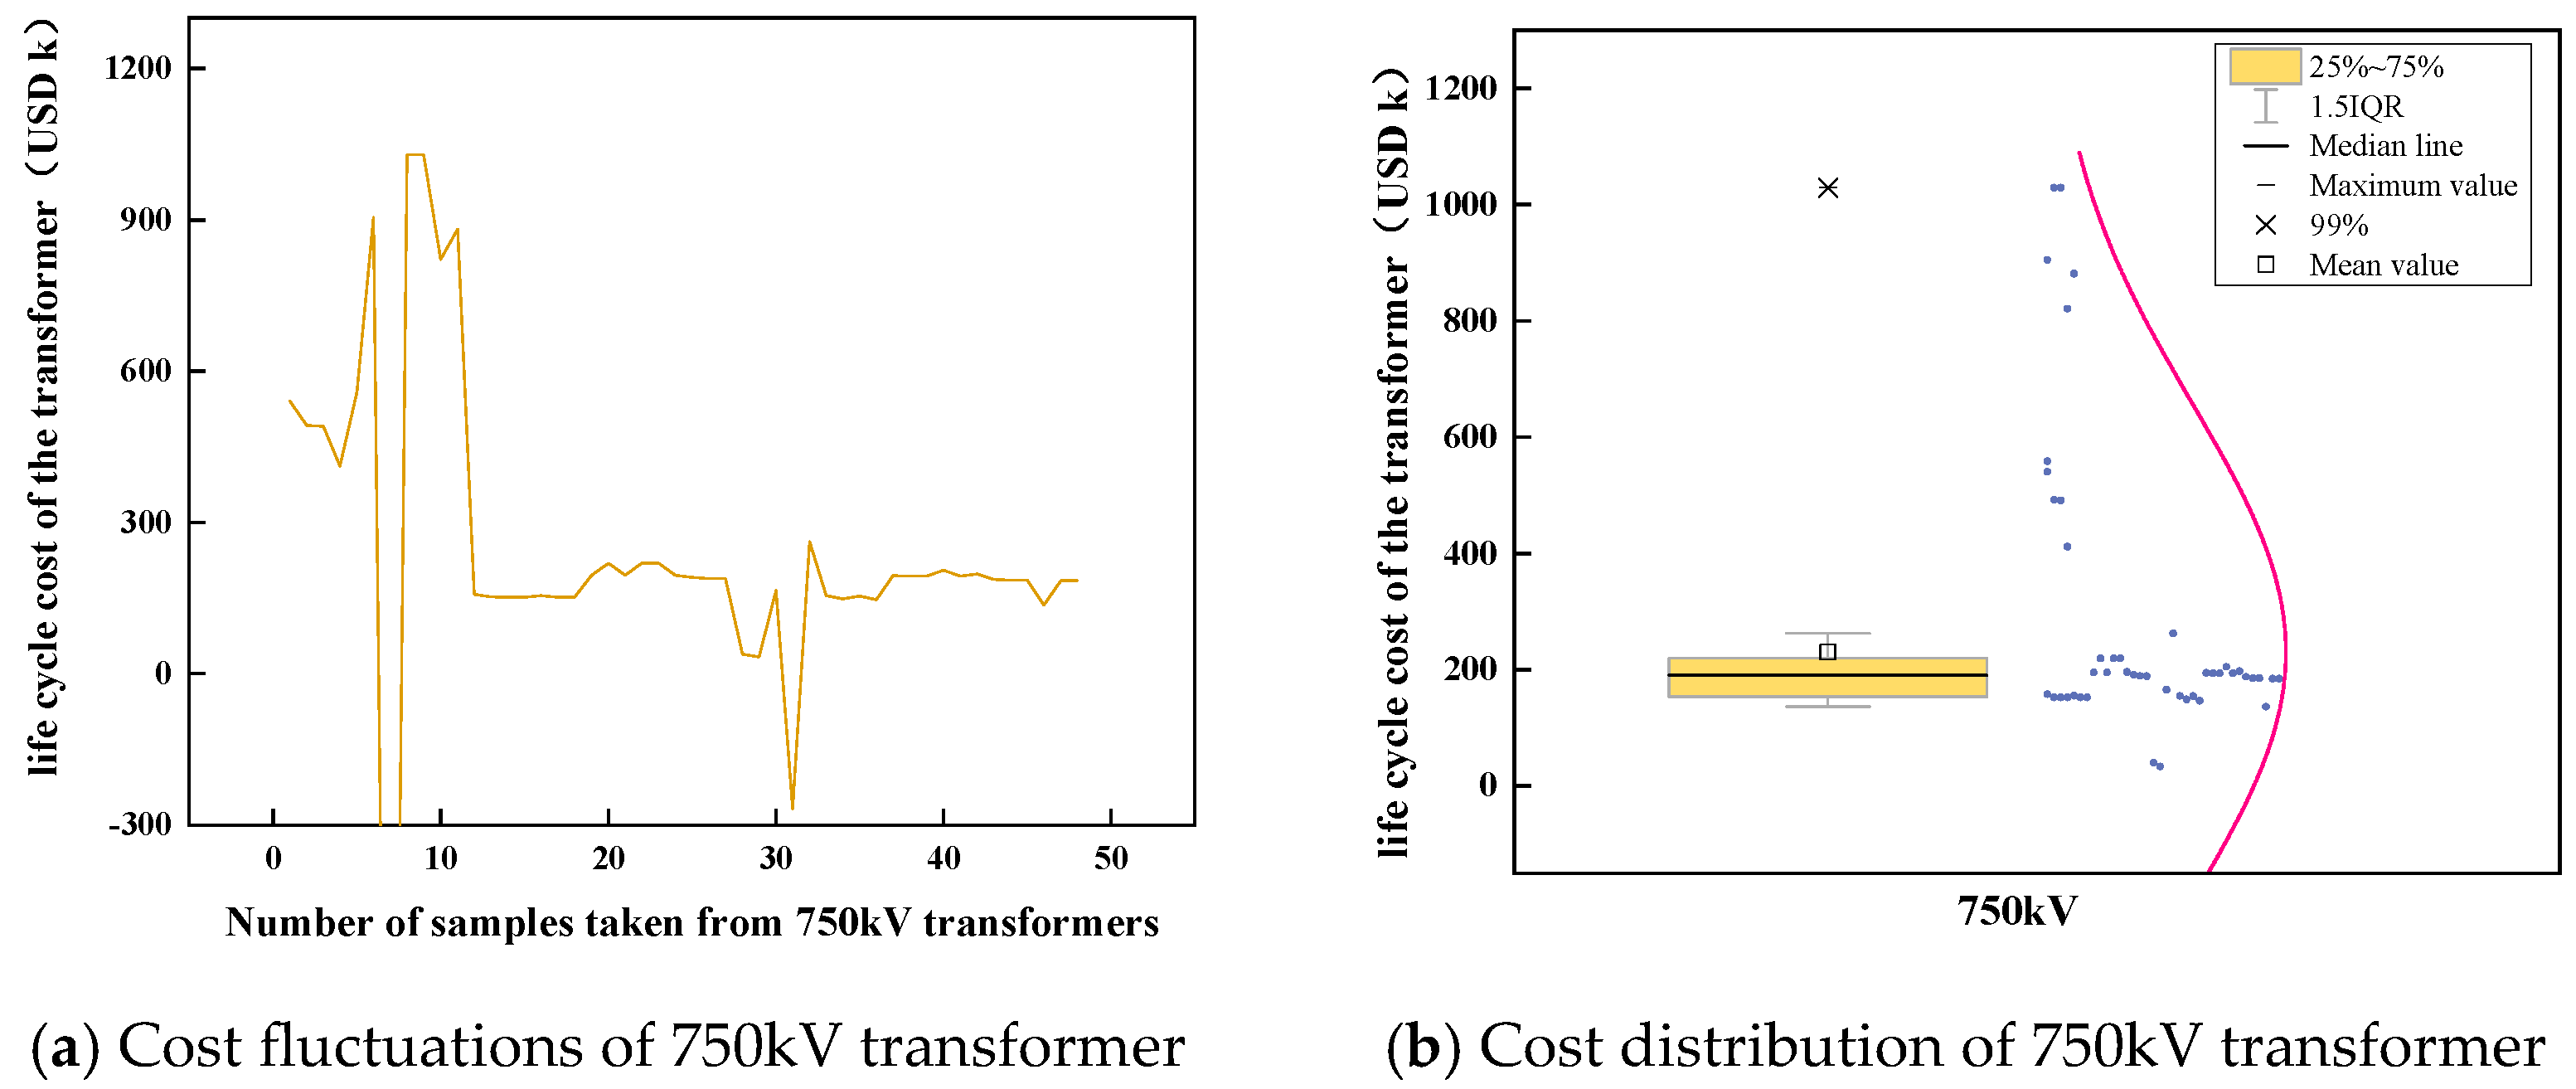
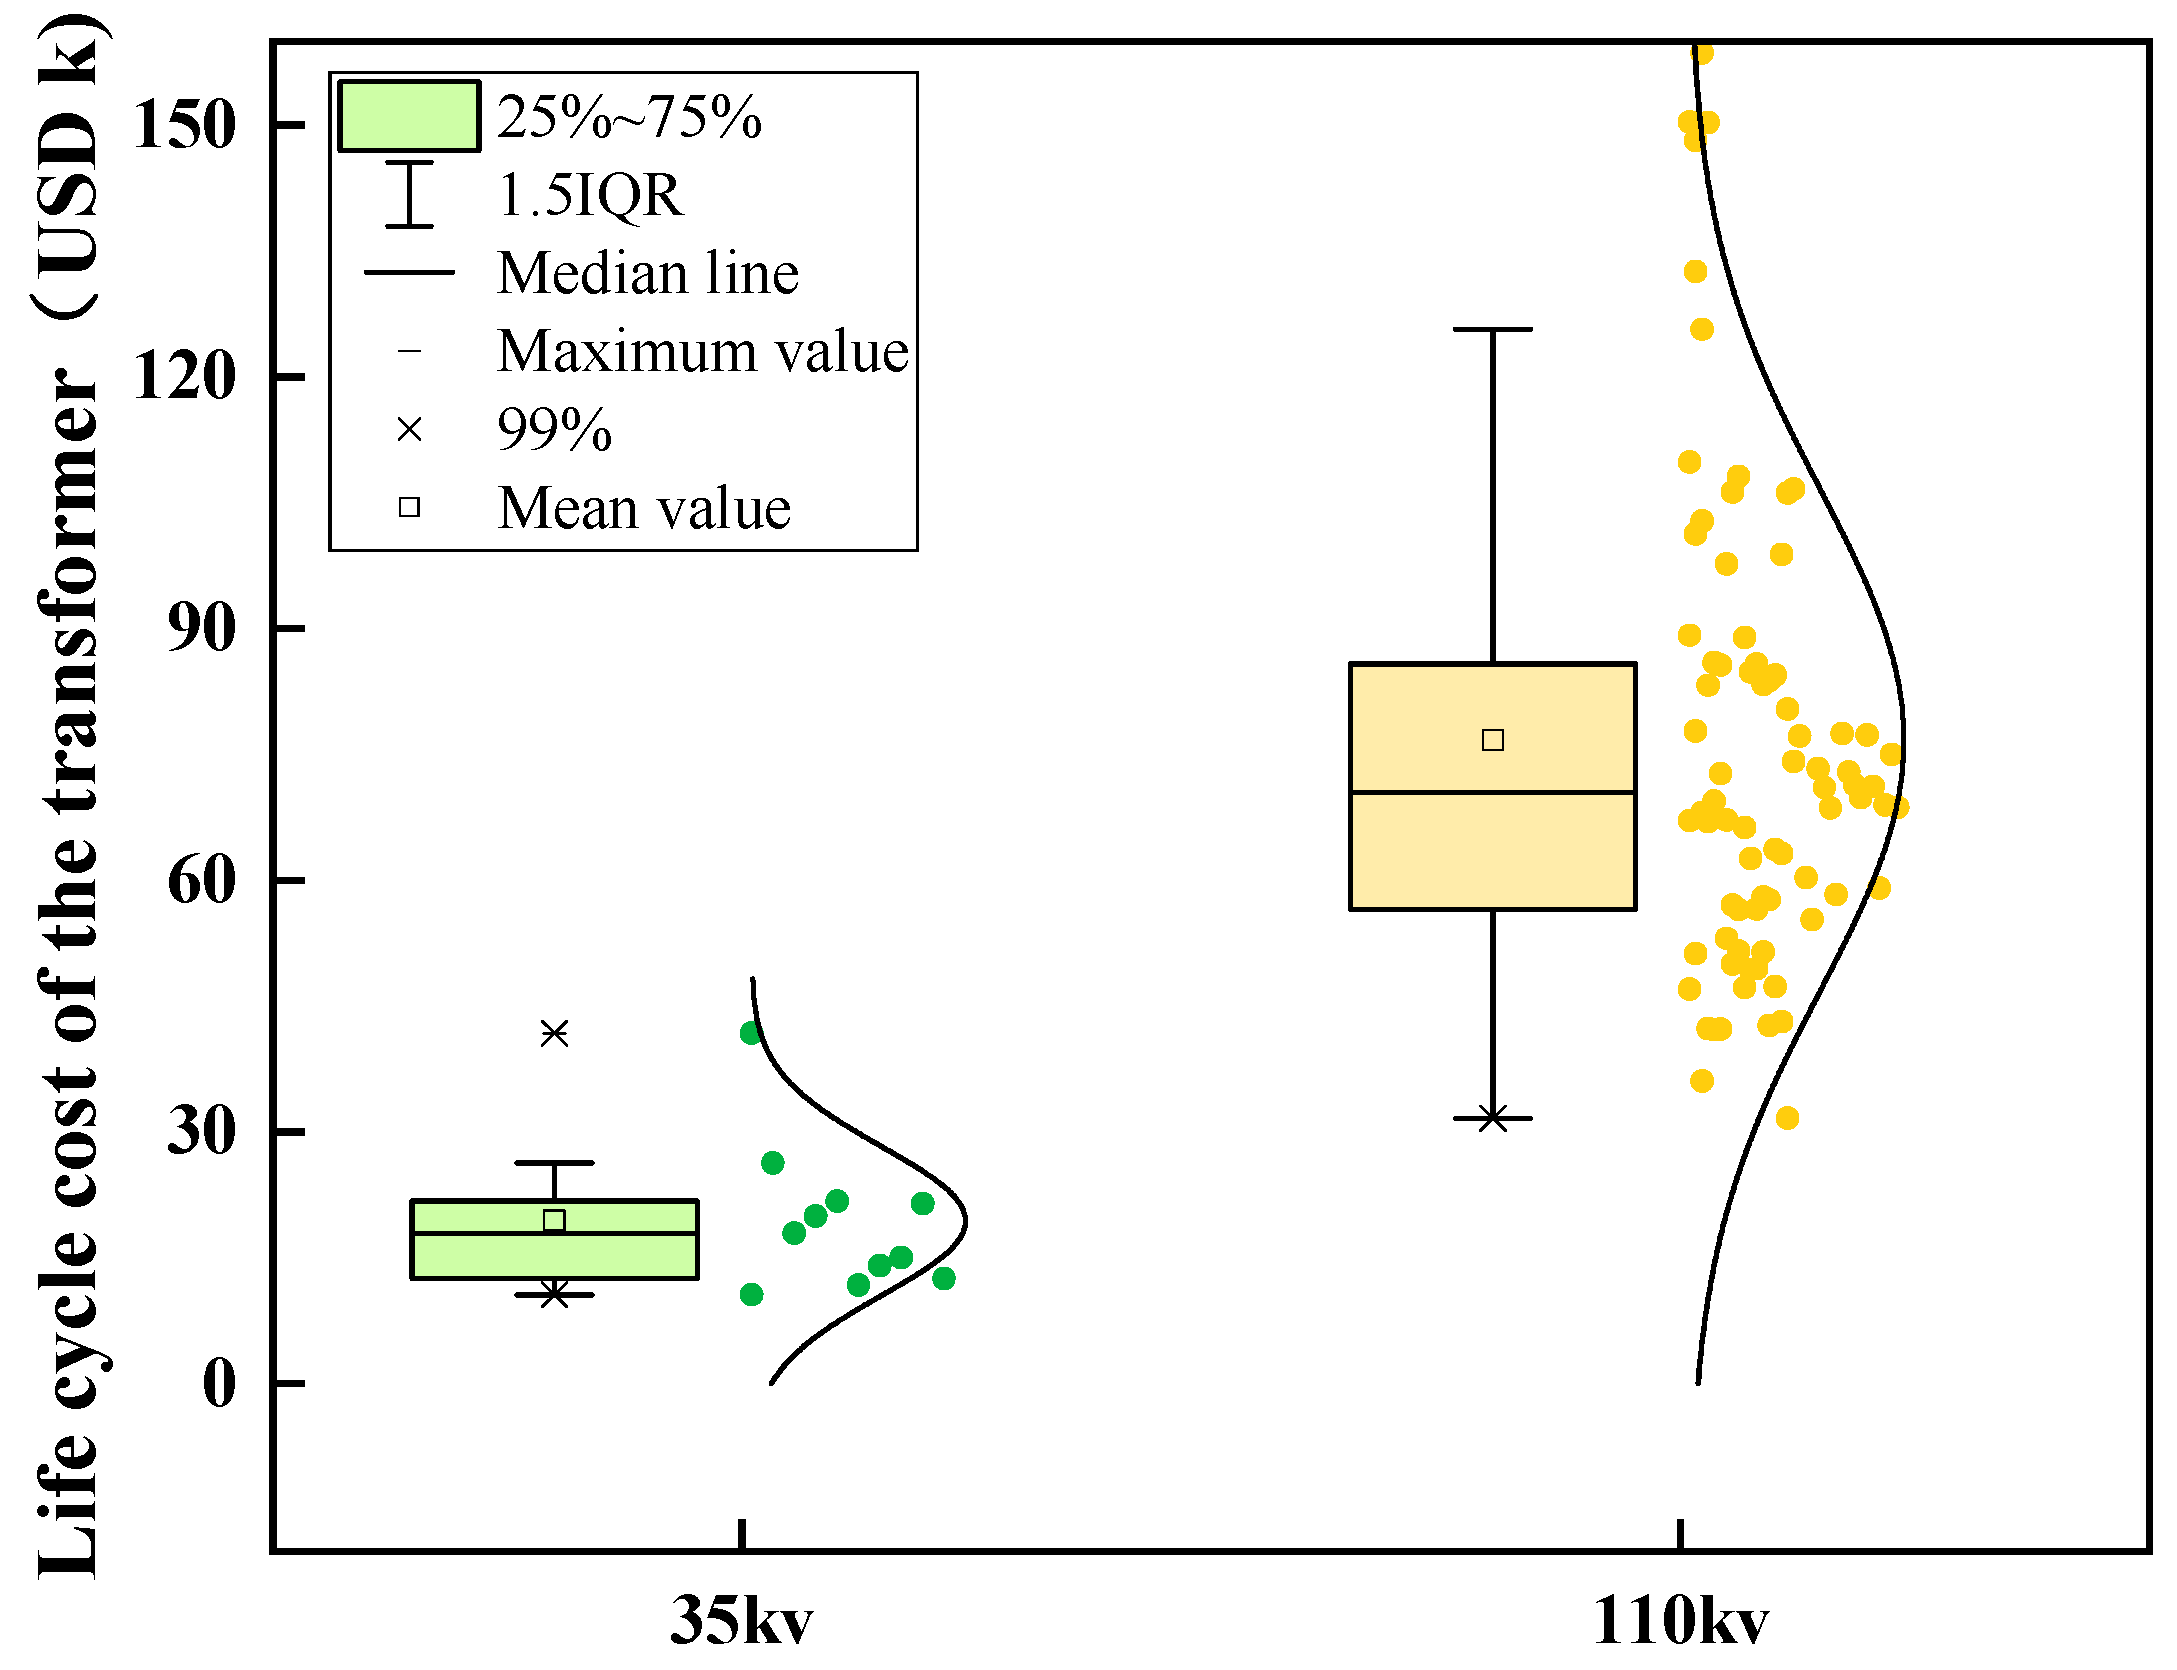
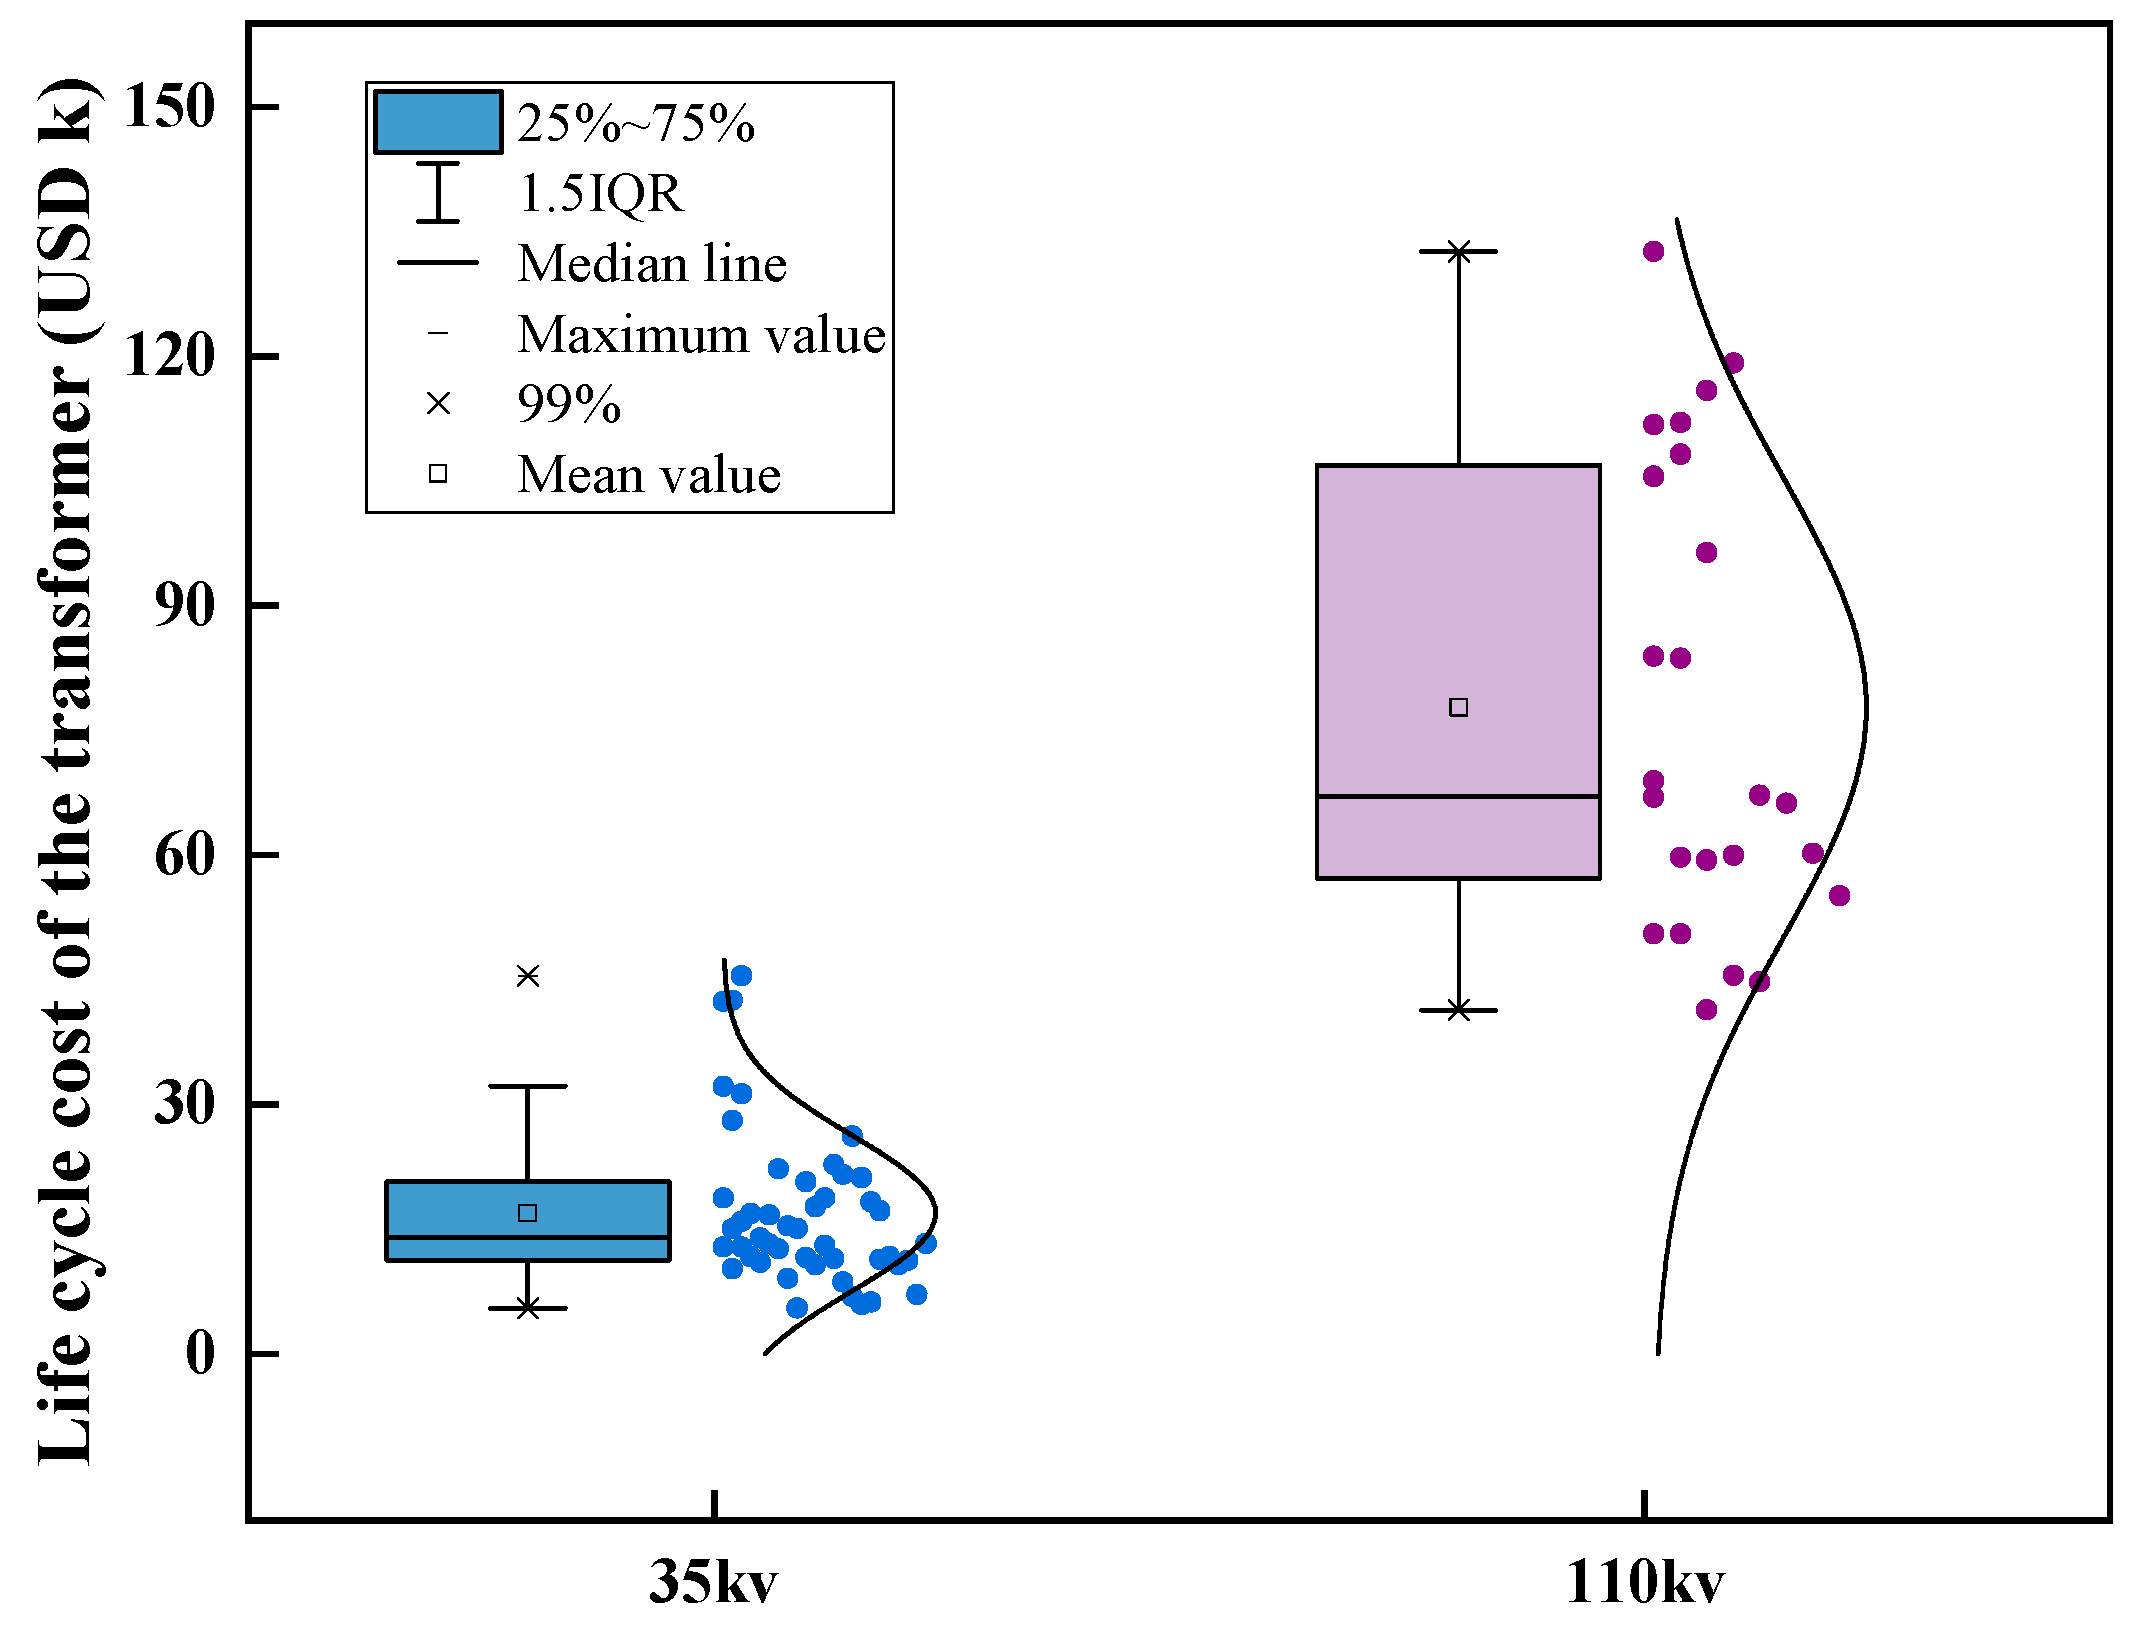
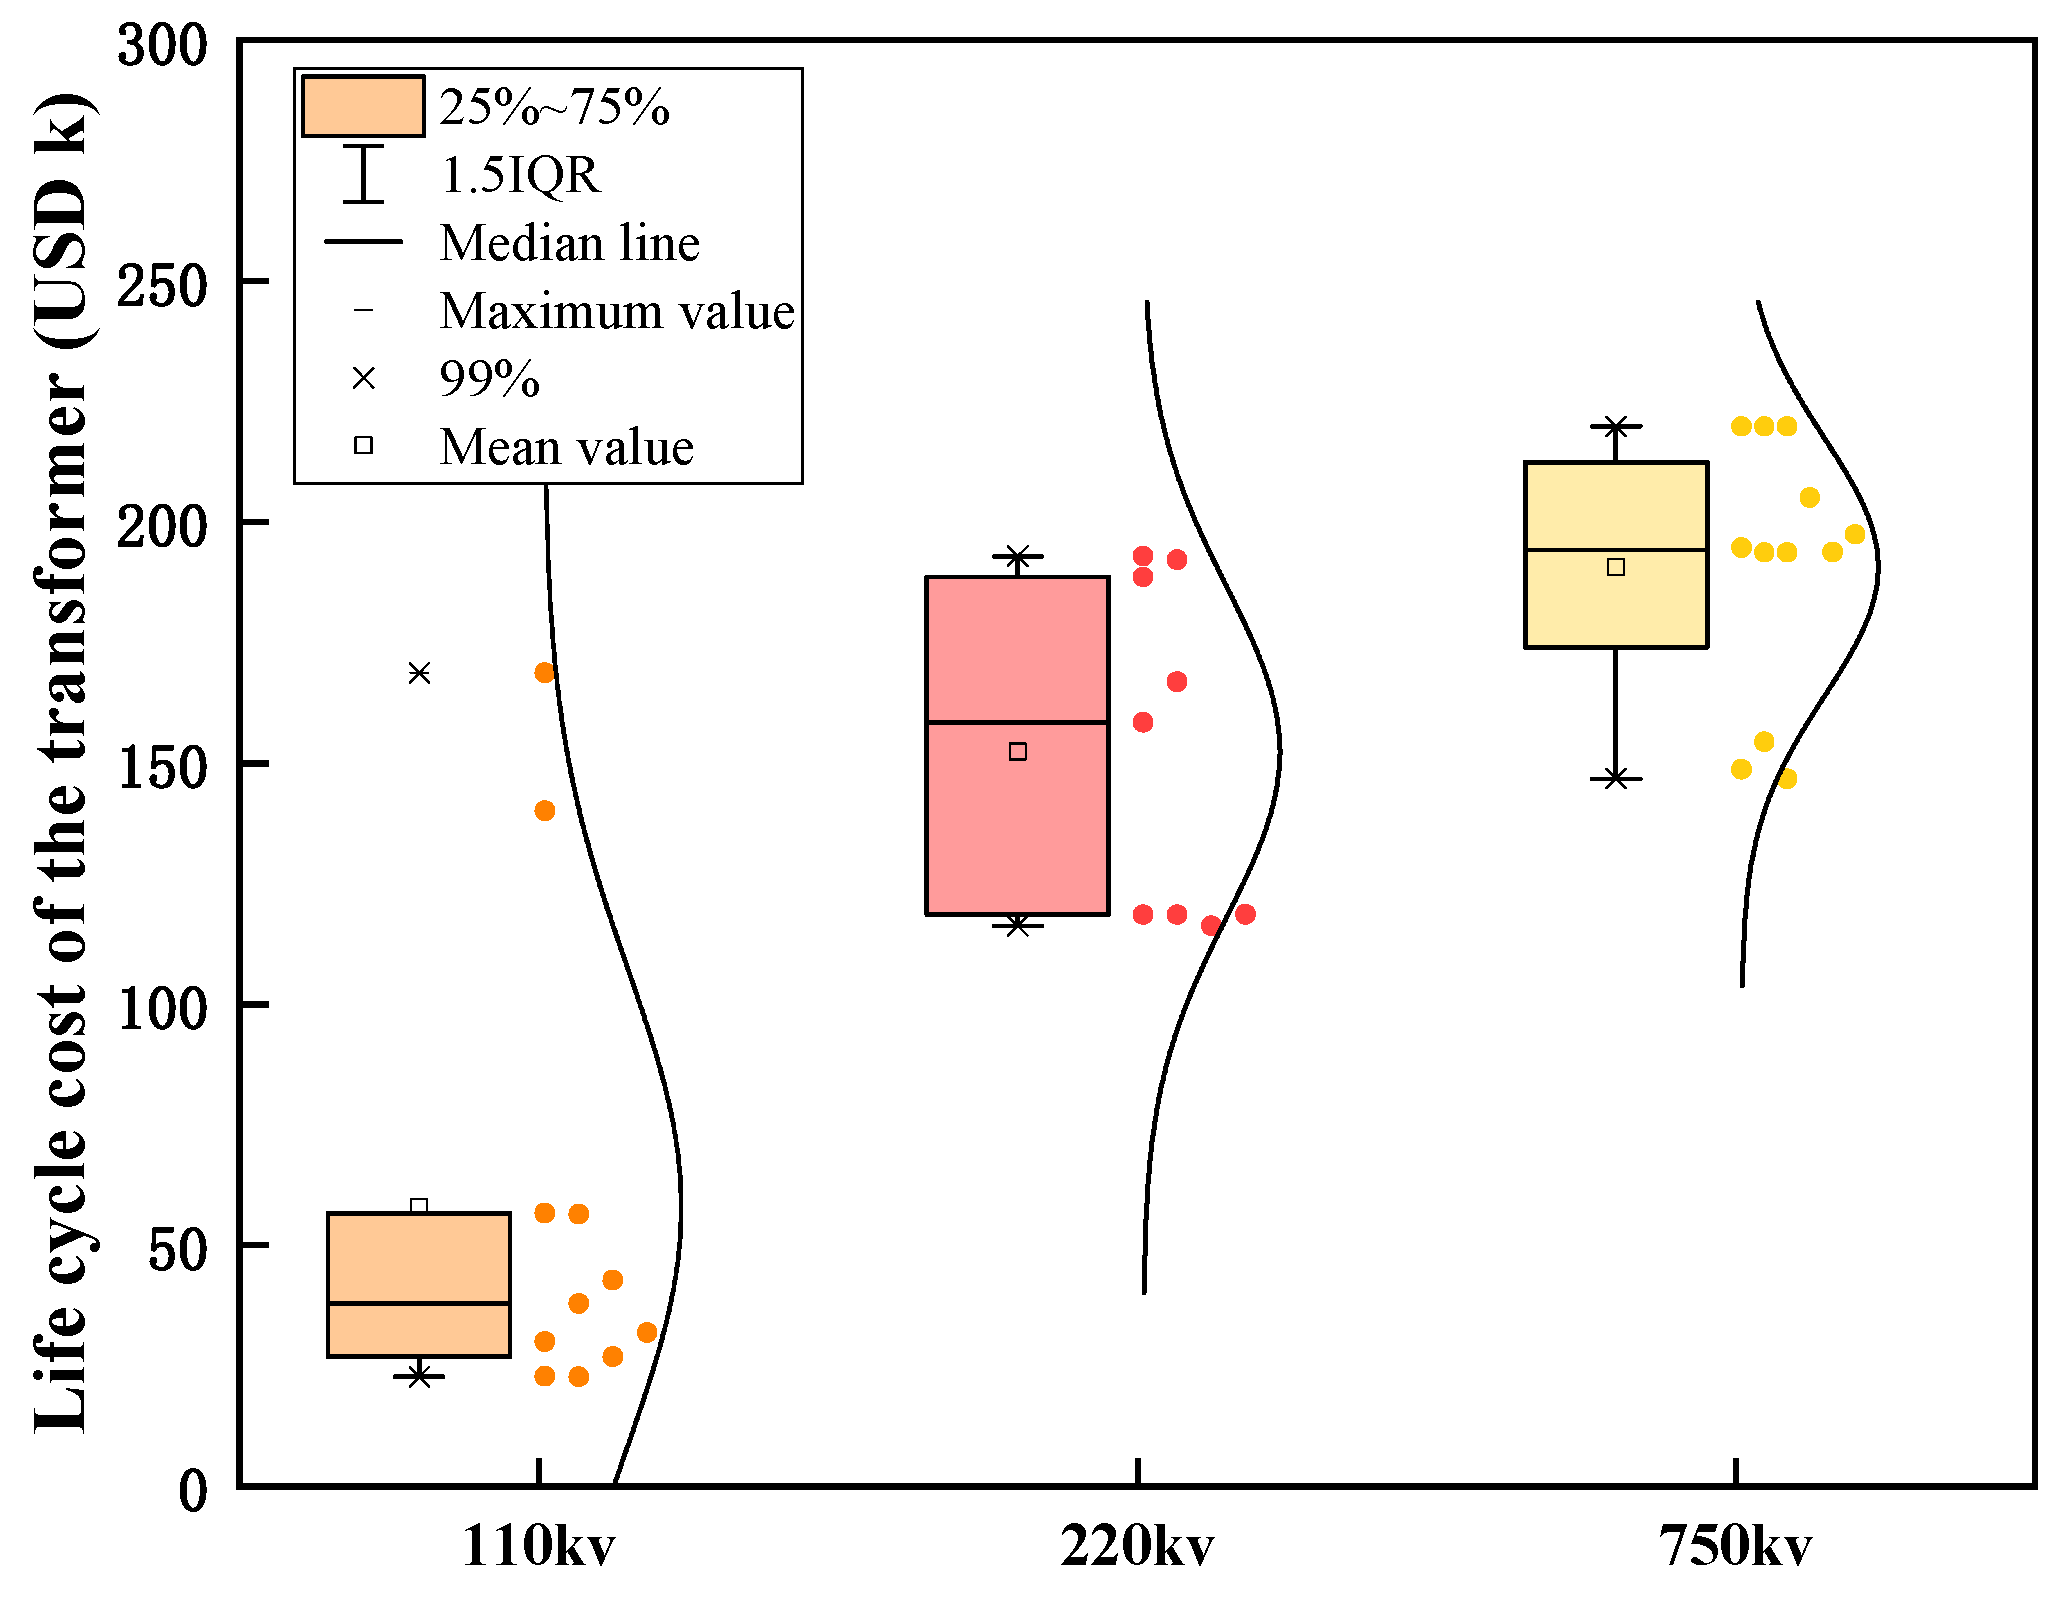
The voltage level is crucial for transformers, as it directly affects the efficiency of energy transmission, the stability of the power grid, and the compatibility of equipment, as well as the safety and maintenance costs of the system. Choosing and configuring the voltage level of transformers appropriately is crucial for achieving efficient, reliable, and safe power systems. In order to compare the impact of voltage level on the life cycle cost of transformers more clearly, we predicted the cost of five typical voltage levels of transformers and drew data distribution and fluctuation diagrams. This comparative analysis is elucidated in Figure 6, Figure 7, Figure 8, Figure 9 and Figure 10.
Analyzing the life cycle cost prediction schematic for transformers across various voltage levels, the average life cycle cost of 330 kV transformers—serving as a benchmark for evaluating cost-effectiveness—is notably lower than that of 220 kV transformers and marginally less than that of 110 kV transformers. These prediction outcomes highlight that the initial cost alone does not exclusively determine the life cycle cost of equipment. A comprehensive evaluation, considering various factors, becomes imperative in the equipment selection process. Shown in Table 3 is the data organization of the predicted full life cycle cost for transformers of different voltage levels.
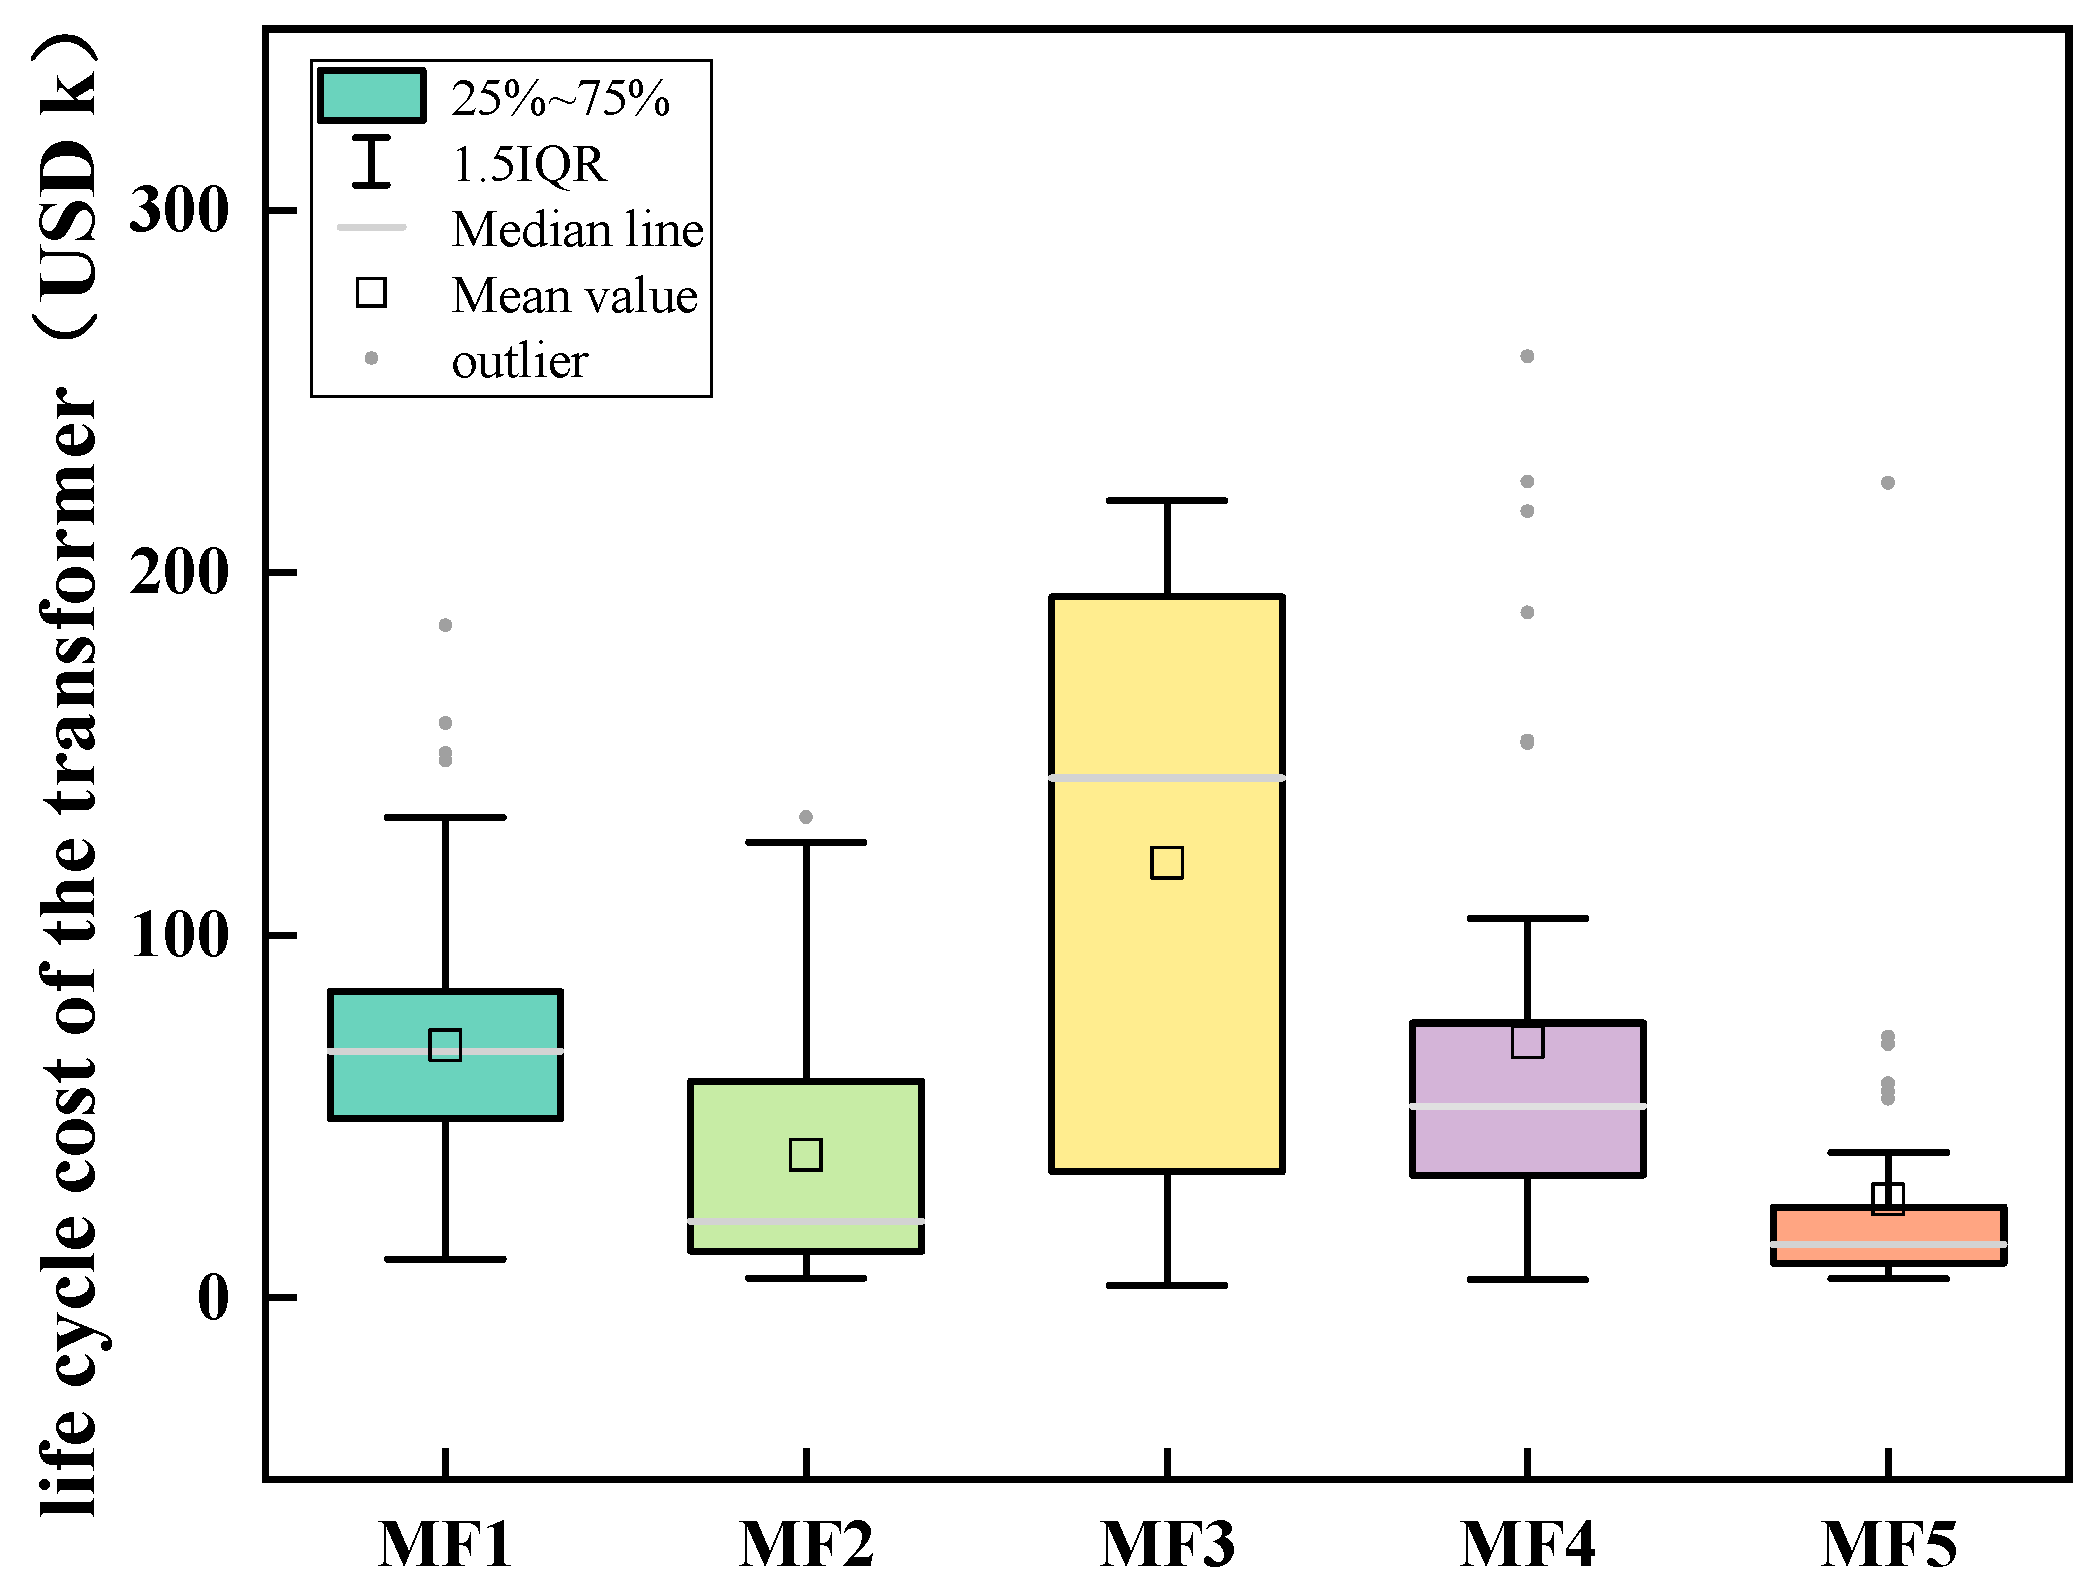
After organizing the equipment data provided by a northern power company from 2016 to 2021, we found that different manufacturers have a significant impact on the cost of transformers. Differences in materials, manufacturing processes, production batches, delivery times, transportation methods, and other factors among different manufacturers can lead to differences in the life cycle cost of transformers. Therefore, based on a cost prediction model, we analyzed the differences in the life cycle cost of transformers from five major manufacturers. We also predicted the life cycle cost of transformers from five different manufacturers, as shown in Figure 11.
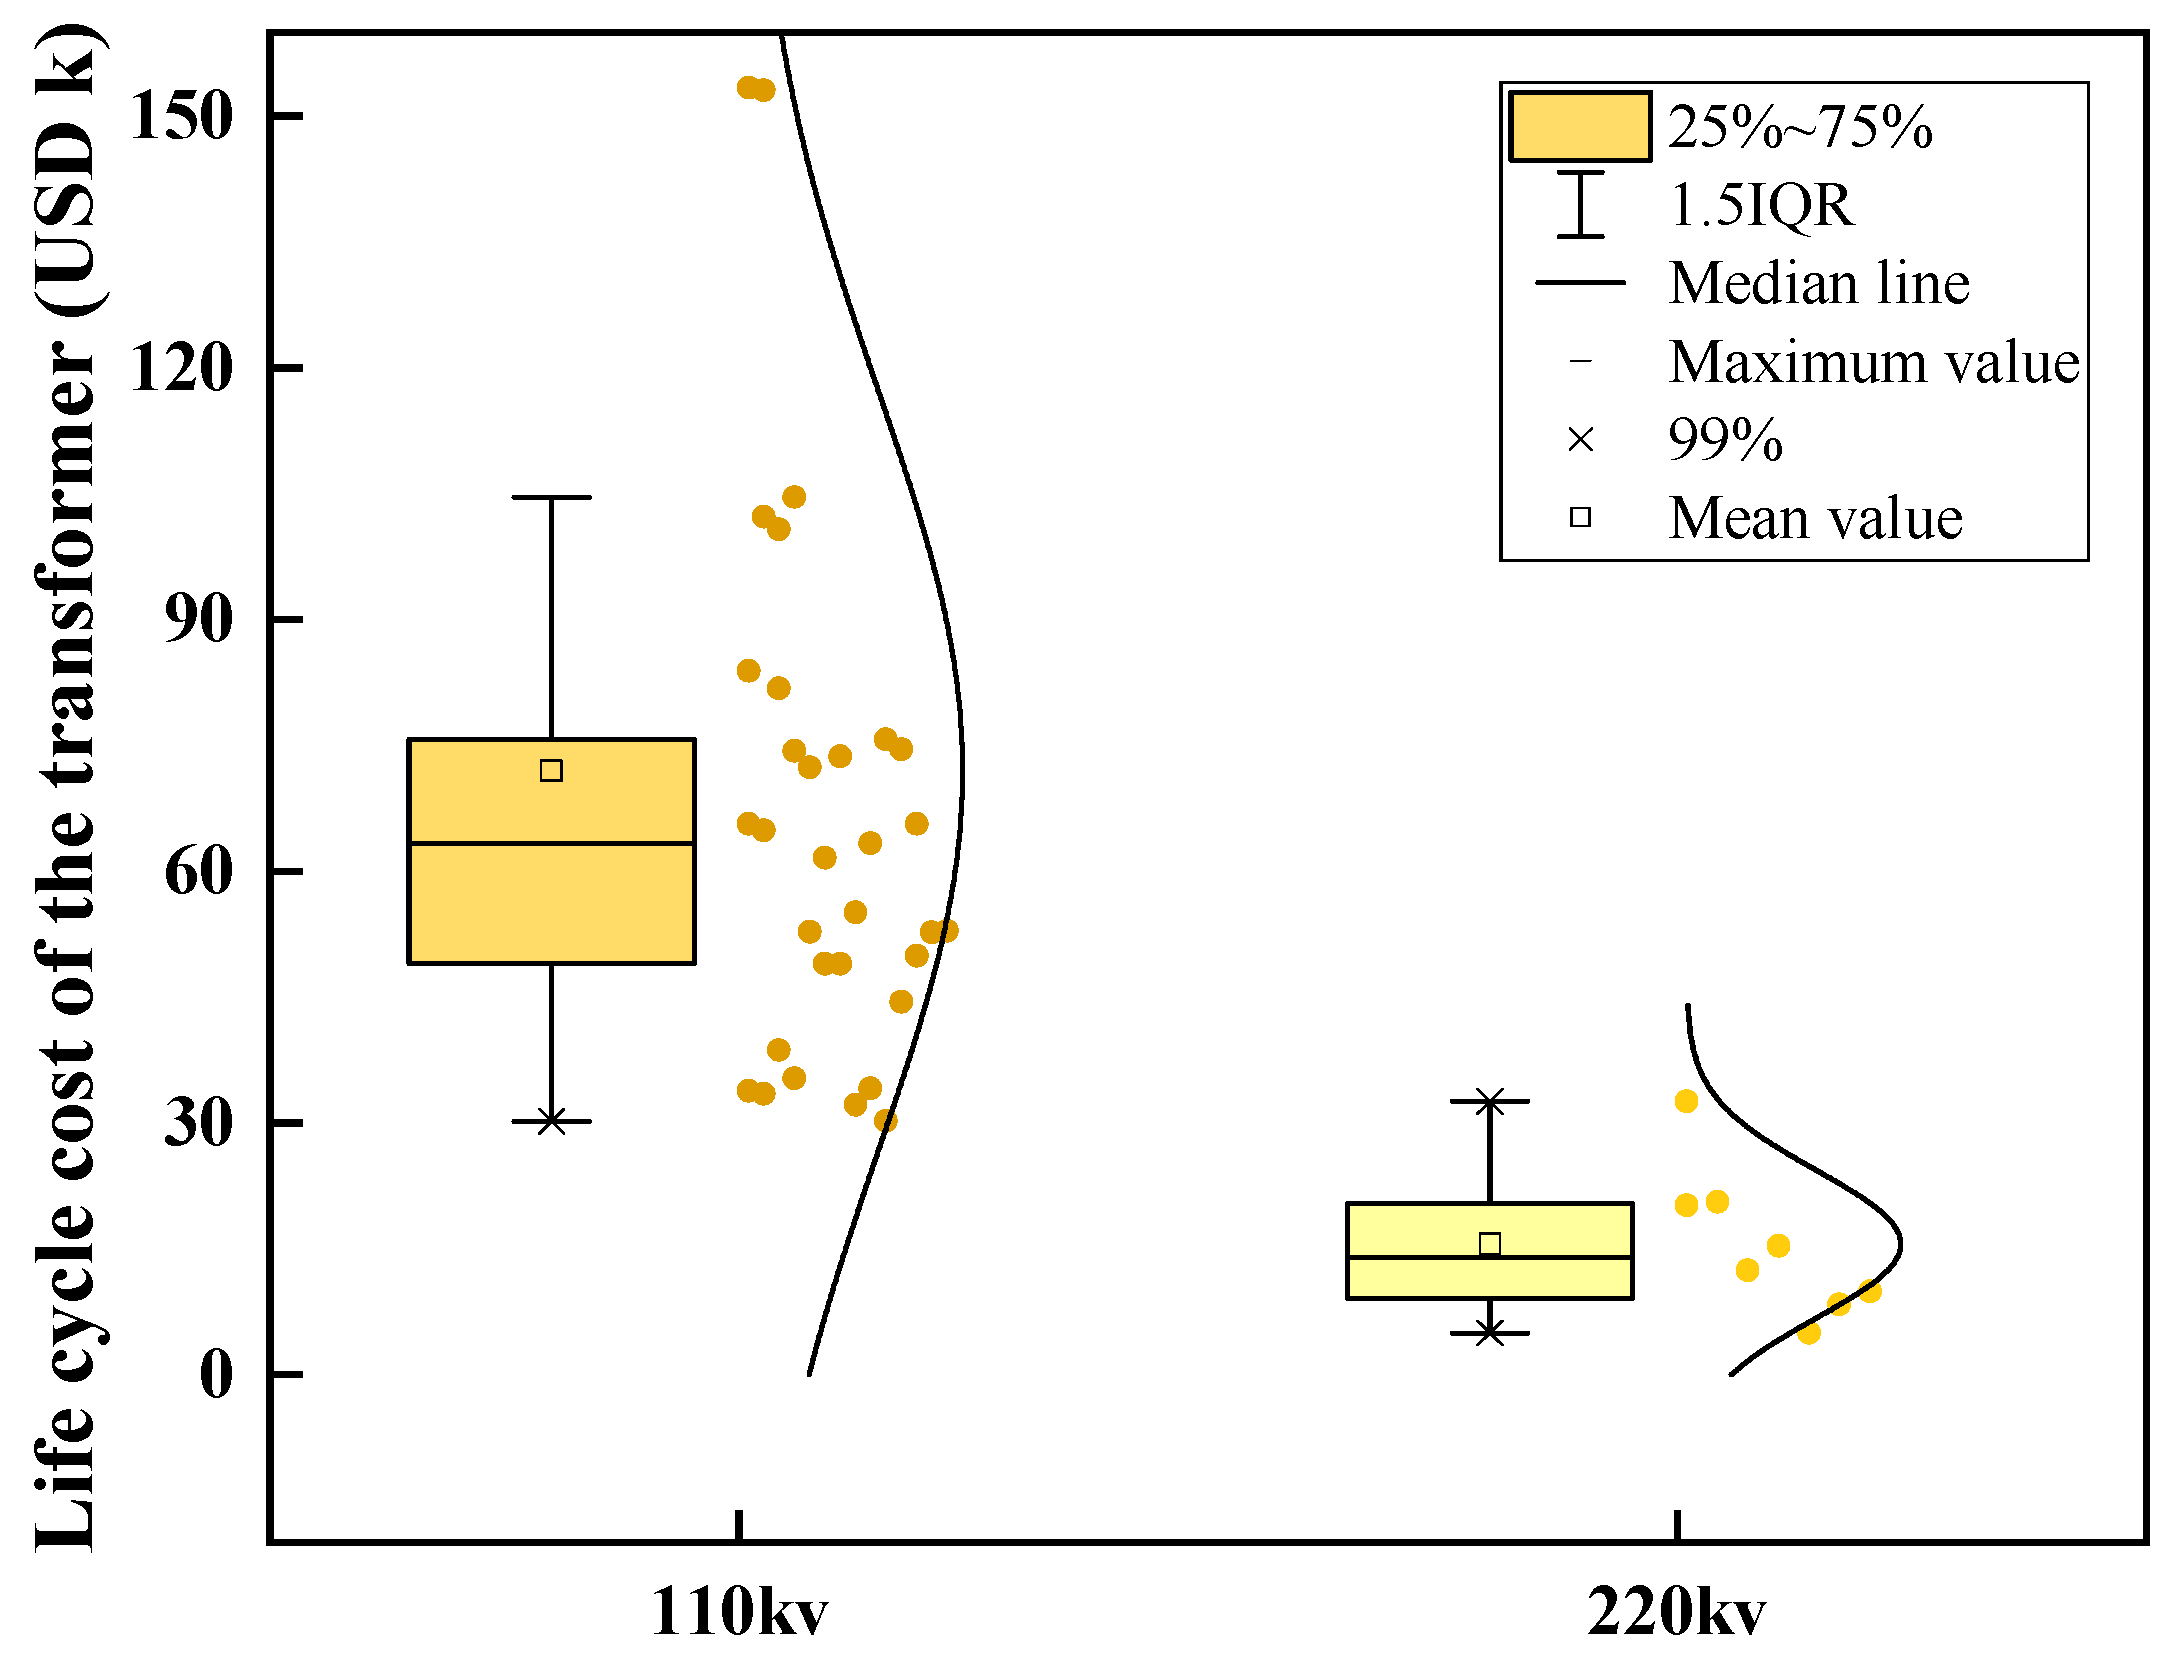
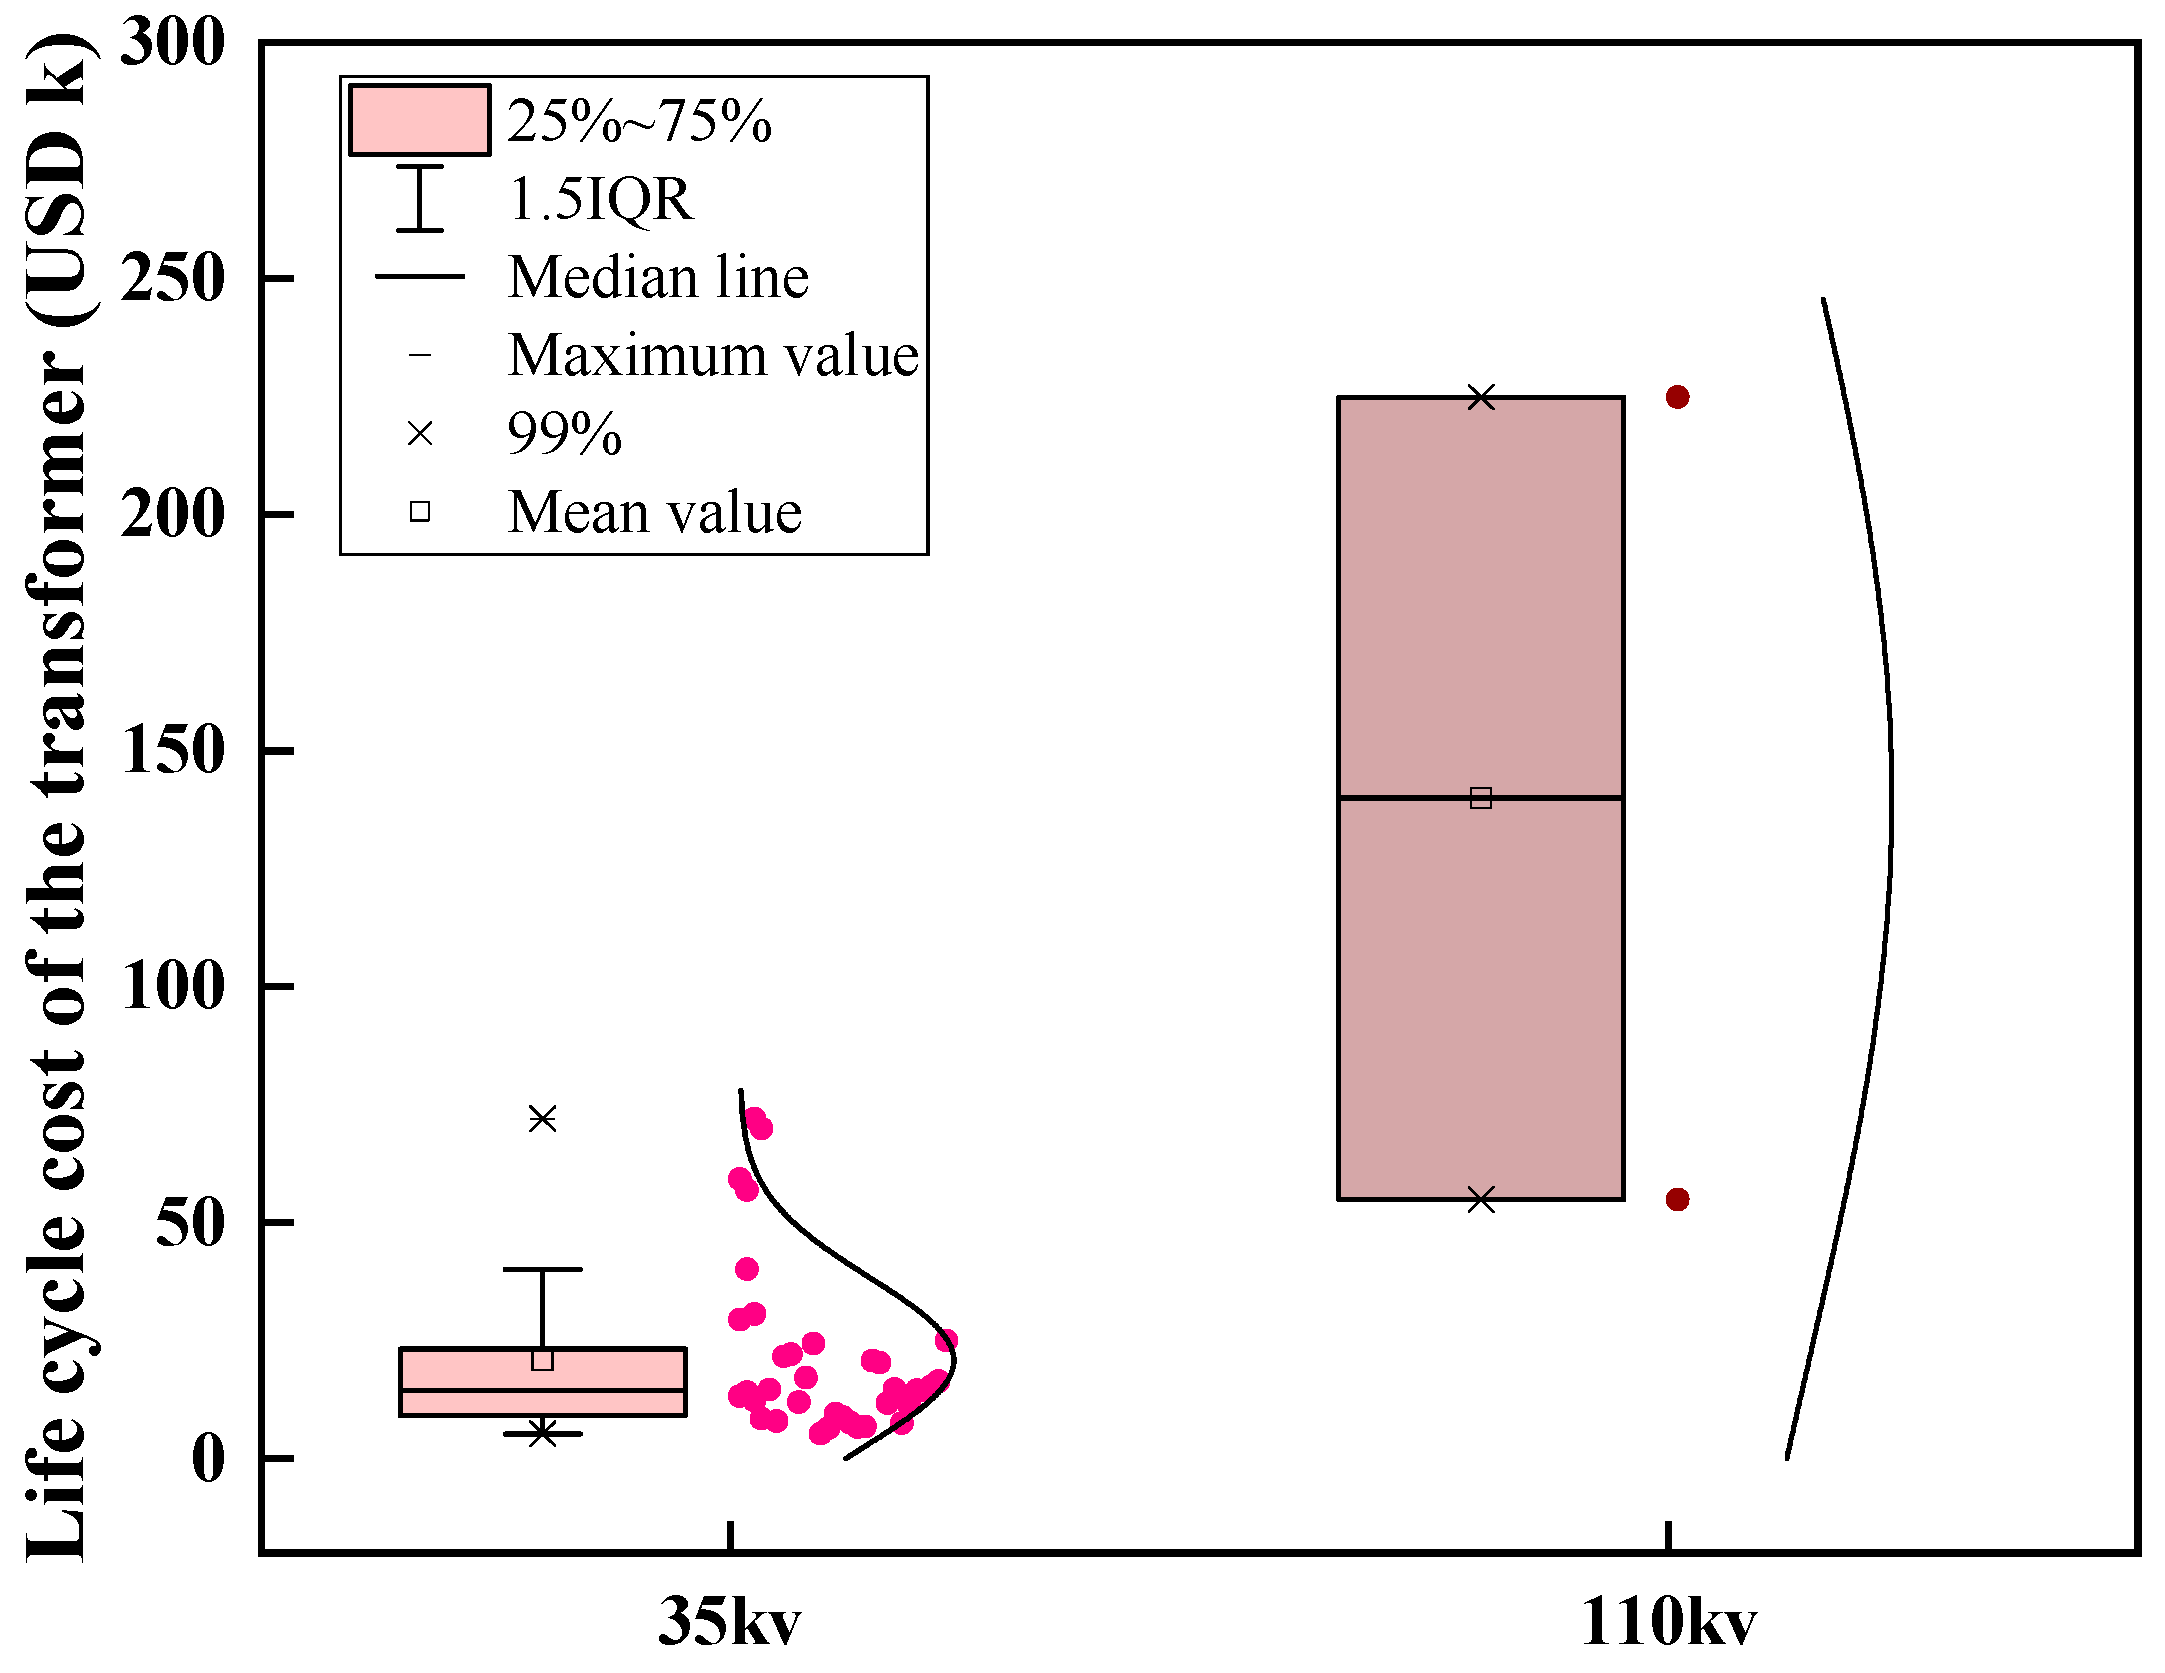
As illustrated in Figure 11, the life cycle cost of transformers from MF3 significantly exceeds that of the other four manufacturers. The costs associated with MF1 and MF4 are closely aligned, with MF2 and MF5 slightly below them. To provide a clearer depiction of the cost disparities among the five manufacturers, we conducted a detailed comparison of cost prediction results across different typical voltage levels. This comparative analysis is elucidated in Figure 12, Figure 13, Figure 14, Figure 15 and Figure 16.
By analyzing Figure 12, Figure 13, Figure 14, Figure 15 and Figure 16, it can be concluded that the cost prediction results for the life cycle of transformers from most manufacturers are relatively stable. And the life cycle cost of transformers produced from MF1, MF2, MF3, and MF5 increases with the increase in voltage level, while the cost of the transformer produced by MF4 with a voltage level of 220 kV is much lower than that of the transformer with a voltage level of 110 kV. The cost forecast results for various transformers from the five major suppliers are shown in Table 4.
5. Conclusions
In this study, the application of life cycle cost theory was applied to the cost evaluation of power transformers and an in-depth study was conducted using the life cycle cost of 110 kV transformers as an example. Based on the distribution of transformer failure rates, the corresponding life cycle cost of transformers can be fitted to assist in the procurement and maintenance arrangements of transformers, and the following conclusions have been drawn:
- (1)
- Based on a large number of fault statistics of transformers, this study established a three-layer fault tree model for transformers with transformer structure as the main auxiliary and combined with transformer prone fault areas. Transformer faults were divided into seven major categories: lead fault, winding fault, iron core fault, bushing fault, oil conservator fault, tap switch fault, and other faults. By analyzing the probability statistics of bottom events, intermediate events, and top events, the transformer failure rate can be obtained.
- (2)
- This study comprehensively analyzed the operating, maintenance, failure, and scrapping costs of transformers during their service life using historical operating data provided by a northern power company. Based on the calculated failure rate distribution, a dataset of the full life cost of various transformers was constructed and effective prediction of the life cost of transformers was provided as a reference indicator for power enterprises to bid and invest.
- (3)
- Equipment procurement management should not only focus on the initial procurement cost of equipment but also include various aspects of the entire life cycle. By estimating and analyzing the full life cycle cost of transformers with different voltage levels, it was found that, the higher the voltage level, the higher the initial procurement cost of transformers. However, the full life cycle cost of transformers with higher initial costs may not necessarily be higher than that of other transformers.
- (4)
- Due to the late start of transformer maintenance work, the available statistical data are not yet very detailed. In future research, we will further conduct in-depth research, collect more detailed transformer inspection data, and use more accurate fitting methods, combined with investment payback time and net present value, to better measure the multidimensional benefits of various equipment.
Author Contributions
Conceptualization, writing—original draft preparation, writing—review and editing, X.Z.; Conceptualization, supervision, H.C. and P.P.; methodology, F.G.; software, L.F. All authors have read and agreed to the published version of the manuscript.
Funding
This research was funded by the Science and Technology Project of State Grid Corporation of China, grant number 5200-202356133A-1-1-ZN, “Research on key technologies of scheme optimization and cost control for transmission and transformation projects considering the development of a unified large market and carbon emission reduction”.
Data Availability Statement
Data is contained within the article.
Conflicts of Interest
The authors declare that they have no known competing financial interests or personal relationships that could have appeared to influence the work reported in this paper.
Abbreviations
| Nomenclature | |||
| Symbols | |||
| C | Cost (k$) | T/t | Time |
| R/r | Rate | p | Probability |
| P | Loss (kW) | W | Power (kW) |
| Subscripts and superscripts | |||
| ep | Equipment purchase | ic | Installation and commissioning |
| rv | Residual value | om | Operation and maintenance |
| ol | Operation loss | min | Minor |
| maj | Major | sc | Scrap |
| dd | Decommissioning disposal | ||
| Abbreviations | |||
| FTA | Failure tree analysis | LCC | Life cycle cost |
| LCECA | Life cycle environmental cost analysis | MF | Manufacturer |
| MTTR | Mean time to repair | ||
References
- Wanyin, C. The problems and countermeasures of asset lifecycle management in power grid enterprises. Chin. Agric. Account. 2023, 33, 109–111. [Google Scholar]
- Bian, J.P.; Yang, S.; Gao, S.C.; Lian, W.J. Maintenance decision of power transformer based on full life cycle cost. J. Power Syst. Autom. 2019, 31, 77–83. [Google Scholar]
- Chen, X.; Song, Y.; Yang, J. Optimal service life evaluation model for in-service equipment based on state linkage. Power Syst. Prot. Control. 2017, 45, 67–73. [Google Scholar]
- Du, M.; Zhao, Y.; Liu, C.; Zhu, Z. Lifecycle cost forecast of 110 kV power transformers based on support vector regression and gray wolf optimization. Alex. Eng. J. 2021, 60, 5393–5399. [Google Scholar] [CrossRef]
- Baoye, D. State assessment and maintenance of transformers during operation. Power Equip. 2006, 7, 57–60. [Google Scholar]
- Cervero, D.; Fotopoulou, M.; Muñoz-Cruzado, J.; Rakopoulos, D.; Stergiopoulos, F.; Nikolopoulos, N.; Voutetakis, S.; Sanz, J.F. Solid State Transformers: A Critical Review of Projects with Relevant Prototypes and Demonstrators. Electronics 2023, 12, 931. [Google Scholar] [CrossRef]
- Khan, S.; Rahman, K.; Tariq, M.; Hameed, S.; Alamri, B.; Babu, T.S. Solid-State Transformers: Fundamentals, Topologies, Applications, and Future Challenges. Sustainability 2022, 14, 319. [Google Scholar] [CrossRef]
- Santos, N.; Chaves, M.; Gamboa, P.; Cordeiro, A.; Santos, N.; Pinto, S.F. High Frequency Transformers for Solid-State Transformer Applications. Appl. Sci. 2023, 13, 7262. [Google Scholar] [CrossRef]
- Zaldivar, D.A.; Sanchez, A.M.; Romero, A.A. A comprehensive methodology for the optimization of condition-based maintenance in power transformer fleets. Electr. Power Syst. Res. 2023, 220, 109374. [Google Scholar] [CrossRef]
- Liu, J.; Song, D.; Li, Q.; Yang, J.; Hu, Y.; Fang, F.; Hoon Joo, Y. Life cycle cost modelling and economic analysis of wind power: A state of art review. Energ. Convers. Manag. 2023, 277, 116628. [Google Scholar] [CrossRef]
- Hosseinkhanloo, M.; Kalantari, N.T.; Behjat, V.; Ravadanegh, S.N. Optimal exploitation of power transformer fleet considering loss of life and economic evaluation based on failure probability. Electr. Power Syst. Res. 2022, 213, 108801. [Google Scholar] [CrossRef]
- Jeromin, I.; Balzer, G.; Balzer, J.; Balzer, R. Life cycle cost analysis of transmission and distribution systems. In Proceedings of the 2009 IEEE Bucharest PowerTech, Bucharest, Romania, 28 June–2 July 2009. [Google Scholar]
- Waugh, N.T.; Muir, D.D. Improving the life cycle management of power transformers transforming data to life. In Proceedings of the SoutheastCon, Fort Lauderdale, FL, USA, 9–12 April 2015. [Google Scholar]
- Breidenbach, D.P. Life cycle cost analysis. In Proceedings of the IEEE National Aerospace and Electronics Conference, Dayton, OH, USA, 22–26 May 1989. [Google Scholar]
- Senthil Kumaran, D.; Ong, S.K.; Tan, R.B.H.; Nee, A.Y.C. Environmental life cycle cost analysis of products. Environ. Manag. Health 2001, 12, 260–276. [Google Scholar] [CrossRef]
- Jiang, W. Selection of Substation Main Transformers Based on Full Life Cycle Cost. Electr. Electr. 2009, 29, 21–23. [Google Scholar]
- Li, T.; Ma, W.; Huang, X.B. Management of Substation Equipment Based on Life Cycle Cost Theory. Power Grid Technol. 2008, 11, 50–53. [Google Scholar]
- Jian, M. Research on Procurement of 220kV Power Transformers Based on the Theory of Full Lifecycle Cost; South China University of Technology: Guangzhou, China, 2017. [Google Scholar]
- Yang, G.; Ghazali, Y. Managing on-load tap changer life cycle in tenaga nasional berhad (TNB) distribution power transformers. CIRED—Open Access Proc. J. 2017, 2017, 303–307. [Google Scholar] [CrossRef]
- Meyer, C.; De Doncker, R.W. LCC analysis of different resonant circuits and solid-state circuit breakers for medium-voltage grids. IEEE Trans. Power Deliver. 2006, 21, 1414–1420. [Google Scholar] [CrossRef]
- Zhao, Y. Optimization of support vector regression based on grey wolf algorithm for predicting the full life cycle cost of 110kV power transformers. J. Chongqing Electr. Power Coll. 2023, 28, 24–29. [Google Scholar]
- Zhijian, H. Research on Cost Optimization of Transformer Life Cycle; North China Electric Power University: Beijing, China, 2011. [Google Scholar]
- Sonawane, P.R.; Bhandari, S.; Patil, R.B.; Al-Dahidi, S. Reliability and Criticality Analysis of a Large-Scale Solar Photovoltaic System Using Fault Tree Analysis Approach. Sustainability 2023, 15, 4609. [Google Scholar] [CrossRef]
- Singh, J.; Singh, S.; Singh, A. Distribution transformer failure modes, effects and criticality analysis (FMECA). Eng. Fail. Anal. 2019, 99, 180–191. [Google Scholar] [CrossRef]
- Huang, W.; Shao, C.; Hu, B.; Li, W.; Sun, Y.; Xie, K.; Zio, E.; Li, W. A restoration-clustering-decomposition learning framework for aging-related failure rate estimation of distribution transformers. Reliab. Eng. Syst. Safe 2023, 232, 109043. [Google Scholar] [CrossRef]
- Shao, Y. Application of Fault Tree Analysis in System Fault Diagnosis. Manuf. Inf. Eng. China 2007, 1, 72–74. [Google Scholar]
- Jianhua, H. The current situation and development of status maintenance of high-voltage electrical equipment in substations. Transformer 2002, 39, 11–15. [Google Scholar]
- Bertling, L.; Allan, R.; Eriksson, R. A Reliability-Centered Asset Maintenance Method for Assessing the Impact of Maintenance in Power Distribution Systems. IEEE Trans. Power Syst. 2005, 20, 75–82. [Google Scholar] [CrossRef]
- Barkas, D.A.; Chronis, I.; Psomopoulos, C. Failure mapping and critical measurements for the operating condition assessment of power transformers. Energy Rep. 2022, 8, 527–547. [Google Scholar] [CrossRef]
- Soni, R.; Mehta, B. Evaluation of power transformer health analysis by internal fault criticalities to prevent premature failure using statistical data analytics approach. Eng. Fail. Anal. 2022, 136, 106213. [Google Scholar] [CrossRef]
- A statistical approach to processing power transformer failure data. In Proceedings of the 19th International Conference on Electricity Distribution, Vienna, Austria, 21–24 May 2007.
- Zheng, Z. Research on Optimization of Transformer Life Cycle Cost Based on Rhododendron Algorithm. Power Syst. Prot. Control 2019, 47, 49–55. [Google Scholar]
- Chen, Z. Research on Total Life Cycle Cost of Transformers Based on Improved Fault Rate; Hunan University: Changsha, China, 2014. [Google Scholar]
Figure 1.
The flow diagram of the life cycle cost management of power equipment.

Figure 2.
Composition of the life cycle cost for power grid equipment.

Figure 3.
Structural diagram of transformer fault tree.

Figure 4.
Schematic diagram of the specific workflow of this study.

Figure 5.
Comparison chart of life cycle cost of transformers with different voltage levels.

Figure 6.
Schematic diagram of life cycle cost prediction for 35 kV transformers.

Figure 7.
Schematic diagram of life cycle cost prediction for 110 kV transformers.

Figure 8.
Schematic diagram of life cycle cost prediction for 220 kV transformers.

Figure 9.
Schematic diagram of life cycle cost prediction for 330 kV transformers.

Figure 10.
Schematic diagram of life cycle cost prediction for 750 kV transformers.

Figure 11.
Comparison chart of life cycle cost of transformers with different manufacturers.

Figure 12.
Schematic diagram of life cycle cost prediction for transformers from MF1.

Figure 13.
Schematic diagram of life cycle cost prediction for transformers from MF2.

Figure 14.
Schematic diagram of life cycle cost prediction for transformers from MF3.

Figure 15.
Schematic diagram of life cycle cost prediction for transformers from MF4.

Figure 16.
Schematic diagram of life cycle cost prediction for transformers from MF5.


Table 1.
The specific parameters of the 110 kv transformer.
| Item | Value |
|---|---|
| Equipment type | Transformer |
| Voltage level | 110 kV |
| Operation date | 2011.12 |
| Equipment model | SSZ11-63000/110 |
| Rated capacity (MVA) | 63 |
| Arrangement | Above ground and outdoors |
| Pollution class | C |
| Insulator | Oil immersion |
| Winding configurations | Three-winding |
| Cooling method | ONAF |
| Rated voltage | 110 kv |
| Rated current | 330.7 A |
| Substation type | AIS |
Table 2.
The specific cost prediction results.
| Operating Year | C1 (USD k) | C2 + C3 + C4 (USD k) | C5 (USD k) | Predicted C2 + C3 + C4 (USD k) | LCC (USD k) |
|---|---|---|---|---|---|
| 2016 | 34.13 | 1.01 | −2.45 | 41.01 | 72.68 |
| 2017 | 34.13 | 1.53 | −2.45 | ||
| 2018 | 34.13 | 2.42 | −2.45 | ||
| 2019 | 34.13 | 3.50 | −2.45 | ||
| 2020 | 34.13 | 0.28 | −2.45 | ||
| 2021 | 34.13 | 0.13 | −2.45 |
Table 3.
Comparison of life cycle costs of transformers with different voltage levels.
| Item | Value (USD k) | |
|---|---|---|
| 35 kV transformers | Fluctuation range | 11.66–24.92 |
| Average value | 20.69 | |
| 110 kV transformers | Fluctuation range | 51.55–91.01 |
| Average value | 78.66 | |
| 220 kV transformers | Fluctuation range | 149.89–221.40 |
| Average value | 188.75 | |
| 330 kV transformers | Fluctuation range | 14.61–108.09 |
| Average value | 59.34 | |
| 750 kV transformers | Fluctuation range | 153.50–230.37 |
| Average value | 219.85 | |
Table 4.
Comparison of life cycle costs of transformers from different manufacturers.
| Item | Mean Value (USD k) | Fluctuation Range (USD k) | |
|---|---|---|---|
| MF1 | 35 kV transformers | 19.40 | 12.53–21.76 |
| 110 kV transformers | 76.71 | 56.53–85.78 | |
| MF2 | 35 kV transformers | 16.93 | 11.28–20.68 |
| 110 kV transformers | 77.74 | 57.27–106.88 | |
| MF3 | 110 kV transformers | 56.69 | 26.93–57.93 |
| 220 kV transformers | 152.37 | 118.57–188.64 | |
| 750 kV transformers | 190.67 | 174.07–212.46 | |
| MF4 | 110 kV transformers | 72.00 | 49.02–75.76 |
| 220 kV transformers | 15.60 | 9.19–20.44 | |
| MF5 | 35 kV transformers | 20.81 | 9.17–23.26 |
| 110 kV transformers | 139.88 | 54.90–224.85 | |
Disclaimer/Publisher’s Note: The statements, opinions and data contained in all publications are solely those of the individual author(s) and contributor(s) and not of MDPI and/or the editor(s). MDPI and/or the editor(s) disclaim responsibility for any injury to people or property resulting from any ideas, methods, instructions or products referred to in the content. |
© 2024 by the authors. Licensee MDPI, Basel, Switzerland. This article is an open access article distributed under the terms and conditions of the Creative Commons Attribution (CC BY) license (https://creativecommons.org/licenses/by/4.0/).
Share and Cite
MDPI and ACS Style
Zhao, X.; Gui, F.; Chen, H.; Fan, L.; Pan, P. Life Cycle Cost Estimation and Analysis of Transformers Based on Failure Rate. Appl. Sci. 2024, 14, 1210. https://doi.org/10.3390/app14031210
AMA Style
Zhao X, Gui F, Chen H, Fan L, Pan P. Life Cycle Cost Estimation and Analysis of Transformers Based on Failure Rate. Applied Sciences. 2024; 14(3):1210. https://doi.org/10.3390/app14031210
Chicago/Turabian StyleZhao, Xinyue, Fangxu Gui, Heng Chen, Lanxin Fan, and Peiyuan Pan. 2024. "Life Cycle Cost Estimation and Analysis of Transformers Based on Failure Rate" Applied Sciences 14, no. 3: 1210. https://doi.org/10.3390/app14031210
Note that from the first issue of 2016, this journal uses article numbers instead of page numbers. See further details here.