
A Novel Method Based on Topological Perception Theory for 3D Landmark Building Model Retrieval

School of Earth Sciences and Engineering, Hohai University, Nanjing 211000, China
*
Author to whom correspondence should be addressed.
Appl. Sci. 2024, 14(3), 1146; https://doi.org/10.3390/app14031146
Submission received: 16 November 2023
/
Revised: 10 December 2023
/
Accepted: 25 December 2023
/
Published: 30 January 2024
(This article belongs to the Section Earth Sciences)
Abstract
:Landmark building models typically exhibit intricate structures, posing challenges for retrieval using generic descriptors. To address this challenge, this paper abstracts and simplifies the model into simple topological structures grounded in topological perceptual theory and introduces a novel categorization of landmark building models. Furthermore, based on view, the quotient distance–angle histogram algorithm is proposed for extracting model topological features. This approach facilitates the identification of intricate landmark building models and enhances retrieval performance. In addition, a new projection method is also proposed. Based on the fact that most landmark building models have correct upright direction and the significant topological features predominantly emerge in the top or side views of these models, this method can accelerate the subsequent extraction and matching of shape descriptors by reducing the extraction of model views. Compared with the existing methods, the proposed projection method is more consistent with human visual perception, and the experimental results verify that the proposed method can improve the retrieval performance when classifying the topological structure of 3D landmark building models.
1. Introduction
Landmark buildings possess prominent visual features [1,2], serving as crucial spatial reference points within the geographical environment and foundational elements in cognitive mapping. With the proliferation of online maps and rapid urban development, landmark buildings are assuming an increasingly significant role in guiding pedestrians, determining spatial positions, and providing route directions [3,4,5,6,7]. Three-dimensional landmark buildings offer more immersive visual information [8], aiding in spatial recollection and decision-making during navigation [9]. The rapid advancements in photogrammetry, computer vision, scanning, the contemporary approach of grammar shape studies [10], and 3D modeling technologies have made it feasible to create detailed and user-friendly 3D models of landmark buildings in a cost-effective manner. This is possibly the main reason why 3D digital urban models have become so increasingly popular. Research findings indicate that 40% of new product development involves the reuse of existing or vendor-supplied products, while another 40% pertains to the modification and reuse of existing products. A mere 20% of products undergoes a complete redesign. This suggests that the majority of design tasks can benefit from the reuse of previous product design knowledge [11]. Maximizing the reuse of existing products to develop new ones based on product similarities not only reduces costs and shortens design times but also effectively enhances the reliability of the product, ensuring overall product quality [12]. Indeed, beyond expediting access to necessary 3D models for urban planners and designers, 3D model retrieval can provide important visualization support for city management and operation in urban space [13]. Furthermore, it has the capacity to deliver a spectrum of services and experiences for city residents and visitors, thereby amplifying the attractiveness and competitiveness of cities. In this context, the retrieval of 3D landmark building models has become an important research direction.
Shape-based matching methods are preferred over text-based methods because visual cues of 3D landmark models available on the web are usually not sufficiently annotated, and moreover, some misannotations occur [14]. Textual annotations often suffer from ambiguity given their susceptibility to influence from variables such as language, culture, age, gender, and other human-associated factors. Conversely, measurable visual properties like shape, color, and texture can typically be directly extracted from the objects. Hence, this paper concentrates on facile extraction of shape features directly from landmark models to subsequently utilize those features for shape-based retrieval of landmark mode. In the realm of information retrieval, the importance of shape retrieval cannot be overstated. Shape retrieval is increasingly being used as a primary cue for indexing in numerous applications [15]. This holds true for geobrowsers as well: Shape-based model matching proves notably valuable for swiftly identifying landmark buildings using user-provided geometric cues. This is particularly beneficial for individuals who are concerned with and interested in information pertaining to landmark building shapes, including sketchers and architects.
2. Related Work
Three-dimensional model retrieval feature extraction algorithms can be categorized into four main types: statistical feature-based, function transformation-based, view-based, and hybrid feature extraction methods [16,17,18,19]. The view-based feature extraction method generally obtains one or more views by projection, then extracts the features of the views, and finally generates the features of the model through the features of the views. View-based feature extraction methods have gained wide acceptance due to their alignment with human visual perception and their increased resilience to model noise and simplification. Ohbuchi [20] introduced a novel approach where an icosahedron is positioned on the model’s bounding sphere to generate an 80-hedral polyhedron through a cyclic subdivision algorithm. From this, 42 depth views are derived by projection. Finally, Fourier descriptors are employed for feature extraction. However, this process is computationally expensive. In the experiment conducted by Chen [17], a regular dodecahedron is initially used to enclose the 3D model. Subsequently, the 20 vertices of the dodecahedron serve as viewpoint pairs for acquiring the views. View features are extracted using Zernike moments and Fourier transform descriptors. Retrieval results demonstrate the superiority of this method over many traditional approaches. Nevertheless, there is a large number of redundant views, and it is ignored that the features of different views have different importance to the 3D model. Liu [21] obtained six greyscale images by orthogonally projecting each model onto the six faces of a projection cube containing the model. Subsequently, the Hu invariant moment and Fourier transform descriptor were employed to extract the features of the projected image. In recent years, some researchers have combined deep learning with view-based methods. Su [22] employed a two-layer convolutional neural network for model classification. The first convolutional neural network layer separately extracts features from 12 2D views, which are then merged and fed into the second neural network layer to obtain a comprehensive shape descriptor. However, this network may not be able to take full advantage of the multi-view feature because it discards non-maximum values in the maximum pooling operation. To address this shortcoming, some scholars have tried to use the long short-term memory (LSTM) network to aggregate the features of multi-view images [23,24]. In addition, Chen [25] proposed the use of a recurrent attention model to automatically select view sequences for accurate 3D shape recognition. Ding [26] integrated light field descriptors with clustering to generate representative views, followed by feature extraction using a convolutional neural network.
However, the majority of existing shape descriptors are designed for generic 3D models. The diverse architectural styles pose a significant challenge to effective shape retrieval for landmark building models. In contrast to conventional 3D building models, 3D landmark building models exhibit more pronounced topological structures, including holes, separations, and other unique shapes, resulting in higher matching complexity. Therefore, this paper introduces a novel shape retrieval method based on topological perception theory for retrieving 3D landmark building models. The primary contributions of this paper encompass three key aspects: Firstly, based on the theory of topological perception, this paper abstracts and simplifies the landmark building model into a simple topological structure and reclassifying landmark building model from a new perspective. Secondly, addressing the limitation of previous shape descriptors in adequately capturing topological perception features, we propose a novel feature extraction method employing the quotient distance–angle histogram (QDAH) to extract topological features, thereby enhancing sensitivity to distinct topological perception structures. Finally, to enhance matching efficiency, considering the actual situation of the significant topological features being predominantly found in the top or side views of the landmark building model and the majority of 3D landmark building models having the correct upright direction, this paper makes reasonable use of spatial information, proposing a new projection method aimed at enhancing efficiency through the reduction of projected views.
The rest of this paper is arranged as follows. Section 3 introduces the theory of topological perception. Section 4 introduces the classification of model categories based on topological perception theory. Section 5 presents the proposed method based on topological perception theory. In Section 6, we compare and analyze the proposed method with other methods. Section 7 discusses the results of the proposed method in this paper in comparison with other related algorithms and looks ahead to possible follow-up work. The conclusions of this work are included in Section 8.
3. Topological Perception Theory
Topology, a branch of mathematics sometimes referred to as “rubber sheet geometry”, explores the equivalence of two objects when they can be continuously deformed into each other through spatial motions like bending, twisting, stretching, and shrinking [27]. This process excludes tearing apart or gluing together parts. The primary focus of topology lies in identifying properties that persist despite these continuous deformations. Although it shares similarities with geometry, topology diverges in that geometrically equivalent objects often share numerically measured quantities, such as lengths or angles, whereas topologically equivalent objects exhibit qualitative resemblances.
In some instances, topological considerations involve ordinary objects existing in three- or lower-dimensional space. For instance, a simple loop in a plane and the boundary edge of a square in a plane are topologically equivalent. This equivalence becomes apparent when imagining the loop as a rubber band that can be stretched to snugly fit around the square. Conversely, the surface of a sphere is not topologically equivalent to a torus, the surface of a solid doughnut ring. This distinction arises because any small loop on a fixed sphere can be continuously shrunk, while staying on the sphere, to any arbitrarily small diameter. An object with this property is termed “simply connected,” and the quality of being simply connected remains unchanged under continuous deformation.
Topological perception theory solves the important question of the onset of visual processes in cognitive science [28]. This theory suggests that topological perception has global geometric invariance and is prioritized over the onset of other geometric percepts [29]. Topological features such as holes and separated structures that have higher recognition rates than shape features such as circles, triangles, and squares [30]. Numerous brain fMRI experiments illustrate that topological perception is associated with the anterior temporal lobe region of the human brain, which lays the physiological foundation of topological perception [31]. In addition, studies of the apparent motion phenomenon, the illusory conjunctions effect, the structural advantage effect, and the masked priming phenomenon have all shown the importance of detecting topological properties in visual perception processes [32,33,34,35]. At the same time, this idea has been supported by germline genetics and developmental psychology [36,37,38]. To summarize, topological perception is a fundamental geometric perception common to human beings [35].
4. Model Category Classification
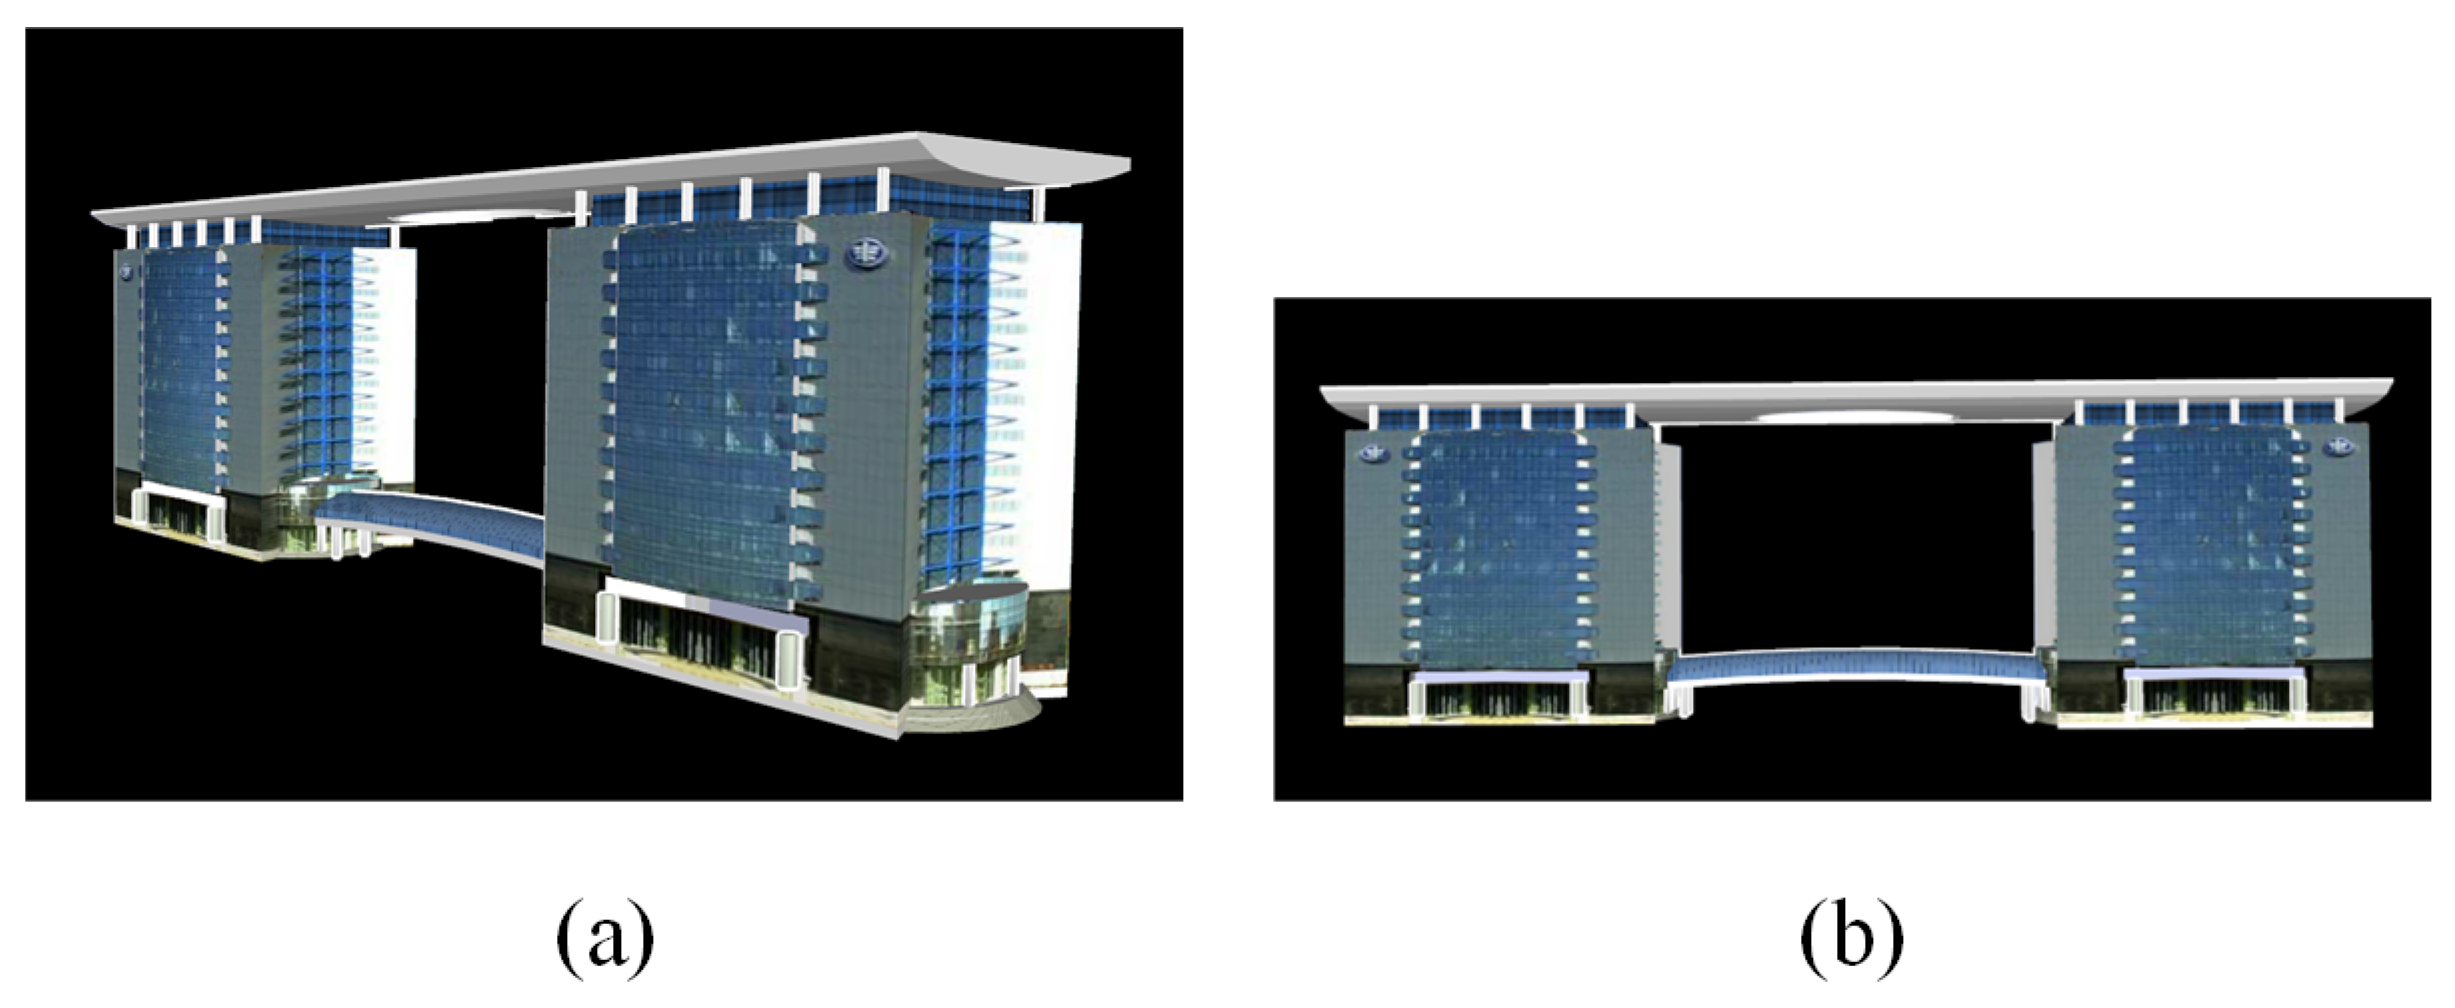
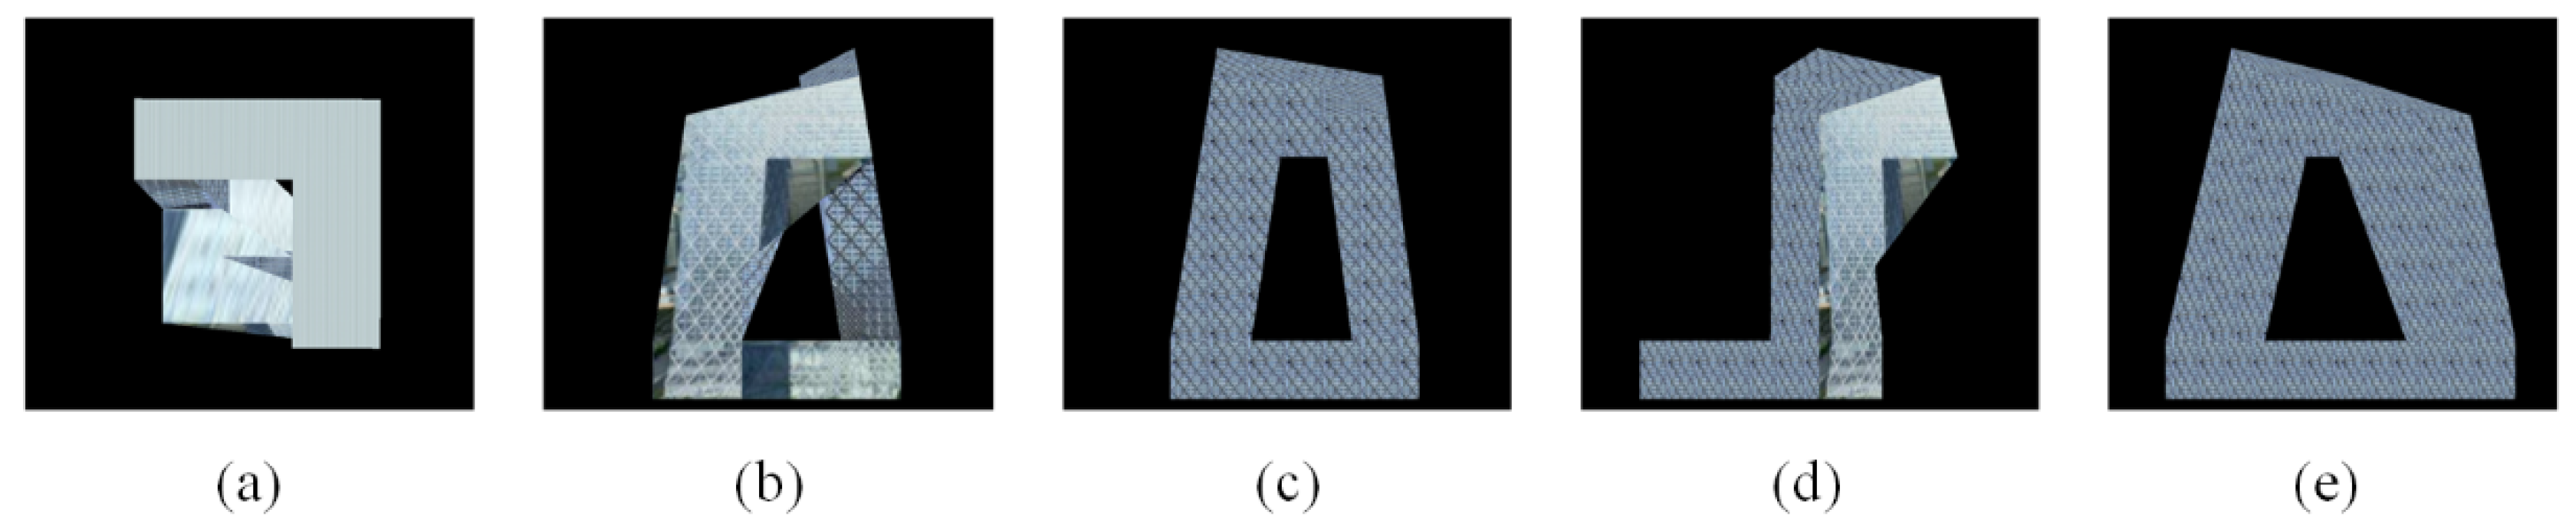
There is a large number of models with complex structures and textures in the landmark building model. View-based methods require projections from various angles to acquire different views. When utilizing common descriptors such as color histograms and contour descriptors to extract view features, the resultant features often lack stability. Even a minor alteration in the viewing angle can lead to substantial changes in the corresponding view features, compromising the reliability of retrieval outcomes. In contrast, topological features exhibit greater stability, consistently yielding similar characteristics for adjacent views. (Using the contour as an example (see Figure 1), when the model is rotated, the contour will be deformed, a rectangle may become a square, a circle may become an ellipse, and features related to the contour such as curvature features, aspect ratio features, and features extracted by the Fourier descriptor will become very different. Color- and texture-related features are similar to contours. On the contrary, the topological structure of the image does not change easily and it still retains the “hole” features). Therefore, extracting topological features is a reliable strategy to effectively minimize the interference of complex structures and textures during the retrieval process.
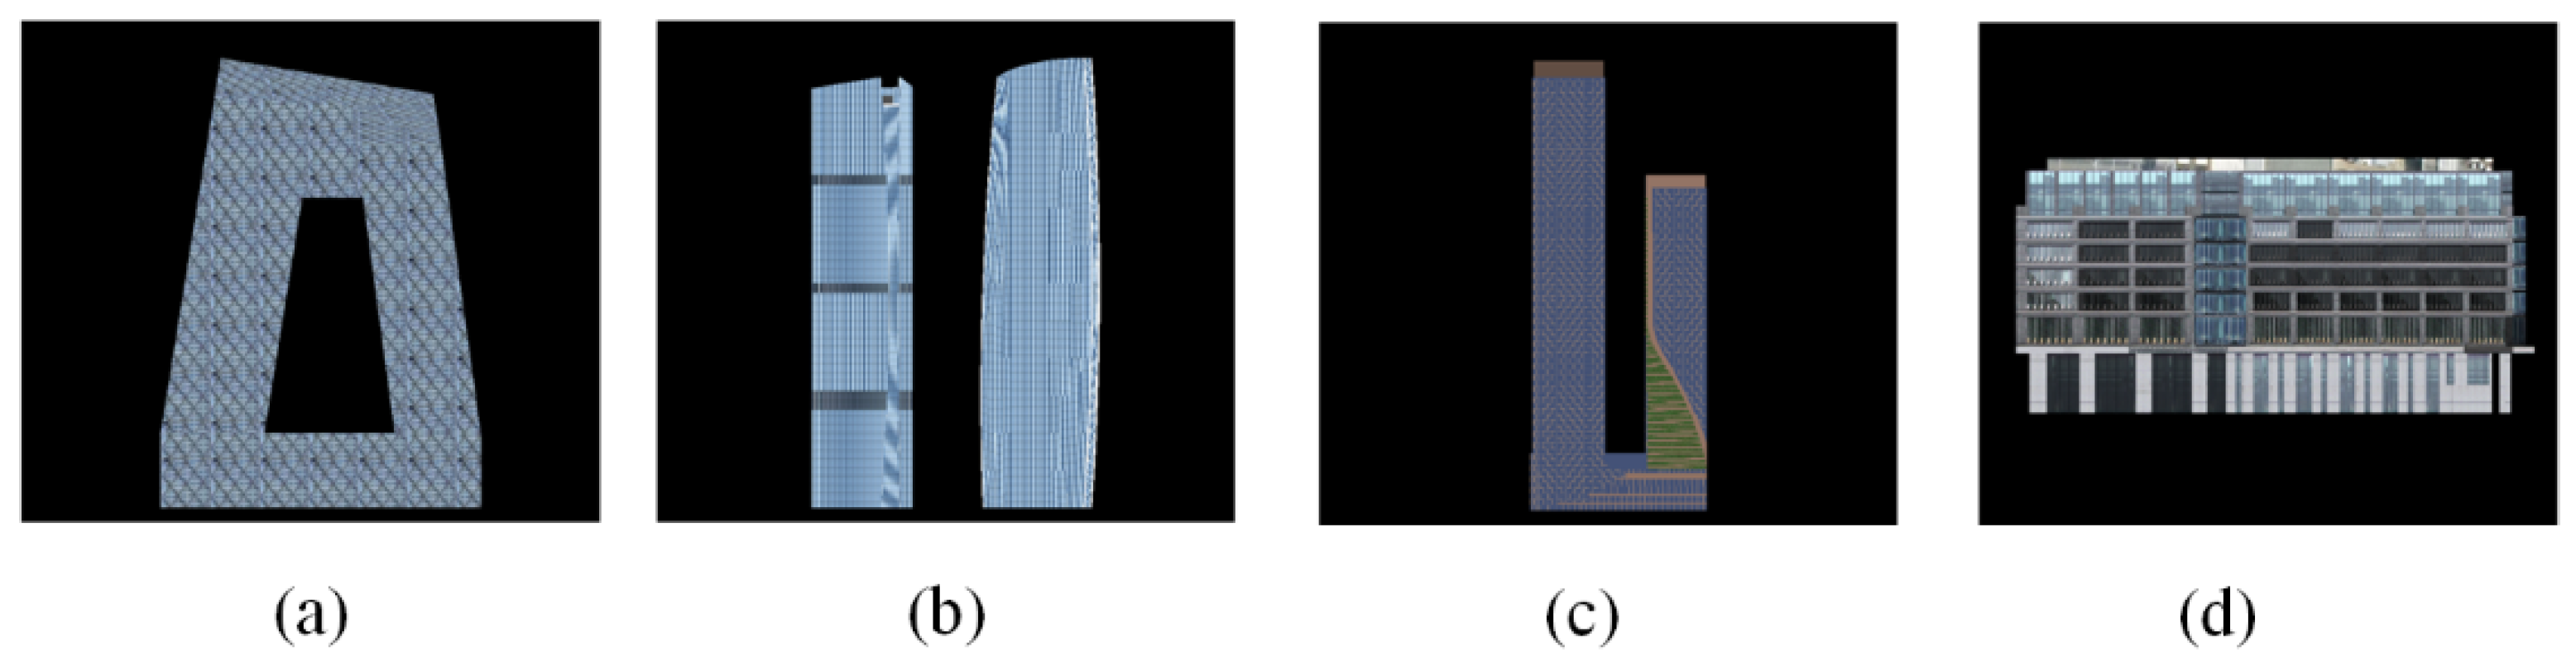
Therefore, instead of focusing on features such as texture, color, and local curvature changes of the view, this paper focuses on the topological differences of the graphs. With the help of topological perception theory, we are able to classify models from a novel perspective. Topological perception theory posits three critical topological features: holes, connectivity, and internal/external relations, which take precedence over other geometric aspects. This paper initially categorizes images into four primary types: hole images, separated images, concave unclosed images, and non-concave images, as show in Figure 2.
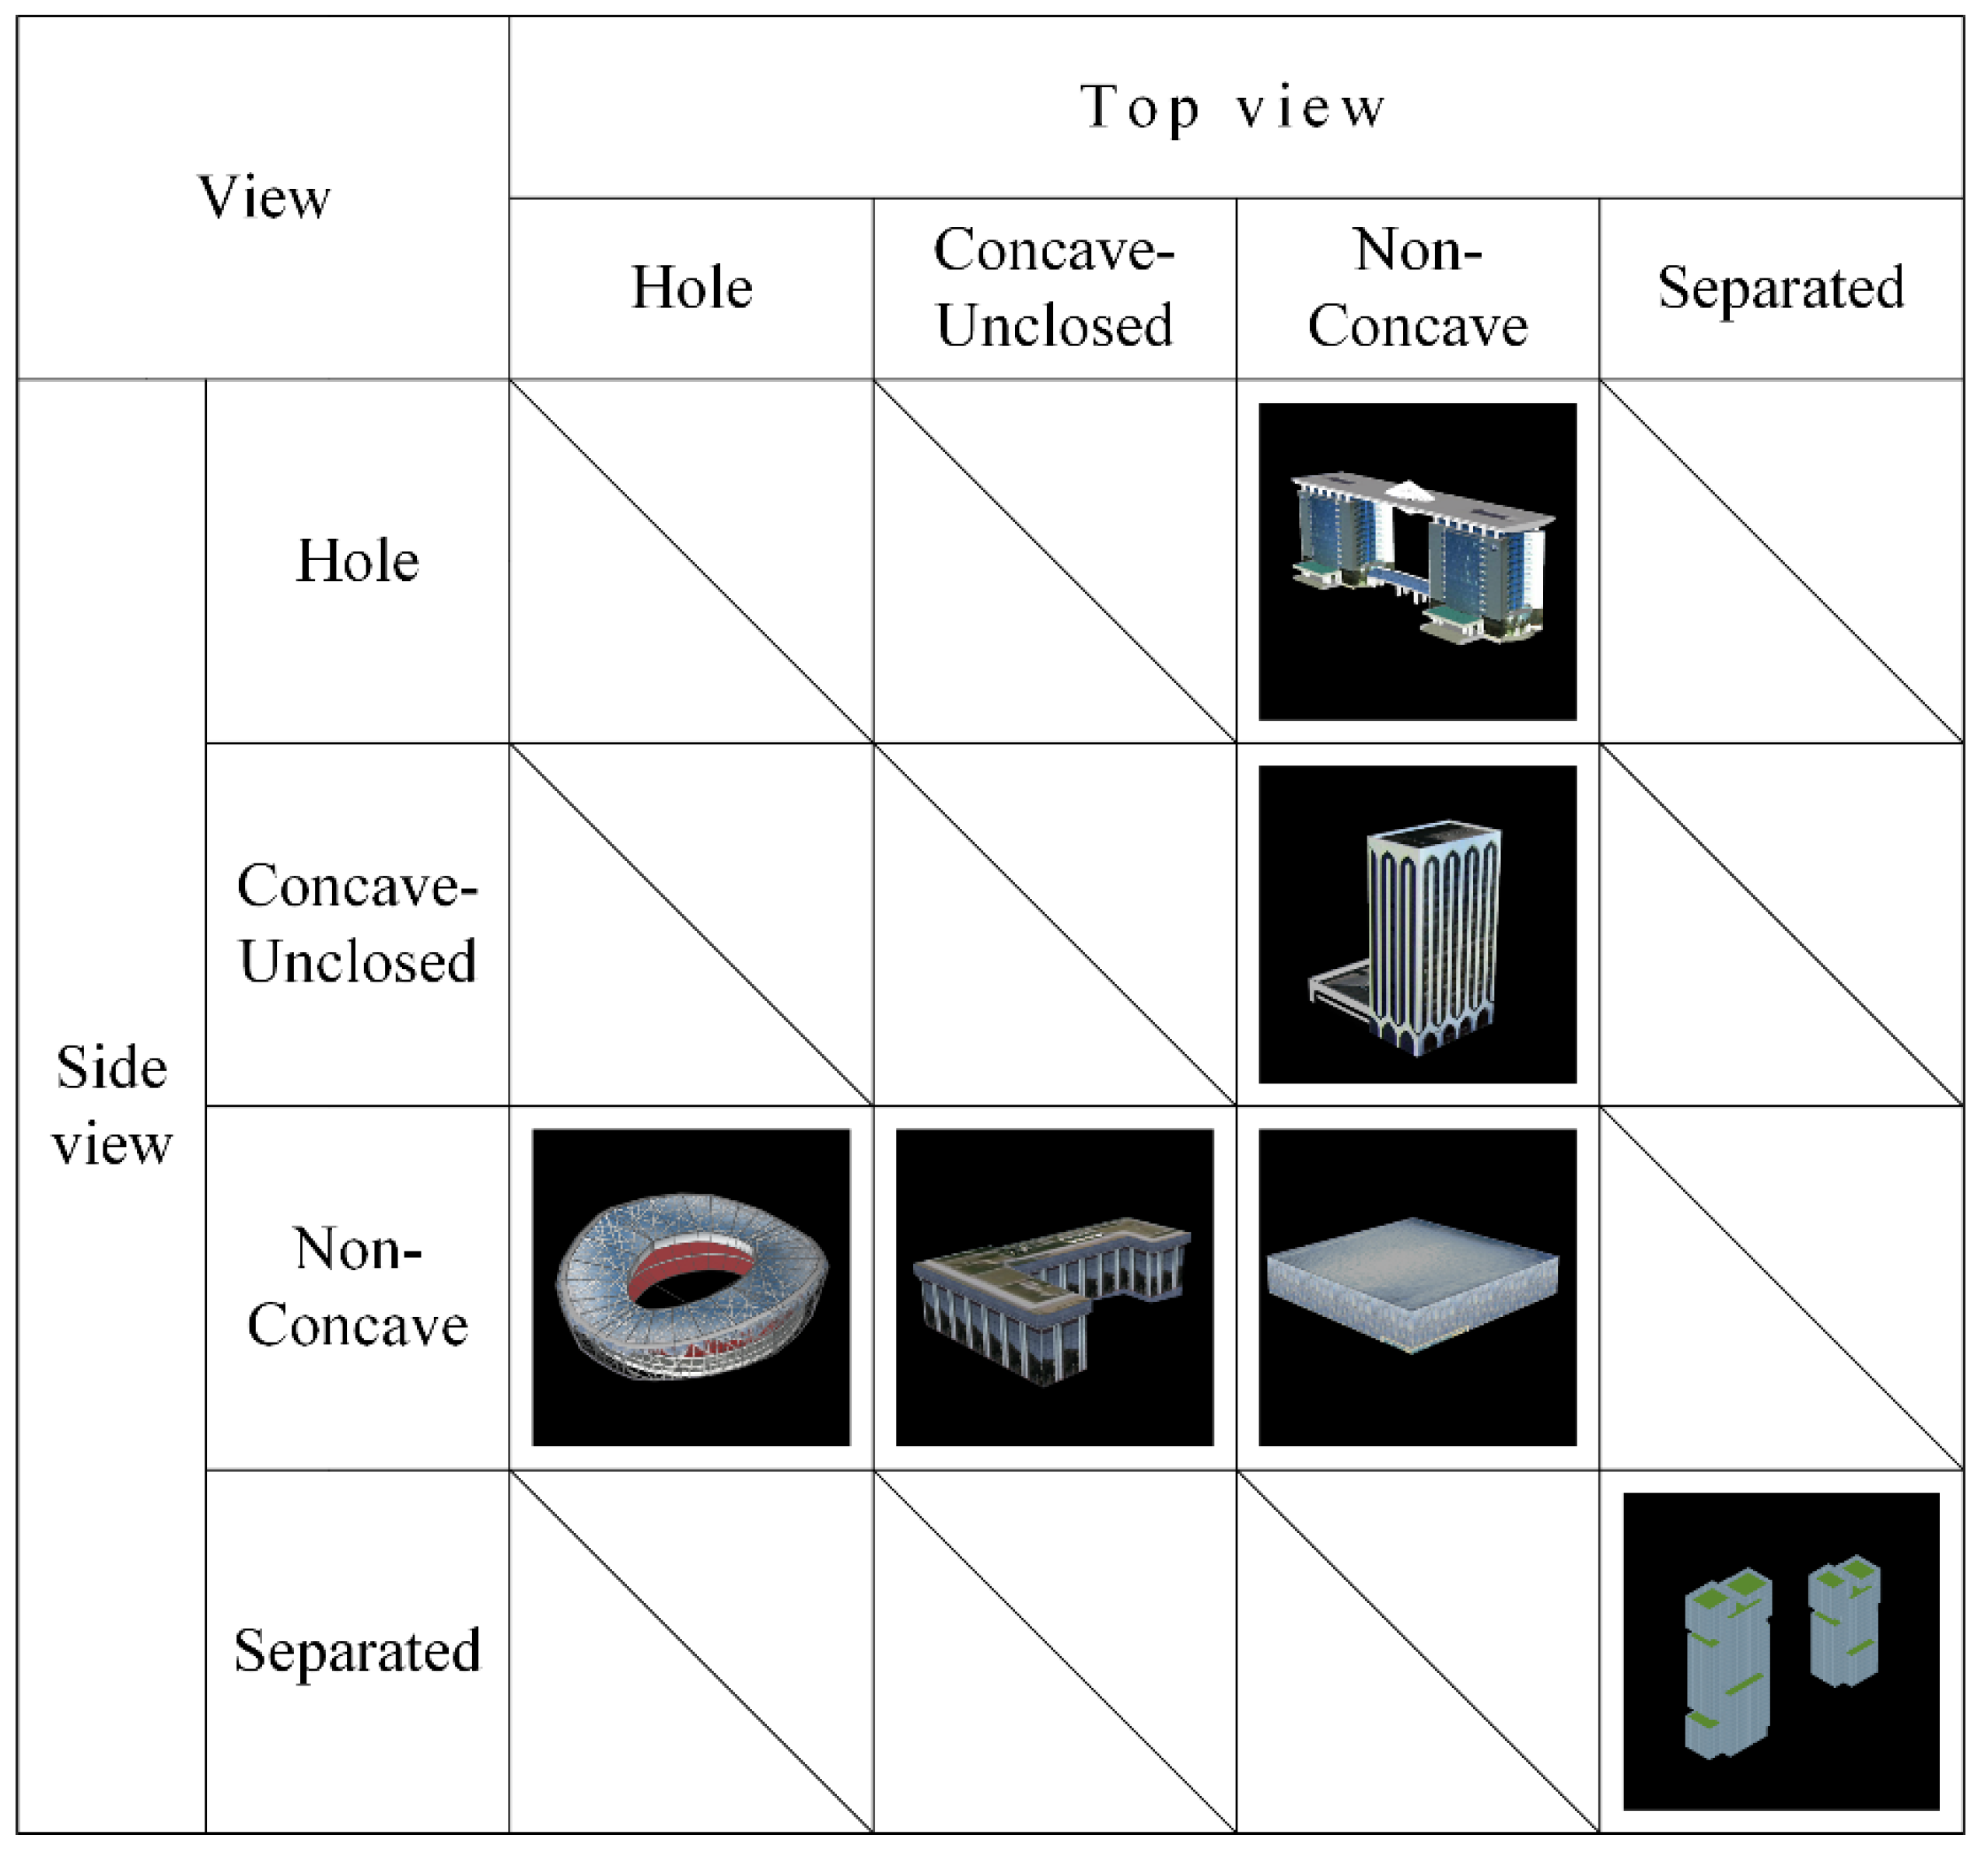
Subsequently, considering that the views with significant topological features are primarily located on the top or side views of the model, this paper firstly divided the landmark building model into 16 shapes by combining the 4 topological structures of the top view and the 4 topological structures of the side view in pairwise combinations. Since some of the combinations cannot exist in reality or the number collected did not meet the requirements, we ultimately selected six categories of 3D topological structure models as the subsequent experimental dataset. The various categories of models are shown in Figure 3.
5. Proposed Method
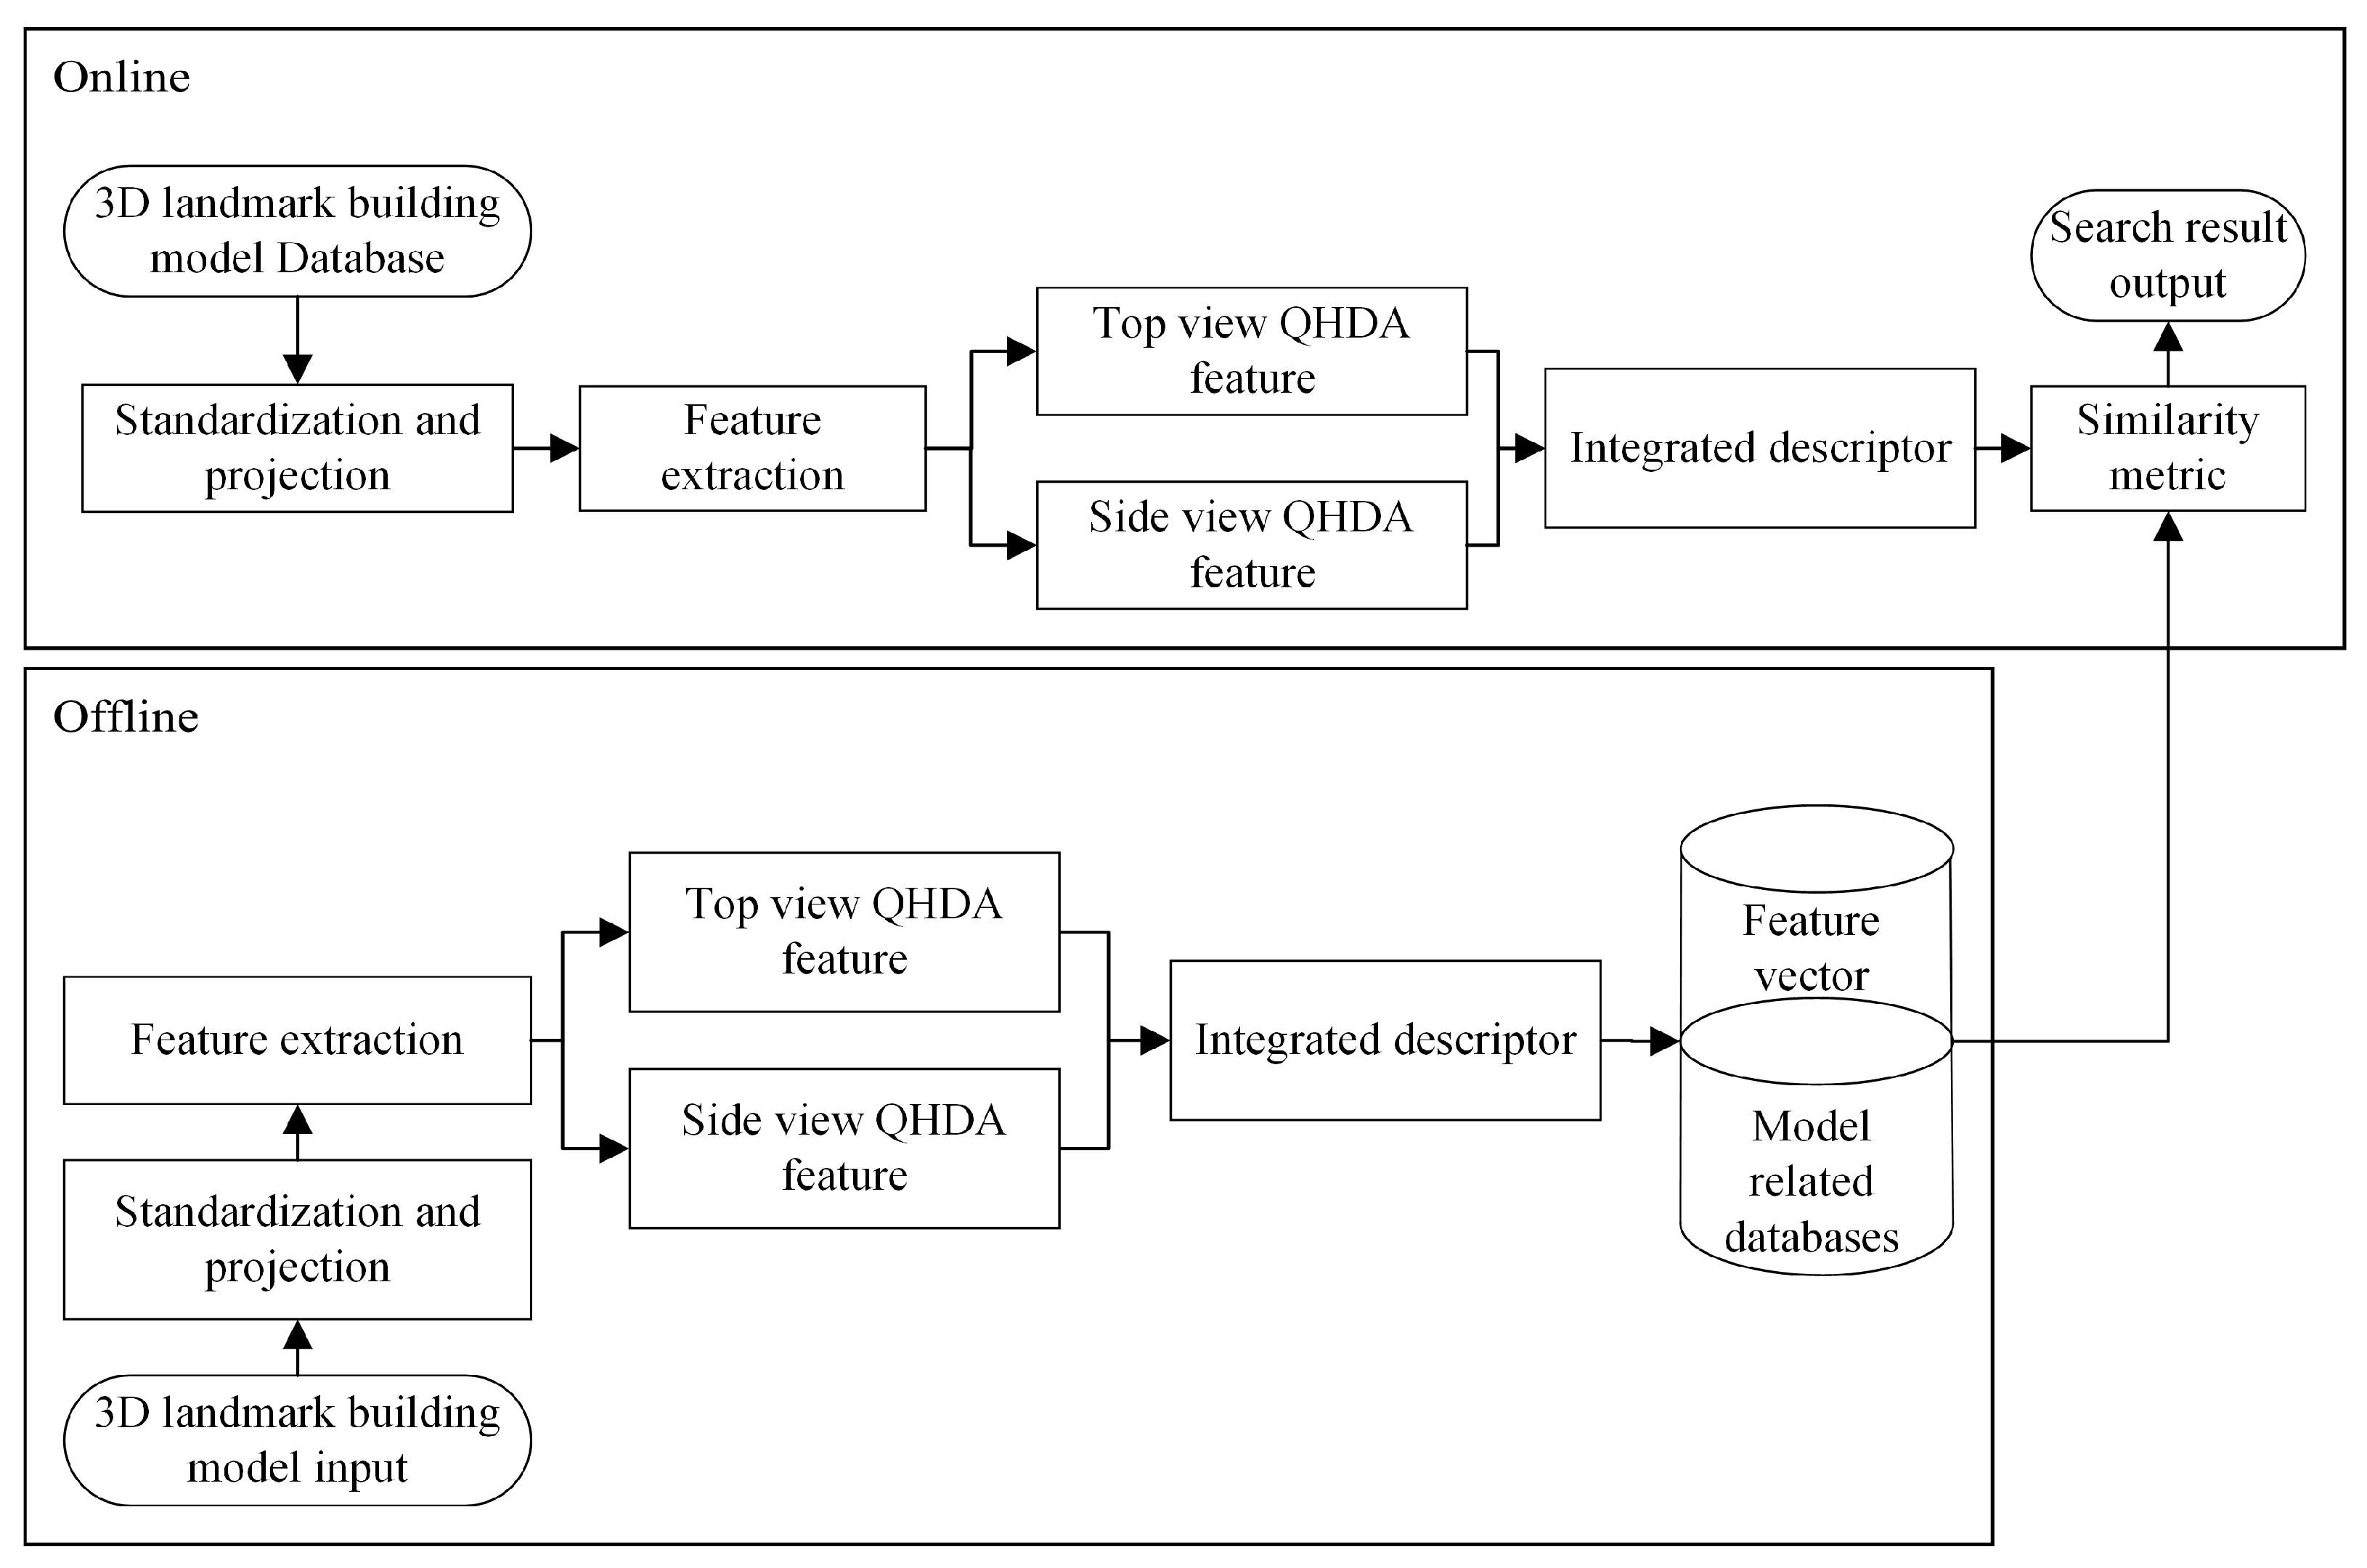
Consistent with common 3D models, 3D landmark building model retrieval can be divided into two distinct stages: online retrieval and offline retrieval, as depicted in Figure 4.
In the initial phase of offline retrieval, the model undergoes standardization, followed by dimensionality reduction through projection, resulting in a two-dimensional view set within the three-dimensional model library. Subsequently, a quotient distance–angle histogram (QDAH) descriptor is utilized to extract features separately from the top and side views. Finally, through a process of fusion, integrated descriptive features are derived and stored in the database. During the online user retrieval phase, the user inputs the three-dimensional model to be retrieved and utilizes the QDAH descriptor to extract integrated features. A similarity comparison is then conducted with the integrated features of the three-dimensional models stored in the database. The retrieval outcomes are presented in descending order of similarity, with the top models exhibiting the highest similarity and serving as the retrieval output.
5.1. Pre-Processing of 3D Landmark Building Models
The pre-processing of 3D landmark building models is mainly to ensure that the extracted features remain unchanged for translation, scaling, and rotation transformations. The pre-processing of a 3D landmark building model starts with the removal of the flat base plane at the bottom of the model, which not only affects the alignment of the model but also reduces the normalized size of the model. Then, the landmark building model is standardized in terms of position and size by translating it to the origin with its center of mass and scaling it accurately within the unit sphere before projection. Upon investigation, it was found that the majority of landmark building models exhibit the correct upright orientation compared to generic models. Therefore, a few models with incorrect upright direction were individually adjusted to upright separately in this paper. After the upright direction was corrected, the information of the landmark building model’s sides was captured by positioning the cameras uniformly on the sides. In 3D model retrieval algorithms, there are two projections that are often used: One method will yield 12 views, and the other yields 20 views [21]. Although in this paper the upright direction was established, given that views containing significant topological features are predominantly found in the top or side views of the model and the topological structure is inherently stable and undergoes only minor changes in neighboring views, having too many views does not make much sense. Consequently, the efficiency of extracting and matching descriptors can be improved by reducing the number of views created for each model. In this paper, one camera was selected to capture the topological structure of the top view, whereas the topological structure of the side view was captured by placing eight virtual cameras around the mesh every 45 degrees. The cameras were pointing towards the center of mass of the model and the side camera system was on a plane that passed through the center of mass of the model and parallel to the ground plane. Due to the symmetric nature, one top view and four side views were obtained, as show in Figure 5. More importantly, the established upright direction facilitated the storage of views in the spatial sequence of the top surface and the four sides. This arrangement ensured the order during feature extraction, thereby assisting in the subsequent fusion of top and side view features.
5.2. Quotient Distance–Angle Histogram
The selection and computation of shape descriptors have a great impact on the matching quality. Huang constructed the quotient distance histogram (QDH) in topological space to describe the topological properties [39]. After being applied to binary images, the value of each interval in the histogram is given by the following equation:
where and are pixel points on the image, denotes the Euclidean distance, denotes the distance between two points in the image, and denotes the tolerance. Points with a distance greater than this tolerance are considered to have an infinite distance. This tolerance assists the algorithm in disregarding minor changes, facilitating image abstraction and simplification. denotes the inner-distance operation, denotes the inner distance, and denotes the quotient distance, which is used as the vote for constructing the histogram. This intuition is reasonable because the inner distance contains rich structural information and the quotient of the inner distance and Euclidean distances is scale invariant. n is the count of pixels in the structure, is the indicator function, and is the range of the k-th interval.
The QDH algorithm can describe topological features to some extent. However, the retrieval effect of the QDH algorithm in practical application is greatly affected by the discrete features of pixels, and it is also unable to distinguish between holes and concave unclosed shapes. Therefore, in this paper, two improvements are proposed to extract the QDAH feature to characterize the topological perception.
5.2.1. Voting Interval Improvement
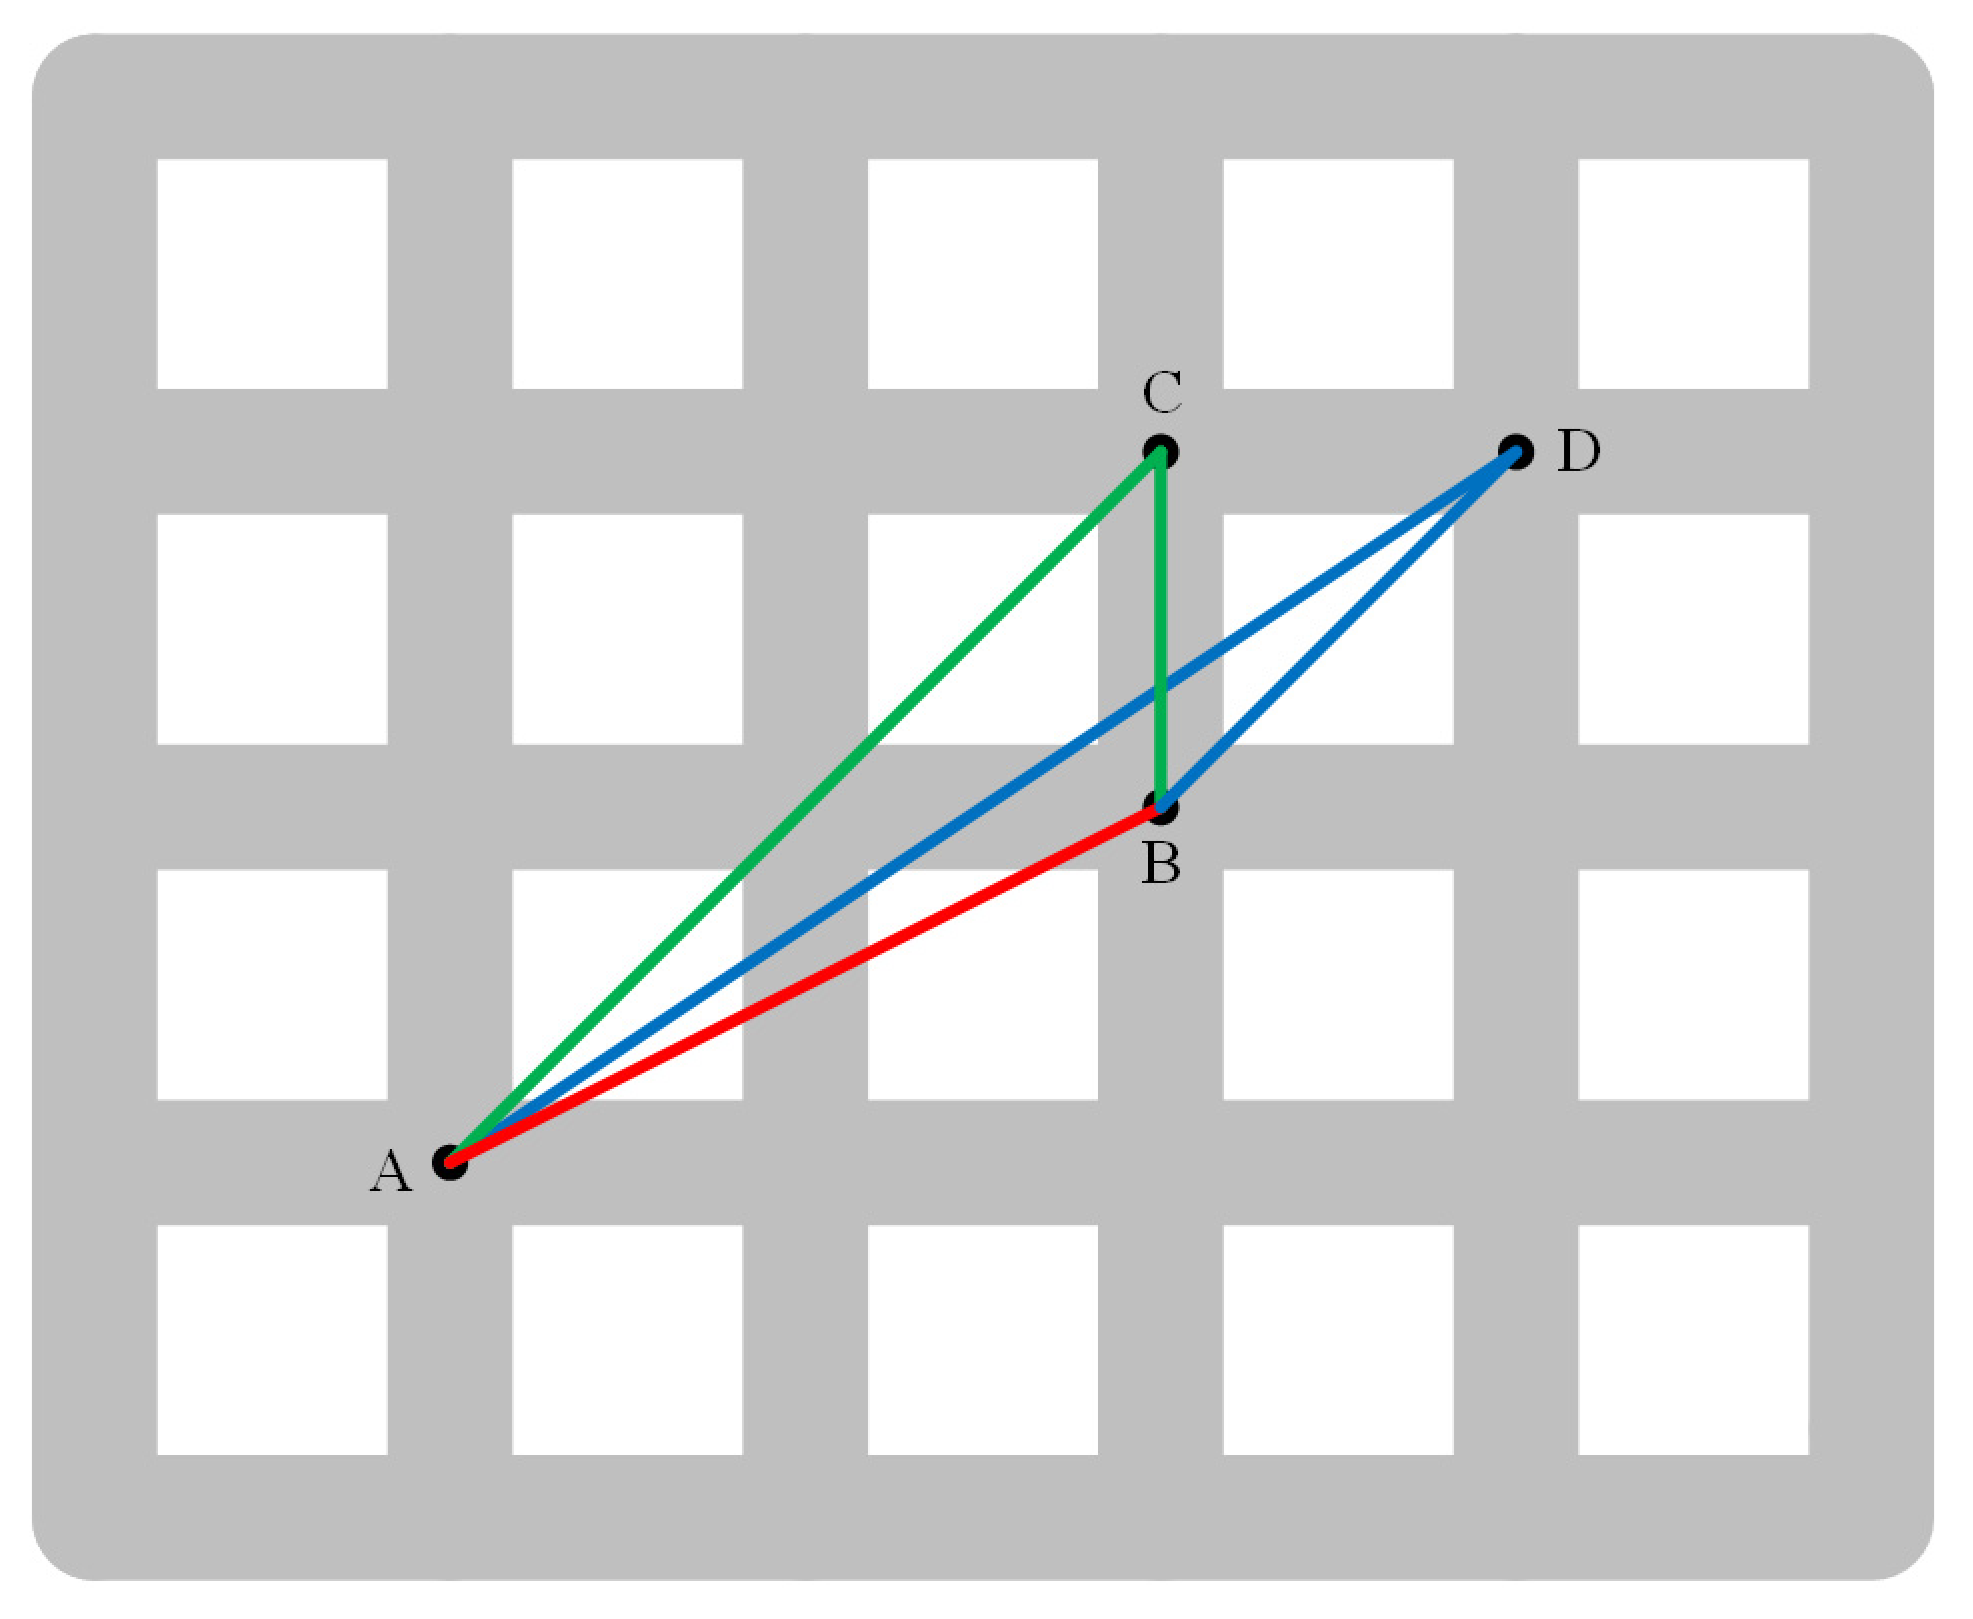
In theory, when establishing the voting interval, the inner distance in a non-concave plane is expected to be equal to the Euclidean distance, resulting in a quotient distance of 1. However, since the image is composed of discrete points, the inner distance is limited by the tolerance, which leads to computations that do not follow a straight path on the image, resulting in a quotient distance typically exceeding 1. As an illustration, consider Figure 6: Each intersection represents a pixel centroid. Assuming that the tolerance is , the Euclidean distance from A to C is AC, the inner distance is AB + BC, and the quotient distance is the quotient of AB + BC and AC. Obviously, the quotient distance is not 1.
Although there may exist points with quotient distances exceeding 1 within concave structures, for the majority of landmark building models characterized by “stout” structures, most point pairs in the model tend to have quotient distances close to 1, which can lead to confusion with non-concave graphs. Therefore, this paper seeks to find the maximum quotient distance value that can be obtained in non-concave graphs. This determination is essential for controlling the voting results by increasing the weight of point pairs that exceed the maximum value. The value of the maximum quotient distance in non-concave graphs is closely related to the tolerance (as show in Figure 6, where it can be seen that, for the case where is the tolerance, the quotient distance obtained for the longer distance between points A and D is less than that obtained for points A and C. In fact, the quotient distance between two points on any straight line, controlled by the tolerance, is not greater than the quotient of AB + BC to AC). The generalized formula for calculating the maximum quotient distance in a non-concave graph is represented by the following equation:
denotes the tolerance; needs to be the sum of the squares of two natural numbers, such as 1, 2, etc.; and denotes the maximum quotient distance value. After the value is determined, thereby enabling the manipulation of voting outcomes through the adjustment of voting weights associated with point pairs surpassing the threshold, this procedure can effectively distinguish non-concave graphs from other topological structures.
5.2.2. Improving by Introducing Angle Distribution
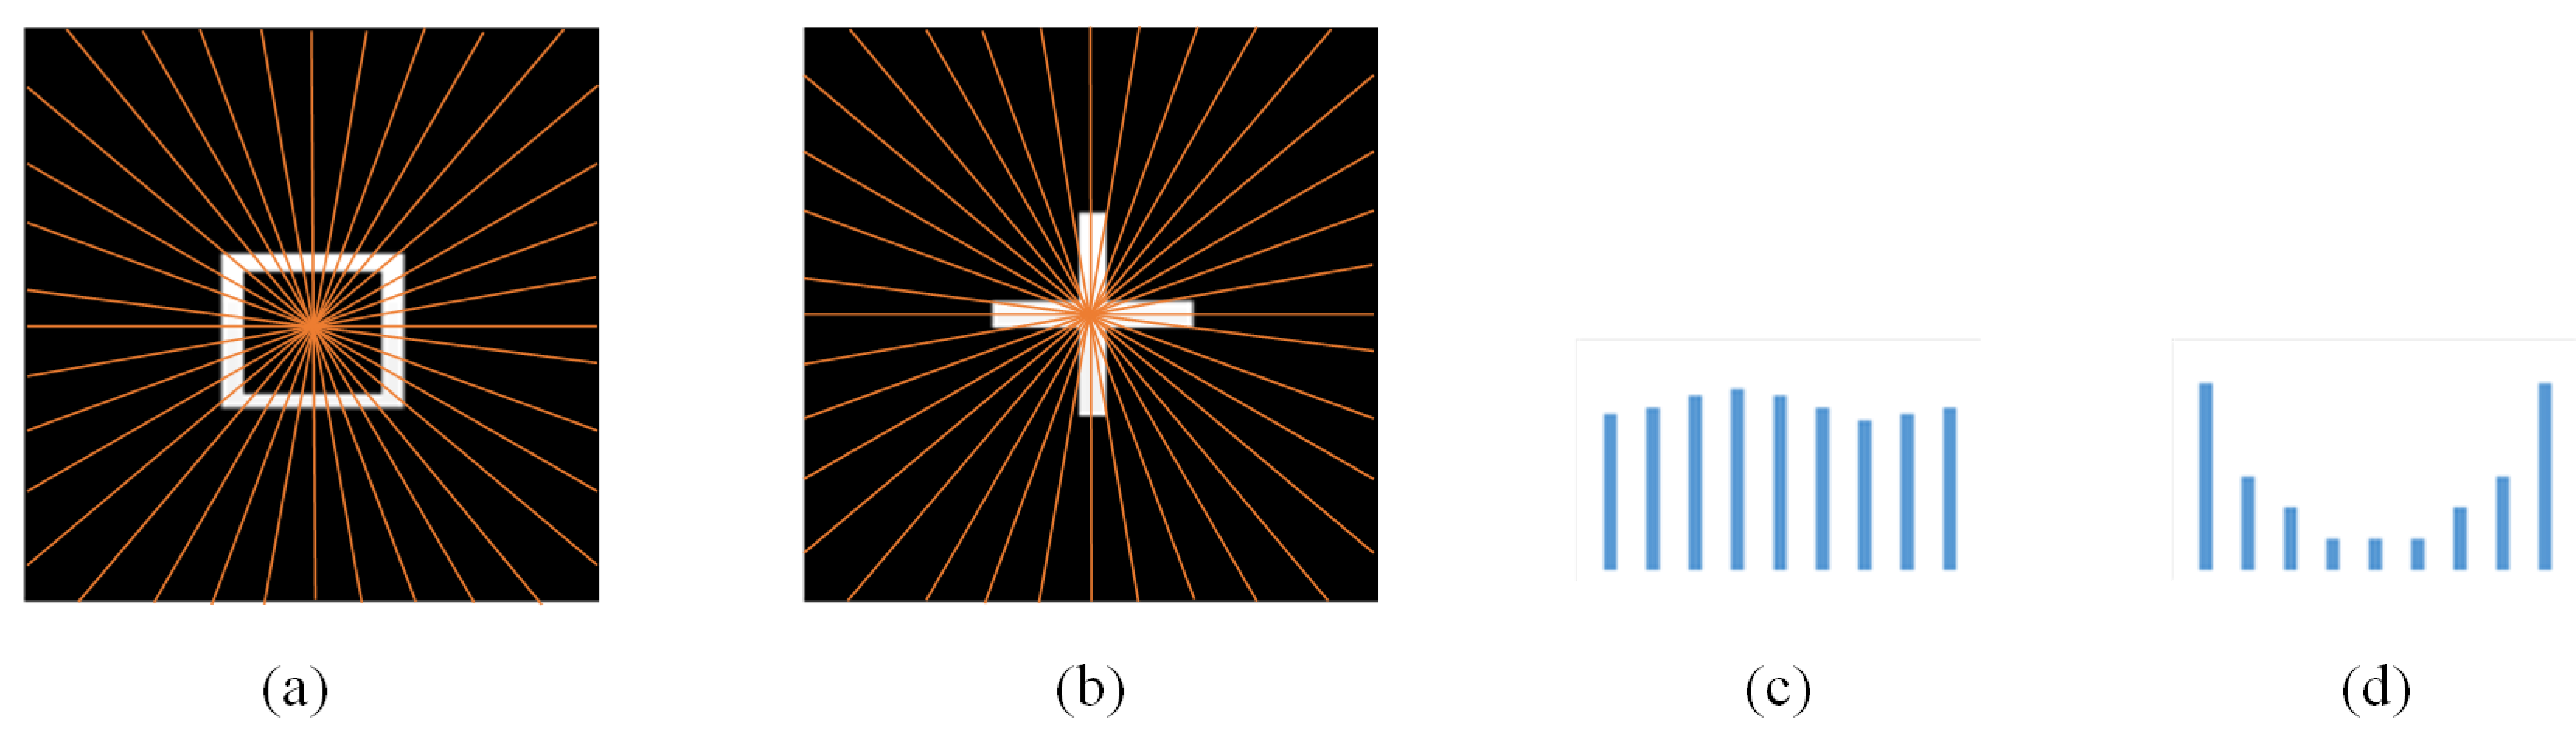
The quotient distance can effectively capture the inconsistency between the inner distance and the Euclidean distance. However, the quotient distances obtained from the concave unclosed graphs and the graphs with holes are similar, which can easily lead to a mismatch. According to the theory of topological perception, it is necessary to make a distinction between holes and concave unclosed graphs. In this paper, we used angles to distinguish between those two shapes. The segmentation method and their angle distribution histograms are shown in Figure 7.
First, the image was divided into 36 regions using rays emanating from the center of the mass. Then, one direction was selected as the initial direction. Next, the votes in each angular interval were counted and a threshold value was set. Finally, the intervals below the threshold value were judged as “empty regions.” In the view of the landmark building model, the hole graphs were generally voted evenly, whereas there were always some areas in the concave unclosed graphs that were judged as “empty areas” due to their small percentage. In this way, holes were distinguished from concave unclosed structures.
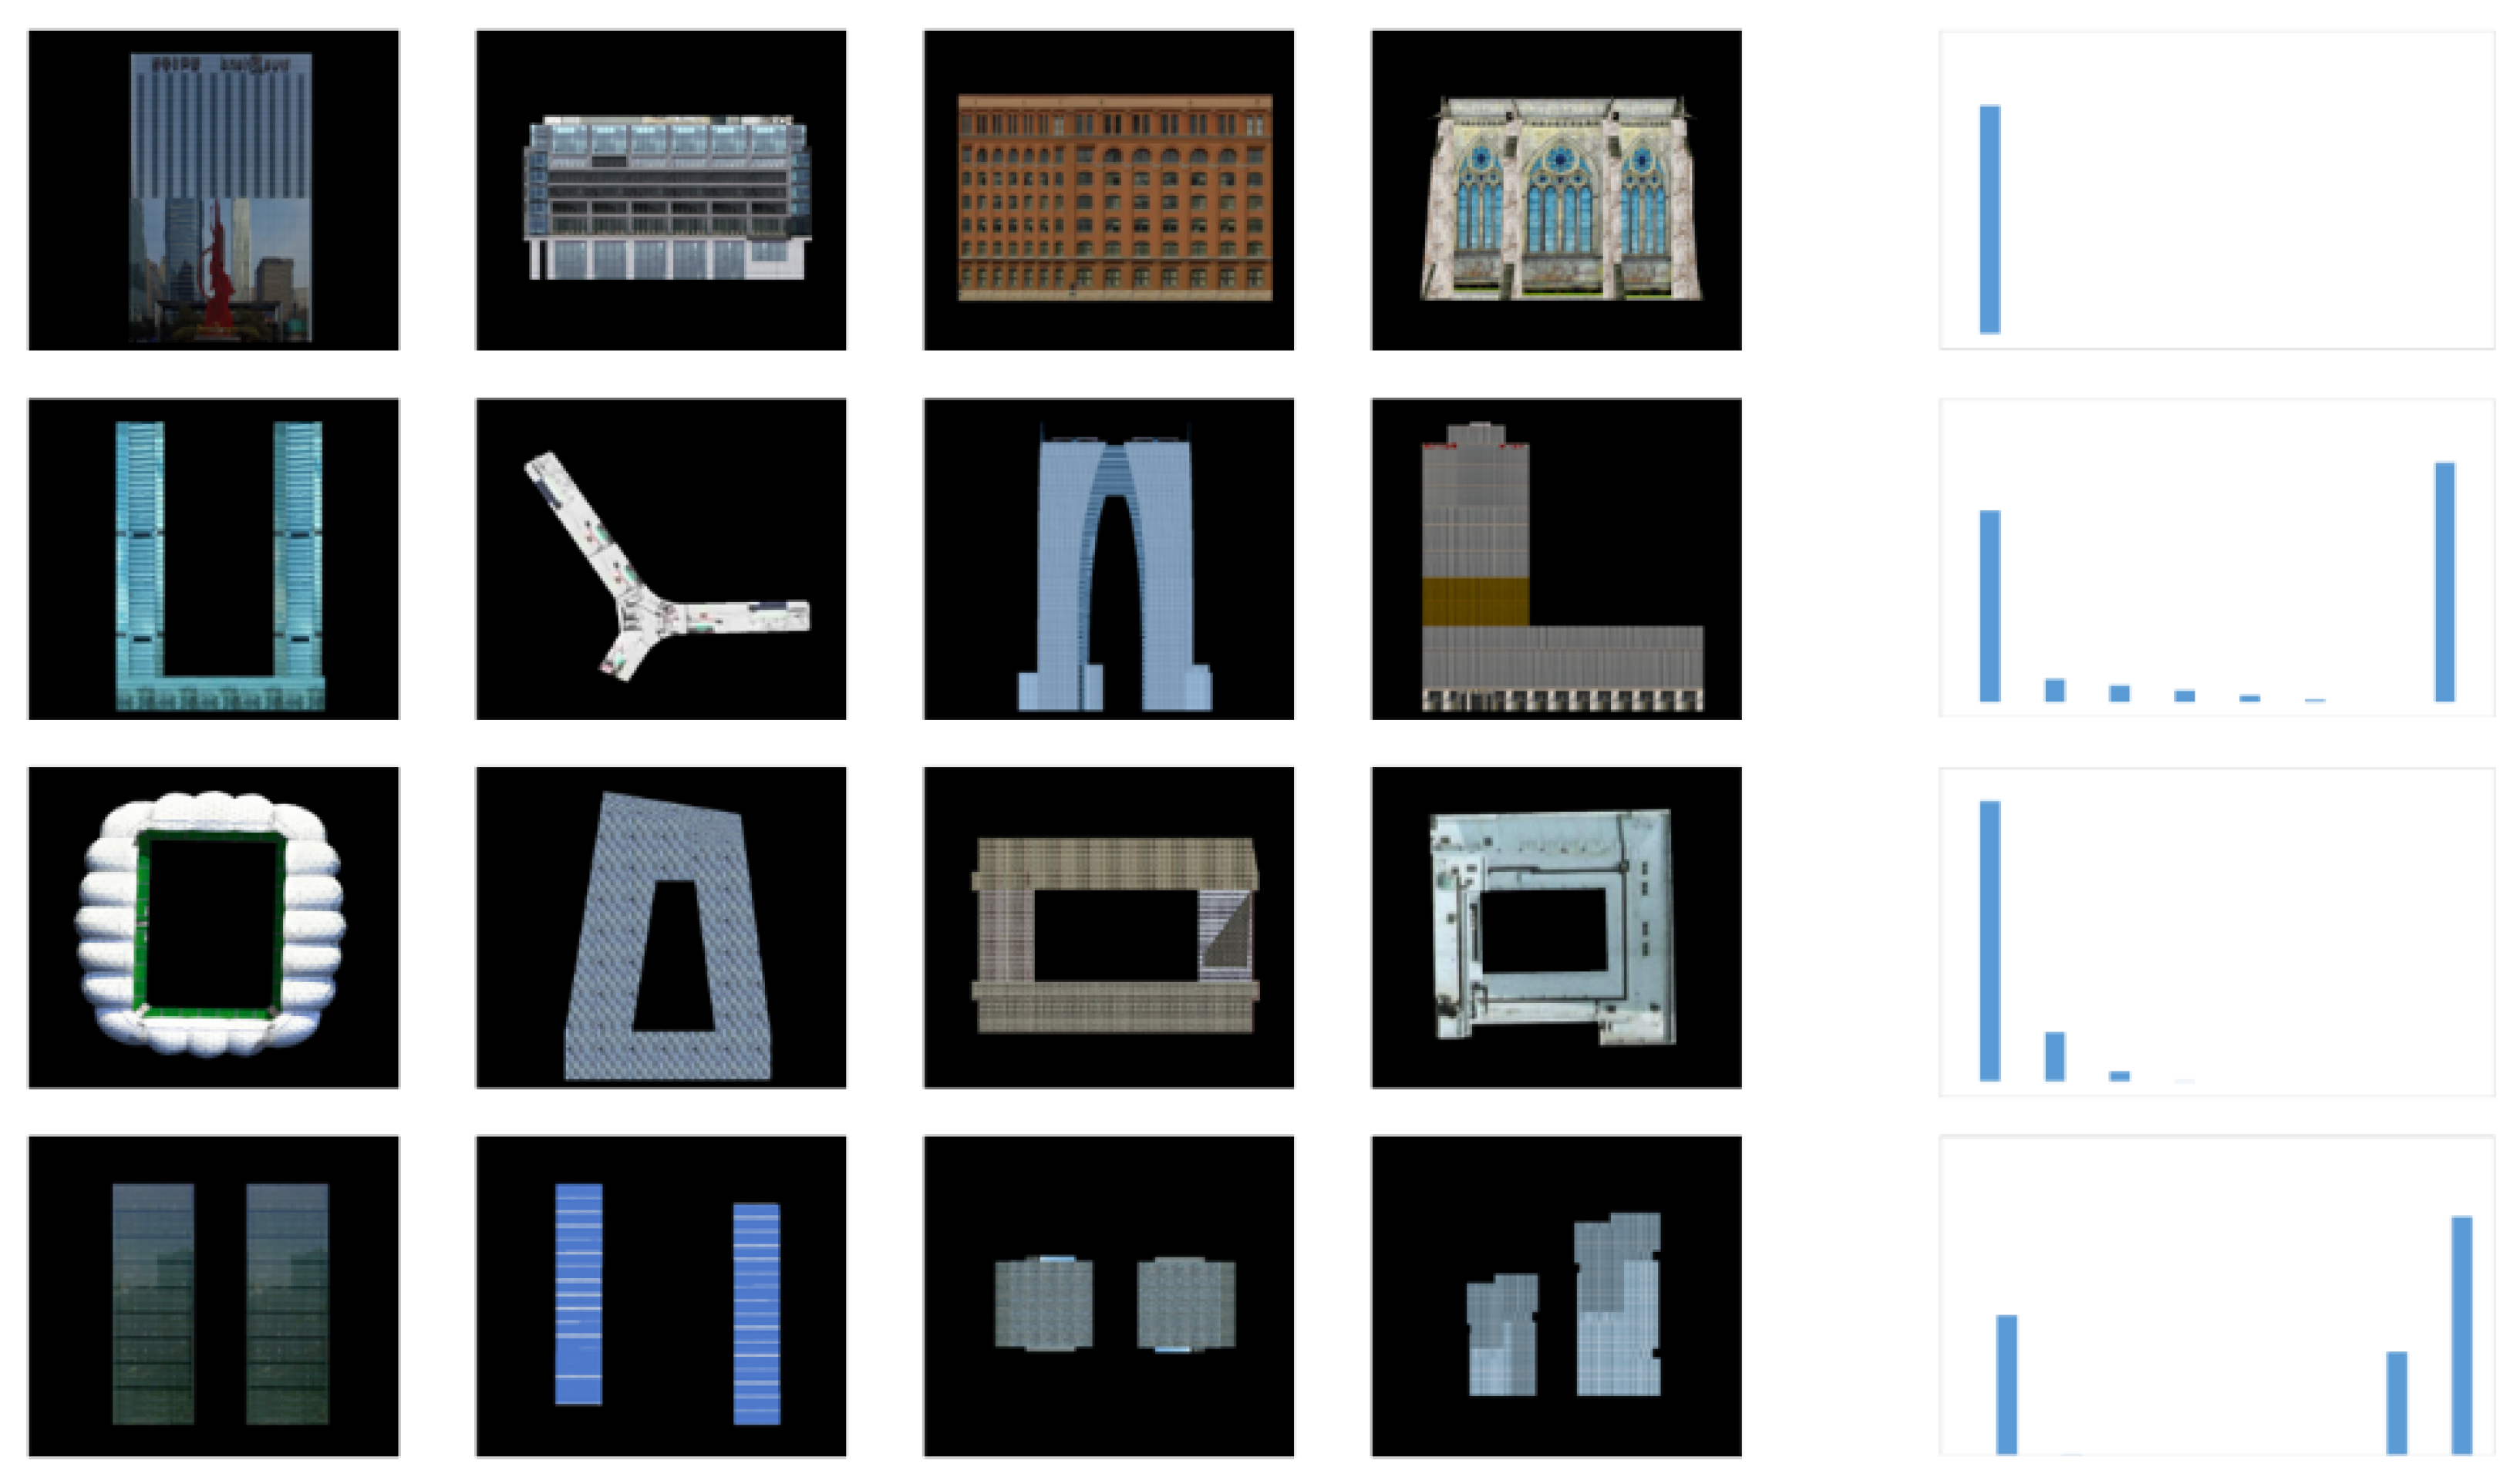
Upon completion of the above improvements, the QDAH was obtained. Subsequent to the completion of pixel-wise voting, we computed the average of the voting results across all pixel points, obtaining the QDAH for the image. After completion of the experiment, the average QDAH over the various types of images was calculated and set as the pre-value, as shown in Figure 8.
5.3. Matching Strategy
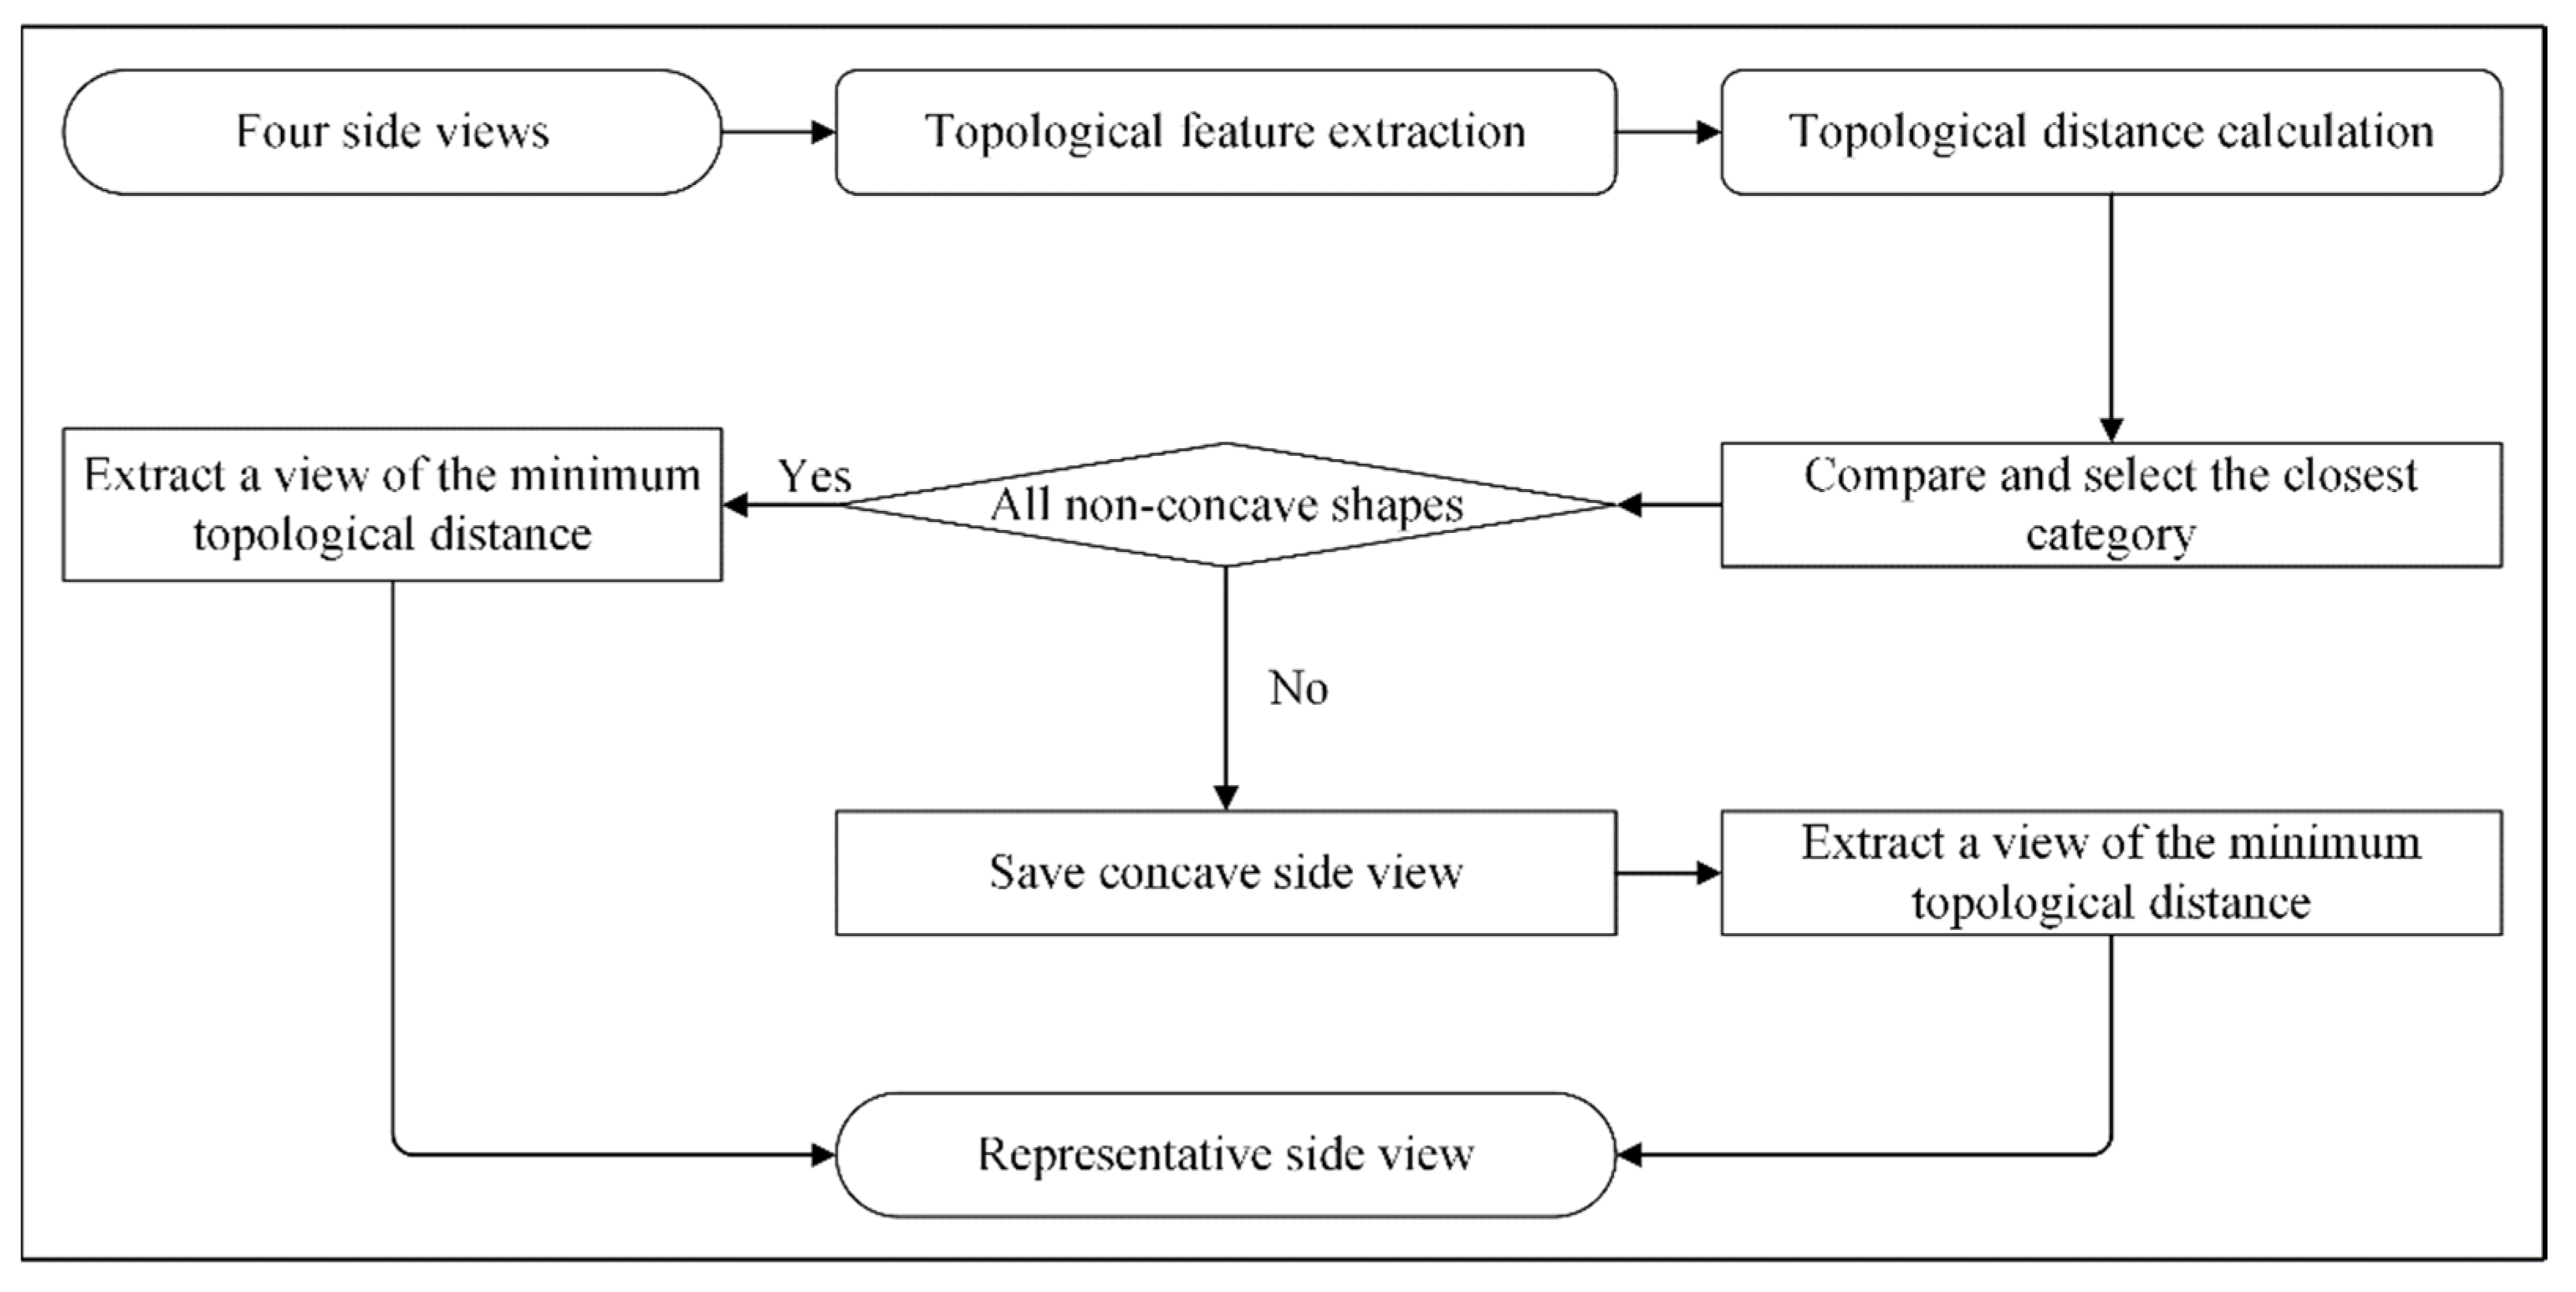
In this method, after projection, each model obtained one top view and four side views. The feature vectors of the side views were compared with the pre-value (as show in Figure 8) and the category that best matched was selected as the determination result. If all four side views were non-concave images, the non-concave image closest to the pre-value among the side views was chosen as the representative view of the side view; if not all of them were non-concave images, the view closest to pre-value was chosen as the representative view among the concave side views. This is reasonable because, during the projection process, models with concave structures can still yield non-concave structure views at specific angles, whereas the reverse is not true, and as long as other topologies are found in the views, the model can be determined to have this structure. The specific process is shown in Figure 9. After obtaining representative side views, the QDAH of the top and side view were sequentially combined to obtain the feature vectors of the model. Finally, the similarity was calculated using Euclidean distance and sorted to obtain the final retrieval result.
6. Experiment and Analysis
In the experimental environment of this algorithm, the CPU is AMD Ryzen5 4600H with Radeon Graphics, 12 core, 3.0GHz; the memory is 16G; the operating system is Windows 10 (64-bit); and the programming software is Python 3.9. In this paper, two sets of experiments were conducted to verify the effectiveness of QDAH algorithm in both image and model retrieval tasks. Since the previous shape benchmark only included a limited number of landmark building models, we built a 3D landmark building model database. The landmark building models used in the experiments were all from 3D Warehouse, and the images used were the projected views of the abovementioned landmark building models.
6.1. Image Matching Results and Analysis
Since our algorithm is view based, we first tested its efficiency in image retrieval. The image library employed in experiment 1 comprised a total of 443 images, categorized as follows: 110 non-concave images, 110 separated images, 183 concave unenclosed images, and 40 images. To assess the efficiency of the QDAH algorithm, we conducted simulation experiments wherein we employed Fourier descriptors (FD) [40], Hu invariant moments (Hu) [41], QDH, and the QDH1 algorithm (QDH algorithm after voting interval improvement). These methods were used for comparative analysis against the algorithm presented in this paper.
6.1.1. Search Results
Search results can directly show the efficiency of the algorithm. This query displayed the top 10 images exhibiting the highest similarity. Some search results are shown in Table 1.
Among the 10 result images retrieved when searching for hole images, the Hu algorithm obtained 3 relevant images, the FD algorithm obtained 7 relevant images, and the QDH algorithm and the QDH1 algorithm obtained 6 relevant images. The algorithm proposed in this paper obtained 10 relevant images. From the experimental results, it can be seen that the algorithm in this paper surpassed other image retrieval algorithms for topology retrieval. Additionally, the QDH algorithm failed to distinguish between hole and concave unclosed images. Since the QDH1 algorithm is mainly designed to improve the differentiation between non-concave and concave non-closed images, it did not provide a significant improvement in the search for hole images compared to the QDH algorithm.
6.1.2. Precision Rate and Recall Rate
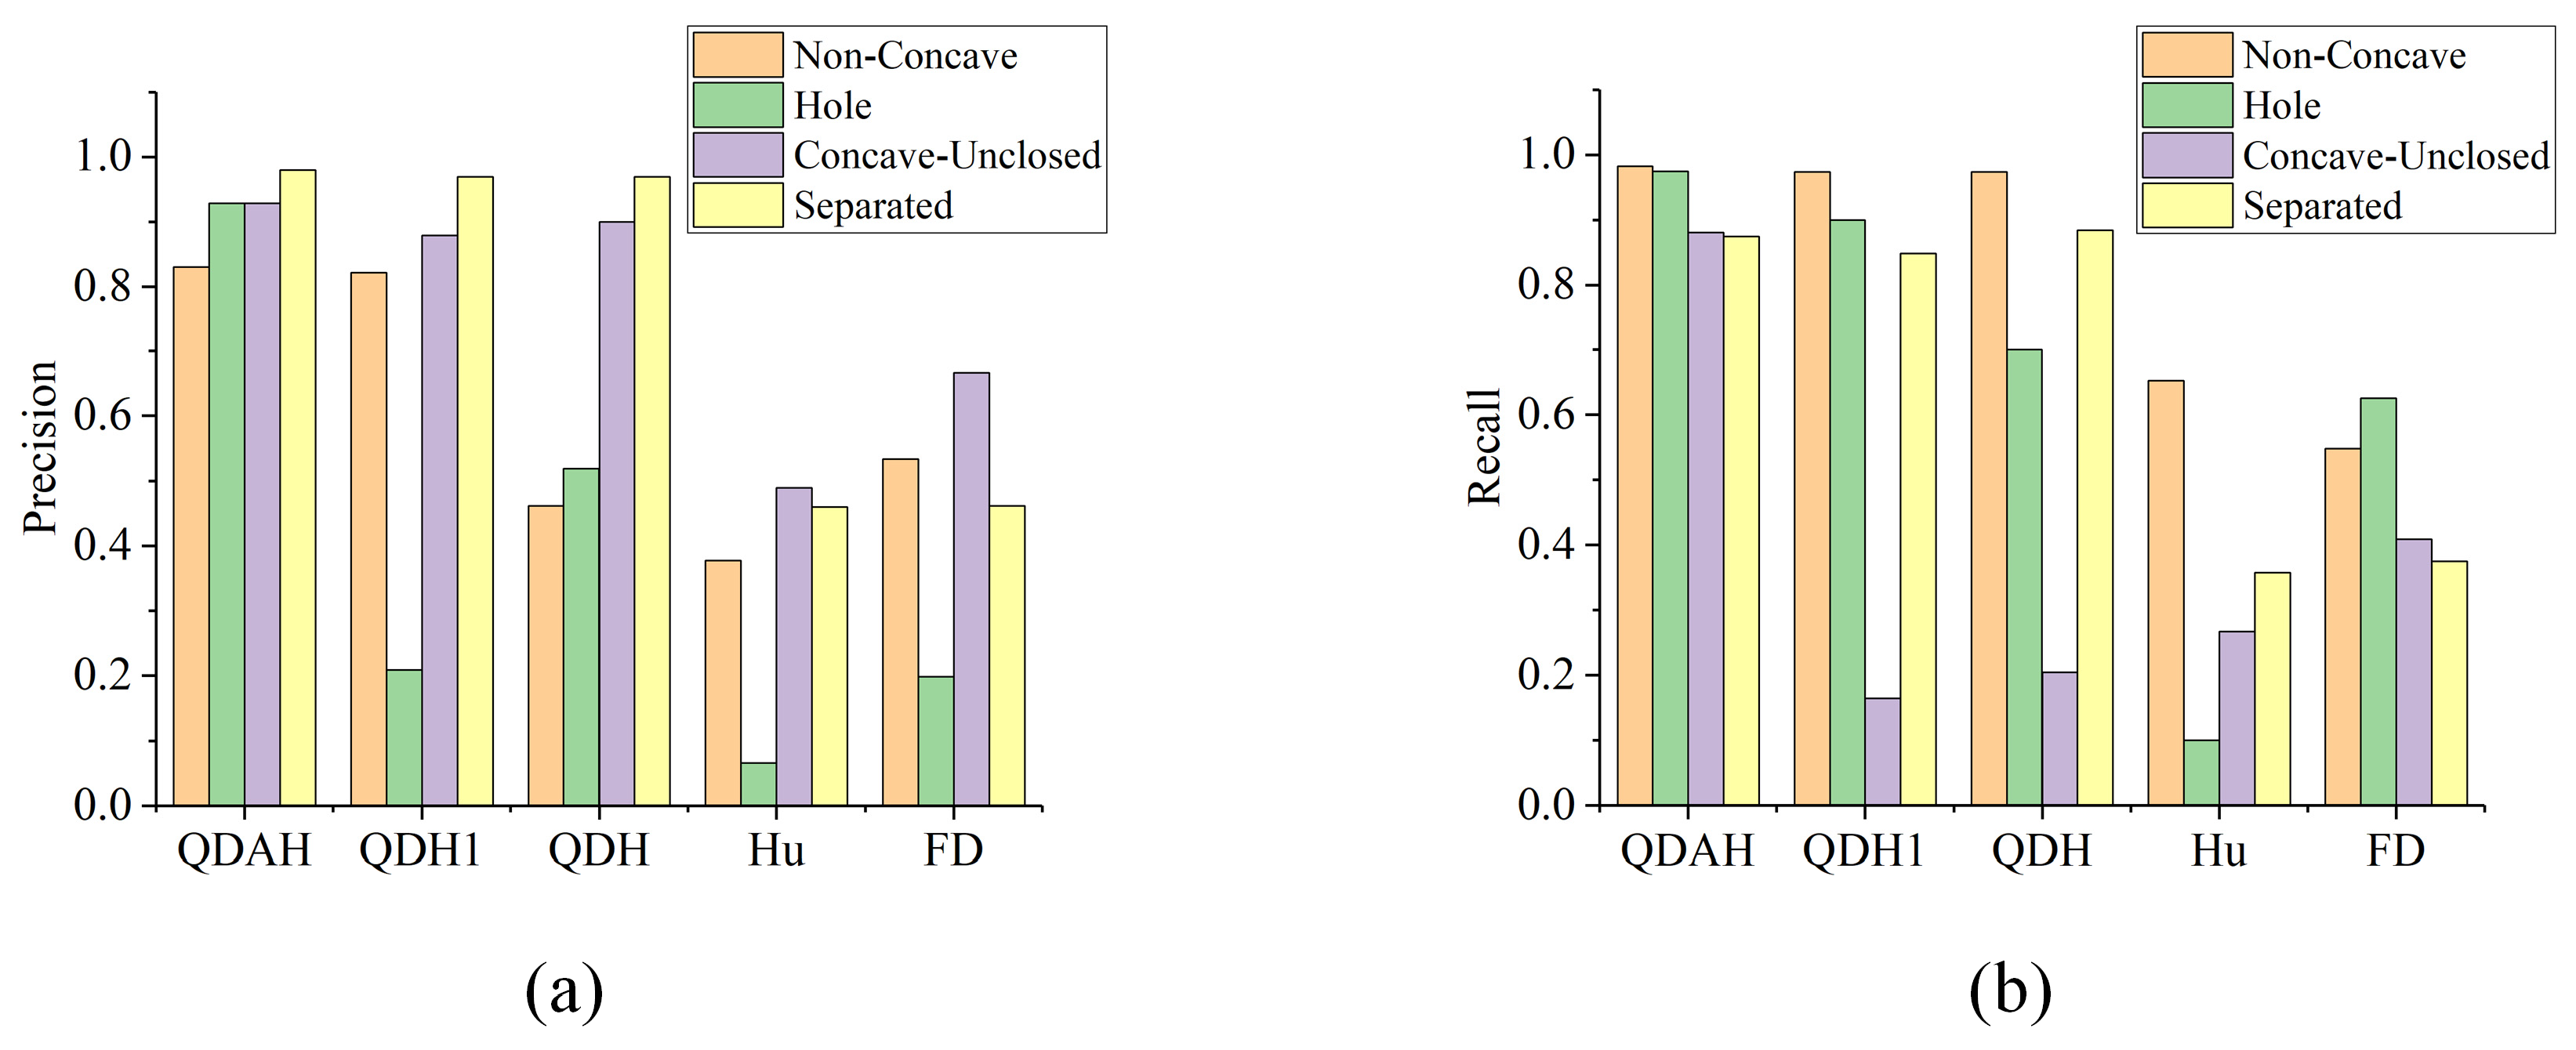
The precision rate and recall rate are important indicators of the efficiency of image retrieval. The precision rate indicates the correctness of the results returned by retrieval, and the recall rate reflects the ability of the system to retrieve correct results. In order to objectively analyze the efficiency of the algorithms, this paper calculated the precision rate and recall rate of each algorithm in each category, as shown in Figure 10.
From Figure 10, the following results can be drawn: Firstly, the improvement in the voting interval of QDH significantly improved the precision of the non-concave images, but after stripping the non-concave images accurately, many concave unclosed images initially classified as non-concave were included in the category of hole images, which led to a significant reduction in the precision of the class of holes in the presence of the increase in the recall rate of the category of holes. Secondly, the inclusion of the angle distribution feature significantly improved the differentiation between concave unclosed images and hole images, thus achieving a more desirable classification of the four categories of topologies. Lastly, the QDAH algorithm outperformed other algorithms in this dataset.
6.2. Model Retrieval Results and Analysis
Model retrieval experiments were conducted in experiment 2 to verify the performance of this paper’s algorithm in model retrieval. Our dataset had six categories, as mentioned in Section 3. We collected 215 models of landmark building models, with 35 in each category.
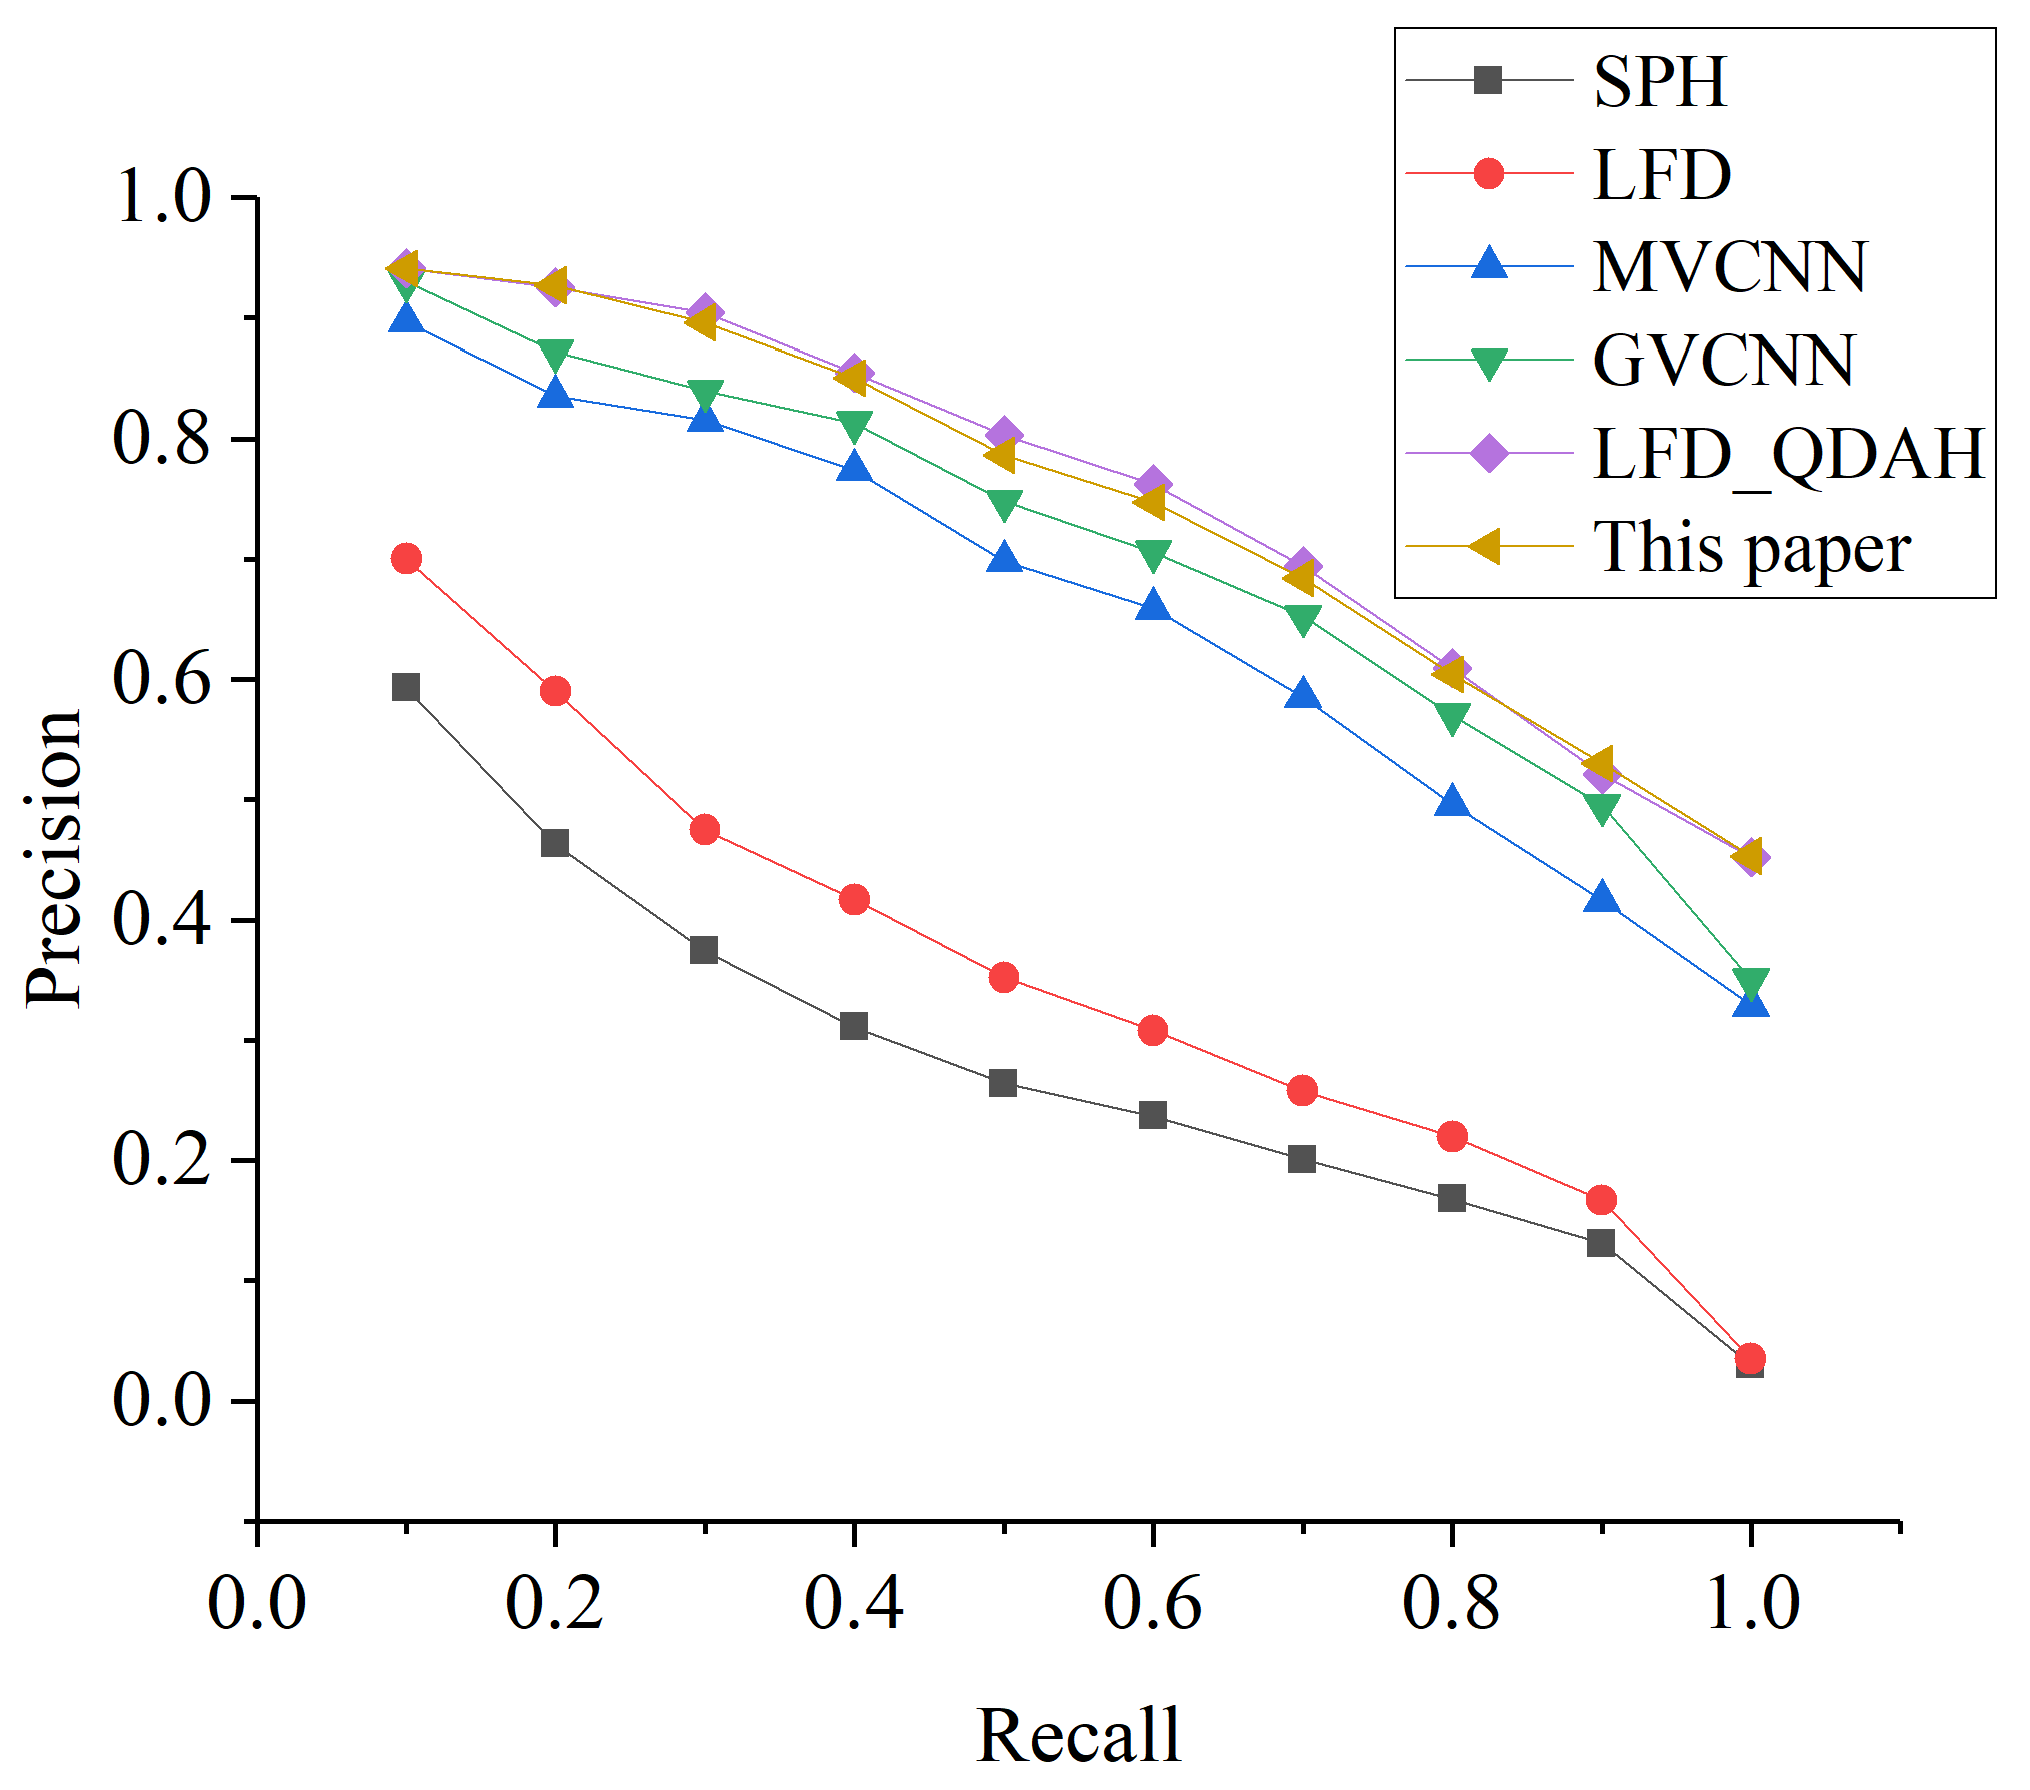
In order to verify the retrieval performance of the algorithm, the proposed algorithm was compared with the spherical harmonics descriptor (SPH) [42], LightField descriptor (LFD) [17], multi-view CNN retrieval algorithm (MVCNN) [22], group-view CNN retrieval algorithm (GVCNN) [43], and projective approach of LFD combined with the QDAH feature descriptor (LFD_QDAH). The P-R curve refers to the relationship curve between the precision rate and recall rate, which is a common method for evaluating the performance of information retrieval systems, text categorization systems, and so on. In the P-R curve, the horizontal axis is generally the recall rate and the vertical axis is the precision rate. To objectively assess the algorithm’s retrieval performance, this paper plotted the P-R curves of each algorithm, as shown in Figure 11.
From Figure 11, the following results were obtained: The performance of the topological feature-based algorithm proposed in this paper was better than that of the other four algorithms for the classification of the topological structure of the landmark building models. The SPH method was the worst of the five algorithms in terms of classifying topological structures. Moreover, in contrast to the LFD_QHDA methods, the curves of the two methods almost overlapped, indicating no significant difference between them. Notably, our method employed fewer views, contributing to increased speed in both the projected view and the view feature extraction phase.
7. Discussion
In this study, we propose a novel method for landmark building model retrieval to evaluate the algorithm’s performance on a dataset we constructed. The method consists of two parts: a new projection method and the QDAH algorithm. Compared to the Hu moments and the Fourier descriptor algorithm, the QDAH algorithm extracted more stable topological features and performed better when classifying views of the model. This is likely because views with an identical topological structure may be completely different in terms of contours, textures, and other features, which is what makes topological features superior. In contrast to the QDH algorithm, our approach enhances the ability to distinguish between hole, non-concave, and concave unclosed shapes. This is achieved by reclassifying the voting interval of the quotient distance histogram and incorporating angular distribution features to minimize confusion among the three categories. Additionally, we performed model retrieval experiments comparing the new projection method combined with the QDAH algorithm to several classical 3D model retrieval algorithms. Compared with LFD_QDAH, the algorithm in this paper reduced the time cost by appropriately minimizing the projection views, and the retrieval results are comparable. This is in line with our view that topological features are more stable and that too many views will extract a large number of similar features, resulting in redundancy and little enhancement to the algorithm. Furthermore, our algorithm outperformed the SPH, LFD, MVCNN, and GVCNN algorithms in categorizing landmark buildings based on topological structure. We attribute this to our emphasis on the topology of landmark models, deliberately avoiding interference from other features.
Classification based on topological structure mitigates interference from unrelated features. Nevertheless, in this study, attributes such as color and texture were not considered, potentially causing instances with similar topology but differing semantics to be erroneously grouped. In subsequent research, we aim to alleviate this limitation by integrating topological features with neural network models. One of the major difficulties of view-based methods is utilizing the relationships between features in multiple views effectively, and there is no exception in deep learning-related algorithms. On the one hand, some viewpoints are similar to each other and some are more different, and these similar viewpoints should play an equal role in the representation of 3D object shapes. On the other hand, there are some perspectives that extract more useful features. If we can group the views by topological features and assign weights to them, the distinguishability of the final feature descriptors will be improved to some extent. Additionally, due to time constraints, the experimental results were exclusively derived from the dataset of landmark building models. Since the majority of building models available on the web are renowned landmark buildings, the process of gathering and generating datasets for other models is anticipated to be time-consuming. In this context, the models employed in this paper lack diversity. In the future, we will collect more building models and further validate the QDAH-related algorithms.
8. Conclusions
This paper introduces a novel approach that leverages topological perception theory to enhance the retrieval of intricate landmark building models. Grounded in the topological perception theory, the paper categorizes model views into four classes and further stratifies typical 3D landmark building models into six categories by amalgamating the top-view structure with the side-view structure. Simultaneously, a new topology calculation method is proposed to address the insensitivity of the quotient distance histogram to certain topological structures. To ensure reliable outcomes, the interval parameter of the quotient distance histogram is readjusted to mitigate confusion between non-concave shapes and concave unclosed shapes with partially concave features. Additionally, an angular distribution feature is introduced to resolve confusion between holes and concave unclosed views.
In addition, this paper also proposes a new projection method that is based on the stability of topological features, the fact that most of the models have the correct upright orientation, and the reality that most of the significant topological features appear on the top surface and sides of the model; determines that too many views are not meaningful for the extraction of topological features of the model; and reduces the views of the landmark building model. Thus, the model projection time and the subsequent extraction of view features can be reduced. Finally, we also put the spatial information to use by storing the features in an orderly manner through the determined vertical direction, which facilitates the feature fusion of the top and side views.
Experimental results from image retrieval showcase the enhanced performance of the QDAH algorithm in topology retrieval. Two refinements to the QDH algorithm prove effective in reliably classifying views based on topological structure. Model retrieval experiments affirm the feasibility of the proposed projection method combined with the QDAH algorithm for model retrieval. In the classification of landmark building models according to topological structure, the algorithm in this paper surpasses the SPH, LFD, MVCNN, and GVCNN algorithms and demonstrates similarity to the LFD_QHDA algorithm. This further substantiates the superior capability of the QDAH algorithm in extracting topological features from models. The findings also underscore that a moderate reduction in views is viable when extracting topological features of 3D models. Although more views offer additional information, they also introduce redundant features, particularly when applied to relatively stable features such as topology, rendering excessive views less meaningful.
Author Contributions
Conceptualization, Y.D.; methodology, C.L. and Y.D.; validation, C.L.; formal analysis, C.L., Y.D. and Y.Y.; writing—original draft preparation, C.L. and Y.D.; writing—review and editing, C.L., Y.D. and Y.Y.; supervision, Y.Y.; funding acquisition, Y.Y. All authors have read and agreed to the published version of the manuscript.
Funding
This research was funded by the National Natural Science Foundation of China under MOST grant No. 42071346, No. 42371397, and Marine Science and Technology Innovation Project of Jiangsu Province grant No. JSZRHYKJ202302.
Institutional Review Board Statement
Not applicable.
Informed Consent Statement
Not applicable.
Data Availability Statement
The data presented in this study are available on request from the corresponding author due to privacy.
Conflicts of Interest
The authors declare no conflicts of interest.
References
- Keil, J.; Edler, D.; Dickmann, F. Meaningfulness of landmark pictograms reduces visual salience and recognition performance. Appl. Ergon. 2019, 75, 214–220. [Google Scholar] [CrossRef]
- Li, J.; Wu, H.; Gao, P. Landmark extraction via composite features of Voronoi diagram. Geomat. Inf. Sci. Wuhan Univ. 2020, 45, 1448–1454. [Google Scholar]
- Min, P.; Kazhdan, M.; Funkhouser, T. A comparison of text and shape matching for retrieval of Online 3D models. In Research and Advanced Technology for Digital Libraries; Heery, R.L., Ed.; Springer: Berlin/Heidelberg, Germany, 2004; pp. 209–220. [Google Scholar]
- Zhu, L.; Shen, J.; Zhou, J. Personalized landmark adaptive visualization method for pedestrian navigation maps: Considering user familiarity. Trans. GIS 2022, 26, 669–690. [Google Scholar] [CrossRef]
- Millonig, A.; Schechtner, K. Developing landmark-based pedestrian navigation systems. In Proceedings of the 8th IEEE International Conference on Intelligent Transportation Systems (ITSC), Piscataway, NJ, USA, 13–16 September 2005; pp. 197–202. [Google Scholar]
- Gong, Y.; Liu, Y.; Wu, L. Locality description based on multiplicatively weighted Voronoi diagram and landmarks. Geogr. Geo-Inf. Sci. 2010, 26, 21–26. [Google Scholar]
- Lynch, K. The city image and its elements. In The Image of the City; MIT Press: Cambridge, UK, 1964; pp. 46–90. [Google Scholar]
- Yonov, N.; Bandrova, T. 3D maps-cartographical aspects. In Proceedings of the 7th International Conference on Cartography and GIS, Sozopol, Bulgaria, 18–23 June 2018; pp. 452–463. [Google Scholar]
- Liao, H.; Dong, W.; Peng, C. Exploring differences of visual attention in pedestrian navigation when using 2D maps and 3D geo-browsers. Cartogr. Geogr. Inf. Sci. 2017, 44, 474–490. [Google Scholar] [CrossRef]
- Tepavčević, B.; Stojaković, V. Shape grammar in contemporary architectural theory and design. Facta Univ.-Ser. Archit. Civ. Eng. 2012, 10, 169–178. [Google Scholar] [CrossRef]
- Sharma, R.; Gao, J.X. A knowledge-based manufacturing and cost evaluation system for product design/re-design. Int. J. Adv. Manuf. Technol. 2007, 33, 856–865. [Google Scholar] [CrossRef]
- Li, H.; Sun, L.; Wu, Y. Survey on Feature Extraction Techniques for Non-Rigid 3D Shape Retrieval. J. Softw. 2018, 29, 483–505. [Google Scholar]
- Toschi, I. Geospatial data processing for 3D city model generation, management and visualization. Int. Arch. Photogramm. Remote Sens. Spat. Inf. Sci. 2017, 42, 527–534. [Google Scholar] [CrossRef]
- Zhou, M.; Fan, Y.; Geng, G. A spatial symmetry descriptor for 3D model. Acta Electron. Sin. 2010, 38, 853–859. [Google Scholar]
- Zhang, M.; Zhang, L. Perception-based shape retrieval for 3D building models. ISPRS J. Photogramm. Remote Sens. 2013, 75, 76–91. [Google Scholar] [CrossRef]
- Ankerst, M.; Kastenmüller, G.; Kriegel, H.-P. 3D shape histograms for similarity search and classification in spatial databases. In Proceedings of the Advances in Spatial Databases: 6th International Symposium, Hong Kong, China, 20–23 July 1999; pp. 207–226. [Google Scholar]
- Chen, D.; Tian, X.; Shen, Y. On visual similarity based 3D model retrieval. Comput. Graph. Forum 2003, 22, 223–232. [Google Scholar] [CrossRef]
- Laga, H.; Takahashi, H.; Nakajima, M. Spherical wavelet descriptors for content-based 3D model retrieval. In Proceedings of the 8th International Conference on Shape Modeling and Applications, Matsushima, Japan, 14–16 June 2006. [Google Scholar]
- Li, Y. 3D retrieval algorithm based on multi-feature. Comput. Sci. 2019, 46, 266–269. [Google Scholar]
- Ohbuchi, R.; Nakazawa, M.; Takei, T. Retrieving 3D shapes based on their appearance. In Proceedings of the 5th ACM SIGMM International Workshop on Multimedia Information Retrieval, New York, NY, USA, 7 November 2003; pp. 39–45. [Google Scholar]
- Liu, W.; He, Y. 3D model retrieval based on orthogonal projections. In Proceedings of the 9th International Conference on Computer Aided Design and Computer Graphics, Hong Kong, China, 7–10 December 2005; pp. 157–162. [Google Scholar]
- Su, H.; Maji, S.; Kalogerakis, E. Multi-view convolutional neural networks for 3d shape recognition. In Proceedings of the IEEE International Conference on Computer Vision, Santiago, Chile, 11–18 December 2015; pp. 945–953. [Google Scholar]
- Dai, G.; Xie, J.; Fang, Y. Siamese CNN-BiLSTM architecture for 3D shape representation learning. In Proceedings of the 27th International Joint Conference on Artificial Intelligence (IJCAI), Stockholm, Sweden, 13–19 July 2018; pp. 670–676. [Google Scholar]
- Ma, C.; Guo, Y.; Yang, J. Learning Multi-View representation with LSTM for 3D shape recognition and retrieval. IEEE Trans. Multimed. 2019, 21, 1169–1182. [Google Scholar] [CrossRef]
- Chen, S.; Zheng, L.; Zhang, Y. VERAM: View-enhanced recurrent attention model for 3D shape classification. IEEE Trans. Vis. Comput. Graph. 2019, 25, 3244–3257. [Google Scholar] [CrossRef] [PubMed]
- Ding, B.; Tang, L.; He, Y. 3D model retrieval based on representative views. J. Harbin Univ. Sci. 2021, 26, 18–23. [Google Scholar]
- Croom, F.H. Introduction. In Principles of Topology; Courier Dover Publications: New York, NY, USA, 2016; pp. 1–25. [Google Scholar]
- Pomerantz, J.R. Perceptual organization in information processing. In Perceptual Organization; Routledge: London, UK; New York, NY, USA, 2017; pp. 141–180. [Google Scholar]
- Zhang, J. The topological approach to perceptual organization—From topological perception to distributed cognition. Vis. Cogn. 2005, 12, 662–664. [Google Scholar]
- Chen, L. Topological structure in visual perception. Science 1982, 218, 699–700. [Google Scholar] [CrossRef]
- Zhuo, Y.; Zhou, T.; Rao, H. Contributions of the visual ventral pathway to long-range apparent motion. Science 2003, 299, 417–420. [Google Scholar] [CrossRef] [PubMed]
- Chen, L.; Zhou, W. Holes in illusory conjunctions. Psychon. Bull. Rev. 1997, 4, 507–511. [Google Scholar] [CrossRef]
- Todd, J.T.; Chen, L.; Norman, J.F. On the relative salience of Euclidean, affine, and topological structure for 3D form discrimination. Perception 1998, 27, 273–282. [Google Scholar] [CrossRef] [PubMed]
- Huang, Y.; Zhou, T.; Chen, L. The precedence of topological change over top-down attention in masked priming. J. Vis. 2011, 11, 9. [Google Scholar] [CrossRef] [PubMed]
- Chen, L. Topological structure in the perception of apparent motion. Perception 1985, 14, 197–208. [Google Scholar] [CrossRef] [PubMed]
- Chen, L.; Zhang, S.; Srinivasan, M.V. Global perception in small brains: Topological pattern recognition in honey bees. Proc. Natl. Acad. Sci. USA 2003, 100, 6884–6889. [Google Scholar] [CrossRef]
- Chien, S.; Lin, Y.; Qian, W. With or without a hole: Young infants’ sensitivity for topological versus geometric property. Perception 2012, 41, 305–318. [Google Scholar] [CrossRef]
- Zhu, J.; Guo, X.; Ma, Y. Different topological properties pattern recognition in mice. Prog. Biochem. Biophys. 2010, 37, 613–617. [Google Scholar] [CrossRef]
- Huang, Y.; Huang, K.; Tan, T. A novel visual organization based on topological perception. In Proceedings of the Computer Vision–ACCV 2009: 9th Asian Conference on Computer Vision, Xi’an, China, 23–27 September 2009. [Google Scholar]
- Sokic, E.; Konjicija, S. Phase preserving Fourier descriptor for shape-based image retrieval. Signal Process. Image Commun. 2016, 40, 82–96. [Google Scholar] [CrossRef]
- Ren, Y.; Yang, J.; Zhang, Q. Ship recognition based on Hu invariant moments and convolutional neural network for video surveillance. Multimed. Tools Appl. 2021, 80, 1343–1373. [Google Scholar] [CrossRef]
- Kazhdan, M.; Funkhouser, T.; Rusinkiewicz, S. Rotation invariant spherical harmonic representation of 3d shape descriptors. In Proceedings of the Symposium on Geometry Processing, Aachen, Germany, 23–25 June 2003; pp. 156–164. [Google Scholar]
- Feng, Y.; Zhang, Z.; Zhao, X.; Ji, R.; Gao, Y. Gvcnn: Group-view convolutional neural networks for 3d shape recognition. In Proceedings of the IEEE Conference on Computer Vision and Pattern Recognition, Salt Lake City, UT, USA, 18–23 June 2018; pp. 264–272. [Google Scholar]
Figure 1.
Examples of the stability of topological features: (a,b) views of the same model from different viewpoints.
Figure 1.
Examples of the stability of topological features: (a,b) views of the same model from different viewpoints.

Figure 2.
Example of topology structure: (a) hole, (b) separated, (c) concave unclosed, and (d) non-concave.
Figure 2.
Example of topology structure: (a) hole, (b) separated, (c) concave unclosed, and (d) non-concave.

Figure 3.
Model categories: top view is non-concave, side view is a hole; top view is non-concave, side view is concave unclosed; top view is non-concave, side view is non-concave; top view is hole, side view is non-concave; top view is concave unclosed, side view is non-concave; top view is separated, side view is separated.

Figure 4.
Framework of 3D landmark building model retrieval system.

Figure 5.
Five projection views: (a) top view and (b–e) side views.

Figure 6.
Example of quotient distance.

Figure 7.
Example of angle distribution: (a,b) diagram of the difference in angle distribution, (c,d) angle histograms. Due to symmetry, only the histograms of the first 9 intervals have been calculated to display here.
Figure 7.
Example of angle distribution: (a,b) diagram of the difference in angle distribution, (c,d) angle histograms. Due to symmetry, only the histograms of the first 9 intervals have been calculated to display here.

Figure 8.
Average quotient distance–angle histogram.

Figure 9.
Representative side-view selection process.

Figure 10.
Precision rate and recall rate: (a) the precision rate of each algorithm and (b) the recall rate of each algorithm.
Figure 10.
Precision rate and recall rate: (a) the precision rate of each algorithm and (b) the recall rate of each algorithm.

Figure 11.
Recall–precision curves of each algorithm.


Table 1.
Search results for each algorithm.
| Algorithm | QDAH | QDH1 | QDH | FD | Hu |
|---|---|---|---|---|---|
| Correct searches | 10 | 6 | 6 | 7 | 3 |
Disclaimer/Publisher’s Note: The statements, opinions and data contained in all publications are solely those of the individual author(s) and contributor(s) and not of MDPI and/or the editor(s). MDPI and/or the editor(s) disclaim responsibility for any injury to people or property resulting from any ideas, methods, instructions or products referred to in the content. |
© 2024 by the authors. Licensee MDPI, Basel, Switzerland. This article is an open access article distributed under the terms and conditions of the Creative Commons Attribution (CC BY) license (https://creativecommons.org/licenses/by/4.0/).
Share and Cite
MDPI and ACS Style
Li, C.; Ding, Y.; Yang, Y. A Novel Method Based on Topological Perception Theory for 3D Landmark Building Model Retrieval. Appl. Sci. 2024, 14, 1146. https://doi.org/10.3390/app14031146
AMA Style
Li C, Ding Y, Yang Y. A Novel Method Based on Topological Perception Theory for 3D Landmark Building Model Retrieval. Applied Sciences. 2024; 14(3):1146. https://doi.org/10.3390/app14031146
Chicago/Turabian StyleLi, Chunlei, Yuan Ding, and Yingbao Yang. 2024. "A Novel Method Based on Topological Perception Theory for 3D Landmark Building Model Retrieval" Applied Sciences 14, no. 3: 1146. https://doi.org/10.3390/app14031146
Note that from the first issue of 2016, this journal uses article numbers instead of page numbers. See further details here.