
Physical Simulation of Brittle Rocks by 3D Printing Techniques Considering Cracking Behaviour and Permeability

1
School of Earth Sciences and Engineering, Nanjing University, Nanjing 210023, China
2
Department of Civil and Environmental Engineering, Brunel University London, London UB8 3PH, UK
3
School of Civil Engineering, Southeast University, Nanjing 211189, China
4
Jiangsu East China Geological Construction Group Co., Ltd., Nanjing 210007, China
*
Author to whom correspondence should be addressed.
Appl. Sci. 2024, 14(1), 344; https://doi.org/10.3390/app14010344
Submission received: 10 December 2023
/
Revised: 22 December 2023
/
Accepted: 25 December 2023
/
Published: 29 December 2023
(This article belongs to the Special Issue Novel Insights into Rock Mechanics and Geotechnical Engineering)
Abstract
:Featured Application
Fabricating physical simulation of porous rock samples using 3D printing techniques.
Abstract
Additive manufacturing, commonly named 3D printing, is more frequently studied and used due to its ability to replicate micro- and macroscopic structures in natural rocks and fabricate complex experimental samples. Previous studies in this field mainly focused on mechanical properties and cracking behaviour but less on permeability because of the difficulties in unifying these three aspects with modern 3D printing techniques. Since the plaster-based 3D printing (PP) samples are more brittle and are close to rocks, and the stereolithography (SLA) samples have a higher resolution without chemical reaction with water, the present study combined these two mainstream 3D printing methods to try to replicate both the mechanical and permeable behaviour of rocks. Stereolithography (SLA) resolution can replicate submillimetre pores and structures in natural rocks. The result is that the PP method can successfully print rocklike samples, and their strength and failure modes are significantly influenced by the printing dip angle and sintering temperature. The porosity and anisotropy of the permeability of the samples printed by the SLA method are compared with the prototype porous basalt, and the replication ability in pore structures and seepage is confirmed. In addition to the experimental study, the theoretical permeability of samples printed with various resolutions is also discussed. The results of this study demonstrate the effectiveness of combining PP and SLA 3DP techniques for physically simulating natural porous rocks.
1. Introduction
Mechanical and seepage properties are two key issues in rock mechanics. In recent years, with the construction of various large-scale underground projects such as deep tunnelling, deep resource exploitation, nuclear waste disposal, and oil and gas storage [1,2,3,4,5], new challenges have been posed to the above two issues. Due to the difficulty of drilling samples in deep strata and the high cost, the number of samples available for experimental study is very limited. In addition, more samples are needed when considering more influencing factors representing complex field engineering or geological conditions, like anisotropy of mechanical properties and disturbance of samples. Sampling constraints the experimental studies on deep rocks. As a technique for replicating samples, 3D printing (3DP) technology has great application prospects in this area [6]. The 3DP replication can produce solid samples with similar physical and mechanical properties [7,8,9,10,11,12]. High-precision printing techniques can provide the feasibility of 3DP samples in the physical simulation of rock defects and seepage [13], which is extremely important in modern rock engineering, like CO2 sequestration, gas geological storage, and oil extraction.
By changing the formula of printing materials and the size of printing particles, 3DP technology can quantitatively control the physical properties, mechanical properties, and structures of samples, including porosity and permeability. Previous studies mainly focused on the validity of 3DP samples to simulate the mechanical properties and failure modes of natural rocks [8,9,10,11,12,14,15,16,17,18,19,20,21,22,23]. With the development of 3DP resolution, researchers tried to print samples with fine structures to replicate the fractures, defects, and even fine pores inside natural rocks. The relevant research concentrates more on the replication ability of the porosity or surface roughness, while the materials range from inorganic to organic, from brittle to ductile, and from small to large scale [24,25,26,27,28,29]. In the past decade, replication methods for porous rocks have been tried [30,31]. By changing the size of the nozzle and the printing program, the average porosity as well as the permeability of uniformly porous rocks like sandstone can be simulated. The replication of non-uniform porous rocks is well achieved by using digital light projection (DLP) 3D printing [32] and SLA and PolyJet techniques [33]. Using the most advanced nano-3D printing, an extremely fine physical model can be manufactured [34]. However, the permeability of 3DP samples and its ability to duplicate anisotropy are not comprehensively studied in rock mechanics [35]. Only some tests are conducted on the permeability of the 3DP materials with regular arrangement structures in biology engineering, water science, petroleum engineering, and soil mechanics [16,25,26,27,36] without synchronously considering the similarities in mechanical properties. The tests on the permeability of the 3DP sample replicating natural rocks with non-uniform pores were studied and discussed less. Only a few scientists have explored the permeability of coarse granular 3DP materials [14,37,38,39] or fractured materials [29] in experimental or numerical ways [27].
Plass-based 3D printing (PP) [17,20] and stereolithography (SLA) [28,40] are two mainstream 3DP methods in rock mechanics. With the aid of the micro-CT, natural rocks with pores larger than one micrometre can be reconstructed digitally and theoretically replicated by a high-precision 3DP machine. According to the literature about 3DP rocklike materials [7,8,9,10,11,12], the artificial samples do not have a comprehensive similarity in all physical and mechanical properties to the natural rock. Generally, one 3DP method or material can only simulate limited aspects of the physical or mechanical properties of natural rocks [18,19,41,42]. The PP method can produce brittle samples with a good simulation of the failure processes of brittle rocks, while the SLA samples have advantages in simulating water seepage due to no chemical reaction with water. Therefore, the present study tries to combine these two 3DP methods to replicate samples by considering the mechanical properties and the permeability.
1.1. Plaster-Based 3D Printing
The PP technique can use various materials, including gypsum, sand, cement, and other powders, with the binder to produce the sample, which might require further sintering or curing treatment. The finished products are often relatively brittle. This layered manufacturing process makes possible heterogeneity in the physical and mechanical properties in different directions. Fereshtenejad and Song (2016) [20] studied the influence of layer incline angle, layer thickness, binder saturation level, and post-printing drying temperature on the properties of printed gypsum samples. They found that (a) the incline angle has an obvious influence on sample strength, (b) the layer thickness has a very limited effect on the sample uniaxial compressive strength (UCS), (c) the UCS increases with the binder saturation, and (d) the sample dried at 150 °C for two hours produces the highest UCS and brittleness. Sintering or heating is necessary to dry the samples and enhance their strength.
1.2. Stereolithography 3D Printing
Common stereolithography (SLA) can print samples with a smooth surface and a high resolution (100 μm). Such a resolution is capable of replicating natural rocks with relatively large pores, open cracks, or defects [43,44]. Zhao et al. (2020) investigated the pore size distribution of several sandstones with porosity ranging from 6.92% to 15.17% by the mercury intrusion porosimetry test and found that the dominant pore size ranges from 15 to 35 μm. Such pore size is hard to replicate accurately by current SLA printing machines [45]. Therefore, the replication of sandstone with such a pore size is not available for the current techniques. However, it can replicate a type of porous rock with most pores larger than 100 μm or be applicable for projects only concerning the seepage behaviour of large pores.
Since it is hard to find an additive manufacturing material that can replicate both the mechanical properties, cracking mode, and permeability of natural rocks, the present study aims to discover the performance of the combination of the PP and SLA methods, which are good at replicating the mechanical behaviour and the fine structure of rocks, respectively, in investigating the failure and seepage in rock engineering like dams, reservoirs, oil and gas exploitation, CO2 storage, etc. This study overcomes the difficulty of finding the perfect additive manufacturing material. It only uses two mainstream 3DP methods and common materials to realize the physical simulation of both the failure and seepage of natural rocks. Moreover, since the PP method can simulate the bonding conditions and directions of the microstructure planes of sedimentary rocks by changing the print procedures, print materials, and post-processing methods, the influence of sedimentary orientation and bonding on the failure mode and mechanical properties can be experimentally studied by setting a proper layer inclination angle and cementation condition.
In this research, the effects of printing setup and sintering method on the mechanical properties and cracking behaviour of intact samples are studied first. Subsequently, the cracking processes of 3DP samples containing pre-existing flaws are compared with those of moulded samples, which are universally used in rock mechanics [41,46,47] to verify the ability of 3DP to simulate the cracking mode of natural rocks. Then, the permeability and anisotropy of SLA samples, replicating the pores inside a porous basalt with pore sizes larger than 0.1 mm, are tested and compared with the original rock. Meanwhile, the effect of the print particle size on the permeability is also studied through theoretical studies. The results of the present experimental and theoretical studies support the application feasibility of the PP and SLA 3DP techniques in replicating natural rocks and rock masses with complex geological structures.
2. Materials and Methods
There have been many types of 3DP methods and machines on the market or in the laboratory [48]. Plaster-based 3D printing (PP) and stereolithography (SLA) are used to manufacture the samples. This section mainly introduces the principles and operation procedures of these 3DP methods and the tests for mechanical and seepage properties. The cracking behaviour of the 3DP samples is compared with that of the moulded gypsum samples.
2.1. 3D Printing Methods
2.1.1. Plaster-Based 3D Printing
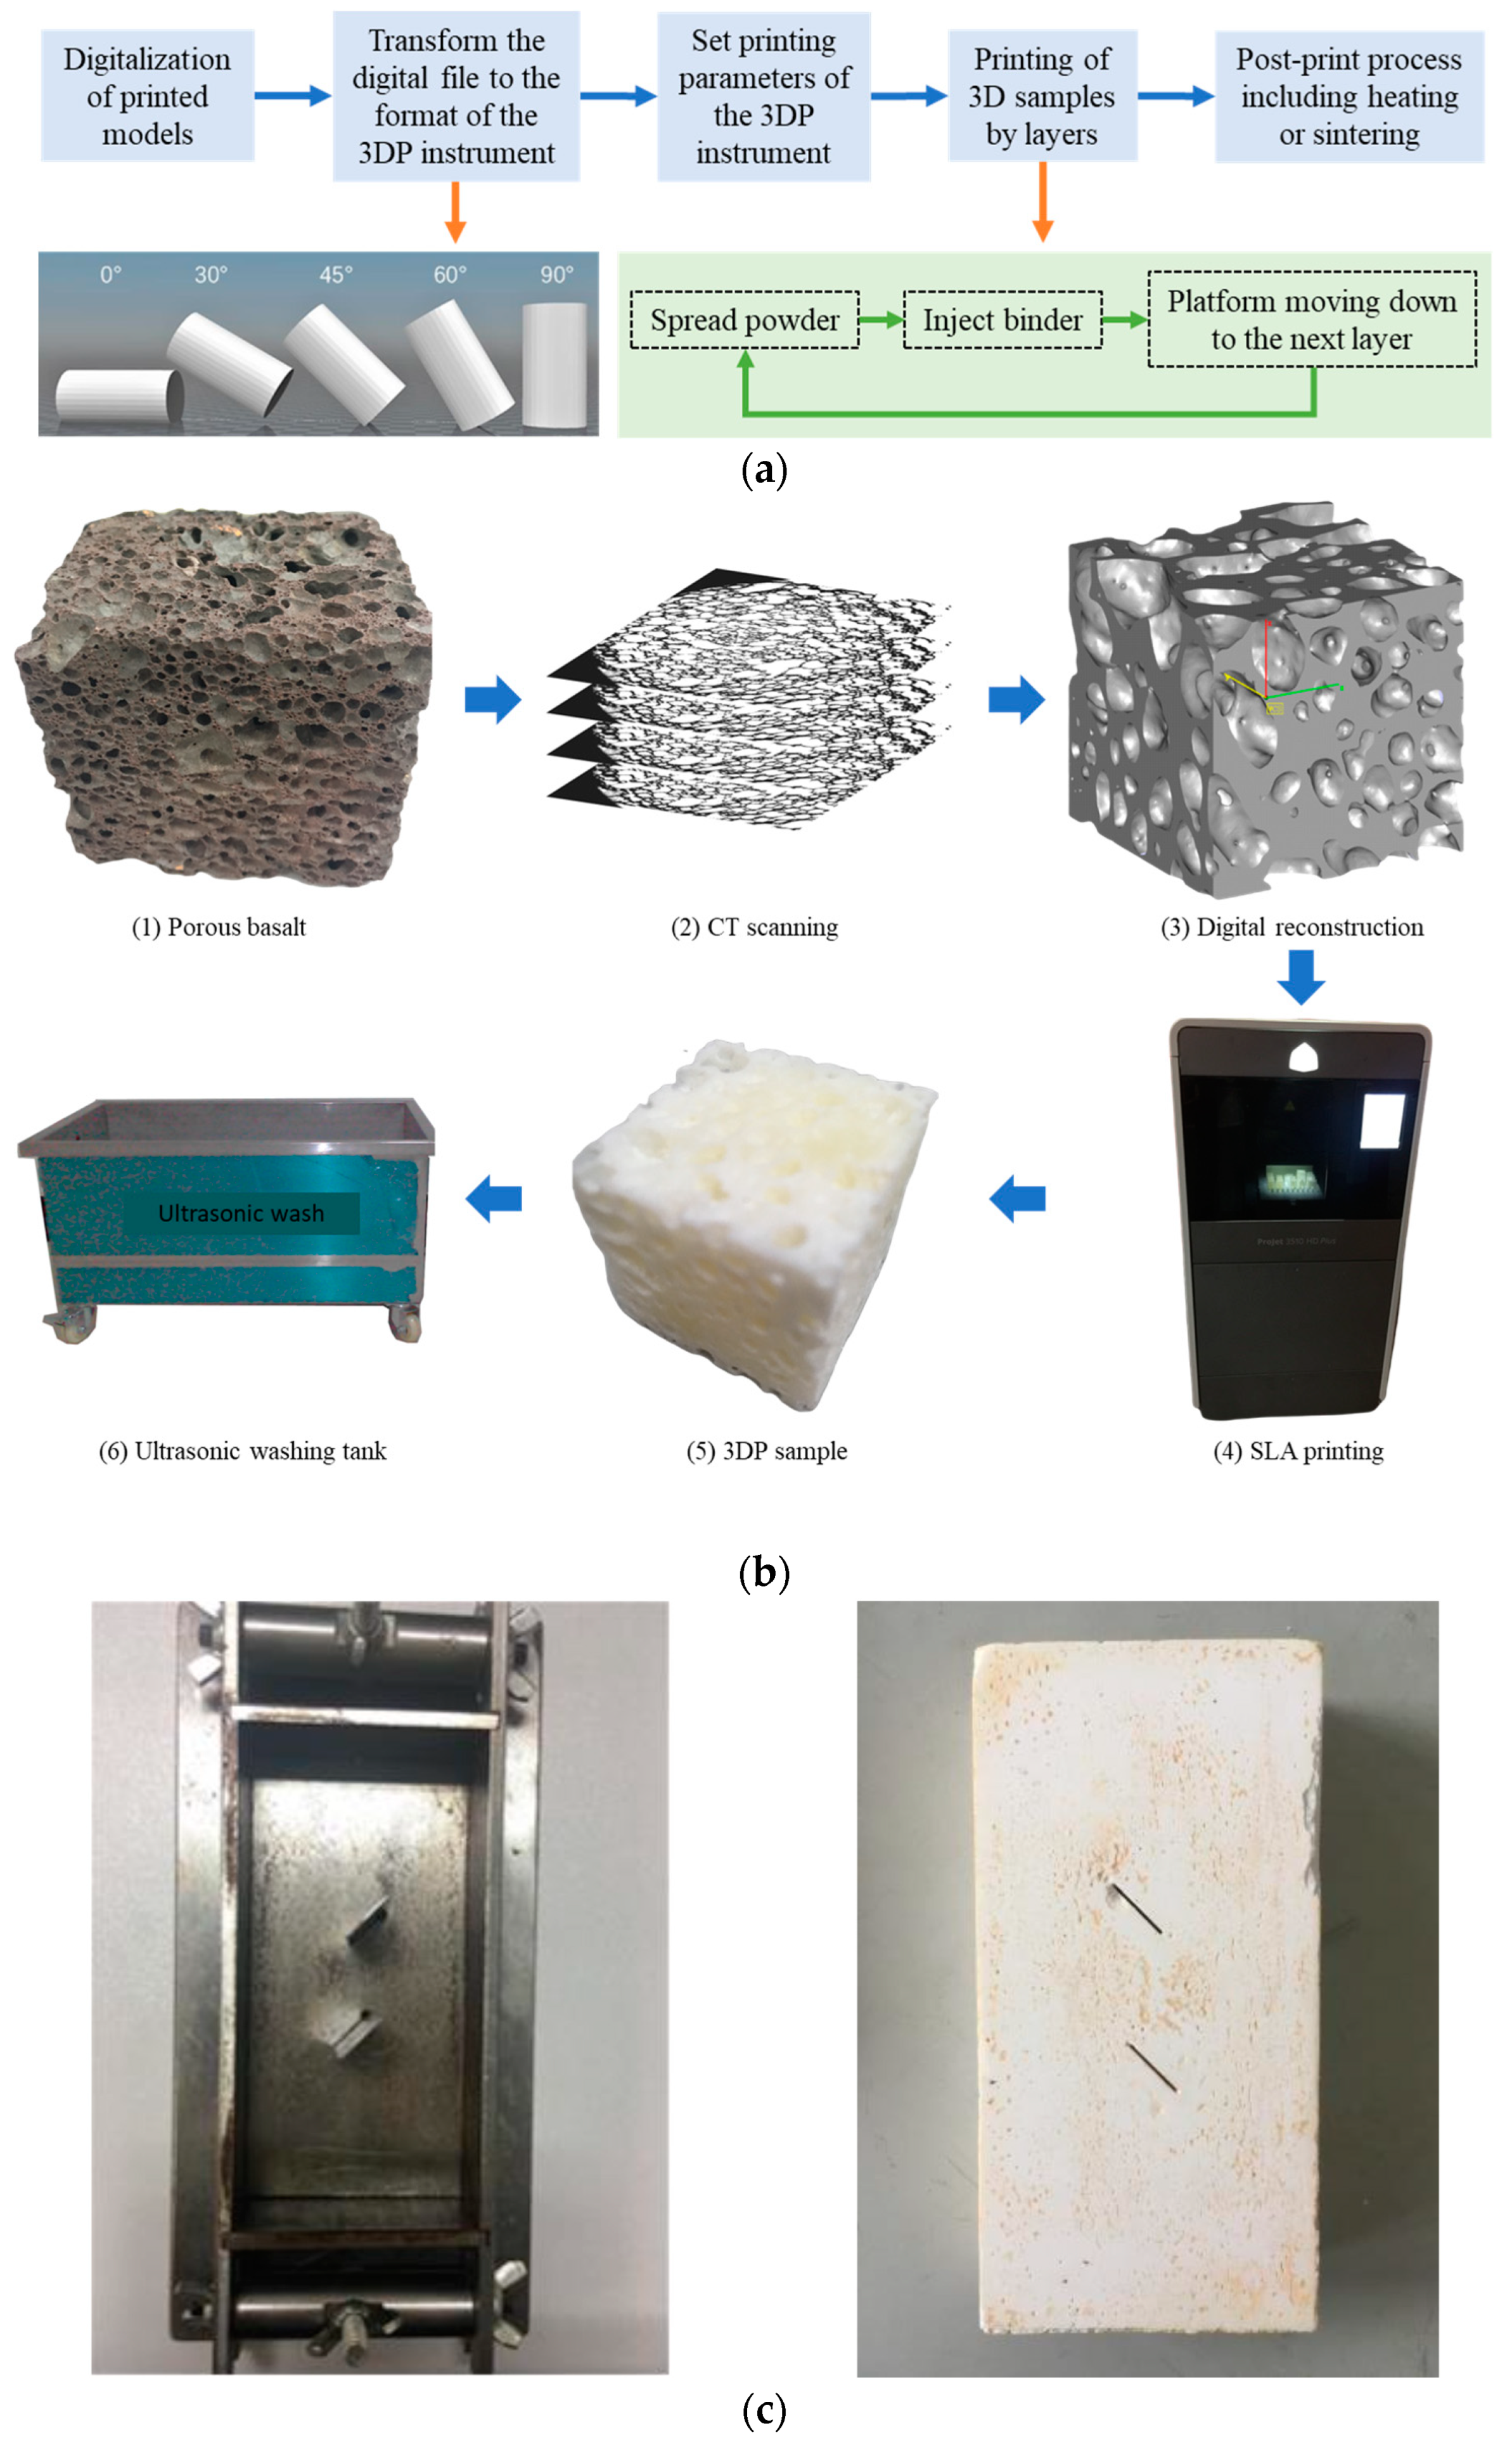
The present PP technique, with an accuracy of 100 μm/layer and a speed of 20 mm/h, uses gypsum powder and binder to print rocklike samples. The printing process is shown in Figure 1. Since there might be some variations in the setup of printing programs and materials, the present study does similar tests first by printing a series of cylindrical samples with various incline angles (0°, 30°, 45°, 60°, and 90°) between the long axis and the horizontal printing plane. The binder used for PP printing is an organic polymer material stored in an aqueous environment. The sample just printed is slightly ‘wet’ due to this reason. It is necessary to study the influence of drying temperature on the sample’s physical and mechanical properties. In this study, four different drying temperatures (20 °C, 60 °C, 100 °C, and 140 °C) are applied. However, gypsum is unsuitable for permeability tests because of the chemical reaction with the water. Therefore, due to its high printing precision and nonreaction with water, the SLA method is added to print the resin samples for the permeability tests.
2.1.2. Stereolithography 3D Printing
The present stereolithography (SLA) can replicate a type of porous basalt that originates in Wudalianchi City, Heilongjiang Province, China, because most pores inside the porous basalt are larger than 100 μm in diameter. The overall density and porosity of the porous basalt are 0.70 g/cm3 and 25%, respectively. The permeability and anisotropy of the 3DP samples are then tested and compared with the original natural rock. The printing processes of the SLA method are shown in Figure 1: (1) digital reconstruction by micro-CT scanning with a resolution of 1 μm and a scanning layer thickness of 100 μm, (2) print by adding support materials (wax) in the SLA process, and (3) post-print wash using ultrasonic waves. It does not need sintering or cementation after manufacturing, but the mechanical properties of the SLA samples are normally different from those of natural rocks.
2.2. Moulded Gypsum
The moulded gypsum samples with pre-existing flaws are prepared using a mould containing the position for the installation of the thin steel shims. The shims are pulled out with the help of the grease before the insert. The thickness of the thin steel plate is about 0.4 mm. The cast sample uses a type of high-strength gypsum powder mixed with water, and the mixing ratio is 1 (water): 2.65 (gypsum). For the details of the preparation steps, please refer to the author’s previous paper [43,46]. After the sample is formed, check the surface, remove the damaged samples, polish the surface, and ensure the flatness of the samples, as shown in Figure 1c.
2.3. Testing Methods
2.3.1. Uniaxial Compression Strength (UCS) Test
The CSS44300 material testing machine is used for the uniaxial compression strength with a maximum loading capacity of 100 kN and a maximum displacement rate of 0–500 mm/min. The test adopts the displacement control mode. A preloading of about 0.1kN is applied manually to increase the contact quality between the specimen end and the loading plate. Then, the specimen is compressed at a constant loading rate of 0.1 mm/min with the help of LVDT to measure the vertical displacement until it is damaged. There are three parallel samples in each group of tests.
2.3.2. Seepage Test
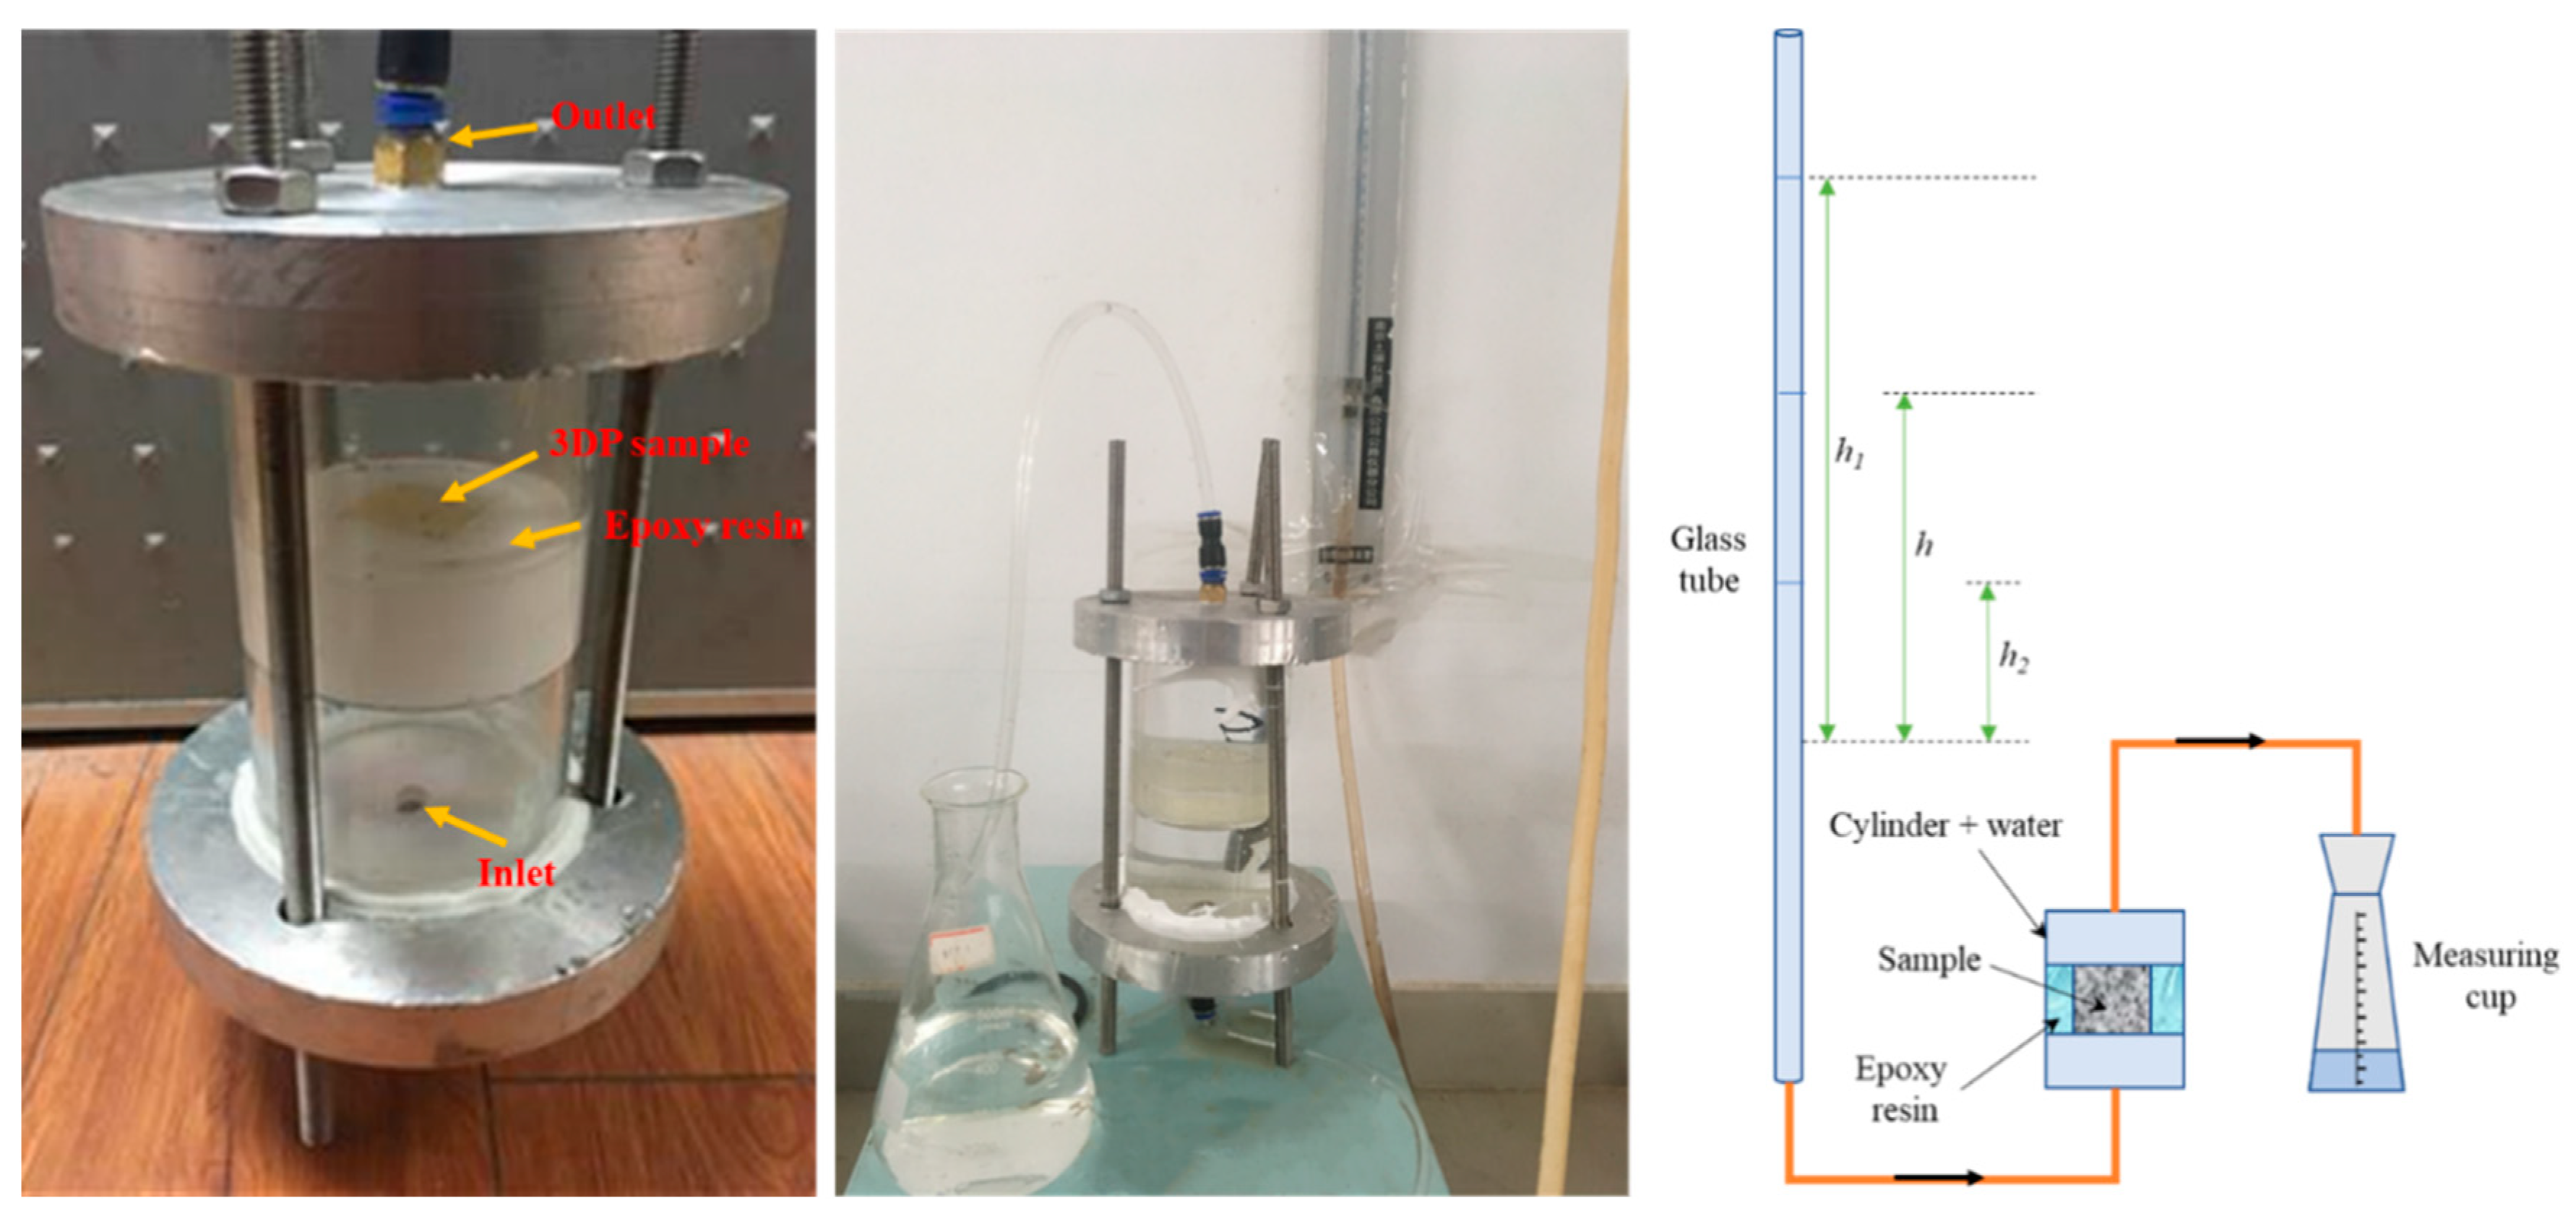
The permeability coefficients of the present samples are calculated based on Darcy’s law by measuring the change in waterhead versus time, which is called the variable waterhead method, as shown in Figure 2. Five steps are used in the test: (1) place the sample in a plexiglass cylinder by sealing its lateral surfaces with epoxy resin, (2) saturate the sample for four hours using a vacuum saturation cylinder, (3) connect the testing setups and fill them with water, (4) remove air bubbles in the tubes, and (5) then record the water head versus the time when the water head variation is stable. The permeability coefficient of the sample is the average value of three different recording periods.
3. Results
Moulded gypsum is commonly used in research on the cracking behaviour and failure mode of brittle rocks under both quasi-static and dynamic loadings [19,44,45,49,50,51]. If the similarities regarding the mechanical properties and cracking behaviour between moulded gypsum and 3DP gypsum can be proved, the 3DP gypsum samples can be guaranteed in the physical simulation of natural rocks. In addition, the permeability of the SLA samples and the original porous basalt are also tested to evaluate the capability of the SLA samples in the physical simulation of water seepage. A comparison of the experimental results between the original rocks and the replicated 3DP samples is conducted to discuss the feasibility of 3DP methods in the physical simulation of rocks in this section.
3.1. Mechanical and Fracturing Behaviour of Intact Samples
The main challenge of 3DP samples in the physical simulation of natural rocks comes from the differences in mechanical properties. The differences in mechanical properties, such as stiffness, elastic modulus, peak stress, and failure strain, may result in a different failure mode. This section reports such similarities and differences based on the intact gypsum samples, considering the printing directions and the sintering temperature by the PP printing method.
3.1.1. Mechanical Properties and Failure Mode
The cylindrical samples have the same length-diameter ratio of 2:1. The average UCS of the 3DP samples is about 8.64 MPa, with an elastic modulus of 0.4 GPa and a failure strain of 2.75%. Since no binder is used in moulded gypsum, the moulded gypsum shows a higher brittleness and a much lower failure strain (0.137%). According to the definition of brittleness (a failure strain of less than 3%) [52], 3DP gypsum is brittle but not as brittle as natural rocks and moulded gypsum. Since brittleness can affect the failure mode [53], this result indicates that more tests about the failure mode should be conducted to verify the feasibility of 3DP or moulded gypsum in simulating the failure process of brittle rocks. The failure modes of 3DP and moulded samples are compared to investigate the feasibility of the 3DP specimens in experimental rock mechanics. Figure 3 shows the typical failure pattern of the cylindrical specimens, indicating their similarity in failure mode.
3.1.2. Effects of Printing Direction and Sintering Process
The printing direction and the sintering process of the PP 3DP method will affect the mechanical properties of the specimens. This feature makes the PP printing capable of simulating the sedimentary rocks regarding the sedimentary direction and the cementation condition between grains. This section selected five different printing inclination angles and four sintering temperatures to systematically study the influence of the printing parameters of PP 3DP on mechanical properties and failure modes.
- (1)
- Inclination angle
Table 1 lists the physical and mechanical properties of the 3DP specimens, including the dry density, UCS, and failure strain, with five printing inclination angles (0°, 30°, 45°, 60°, and 90°) and the sintering temperature of 100 °C. The UCS is significantly affected by the printing inclination angle. The specimens with the 45° inclination angle have the lowest UCS value consistent with the experimental data on the sedimentary rocks in previous studies [54,55,56,57], while those with the 0° and 90° inclination angles are the most consistent with the theoretical result based on single-joint mode [58] and the experimental result given by Fereshtenejad and Song (2016) [20]. Fortunately, the failure strains of most specimens are less than 3%, supporting a brittle failure characteristic. Figure 3 shows the typical stress–strain curve of these 3DP specimens. The inclination angle also has a conspicuous influence on elastic modulus, post-failure modulus, and brittleness, which should be considered in the research using 3DP methods.
Coplanar failure patterns may dominate the failure mode for complicated structures manufactured by these layered printing methods. The specimens with printing inclination angles of 30°, 45°, and 60° have a shear plane coplanar with the printing direction, as shown in Figure 3. The specimens with a printing inclination angle of 90° have a diagonal or X-shaped failure plane, similar to the failure mode of natural homogenous and isotropic brittle rocks. Therefore, the printing inclination angle is chosen to be 90° to minimize the influence of the printing inclination angle in this study.
- (2)
- Sintering temperature
A certain period of high-temperature curing can improve the strength of the PP 3DP sample. It is noted that all the samples are printed with a printing inclination angle of 90°. Since it is found that the change in sample mass becomes very little after eight hours of sintering, the samples are heated and cured in an oven for eight hours at different temperatures (20 °C, 60 °C, 100 °C, and 140 °C) in this study.
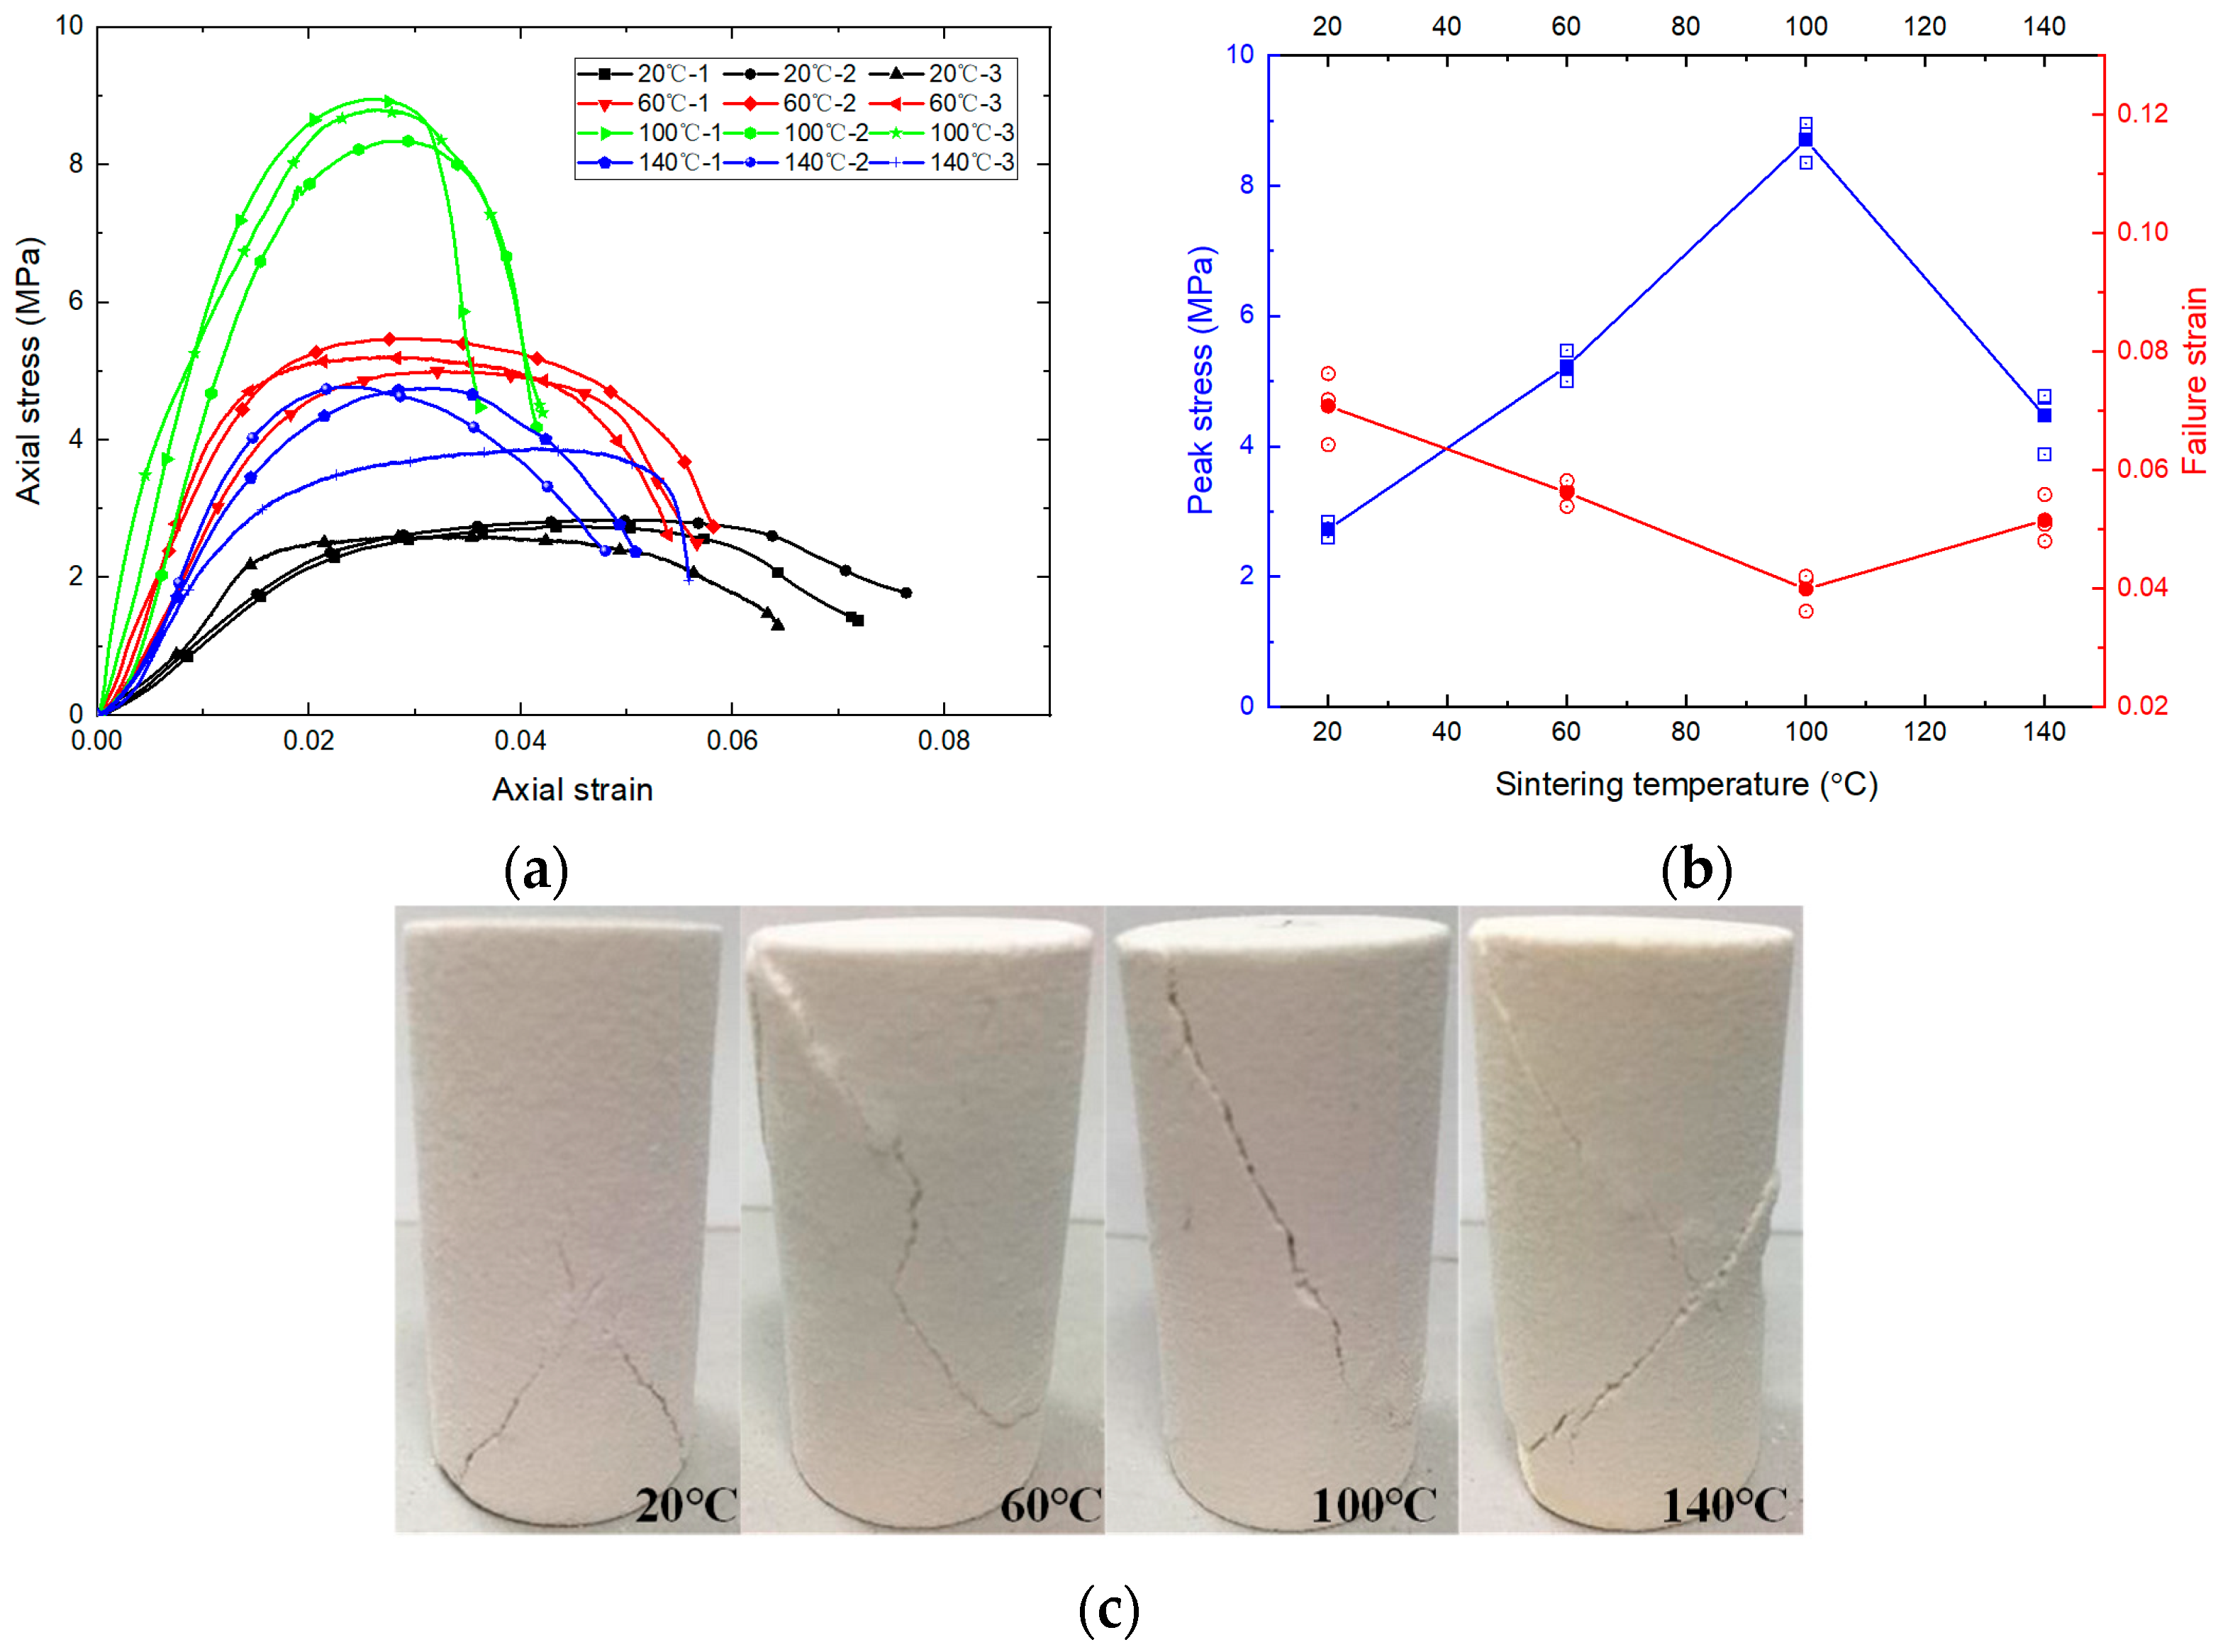
The stress–strain curves and the corresponding UCS and failure strain are shown in Figure 4 and Table 2. It is found that the mechanical properties are very sensitive to the sintering temperature, with nonlinear and nonmonotonic variation trends. The UCS increases with the sintering temperature within 100 °C, while it decreases sharply over 100 °C. In contrast, the failure strain decreases significantly with the sintering temperature within 100 °C, while it increases at 140 °C. The surface colour changes from pure white to light yellow at 140 °C (Figure 4), implying the chemical change of the gypsum or the binder. However, the sintering temperature has little influence on the failure pattern, mainly diagonal or X-shaped failure.
- (3)
- Summary
Though the present results are similar to those reported by Fereshtenejad and Song (2016) [20], there are still two differences. One is the corresponding inclination angle of the highest UCS, and the other is the corresponding sintering temperature. Such a result indicates that tests on basic mechanical and physical properties are advised to be conducted even though the same printing technique is used as in the previous studies.
3.2. Mechanical and Fracturing Behaviours of Samples Containing Pre-Existing Flaws
As stated before, the crack patterns between moulded and 3DP gypsum samples should be compared before the physical simulation to confirm their feasibility. Jiang et al. (2016) and Liu et al. (2017) used the single-flawed 3DP sample by FDM and powder-ink binders (PIB) methods to discuss the feasibility of 3DP samples in simulating rock failure [59,60]. The present study uses more complicated samples with three double-flaw system types (Figure 5) to test the coalescence behaviour. The flaw length 2a is 12 mm, and the bridge length 2b linking the two inner tips is 20 mm. The inclination angle is 45°, but with different bridging angles (β). The cracking processes of the specimens belonging to these three double-flaw systems are illustrated in Figure 6. The 3DP specimens show the advantages of repeatability and data reliability in the physical simulation of the cracking process of brittle rocks. The similarities and differences between the moulded and 3DP gypsum specimens are summarized below.
- (1)
- As shown in Table 3, the failure strains of the pre-flawed specimens are significantly higher than those of the intact moulded gypsum (0.1%~0.2%). The double-flawed specimens made from moulded gypsum have a failure strain ranging from 0.7–0.8%, while those made from 3DP gypsum are usually higher than 1%. The higher failure strain of the 3DP specimen is thought to be attributed to the plastic deformation brought on by the binder used in the 3DP process.
- (2)
- The crack patterns of these two types of specimens are similar regardless of flaw geometries. The coalescences appear slightly before the peak stress, and their development induces specimen failure. The result shows the feasibility of the 3DP gypsum in the physical modelling of the rock failure process.
- (3)
- (4)
- The tensile wing cracks, apparently initiating before the anti-wing and coplanar cracks, are more likely to develop in the moulded gypsum specimens than the 3DP samples, which indicates the higher brittleness of the moulded gypsum.
- (5)
- Another obvious difference is that the crack opening of the moulded gypsum is slightly narrower than that of the 3DP gypsum, also indicating the difference in brittleness.
3.3. Seepage Behaviour of SLA Samples
3.3.1. Pore Size and Printing Resolution
The porosity of rocks is typically low, with only certain types of rocks, such as sandstone [69], limestone [70], dolomite [71] and porous volcanic rocks [72] exhibiting porosity greater than 10%. Microscopic examination of Zigong sandstone reveals a relatively uniform pore size distribution, with pore diameters generally less than 180 μm, most of which are less than 50 μm. The actual printing accuracy may be lower due to deformations prior to solidification and mechanical disturbances such as motion inertia and printing head jitter. Practical experience suggests that when the printed pore diameter is greater than 0.3 mm, it closely resembles the original model, while printed pore volumes become smaller than the model size when the pore diameter ranges from 0.1 mm to 0.3 mm. A pore size less than 0.1 mm results in significantly reduced or even complete filling of the printed pore. Consequently, the effective print pore size of current 3DP technologies is approximately 0.3 mm. In addition, considering the chemical reaction with water, the PP sample is unsuitable for the research on permeability. Therefore, the present study uses the SLA method to replicate the pores with sizes larger than 0.1 mm to study the permeability behaviour.
3.3.2. Rocks with Coarse Pores
Porous basalt with coarse pores has a high potential for CO2 geological storage. This section investigates the feasibility of the SLA method to reconstruct the pore structures and to investigate the permeability of the porous basalt originating from Wudalianchi City in northeastern China. The CT scanning found that the diameter of most pores inside the rock is higher than 0.3 mm, which is suitable for the SLA method to replicate the pores.
The SLA samples are cubic, measuring 30 mm × 30 mm × 30 mm. The porosities of all the samples were measured before seepage tests, as shown in Table 4. The porosities are relatively stable, reflecting the SLA technique’s advantage in making parallel samples. They are slightly lower (about 7%) than the original rock, probably attributing the incapability of the print machine to the small pores. It is worth noting that the porosity measured by the vacuum pumping method in this paper is open porosity, which includes the ratio of the volume of interconnected pores to the sample volume. The sintering temperature is 70 °C to prevent the deterioration of the binder materials in 3DP samples.
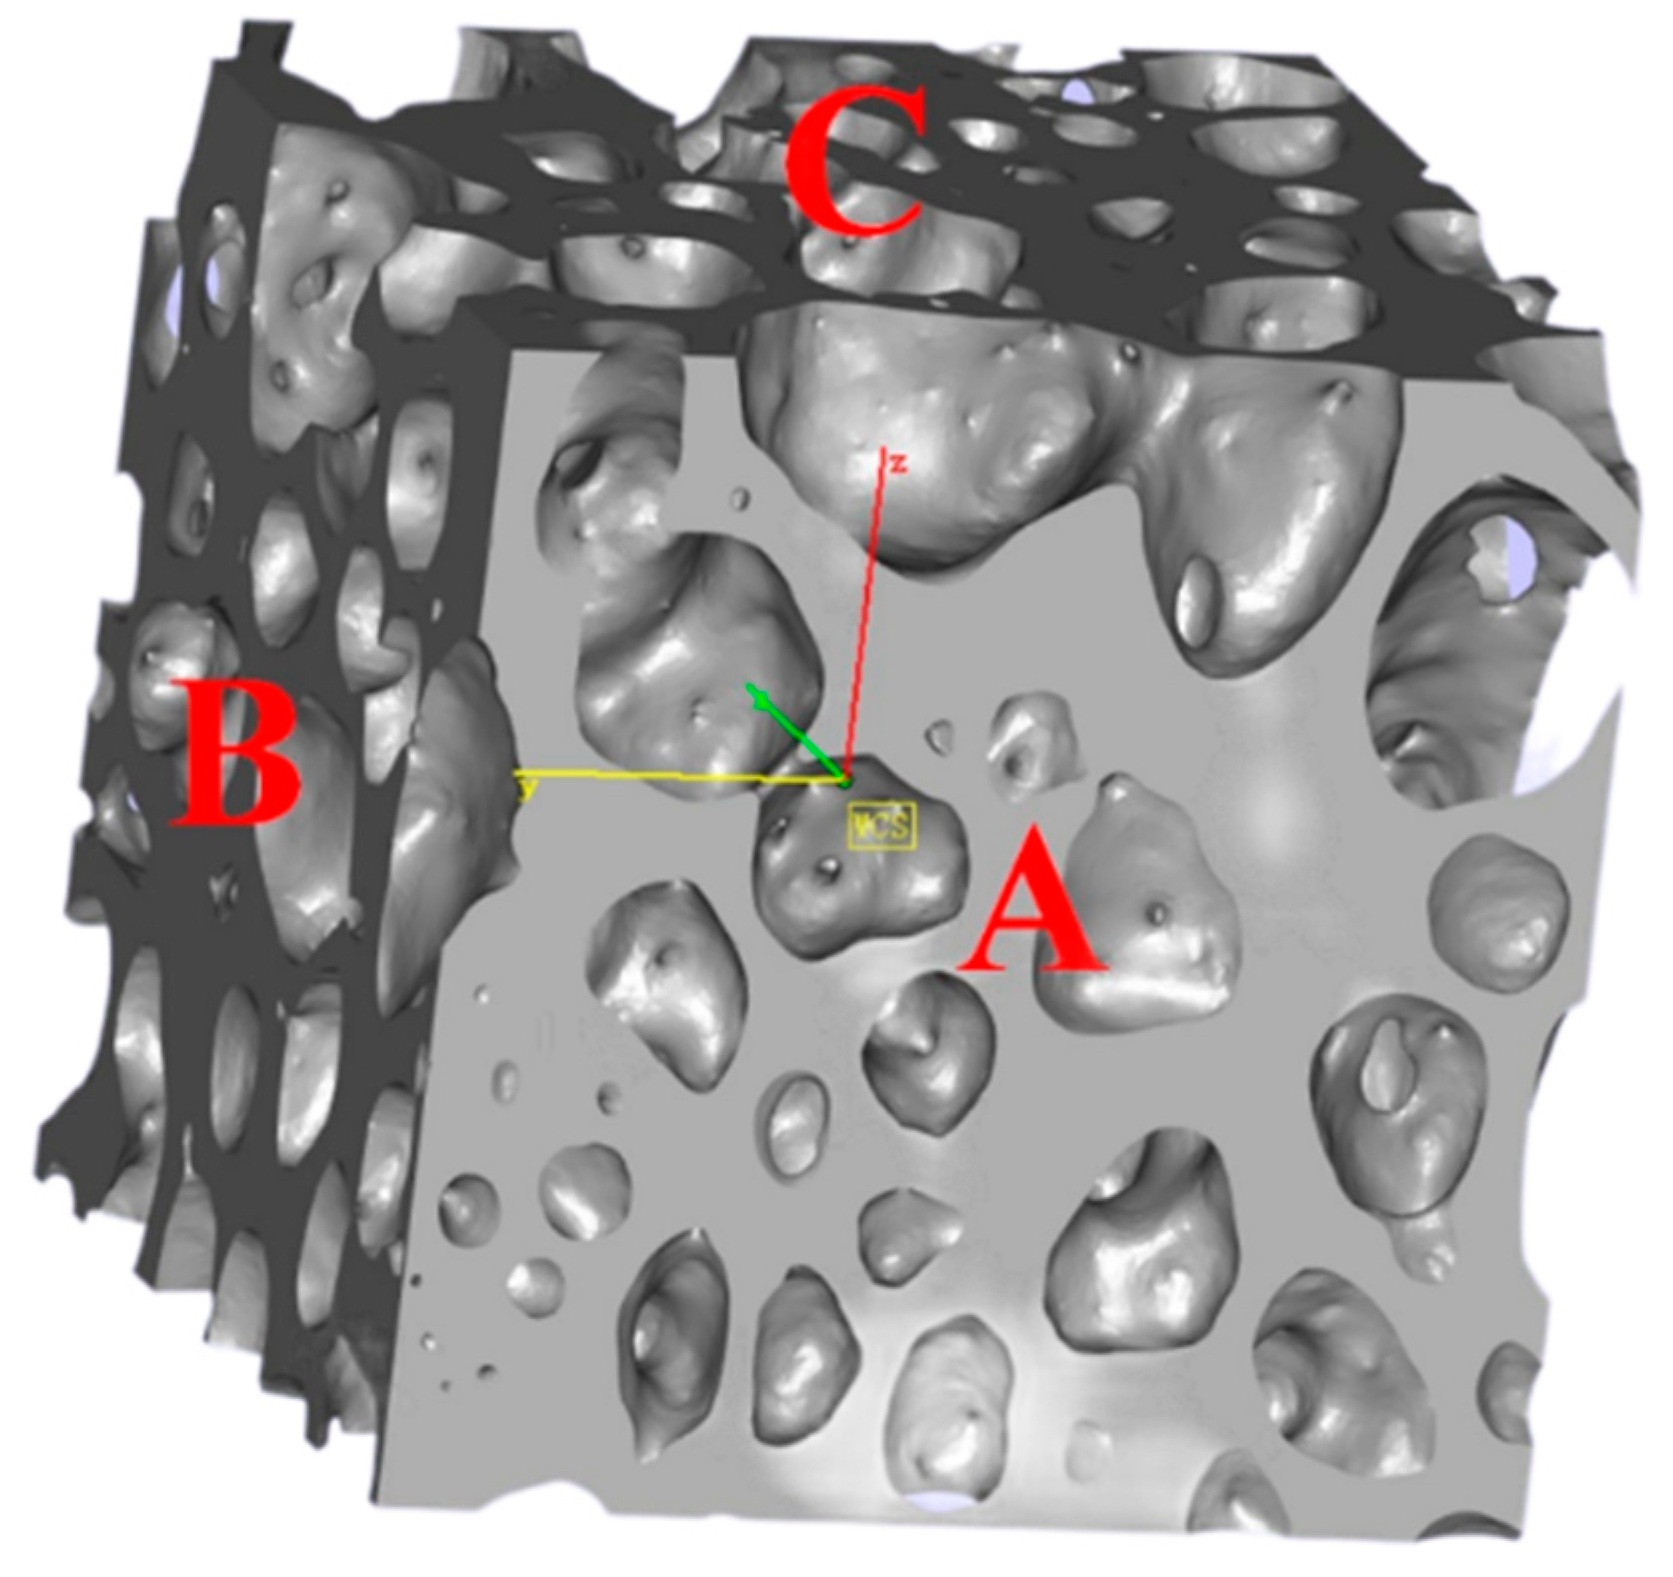
Seepage tests were performed on 3DP samples to determine their permeability. Three groups of specimens were tested, with each group consisting of three parallel specimens oriented along three seepage directions perpendicular to the cubic surfaces (designated as Faces A, B, and C in Figure 7), in order to investigate the anisotropy of the permeability. Due to the use of epoxy resin to fix and seal the other four surfaces, each specimen could only be tested in a single seepage test, and reuse was not possible. Consequently, the original rock sample was only tested along the seepage direction perpendicular to Face A. To ensure test reliability, three parallel tests were conducted for each seepage direction, and the average value was used to calculate the final permeability coefficient for that direction.
Table 4 presents the permeability coefficients of the original rock sample and the 3DP replication samples. The permeability coefficients perpendicular to Face A for both the original rock and the replicated samples are very similar, differing by only approximately 10%. This result suggests that SLA 3DP samples can be used to represent the permeability of coarse porous rocks accurately. However, the permeability coefficients differ significantly along the three flow directions, indicating the anisotropy of permeability. Despite the similarity in pore structure among specimens exposed to different surfaces, significant differences in permeability perpendicular to these surfaces were observed. Notably, the maximum permeability coefficient (perpendicular to Face C) was over three times higher than the minimum value (perpendicular to Face A).
3.4. Printing Resolution Effects
3.4.1. Mathematical Modelling of Permeability
Previous studies have proposed various mathematical equations to describe the relationship between permeability and void space in rocks. In this study, we used the cylindrical tube model to estimate fluid flow, assuming that the porous medium consists of a bundle of tubes tightly packed together [73]. Based on Poiseuille’s equation (Equation (1)), fluid flow through a cylindrical tube is determined by several factors, including the tube radius, fluid viscosity, pressure difference between the two ends of the tube, and the tube length.
where Q is the flow rate (cm3/s), r is the radius of the tube (cm), μ is the fluid viscosity (poizes), ΔP is the pressure difference between two ends of the tube (dyne/cm2), and ΔL is the length of the tube (cm).
Considering Darcy’s law,
where the permeability of the one-tube system () can be written as:
where K is the permeability (cm2).
If the flow medium is assumed to contain several parallel tubes (n), the total flow rate is:
The corresponding porosity of this system is:
and the corresponding Darcy’s law can be revised to:
Therefore, the permeability of the multi-straight-tube system with the porosity can be represented by:
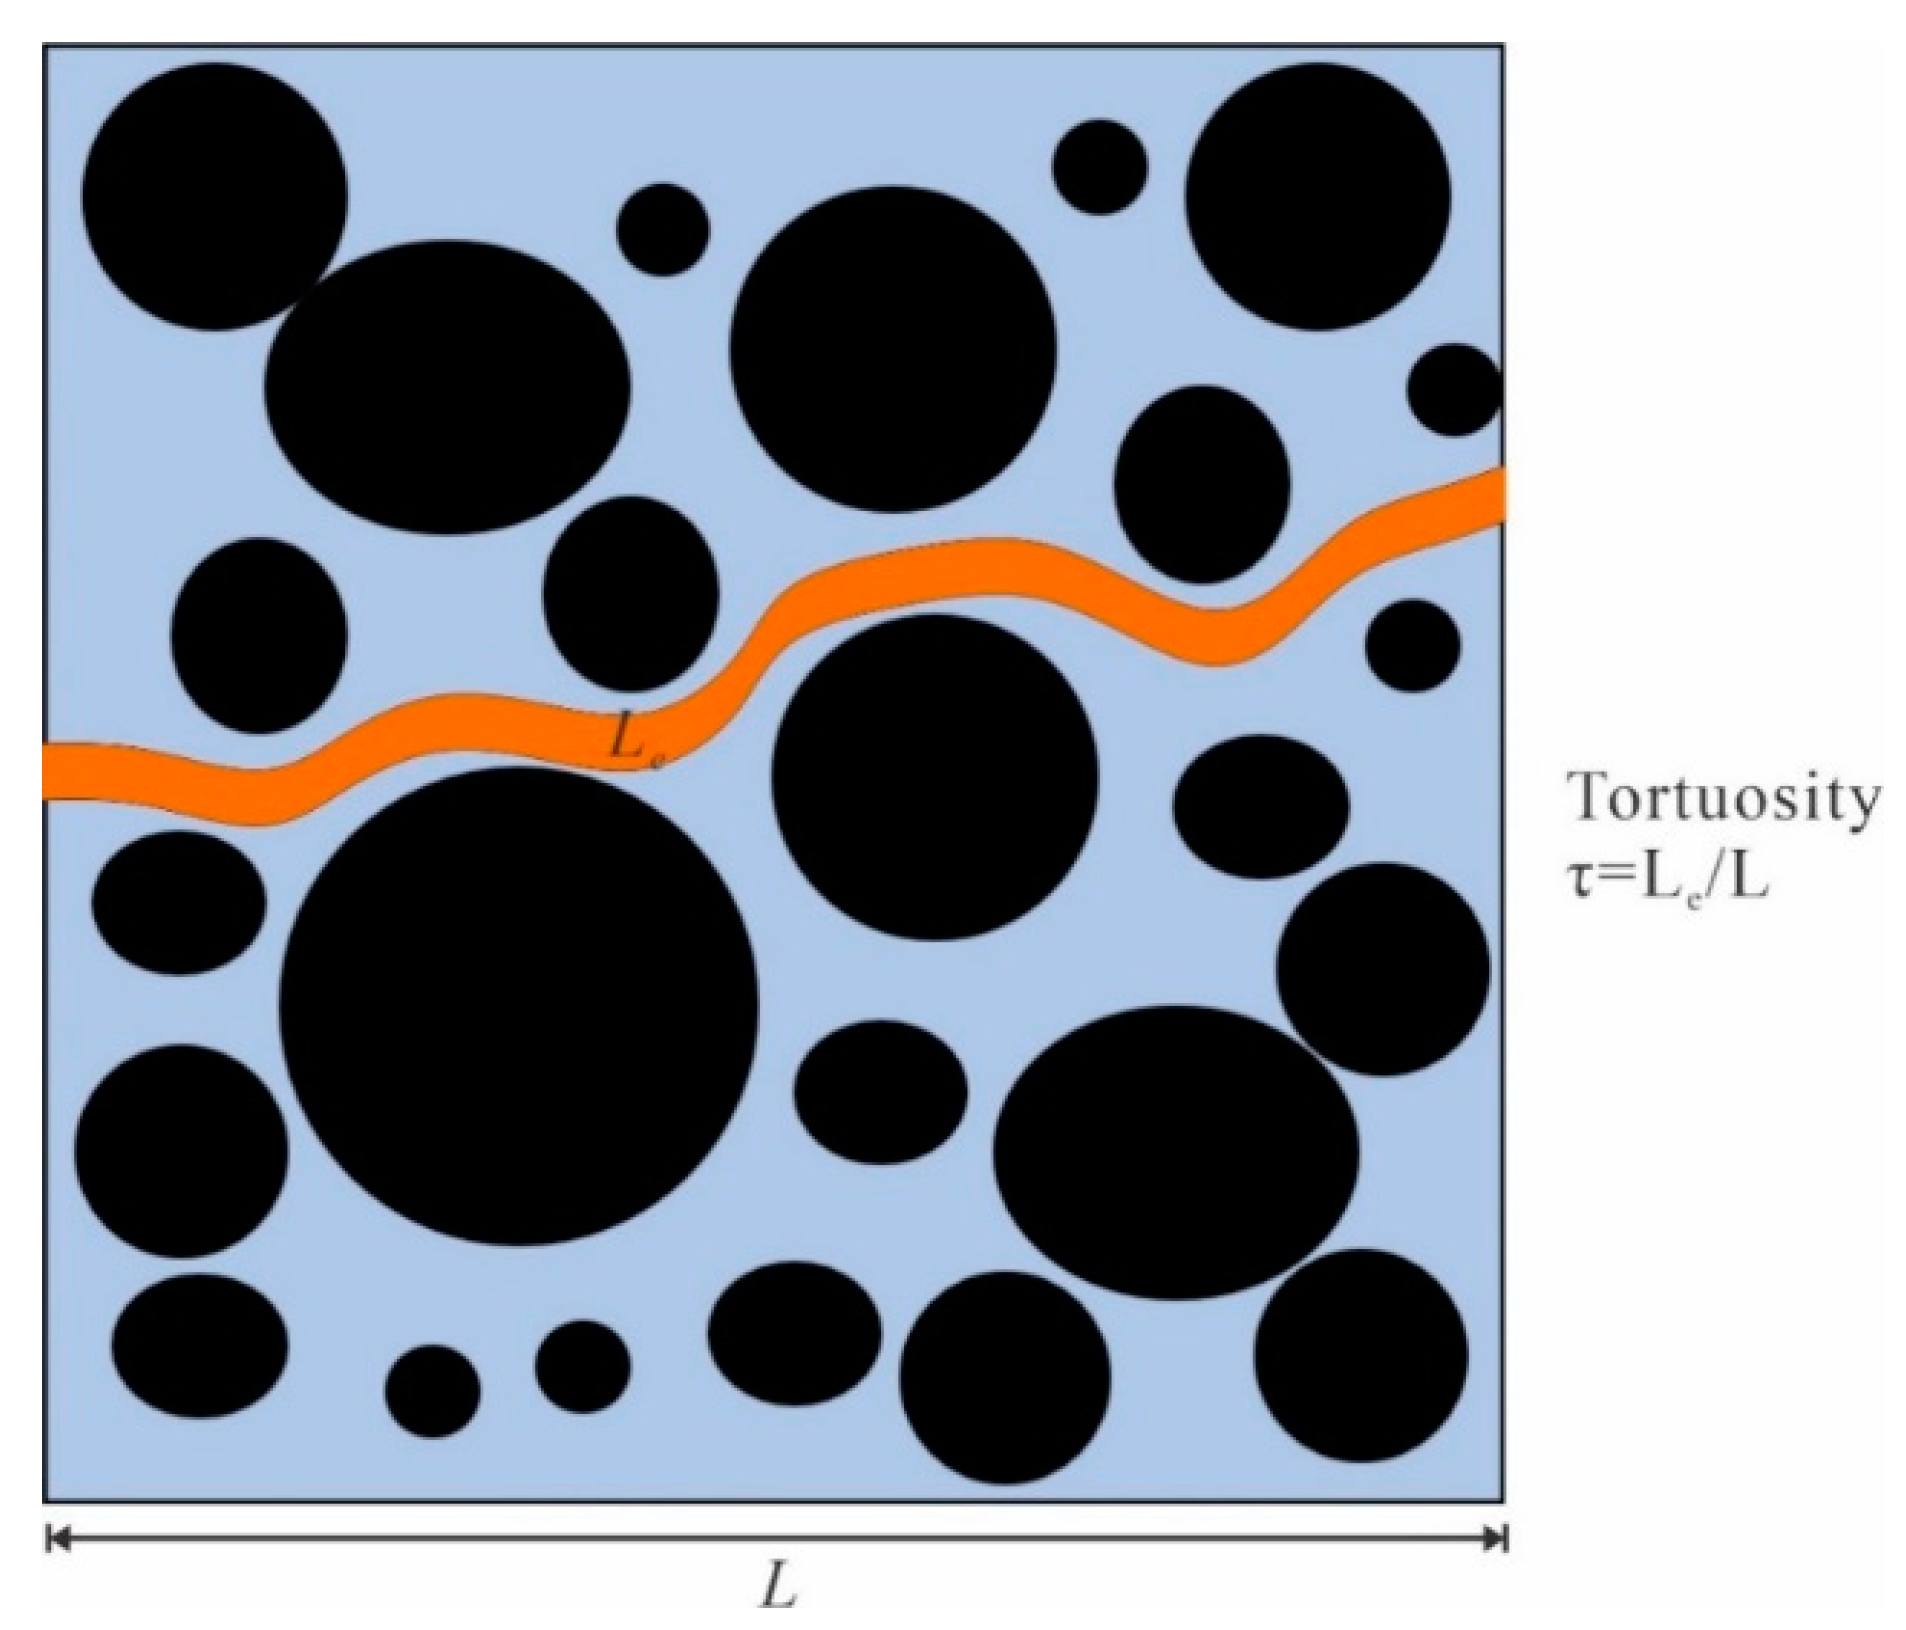
In nature, the flow tube is normally not straight but has some tortuosity. Here, we define the tortuosity as the ratio of the actual flow path (Le) to the length (L) of the porous medium along the macroscopic flow direction (Figure 8). Then, the equation about permeability should be revised accordingly.
3.4.2. Grain Size and Permeability
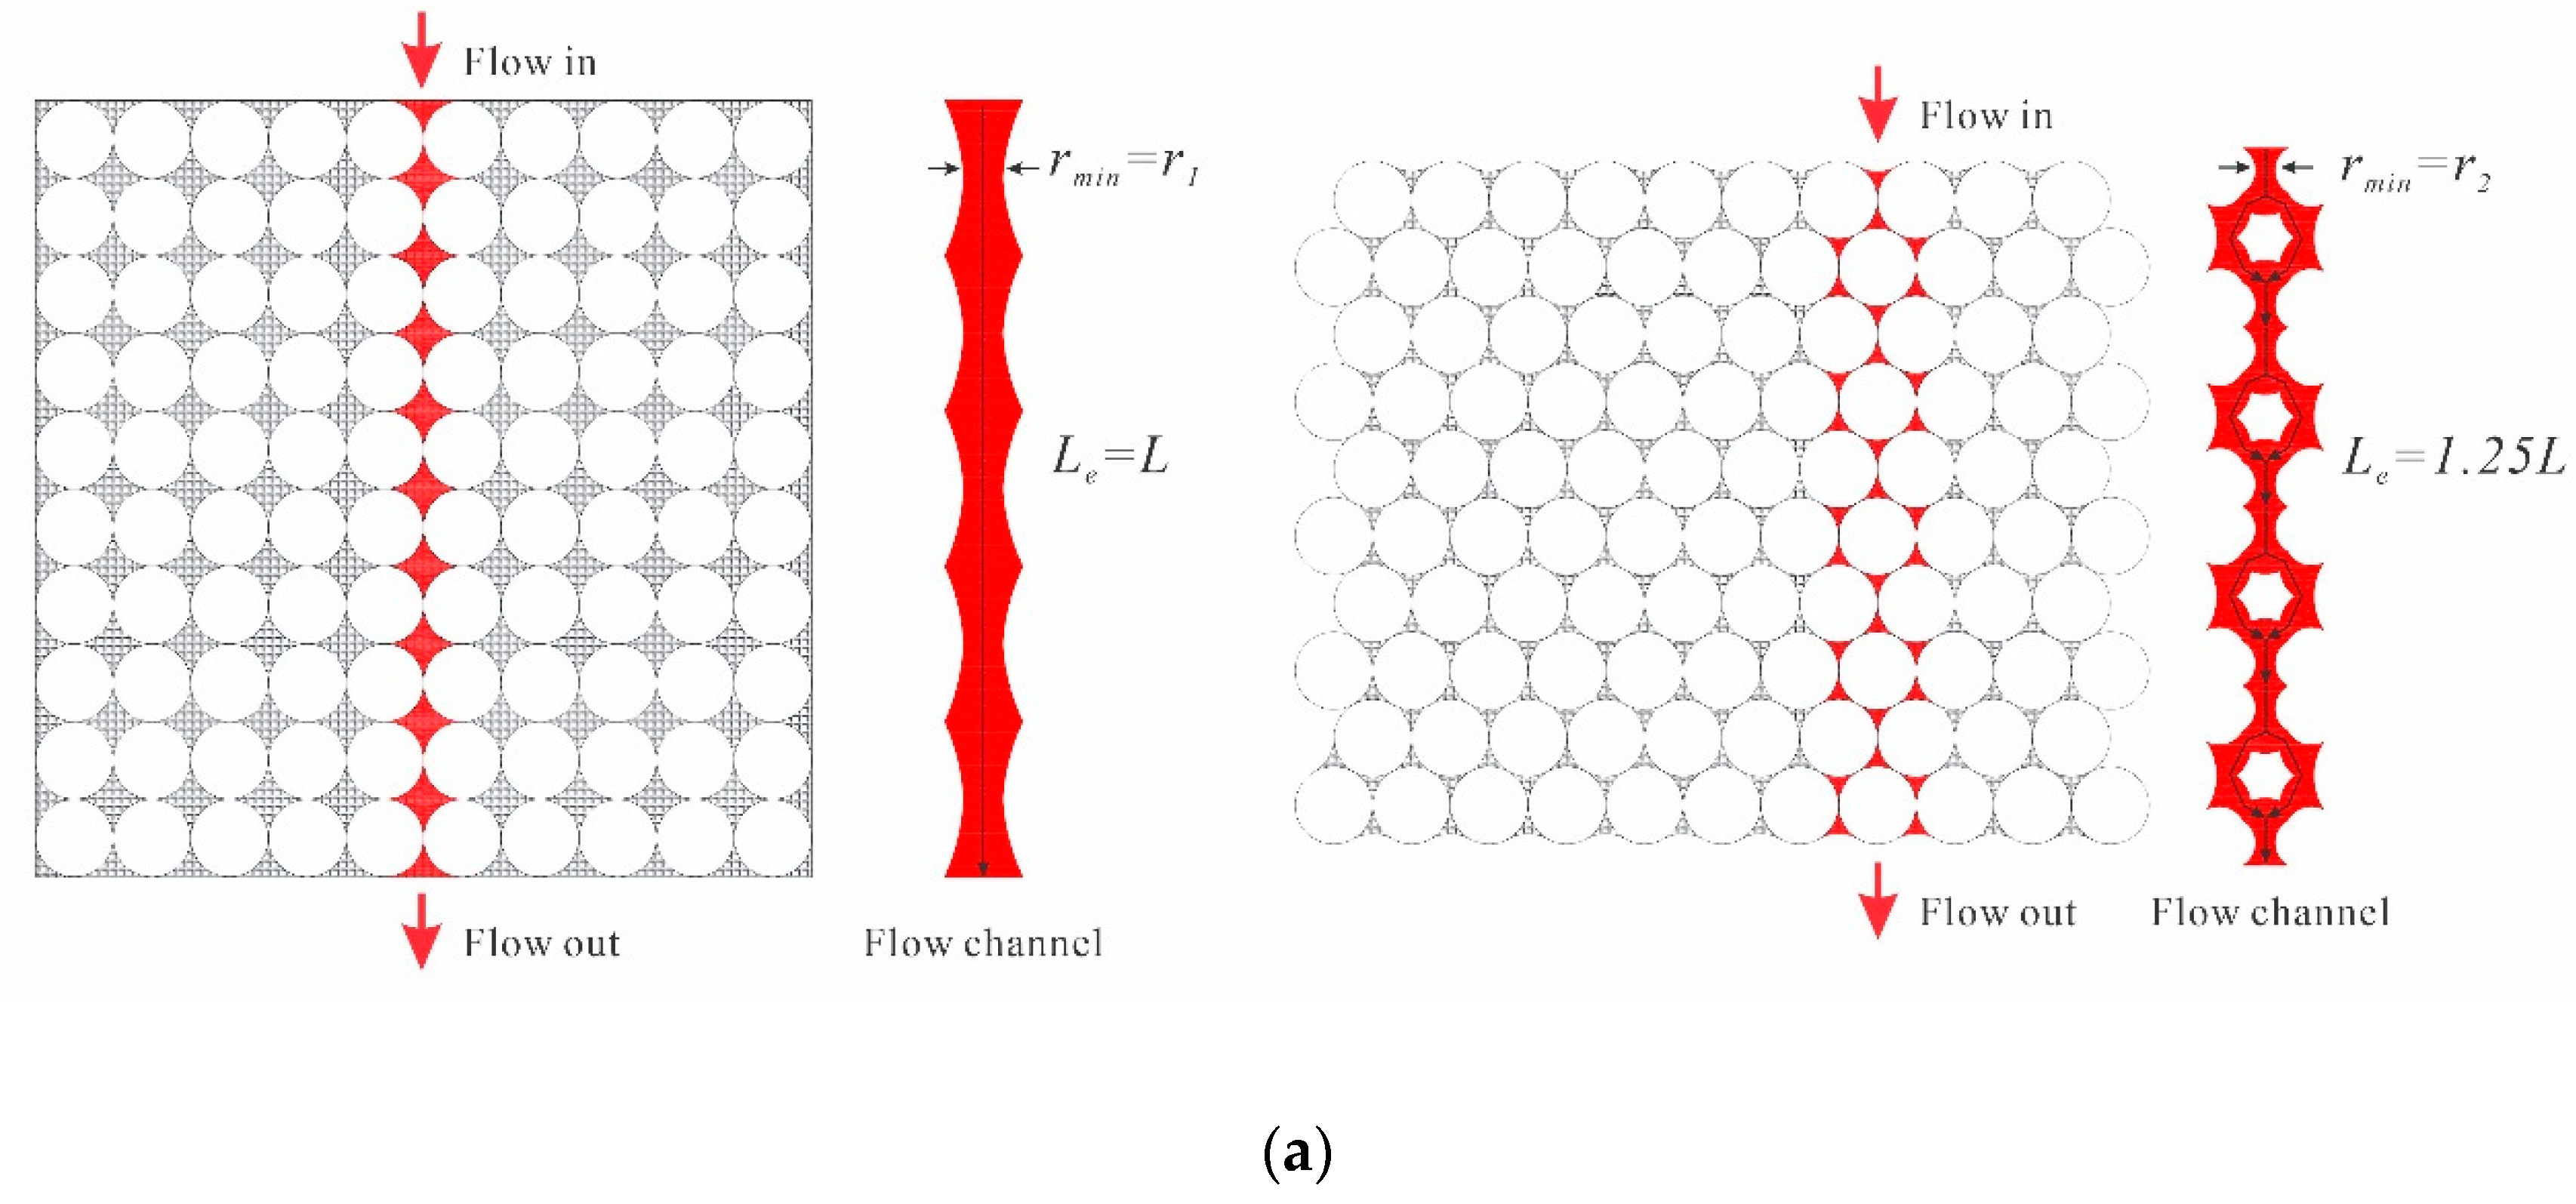
In 3D printing, the element (particle, grain, or drop) size is normally constant for a single printing project. We assume that the 3DP sample is formed by small elements layer by layer with a regular array bonded by adhesives or sintering. In that case, a mathematical model can theoretically predict the porosity and permeability of the printed samples. According to this model, the seepage channel is similar to a necklace of gems. The narrowest part is the middle part of the particles, and the widest part is the lower part of the particles. It is noted that the narrowest part controls the flow rate for a single tube, like a neck, as shown in Figure 9.
As depicted in Figure 10, the diameter of the equivalent tube can be expressed in two ways, depending on the array styles of the elements. The first arrangement yields an equivalent circular area that is equivalent to the four curved edge pores surrounded by four equal-sized particles, while the second arrangement yields an equivalent circular area that is equivalent to the three curved edge pores surrounded by three equal-sized particles. In the first arrangement, the equivalent circular area can be expressed as having a radius of r1, while in the second arrangement, the equivalent circular area can be expressed as having a radius of r2. The voids for these two arrangements are illustrated in Figure 9, which can be used to derive the theoretical porosity.
For the first type, we have:
The corresponding permeability K1 without considering the tortuosity is then determined, as illustrated by Equation (11).
For the second type, we have:
Also, the corresponding permeability without considering the tortuosity has the following form (Equation (14)):
When considering the tortuosity, the actual flow paths for the two types of particle arrangements are illustrated in Figure 9. The tortuosities in these two cases are derived in the following forms:
Therefore, the permeability coefficient calculation equation considering tortuosity has the following forms for the two types of particle arrangements:
where the units of the permeability and the radius of the pore are cm2 and cm, respectively.
3.4.3. Printing Resolution and Permeability
In this section, we discuss the variation of permeability with respect to grain size or printing resolution, assuming that the grain array is printed in the first type of arrangement. The variation trend of permeability for the medium arranged by the second style is very similar, but with a slight difference in absolute value, as indicated by the above analysis. The maximum print resolution achievable with 3D printing technology is approximately 100 nm, while the present resolution is 100 μm. Therefore, we calculated the permeability of the printed medium with an effective pore radius ranging from 10 nm to 1 mm based on Equations (17) and (18). The results presented in Table 5 demonstrate the sensitivity of permeability to pore radius. Advanced 3D printing techniques, with a high resolution of 10 nm, can be used to simulate rocks with very low porosity, such as granite, physically. It is noted that the permeability K is an intrinsic physical property of rocks independent of the fluid viscosity, while the permeability coefficient k is dependent on the fluid viscosity. The relationship between these two concepts is shown in Equation (19) [74].
4. Discussion
4.1. Advanced 3D Printing Techniques in Rock Mechanics
Based on the current 3DP technique, we find that 3DP samples can only partially simulate the mechanical and seepage characteristics of natural rocks. The physical simulation of more comprehensive physical characteristics is still not fully developed. Therefore, to take advantage of the convenience of building complex models using 3D printing technology for physical simulation, the following aspects should be considered:
- (1)
- Identify the most important physical and mechanical properties of the natural rocks of interest, and then select printing materials and methods.
- (2)
- If multiple physical and mechanical properties are relevant, it may be necessary to consider using a mixture of multiple printing materials or methods, with a discussion of feasibility.
- (3)
- The similarity between artificial and natural samples regarding brittleness or fracture toughness can affect the failure mode.
- (4)
- When exploring the manufacture of rocklike artificial samples, combinations of multiple materials in a single printing sample can be attempted to achieve uniform similarities in strength and deformation.
- (5)
- Advanced 3D printing methods can increase printing resolution and obtain finer pores in samples for research on seepage characteristics.
4.2. Application in Resource Exploitation and Geological Storage
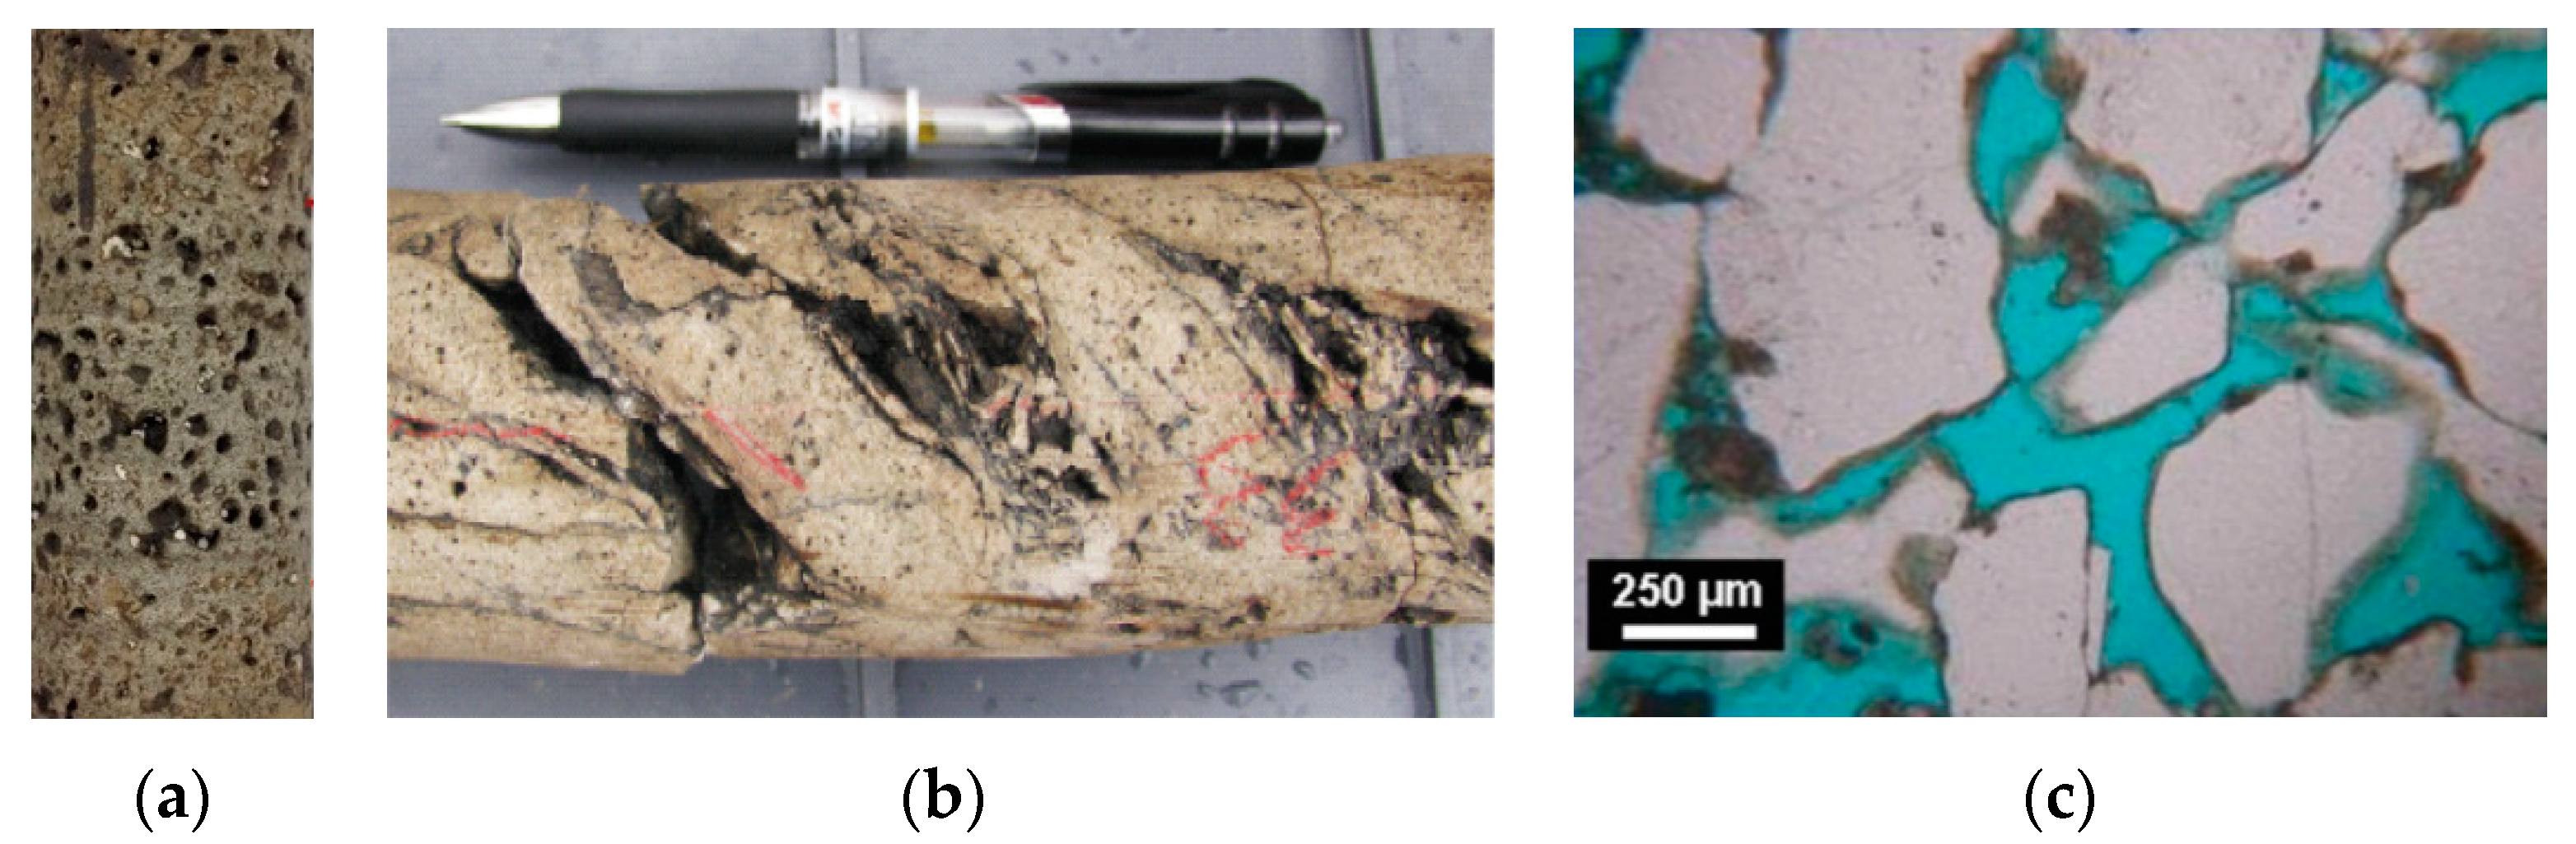
In the pursuit of sustainable energy development, massive storage techniques have emerged as a critical research focus. One promising approach is the re-utilization of depleted oil and gas fields and the exploitation of porous strata for gas or liquid storage. To optimize storage efficiency and minimize costs, it is important to identify porous media with large pore sizes (>100 μm) and good connectivity, as illustrated in Figure 11 [78,79,80]. Such a technique can also be applied to the geological storage of carbon dioxide (CO2) [4,81]. Saline formations (brine) and depleted oil and gas fields are two types of reservoirs with porous and permeable rocks that have been identified as having the largest capacity for CO2 storage [1,82,83]. CO2 is stored at depths normally greater than 800 m in a dense form to increase storage efficiency and security [2]. However, the porosity and permeability of the reservoirs play a critical role in injection difficulty and capacity, as does the fracturing behaviour of the gas or supercritical CO2 at high pressure [82].
5. Conclusions
The aim of this study is to evaluate 3D printing techniques for investigating the permeability of brittle rocks. Two mainstream 3D printing methods, stereolithography (SLA) and plaster-based 3D printing (PP), are selected to manufacture rocklike samples. The feasibility and capability of 3D-printed samples for simulating natural rocks are analysed based on their physical properties and seepage characteristics. The main findings of this study are as follows:
- (1)
- SLA is suitable for investigating the seepage characteristics or permeability of natural rocks, while PP can simulate the failure modes of brittle rocks.
- (2)
- The mechanical behaviour and failure modes of PP gypsum samples are similar to those of moulded gypsum samples.
- (3)
- The mechanical properties and failure modes of PP samples are significantly affected by the printing inclination angle and sintering temperature. This can be used to simulate sedimentary rocks by studying the influence of sedimentary orientation and cementation conditions.
- (4)
- The slight difference in mechanical properties from previously published data highlights the importance of verification tests before each physical simulation using 3D printing methods.
- (5)
- The SLA 3DP samples are found to have the capability to simulate the permeability coefficient and the anisotropy of porous basalts.
Author Contributions
Conceptualization, X.Z. and C.Z.; methodology, X.Z., Y.L. and C.Z.; software, C.Z.; data curation: Y.L.; validation, J.L. and L.H.; writing—original draft preparation, X.Z. and C.Z.; writing—review and editing, P.C. and J.L.; funding acquisition, X.Z. and C.Z. All authors have read and agreed to the published version of the manuscript.
Funding
This research was funded by the Jiangsu Province Carbon Peak Carbon Neutral Technology Innovation Project in China (grant number: BE2022034-3), the National Natural Science Foundation of China (grant numbers: 41372266 and 42220104007), and the State Key Laboratory for GeoMechanics and Deep Underground Engineering, China University of Mining & Technology (grant number: SKLGDUEK2115).
Institutional Review Board Statement
Not applicable.
Informed Consent Statement
Not applicable.
Data Availability Statement
The data presented in this study are available on request from the corresponding author. The data are not publicly available due to privacy.
Conflicts of Interest
Author Ping Che was employed by the company Jiangsu East China Geological Construction Group Co., Ltd. The remaining authors declare that the research was conducted in the absence of any commercial or financial relationships that could be construed as a potential conflict of interest.
References
- IEA. Special Report on Carbon Capture Utilisation and Storage: CCUS in Clean Energy Transitions; International Energy Agency: Paris, France, 2020. [Google Scholar]
- Ringrose, P. How to Store CO2 Underground: Insights from Early-Mover CCS Projects, 1st ed.; Springer International Publishing: Cham, Switzerland; Imprint: Hatfield, PA, USA, 2020. [Google Scholar]
- Sun, L.; Dou, H.; Li, Z.; Hu, Y.; Hao, X. Assessment of CO2 storage potential and carbon capture, utilization and storage prospect in China. J. Energy Inst. 2018, 91, 970–977. [Google Scholar] [CrossRef]
- Gluyas, J.; Mathias, S. Geological Storage of Carbon Dioxide (CO2): Geoscience, Technologies, Environmental Aspects and Legal Frameworks; Woodhead Pub.: Philadelphia, PA, USA, 2013. [Google Scholar]
- Yin, Q.; Liu, R.; Jing, H.; Su, H.; Yu, L.; He, L. Experimental Study of Nonlinear Flow Behaviors Through Fractured Rock Samples After High-Temperature Exposure. Rock Mech. Rock Eng. 2019, 52, 2963–2983. [Google Scholar] [CrossRef]
- Jiang, C.; Zhao, G.-F. A preliminary study of 3D printing on rock mechanics. Rock Mech. Rock Eng. 2015, 48, 1041–1050. [Google Scholar] [CrossRef]
- Zhou, T.; Zhu, J. Mechanical and volumetric fracturing behaviour of three-dimensional printing rocklike samples under dynamic loading. Rock Mech. Rock Eng. 2020, 53, 2855–2864. [Google Scholar] [CrossRef]
- Sharafisafa, M.; Shen, L. Experimental investigation of dynamic fracture patterns of 3D printed rocklike material under impact with digital image correlation. Rock Mech. Rock Eng. 2020, 53, 3589–3607. [Google Scholar] [CrossRef]
- Zhou, T.; Zhu, J.B.; Ju, Y.; Xie, H.P. Volumetric fracturing behavior of 3D printed artificial rocks containing single and double 3D internal flaws under static uniaxial compression. Eng. Fract. Mech. 2019, 205, 190–204. [Google Scholar] [CrossRef]
- Sharafisafa, M.; Shen, L.; Zheng, Y.; Xiao, J. The effect of flaw filling material on the compressive behaviour of 3D printed rocklike discs. Int. J. Rock Mech. Min. Sci. 2019, 117, 105–117. [Google Scholar] [CrossRef]
- Zhu, J.B.; Zhou, T.; Liao, Z.Y.; Sun, L.; Li, X.B.; Chen, R. Replication of internal defects and investigation of mechanical and fracture behaviour of rock using 3D printing and 3D numerical methods in combination with X-ray computerized tomography. Int. J. Rock Mech. Min. Sci. 2018, 106, 198–212. [Google Scholar] [CrossRef]
- Zhou, T.; Zhu, J.B. Identification of a suitable 3D printing material for mimicking brittle and hard rocks and its brittleness enhancements. Rock Mech. Rock Eng. 2018, 51, 765–777. [Google Scholar] [CrossRef]
- Ju, Y.; Wang, L.; Xie, H.; Ma, G.; Mao, L.; Zheng, Z.; Lu, J. Visualization of the three-dimensional structure and stress field of aggregated concrete materials through 3D printing and frozen-stress techniques. Constr. Build. Mater. 2017, 143, 121–137. [Google Scholar] [CrossRef]
- Gomez, J.S.; Chalaturnyk, R.J.; Zambrano-Narvaez, G. Experimental investigation of the mechanical behavior and permeability of 3D printed sandstone analogues under triaxial conditions. Transp. Porous Media 2019, 129, 541–557. [Google Scholar] [CrossRef]
- Guo, C.; Zhao, D.; Liu, Z.; Ding, Q.; Gao, H.; Yan, Q.; Sun, Y.; Ren, F. The 3D-printed honeycomb metamaterials tubes with tunable negative poisson’s ratio for high-performance static and dynamic mechanical properties. Materials 2021, 14, 1353. [Google Scholar] [CrossRef] [PubMed]
- Montazerian, H.; Mohamed, M.G.A.; Montazeri, M.M.; Kheiri, S.; Milani, A.S.; Kim, K.; Hoorfar, M. Permeability and mechanical properties of gradient porous PDMS scaffolds fabricated by 3D-printed sacrificial templates designed with minimal surfaces. Acta Biomater. 2019, 96, 149–160. [Google Scholar] [CrossRef] [PubMed]
- Hasiuk, F.J. Testing bulk properties of powder-based 3D-printed reservoir rock proxies. Transp. Porous Media 2019, 129, 501–520. [Google Scholar] [CrossRef]
- Song, L.; Jiang, Q.; Shi, Y.-E.; Feng, X.-T.; Li, Y.; Su, F.; Liu, C. Feasibility investigation of 3D printing technology for geotechnical physical models: Study of tunnels. Rock Mech. Rock Eng. 2018, 51, 2617–2637. [Google Scholar] [CrossRef]
- Jiang, C.; Zhao, G.-F.; Zhu, J.; Zhao, Y.-X.; Shen, L. Investigation of dynamic crack coalescence using a gypsum-like 3D printing material. Rock Mech. Rock Eng. 2016, 49, 3983–3998. [Google Scholar] [CrossRef]
- Fereshtenejad, S.; Song, J.-J. Fundamental study on applicability of powder-based 3D printer for physical modeling in rock mechanics. Rock Mech. Rock Eng. 2016, 49, 2065–2074. [Google Scholar] [CrossRef]
- Bobby, S.S.; Singamneni, S. Influence of moisture in the gypsum moulds made by 3D printing. Procedia Eng. 2014, 97, 1618–1625. [Google Scholar] [CrossRef]
- Shao, Y.; Yang, J.; Kim, J.; Song, J.-J.; Moon, J.; Han, J. A Comprehensive Experimental Study on Mechanical Anisotropy and Failure Mode of 3D Printed Gypsum Rocks: From Composition and Microstructure to Macroscopic Mechanical Properties Response. Rock Mech. Rock Eng. 2023, 56, 6503–6528. [Google Scholar] [CrossRef]
- Niu, Q.; Jiang, L.; Li, C.; Zhao, Y.; Wang, Q.; Yuan, A. Application and prospects of 3D printing in physical experiments of rock mass mechanics and engineering: Materials, methodologies and models. Int. J. Coal Sci. Technol. 2023, 10, 5. [Google Scholar] [CrossRef]
- Ishutov, S.; Hasiuk, F.J.; Harding, C.; Gray, J.N. 3D printing sandstone porosity models. Interpretation 2015, 3, SX49–SX61. [Google Scholar] [CrossRef]
- Ozelim, L.C.d.S.M.; Cavalcante, A.L.B. Combining microtomography, 3D printing, and numerical simulations to study scale effects on the permeability of porous media. Int. J. Geomech. 2019, 19, 04018194. [Google Scholar] [CrossRef]
- Head, D.; Vanorio, T. Effects of changes in rock microstructures on permeability: 3-D printing investigation. Geophys. Res. Lett. 2016, 43, 7494–7502. [Google Scholar] [CrossRef]
- Ju, Y.; Gong, W.; Zheng, J. Effects of pore topology on immiscible fluid displacement: Pore-scale lattice Boltzmann modelling and experiments using transparent 3D printed models. Int. J. Multiphase Flow 2022, 152, 104085. [Google Scholar] [CrossRef]
- Kong, L.; Ostadhassan, M.; Liu Bo, L.B.; Eshraghi, M.; Li Chunxiao, L.C.; Navarro, M.; Zhang Yihuai, Z.Y.; Wei Huabin, W.H. A comparison of three-dimensional-printed porous rocks with nano X-ray computed tomography silica sand, gypsum powder, and resin. AAPG Bull. 2021, 105, 2245–2261. [Google Scholar] [CrossRef]
- Tan, W.; Wang, P. Experimental study on seepage properties of jointed rocklike samples based on 3D printing techniques. Adv. Civ. Eng. 2020, 2020, 10. [Google Scholar] [CrossRef]
- Ishutov, S. Establishing Framework for 3D Printing Porous Rock Models in Curable Resins. Transp. Porous Media 2019, 129, 431–448. [Google Scholar] [CrossRef]
- Almetwally, A.G.; Jabbari, H. 3D-Printing Replication of Porous Media for Lab-Scale Characterization Research. ACS Omega 2021, 6, 2655–2664. [Google Scholar] [CrossRef]
- Fahim Salek, M.; Shinde, V.V.; Beckingham, B.S.; Beckingham, L.E. Resin based 3D printing for fabricating reactive porous media. Mater. Lett. 2022, 322, 132469. [Google Scholar] [CrossRef]
- Song, R.; Wang, Y.; Sun, S.; Liu, J. Characterization and microfabrication of natural porous rocks: From micro-CT imaging and digital rock modelling to micro-3D-printed rock analogs. J. Pet. Sci. Eng. 2021, 205, 108827. [Google Scholar] [CrossRef]
- Goral, J.; Deo, M. Nanofabrication of synthetic nanoporous geomaterials: From nanoscale-resolution 3D imaging to nano-3D-printed digital (shale) rock. Sci. Rep. 2020, 10, 21596. [Google Scholar] [CrossRef] [PubMed]
- Zhang, K.; Zhang, K.; Ye, J.; Liu, X.; Fan, W. An improved sand 3D printing method for better reproduction of high-strength and high-brittleness rock mechanical properties is proposed. J. Mater. Res. Technol. 2023, 26, 5037–5054. [Google Scholar] [CrossRef]
- Ma, S.; Jin, G.; Antle, R.; Wieneke, B. 3D Printed Rocks—An Emerging Technology for Systematic Petrophysical Studies. In Proceedings of the Middle East Oil, Gas and Geosciences Show, Manama, Bahrain, 19–21 February 2023. [Google Scholar]
- Osei-Bonsu, K.; Grassia, P.; Shokri, N. Effects of pore geometry on flowing foam dynamics in 3D-printed porous media. Transp. Porous Media 2018, 124, 903–917. [Google Scholar] [CrossRef]
- Wei, D.; Wang, Z.; Pereira, J.-M.; Gan, Y. Permeability of uniformly graded 3D printed granular media. Geophys. Res. Lett. 2021, 48, 1–12. [Google Scholar] [CrossRef]
- Kondo, A.; Matsumura, S.; Mizutani, T.; Kohama, E. Reproduction of discrete element model by 3D printing and its experimental validation on permeability issue. In Proceedings of the Advances in Laboratory Testing and Modelling of Soils and Shales (ATMSS), Cham, Switzerland, 18–20 January 2017; pp. 517–524. [Google Scholar]
- Kafle, A.; Luis, E.; Raman, S.; Pan, H.M.; Pratisthit Lal, S.; Bastola, A.K. 3D/4D printing of polymers: Fused deposition modelling (FDM), selective laser sintering (SLS), and stereolithography (SLA). Polymers 2021, 13, 3101. [Google Scholar] [CrossRef] [PubMed]
- Kong, L.; Ostadhassan, M.; Li, C.; Tamimi, N. Can 3-D printed gypsum samples replicate natural rocks? an experimental study. Rock Mech. Rock Eng. 2018, 51, 3061–3074. [Google Scholar] [CrossRef]
- Kong, L.; Ostadhassan, M.; Li, C.; Tamimi, N. Pore characterization of 3D-printed gypsum rocks: A comprehensive approach. J. Mater. Sci. 2018, 53, 5063–5078. [Google Scholar] [CrossRef]
- Zou, C.; Wong, L.N.Y.; Cheng, Y. The strength and crack behavior of the rocklike gypsum under high strain rate. In Proceedings of the 46th US Rock Mechanics/Geomechanics Symposium 2012, Chicago, IL, USA, 24–27 June 2012; pp. 1773–1786. [Google Scholar]
- Zou, C.; Wong, L.N.Y. Different compressive and tensile strength of moulded gypsum under various strain rates from quasi-static to dynamic regime. Geotech. Test. J. 2016, 39, 20150174. [Google Scholar] [CrossRef]
- Wong, L.; Jong, M. Water saturation effects on the Brazilian tensile strength of gypsum and assessment of cracking processes using high-speed video. Rock Mech. Rock Eng. 2014, 47, 1103–1115. [Google Scholar] [CrossRef]
- Zou, C.; Wong, L.N.Y.; Loo, J.J.; Gan, B.S. Different mechanical and cracking behaviors of single-flawed brittle gypsum specimens under dynamic and quasi-static loadings. Eng. Geol. 2016, 201, 71–84. [Google Scholar] [CrossRef]
- Zhang, G.; Wang, M.; Li, X.; Yue, S.; Wen, Z.; Han, S. Micro- and macrocracking behaviors in granite and molded gypsum containing a single flaw. Constr. Build. Mater. 2021, 292, 123452. [Google Scholar] [CrossRef]
- Zhou, T.; Zhu, J. An experimental investigation of tensile fracturing behavior of natural and artificial rocks in static and dynamic brazilian disc tests. Procedia Eng. 2017, 191, 992–998. [Google Scholar] [CrossRef]
- Heidari, M.; Khanlari, G.R.; Torabi Kaveh, M.; Kargarian, S. Predicting the uniaxial compressive and tensile strengths of gypsum rock by point load testing. Rock Mech. Rock Eng. 2012, 45, 265–273. [Google Scholar] [CrossRef]
- Brantut, N.; Schubnel, A.; Guéguen, Y. Damage and rupture dynamics at the brittle-ductile transition: The case of gypsum. J. Geophys. Res. Solid Earth 2011, 116, 1–19. [Google Scholar] [CrossRef]
- Wong, L.N.Y.; Einstein, H.H. Crack coalescence in molded gypsum and carrara marble: Part 1. macroscopic observations and interpretation. Rock Mech. Rock Eng. 2009, 42, 475–511. [Google Scholar] [CrossRef]
- Heard, H.C.; Griggs, D.; Handin, J. Chapter 7: Transition from brittle fracture to ductile flow in solenhofen limestone as a function of temperature, confining pressure, and interstitial fluid pressure. In Rock Deformation (A Symposium); Geological Society of America: Boulder, CO, USA, 1960; Volume 79. [Google Scholar]
- Zou, C.; Yingying, S.; Liu, K.; Cheng, Y.; Li, J. Feasibility of artificial materials in simulating rock failure based on rate-dependent brittleness indexes. Rock Mech. Rock Eng. 2022, 55, 4999–5027. [Google Scholar] [CrossRef]
- Liu, L.; Li, H.; Chen, S.; Shao, Z.; Zhou, C.; Fu, S. Effects of bedding planes on mechanical characteristics and crack evolution of rocks containing a single pre-existing flaw. Eng. Geol. 2021, 293, 106325. [Google Scholar] [CrossRef]
- Liu, H.; Jing, H.; Yin, Q.; Meng, Y.; Zhu, G. Effect of bedding plane on mechanical properties, failure mode, and crack evolution characteristic of bedded rocklike specimen. Theor. Appl. Fract. Mech. 2023, 123, 103681. [Google Scholar] [CrossRef]
- Zhu, Y.; Liu, K.; Zhong, X.; Wang, Y.; Chen, C.; Zhang, H.; Pan, D.; Zhai, L.; Gao, S. Experimental investigation on the anisotropic behaviors induced by bedding planes in mechanical properties of Ma′quan oil shale. Arab. J. Sci. Eng. 2022, 47, 11385–11403. [Google Scholar] [CrossRef]
- Zhao, Y.; Semnani, S.J.; Yin, Q.; Borja, R.I. On the strength of transversely isotropic rocks. Int. J. Numer. Anal. Methods Geomech. 2018, 42, 1917–1934. [Google Scholar] [CrossRef]
- Liu, Y.; Tang, H. Rockmass Mechanics; China University of Geosciences Press: Wuhan, China, 1999; p. 214. [Google Scholar]
- Jiang, Q.; Feng, X.; Song, L.; Gong, Y.; Zheng, H.; Cui, J. Modeling rock specimens through 3D printing: Tentative experiments and prospects. Acta Mech. Sin. 2016, 32, 101–111. [Google Scholar] [CrossRef]
- Liu, H.; Zhao, Y.; Jiang, Y.; Wang, Z. Technology. Experimental study of mechanical properties of 3D printing gypsum specimens. Mech. Eng. 2017, 39, 455–459. [Google Scholar]
- Yin, P.; Wong, R.H.C.; Chau, K.T. Coalescence of two parallel pre-existing surface cracks in granite. Int. J. Rock Mech. Min. Sci. 2014, 68, 66–84. [Google Scholar] [CrossRef]
- Yang, L.; Jiang, Y.; Li, S.; Li, B. Experimental and numerical research on 3D crack growth in rocklike material subjected to uniaxial tension. J. Geotech. Geoenviron. Eng. 2013, 139, 1781–1788. [Google Scholar] [CrossRef]
- Lee, H.; Jeon, S. An experimental and numerical study of fracture coalescence in pre-cracked specimens under uniaxial compression. Int. J. Solids Struct. 2011, 48, 979–999. [Google Scholar] [CrossRef]
- Park, C.H.; Bobet, A. Crack initiation, propagation and coalescence from frictional flaws in uniaxial compression. Eng. Fract. Mech. 2010, 77, 2727–2748. [Google Scholar] [CrossRef]
- Sagong, M.; Bobet, A. Coalescence of multiple flaws in a rock-model material in uniaxial compression. Int. J. Rock Mech. Min. Sci. 2002, 39, 229–241. [Google Scholar] [CrossRef]
- Einstein, H.H.; Stephansson, O. Fracture systems, fracture propagation and coalescence. In Proceedings of the Geoeng2000-An International Conference on Geotechnical & Geological Engineering, Melbourne, Australia, 19–24 November 2000; pp. 1–41. [Google Scholar]
- Wong, R.H.C.; Chau, K.T. Crack coalescence in a rocklike material containing two cracks. Int. J. Rock Mech. Min. Sci. 1998, 35, 147–164. [Google Scholar] [CrossRef]
- Wong, L.N.Y.; Einstein, H.H. Coalescence behavior in Carrara marble and molded gypsum containing artificial flaw pairs under uniaxial compression. In Proceedings of the 1st Canada-US Rock Mechanics Symposium—Rock Mechanics Meeting Society’s Challenges and Demands, Vancouver, BC, Canada, 27–31 May 2007; pp. 581–589. [Google Scholar]
- Kovacich, J.R.; Haimson, B.C. Factors affecting borehole breakout dimensions, and the potential for sand production in high porosity berea sandstone. In Proceedings of the 4th North American Rock Mechanics Symposium, Seattle, WA, USA, 31 July–3 August 2000. [Google Scholar]
- Grasmueck, M.; Marchesini, P.; Eberli, G.; Zeller, M.; Van Dam, R. 4D GPR tracking of water infiltration in fractured high-porosity limestone. In Proceedings of the XIII Internarional Conference on Ground Penetrating Radar, Lecce, Italy, 21–25 June 2010. [Google Scholar]
- Yan, S.; Zhang, F.; Wang, S.; He, P.; Jia, D.; Yang, J. Crystallization behavior and mechanical properties of high open porosity dolomite hollow microspheres filled hybrid geopolymer foams. Cem. Concr. Compos. 2019, 104, 103376. [Google Scholar] [CrossRef]
- Al-Harthi, A.A.; Al-Amri, R.M.; Shehata, W.M. The porosity and engineering properties of vesicular basalt in Saudi Arabia. Eng. Geol. 1999, 54, 313–320. [Google Scholar] [CrossRef]
- Badawy, A.M.; Ganat, T.A.A.O. Permeability; Springer International Publishing: Cham, Switzerland, 2021; pp. 35–56. [Google Scholar]
- Zhang, L. Chapter 8—Permeability. In Engineering Properties of Rocks, 2nd ed.; Zhang, L., Ed.; Butterworth-Heinemann: Woburn, MA, USA, 2017; pp. 339–370. [Google Scholar]
- Bear, J. Hydraulic conductivity of isotropic media. In Dynamics of Fluids in Porous Media; Bear, J., Ed.; Dover Publications: New York, NY, USA, 1972; pp. 119–156. [Google Scholar]
- Huang, Z.; Shao, G.; Li, L. Micro/nano functional devices fabricated by additive manufacturing. Prog. Mater. Sci. 2023, 131, 101020. [Google Scholar] [CrossRef]
- Xu, W.; Jambhulkar, S.; Ravichandran, D.; Zhu, Y.; Kakarla, M.; Nian, Q.; Azeredo, B.; Chen, X.; Jin, K.; Vernon, B.; et al. 3D printing-enabled nanoparticle alignment: A review of mechanisms and applications. Small 2021, 17, 2100817. [Google Scholar] [CrossRef] [PubMed]
- Worden, R.; Armitage, P.; Butcher, A.; Churchill, J.; Csoma, A.; Hollis, C.; Lander, R.; Omma, J. Petroleum reservoir quality prediction: Overview and contrasting approaches from sandstone and carbonate communities. Geol. Soc. Lond. Spec. Publ. 2018, 435, 1–31. [Google Scholar] [CrossRef]
- Feng, X.; Peng, X.; Li, L.; Yang, X.; Wang, J.; Li, Q.; Zhang, C.; Deng, H. Influence of reservoir heterogeneity on water invasion differentiation in carbonate gas reservoirs. Nat. Gas Ind. B 2019, 6, 7–15. [Google Scholar] [CrossRef]
- Callow, B.; Falcon-Suarez, I.; Ahmed, S.; Matter, J. Assessing the carbon sequestration potential of basalt using X-ray micro-CT and rock mechanics. Int. J. Greenhouse Gas Control 2018, 70, 146–156. [Google Scholar] [CrossRef]
- Rutqvist, J. The geomechanics of CO2 storage in deep sedimentary formations. Geotech. Geol. Eng. 2012, 30, 525–551. [Google Scholar] [CrossRef]
- Niemi, A.; Bear, J.; Bensabat, J. Geological Storage of CO2 in Deep Saline Formations; Springer: Dordrecht, The Netherlands, 2017; Volume 29. [Google Scholar]
- Saini, D. Engineering Aspects of Geologic CO2 Storage: Synergy between Enhanced Oil Recovery and Storage; Springer International Publishing AG: Cham, Switzerland, 2017. [Google Scholar]
- Ringrose, P.; Bentley, M. Reservoir Model Design: A Practitioner’s Guide; Springer International Publishing AG: Cham, Switzerland, 2021. [Google Scholar]
Figure 1.
The manufacturing process of (a) plaster-based 3D printing (PP), (b) stereolithography (SLA) samples, and (c) moulded gypsum samples.
Figure 1.
The manufacturing process of (a) plaster-based 3D printing (PP), (b) stereolithography (SLA) samples, and (c) moulded gypsum samples.

Figure 2.
Experimental seepage test and the schematic drawing in the present study.

Figure 3.
(a) Stress–strain curves and (b) peak stresses of the 3DP PP samples with different printing inclination angles (solid point—average value of each group), and (c) their failure modes.
Figure 3.
(a) Stress–strain curves and (b) peak stresses of the 3DP PP samples with different printing inclination angles (solid point—average value of each group), and (c) their failure modes.

Figure 4.
(a) Stress–strain curves and (b) peak stresses of the 3DP PP samples with different sintering temperatures (solid point—average value of each group), and (c) their failure modes.
Figure 4.
(a) Stress–strain curves and (b) peak stresses of the 3DP PP samples with different sintering temperatures (solid point—average value of each group), and (c) their failure modes.

Figure 5.
Geometry parameters defined in the present double-flaw system. (a) the geometry of flaws for sample 45°–45°; (b) the geometry of flaws for sample 45°–75°; (c) the geometry of flaws for sample 45°–105°; (d) the photo of moulded gypsum sample 45°–105°; (e) the photo of 3DP gypsum sample 45°–105°.

Figure 6.
Comparison of the stress–strain curves and the corresponding cracking processes between the double-flawed moulded gypsum (left) and PP (right) specimens: (a) 45°–45°, (b) 45°–75°, and (c) 45°–105°.
Figure 6.
Comparison of the stress–strain curves and the corresponding cracking processes between the double-flawed moulded gypsum (left) and PP (right) specimens: (a) 45°–45°, (b) 45°–75°, and (c) 45°–105°.


Figure 7.
Three orthogonalized surfaces of the porous basalt in the seepage test.

Figure 8.
Sketch of the actual flow path and the tortuosity (Black dots represent skeletons with different sizes).
Figure 8.
Sketch of the actual flow path and the tortuosity (Black dots represent skeletons with different sizes).

Figure 9.
(a) Flow channels and (b) the corresponding pores of two types of particle arrangements in 3D printing techniques.
Figure 9.
(a) Flow channels and (b) the corresponding pores of two types of particle arrangements in 3D printing techniques.


Figure 10.
Porosity of the medium with the two types of particle arrangements.

Figure 11.
Porous rocks with high potential for gas or liquid storage: (a) basalt rock core (D = 44.5 mm) [80], (b) carbonate [79], and (c) sandstone [84].


Table 1.
Density, UCS, and failure strain of the cylindrical 3DP specimens with different printing inclination angles.
Table 1.
Density, UCS, and failure strain of the cylindrical 3DP specimens with different printing inclination angles.
| Inclination Angle | Density (g/cm3) | UCS (MPa) | Failure Strain |
|---|---|---|---|
| 0° | 1.24 | 7.7 | 2.0% |
| 30° | 1.23 | 4.2 | 1.6% |
| 45° | 1.22 | 3.9 | 2.3% |
| 60° | 1.23 | 6.0 | 3.4% |
| 90° | 1.25 | 8.6 | 2.8% |
Table 2.
Dry density, UCS, and failure strain of the cylindrical 3DP specimens with different sintering temperatures.
Table 2.
Dry density, UCS, and failure strain of the cylindrical 3DP specimens with different sintering temperatures.
| Sintering Temperature (°C) | Dry Density (g/cm3) | UCS (MPa) | Failure Strain |
|---|---|---|---|
| 20 | 1.29 | 2.7 | 4.3% |
| 60 | 1.26 | 5.2 | 3.0% |
| 100 | 1.25 | 8.6 | 2.8% |
| 140 | 1.22 | 4.4 | 3.3% |
Table 3.
Average mechanical properties of the moulded gypsum and the 3DP specimens with double pre-existing flaws.
Table 3.
Average mechanical properties of the moulded gypsum and the 3DP specimens with double pre-existing flaws.
| Flaw Geometry | Moulded Gypsum | 3DP Gypsum | ||
|---|---|---|---|---|
| UCS (MPa) | Failure Strain | UCS (MPa) | Failure Strain | |
| 45°–45° | 28.1 | 0.68% | 5.6 | 1.24% |
| 45°–75° | 25.9 | 0.71% | 4.9 | 1.17% |
| 45°–105° | 27.1 | 0.75% | 6.1 | 1.43% |
Table 4.
Porosities and permeability coefficients K of the natural basalt and its 3DP replications.
| Specimen No. | Porosity (%) | Average Porosity (%) | Seepage Face | K (10−4 cm/s) | Average K (10−4 cm/s) |
|---|---|---|---|---|---|
| Origin | 25.41 | 25.41 | A | 3.13 | 3.13 |
| 1 | 22.97 | 24.90 | A | 2.74 | 2.77 |
| 2 | 27.78 | 2.91 | |||
| 3 | 23.96 | 2.66 | |||
| 4 | 23.85 | 23.10 | B | 5.34 | 5.11 |
| 5 | 22.30 | 5.13 | |||
| 6 | 23.14 | 4.87 | |||
| 7 | 23.86 | 23.24 | C | 9.85 | 10.28 |
| 8 | 22.73 | 10.75 | |||
| 9 | 23.12 | 10.23 |
Table 5.
Permeability of medium with different particle sizes in 3D printing techniques and the corresponding rock type with a similar permeability in nature [74,75,76,77].
| Particle Size/nm | Printing Technique | Permeability/mD | Corresponding Rock |
|---|---|---|---|
| 10 | TPP | 0.000733 | Fresh granite |
| 100 | EHD jet printing and ECAM | 0.073297 | Fresh limestone and dolomite |
| 1000 | μSLA, PμSL, DIW, and Micro-SLS | 7.329714 | Fresh sandstone |
| 10,000 | CLIP, Micro-CAL, AJ deposition, and Micro-SLM | 732.9714 | Oil reservoir rocks |
| 100,000 | FDM | 73,297.14 | Highly fractured rocks |
| 1,000,000 | Most | 7,329,714 | Highly fractured rocks |
Disclaimer/Publisher’s Note: The statements, opinions and data contained in all publications are solely those of the individual author(s) and contributor(s) and not of MDPI and/or the editor(s). MDPI and/or the editor(s) disclaim responsibility for any injury to people or property resulting from any ideas, methods, instructions or products referred to in the content. |
© 2023 by the authors. Licensee MDPI, Basel, Switzerland. This article is an open access article distributed under the terms and conditions of the Creative Commons Attribution (CC BY) license (https://creativecommons.org/licenses/by/4.0/).
Share and Cite
MDPI and ACS Style
Zhao, X.; Liu, Y.; Zou, C.; He, L.; Che, P.; Li, J. Physical Simulation of Brittle Rocks by 3D Printing Techniques Considering Cracking Behaviour and Permeability. Appl. Sci. 2024, 14, 344. https://doi.org/10.3390/app14010344
AMA Style
Zhao X, Liu Y, Zou C, He L, Che P, Li J. Physical Simulation of Brittle Rocks by 3D Printing Techniques Considering Cracking Behaviour and Permeability. Applied Sciences. 2024; 14(1):344. https://doi.org/10.3390/app14010344
Chicago/Turabian StyleZhao, Xiaobao, Yang Liu, Chunjiang Zou, Lei He, Ping Che, and Jianchun Li. 2024. "Physical Simulation of Brittle Rocks by 3D Printing Techniques Considering Cracking Behaviour and Permeability" Applied Sciences 14, no. 1: 344. https://doi.org/10.3390/app14010344
Note that from the first issue of 2016, this journal uses article numbers instead of page numbers. See further details here.