

A Photonic Label-Free Biosensor to Detect Salmonella spp. in Fresh Vegetables and Meat
by
 , , and
Ana Fernández Blanco
1,*,†,
Manuel Hernández Pérez
2,†,
Yolanda Moreno Trigos
3 and
Jorge García-Hernández
2,*,† 1
Lumensia Sensors S.L., 46020 Valencia, Spain
2
Centro Avanzado de Microbiología de Alimentos, Biotechnology Department, Universitat Politècnica de València, 46022 Valencia, Spain
3
Instituto de Ingeniería de Agua y del Medioambiente, Universitat Politècnica de València, 46022 Valencia, Spain
*
Authors to whom correspondence should be addressed.
†
These authors contributed equally to this work.
Appl. Sci. 2023, 13(24), 13103; https://doi.org/10.3390/app132413103
Submission received: 17 October 2023
/
Revised: 21 November 2023
/
Accepted: 5 December 2023
/
Published: 8 December 2023
(This article belongs to the Special Issue Microorganisms in Foods and Food Processing Environments)
Abstract
:This paper presents a method that can be used to detect and identify Salmonella spp. in fresh meat and vegetable samples using a photonic biosensor with specialized bioreceptors. Detection was based on photon transduction. Silicon-nitride-based resonant cavities were used to capture the change in light response when there is specific binding of the immobilized antibody to the sensor surface against the target antigen. A control immobilization experiment was conducted to validate the immobilization process on the biosensor surface prior to biofunctionalization for Salmonella spp. detection. This experiment involved immobilization of pre-selected antibodies on silicon nitride surfaces. Two types of antibodies were suitable. The first was a specific polyclonal antibody with superior antigen-binding capacity across a wide range of concentrations. The second was a monoclonal antibody designed for effective binding at lower concentrations. Rigorous validation was performed. The outcomes were compared with those of the habitual method used to detect Salmonella spp. (reference method). Replicates from different batches of contaminated meat and vegetable samples were analyzed. This comprehensive approach provides a methodologically robust, highly sensitive, and accurate way of rapidly detecting Salmonella spp. in food samples. It has potential implications for improved food safety and quality control.
1. Introduction
Salmonella spp. can transmit infectious diseases from contaminated food and can hence seriously threaten public health [1]. Salmonella is a genus of Gram-negative bacteria in the Enterobacteriaceae family [2,3]. Within the Salmonella genus, there are two main species: Salmonella enterica and Salmonella bongori. This genus comprises over 2500 serotypes, each with the potential to transmit diseases in humans [4]. Salmonella Typhimurium is the second most common serotype transmitted to humans, considering all foodborne pathogens [5]. A method of rapidly, selectively, and accurately detecting Salmonella in consumer food products is still needed.
The shallow infection limits of one colony-forming unit (CFU) of Salmonella spp. in food products are regulated and reviewed under food safety laws due to the potential danger of transmission and high prevalence of Salmonella spp. [3]. Commission Regulation (EC) No. 2073/2005 (amended by No. 1441/2007) requires the absence of Salmonella in small quantities of food products (10 g or 25 g). Regulation No. 2073/2005 on microbiological criteria for food products states that the presence of Salmonella spp. (25 g portion) constitutes a risk factor for human health. The presence of these bacteria is enough for food products to be considered unsafe.
Hence, a sensitive, specific, and reliable method to detect Salmonella in food products is necessary. Cultures, quantitative polymerase chain reaction (qPCR) methods, and the enzyme-linked immunosorbent assay (ELISA) are globally accepted methods for detecting Salmonella [6,7,8]. However, most must be performed by highly trained personnel using sophisticated instruments. Moreover, these methods provide false positives or negatives and are time-consuming and laborious [2]. Additionally, the sensitivity of traditional culture methods recommended by the International Organization for Standardization (ISO) under ISO standard 6579:2002 is too low to detect these bacteria [6].
Methods have been designed to identify harmful microorganisms in food such as Salmonella more quickly. However, these methods cannot be validated sufficiently enough to enter the food market. Not only are they designed for specific foods and are expensive, but they also give false negatives [9]. Biosensors are now among the most recommended alternatives for rapidly detecting Salmonella in food. This technology is faster, cheaper, and more portable for use in situ than existing methods. In addition, biosensors outperform multiple laboratory assays thanks to their high sensitivity, specificity, and precision [10].
In recent years, the number of biosensors being used to detect Salmonella has increased. According to the International Union of Pure and Applied Chemistry (IUPAC), a biosensor is a “self-contained integrated system that is capable of providing specific quantitative or semiquantitative analytical information using a biological recognition element that is in direct spatial contact with a transducer” [11]. Biosensors have four main components: bioreceptor, transducer, sensor, and processor. The bioreceptor allows biological recognition of, for example, an antibody or enzyme. It is responsible for recognizing the specific analyte of interest. It is connected to a transducer. Interaction with the analyte modifies the response. The transducer’s role is to convert this information into a measurable signal. This signal is then relayed to a processor for further analysis [12].
The components that enable specific, sensitive detection of Salmonella spp. in a biosensor are bioreceptors. They can be any biomolecule/set that can recognize the entire bacterium or part of it [13]. The most commonly used bioreceptors to recognize Salmonella include antibodies, aptamers, bacteriophages, antimicrobial peptides (AMP), and nucleic acid probes [14].
To develop a selective biosensor, recognition elements or probes must be deposited onto the immunosensor substrate for analyte identification. The selection of these bioreceptors is critical and requires comprehensive characterization and optimization. This initial phase lays the foundations to create nanophotonic-based biosensors that can discern specific pathogenic microorganisms. It requires thoughtful evaluation of their specificity and binding affinity toward the target analyte. It also depends on the nature of the analyte and the desired sensitivity of the sensor.
The effectiveness of the antibodies immobilized on a biosensor’s surface in their role as probes depends on their specificity in recognizing the target of interest [15]. Therefore, pre-validation of how the selected target antigen interacts with various antibodies is crucial [16,17,18] to account for potential non-specific interactions during the experimental process [19]. For this purpose, microarrays, referred to as detection platforms, can be generated by depositing microdroplets of different antibodies to be used as probes [20,21].
Salmonella detection using optical and electrochemical biosensors is common. They are often integrated into microfluidic devices to develop microfluidic-based biosensors for the detection of Salmonella [22,23,24,25,26,27]. These miniaturized systems are used to enable automation and miniaturization, enhance performance analysis, reduce reagent consumption, lower processing time, and ensure high portability to combine several laboratory functions [28,29,30,31]. Microfluidic-based biosensors are composed of microchannels through which fluidic samples circulate to allow an immunoassay on a chip [32]. These devices enable the simultaneous in situ application of laboratory processes such as sampling, separation, mixing, and detection [33,34].
Biosensors employing optical transduction systems have several advantages. They require considerably smaller sample volumes, thanks to the integration of microfluidic and nanophotonic systems. Hence, analyses can be performed on the nanometric or micrometric scale. Additionally, such biosensors offer label-free detection, allowing for real-time monitoring and streamlining of the procedure by reducing the required number of steps and reagents.
SPR biosensors enable control of the interaction between targets and ligands in terms of changes in the refractive index [35]. Their performance has improved thanks to the ability to control immunoassay reactions (target–ligand) in real time, which is coupled with their simplicity and low cost [36,37]. Salmonella spp. can generally be detected using two types of biosensors: label-free and label-based. Simplified procedures combined with label-free surface-enhanced Raman scattering (SERS) biosensors are in demand for Salmonella detection [38]. However, although label-free SERS methods have substantial intrinsic advantages, they still have limitations in terms of sensitivity and reproducibility. The limit of detection (LoD) is usually unsatisfactory (108 CFU/mL).
Detecting low concentrations of Salmonella remains a challenge, especially in food samples. This issue is closely related to the selection of bioreceptors and transducers, as well as the development of suitable sample pre-treatment methods. Analyzing natural foods using biosensors is more complicated than analyzing artificial samples doped with Salmonella antigens in the same way. The reason is the effect of each matrix on the refractive index. This effect has been confirmed in some research, revealing that food matrices adversely affect detection performance [39].
Photonic biosensors on silicon photonic integrated circuits (PICs) enable label-free performance with high detection sensitivities. They are ultimately disposable, which is helpful for point-of-care diagnostics without specialized personnel [40]. Sensitivity is intrinsically connected to key sensing parameters, including LoD and limit of quantification (LoQ). The outcomes related to the sensitivity of waveguide sensors are influenced by the degree of overlap between the evanescent field and the analyzed sample [41,42].
Photon transduction provides the basis for detection. It uses resonant cavities in the form of ring resonators constructed using silicon nitride technology. A variety of applications have been suggested for the examination of refractive indices from these ring resonators. Within these transducers, the refractive index of light is modified when the analyte of interest forms a binding interaction with the bioreceptor that is anchored to the ring’s surface. Consequently, the concentration of the analyte attached to the ring can be correlated with the observed signal. Biosensors to detect Salmonella still depend on laborious manual operations, so their use in the laboratory is limited. Although existing optical microfluidic biosensors have acceptable levels of sensitivity, their high cost and complicated assembly are weaknesses [43].
2. Materials and Methods
2.1. Bacterial Strains and Culture Conditions
The reference strains Salmonella enterica serotype Typhimurium CECT4266 (Spanish Type Culture Collection, Valencia, Spain) and Salmonella enterica serotype Enteritidis CECT 7236 were employed in all experiments involving the inoculation of meat and vegetable samples. To aid their growth and preservation, the bacterial strains were cultivated in buffered peptone water (Merck, Darmstadt, Germany). Subsequently, the cultured bacteria were transferred to plates and incubated under aerobic conditions at 37 °C for 24 to 48 h. These incubation conditions followed the established recommendations and standards for bacterial culture and growth [6].
2.2. Meat Samples
The response of the biosensor was also assessed using various replicas of fresh chicken meat samples. Each comprised 25 g suspended in 250 mL of buffered peptone water. These meat samples were intentionally inoculated with Salmonella enterica at concentrations ranging from 10 to 1010 CFU/mL.
A series of distinct batches of fresh chicken samples were collected over one year from a meat-industry in the region of Valencia (Spain). These samples had previously undergone evaluation via qPCR and traditional plate counting, confirming the presence of Salmonella enterica. These products were acquired directly from their original packaging and were intended for immediate consumption. They were procured from a local grocery store and stored at a temperature of 4 °C until deployment in the present experiments.
2.3. Fresh Vegetable Samples
The biosensor response was assessed using numerous replicates of fresh red Batavia samples, as well as various batches of fresh salad samples. These samples were sourced from a vegetable-processing facility in the region of Valencia (Spain). They were gathered over one year. Prior to their inclusion in the study, these samples had already undergone comprehensive evaluation through traditional plate counting methods, confirming the presence of Salmonella enterica.
2.4. Reagents and Antibodies
A crucial element for target recognition was a monoclonal antibody specifically designed to target the Lipopolysaccharides (LPS) of Salmonella spp. It was used in conjunction with a polyvalent polyclonal antibody capable of detecting Salmonella spp. with affinity for all O and H antigens. The antibodies used in this study were a polyclonal (rabbit) anti-Salmonella antibody (Invitrogen S.A, Barcelona, Spain) and a Salmonella LPS core monoclonal (mouse) antibody (Fisher Scientific SL, Madrid, Spain).
To assess the primary antibodies, polyclonal and monoclonal antibodies were evaluated against target antigens sourced from Salmonella enterica. Specifically, the LPS from Salmonella enterica L9516-5MG were used. They were obtained from Sigma Aldrich (Darmstadt, Germany).
Two types of secondary array antibodies were employed: GAM (goat anti-mouse) anti-mouse IgG–Alexa 647 and GAR (goat anti-rabbit) anti-rabbit IgG–Alexa 647, both sourced from Abcam (Cambridge, UK). These secondary antibodies were integral to the experimental setup. To complete the array of sensor probes, a rabbit anti-Salmonella polyclonal antibody (Abcam, Cambridge, UK) was introduced. As a negative control, a rabbit anti-fish polyclonal antibody from Eurofins Immunolab (Reinbek, Germany) was used. These sensor probes were crucial in the experimental setup, enabling the detection and differentiation of target elements.
2.5. Antibody Immobilization Control on Silicon Nitride Surfaces
An antibody immobilization control experiment was conducted. It specifically targeted Salmonella spp. on four planar silicon nitride surfaces. Initially, these four pieces of silicon nitride followed an oxidation process by immersing them in a 0.1 M hydrochloric acid (HCl) solution (Scharlab, Barcelona, Spain) comprising 5 mL of solution. This immersion lasted 30 min on an orbital shaker set at 30 rpm (revolutions per minute). Later, the surfaces were washed with water and then dried using a stream of air. These surfaces were subjected to a drying process in an oven incubator at 110 °C for 30 min. Next, they were tempered in a desiccator for 10 min and were finally incubated at 4 °C overnight.
Surfaces 1 and 2 were subjected to activation. They were immersed in 500 µL of a solution with a 2:1 molar ratio of NHS (N-Hydroxysuccinimide and EDC (1-Ethyl-3-(3-dimethylaminopropyl) carbodiimide) in 0.1 M MES (2-(N-morpholino) ethanesulfonic acid) obtained from ThermoFisher (Waltham, MA, USA). This immersion took place at room temperature for 30 min. Surfaces 3 and 4 were not activated and were instead immersed in 500 µL of water for 30 min at the same temperature. Following these treatments, all surfaces were thoroughly washed with 0.1 M MES and water and then air-dried. Each surface received 0.8 µL of solution, which was carefully applied in drops. Four drops of the selected monoclonal or polyclonal antibody (Abcam, Cambridge, UK) were added to the first row of four surfaces (1, 2, 3, and 4) against Salmonella spp. Four additional drops of Lipopolysaccharides (LPS) from Salmonella spp. were applied to the second row. Moreover, four more drops of 1× PBS were deposited in the third row as a negative control. Additionally, 0.8 µL of polyclonal antibody was added to the fourth row of surface 1 (S1), whereas 0.8 µL of monoclonal antibody was introduced to the fourth row of surface 3 (S3). At the same time, surfaces 2 and 4 contained the same content in their respective fourth rows. All antibody solutions used were prepared to reach a final concentration of 200 µg/mL in 1× PBS. Later, each surface was kept for 2 h in controlled humidity conditions and was subsequently washed with 1× PBS.
Finally, all surfaces were blocked by immersing them in a solution of 1% bovine serum albumin (BSA) in 1× PBS. They were left to incubate overnight at a temperature of 4 °C inside a refrigerator. This comprehensive procedure ensured the systematic immobilization of antibodies on the silicon nitride surfaces, facilitating subsequent experiments and evaluations.
A standardized solution of LPS (rough strains) from Salmonella enterica serotype Typhimurium SL1181 (L9516), sourced from Sigma Aldrich, was used as a positive control in the experiments. This control was introduced in the second row of all surfaces except surfaces 1 and 2 and surfaces 3 and 4. With surfaces 1 and 2, a prior functionalization step was conducted using the monoclonal anti-Salmonella spp. primary antibody. With surfaces 3 and 4, the polyclonal anti-Salmonella spp. primary antibody was applied. The primary aim was to compare the immobilization efficiency of these antibodies on the surface material and observe their binding efficiency with the target antigen. After adding the drops containing the positive LPS control for Salmonella spp., the surfaces were incubated at room temperature for 30 min. This step was designed to evaluate the antibodies’ performance in terms of surface immobilization and antigen binding efficiency.
After a 30-min incubation period, all surfaces were thoroughly washed using 1× PBS and then water. Subsequently, a conjugated secondary antibody was applied uniformly across all rows and was incubated at room temperature for 30 min. Following this incubation, the surfaces were again meticulously washed with 1× PBS and water. They were not dried. A total volume of 50 µL of the goat anti-mouse (GAM) secondary antibody solution was evenly distributed onto surfaces 1 and 2. This solution was conjugated with the fluorophore Alexa 647 sourced from Abcam. This step was designed to assess the immobilization of the monoclonal antibody. The incubation period was 1 h, during which the experiment environment was maintained in complete darkness. After the incubation, the surfaces were once again thoroughly washed with 1× PBS and water.
For surfaces 3 and 4, a 50 µL solution containing GAR (goat anti-rabbit) secondary antibody was added to monitor how many polyclonal antibodies had fixed to said surfaces. This solution was also conjugated with the fluorophore Alexa 647 sourced from Abcam. The subsequent incubation and washing steps for surfaces 3 and 4 followed the same protocol as described for surfaces 1 and 2. This systematic approach is based on the microarray technique which allows for monitoring of the antigen–antibody binding produced on the immunosensor surface through a direct assay. This fact is illustrated in Figure 1.
2.6. Immunosensor Detection System
The biosensor (PIC) developed during this study had three main components: a detection ring resonator, a light coupling block using grating couplers, and an optical power distribution block. The lightly coupled section served the crucial function of enabling the input and output of optical signals to and from the PIC. The power distribution block was essential to supply the standard laser source input to all ring resonators within the PIC [44].
One notable advantage of this biosensor over existing detection systems is the multiplex ring system. The sensor’s structure enables simultaneous measurement of several targets within a single analysis because each ring resonator can be equipped with a different probe. This feature makes the system fundamentally different from common applications such as ELISA and qPCR where each of the probes used typically needs separate analysis.
Although resonant structures such as these are essential elements to develop this technique, they require appropriate interfaces that allow fiber optics to perform applications in real samples and tests on wafers. A key advantage of this sensor pertains to its scheme, which allows light to be coupled. The coupling process is conducted in free space, eliminating the need to attach the collimator directly to the input gratings (Figure 2). This feature removes the need for a direct fiber connection to the PIC for optical laser connection. As outlined by Fernández Blanco et al. [44], the grating coupler interface meets these requirements.
The sensor comprised eight ring resonators. They were distributed across one pair of channels (or sensing areas), each with four ring resonators (Figure 3). This distribution allows for the inclusion of two detection areas where the antibodies are housed, which allows binding to the Salmonella antigen. This feature aided binding to the Salmonella spp. bacterium. Two additional rings served as negative controls. An alternative probe (anti-fish antibody) was designed to bind to an antigen other than the target bacterium that was not typically found in the food matrices under investigation. Lastly, a reference resonant ring, since no probe is functionalized on it, served as a blank for comparison. This ring resonator offered a baseline for comparison.
2.7. Functionalization Process
The optical PICs designed for this study were fabricated in a controlled cleanroom environment, specifically, a class 10–100 cleanroom. These PICs were created by a simple process based on an electron beam fixed on top of a positive resist layer composed of polymethyl methacrylate (PMMA) with a thickness of 100 nm [44].
Different batches and wafers were used to extract a total of 100 photonic biosensors (PIC), which were subsequently functionalized to detect Salmonella spp., following the procedure described by Fernández Blanco et al. [44]. The functionalization process commenced by oxidizing the PIC surface by immersing it in 5 mL of a 0.1 M hydrochloric acid solution (Scharlab) for a duration of 30 min. This oxidation step was carried out using an orbital shaker working at 30 rpm. Later, the surface was washed with deionized water (DIW) and then dried. Oxidation was carried out using an orbital shaker that works at 30 rpm. Later, the surface was washed with deionized water (DIW) and then dried.
Following the oxidation process, the PIC’s surfaces were subjected to silanization employing carboxyethylsilanetriol (CTES) for 2 h. Simultaneously, the carboxylic group within the CTES organosilane on the surface was activated by introducing a mixture of carbodiimide and N-hydroxysuccinimide (EDC/NHS), followed by 30 min of incubation at room temperature. The surface was then rinsed and dried under an airflow.
Covalent immobilization of anti-Salmonella antibodies was carried out on the biosensor surface. Specifically, the anti-Salmonella rabbit polyclonal antibody from Invitrogen and the anti-Salmonella mouse monoclonal antibody were immobilized by orienting their residues to bind to the target antigen.
Later, the surfaces were washed with PBS, dried, and blocked by incubating them overnight with a solution containing 1% GFS (cold water fish skin gelatin) in PBS. This blocking step ensured that non-specific binding sites on the surface were effective.
2.8. Microbiological Enumeration
Culture Method
Salmonella spp. quantification in food samples adhered to the guidelines provided by UNE-EN ISO 6579-1:2017/A1:2021 [33]. This standard specifies a horizontal method for the detection, enumeration, and serotyping of Salmonella. A Xylose Lysine Deoxycholate agar (XLD agar) medium was used as a key component in the process. Enumeration was conducted following 48 h of incubation at 37 (±1) °C.
Salmonella spp. quantification in food samples followed the guidelines provided by EN ISO UNE-6579-1:2017/A1:2021. This standard specifies a horizontal method for the detection, enumeration, and serotyping of Salmonella. In accordance with the ISO protocol, 25 g of each meat or vegetable sample was weighed and placed in a sterile bag. Subsequently, 225 mL of buffered peptone water was added to the bag. The contents were shaken for one minute using a Stomacher and then incubated at 37 °C for 18 h. After the incubation period, a 0.1 mL aliquot of the primary enrichment was transferred into 10 mL of Rappaport Vassiliadis medium with soya (RVS), and 1.0 mL was transferred into 9 mL of Muller–Kauffmann tetrathionate-novobiocin (MKTTn) broth. The RVS broth and the MKTTn broth were incubated at 41.56 °C for 24 h and at 37 °C for 24 h, respectively. From each secondary enrichment, a loopful was streaked onto the XLD agar plates.
Following incubation, different concentrations of previously obtained pure culture (ranging from 10 CFU/mL to 108 CFU/mL) of Salmonella enterica Typhimurium and Salmonella enterica Enteritidis were added to fresh chicken and Batavia samples. The food samples were subsequently incubated for varying durations of 3, 6, and 24 h, at a temperature of 37 (±1) °C. After the incubation period, the first inoculum was quantified by performing decimal dilutions of buffered peptone water. Each experimental procedure was conducted in duplicate to enhance the reliability and consistency of the findings. The samples at each enrichment stage were plated on a selective agar medium (XLD agar). These agar plates were placed in an incubator at 37 °C for a specific duration ranging from 3 to 24 h. After the incubation period, the plates were carefully examined for the presence of characteristic Salmonella colonies. This examination enabled enumeration and identification of Salmonella spp. based on the distinct colony characteristics.
Similar enumeration and identification of Salmonella spp. on culture plates were performed for fresh salad and fresh chicken naturally contaminated with the pathogen. These samples were diluted 1:10 to achieve concentrations similar to those in the spiked samples of fresh chicken and red Batavia (ranging from 10 to 1010 CFU/mL).
2.9. Biodetection Method for Salmonella spp.
Multiple experimental tests were conducted to determine the optimal detection limit and the highest sensitivity of the alternative developing technique. This performance and reliability of this detection technique were evaluated by flowing different samples of Salmonella spp. over previously functionalized photonic biosensors (PICS). This crucial step enabled comprehensive assessment of the technique’s effectiveness in detecting and responding to various Salmonella strains. Some of these strains (i.e., those used to spike samples) were acquired from The Spanish Type Culture Collection (CECT). Others were wild strains that came from naturally contaminated meat and vegetable samples. This feature contributes to the validation and reliability of the technique.
To compare immunosensor responses, two Salmonella strains (Salmonella enterica Typhimurium CECT4266 and Salmonella enterica Enteritidis CECT7236) from The Spanish Type Culture Collection (CECT) were used to spike red Batavia and fresh chicken. Different samples of fresh salad and fresh chicken from the same batch were naturally contaminated by Salmonella spp. within a concentration range of 10 to 1010 CFU/mL, as detailed earlier.
The samples were then systematically flowed and subjected to bacterial sensing using a Lumensia Sensors setup detector optimized for PICs (Figure 4). After the photonic chips were successfully functionalized, the next step was to attach a microfluidic adhesive layer to enable the controlled flow of samples. The immunosensors were securely housed within the previously functionalized PICS, as detailed earlier.
A peristaltic pump operating at a rate of 15 µL/min controlled the flow rate of the sample dilutions. This precise flow method meant that the prepared samples reached the immunosensors, where the crucial reaction between the Salmonella spp. antigen and the functionalized antibodies specific to that antigen took place. This setup enabled comprehensive evaluation of immunosensor performance in detecting and responding to Salmonella spp. Its efficacy and reliability in real-world food samples was thus verified.
The current trend in biosensors is to streamline the identification process in order to enhance accessibility and robustness. The system for capturing the transduction signal emitted by the sensor during the analysis consisted of three essential components (Figure 4): a PIC (designed by Lumensia Sensors), a two-channel microfluidic system integrated with the PIC, and a peristaltic pump. Both microfluidic channels were connected to the microfluidic system, which was attached to the PIC. This setup enabled the samples to flow over the sensor for analysis [44]. The coupled microfluidic system substantially enhanced detection capabilities by enabling the simultaneous measurement of two samples. Two samples could be measured simultaneously thanks to the arrangement of eight ring resonators across two channels, each consisting of four ring resonators (Figure 3). Consequently, this configuration enabled detection of sensitivity on the ng/mL scale, with response times of under 30 min [44].
The setup for reading resonance data from signal transduction is an integral part of a biosensor system. The reading system used in this study was developed by Lumensia Sensors and had hardware and software components. Its primary function was to interpret the optical signals generated by the biosensor and translate them into measurements of resonance, typically expressed in picometers (pm). This system was crucial for monitoring and quantifying the interaction between the biosensor and the Salmonella spp. analyte [44]. The measurement sensogram enabled real-time monitoring and quantification of Salmonella spp. using the biosensor. It visually represented the biosensor’s response to the analyte and enabled estimation of the analyte’s concentration in the sample of interest (Figure 4).
The Salmonella spp. sensing experiment employed a flowing protocol to detect and quantify Salmonella spp. through real-time monitoring of changes in resonance signals on the biosensor (Figure 5). Initially, a solution of buffered peptone water flowed through the system for 3 min. This step was essential to establish a baseline reference signal. Next, the bacterial sample, which had been diluted in the same buffered peptone water solution, flowed through the system for 15 min, Figure 5a. During this phase, the biosensor interacted with the bacterial sample to detect the presence of Salmonella spp. Subsequently, a cleaning buffer, composed of buffered peptone water similar to the solution used in the initial reference step, flowed through the system for 5 min. This last step prepared the system for subsequent analyses and ensured that any residual substances were removed.
The y-axis of the sensogram (Figure 5b) represents the resonance values in picometers (pm), and the x-axis shows the time in seconds. This graphical representation illustrates how the resonance changed over time. The software detected positive differences in resonance between the functionalized rings with the specific Salmonella spp. antibody (primary bioreceptor) and the reference rings (negative controls and blanks). Such a positive difference indicated the presence of the target analyte (Salmonella spp.). The measurement sensogram enabled indirect quantitative estimation of the concentration of the target analyte, expressed in terms of colony-forming units per milliliter (CFU/mL). The greater the response (increase in resonance values) on the measurement sensogram, the higher the concentration of Salmonella spp. in the sample.
This protocol enabled comprehensive assessment of the results from the setup reader. The units measured by the reader in picometers (pm) were compared with the concentration according to the traditional ISO culture method (in CFU/mL). This comparison gave a reliable evaluation of immunosensor performance in terms of sensitivity and detection accuracy.
2.10. Data Analysis
The results of the plate counts are shown as the mean ± standard error. Data are expressed in CFU after conversion to log10 for improved analysis. Multiple samples were analyzed to test for the presence of viable bacteria in each experimental replicate. The entire experimental procedure, along with immunosensor identification, was replicated at various time intervals, with incubation times of approximately 3 h and 24 h. The validation process was based on an independently prepared Salmonella spp. inocula. The validation process included several replicates of food samples that were naturally contaminated from the same batch of fresh salad and fresh chicken. These replicates allowed for multiple independent tests with identical samples to ensure the reproducibility and accuracy of the detection method.
Analysis of variance (ANOVA) was used to assess the impact of each variable. Variations in the frequency of positive samples were evaluated by a chi-square test with a confidence level of 95%. Data analysis was performed using Systat version 9 software (SPSS Inc., Chicago, IL, USA). Statistically significant differences in the ANOVA were considered to confirm when the p-value was less than or equal to 0.05.
A double-blind assay was sufficient to determine the sensitivity and specificity of the method assay in which negative fresh chicken and Batavia samples were deliberately contaminated with Salmonella enterica serotype Typhimurium CECT4266 and Salmonella enterica serotype Enteritidis CECT 7236. The results were statistically analyzed to determine their significance [19]. The reproducibility of the method was assessed by multiple identifications using a PIC or immunosensor surface for each entire range of concentrations of the study strains under identical conditions, using similar chemicals and instrumentation elements.
One-way ANOVA was carried out for the antibody array (immobilization control test) to evaluate the presence of statistically significant differences in fluorescence rates between activated and non-activated surfaces.
3. Results and Discussion
Food pathogen detection methods have recently shifted from traditional culture-based approaches [45] to faster and more efficient techniques, thereby reducing the time required for pathogen detection. Various rapid detection methods have emerged. They can be categorized into three main groups: immunological reactions, nucleic acid assays, and biosensors [46,47]. Among the most rapid tests commonly used to detect pathogens are the lateral flow immunoassay, the enzyme-linked immunosorbent assay (ELISA), and the polymerase chain reaction (PCR) [48,49].
3.1. Study of Bioreceptor Inmobilization
The antibodies employed as bioreceptors for detection can be tagged with fluorescent compounds [50,51]. These probes are then deposited onto the biosensor surface at different concentrations. The suitability of different antibodies as bioreceptors can be evaluated using the resulting fluorescence data. Laser scanners are crucial in the analysis and quantification of the fluorescence signal generated by molecular excitation. These scanners provide an accurate and controlled way of measuring the fluorescence emitted from samples. This approach enables comparison of diverse immobilization methods and helps select the most effective antibody to be immobilized on biosensor surfaces.
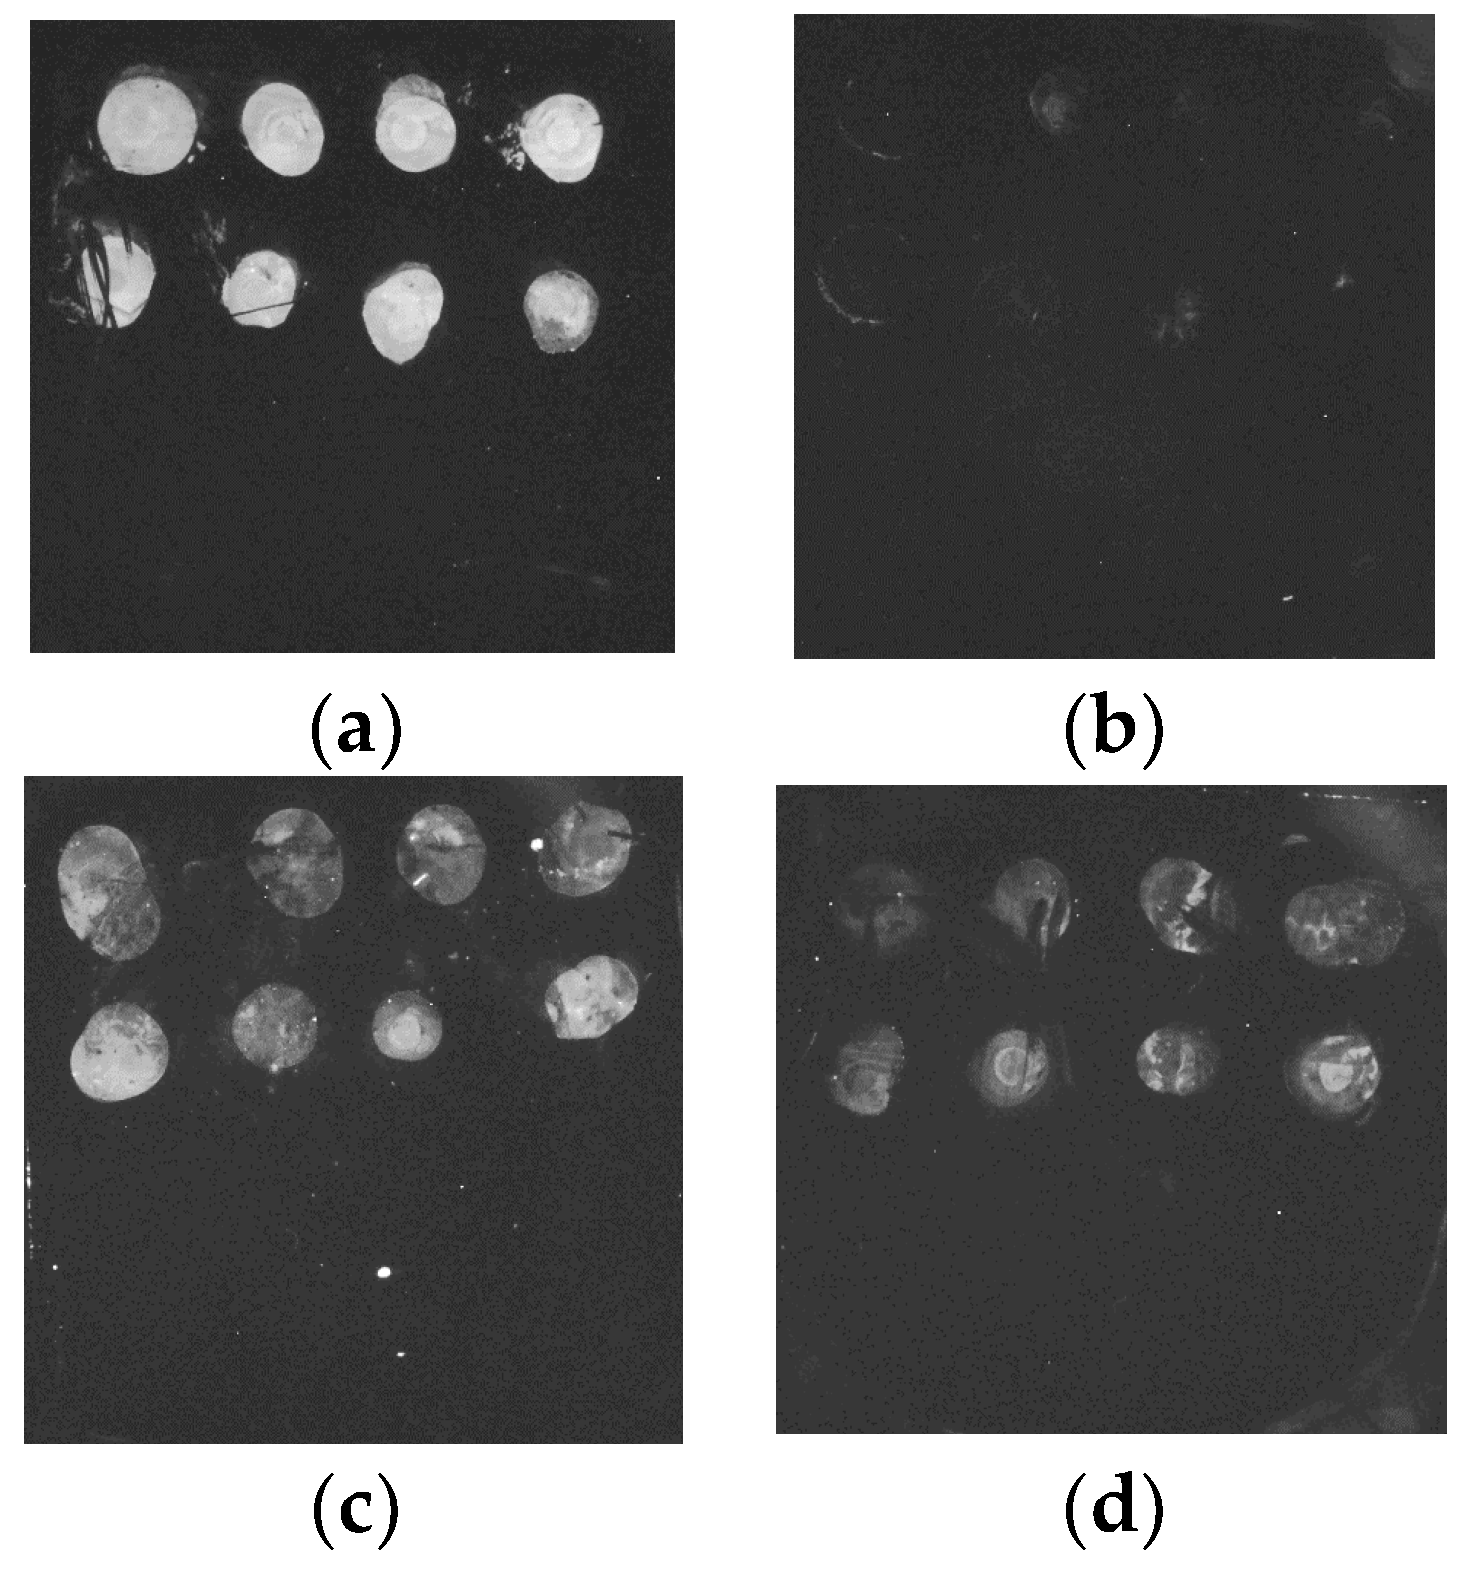
Following immobilization of the selected antibodies for Salmonella spp. on silicon nitride surfaces, the results were consistent with expectations. In Figure 6a, the drops in Line 1 corresponded to the results of the immobilization of the monoclonal antibody. This antibody subsequently reacted by binding to the secondary anti-mouse antibody. In this second row (Line 2) a serial dilution of the positive control LPS of Salmonella spp. confirmed a successful interaction with the monoclonal antibody. This outcome was consistent with the experimental design because the secondary antibody was the monoclonal GAM (goat anti-mouse Alexa Fluor 647). Consequently, this secondary antibody specifically reacts to the monoclonal antibodies and did not bind with the polyclonal antibody on the same surface.
On surface 3 (Figure 6c), the four drops in the first row signified the immobilization of the polyclonal antibody, with subsequent addition of the secondary GAR (goat anti-rabbit Alexa Fluor 647) antibody. In the second row (Line 2), the four drops also corresponded to the binding with a dilution of the positive control LPS of Salmonella spp. This reaction indicated successful interaction with the immobilized polyclonal primary antibody, and surfaces 2 (Figure 6b) and 4 (Figure 6d) remained non-activated. They exhibited lower fluorescence intensity than the activated surfaces (Figure 4a,c). This discrepancy highlighted the importance of surface activation in facilitating antibody immobilization and subsequent binding.
The signal for both covalently immobilized antibodies (pAb and mAb) through EDC/NHS activation on surfaces 1 and 3 was significantly higher than the signal for the non-specific control surfaces 3 and 4 (no EDC/NHS treatment), as shown in Figure 7. The higher fluorescence intensity measurements for both antibodies on activated surfaces 1 and 3 can be attributed to the formation of covalent bonds between the antibodies and the chemically treated surface. As a result, this immobilization control experiment provided confirmation that both antibodies were securely covalently attached to the chemically treated surface of the PICs, which acted as immunosensor surface. The monoclonal antibody against Salmonella spp. yielded superior results in terms of fluorescence intensity and covalent attachment. The differences in fluorescence intensity between activated and non-activated surfaces indicated that immobilization was specific and that the antibodies contributed to the observed fluorescence signals.
Statistical analysis was conducted to evaluate differences in fluorescence intensity values between activated and non-activated surfaces, as well as between monoclonal and polyclonal antibodies on activated surfaces. For surfaces with the immobilized monoclonal antibody (surfaces 1 and 2), statistically significant differences were observed, with a p-value of 0.0016 (less than the alpha value of 0.05). The result for the F statistic exceeded the critical value from the tables. This finding suggested significant differences in fluorescence intensity between activated and non-activated surfaces for the monoclonal antibody.
For surfaces 3 and 4, with the immobilized polyclonal antibody, statistically significant differences were observed. The p-value was 0.026, and the F value was slightly greater than the tabulated F value. These findings suggested significant differences in fluorescence intensity between activated and non-activated surfaces for the polyclonal antibody.
No significant differences were observed between the fluorescence values of the monoclonal antibody and polyclonal antibody from the activated surfaces (p-value = 0.38). This finding suggested that both antibodies had similar fluorescence intensities when immobilized on activated surfaces.
3.2. Sensor Selectivity and Efficiency
The detection efficiency of the immunosensor method for Salmonella spp. was assessed at concentrations ranging from 10 to 1010 CFU/mL. To determine the most effective enrichment method for Salmonella spp. detection, a variety of Salmonella enterica Enteritidis and Salmonella enterica Typhimurium strains were used, with samples of red Batavia and fresh chicken spiked with these strains. Naturally contaminated samples (fresh salad and fresh chicken) were also used for evaluation. Validation involved analyzing the presence or absence of the pathogen and comparing the detection units of the immunosensor with the results of plate culture methods. Results are summarized in Table 1 and Table 2. The evaluation was performed using the equal detection method on identical samples employing various measurement equipment by different operators.
The analysis of the LoD in chicken samples after using this biosensor were promising. After 3 h of enrichment, the biosensor method achieved a 100% detection rate for samples containing as few as 10 CFU/mL of Salmonella spp. (p = 0.0026). The biosensor method had a relative accuracy of 100%, indicating that the results from the biosensor fully agreed with those from the reference method when testing identical samples. The sensitivity results were similar. Hence, the biosensor method detected samples contaminated with Salmonella spp., whereas samples without Salmonella spp. were not detected. This finding confirmed the specificity of the biosensor method in distinguishing between true negatives and true positives for the presence of the Salmonella spp. The positive predictive value of the biosensor method was 100%, indicating that it was highly reliable in correctly detecting positive samples. The negative predictive value of the biosensor method was also 100%, indicating that it was highly reliable in correctly identifying negative samples. The results imply that Salmonella spp., in both meat and vegetable samples, can be effectively detected using either of the two tested methods. The reason for this conclusion is that the two methods share the same level of specificity, which indicates that they are equally capable of correctly identifying the presence of Salmonella species in the samples.
The results also indicated high reproducibility. Detections based on the specific binding of Salmonella species antigens were observed in 96.8% of the contaminated samples. This high reproducibility implied a 96.8% probability of observing the same detection result when analyzing identical samples at different times under standard reproducibility conditions.
Reproducibility results are presented in Table 1. They provide strong evidence of the reliability and consistency of both detection methods for Salmonella spp. This characteristic is valuable because it indicates that the methods can consistently produce accurate results across multiple analyses under varying conditions.
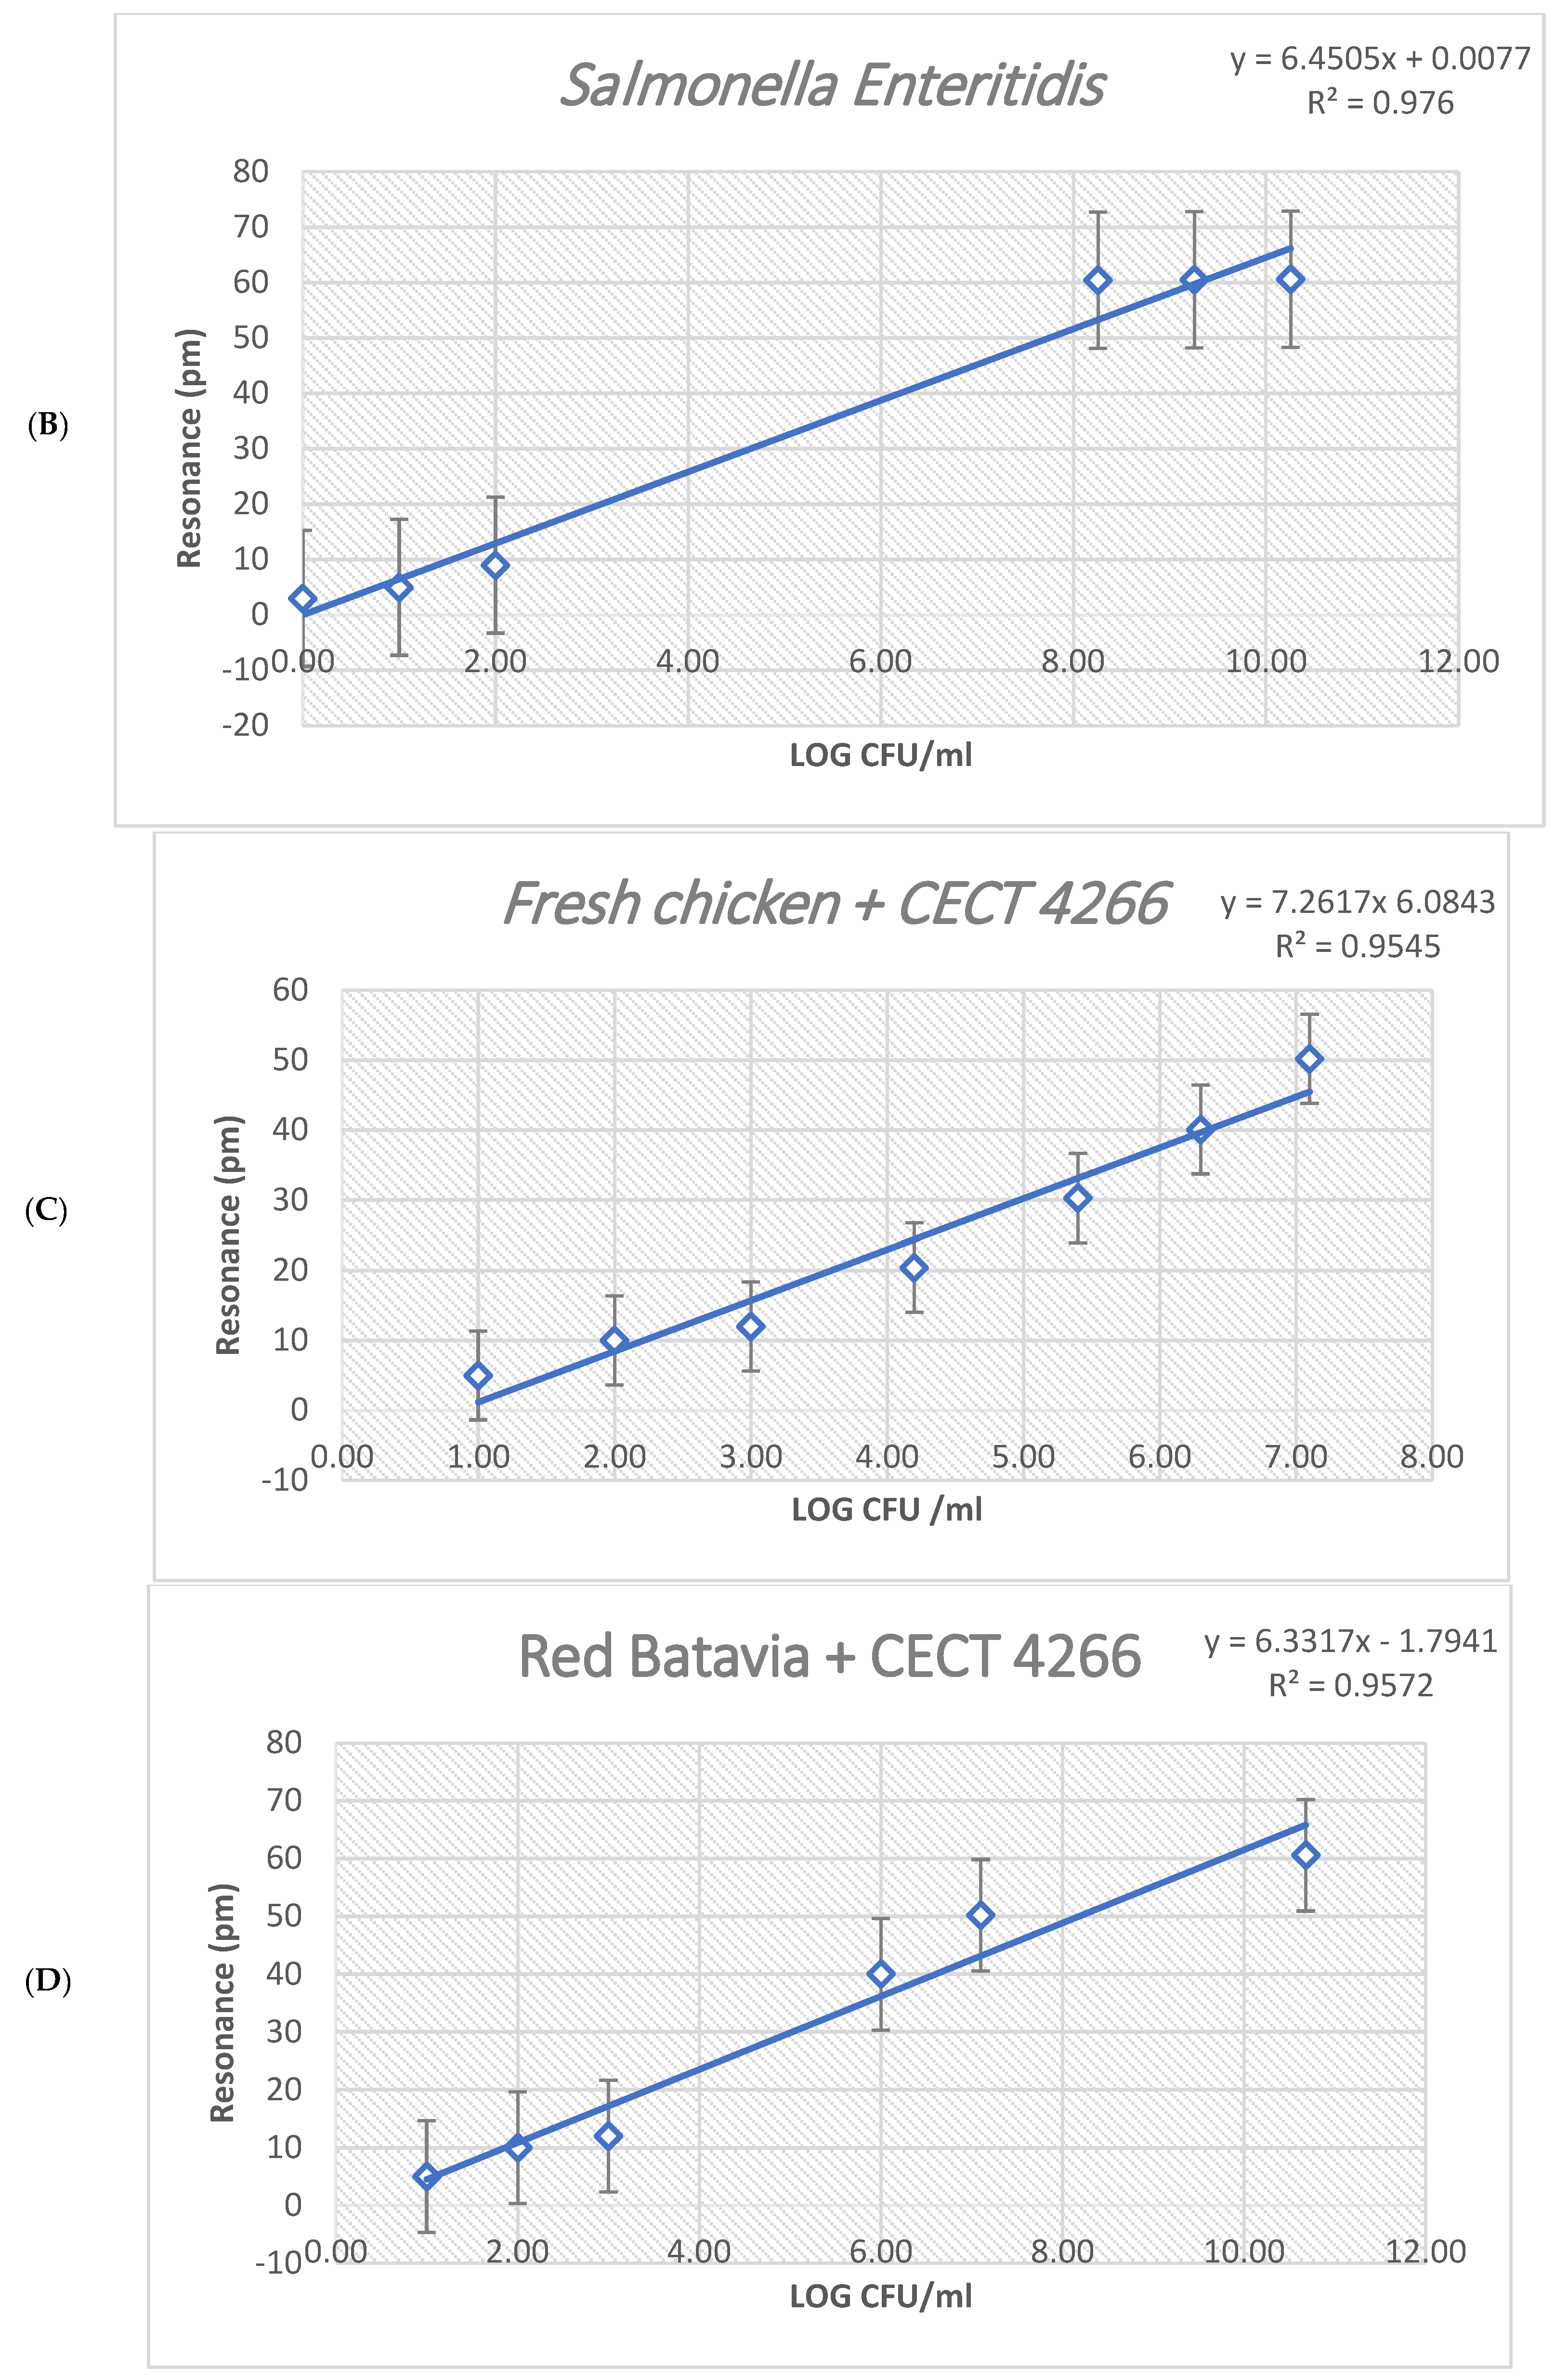
Interestingly, the results were influenced by bacterial concentration. Samples with higher dilution factors produced weaker optical signals, indicating that the optical response was less intense for more diluted samples. This concentration-dependent relationship between the bacterial concentration and the optical signal is reflected in Figure 8. This figure illustrates the photonic measurements, particularly the microring resonance notch shift, quantified in picometers (pm). These measurements were taken during the Salmonella spp. experiment with different dilution factors, ranging from 10 to 1010 CFU/mL in buffered peptone water. The data showed successful detection for samples with dilution factors up to 10 CFU/mL.
This immunosensor method was assessed for its capacity to provide a quantitative response. Such a response is particularly valuable for enumerating Salmonella spp. to determine the food safety of a food product. Calibration curves were generated by plotting the resonance in picometers (pm) against the known concentrations of Salmonella spp. in CFU/mL, as shown in Figure 8. This approach enabled quantitative assessment of bacterial concentration based on the immunosensor’s optical response.
As shown in Figure 8, the linearity of the analysis was qualitatively evaluated and confirmed by calculating the correlation coefficient. This qualitative assessment of the linear relationship was employed to ensure the working interval and verify that the relationship between the X and Y variables was indeed linear. In the context of quantitative analysis, the working interval refers to a range of values for which the test method exhibits adequate precision, trueness, and linearity. Within this interval, the test method yields results with an acceptable level of uncertainty. Examination of the four curves suggested that the relationship between X and Y was linear. The correlation coefficient and the regression model were acceptable in all three cases, given that the correlation coefficient (r) approached 1.—Establishing the working interval for each calibration curve enabled estimation of several key parameters. In Figure 8, the lower limit, or approximate LoQ, was determined to be approximately 100 CFU/mL. This LoQ helped define the linear range of calibration. The LoD set the boundary of the working interval. It was approximately 10 CFU/mL. The upper limit of quantification (ULOQ) was influenced by the equipment and technique. It was inferred from the four curves. It set the upper boundary of the linear range. It was approximately 108 CFU/mL.
Also, in Figure 8, the threshold spread (s0) for the detection method was estimated by performing at least six detections (preferably 10) of samples at the breakpoint concentration. Quantifications of Salmonella spp. in the enrichment cultures was read from Table 1. The unit of measurement for resonance was picometers (pm). These data were read from a laboratory setup reader after processing the contaminated samples, as detailed in Table 1. To calculate the LoD, the formula LoD = 3.3 × s0 was applied. To calculate the LoQ, the formula LoQ = 10 × s0 was used. The ULOQ was determined based on the specific requirements of the analysis.
The results of previous studies [52,53] suggest that foodborne pathogens in meat samples are detected more effectively when tests follow a two-step process involving a short enrichment step followed by a polymerase chain reaction (PCR) assay. This approach appears to be necessary for the successful detection of low concentrations of pathogenic bacteria in food samples.
The results of the present research indicate that the method described in this study is equally effective in detecting Salmonella spp. The immunosensor had comparable efficiency to that of the culture method and qPCR for the specific detection of Salmonella spp., as reflected in Figure 8. This figure shows a positive correlation between the immunosensor and the culture method for both fresh vegetable and meat samples. In both cases, the correlation values were similar and close to 1, indicating a high level of agreement and correlation between the two methods.
The immunosensor method offers several advantages over alternative methods, such as PCR. First, it eliminates the need for bacterial processing involving a lysis buffer and DNA purification kits, which is necessary for PCR analysis of Salmonella spp. Second, using specific antibodies for detection removes the need for extensive preliminary work to assess primer specificity when developing qPCR protocols. This feature simplifies and streamlines the detection process.
4. Conclusions
This paper validates a novel approach to detect Salmonella spp. in food samples using a photonic biosensor. The method, which is part of the Feder Bacterio project, was observed to have high sensitivity, specificity, and overall accuracy when compared to the using cultures. This finding indicates that the photonic biosensor has the potential to become a reliable and effective tool in the agroindustry for the early detection of pathogens in food samples.
The biosensor was fabricated using silicon nitride and was developed using CMOS-compatible techniques. It relied on electron beam lithography and RIE-ICP etching. The immunosensor’s surface was composed of eight ring resonators. These resonators were functionalized with a variety of antibodies specifically selected to detect Salmonella spp. in meat and vegetable matrices. A preliminary validation of the biosensor was conducted with 100 fabricated PICs. After functionalizing the rings with these specific antibodies and attaching a microfluidic layer to the PIC, the biosensor successfully detected various bacterial concentrations. This innovative method was found to be a well-performing and feasible detection technique.
The results of the immobilization control experiments provide valuable insights. They indicate that the surfaces activated for immobilization had significantly higher fluorescence intensity values than nonactivated surfaces, underlining the effectiveness of the activation process in promoting immobilization. Interestingly, no statistically significant differences were observed between the fluorescence values of the monoclonal antibody and the polyclonal antibody. Hence, both antibodies appeared to be successfully immobilized on the sensor surfaces and supported the development of the biosensor. Both the selected monoclonal antibody and the polyclonal antibody specific to Salmonella spp. were immobilized on silicon nitride surfaces. Overall, these findings verify the successful immobilization of antibodies on the sensor surfaces, a critical step in biosensor development.
The results underscore the effectiveness of the biosensor method in accurately detecting Salmonella spp. in meat and vegetable samples, even at low concentrations. The chosen Salmonella spp. specific monoclonal antibody had heightened specificity and a robust binding affinity at lower antigen concentrations. Conversely, the selected polyclonal antibody specific to Salmonella spp. had a higher binding capacity to antigens across a wide range of concentrations. Nevertheless, at very high antigen concentrations, no significant results were observed. This finding highlights the strengths and limitations of the method in different contexts.
The novelty of this study lies in its detection methodology. The integrated system described in this paper enables the detection of changes in the light response when specific binding occurs between the immobilized antibody on the sensor surface and the target antigen (a particular protein or enzyme found on the surface of Salmonella spp.). Crucially, this process does not require the antibody to be labeled with a fluorophore to detect the antigen. This label-free detection method simplifies analysis and enhances the efficiency of Salmonella spp. detection. Another notable innovation is the integration of the detection system. To date, this integrated system has not been used to detect the food pathogen Salmonella spp. This novel approach offers a promising way of achieving more efficient and reliable Salmonella spp. detection in food samples.
Author Contributions
Conceptualization, A.F.B., J.G.-H., M.H.P. and Y.M.T.; methodology, A.F.B., J.G.-H., M.H.P. and Y.M.T.; validation, A.F.B., J.G.-H., M.H.P. and Y.M.T.; investigation, A.F.B., J.G.-H., M.H.P. and Y.M.T.; data curation, A.F.B., J.G.-H., M.H.P. and Y.M.T.; writing—original draft preparation, A.F.B.; writing—review and editing, J.G.-H., M.H.P. and Y.M.T.; funding acquisition, A.F.B., J.G.-H., M.H.P. and Y.M.T. All authors have read and agreed to the published version of the manuscript.
Funding
This research was financially supported by the AVI (Valencian Innovation Agency) and received funding from the European Union through FEDER funds. The project, identified as INNEST/2021/338, is known as the “BACTERIO project”, which focuses on “Integrated Photonics for integral microbiological control in the agri-food sector”.
Institutional Review Board Statement
Not applicable.
Informed Consent Statement
Not applicable.
Data Availability Statement
The data presented in this study are available in the article.
Conflicts of Interest
Author Ana Fernández Blanco was employed by the company Lumensia sensors S.L. The remaining authors declare that the research was conducted in the absence of any commercial or financial relationships that could be construed as a potential conflict of interest.
Abbreviations
The following abbreviations are used in this manuscript:
| MDPI | Multidisciplinary Digital Publishing Institute |
| DOAJ | Directory of Open Access Journals |
| TLA | Three-letter acronym |
| LD | Linear dichroism |
References
- Centers for Disease Control and Prevention (CDC). Highlights from the 2017 Surveillance Report. 2019. Available online: https://www.cdc.gov/fdoss/annual-reports/2017-report-highlights.htm (accessed on 1 July 2023).
- Ansari, N.; Yazdian-Robati, R.; Shahdordizadeh, M.; Wang, Z.; Ghazvini, K. Aptasensors for quantitative detection of Salmonella Typhimurium. Anal. Biochem. 2017, 533, 18–25. [Google Scholar] [CrossRef] [PubMed]
- Silva, N.F.D.; Magalhães, J.M.C.S.; Freire, C.; Delerue-Matos, C. Electrochemical biosensors for Salmonella: State of the art and challenges in food safety assessment. Biosens. Bioelectron. 2018, 99, 667–682. [Google Scholar] [CrossRef] [PubMed]
- World Health Organization (WHO). Salmonella (Non Typhoidal). 2018. Available online: https://www.who.int/news-room/factsheets/detail/salmonella-(non-typhoidal) (accessed on 1 July 2023).
- Solutions, S. Regulatory Compliance. Available online: https://www.fsis.usda.gov/wps/portal/fsis/topics/regulatory-compliance/ (accessed on 31 May 2018).
- ISO 6579:2002; Microbiology of Food and Animal Feeding Stuffs–Horizontal Method for the Detection of Salmonella spp. International Organization for Standardization ISO: Geneva, Switzerland, 2002; p. 27.
- Alhajj, M.; Farhana, A. Enzyme Linked Immunosorbent Assay; StatPearls Publishing: Treasure Island, FL, USA, 2020. Available online: https://www.ncbi.nlm.nih.gov/books/NBK555922/ (accessed on 8 September 2021).
- Notomi, T.; Okayama, H.; Masubuchi, H.; Yonekawa, T.; Watanabe, K.; Amino, N.; Hase, T. Loop-mediated isothermal amplification of DNA. Nucleic Acids Res. 2000, 28, E63. [Google Scholar] [CrossRef] [PubMed]
- Valderrama, W.B.; Dudley, E.G.; Doores, S.; Cutter, C.N. Commercially Available Rapid Methods for Detection of Selected Food-borne Pathogens. Crit. Rev. Food Sci. Nutr. 2016, 56, 1519–1531. [Google Scholar] [CrossRef] [PubMed]
- Rotariu, L.; Lagarde, F.; Jaffrezic-Renault, N.; Bala, C. Electrochemical biosensors for fast detection of food contaminantstrends and perspective. TrAC Trends Anal. Chem. 2016, 79, 80–87. [Google Scholar] [CrossRef]
- Kirsch, J.; Siltanen, C.; Zhou, Q.; Revzin, A.; Simonian, A. Biosensor technology: Recent advances in threat agent detection and medicine. Chem. Soc. Rev. 2013, 42, 8733–8768. [Google Scholar] [CrossRef] [PubMed]
- Wang, J.; Yao, Z.; Poon, A.W. Silicon-nitride-based integrated optofluidic biochemical sensors using a coupled-resonator optical waveguide. Front. Mater. 2015, 2, 34. [Google Scholar] [CrossRef]
- Ahmed, A.; Rushworth, J.V.; Hirst, N.A.; Millner, P.A. Biosensors for Whole-Cell Bacterial Detection. Clin. Microbiol. Rev. 2014, 27, 631–646. [Google Scholar] [CrossRef]
- Park, K.S. Nucleic acid aptamer-based methods for diagnosis of infections. Biosens. Bioelectron. 2017, 102, 179–188. [Google Scholar] [CrossRef]
- Byrne, B.; Stack, E.; Gilmartin, N.; O’Kennedy, R. Antibody-based sensors: Principles problems and potential for detection of pathogens and associated toxins. Sensors 2009, 9, 4407–4445. [Google Scholar] [CrossRef]
- Hearty, S.; Leonard, P.; Quinn, J.; O’Kennedy, R. Production, characterisation and potential application of a novelmonoclonal antibody for rapid identification of virulent Listeria monocytogenes. J. Microbiol. Methods 2006, 66, 294–312. [Google Scholar] [CrossRef] [PubMed]
- Hahm, B.-K.; Bhunia, A. Effect of environmental stresses on antibody-based detection of Escherichia coli O157:H7, Salmonella enterica serotype Enteritidis and Listeria monocytogenes. J. Appl. Microbiol. 2006, 100, 1017–1027. [Google Scholar] [CrossRef] [PubMed]
- Lathrop, S.K.; Santacruz, N.A.; Pham, D.; Luo, J.; Chyi-Song Hsieh, C.-S. Antigen-specific peripheral shaping of the natural regulatory T cell population. J. Exp. Med. 2008, 205, 3105–3117. [Google Scholar] [CrossRef] [PubMed]
- Vytřasova, J.; Zachová, I.; Červenka, L.; Štěpanková, J.; Pejchalová, M. Non-specific reactions during immunomagnetic separation of Listeria. Food Technol. Biotechnol. 2005, 43, 397–401. [Google Scholar]
- Howell, S.W.; Inerowicz, H.D.; Regnier, F.E.; Reifenberger, R. Patterned protein microarrays for bacterial detection. Langmuir 2003, 19, 436–439. [Google Scholar] [CrossRef]
- Chandra, H.; Reddy, P.J.; Srivastava, S. Protein microarrays and novel detection platforms. Expert Rev. Proteom. 2011, 8, 61–79. [Google Scholar] [CrossRef] [PubMed]
- Ghosh Dastider, S.; Barizuddin, S.; Yuksek, N.S.; Dweik, M.; Almasri, M.F. Efficient and rapid detection of Salmonella using microfluidic impedance based sensing. J. Sens. 2015, 2015, 293461. [Google Scholar] [CrossRef]
- Kim, G.; Moon, J.H.; Moh, C.Y.; Lim, J.G. A microfluidic nano-biosensor for the detection of pathogenic Salmonella. Biosens. Bioelectron. 2015, 67, 243–247. [Google Scholar] [CrossRef]
- Li, J.F.; Zhang, Y.J.; Ding, S.Y.; Panneerselvam, R.; Tian, Z.Q. Core-shell nanoparticle-enhanced Raman spectroscopy. Chem. Rev. 2017, 117, 5002–5069. [Google Scholar] [CrossRef]
- Lin, H.Y.; Huang, C.H.; Hsieh, W.H.; Liu, L.H.; Lin, Y.C.; Chu, C.C.; Wang, S.T.; Kuo, I.T.; Chau, L.K.; Yang, C.Y. On-line SERS detection of single bacterium using novel SERS nanoprobes and a microfluidic dielectrophoresis device. Small 2014, 10, 4700–4710. [Google Scholar] [CrossRef]
- Singh, C.; Ali, M.A.; Kumar, V.; Ahmad, R.; Sumana, G. Functionalized MoS2 nanosheets assembled microfluidic immunosensor for highly sensitive detection of food pathogen. Sens. Actuators B Chem. 2018, 259, 1090–1098. [Google Scholar] [CrossRef]
- Thiha, A.; Ibrahim, F.; Muniandy, S.; Dinshaw, I.J.; Teh, S.J.; Thong, K.L.; Leo, B.F.; Madou, M. All-carbon suspended nanowire sensors as a rapid highly-sensitive label-free chemiresistive biosensing platform. Biosens. Bioelectron. 2018, 107, 145–152. [Google Scholar] [CrossRef] [PubMed]
- Choi, S.; Goryll, M.; Sin, L.Y.M.; Wong, P.K.; Chae, J. Microfluidic-based biosensors toward point-of-care detection of nucleic acids and proteins. Microfluid. Nanofluidics 2011, 10, 231–247. [Google Scholar] [CrossRef] [PubMed]
- Derkus, B. Applying the miniaturization technologies for biosensor design. Biosens. Bioelectron. 2016, 79, 901–913. [Google Scholar] [CrossRef] [PubMed]
- Sun, J.; Xianyu, Y.; Jiang, X. Point-of-care biochemical assays using gold nanoparticle-implemented microfluidics. Chem. Soc. Rev. 2014, 43, 6239–6253. [Google Scholar] [CrossRef] [PubMed]
- Wen, T.; Wang, R.; Sotero, A.; Li, Y. A portable impedance immunosensing system for rapid detection of Salmonella typhimurium. Sensors 2017, 17, 1973. [Google Scholar] [CrossRef] [PubMed]
- Bange, A.; Halsall, H.B.; Heineman, W.R. Microfluidic immunosensor systems. Biosens. Bioelectron. 2005, 20, 2488–2503. [Google Scholar] [CrossRef]
- Luka, G.; Ahmadi, A.; Najjaran, H.; Alocilja, E.; DeRosa, M.; Wolthers, K.; Malki, A.; Aziz, H.; Althani, A.; Hoorfar, M. Microfluidics integrated biosensors: A leading technology towards lab-on-a-chip and sensing applications. Sensors 2015, 15, 30011–30031. [Google Scholar] [CrossRef]
- Prakash, S.; Pinti, M.; Bhushan, B. Theory, fabrication and applications of microfluidic and nanofluidic biosensors. Philos. Trans. R. Soc. A Math. Phys. Eng. Sci. 2012, 370, 2269–2303. [Google Scholar] [CrossRef]
- Zou, D.; Jin, L.; Wu, B.; Hu, L.; Chen, X.; Huang, G.; Zhang, J. Rapid detection of Salmonella in milk by biofunctionalised magnetic nanoparticle cluster sensor based on nuclear magnetic resonance. Int. Dairy J. 2019, 91, 82–88. [Google Scholar] [CrossRef]
- Lan, L.; Yao, Y.; Ping, J.; Ying, Y. Recent advances in nanomaterial-based biosensors for antibiotics detection. Biosens. Bioelectron. 2017, 91, 504–514. [Google Scholar] [CrossRef] [PubMed]
- Mauriz, E.; García-Fernández, M.C.; Lechuga, L.M. Towards the design of universal immunosurfaces for SPR-based assays: A review. TrAC Trends Anal. Chem. 2016, 79, 191–198. [Google Scholar] [CrossRef]
- Zhang, D.; Yan, Y.; Li, Q.; Yu, T.; Cheng, W.; Wang, L.; Ju, H.; Ding, S. Label-free and high-sensitive detection of Salmonella using a surface plasmon resonance DNA-based biosensor. J. Biotechnol. 2012, 160, 123–128. [Google Scholar] [CrossRef] [PubMed]
- Xu, L.; Callaway, Z.T.; Wang, R.; Wang, H.; Slavik, M.F.; Wang, A.; Li, Y. A fluorescent aptasensor coupled with nanobeadbased immunomagnetic separation for simultaneous detection of four foodborne pathogenic bacteria. Trans. ASABE 2015, 58, 891–906. [Google Scholar] [CrossRef]
- González-Guerrero, A.B.; Dante, S.; Duval, D.; Osmond, J.; Lechuga, L.M. Advanced photonic biosensors for point-of-care diagnostics. Procedia Eng. 2011, 25, 71–75. [Google Scholar] [CrossRef]
- White, I.M.; Fan, X.; Shopova, S.I.; Zhu, H.; Suter, J.D.; Sun, Y. Sensitive optical biosensors for unlabeled targets: A review. Anal. Chim. Acta 2008, 620, 8–26. [Google Scholar] [CrossRef]
- De Vos, K.; Bartolozzi, I.; Schacht, E.; Bienstman, P.; Baets, R. Silicon-on-Insulator microring resonator for sensitive and label-free biosensing. Opt. Express 2007, 15, 7610. [Google Scholar] [CrossRef]
- Kant, K.; Shahbazi, M.A.; Dave, V.P.; Ngo, T.A.; Chidambara, V.A.; Than, L.Q.; Bang, D.D.; Wolff, A. Microfluidic devices for sample preparation and rapid detection of foodborne pathogens. Biotechnol. Adv. 2018, 36, 1003–1024. [Google Scholar] [CrossRef]
- Blanco, A.F.; Pérez, M.H.; Trigos, Y.M.; García-Hernández, J. Development of Optical Label-Free Biosensor Method in Detection of Listeria monocytogenes from Food. Sensors 2023, 23, 5570. [Google Scholar] [CrossRef]
- UNE-EN ISO 6579-1:2017/A1:2021; Microbiology of the Food Chain—Horizontal Method for the Detection, Enumeration and Serotyping of Salmonella—Part 1: Detection of Salmonella spp.—Amendment 1 Broader Range of Incubation Temperatures, Amendment to the Status of Annex D, and Correction of the Composition of MSRV and SC (ISO 6579-1:2017/Amd 1:2020). International Organization for Standardization ISO: Geneva, Switzerland, 2021.
- Goodridge, H.S.; Reyes, C.N.; Becker, C.A.; Katsumoto, T.R.; Ma, J.; Wolf, A.J.; Bose, N.; Chan, A.S.H.; Magee, A.S.; Danielson, M.E.; et al. Activation of the innate immune receptor Dectin-1 upon formation of a ‘phagocytic synapse’. Nature 2011, 472, 471–475. [Google Scholar] [CrossRef]
- Mandal, P.K.; Biswas, A.K.; Choi, K.; Pal, U.K. Methods for Rapid Detection of Foodborne Pathogens: An Overview. Am. J. Food Technol. 2011, 6, 87–102. [Google Scholar] [CrossRef]
- Aznar, R.; Alarcón, B. On the specificity of PCR detection of Listeria monocytogenes in food: A comparison of published primers. Syst. Appl. Microbiol. 2002, 25, 109–119. [Google Scholar] [CrossRef] [PubMed]
- Brehm-Stecher, B.F.; Johnson, E.A. Rapid methods for detection of Listeria. Food Sci. Technol. 2007, 161, 257. [Google Scholar]
- Walczak, R.; Krüger, J.; Moynihan, S. A miniaturised image based fluorescence detection system for point-of-care-testing of cocaine abuse. Meas. Sci. Technol. 2015, 26, 085401. [Google Scholar] [CrossRef]
- Wheeler, M.J.; Morley Hutchinson, J.S. Hormone Assays in Biological Fluids; Methods in Molecular Biology; Fraser, W.D., Ed.; Humana Press: Totowa, NJ, USA, 2006; p. 324. [Google Scholar]
- Ingianni, A.; Floris, M.; Palomba, P.; Madeddu, M.A.; Quartuccio, M.; Pompei, R. Rapid detection of Listeria monocytogenes in foods, by a combination of PCR and DNA probe. Mol. Cell. Probes 2001, 15, 275–280. [Google Scholar] [CrossRef]
- Manzano, M.; Cocolin, L.; Ferroni, P.; Cantoni, C.; Comi, G. A simple and fast PCR protocol to detect Listeria monocytogenes from meat. J. Sci. Food Agric. 1997, 74, 25–30. [Google Scholar] [CrossRef]
Figure 1.
Array layout. This figure illustrates the arrangement of the array. It shows surfaces that were both activated and non-activated with primary antibody immobilization (Lines 1 and 4), as well as blank (Line 3) and positive control (Line 2) test configurations. (a) Surfaces 1 and 2 had both activated and non-activated surfaces, where primary antibodies were immobilized and then secondary anti-mouse antibodies were immobilized. (b) Surfaces 3 and 4 had both activated and non-activated surfaces. They were subjected to immobilization with primary antibodies, which were subsequently bound to fluorophore-linked anti-rabbit secondary antibodies.

Figure 2.
Descriptive image of a common coupling process. The red arrows indicate the path that the light follows when incident from the laser entrance, passing through the grating couplers and optica modulator until reaching the optical ring resonators. They also indicate the passage of light through the optical waveguides coupled to the photonic system.

Figure 3.
Descriptive image of the immunosensory surface. Eight ring resonators were distributed across two sensing areas, with four ring resonators per channel. The figure shows enlarged detail of each ring resonator functionalized with an antibody on its surface and its evanescent response.
Figure 3.
Descriptive image of the immunosensory surface. Eight ring resonators were distributed across two sensing areas, with four ring resonators per channel. The figure shows enlarged detail of each ring resonator functionalized with an antibody on its surface and its evanescent response.

Figure 4.
Laboratory set-up reader: detection system to detect samples in the laboratory. Description of photonic components: laser source, polarization drivers, control PCB. Indication of microfluidic components: peristaltic pump, sample reservoir, fluidic channels, waste reservoir, sensing area (PIC + fluidics). The food target sample was pushed from its reservoir through external microfluidic channels connected to an internal microfluidic channel where the sensor structure (PIC) was housed. The laser source impacted the sensor area (PIC) to create resonance by passing the sample over the ring resonators that housed the PIC. The data are collected and directed by the PCB.

Figure 5.
Immunosensor-based detection of Salmonella spp. (a) Binding event ensues with the immobilized antibodies on the PIC surface. Throughout the sample flow process, a meticulous monitoring of the correlation between optical resonance, in picometers (pm), and the elapsed time in seconds (s) is performed. (b) The optical signal transduction performed by the system is elucidated, in the form of a calibration curve. This calibration curve articulates the resonance in pm with the concentration of Salmonella spp. bacteria present in the sample. The curve’s development entails measurement of the net difference in resonance between the reference rings (rr3, rr4) and the rings with functional antibodies (rr1 and rr2). The reference resonators function as controls, and any discernible change in resonance concerning the functionalized rings relative to the reference rings signifies the occurrence of Salmonella spp. binding.

Figure 6.
Images of immunosensor surfaces post-immobilization. (a) Surface 1 was activated with the monoclonal antibody (mAb). It displayed reactions with the secondary anti-mouse antibody (Line 1) and a serial dilution of a positive control of LPS Salmonella spp. (Line 2). (b) Surface 2 was non-activated with mAb. It exhibited minimal reactivity with the secondary anti-mouse antibody (Line 1). (c) Surface 3 was activated with the polyclonal antibody (pAb). It showed a response to the secondary anti-rabbit antibody (Line 1). (d) Surface 4 was non-activated with pAb. It displayed negligible reactivity with the secondary anti-rabbit antibody (Line 2). Images were taken using the microarray fluorescence reader GenePix 4000B from Axon Instruments.

Figure 7.
Comparison of results of immobilization between activated and non-activated surfaces using EDC/NHS. These results reflect fluorescence intensity for each surface, where both polyclonal (pAb) and monoclonal (mAb) antibodies against Salmonella spp. were immobilized.
Figure 7.
Comparison of results of immobilization between activated and non-activated surfaces using EDC/NHS. These results reflect fluorescence intensity for each surface, where both polyclonal (pAb) and monoclonal (mAb) antibodies against Salmonella spp. were immobilized.

Figure 8.
Calibration strains and food sample curves. (A) Calibration curve of biosensor against Salmonella enterica Typhimurium. (B) Calibration curve of biosensor against Salmonella enterica Enteritidis. (C) Biosensor calibration curve against Salmonella spp. isolated from spiked fresh chicken samples. (D) Biosensor calibration curve against Salmonella spp. isolated from spiked red Batavia samples.


Table 1.
Comparison of results for target species.
| Target Species * | Immunosensor Response ** | Count on Selective Agar (CFU/mL) *** |
|---|---|---|
| Salmonella enterica Typhimurium CECT4266 04/2023 | + | 1.5 × 10¹⁰ |
| Salmonella enterica Typhimurium CECT4266 04/2023 | − | 0 |
| Salmonella enterica Typhimurium CECT4266 04/2023 | + | 1.5 × 10⁷ |
| Salmonella enterica Typhimurium CECT4266 04/2023 | + | 1.5 × 10⁸ |
| Salmonella enterica Typhimurium CECT4266 05/2023 | + | 5 × 10³ |
| Salmonella enterica Typhimurium CECT4266 05/2023 | + | 5 × 101 |
| Salmonella enterica Typhimurium CECT4266 05/2023 | + | 5 × 10² |
| Salmonella enterica Enteriditis CECT 7236 04/2023 | + | 1.8 × 10¹⁰ |
| Salmonella enterica Enteriditis CECT 7236 04/2023 | + | 1.8 × 10⁸ |
| Salmonella enterica Enteriditis CECT 7236 04/2023 | + | 1.8 × 10⁷ |
| Salmonella enterica Enteriditis CECT 7236 04/2023 | − | 0 |
| Salmonella enterica Enteriditis CECT 7236 05/2023 | + | 1 × 10² |
| Salmonella enterica Enteriditis CECT 7236 05/2023 | + | 1 × 10³ |
| Salmonella enterica Enteriditis CECT 7236 05/2023 | − | 1 × 101 |
* The replicates were organized in chronological order based on the dates of these inoculum strains. ** and + indicate confirmation that Salmonella spp. was detected. − indicates absence of Salmonella spp. *** Salmonella spp. contamination was estimated based on the concentration of Colony Forming Units (CFU) per milliliter (CFU/mL) in the first dilution of each sample. This measurement reflects the number of viable Salmonella bacteria in the initial sample. CFU/mL units after detecting and quantifying Salmonella spp. in the pre-enrichment cultures are represented against the resonance units (pm) according to the immunosensor reading from the calibration curve shown in Figure 8.
Table 2.
Comparison of results for contaminated food samples.
| Target Sample * | Immunosensor Response ** | Count on Selective Agar (CFU/mL) *** |
|---|---|---|
| Fresh salad 04/2023 | + | 1.1 × 10³ |
| Fresh salad 04/2023 | + | 6.5 × 10⁵ |
| Fresh salad 04/2023 | + | 3.0 × 10² |
| Fresh salad 04/2023 | + | 4.2 × 101 |
| Fresh chicken 05/2023 | + | 2.0 × 10⁵ |
| Fresh chicken 05/2023 | + | 5.6 × 10³ |
| Fresh chicken 05/2023 | + | 6.2 × 10² |
| Fresh chicken 05/2023 | + | 2.0 × 101 |
| Fresh chicken CECT4266 | + | 1.0 × 10² |
| Fresh chicken CECT4266 | + | 2 × 101 |
| Fresh chicken CECT4266 | + | 3.0 × 10⁵ |
| Fresh chicken CECT4266 | + | 1.5 × 10⁷ |
| Fresh chicken CECT4266 | + | 6.0× 10⁶ |
| Fresh chicken CECT4266 | + | 1.5 × 10⁴ |
| Fresh chicken CECT4266 | + | 5.6 × 10³ |
| Red Batavia CECT4266 | + | 2 × 101 |
| Red Batavia CECT4266 | + | 4.8 × 10¹⁰ |
| Red Batavia CECT4266 | + | 1 × 10² |
| Red Batavia CECT4266 | + | 1.5 × 10⁷ |
| Red Batavia CECT4266 | + | 1.9 × 10³ |
* The replicates were organized in chronological order based on the date of sampling food with the presence of Salmonella spp. ** and + indicates confirmation that Salmonella spp. was detected. *** Salmonella spp. contamination was estimated based on the concentration of Colony Forming Units (CFU) per milliliter (CFU/mL) in the first dilution of each sample. This measurement reflects the number of viable Salmonella bacteria in the initial sample. CFU/mL units after detecting and quantifying Salmonella spp. in the pre-enrichment cultures are represented against the resonance units (pm) according to the immunosensor reading from the calibration curve shown in Figure 8.
Disclaimer/Publisher’s Note: The statements, opinions and data contained in all publications are solely those of the individual author(s) and contributor(s) and not of MDPI and/or the editor(s). MDPI and/or the editor(s) disclaim responsibility for any injury to people or property resulting from any ideas, methods, instructions or products referred to in the content. |
© 2023 by the authors. Licensee MDPI, Basel, Switzerland. This article is an open access article distributed under the terms and conditions of the Creative Commons Attribution (CC BY) license (https://creativecommons.org/licenses/by/4.0/).
Share and Cite
MDPI and ACS Style
Fernández Blanco, A.; Hernández Pérez, M.; Moreno Trigos, Y.; García-Hernández, J. A Photonic Label-Free Biosensor to Detect Salmonella spp. in Fresh Vegetables and Meat. Appl. Sci. 2023, 13, 13103. https://doi.org/10.3390/app132413103
AMA Style
Fernández Blanco A, Hernández Pérez M, Moreno Trigos Y, García-Hernández J. A Photonic Label-Free Biosensor to Detect Salmonella spp. in Fresh Vegetables and Meat. Applied Sciences. 2023; 13(24):13103. https://doi.org/10.3390/app132413103
Chicago/Turabian StyleFernández Blanco, Ana, Manuel Hernández Pérez, Yolanda Moreno Trigos, and Jorge García-Hernández. 2023. "A Photonic Label-Free Biosensor to Detect Salmonella spp. in Fresh Vegetables and Meat" Applied Sciences 13, no. 24: 13103. https://doi.org/10.3390/app132413103
Note that from the first issue of 2016, this journal uses article numbers instead of page numbers. See further details here.