
Study on Detecting Method of Internal Defects by Laser Ultrasonics in Lap Joint Welding of Galvanized Steel Sheet and Finite Element Analysis of Its Detectability
 ,
, 
Abstract
:1. Introduction
2. Method and Experimental Results of Blowhole Detection in Thin Sheet Welds Using Laser Ultrasonic Techniques
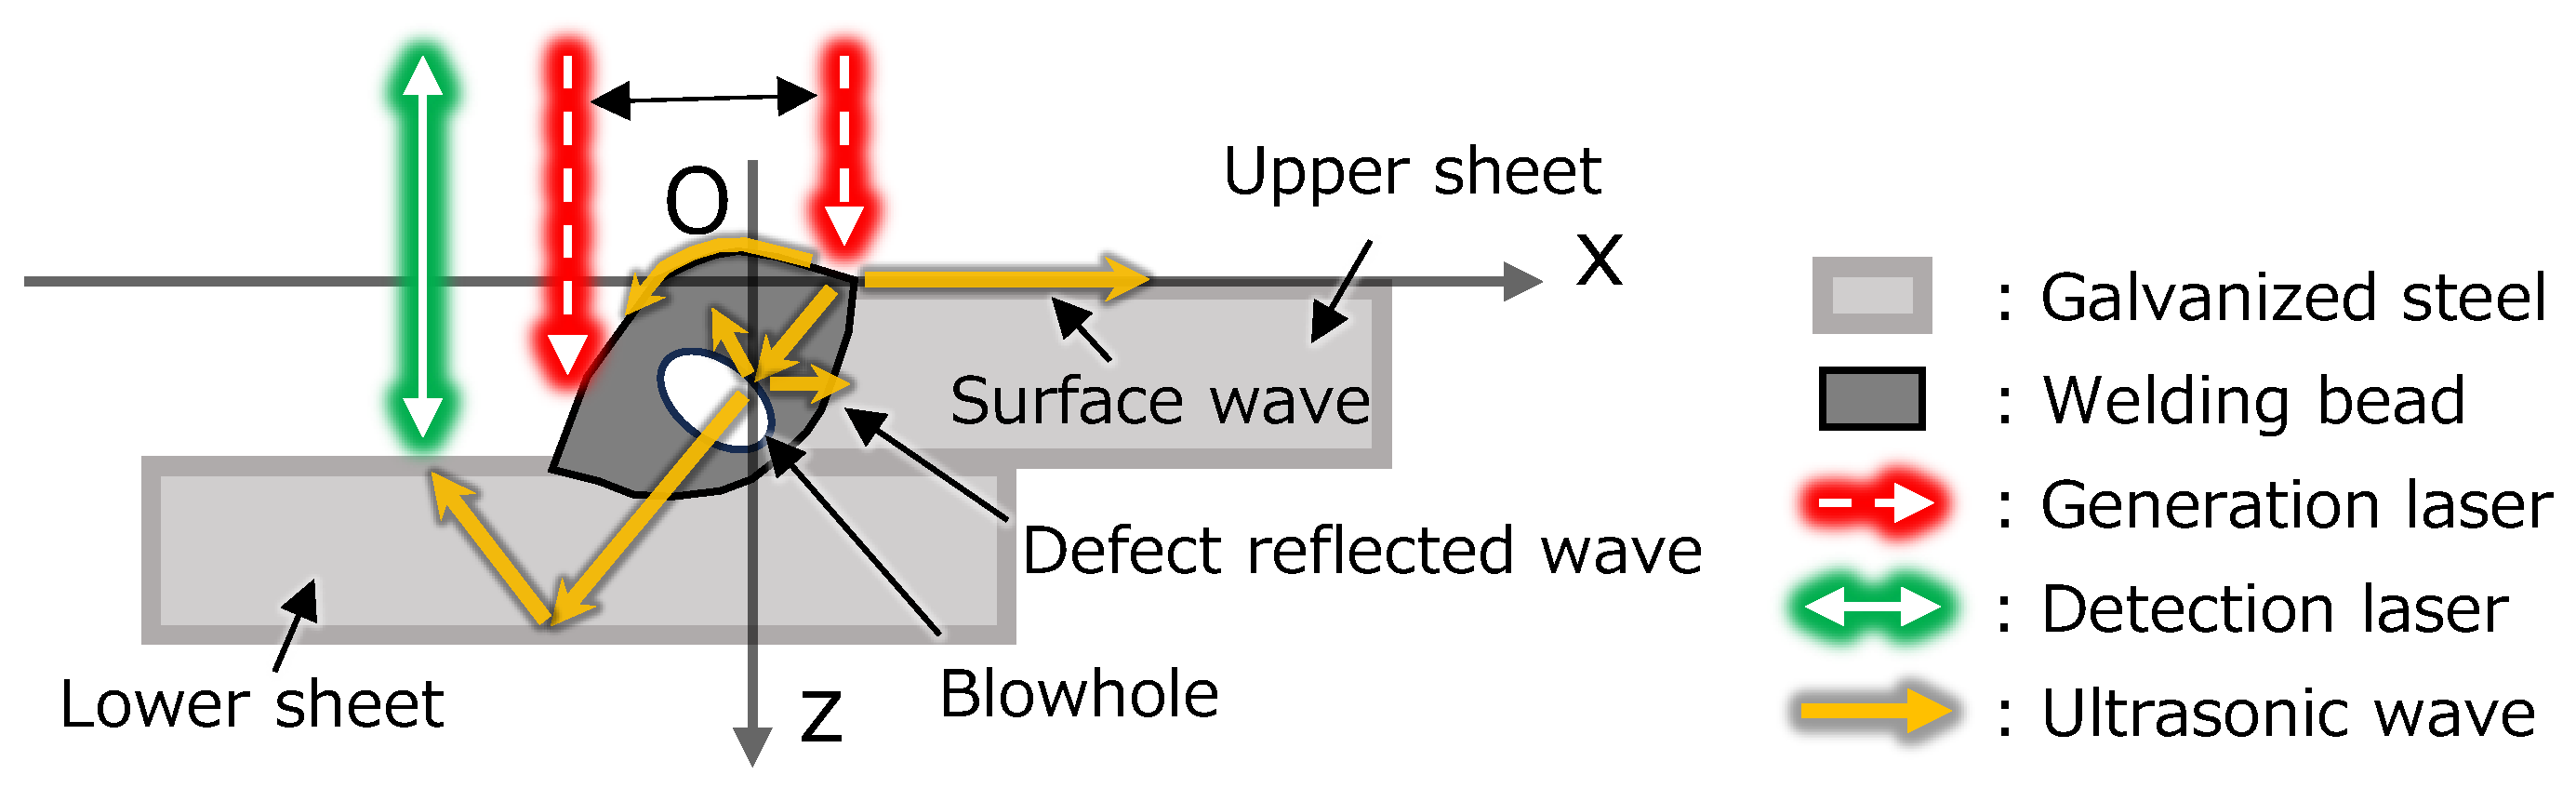
2.1. Theory of Detection Method
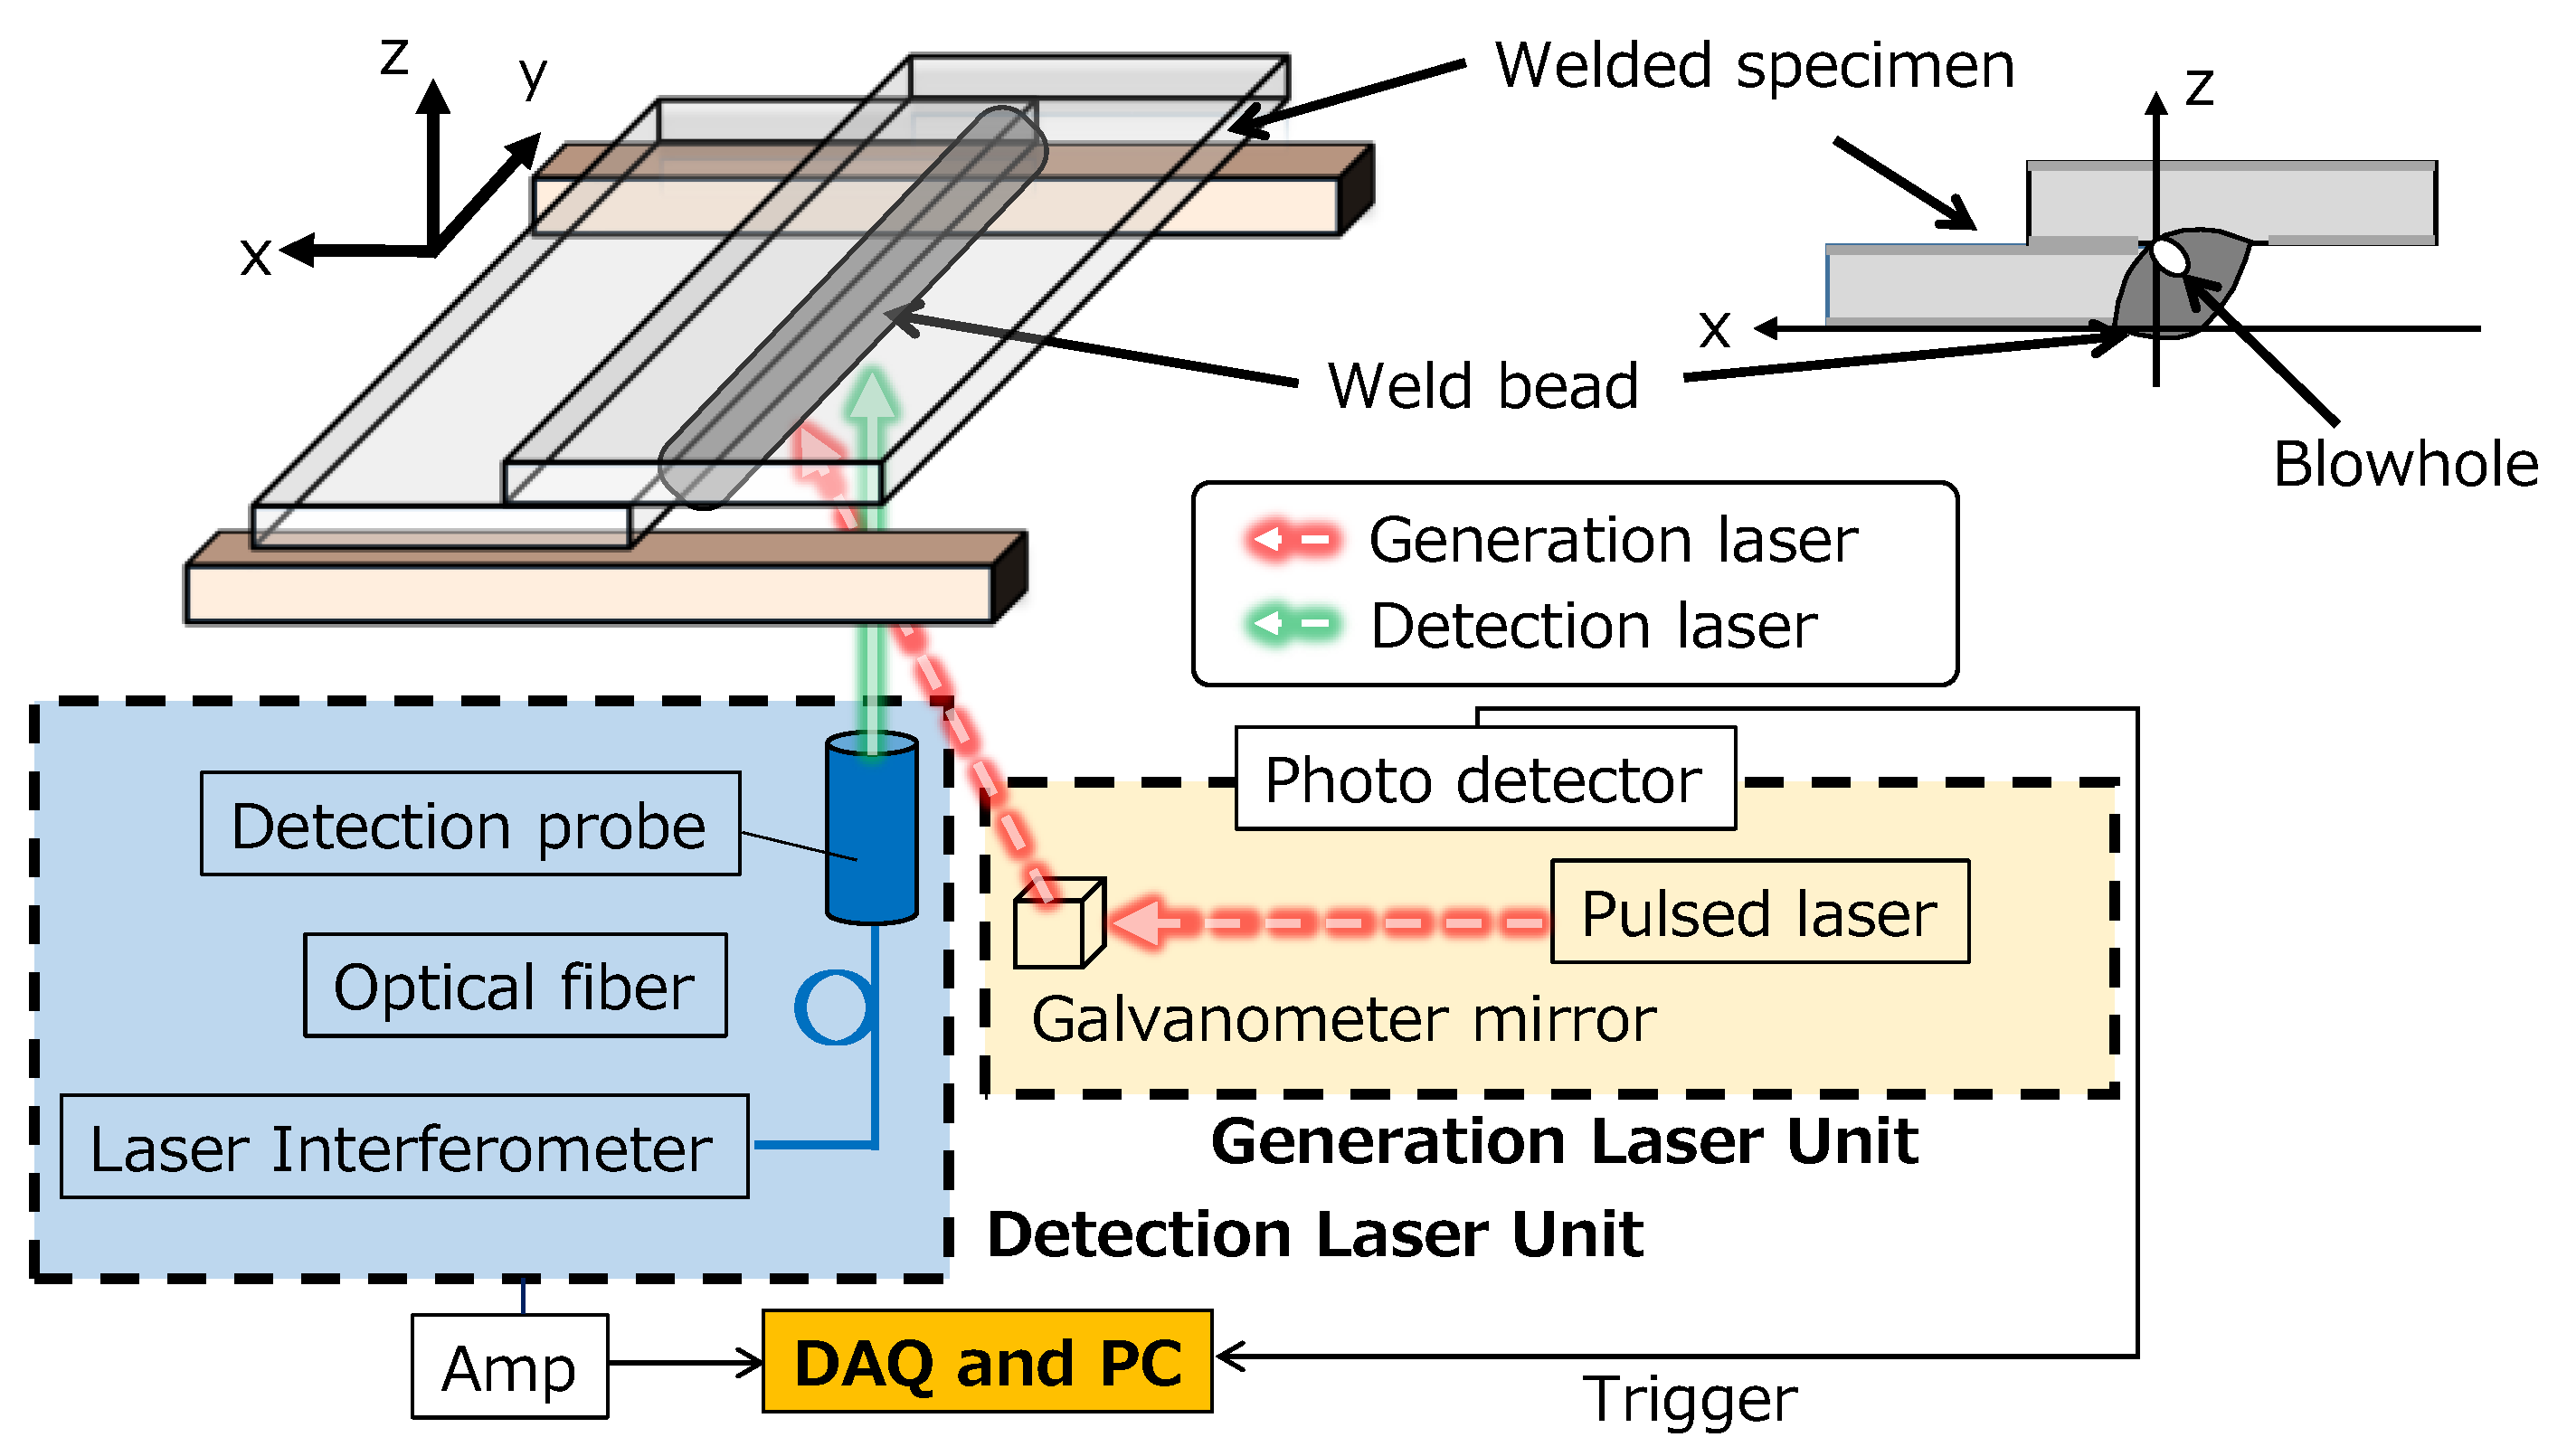
2.2. Experimental Setup
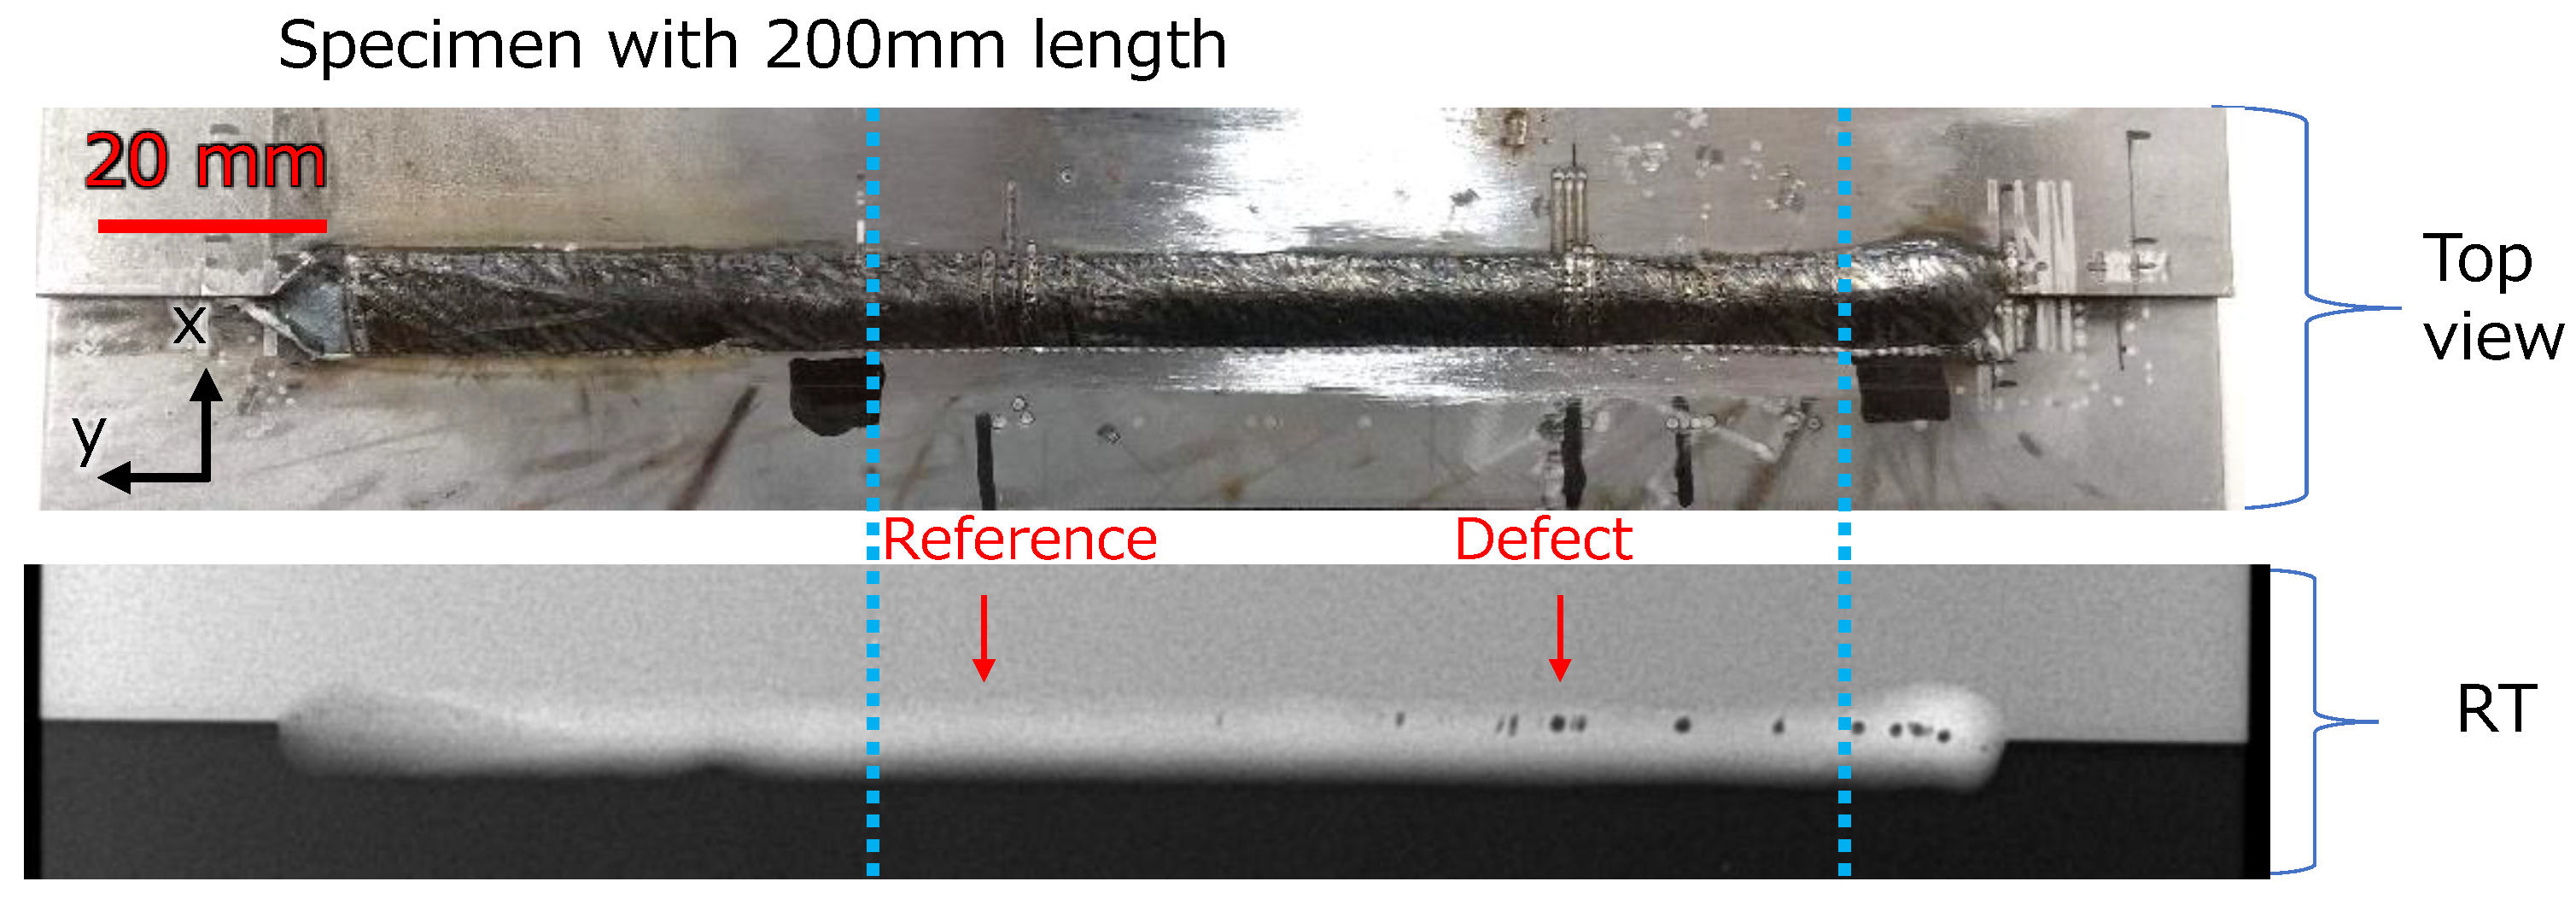
2.3. Experimental Result
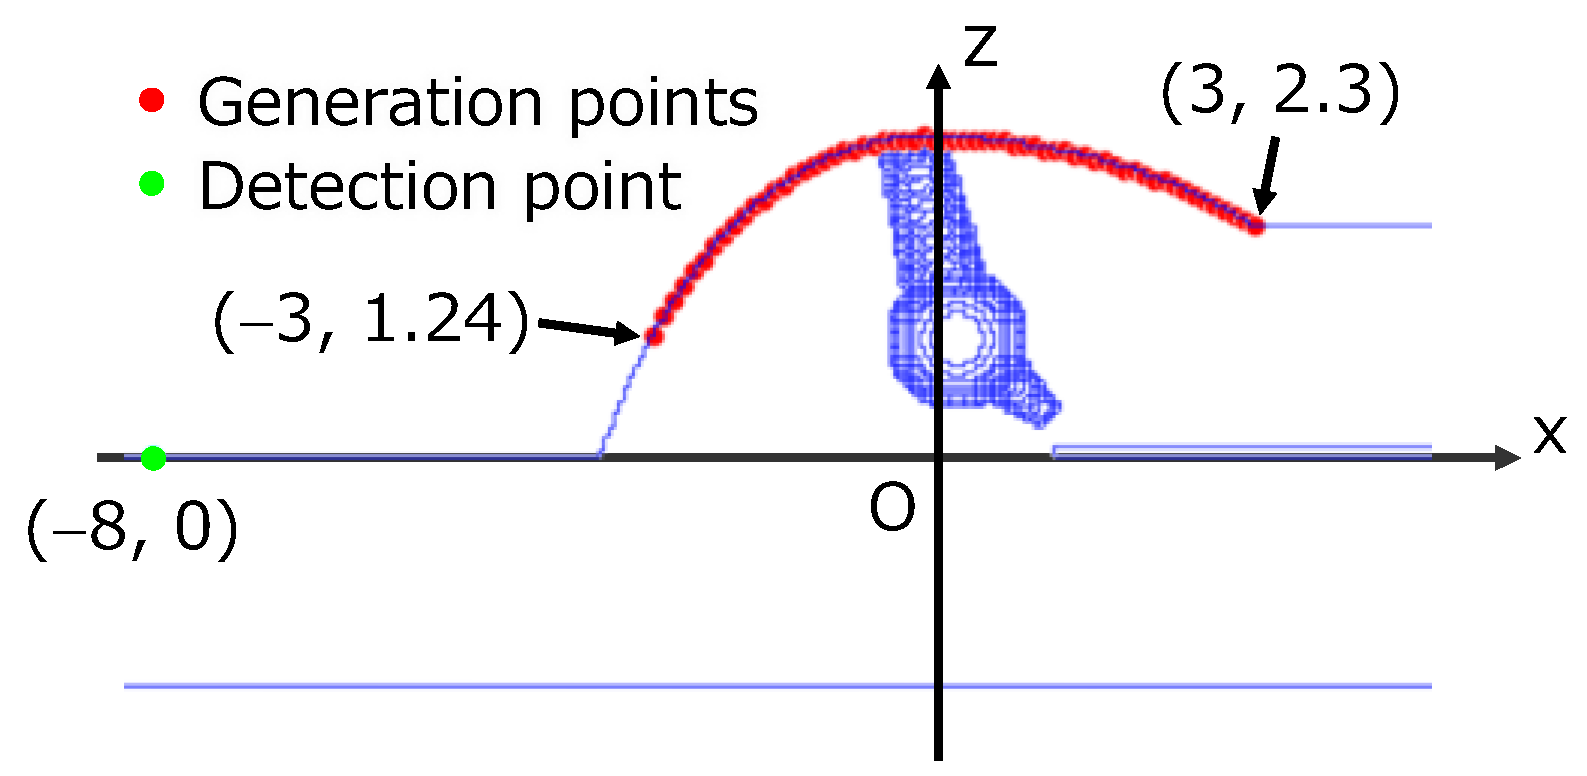
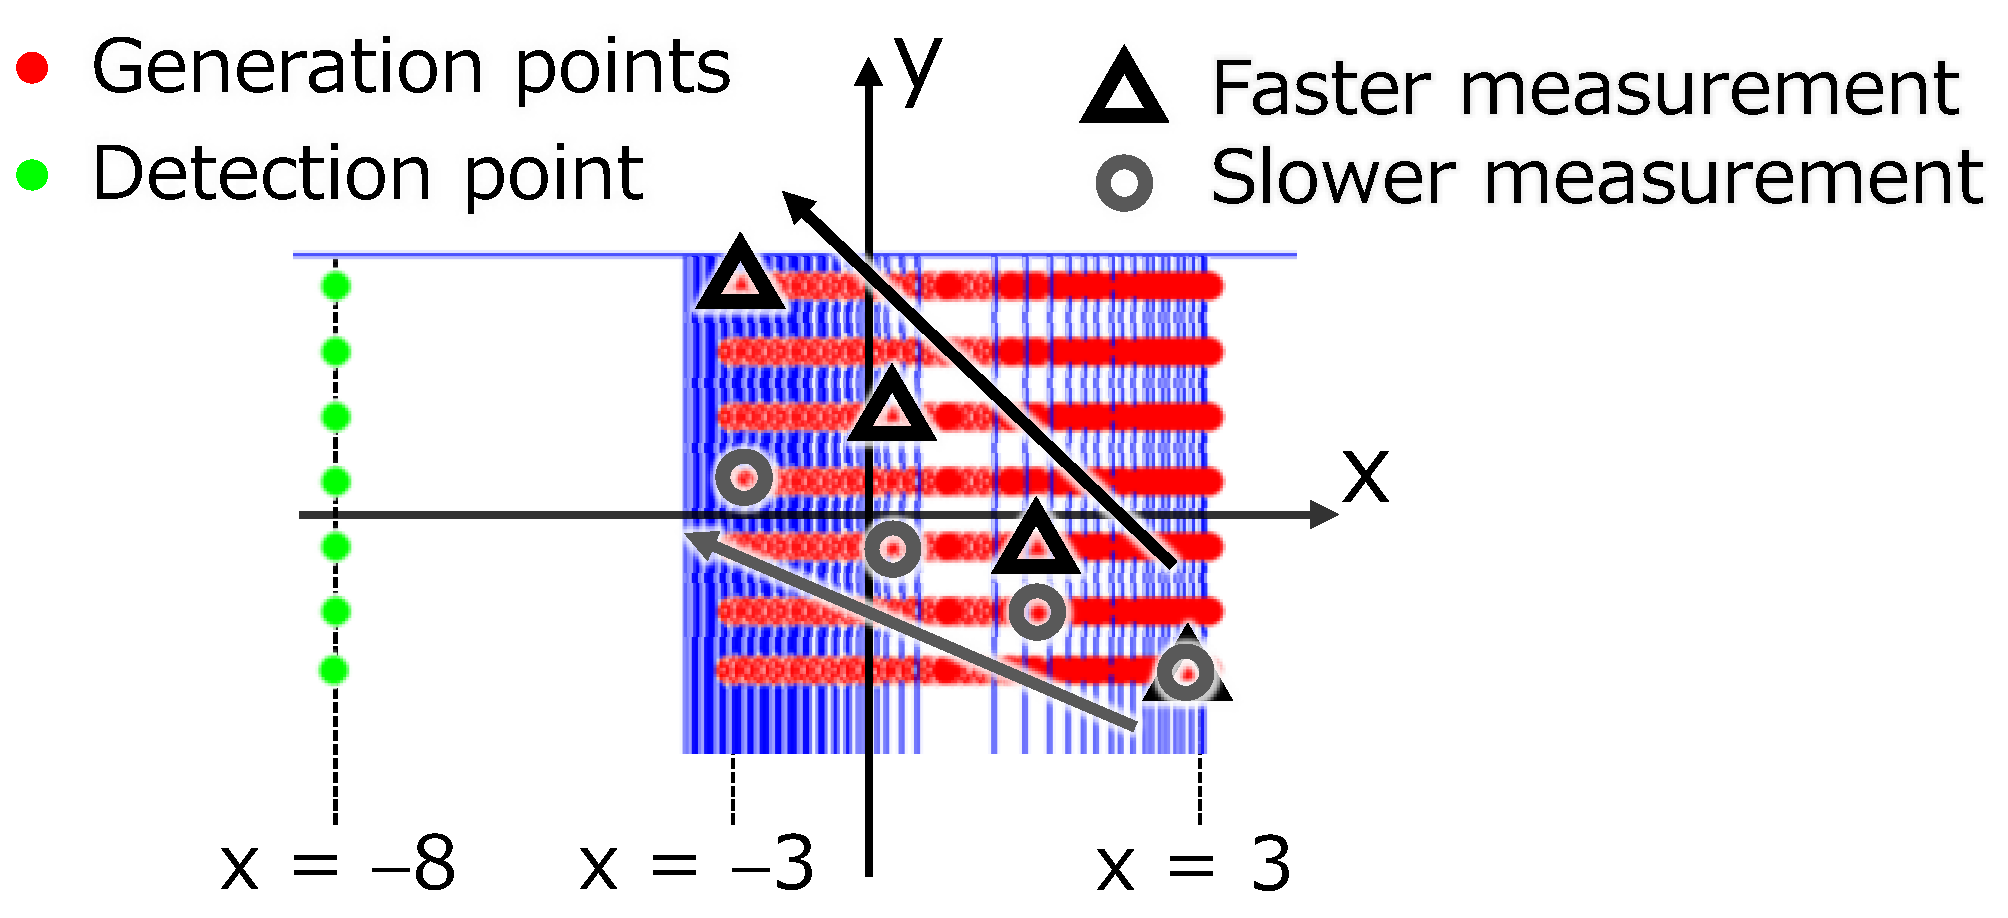
3. Analysis Method
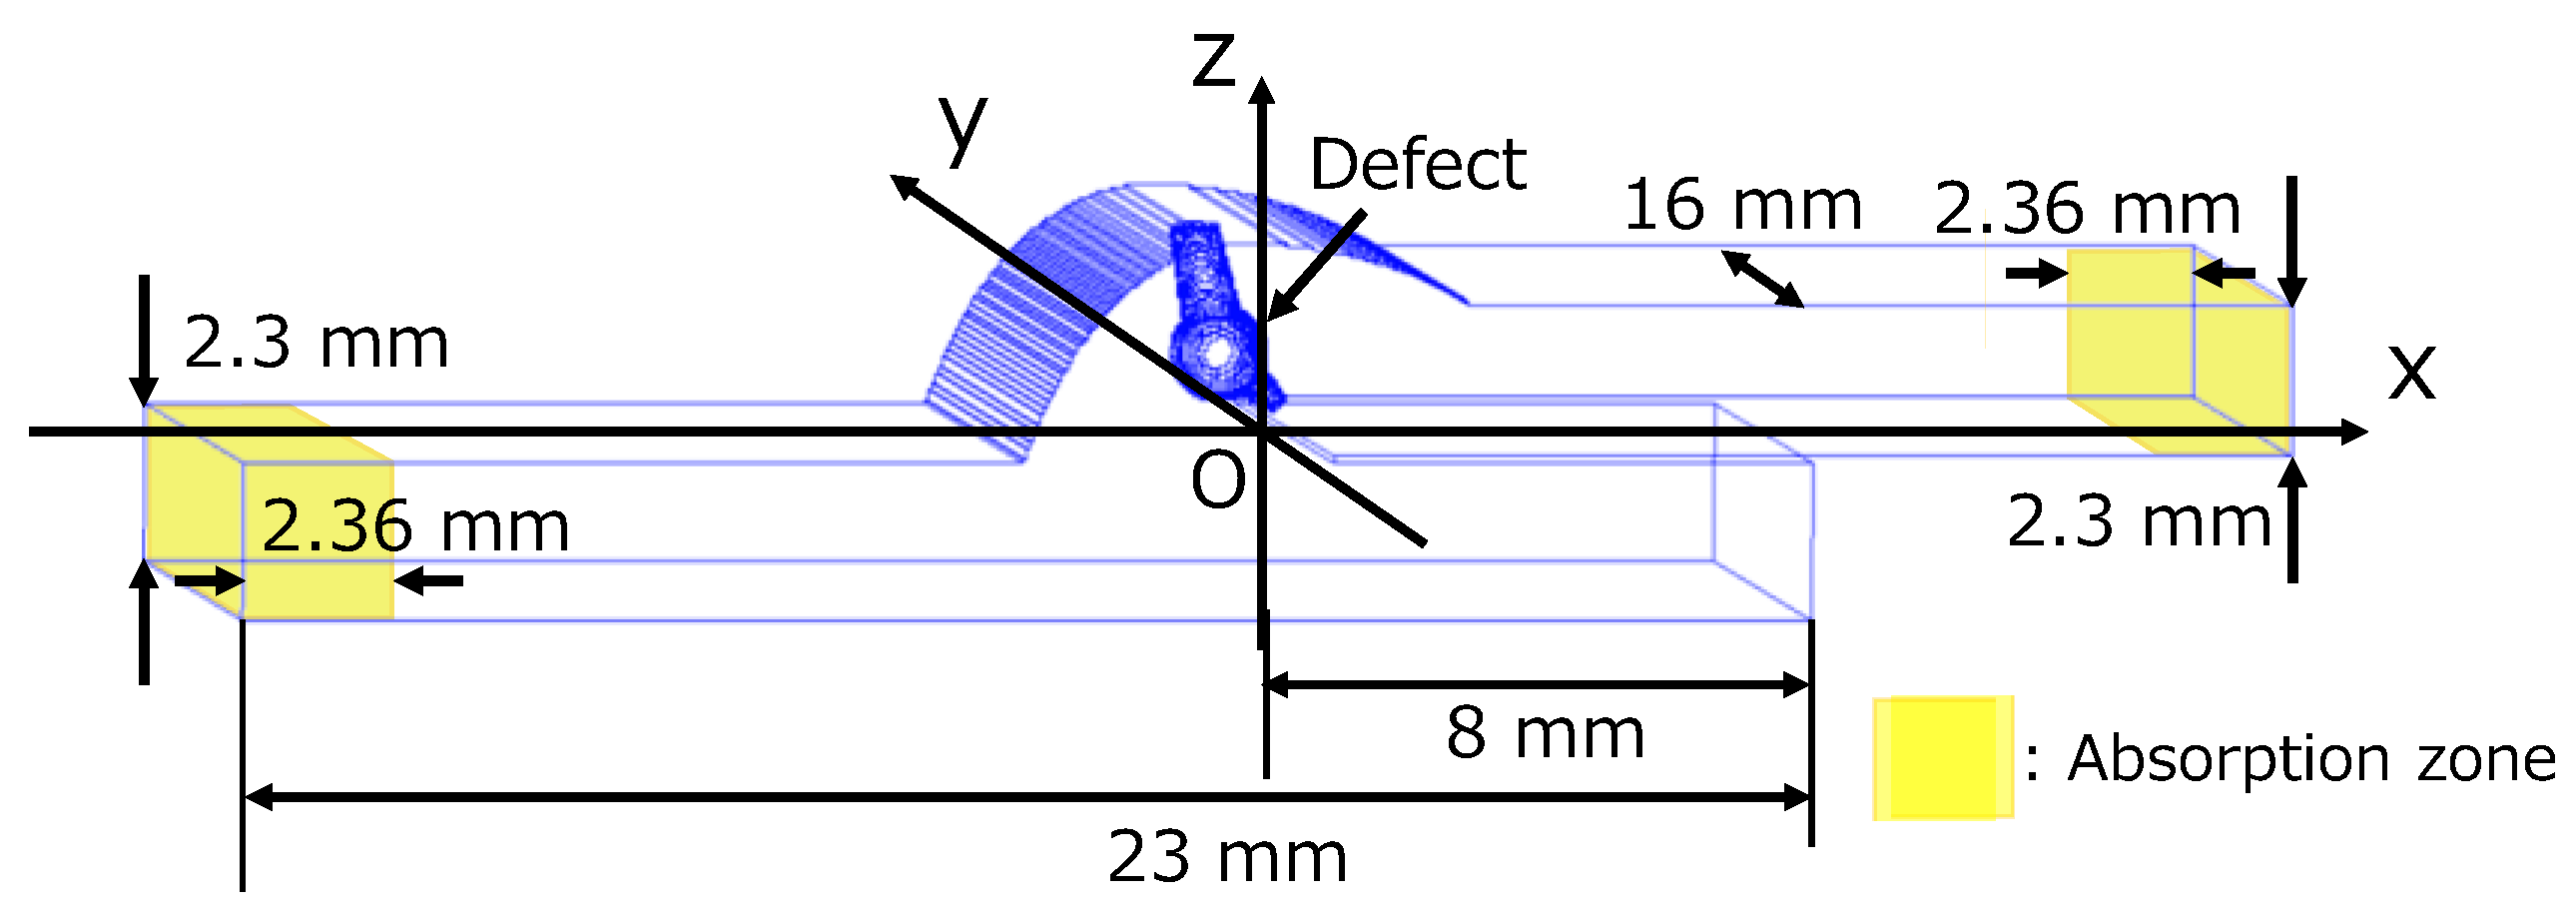
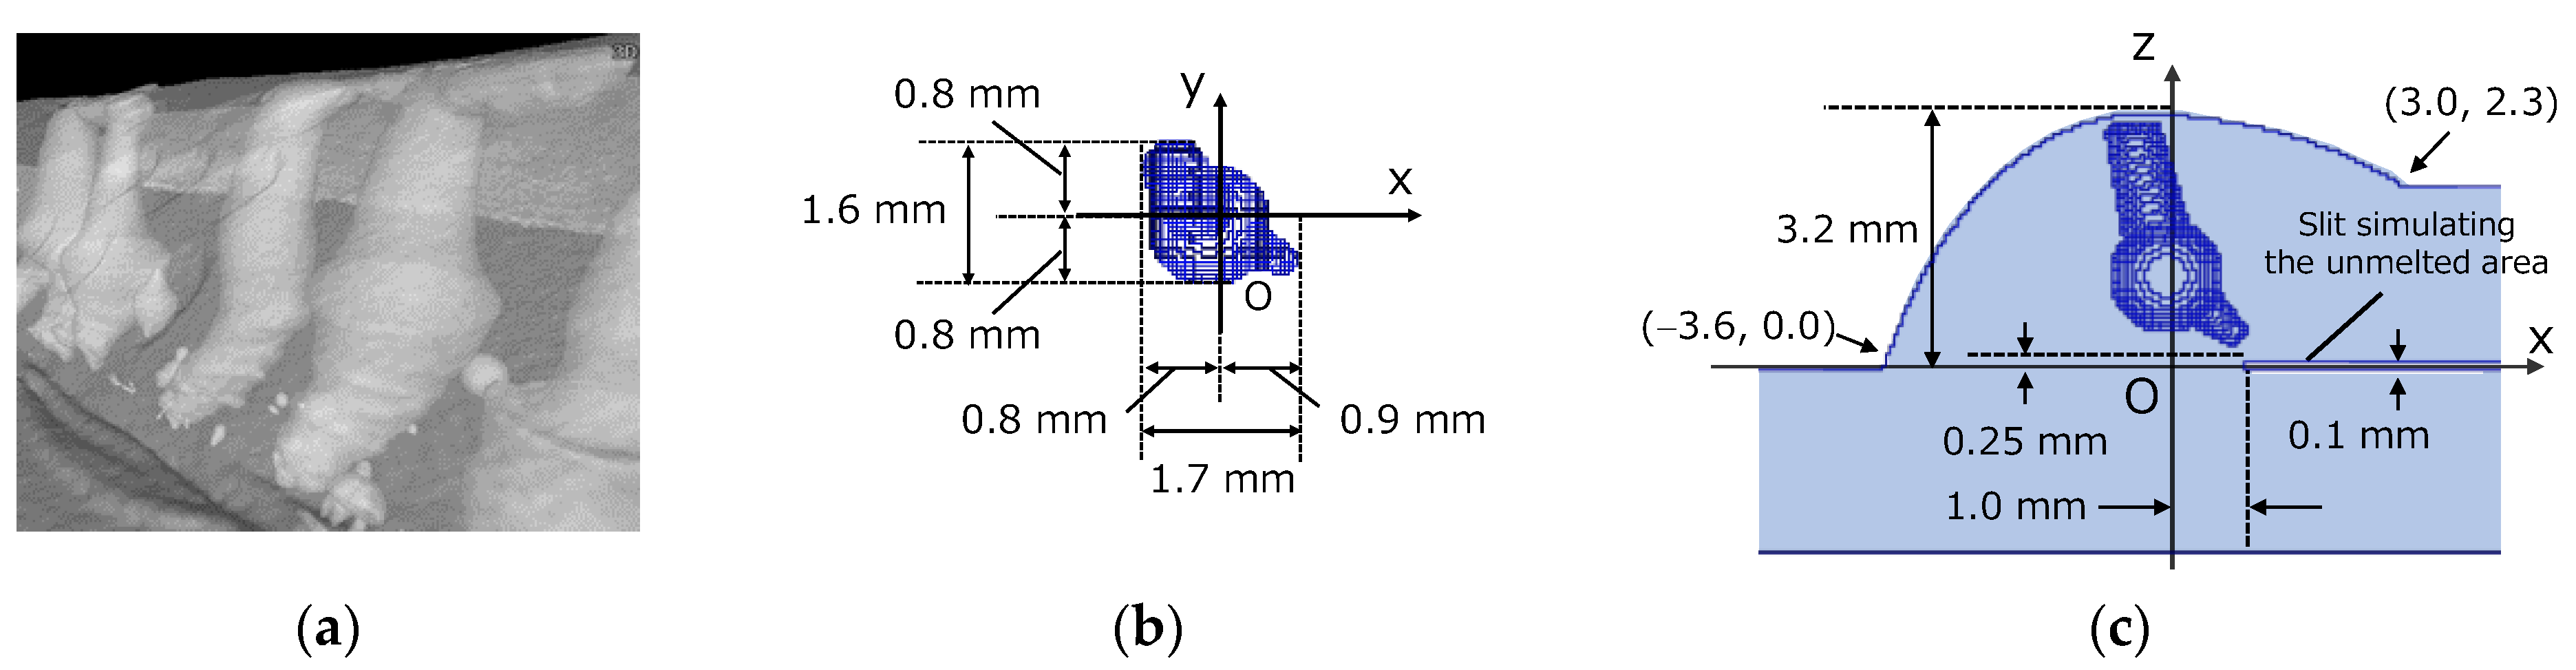
Analysis Conditions
4. Result and Discussion
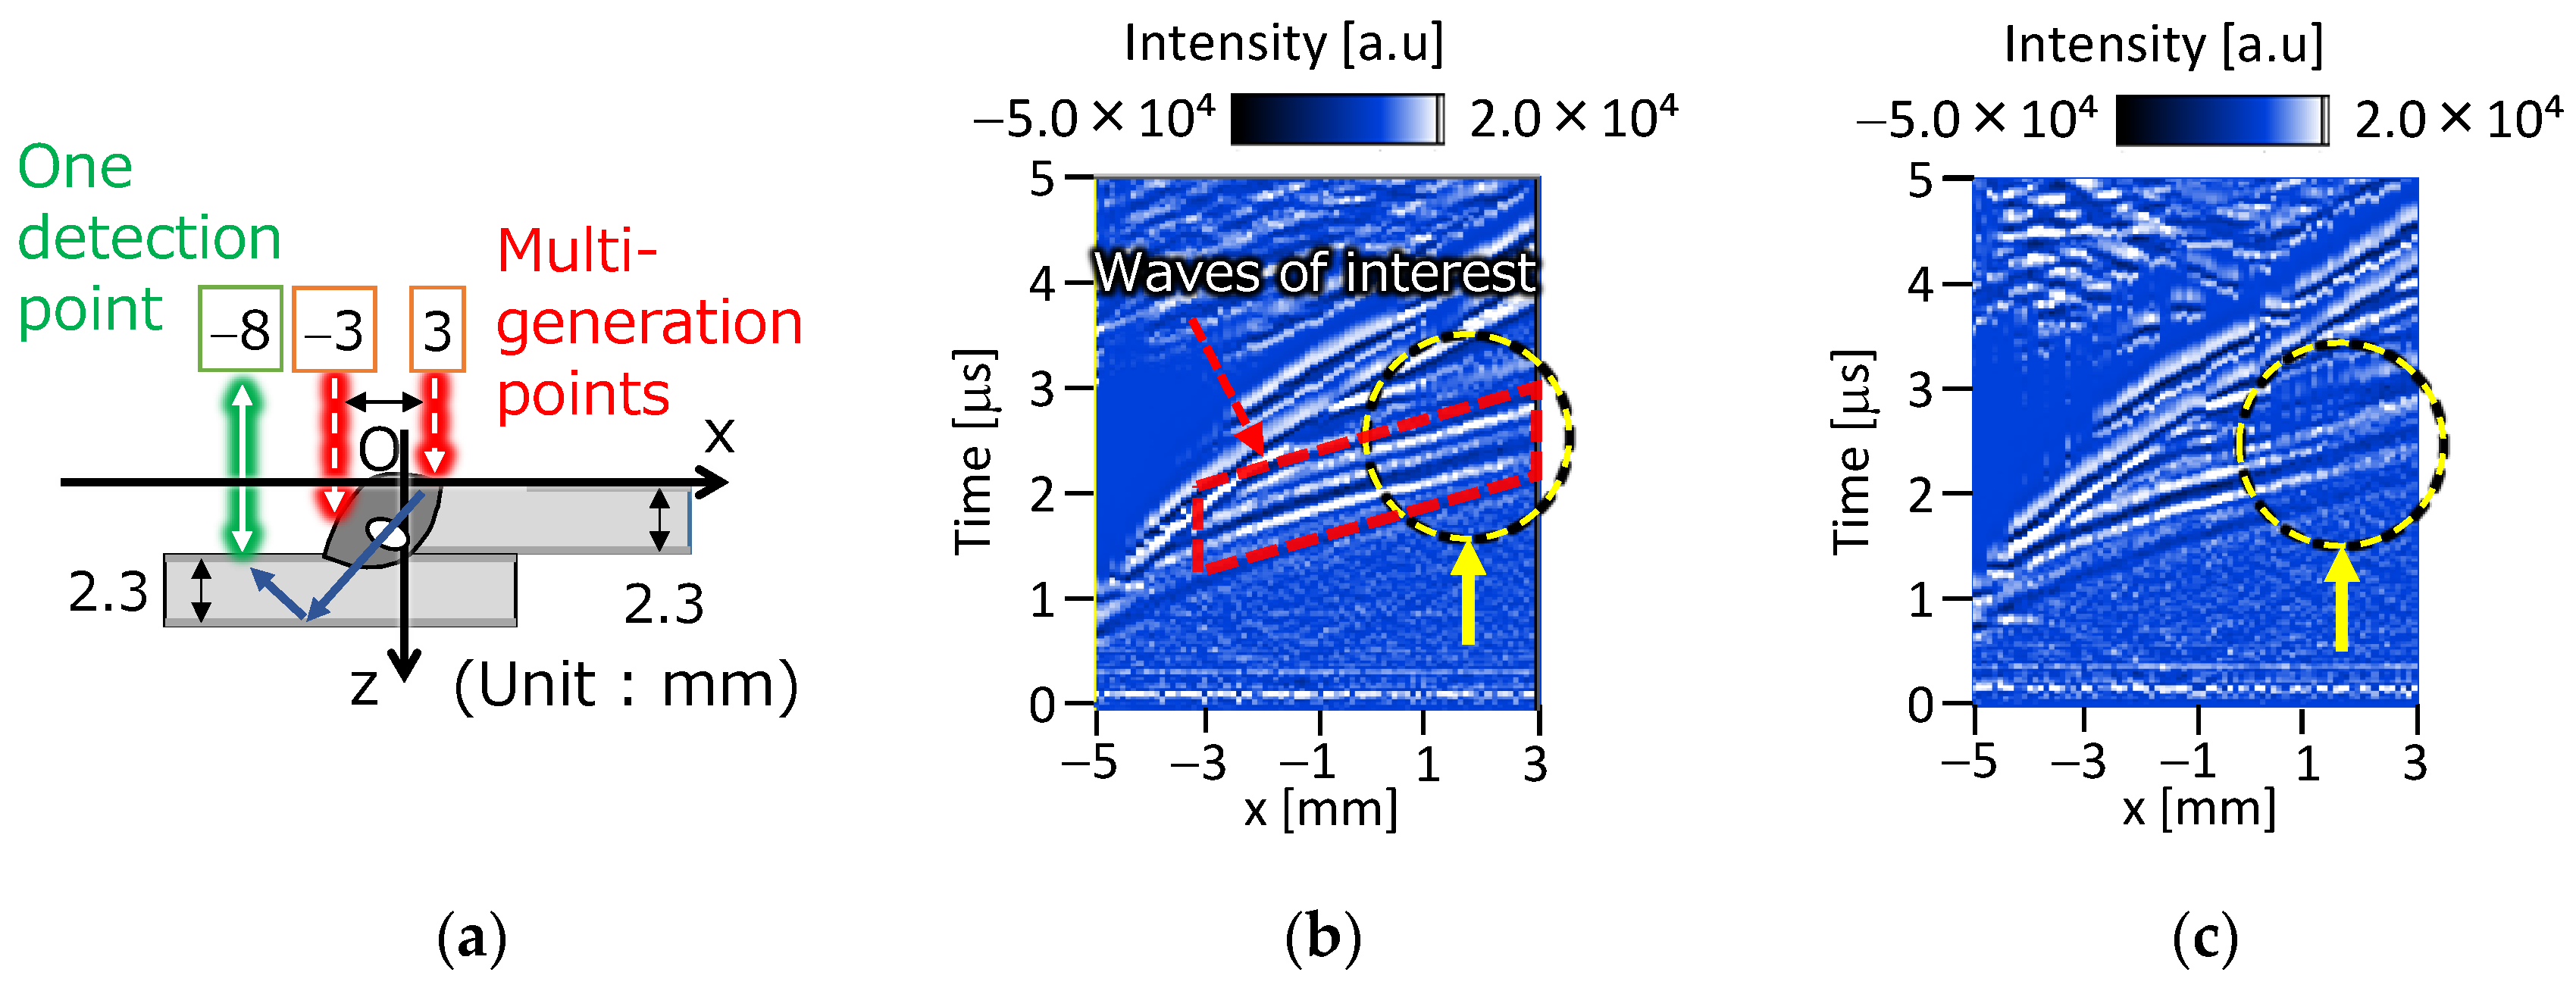
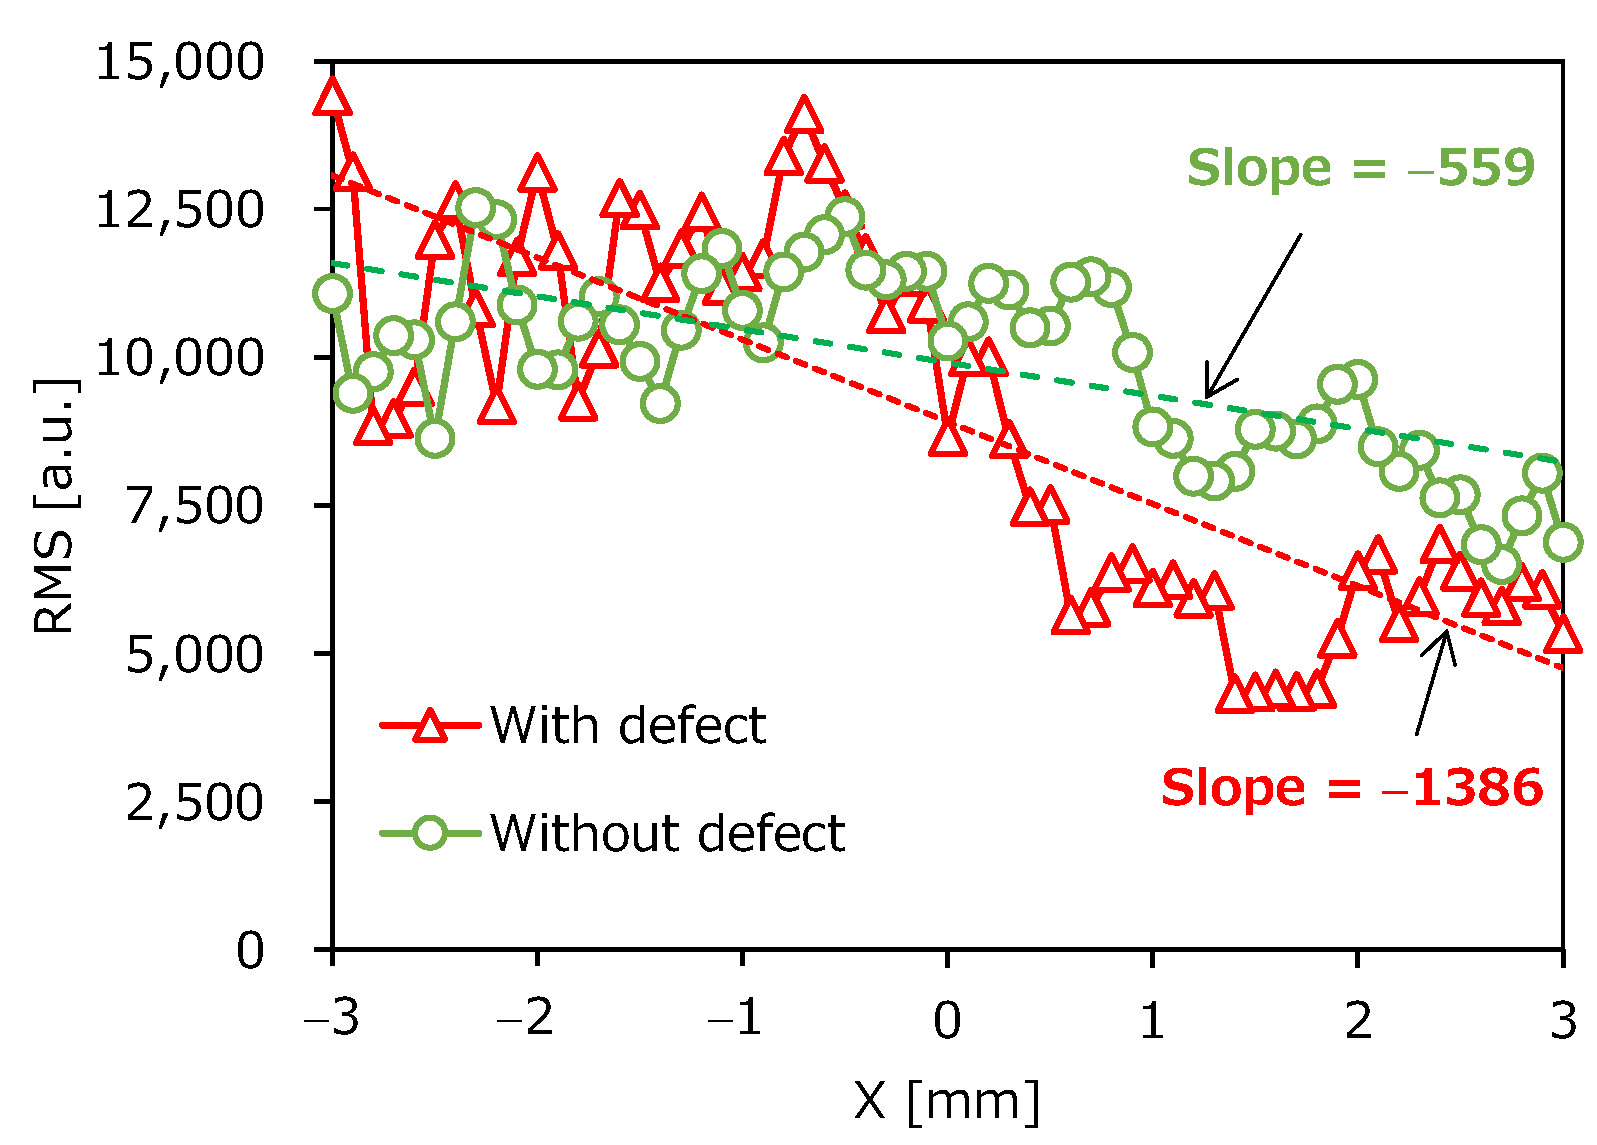
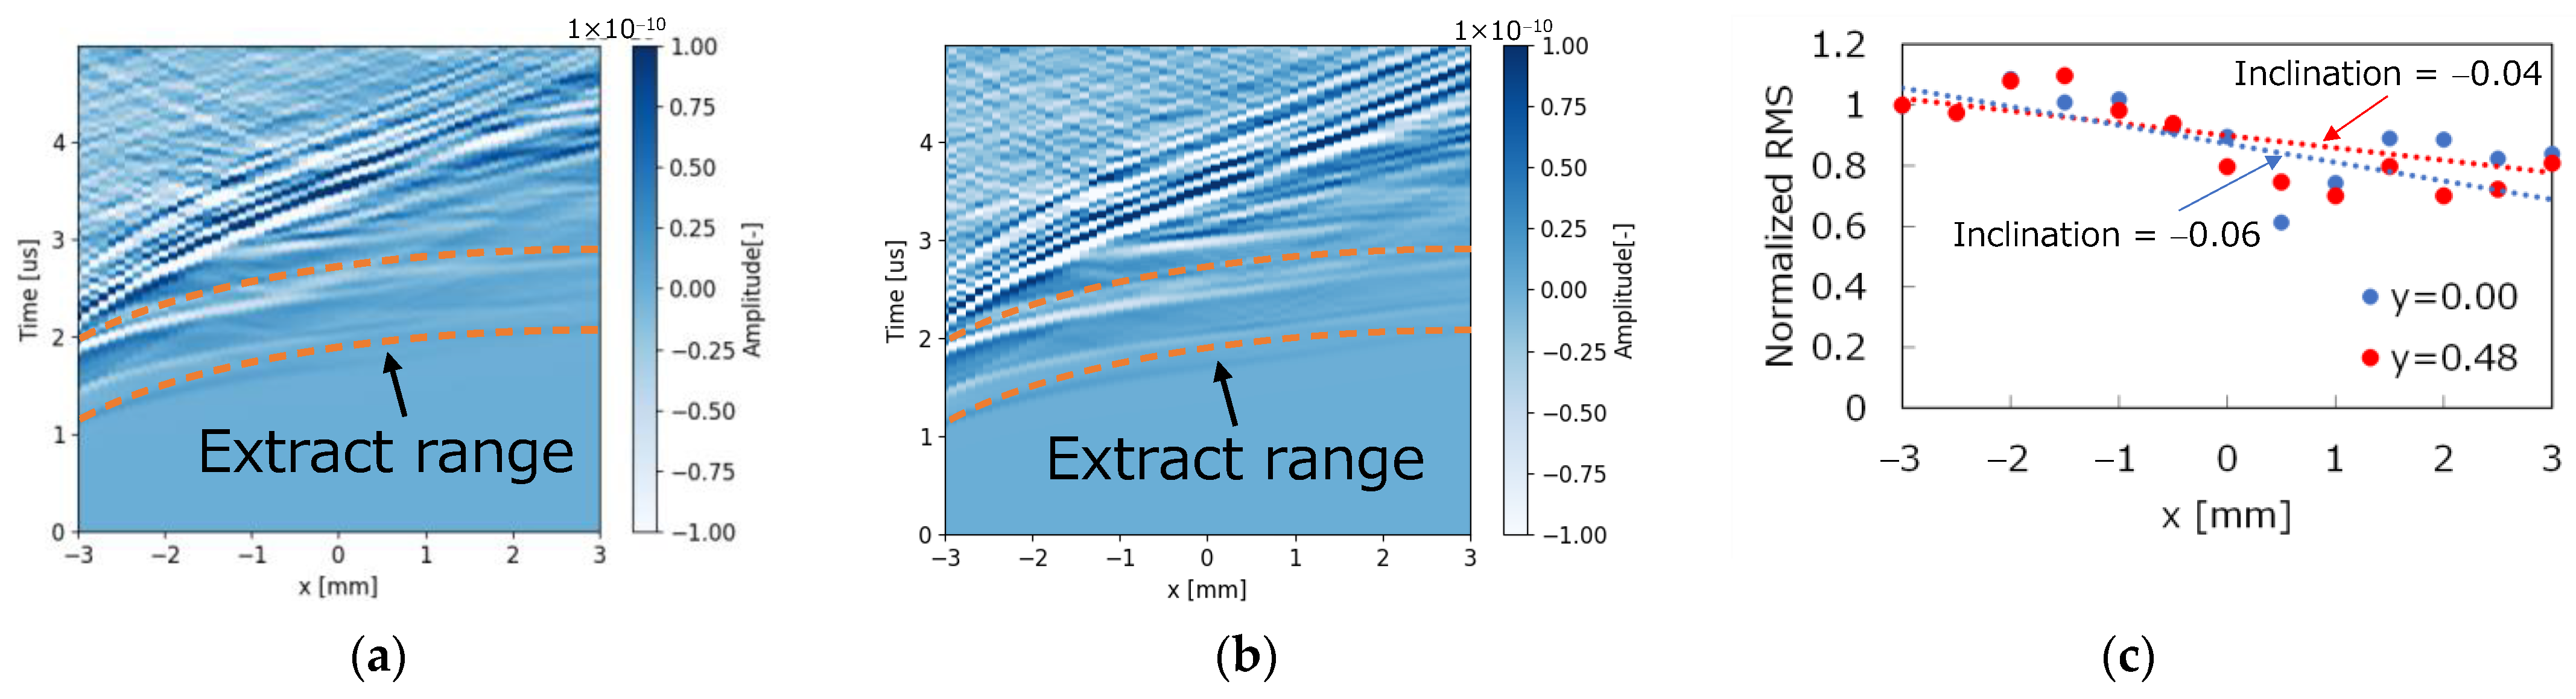
4.1. Data Processing
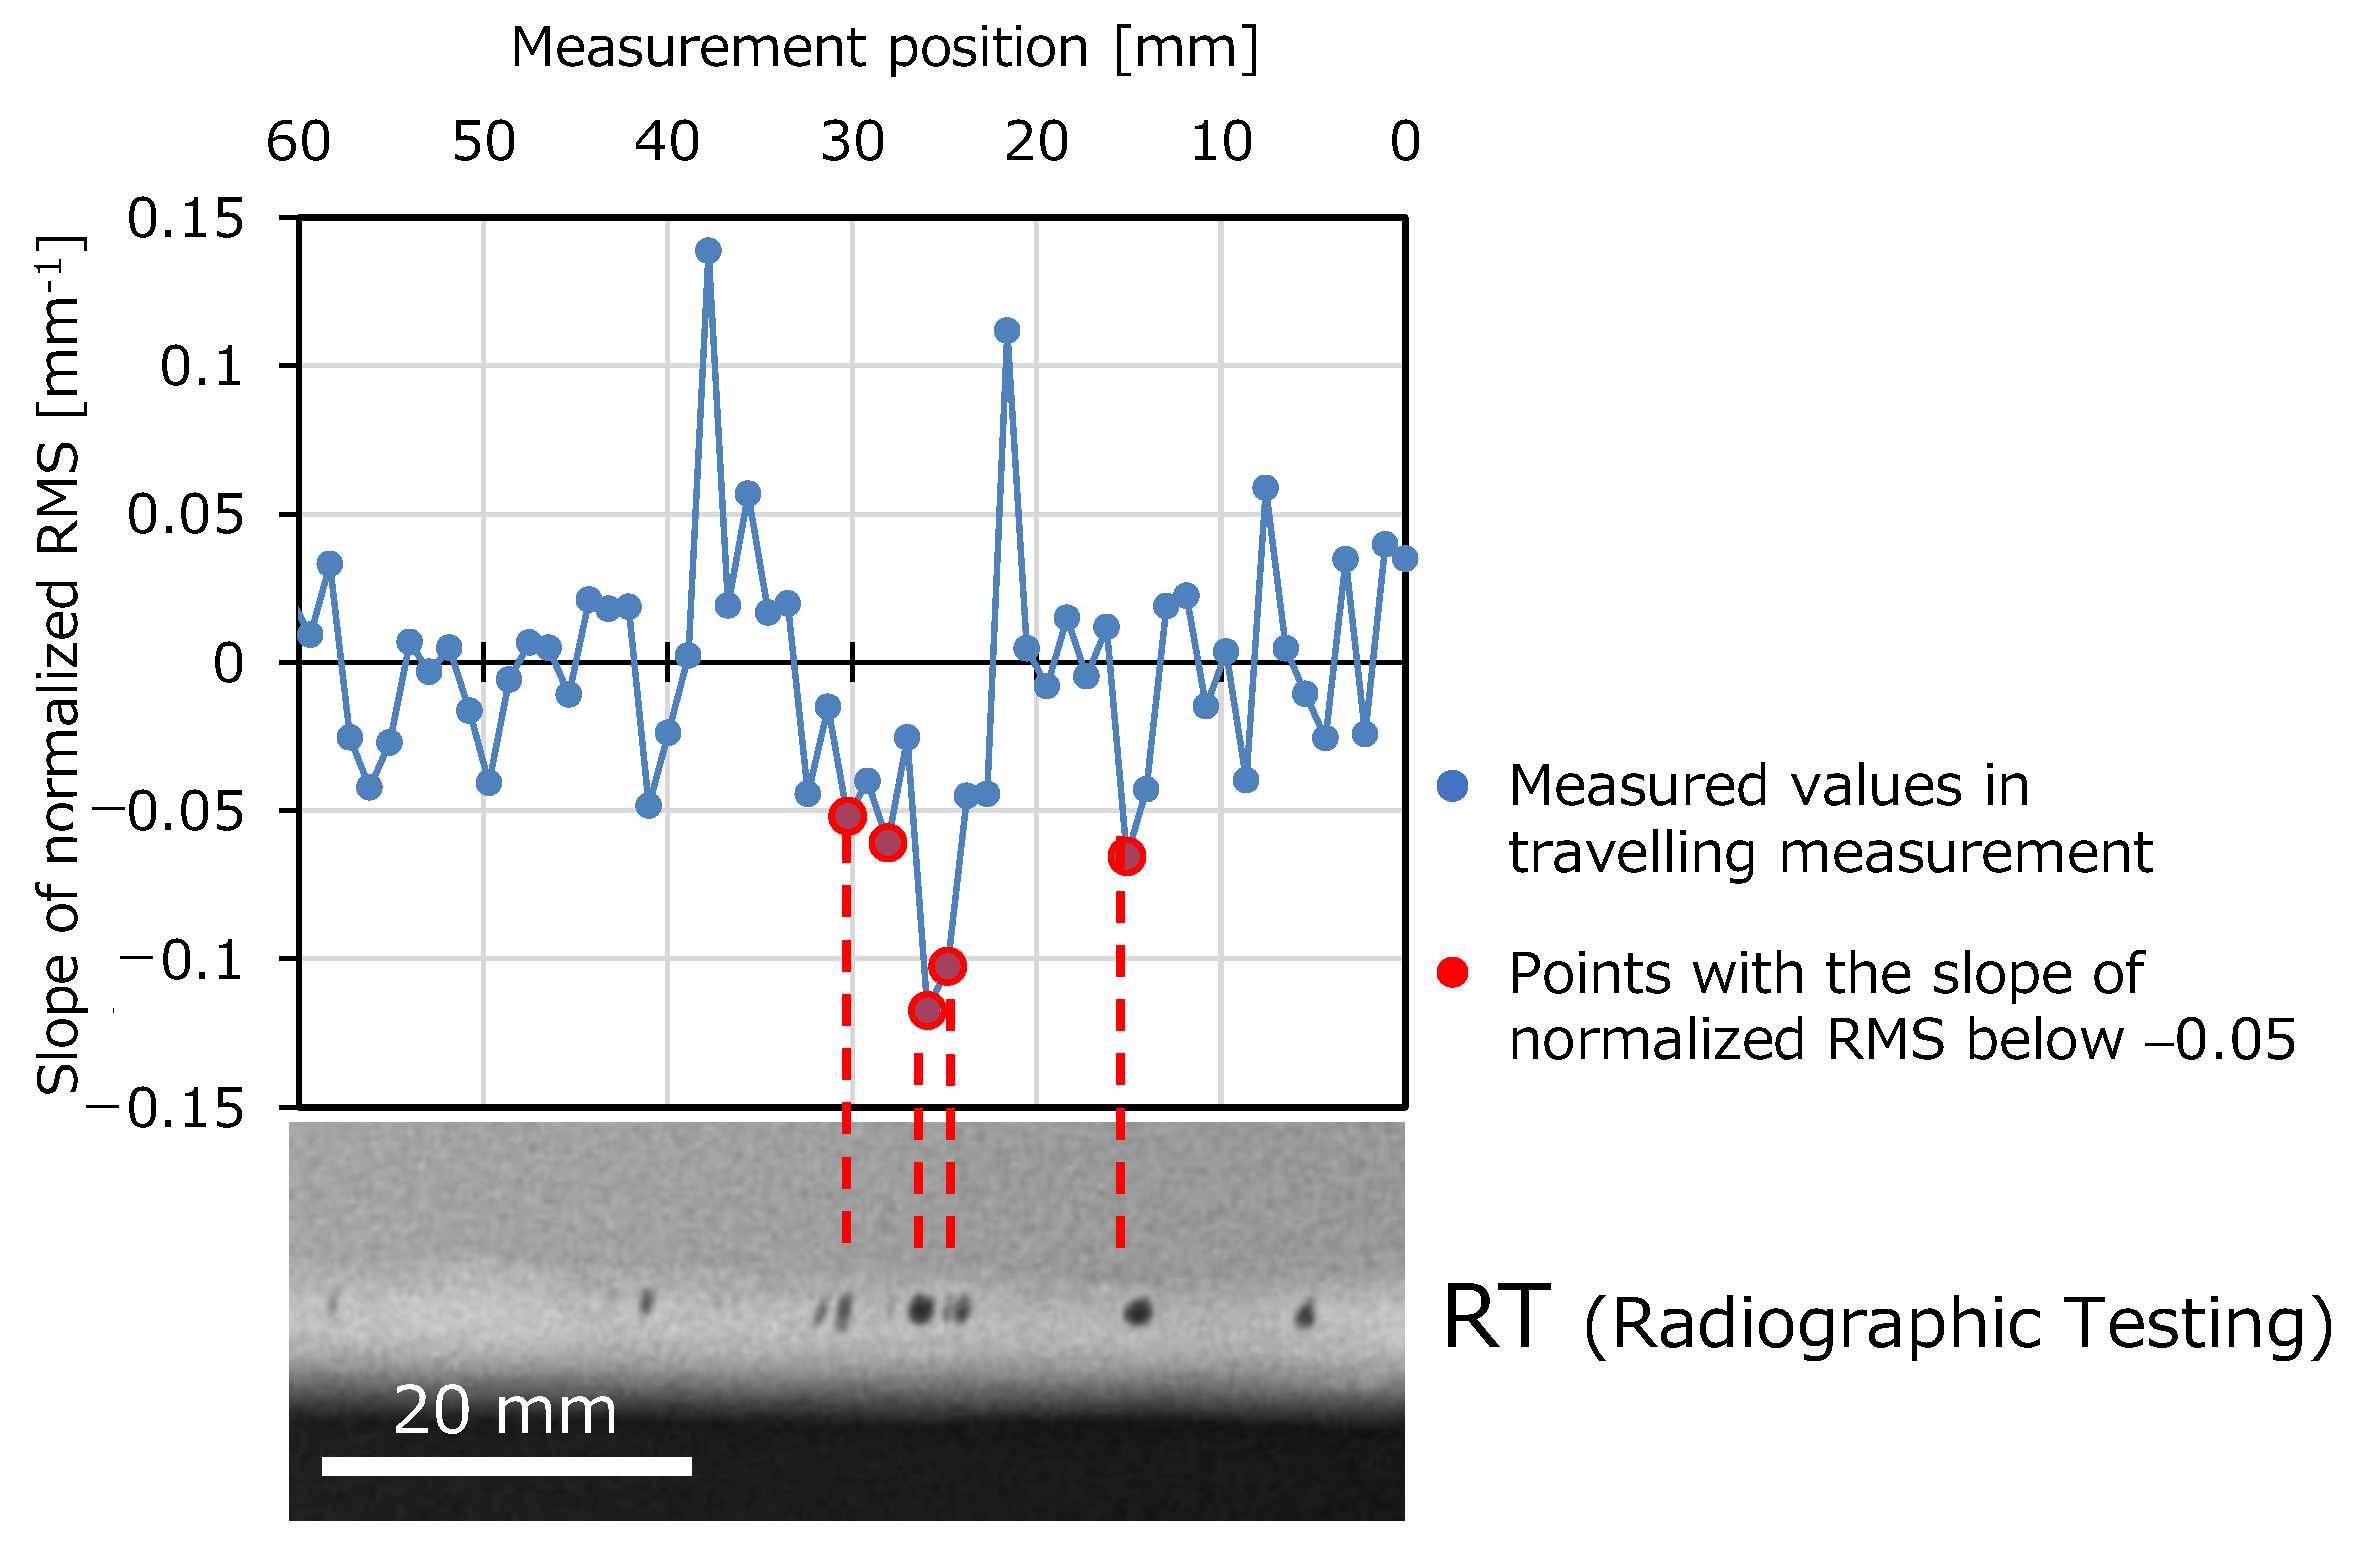
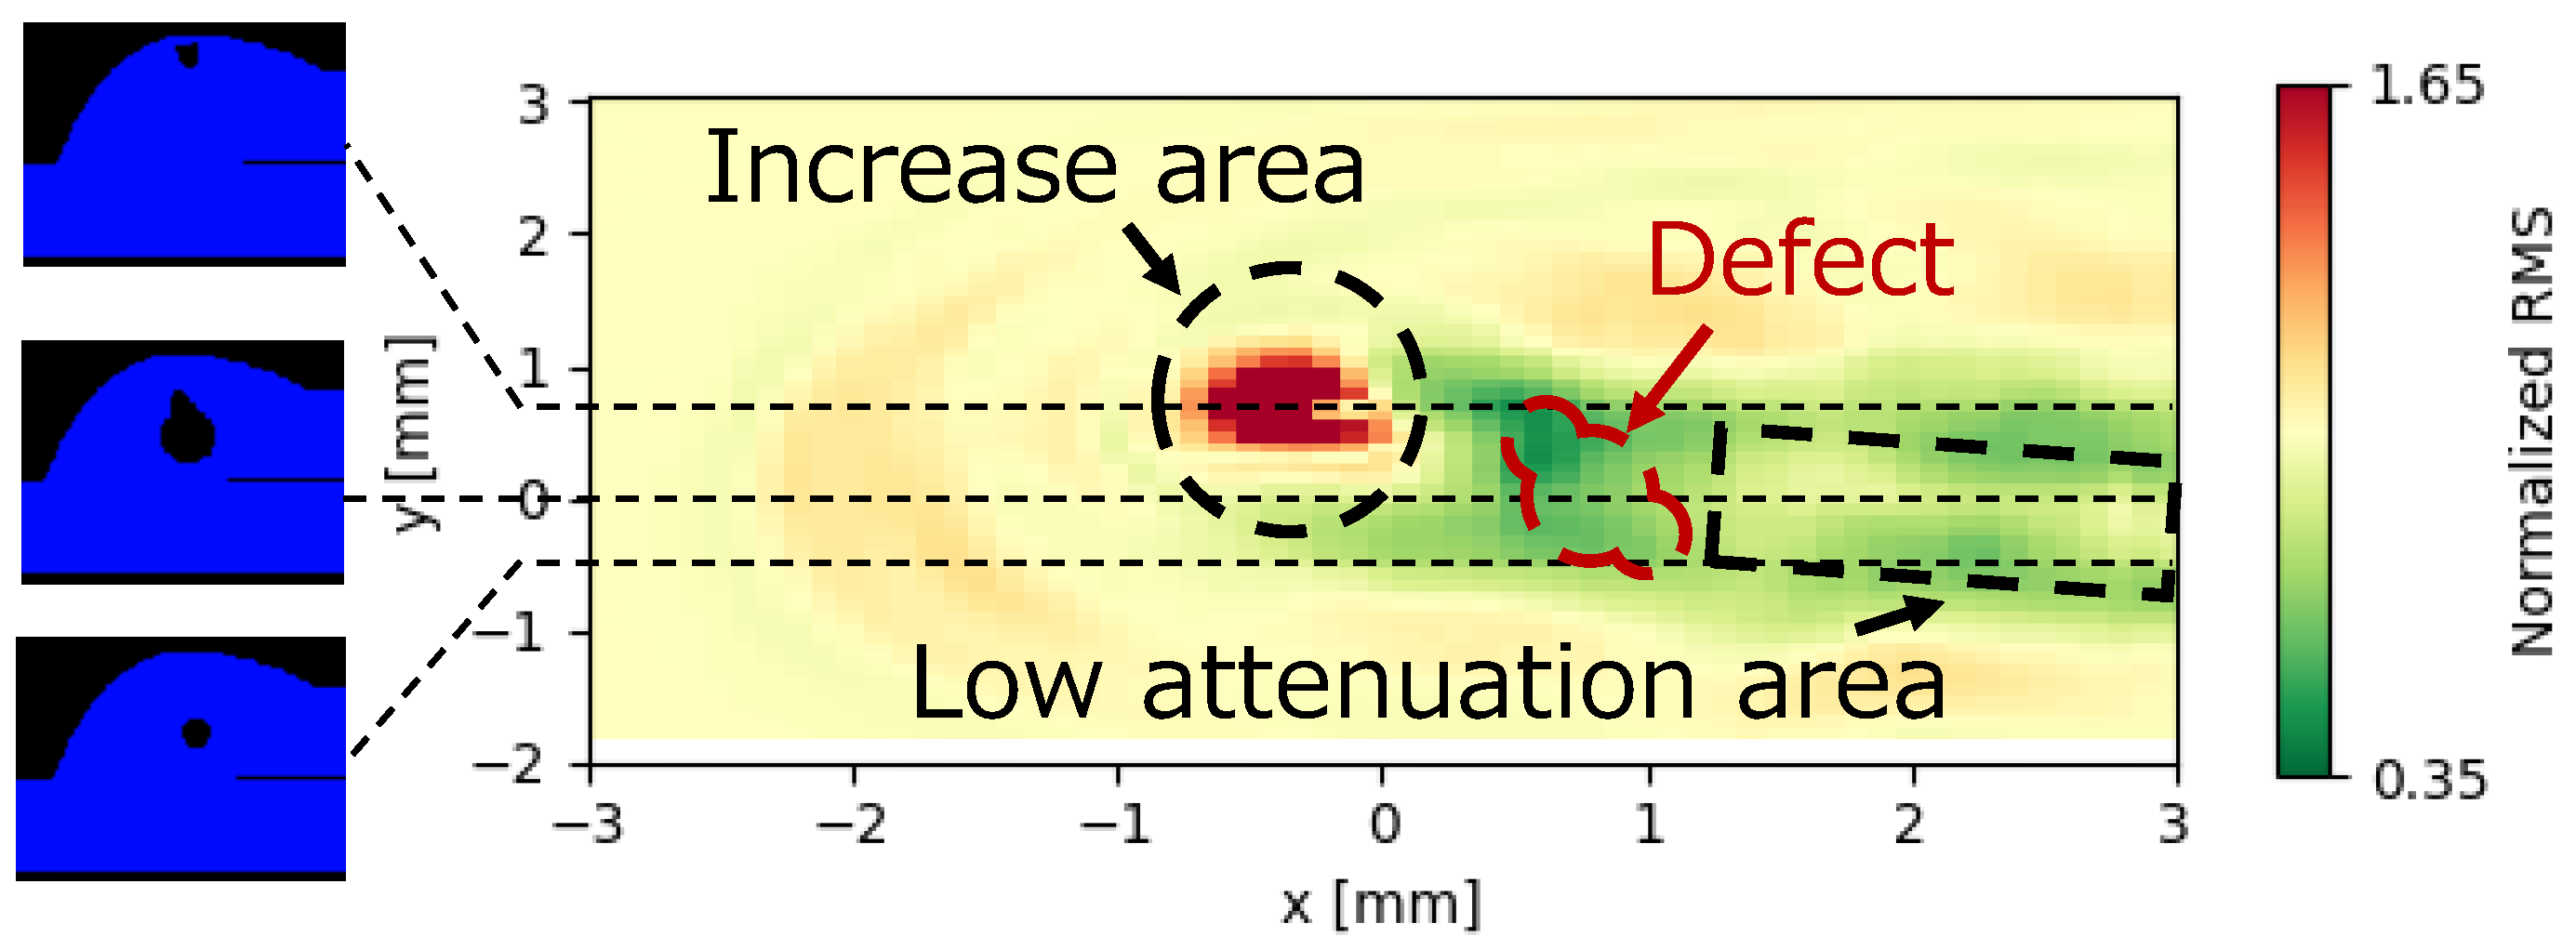
4.2. Measurement with Traveling
4.3. Discussion
5. Conclusions
Author Contributions
Funding
Data Availability Statement
Acknowledgments
Conflicts of Interest
References
- Toyoda, M. Brittle Fracture Strength and Fracture Toughness Evaluation of Welds. J. Jpn. Weld. Soc. 1993, 62, 603–616. [Google Scholar] [CrossRef]
- Matsui, H. Arc Welding of Galvanized Steel Sheets. J. Jpn. Weld. Soc. 1997, 66, 423–427. [Google Scholar] [CrossRef]
- Kato, K. The Most Up-to-Date Radiographic Examination Technology. J. Jpn. Weld. Soc. 2001, 70, 646–649. [Google Scholar] [CrossRef]
- Jen, C.-K.; Cao, B.; Nguyen, K.T.; Loong, C.A.; Legoux, J.-G. On-Line Ultrasonic Monitoring of a Die-Casting Process Using Buffer Rods. Ultrasonics 1997, 35, 335–344. [Google Scholar] [CrossRef]
- Hernandez-Valle, F.; Dixon, S. Initial Tests for Designing a High Temperature EMAT with Pulsed Electromagnet. NDT E Int. 2010, 43, 171–175. [Google Scholar] [CrossRef]
- Gan, T.H.; Hutchins, D.A. Air-Coupled Ultrasonic Tomographic Imaging of High-Temperature Flames. IEEE Trans. Ultrason. Ferroelectr. Freq. Control 2003, 50, 1214–1218. [Google Scholar] [CrossRef] [PubMed]
- Drain, L.E. Laser Ultrasonics Techniques and Applications, 1st ed.; Routledge: Oxfordshire, UK, 2019. [Google Scholar]
- Ochiai, M.; Butsuen, T.; Miura, T.; Kuroda, H.; Soramoto, S.; Kanemoto, S. Sizing of Micro Cracks Using Laser-induced Broad-band Surface Waves. J. Nucl. Sci. Technol. 2001, 43, 275–281. [Google Scholar] [CrossRef]
- Yamamoto, S.; Hoshi, T.; Miura, T.; Semboshi, J.; Ochiai, M.; Fujita, Y.; Ogawa, T.; Asai, S. Defect Detection in Thick Weld Structure Using Welding In-Process Laser Ultrasonic Testing System. Mater. Trans. 2014, 55, 998–1002. [Google Scholar] [CrossRef]
- Tanaka, T.; Izawa, Y. Noncontact Detection of Internal Defects in Carbon Steel by Laser Ultrasonics. Rev. Laser Eng. 2002, 30, 140–145. [Google Scholar] [CrossRef]
- Bustamante, L.; Jeyaprakash, N.; Yang, C.-H. Hybrid Laser and Air-Coupled Ultrasonic Defect Detection of Aluminium and CFRP Plates by Means of Lamb Mode. Results Phys. 2020, 19, 103438. [Google Scholar] [CrossRef]
- Zeng, W.; Ming Cai, F.; Wang, F.; Miao, L.; You, F.; Yao, F. Finite Element Simulation of Laser-Generated Ultrasonic Waves for Quantitative Detection of Internal Defects in Welds. Optik 2020, 221, 165361. [Google Scholar] [CrossRef]
- Jon, S.; So, J.; He, N.; Sok, K.; Choe, L.; Kim, K.; So, S. An Application of Optical Fiber Fizeau Interferometer to the Detection of Internal and Surface Defects in Metal. Chem. Phys. Lett. 2019, 725, 8–13. [Google Scholar] [CrossRef]
- Hong, S.-C.; Abetew, A.-D.; Lee, J.-R.; Ihn, J.-B. Three Dimensional Evaluation of Aluminum Plates with Wall-Thinning by Full-Field Pulse-Echo Laser Ultrasound. Opt. Lasers Eng. 2017, 99, 58–65. [Google Scholar] [CrossRef]
- Li, Y.; Hou, S.; Chai, Y.; Zhou, Y.; Zou, Y. Nondestructive Measurement of the Grain Size of Laser Cladding Coatings Using a Laser Ultrasonic Method. Appl. Opt. AO 2022, 61, 1885–1891. [Google Scholar] [CrossRef] [PubMed]
- Garcin, T.; Schmitt, J.H.; Militzer, M. In-Situ Laser Ultrasonic Grain Size Measurement in Superalloy INCONEL 718. J. Alloys Compd. 2016, 670, 329–336. [Google Scholar] [CrossRef]
- Nomura, K.; Matsuida, T.; Kadota, K.; Era, T.; Asai, S. Study on Blowhole Detection in Fillet Welded Sheet of Lap Joint by Laser Ultrasonic Technique. Q. J. Jpn. Weld. Soc. 2023, 41, 141–149. [Google Scholar] [CrossRef]
- Kadota, K.; Matsuida, T.; Nomura, K.; Era, T.; Asai, S. In-Line Detection of Internal Defects for Lap Joint Welding of Galvanized Steel Sheet by Laser Ultrasonic Technique. In Proceedings of the IIW International Conference on Welding and Joining, Tokyo, Japan, 17–18 July 2022; pp. 192–195. [Google Scholar]
- Ikegami, Y.; Sakai, Y.; Nakamura, H. A Highly Accurate Ultrasonic Simulator Capable of Over One Billion Elements for Non-Destructive Evaluations. e-J. Nondestruct. Test. 2010, 15, 177–190. [Google Scholar]
- Otani, T. Arc Weldability of Zinc Coated Steel Sheets. Weld. Int. 1999, 13, 527–535. [Google Scholar] [CrossRef]
- Murray, T.W.; Wagner, J.W. Laser Generation of Acoustic Waves in the Ablative Regime. J. Appl. Phys. 1999, 85, 2031–2040. [Google Scholar] [CrossRef]


Disclaimer/Publisher’s Note: The statements, opinions and data contained in all publications are solely those of the individual author(s) and contributor(s) and not of MDPI and/or the editor(s). MDPI and/or the editor(s) disclaim responsibility for any injury to people or property resulting from any ideas, methods, instructions or products referred to in the content. |
© 2023 by the authors. Licensee MDPI, Basel, Switzerland. This article is an open access article distributed under the terms and conditions of the Creative Commons Attribution (CC BY) license (https://creativecommons.org/licenses/by/4.0/).
Share and Cite
Okuyama, N.; Nomura, K.; Sano, T.; Kadota, K.; Nitta, S.; Era, T.; Asai, S. Study on Detecting Method of Internal Defects by Laser Ultrasonics in Lap Joint Welding of Galvanized Steel Sheet and Finite Element Analysis of Its Detectability. Appl. Sci. 2023, 13, 11515. https://doi.org/10.3390/app132011515
Okuyama N, Nomura K, Sano T, Kadota K, Nitta S, Era T, Asai S. Study on Detecting Method of Internal Defects by Laser Ultrasonics in Lap Joint Welding of Galvanized Steel Sheet and Finite Element Analysis of Its Detectability. Applied Sciences. 2023; 13(20):11515. https://doi.org/10.3390/app132011515
Chicago/Turabian StyleOkuyama, Norimitsu, Kazufumi Nomura, Tomokazu Sano, Keiji Kadota, Seiya Nitta, Tetsuo Era, and Satoru Asai. 2023. "Study on Detecting Method of Internal Defects by Laser Ultrasonics in Lap Joint Welding of Galvanized Steel Sheet and Finite Element Analysis of Its Detectability" Applied Sciences 13, no. 20: 11515. https://doi.org/10.3390/app132011515