Communication

Development and Validation of a Prediction Model for Differentiation of Benign and Malignant Fat-Poor Renal Tumors Using CT Radiomics

1
Department of Urology, Seoul St. Mary’s Hospital, College of Medicine, The Catholic University of Korea, Seoul 06591, Republic of Korea
2
Department of Brain and Cognitive Science, Seoul National University, Seoul 08825, Republic of Korea
3
Department of Radiology, Seoul St. Mary’s Hospital, College of Medicine, The Catholic University of Korea, Seoul 06591, Republic of Korea
4
Department of Radiology, Eunpyung St. Mary’s Hospital, College of Medicine, The Catholic University of Korea, Seoul 06591, Republic of Korea
5
Department of Psychology, Seoul National University, Seoul 08826, Republic of Korea
6
Department of Pathology, Seoul St. Mary’s Hospital, College of Medicine, The Catholic University of Korea, Seoul 06591, Republic of Korea
*
Authors to whom correspondence should be addressed.
These authors contributed equally to this work.
Appl. Sci. 2023, 13(20), 11345; https://doi.org/10.3390/app132011345
Submission received: 18 August 2023 / Revised: 25 September 2023 / Accepted: 13 October 2023 / Published: 16 October 2023
(This article belongs to the Special Issue Advanced Medical Imaging Technologies and Applications)

Abstract

:
Objectives: To develop and validate a machine learning-based CT radiomics classification model for distinguishing benign renal tumors from malignant renal tumors. Methods: We reviewed 499 patients who underwent nephrectomy for solid renal tumors at our institution between 2003 and 2021. In this retrospective study, patients who had undergone a computed tomography (CT) scan within 3 months before surgery were included. We randomly divided the dataset in a stratified manner as follows: 75% as the training set and 25% as the test set. By using various feature selection methods and a dimensionality reduction method exclusively for the training set, we selected 160 radiomic features out of 1,288 radiomic features to classify malignant renal tumors. Results: The training set included 396 patients, and the test set included 103 patients. The percentage of extracted radiomic features from patients was 32% (385/1218) after the reproducibility test. In terms of the average Area Under the Receiver Operating Characteristic Curve (AU-ROC) and the average Area Under the Precision-Recall Curve (AU-PRC), the Random Forest model achieved better performance (AU-ROC = 0.725; AU-PRC = 0.899). An average accuracy of 0.778 was obtained on evaluation with the hold-out test set. At the optimal threshold, the Random Forest model showed an F1 score of 0.746, precision of 0.862, sensitivity of 0.657, specificity of 0.651, and Negative Predictive Value (NPV) of 0.364. Conclusions: Our machine learning-based CT radiomics classification model performed well for the independent test set, indicating that it could be a useful tool for discriminating between malignant and benign solid renal tumors.

1. Introduction

Kidney cancer is a disease that can be treated relatively easily if detected in its early stages, such as T1a (<4 cm), but the survival rate decreases as the disease progresses [1,2]. Therefore, rapid and accurate diagnosis is very important in the treatment of kidney cancer; however, it is not easy. It is particularly difficult to accurately predict the type and subtype of the lesion when the renal mass is small. Recent developments in radiologic modalities have improved the diagnosis, thus leading to an increase in the prevalence of kidney cancer [3]. However, discrimination for a small renal tumor is difficult. In particular, since the kidneys are covered by Gerota’s fascia, it is unreasonable to perform a biopsy immediately if a small neoplasm is detected. This is because if this small neoplasm is malignant, the Gerota’s fascia is opened, and cancer cells that leak during the biopsy may metastasize [4].
It is more difficult to differentiate between small renal tumors, particularly fat-poor tumors. If there is a large fat component, we can consider benign diseases, such as angiomyolipoma (AML), but it is very difficult to differentiate this disease entity from early-stage tumors with a small proportion of fat. It is obvious that other attempts and approaches are needed to overcome these limitations [5].
Differential diagnosis through computed tomography (CT), which was solely dependent on the radiologist, has recently entered a new phase with the advent of artificial intelligence (AI) technology. Recent radiologic analysis using AI has potential [6,7]. We have glimpsed this possibility, and hence, we have already attempted to diagnose small renal tumors using a convolutional neural network (CNN) model [8]. Rapid advancements in AI research have allowed us to access a technology called radiomics. By relying on this new technology that can extract data from areas that humans cannot access, we once again attempted to diagnose small, fat-poor tumors.

2. Methods

2.1. Patients

We used data from patients who underwent total and partial nephrectomy at a single institution between 2003 and 2021. Cases of clear cell carcinoma and AML, typically with a fat component of more than 30%, were excluded. Of these, only patients with fat-poor tumors were selected; thus, a total of 499 patients were selected. The CT used on the patient may have differed depending on the year, but it was taken using the same protocol from the same company. (SOMATOM DEFINITION AS+, Siemens, Germany) The mean age of patients was 56.02 ± 12.18 years, and the mean size of the tumor on CT was 3.515 ± 2.42 cm. Patients with benign tumors, such as oncocytoma and AML, were included, and among malignant tumors, patients with clear cell, chromophobe, and papillary type renal cell carcinoma (RCC) were included. Each patient’s CT consists of one to four phases, and 1548 sets of CT images were acquired in this manner. The composition of patients is summarized in Table 1. CT configurations were obtained in non-contrast, arterial (20–30 s after contrast injection), portal (60–70 s), and delayed (>180 s) phases. We collected voxel-level segmentation labels for each CT scan, where trained annotators manually delineated the kidneys and tumors in the images, and then a radiologist (with an experience of 11 years) refined the annotations. If the radiologist was adequately confident in the first diagnosis, a second diagnosis was not established. The performance of radiologists was assessed using the first diagnosis (top-1 performance) along with both the first and second diagnoses (top-2 performance).
We used a paired sample t-test or a chi-squared test to test the differences in demographic and pathological characteristics of continuous variables (i.e., age and cancer size) and categorical variables (i.e., sex, kidney cancer, and kidney cancer subtype).

2.2. Radiomics Workflow

Radiomics is a quantitative approach for extracting textural information from medical imaging, which can be used by machine learning algorithms to aid clinical decision-making. To develop a machine learning-based CT radiomics model that can differentiate between benign and malignant solid renal tumors, we started by extracting various types of radiomic features from each CT scan. Then, we randomly divided the dataset in a stratified manner as follows: 75% as the training set and 25% as the test set. In the case of developing a machine learning model for multi-phase CT radiomic features, only those participants with single-phase and two-phase CT scans were assigned to the test set. Only the training set was used for feature selection and model training with 10-fold cross-validation. We tested the following four most popular machine learning algorithms: Linear Support Vector Machine (Linear SVM), Radial basis function Support Vector Machine (Rbf SVM), Random Forest, and XGBoost [9]. We conducted hyperparameter tuning through 200 trials of random hyperparameter search for classification of malignant kidney cancer with optuna (version 3.1.0) [10]. The relevant codes are freely available for reproducibility (https://github.com/Transconnectome/Kidney_Radiomics accessed on 30 August 2023). Given the case-control imbalance as a result of a larger number of patients diagnosed with malignant kidney tumors than the number of patients diagnosed with benign kidney tumors, as well as a higher proportion of patients having a specific kidney cancer subtype (i.e., clear cell renal cell carcinoma) than the proportion of those having other subtypes, we implemented the Synthetic Minority Over-sampling Technique (SMOTE) with imbalanced-learn (version 0.10.1) [11] during the model evaluation-based feature selection and development phases. The hold-out test set was only used for evaluating the final performance. Feature selection, machine learning model development, and model evaluation processes were implemented along with scikit-learn (version 1.2.1) [12] using Python 3.10.8.

2.3. Radiomics Feature Extraction and Feature Selection

After resampling each phase of the CT scan with a resolution of 1 mm × 1 mm × 1 mm, 1288 radiomic features from 1548 CT scans were extracted from the segmented regions of interest (ROIs) in the original CT scans, wavelet-filtered CT scans, and Laplacian of Gaussian-filtered scans by using the Python package pyradiomics (version 3.1.0) [13] with Python 3.7. The extracted radiomic features included first-order features, three-dimensional shape features, the Gray Level Co-occurrence Matrix (GLCM), the Gray Level Run Length Matrix (GLRM), the Gray Level Size Zone Matrix (GLSZM), the Neighborhood Gray Tone Difference Matrix (NGTDM), and the Gray Level Dependence Matrix (GLDM).
By using various feature selection methods and a dimensionality reduction method exclusively for the training set, we selected 160 radiomic features from 1288 radiomic features to classify malignant renal tumors. First, we conducted the ANOVA F-test for 1288 z-score normalized radiomic features while applying the FDR correction with the Benjamini-Hochberg procedure ( α fdr = 0.05). This method selected 801 features for the classification of malignant renal tumors. Second, we applied model evaluation-based feature selection methods with stratified 10-fold cross-validation. We performed the Principal Component Analysis (PCA) of the selected radiomic features to reduce the overall feature space dimensionality. By evaluating the accuracy of the predictions made by the models in the validation set, we decided to set the number of principal components at 20% of the number of radiomic features selected earlier (160 features) for malignant renal tumor classification. We tested various ratios (0.1, 0.2, and 0.3) of the number of principal components to the total number of radiomic features selected in the earlier feature selection step. Then, we standardized these principal components (i.e., PCA whitening) for further analyses. We also utilized Sequential Feature Selection (SFS) for standardized principal components to select principal components that could maximize the model evaluation performance for the validation set. Through a sequential removal process, the SFS systematically selected the features based on their impact on the model performance for the validation set.

2.4. Ethic Statement, Statistics, and Machine Learning

This study was conducted in accordance with the IRB and the Declaration of Helsinki, and it was approved by the Institutional Review Board of the Catholic University of Korea, Seoul St Mary’s Hospital (Protocol code KC22RISI0753). p < 0.05 was considered statistically significant. Statistical calculations were performed with IBM SPSS statistics, version 24 (IBM Corp., Armonk, NY, USA) software.
We followed the Checklist for Artificial Intelligence in Medical Imaging (CLAIM) [14] to ensure the reproducibility of our study.

3. Results

3.1. Demographic Characteristics of the Patients

A cohort of 499 patients was enrolled, and we divided the patients into training and test datasets, while patients with single-phase and two-phase CT scans were only assigned to the test set. For malignant renal tumor classification, patients were divided based on a stratified approach for malignant renal tumor classification (Ntraining = 396, Ntest = 103) as follows: 75% as the training dataset and 25% as the test dataset. There was no significant difference in the demographic characteristics or pathological characteristics between the training and test datasets (p > 0.05) (Table 1).

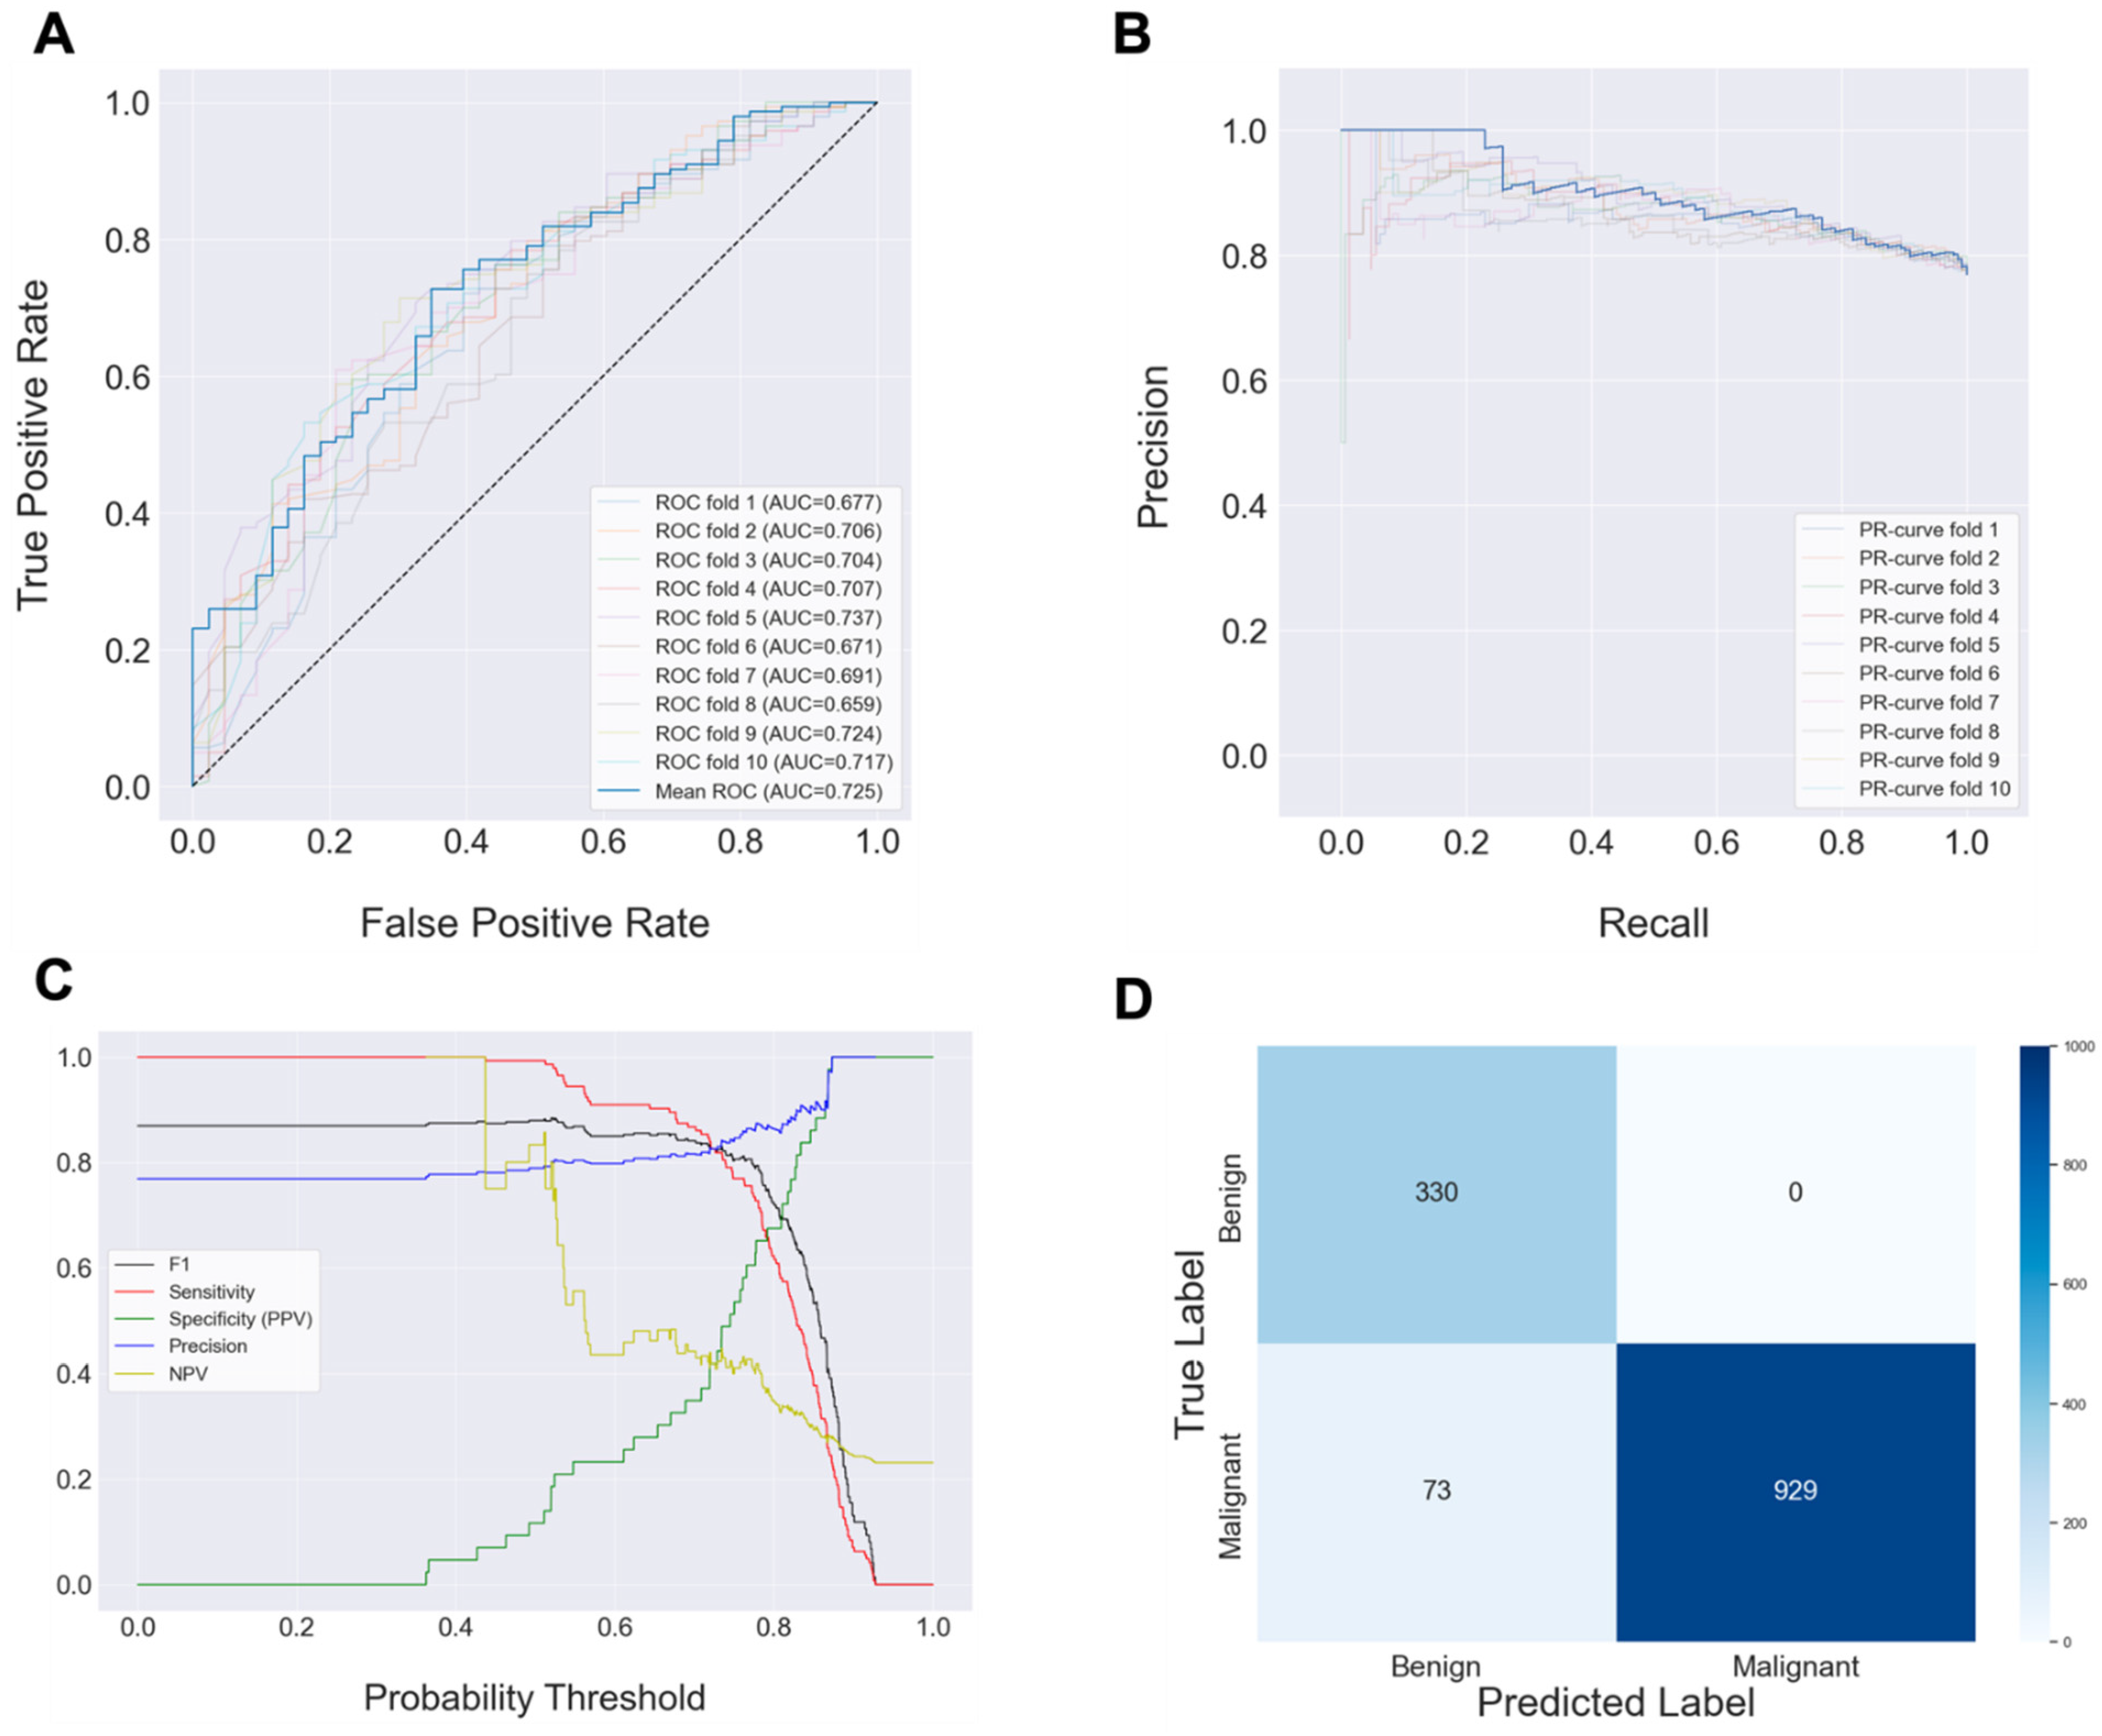
3.2. Multi-Phase CT Radiomic Features-Based Machine Learning Model

We calculated the average test performance of each model in 10-fold cross validations for a hold-out test set, and then we compared the test performance across various machine learning algorithms based on multiple metrics. In terms of the average Area Under Receiver Operating Characteristic Curve (AU-ROC) and the average Area Under the Precision-Recall Curve (AU-PRC), the Random Forest model achieved better performance (AU-ROC: mean = 0.725, standard error = 0.023; AU-PRC: mean = 0.693, standard error = 0.015) than the other ML models for classifying malignant renal tumors using principal components derived from selected radiomic features (Table 1, Figure 1A,B). An average accuracy of 0.778 was obtained on evaluation with the hold-out test set (Table 2). At the optimal threshold, the Random Forest model showed an F1 score of 0.746, precision of 0.862, sensitivity of 0.657, specificity of 0.651, and Negative Predictive Value (NPV) of 0.364 (Table 2B, Figure 1C). Meanwhile, Rbf SVM achieved the second-highest AU-ROC of 0.702, and it showed better performance than the Random Forest model in the following metrics at its optimal probability threshold: F1 score of 0.781, precision of 0.885, sensitivity of 0.699, specificity of 0.698, and NPV of 0.411. These results are summarized in Table 2.
We compared the model performance of four different types of machine learning algorithms for classifying malignant renal tumors. Sensitivity, precision, specificity (Positive Predictive Value; PPV), and Negative Predictive Value (NPV) were calculated at the optimal probability threshold for each model. The average and standard errors over test performance of each model in 10-fold cross-validations for a hold-out test set were calculated.

3.3. Single-Phase CT Radiomic Feature-Based Machine Learning Model

For further analysis, we also developed a radiomic feature-based machine learning model for single-phase CT scans and compared these results to those of a multi-phase CT radiomic feature-based machine learning model in terms of the AU-ROC, AU-PRC, accuracy, and F1 score. As seen in Table 3, for all test performance metrics, utilizing radiomic features derived from non-contrast phase CT scans consistently achieved the highest performance, regardless of the type of machine learning algorithm. Specifically, the Random Forest model using non-contrast phase CT radiomic features showed an average AU-ROC of 0.603, an average accuracy of 0.729, and an average F1 score of 0.843. The XGBoost model using non-contrast-phase CT radiomic features showed the highest average AU-PRC of 0.594.
On comparing the results obtained from machine learning models utilizing single-phase and multi-phase CT radiomic features, it became evident that the Random Forest algorithm outperformed the other types of algorithms, including linear SVM, rbf SVM, and XGBoost, for classifying malignant renal tumors based on CT radiomic features. Nevertheless, it is important to note that machine learning models using single-phase CT radiomic features consistently showed lower test performance than multi-phase CT radiomic feature-based machine learning models.

4. Discussion

We have previously classified renal tumors using a CNN model and data set framework [8]. Compared to the results of prior works, the results obtained in this study are significant. In the previous study, the results obtained by six radiologists and AI were compared, but the predictive rate of fat-poor tumors was only about 50%. It can be said that it is very encouraging that the prediction rate has gradually increased with the development of AI technology. Thus, the ultimate goal of this study was to determine the need for surgery through a single CT scan.
This study showed a robust ML pipeline intended to enhance the effective learning of diverse radiomic features (i.e., a wide column of data) and the generalizability of prediction. This approach included an oversampling technique (i.e., SMOTE) to overcome the imbalance between cases and controls, a combination of various feature selection methods (i.e., the mass univariate statistical test, the Principal Component Analysis, and automated Sequential Feature Selection) to select radiomic features rigorously, and an automated hyperparameter tuning tool (i.e., optuna) to identify the optimal ML models. Through the combinatorial use of various techniques, we developed robust and accurate radiomics-based ML pipelines. The optimized pipeline used in this study is expected to aid in designing future radiomics-based ML pipelines. However, in the end, feature-based ML will eventually be replaced by end-to-end deep learning models for improved accuracy, interpretation, and generalizability. Indeed, the recent combinations of foundation models and generative AI models have had a deep impact across business enterprises and scientific domains [15,16,17]. For example, radiomics will greatly benefit from the foundation models for visual segmentation [18] that can easily be adapted to any kind of computer vision task, including segmentation, interpretation, and prediction, or the model for text-image learning that can be applied to integrate cancer cell image data with clinical data (e.g., EMR) [19]. Our results will serve as a baseline model for the further development of end-to-end deep learning models for medical imaging.
Compared to existing studies, the biggest strength of the current study is the composition of the data set. Even in a multicenter study, it is not easy to construct a data set that is fat-poor and diverse, i.e., one that includes all five types of renal cancer. Our research team is managing this dataset to make it more balanced, and we are attempting further research based on it. For example, the next study will be a study that uses deep learning as a follow-up to this radiomics study.
As mentioned above, the data set in this study included only renal tumors of a size of about 3.5 cm. This is because most renal tumors that are very large are ccRCC, or anyone can easily predict that they are malignant. Further, by screening only renal tumors with less than 10% fat component, it was possible to exclude renal tumors that could be easily distinguished by radiologists. Therefore, the results obtained through this study can be said to support the feasibility of prediction through AI.
Of course, this is not the first study in this area. For example, Pie Nie et al. presented a multi-center study on ccRCC through this technique, and the predictive rate was 0.921 with a ROC. However, this study included only ccRCC, and it did not show a significant difference from the assessments made by radiologists [20]. Shengxing Feng et al. also published a study similar to ours. That study assessed a small renal mass of less than 4 cm, and it predicted AML, fat-free AML, and other malignancies [21]. However, this study targeted general AML and was conducted on a small scale of 150 patients, which is different from our study, which only targeted fat-free tumors. It is encouraging and worthwhile that these initiatives are being implemented in many domains. We look forward to the day when all new tumors can be identified solely through image reading.
Recent studies have shown the potential for integrating radiomics with various data sources, such as medical history and other types of omics data, in developing a machine learning model for classifying malignant renal tumors. Jie Xu et al. showed that combining radiomics features with clinical data, including demographic information and clinical history, can improve the prediction performance of machine learning algorithms compared to utilizing radiomics features alone [22]. Klontzas et al. leveraged both radiomics and metabolomics features to develop a machine learning model, resulting in improved prediction performance [23]. We expect that the integration of data from multiple modalities into our machine learning model could further enhance its predictive capacity.
This study has several limitations. First of all, our prediction rate was about 70%, which is superior to the predictions made by radiologists, but it is clear that there are still limitations to the application of this model in actual clinical practice. In addition, our research used machine learning and not deep learning. It is the result of the researcher combining and learning the features extracted through the radio mix technology. Our research team expects that this process can be fully automated through deep learning technology, such as CNN.

5. Conclusions

The prediction of malignancy in renal tumors by using CT radiomics is found to be feasible. Based on this technology, it is expected that there will be future advances in the diagnosis of renal tumors.

6. Code Availability

The prediction of malignancy in renal tumors by using CT radiomics is found to be feasible. Based on this technology, it is expected that there will be future advances in the diagnosis of renal tumors. The relevant codes are freely available for reproducibility (https://github.com/Transconnectome/Kidney_Radiomics accessed on 30 August 2023).

Author Contributions

Conceptualization, S.B., Y.C. and S.-H.H.; methodology, H.-H.W. and J.C.; software, H.-H.W. and H.K.; validation, S.B. and J.C.; formal analysis, S.-H.H. and Y.C.; investigation, M.H.C.; resources, M.H.C. and S.-H.H.; data curation, H.-H.W. and J.C.; writing—original draft preparation, S.B.; writing—review and editing, S.B., S.-H.H. and Y.C..; visualization, J.C.; supervision, Y.C.; project administration, S.-H.H.; funding acquisition, S.-H.H. All authors have read and agreed to the published version of the manuscript.

Funding

This research was supported by the Korea Medical Device Development Fund grant funded by the Korean government (Ministry of Science and ICT, Ministry of Trade, Industry and Energy, Ministry of Health & Welfare, Republic of Korea, Ministry of Food and Drug Safety) (Project Number: KMDF_PR_20200901_0096), (No. 2021R1C1C1006503, 2021K1A3A1A2103751212, 2021M3E5D2A01022515, RS-2023-00266787, RS-2023-00265406), by Creative-Pioneering Researchers Program through Seoul National University (No. 200-20230058), and by Institute of Information & communications Technology Planning & Evaluation (IITP) grant funded by the Korea government (MSIT) [NO.2021-0-01343, Artificial Intelligence Graduate School Program (Seoul National University)] and Research Fund of Seoul St. Mary’s Hospital, The Catholic University of Korea (ZC22RISI0851).

Institutional Review Board Statement

The study was conducted in accordance with the Declaration of Helsinki, and approved by the Institutional Review Board of the Catholic University of Korea, Seoul St Mary’s Hospital (Protocol code KC22RISI0753).

Data Availability Statement

The relevant codes are freely available for reproducibility (https://github.com/Transconnectome/Kidney_Radiomics accessed on 30 August 2023).

Conflicts of Interest

The authors declare no conflict of interest.

References

  1. Ljungberg, B.; Bensalah, K.; Canfield, S.; Dabestani, S.; Hofmann, F.; Hora, M.; Kuczyk, M.A.; Lam, T.; Marconi, L.; Merseburger, A.S.; et al. EAU guidelines on renal cell carcinoma: 2014 update. Eur. Urol. 2015, 67, 913–924. [Google Scholar] [CrossRef] [PubMed]
  2. Donat, S.M.; Diaz, M.; Bishoff, J.T.; Coleman, J.A.; Dahm, P.; Derweesh, I.H.; Herrell, S.D., 3rd; Hilton, S.; Jonasch, E.; Lin, D.W.; et al. Follow-up for Clinically Localized Renal Neoplasms: AUA Guideline. J. Urol. 2013, 190, 407–416. [Google Scholar] [CrossRef] [PubMed]
  3. Capitanio, U.; Bensalah, K.; Bex, A.; Boorjian, S.A.; Bray, F.; Coleman, J.; Gore, J.L.; Sun, M.; Wood, C.; Russo, P. Epidemiology of Renal Cell Carcinoma. Eur. Urol. 2019, 75, 74–84. [Google Scholar] [CrossRef] [PubMed]
  4. Luciano, R.L.; Moeckel, G.W. Update on the Native Kidney Biopsy: Core Curriculum 2019. Am. J. Kidney Dis. 2019, 73, 404–415. [Google Scholar] [CrossRef] [PubMed]
  5. Flum, A.S.; Hamoui, N.; Said, M.A.; Yang, X.J.; Casalino, D.D.; McGuire, B.B.; Perry, K.T.; Nadler, R.B. Update on the Diagnosis and Management of Renal Angiomyolipoma. J. Urol. 2016, 195, 834–846. [Google Scholar] [CrossRef] [PubMed]
  6. Lubner, M.G. Radiomics and Artificial Intelligence for Renal Mass Characterization. Radiol. Clin. N. Am. 2020, 58, 995–1008. [Google Scholar] [CrossRef] [PubMed]
  7. Kim, H.; Hong, S.H. Use of artificial intelligence to characterize renal tumors. Investig. Clin. Urol. 2022, 63, 123–125. [Google Scholar] [CrossRef] [PubMed]
  8. Uhm, K.H.; Jung, S.W.; Choi, M.H.; Shin, H.K.; Yoo, J.I.; Oh, S.W.; Kim, J.Y.; Kim, H.G.; Lee, Y.J.; Youn, S.Y.; et al. Deep learning for end-to-end kidney cancer diagnosis on multi-phase abdominal computed tomography. NPJ Precis. Oncol. 2021, 5, 54. [Google Scholar] [CrossRef] [PubMed]
  9. Chen, T.; Guestrin, C. Xgboost: A scalable tree boosting system. In Proceedings of the 22nd Acm Sigkdd International Conference on Knowledge Discovery and Data Mining, San Francisco, CA, USA, 13–17 August 2016; pp. 785–794. [Google Scholar]
  10. Akiba, T.; Sano, S.; Yanase, T.; Ohta, T.; Koyama, M. Optuna: A Next-generation Hyperparameter Optimization Framework. In Proceedings of the 25th ACM SIGKDD International Conference on Knowledge Discovery & Data Mining, Anchorage, AK, USA, 4–8 August 2019; Association for Computing Machinery: New York, NY, USA, 2019; pp. 2623–2631. [Google Scholar]
  11. Lemaître, G.; Nogueira, F.; Aridas, C.K. Imbalanced-learn: A python toolbox to tackle the curse of imbalanced datasets in machine learning. J. Mach. Learn. Res. 2017, 18, 559–563. [Google Scholar]
  12. Pedregosa, F.; Varoquaux, G.; Gramfort, A.; Michel, V.; Thirion, B.; Grisel, O.; Blondel, M.; Prettenhofer, P.; Weiss, R.; Dubourg, V. Scikit-learn: Machine learning in Python. J. Mach. Learn. Res. 2011, 12, 2825–2830. [Google Scholar]
  13. Van Griethuysen, J.J.; Fedorov, A.; Parmar, C.; Hosny, A.; Aucoin, N.; Narayan, V.; Beets-Tan, R.G.; Fillion-Robin, J.-C.; Pieper, S.; Aerts, H.J. Computational radiomics system to decode the radiographic phenotype. Cancer Res. 2017, 77, e104–e107. [Google Scholar] [CrossRef] [PubMed]
  14. Klontzas, M.E.; Gatti, A.A.; Tejani, A.S.; Kahn, C.E., Jr. AI Reporting Guidelines: How to Select the Best One for Your Research. Radiol. Artif. Intell. 2023, 5, e230055. [Google Scholar] [CrossRef] [PubMed]
  15. Moor, M.; Banerjee, O.; Abad, Z.S.H.; Krumholz, H.M.; Leskovec, J.; Topol, E.J.; Rajpurkar, P. Foundation models for generalist medical artificial intelligence. Nature 2023, 616, 259–265. [Google Scholar] [CrossRef] [PubMed]
  16. Chambon, P.; Bluethgen, C.; Langlotz, C.P.; Chaudhari, A. Adapting pretrained vision-language foundational models to medical imaging domains. arXiv 2022, arXiv:2210.04133. [Google Scholar]
  17. Qin, Z.; Yi, H.; Lao, Q.; Li, K. Medical image understanding with pretrained vision language models: A comprehensive study. arXiv 2022, arXiv:2209.15517. [Google Scholar]
  18. Kirillov, A.; Mintun, E.; Ravi, N.; Mao, H.; Rolland, C.; Gustafson, L.; Xiao, T.; Whitehead, S.; Berg, A.C.; Lo, W.-Y. Segment anything. arXiv 2023, arXiv:2304.02643. [Google Scholar]
  19. Radford, A.; Kim, J.W.; Hallacy, C.; Ramesh, A.; Goh, G.; Agarwal, S.; Sastry, G.; Askell, A.; Mishkin, P.; Clark, J. Learning transferable visual models from natural language supervision. In Proceedings of the International Conference on Machine Learning: PMLR, Virtual, 18–24 July 2021; pp. 8748–8763. [Google Scholar]
  20. Nie, P.; Yang, G.; Wang, Y.; Xu, Y.; Yan, L.; Zhang, M.; Zhao, L.; Wang, N.; Zhao, X.; Li, X.; et al. A CT-based deep learning radiomics nomogram outperforms the existing prognostic models for outcome prediction in clear cell renal cell carcinoma: A multicenter study. Eur. Radiol. 2023. [Google Scholar] [CrossRef] [PubMed]
  21. Feng, S.; Gong, M.; Zhou, D.; Yuan, R.; Kong, J.; Jiang, F.; Zhang, L.; Chen, W.; Li, Y. A CT-based radiomics nomogram for differentiation of benign and malignant small renal masses (≤4 cm). Transl. Oncol. 2023, 29, 101627. [Google Scholar] [CrossRef] [PubMed]
  22. Xu, J.; He, X.; Shao, W.; Bian, J.; Terry, R. Classification of Benign and Malignant Renal Tumors Based on CT Scans and Clinical Data Using Machine Learning Methods. Informatics 2023, 10, 55. [Google Scholar] [CrossRef]
  23. Klontzas, M.E.; Koltsakis, E.; Kalarakis, G.; Trpkov, K.; Papathomas, T.; Sun, N.; Walch, A.; Karantanas, A.H.; Tzortzakakis, A. A pilot radiometabolomics integration study for the characterization of renal oncocytic neoplasia. Sci. Rep. 2023, 13, 12594. [Google Scholar] [CrossRef] [PubMed]
Figure 1. Malignant renal tumor classification performance of the Random Forest model. (A) Receiver Operating Characteristic curve and (B) Precision-Recall curve of the best model for classifying malignant renal tumors. (C) The difference in the prediction performance of the best model according to the decision threshold. (D) Confusion Matrix at the optimal decision threshold.
Applsci 13 11345 g001
Table 1. Demographic and pathological characteristics of the patients. Training and testing datasets for the classification of malignant kidney cancer.
Training DatasetTest Datasetp Value
Gender 3961030.412
Male (%)222 (56.3%)63 (61.2%)
Female (%)174 (43.7%)40 (38.8%)
Age (years, range)57.0 (22, 83)54.0 (27, 79)0.708
Cancer size (cm, range)3.573 (0.7, 17.5)3.291 (1.0, 9.4)0.294
Renal tumor 0.9
Benign (%)99 (25%)27 (26.2%)
Malignant (%)297 (75%)76 (73.8%)
Table 2. Model performance of multi-phase CT radiomic feature-based machine learning models for malignant renal tumor classification.
AU-ROCAU-PRCACC
Linear SVM 0.625 ± 0.031 0.577 ± 0.017 0.765 ± 0.005
Rbf SVM 0.702 ± 0.034 0.649 ± 0.028 0.77 ± 0.011
XGBoost 0.679 ± 0.017 0.662 ± 0.016 0.79 ± 0.006
Random Forest 0.725 ± 0.023 0.693 ± 0.015 0.778 ± 0.009
Probability ThresholdF1 ScorePrecisionSensitivitySpecificity (PPV)NPV
Linear SVM0.7555 0.661 ± 0.003 0.808 ± 0.037 0.559 ± 0.180 0.558 ± 0.209 0.276 ± 0.028
Rbf SVM0.8044 0.781 ± 0.008 0.885 ± 0.030 0.699 ± 0.155 0.698 ± 0.082 0.411 ± 0.065
XGBoost0.715 0.704 ± 0.003 0.837 ± 0.011 0.608 ± 0.031 0.605 ± 0.036 0.317 ± 0.017
Random Forest0.79 0.746 ± 0.005 0.862 ± 0.019 0.657 ± 0.036 0.651 ± 0.065 0.364 ± 0.022
Table 3. Model performance of single-phase CT radiomic feature-based machine learning models for malignant renal tumor classification.
AU-ROCAU-PRC
CT PhaseArterialDelayedNon-ContrastPortalArterial DelayedNon-ContrastPortal
Sample Size (Train/Test)236/82252/88318/101360/81236/82252/88318/101360/81
Linear SVM 0.395 ± 0.068 0.443 ± 0.054 0.419 ± 0.061 0.412 ± 0.08 0.447 ± 0.038 0.472 ± 0.032 0.467 ± 0.029 0.466 ± 0.043
Rbf SVM 0.530 ± 0.048 0.5 ± 0.0 0.514 ± 0.056 0.515 ± 0.079 0.548 ± 0.042 0.5 ± 0.0 0.514 ± 0.034 0.525 ± 0.05
XGBoost 0.415 ± 0.038 0.351 ± 0.037 0.583 ± 0.026 0.471 ± 0.034 0.466 ± 0.023 0.434 ± 0.021 0.594 ± 0.016 0.492 ± 0.022
Random Forest 0.431 ± 0.063 0.527 ± 0.045 0.603 ± 0.061 0.473 ± 0.043 0.487 ± 0.035 0.553 ± 0.027 0.592 ± 0.043 0.511 ± 0.027
ACCF1 Score
CT PhaseArterialDelayedNon-ContrastPortalArterialDelayedNon-ContrastPortal
Sample Size (Train/Test)236/82252/88318/101360/81236/82252/88318/101360/81
Linear SVM 0.659 ± 0.003 0.681 ± 0.019 0.695 ± 0.022 0.702 ± 0.023 0.792 ± 0.023 0.810 ± 0.014 0.820 ± 0.015 0.824 ± 0.015
Rbf SVM 0.706 ± 0.013 0.693 ± 0.0 0.721 ± 0.012 0.728 ± 0.0 0.825 ± 0.09 0.818 ± 0.0 0.837 ± 0.08 0.843 ± 0.0
XGBoost 0.668 ± 0.012 0.633 ± 0.013 0.728 ± 0.016 0.725 ± 0.008 0.798 ± 0.008 0.773 ± 0.01 0.840 ± 0.01 0.840 ± 0.005
Random Forest 0.696 ± 0.07 0.693 ± 0.0 0.729 ± 0.05 0.729 ± 0.005 0.821 ± 0.005 0.819 ± 0.01 0.843 ± 0.003 0.840 ± 0.04
Disclaimer/Publisher’s Note: The statements, opinions and data contained in all publications are solely those of the individual author(s) and contributor(s) and not of MDPI and/or the editor(s). MDPI and/or the editor(s) disclaim responsibility for any injury to people or property resulting from any ideas, methods, instructions or products referred to in the content.

