
Analysis of Urban Maize Yield Response to Urban Sprawl in a Changing Climate: Case of Harare Metropolitan City


1
Department of Space Science and Applied Physics, Faculty of Science, University of Zimbabwe, Mt. Pleasant, Harare P.O. Box MP167, Zimbabwe
2
Discipline of Geography, School of Agricultural, Earth and Environmental Sciences, University of KwaZulu-Natal, P/Bag X01, Scottsville, Pietermaritzburg 3209, South Africa
*
Author to whom correspondence should be addressed.
Appl. Sci. 2023, 13(18), 10259; https://doi.org/10.3390/app131810259
Submission received: 2 February 2023
/
Revised: 17 March 2023
/
Accepted: 27 July 2023
/
Published: 13 September 2023
(This article belongs to the Special Issue Applications of Remote Sensing and GIS in Land Surface Observation)
Abstract
:Agriculture in free spaces within urban areas sustains residents as they grow crops to ensure food availability while at the same time selling other produce to fund other needs. Due to the value of urban agricultural production, the main focus of this study was to investigate the implications of urban growth on maize yield in Harare metropolitan city. In order to achieve this, Landsat multispectral and multi-temporal data were used to establish the responses of the estimated maize yield to city growth from 1984 to 2018. Initially, Land Use and Land Cover map for each period were produced using multispectral images and field observation in Support Vector Machine (SVM)-based supervised image classification. The maps were reclassified using a binary scheme of croplands and non-croplands, which was used to quantify cropland area in each period and hence change over time. The maize yield for each period was estimated from data obtained from a study of maize yields obtained at the University of Zimbabwe Farm (UZ) farm for maize grown under variable agricultural practices. Results showed that cropland area was reduced from 11,120 ha in 1984 down to 2631 ha in 2018. The estimated average maize yield decreased from 52,264 tons in 1984 to 12,366 tons in 2018. In addition to showing the value of urban agriculture, the findings of this study are important in informing the government, municipalities, and other stakeholders about how urban growth has the potential to compromise food security and livelihoods, especially for the urban poor.
1. Introduction
Urban agriculture involves crop and livestock production in open areas surrounding and within cities, ranging from small vegetable gardens to activities on community lands [1]. The activities of urban agriculture are threatened by urban growth, especially in developing countries [2,3], while they assist urban dwellers to help satisfy their food needs [1]. Due to non-recognition by policymakers, little attention and support hinder the realization of the opportunities offered by urban agriculture. Urban agriculture can help curb the effects of food price crises, increase the resilience of some urban poor, and improve their lives [1]. As cities grow, there is a challenging shift from organized to haphazard farming. This is a result of urban farming being either considered illegal or simply caused by a lack of clear policies on how urban farming should be considered.
A study by Moyo [4] established that urban food production has a significant contribution to household food access and security in Bulawayo townships, thereby improving dietary diversity and nutritional intake. A few farmers who produced surplus traded it in informal township markets, raising income that they could use for other household necessities such as basic medication, transport fares, and other food commodities. In the Harare metropolitan area, a study revealed that maize is the main crop produced during the wet season, while vegetables are produced throughout the year [5]. However, Moyo [4] pointed out how urban agriculture’s potential was constrained by a complex of factors that include invasion due to the growth of built-up areas, land tenure insecurity, erratic water access, small plot sizes, inadequate capital for optimizing plot productivity, and ambivalent application of urban land-use laws. A similar study by [6] confirmed that urban agriculture contributes significantly to food security in Old Pumula, Bulawayo, but also revealed that urban farmers are faced with severe land shortages and are restricted by by-laws from practicing urban agriculture. Evidently, urban agriculture is valuable enough that trends in production need to be analyzed as cities grow.
A number of studies have indicated that cities are growing and increasing so much in developing countries in Africa [7,8,9,10]. The studies have shown a withdrawal of vegetation cover in areas near the peripheries of the cities while the built fabric is expanding. While these Land Use Land Cover (LULC) transitions are evident, little focus has been placed on understanding the implications for urban agriculture, which may have detrimental effects on the quality of life in cities. Although previous studies such as Moyo et al. [11], Mbiba [5], and Ncube and Ncube [6] stressed the value of urban agriculture in sustaining the lives of citizens, especially the low-income strata, studies that relate the growth of cities to food security in Zimbabwe are scarce. Unfortunately, as most of the planted area is not registered with the municipalities for the purposes of formal agriculture, it is hard to quantify the contribution of urban farming to livelihood and food security in response to city expansion trends. Quantifying the responses of urban farming yields to city growth helps policymakers and other stakeholders, such as development partners, identify mechanisms for ensuring that residents, especially the urban poor, have basic access to food provision. It can also inspire the government and municipality of Harare to craft relevant policies to regularize urban farming and make it a vital component that enhances the food security of the urban poor. Unfortunately, urban farming is not part of urban planning and policy.
On the other hand, the growth of cities is concurrent with other growing global challenges, such as increasing pollution levels, which compromise air quality and negatively affect the climate system [12,13]. The patterns also increase energy and water demand [14,15,16,17], while the supply of these puts pressure on governments, especially in developing countries where most economies are not sound. Urban areas have also not been spared from changes in climate, which include changes in intensities and frequencies of extreme events. This implies the need to also investigate the complex interaction between urban growth, climate change, and crop production in cities. Specifically, the comparative and combined influence on crop production between land use change and climate change needs to be understood. In Zimbabwe, there is a heavy dependence on rainfall for crop production [18], while changes in rainfall patterns in combination with rising temperatures also have the potential to change growth patterns. For example, prolonged dry spells during hot days subject crops to water stress in ways almost similar to a drought when rainfall amounts below normal are received. In Zimbabwe, studies have indicated that annual rainfall amounts are not changing significantly. However, low yields in recent years have mainly been attributed to extreme events that compromise the quality of a season. In the context, of urban growth and taking advantage of tools for deriving extreme climate indices [19,20,21,22,23], understanding the effect of intensity and trends of rainfall extremes such as wet spells, dry spells, and heavy amounts on urban crop production requires investigation.
The main objective of this study is to estimate maize production changes due to urban sprawl and illegal settlements in Harare metropolitan city’s urban farming. In particular, changes in cropland area in Harare due to urban sprawl between 1984 and 2018 were quantified, while changes in maize yield due to urban growth in Harare were estimated. The novelty of the study is combining land use/cover dynamics with trends in extreme climatic events to explain long-term changes in urban maize yield. The paper’s next section presents the main methodologies, starting with a description of the study area, followed by the remote sensing techniques used for data collection and GIS analyses carried out. The empirical yield estimation approach is described next, before the results, their discussion, and conclusions are presented.
2. Materials and Methods
2.1. Study Area
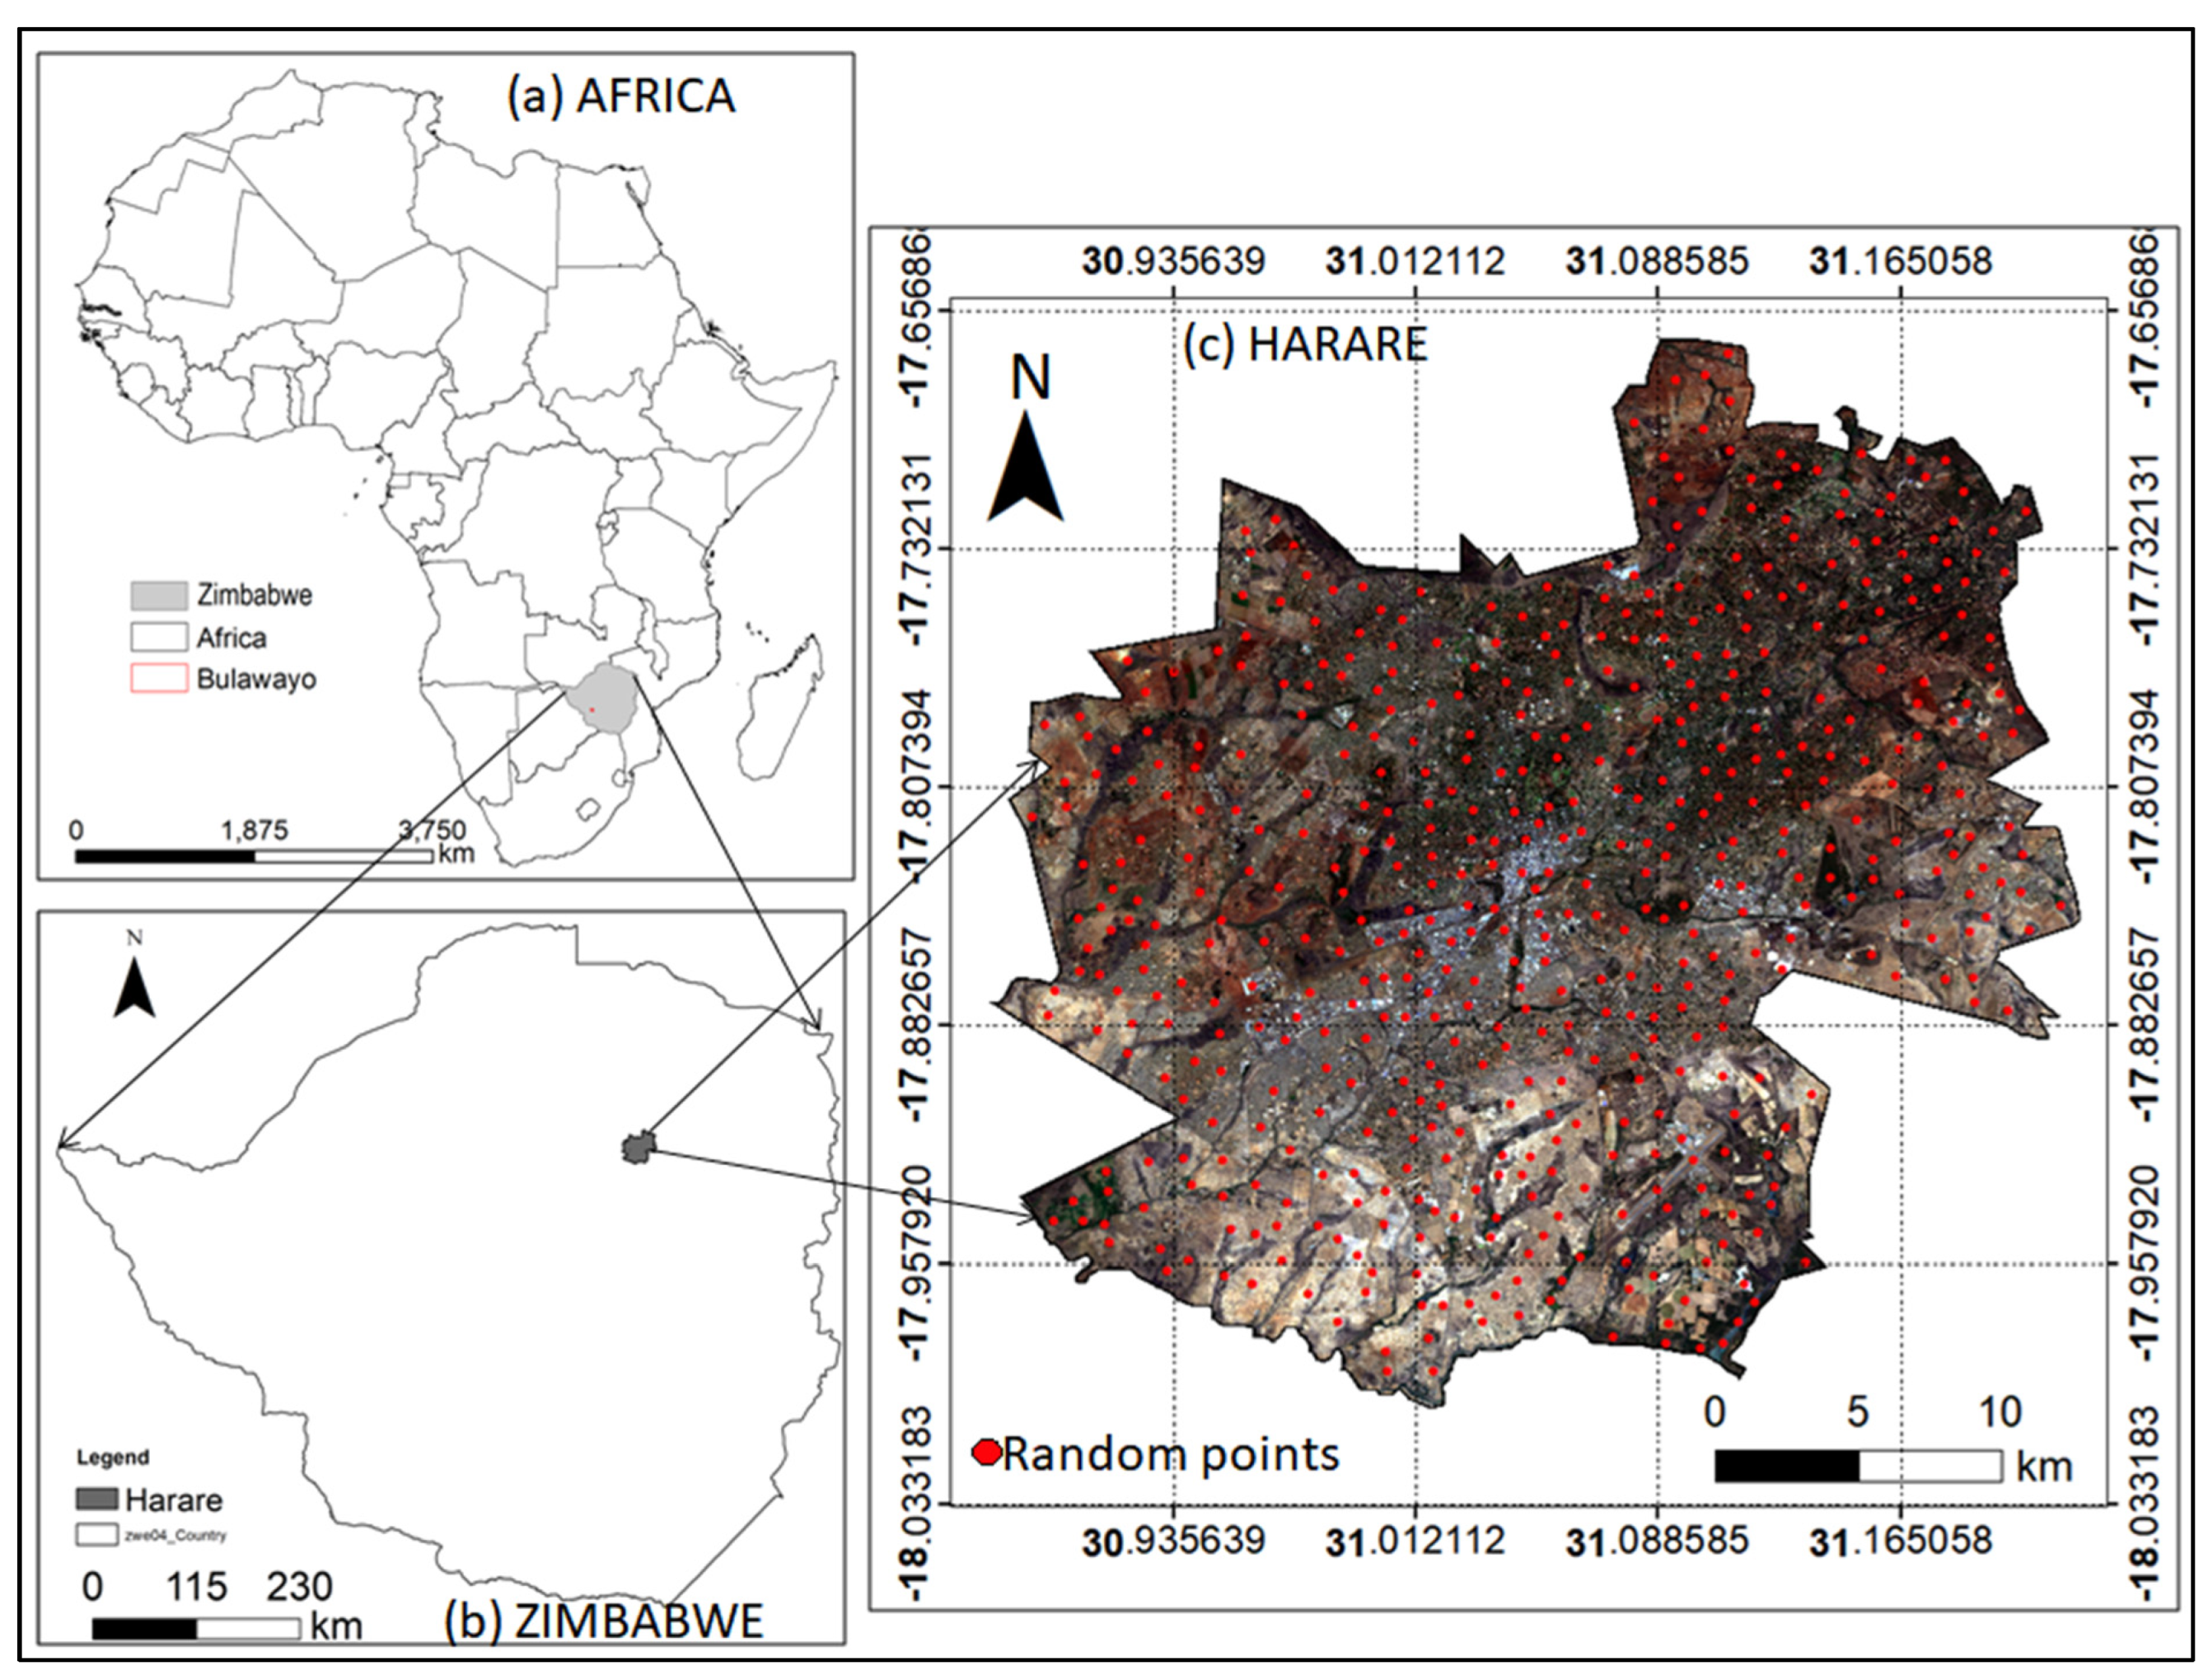
This study was conducted in Harare metropolitan city, the largest and capital city of Zimbabwe (Figure 1). Harare metropolitan province is comprised of Harare Urban, Harare Rural, Chitungwiza, and Epworth areas (see Figure 1). The city is located between 17°40′ and 1800′ south and between 30°55′ and 31°15′ east, lies approximately 1500 m above mean sea level, and occupies approximately 942 km2 [24]. According to [25], the geology to the north is dominated by gabbro and dolerite, the center by an intrusion of metagreywacke and phyllite, while granites are popular to the east and south. The study area is characterized by a warm, wet season from November to April; a cool, dry season from May to August, and a hot, dry season in October [24]. The dry May-to-August season was chosen for land cover mapping to be used in the study as its generally clear skies would provide the cloudless scenes required for the study. The city of Harare has a radial road network with the central business district (CBD) at its center and most industrial areas are located to the east and south [26]. To the north and northeast are low-density residential areas on plot sizes of about 1000 m2 or more, while to the extreme east, south, southwest, and west are high-density residential areas on plot sizes of about 300 m2. Some medium-density residential areas measuring between 800 and 1000 m2 are found in the southern part of the study area [26].
The population in Harare Urban District has been increasing at a fast rate since independence in 1980, increasing from 642,191 in 1982 to 1,485,231 in 2012 [27]. During the same period, the population in Harare Rural District increased from 16,173 to 113,599. The 2012 Zimbabwe population census put the population of Chitungwiza at 356,840 and that of Epworth at 167,462 [27]. Harare is the business capital of Zimbabwe owing to its wide range of commercial activities, although unemployment is high in the city. The city has several conditions favorable to urban food production, which include a relatively wet climate, large residential plot sizes, and large open spaces within the city boundaries [5]. Maize is the main crop produced during the wet season, while vegetables, fruits, and other horticultural products are produced throughout the year for consumption and sale. Due to the ever-rising cost of living and high unemployment rate in the city, produce from urban agriculture plays an increasingly important role, especially for the low-income strata.
2.2. Methodology
The methodology used in this study comprised six major components: data acquisition, pre-processing, land use/cover classification, accuracy assessment, land use/cover change analysis, and estimation of maize yield. In this study, pre-processing and post-processing of images were performed in ENVI 4.7 [28] and ArcGIS 10.2.2 [29] software applications.
2.2.1. Field Data Collection
GPS survey ground data was obtained in June 2018 and used Google Earth maps to extrapolate backwards and construct ground truth data for 1984. The period was chosen as it is difficult to find cloud-free images necessary for land surface analysis during the main growing season. Similar periods were chosen for both 1984 and 2018 to avoid the effect of differences in seasons on mapping accuracy and change detection. The experience of 2018 was used to identify similar LULC classes in the same season as 1984 using high-resolution Google Earth imagery. Table 1 describes the LULC classes that were predominant in the study area and were used in this study. Field data were split into 70% for training LULC mapping and 30% for post-classification accuracy assessment. Daily rainfall data for the study area were downloaded from the NASA website (https://power.larc.nasa.gov/data-access-viewer/, accessed on 13 September 2022) for the period from 1984 to 2020. This data was used in order to cover the same period of analysis as the land cover maps.
2.2.2. Rainfall Data Analysis
Daily rainfall data were used to determine linear trends in extreme events using the Rclimdex software [21,30,31,32]. The indices computed were (i) the yearly Standardized Precipitation Evapotranspiration Index (SPEI), (ii) the consecutive number of dry days with rainfall less than 1 mm, (iii) consecutive number of wet days with at least 1 mm, (iv) the number of days with rainfall exceeding 30 mm, and (v) the number of days with rainfall exceeding the 99th percentile, as well as their trends. For each index, a p-value was used to determine the significance of the trends (with values less than 0.05 indicating statistically significant linear trends and values of at least 0.05 implying otherwise).
2.2.3. Remote Sensing Data Collection
One Landsat 5 Thematic Mapper (TM) scene and one Landsat 8 scene for land use/cover mapping were acquired (Table 2). The Landsat Thematic Mapper (TM) sensor carried on Landsat 4 and Landsat 5 created images consisting of six spectral bands with a spatial resolution of 30 m for Bands 1–5 and 7, and one thermal band (Band 6) (EOS, 2019). Landsat 8 consists of the Operational Land Imager (OLI) and the Thermal Infrared Sensor (TIRS) sensors, which provide images at a spatial resolution of 15 m (panchromatic), 30 m (visible, NIR, SWIR), and 100 m (thermal). Landsat 5 and Landsat 8 images were selected from cloud-free scenes acquired during the month of June. The two Landsat scenes were geometrically corrected at the United States Geological Survey (U.S.G.S) prior to downloading. The scenes were then georeferenced to the Universal Transverse Mercator (UTM) map projection in zone 36 south, where Harare is located. Atmospheric correction was performed using the dark subtract method on all the bands used in image processing.
2.2.4. Region of Interest (ROI) Separability Test
To determine how separable the six classes were against each other, the ROI Separability Test was employed. The test computes the spectral separability between selected ROI pairs for a given input file, and both the Jeffries-Matusita and Transformed Divergence separability measures are reported [33]. The transformed divergence separability index (TDSI) was used to assess the discriminability of LULC classes and the need to merge any inseparable classes to reduce spectral confusion and increase accuracy.
2.2.5. Supervised Classification and Accuracy Assessment
LULC mapping was conducted for 1984 and 2018 using a support vector machine classifier in a supervised classification approach and 70% of ground truth data that was collected in a field survey as well as from Google Earth. Support Vector Machine (SVM) is a classification system derived from statistical learning theory that provides good classification results from complex and noisy data. It performs supervised classification on images using a support vector machine to identify the class associated with each pixel. It separates the classes with a decision surface that maximizes the margin between the classes. The radial basis function (RBF) kernel was selected for classification since it produces the best accuracy [24]. The non-linear and complex nature of the data makes RBF suitable for classification. The mathematical representation of the RBF is shown in Equation (1):
where γ is the gamma term representing the width of the kernel function, xi belongs to Rn, which is an n-dimensional vector, and xj belongs to {1, +1}1 representing the label of each class i = 1, ……, k. γ is a user-controlled parameter, and its correct definition significantly increases the accuracy of the SVM solution. Several authors have demonstrated the effectiveness of the SVM algorithm in mapping urban areas, especially in areas where training data is limited, as is the case in Harare [34]. Post-classification accuracy assessment was conducted using an independent set of ground truth data (30% of collected samples/GPS points).
2.2.6. Mapping of Croplands for 1984 and 2018
The LULC maps for each year were reclassified into a binary scheme showing cropland and non-cropland locations. The reclassify tool in ArcGIS was used to categorize the study area into croplands, merging all other categories into one class called non-cropland areas. An attribute table was automatically generated in the process, which indicated the number of pixels in each category for each period. The area occupied by croplands was then determined as the product of pixel resolution (30 m) and the number of pixels occupied by the class in each period using Equation (2):
2.2.7. Estimation of Maize Yield in HARARE
Yield data for Harare for the study period were not available in the Department of Agricultural Extension for the entire study period. A study by [35] in the context of small fields where maize was produced under diversified farming practices was used as a proxy for the variable agricultural practices and plot sizes similar to what is practiced by urban farmers in Harare metropolitan. Six cultivars were used, and three planting dates were selected to plant on a plot approximately 9 m × 6 m, subdivided into smaller sub-plots. This layout was found to be similar to patterns observed in urban agriculture, also characterized by small farm areas [4], with different practices used even in farms that are next to each other. In view of this, maize yields obtained from the study by [35] over three farming seasons were used to calculate the average maize yield in tons per hectare for Harare. Using the mean and standard deviation, the best-case, worst-case, and average-case yields were derived. Assuming maize was the only crop under production in the study area in all periods, the total quantity of maize (in tons) produced for each year was modeled using Equation (3):
where Cropland Area is derived from supervised image classification and Estimated maize yield per hectare is the worst yield, average, or best case yield per hectare estimation as determined from the mean yield per hectare ± the standard deviation.
3. Results and Discussion
3.1. Rainfall Patterns in Harare
Although the linear trend in annual precipitation was positive, indicating an increase with time (slope = 2.16 mm/year), the change was not statistically significant (p = 0.381). Mazvimavi [36] also observed an insignificant trend in rainfall in most places in Zimbabwe.
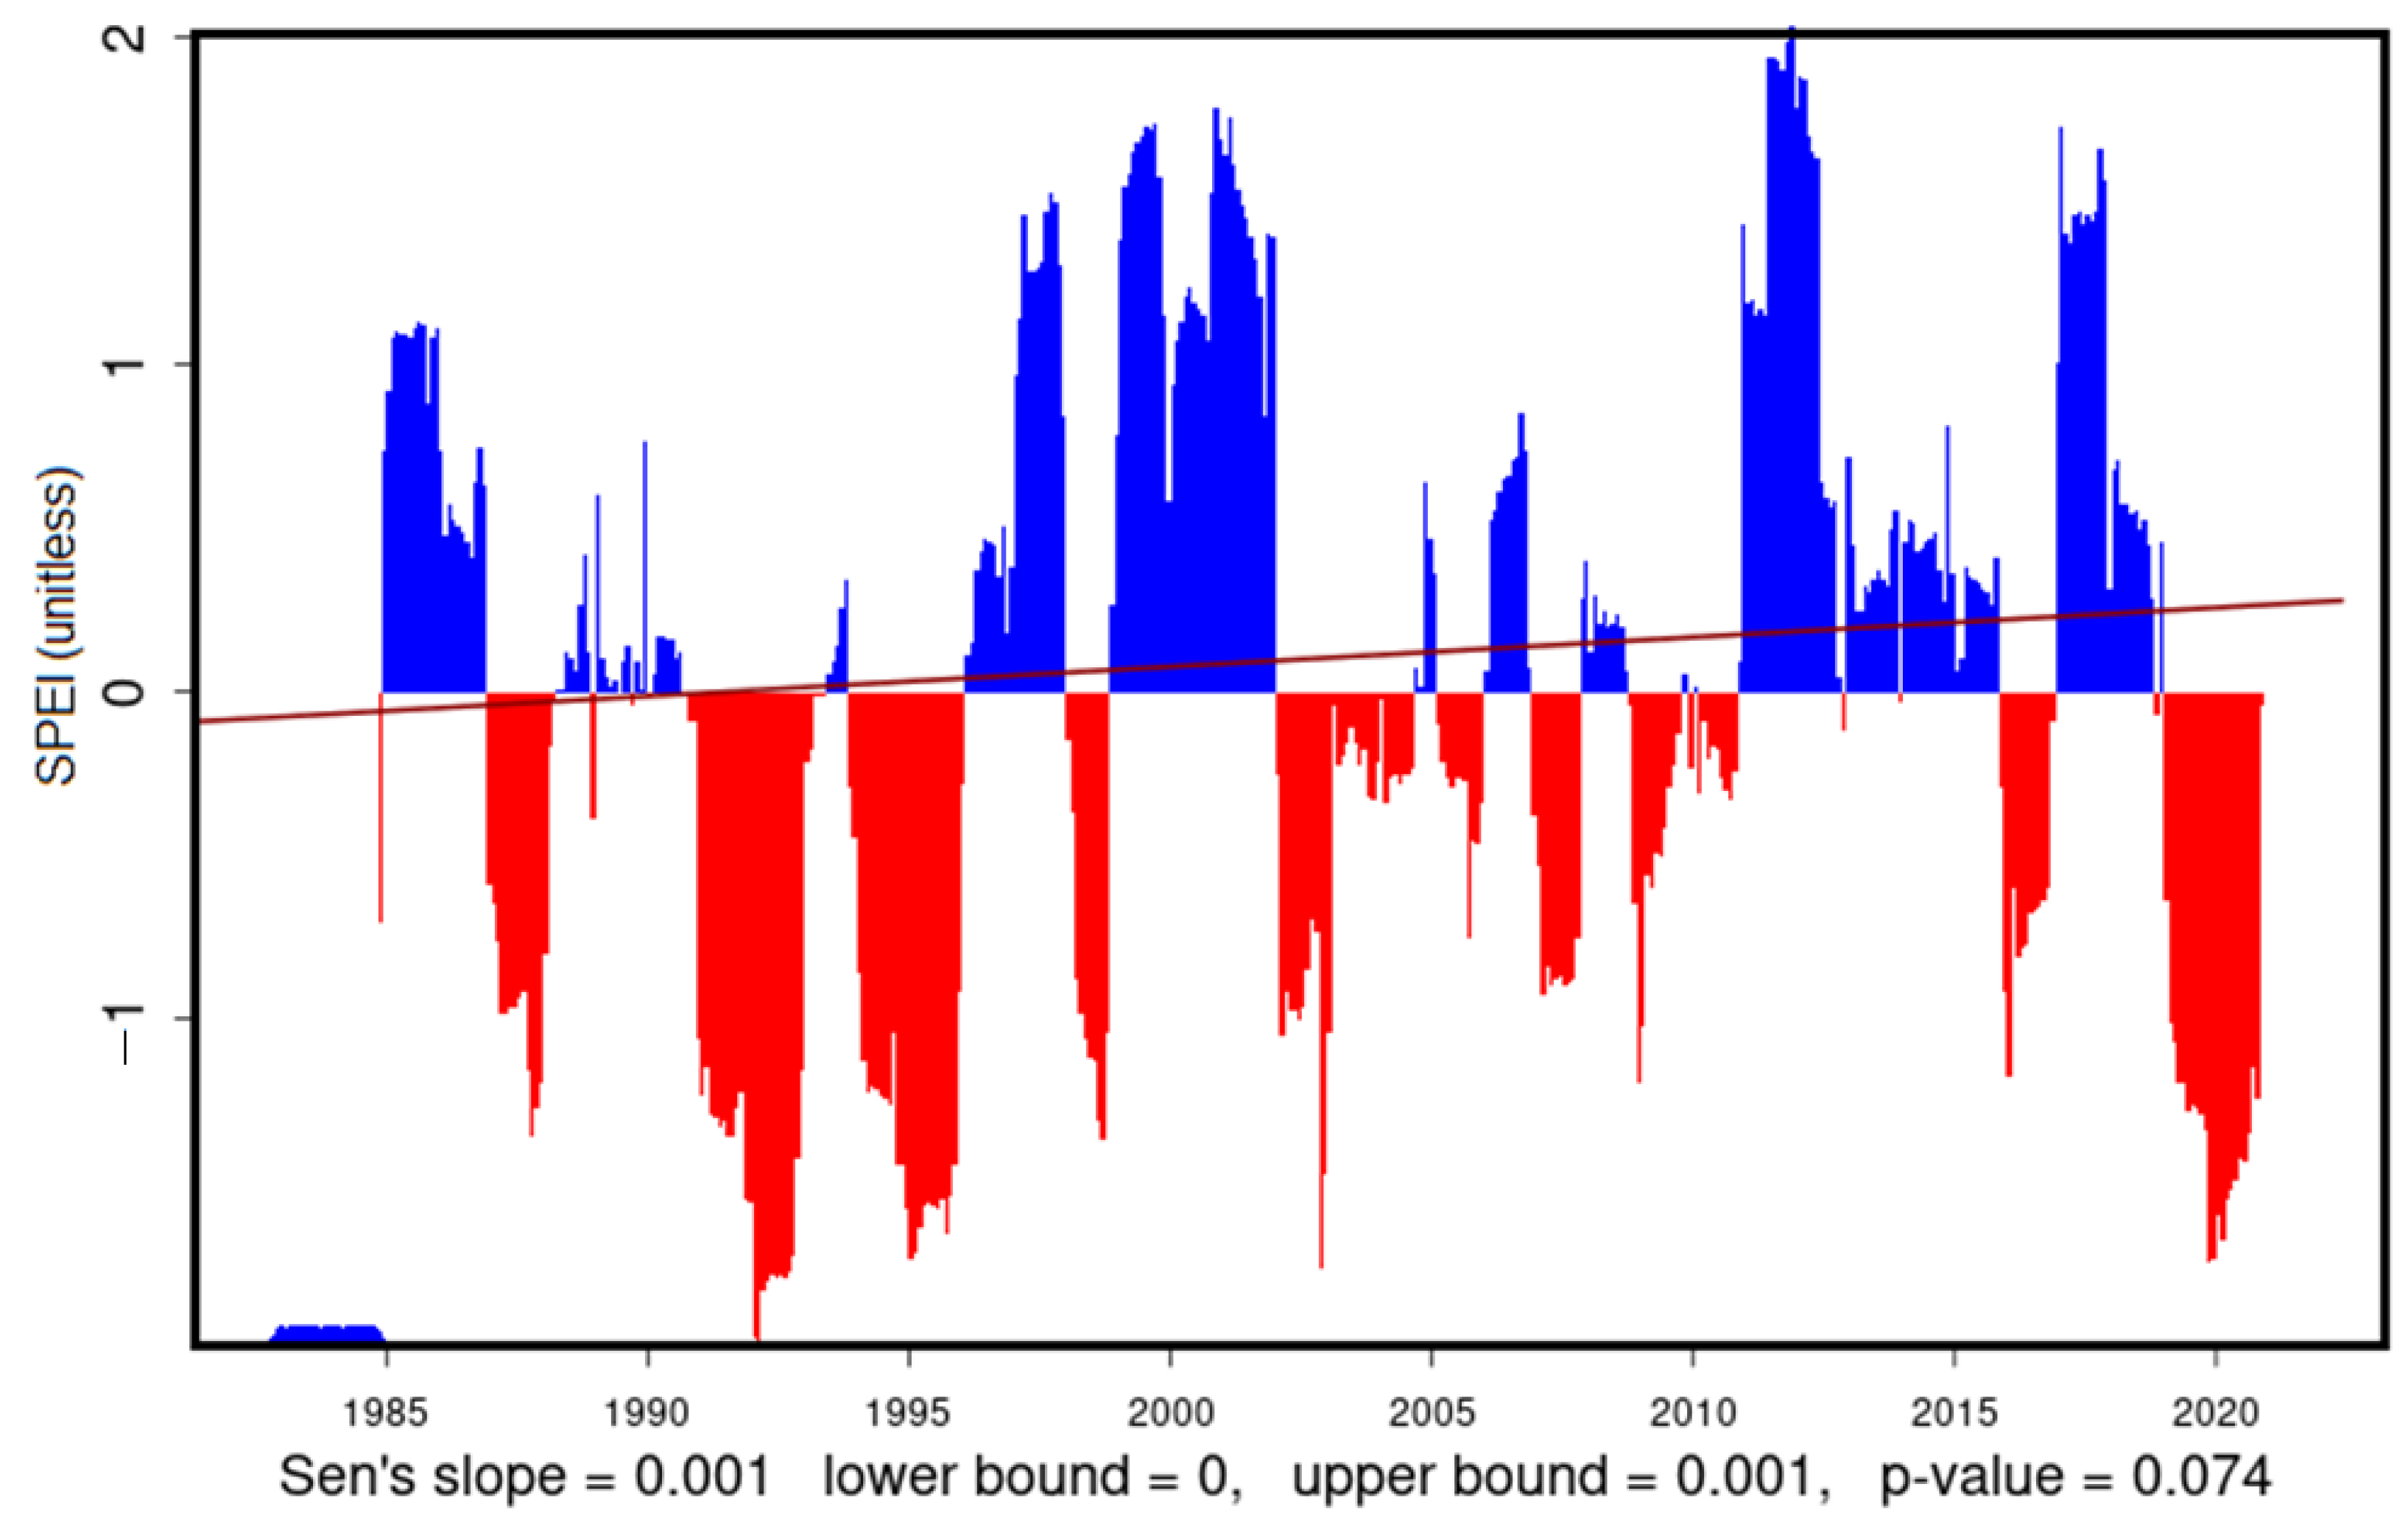
Based on the Standardized Precipitation Evapotranspiration Index (SPEI), years with negative annual rainfall anomalies decreased between 1984 and 2020 (Figure 2). This yielded a positive linear trend in SPEI (0.001/year), which, however, was not statistically significant (p > 0.05).
There was also an insignificant (p > 0.05) and minor increase (0.2 days/year) in the number of consecutive days with precipitation less than 1 mm in a year. This shows that the effect of dry spells is not noticeable in the city. Harare is in agro-ecological region 2a, which is distinguished from region 2b by a low risk of prolonged mid-season dry spells.
The number of consecutive wet days in a year also increased at a statistically insignificant rate between 1984 and 2020 (slope = 0.2 days/year and p > 0.05).
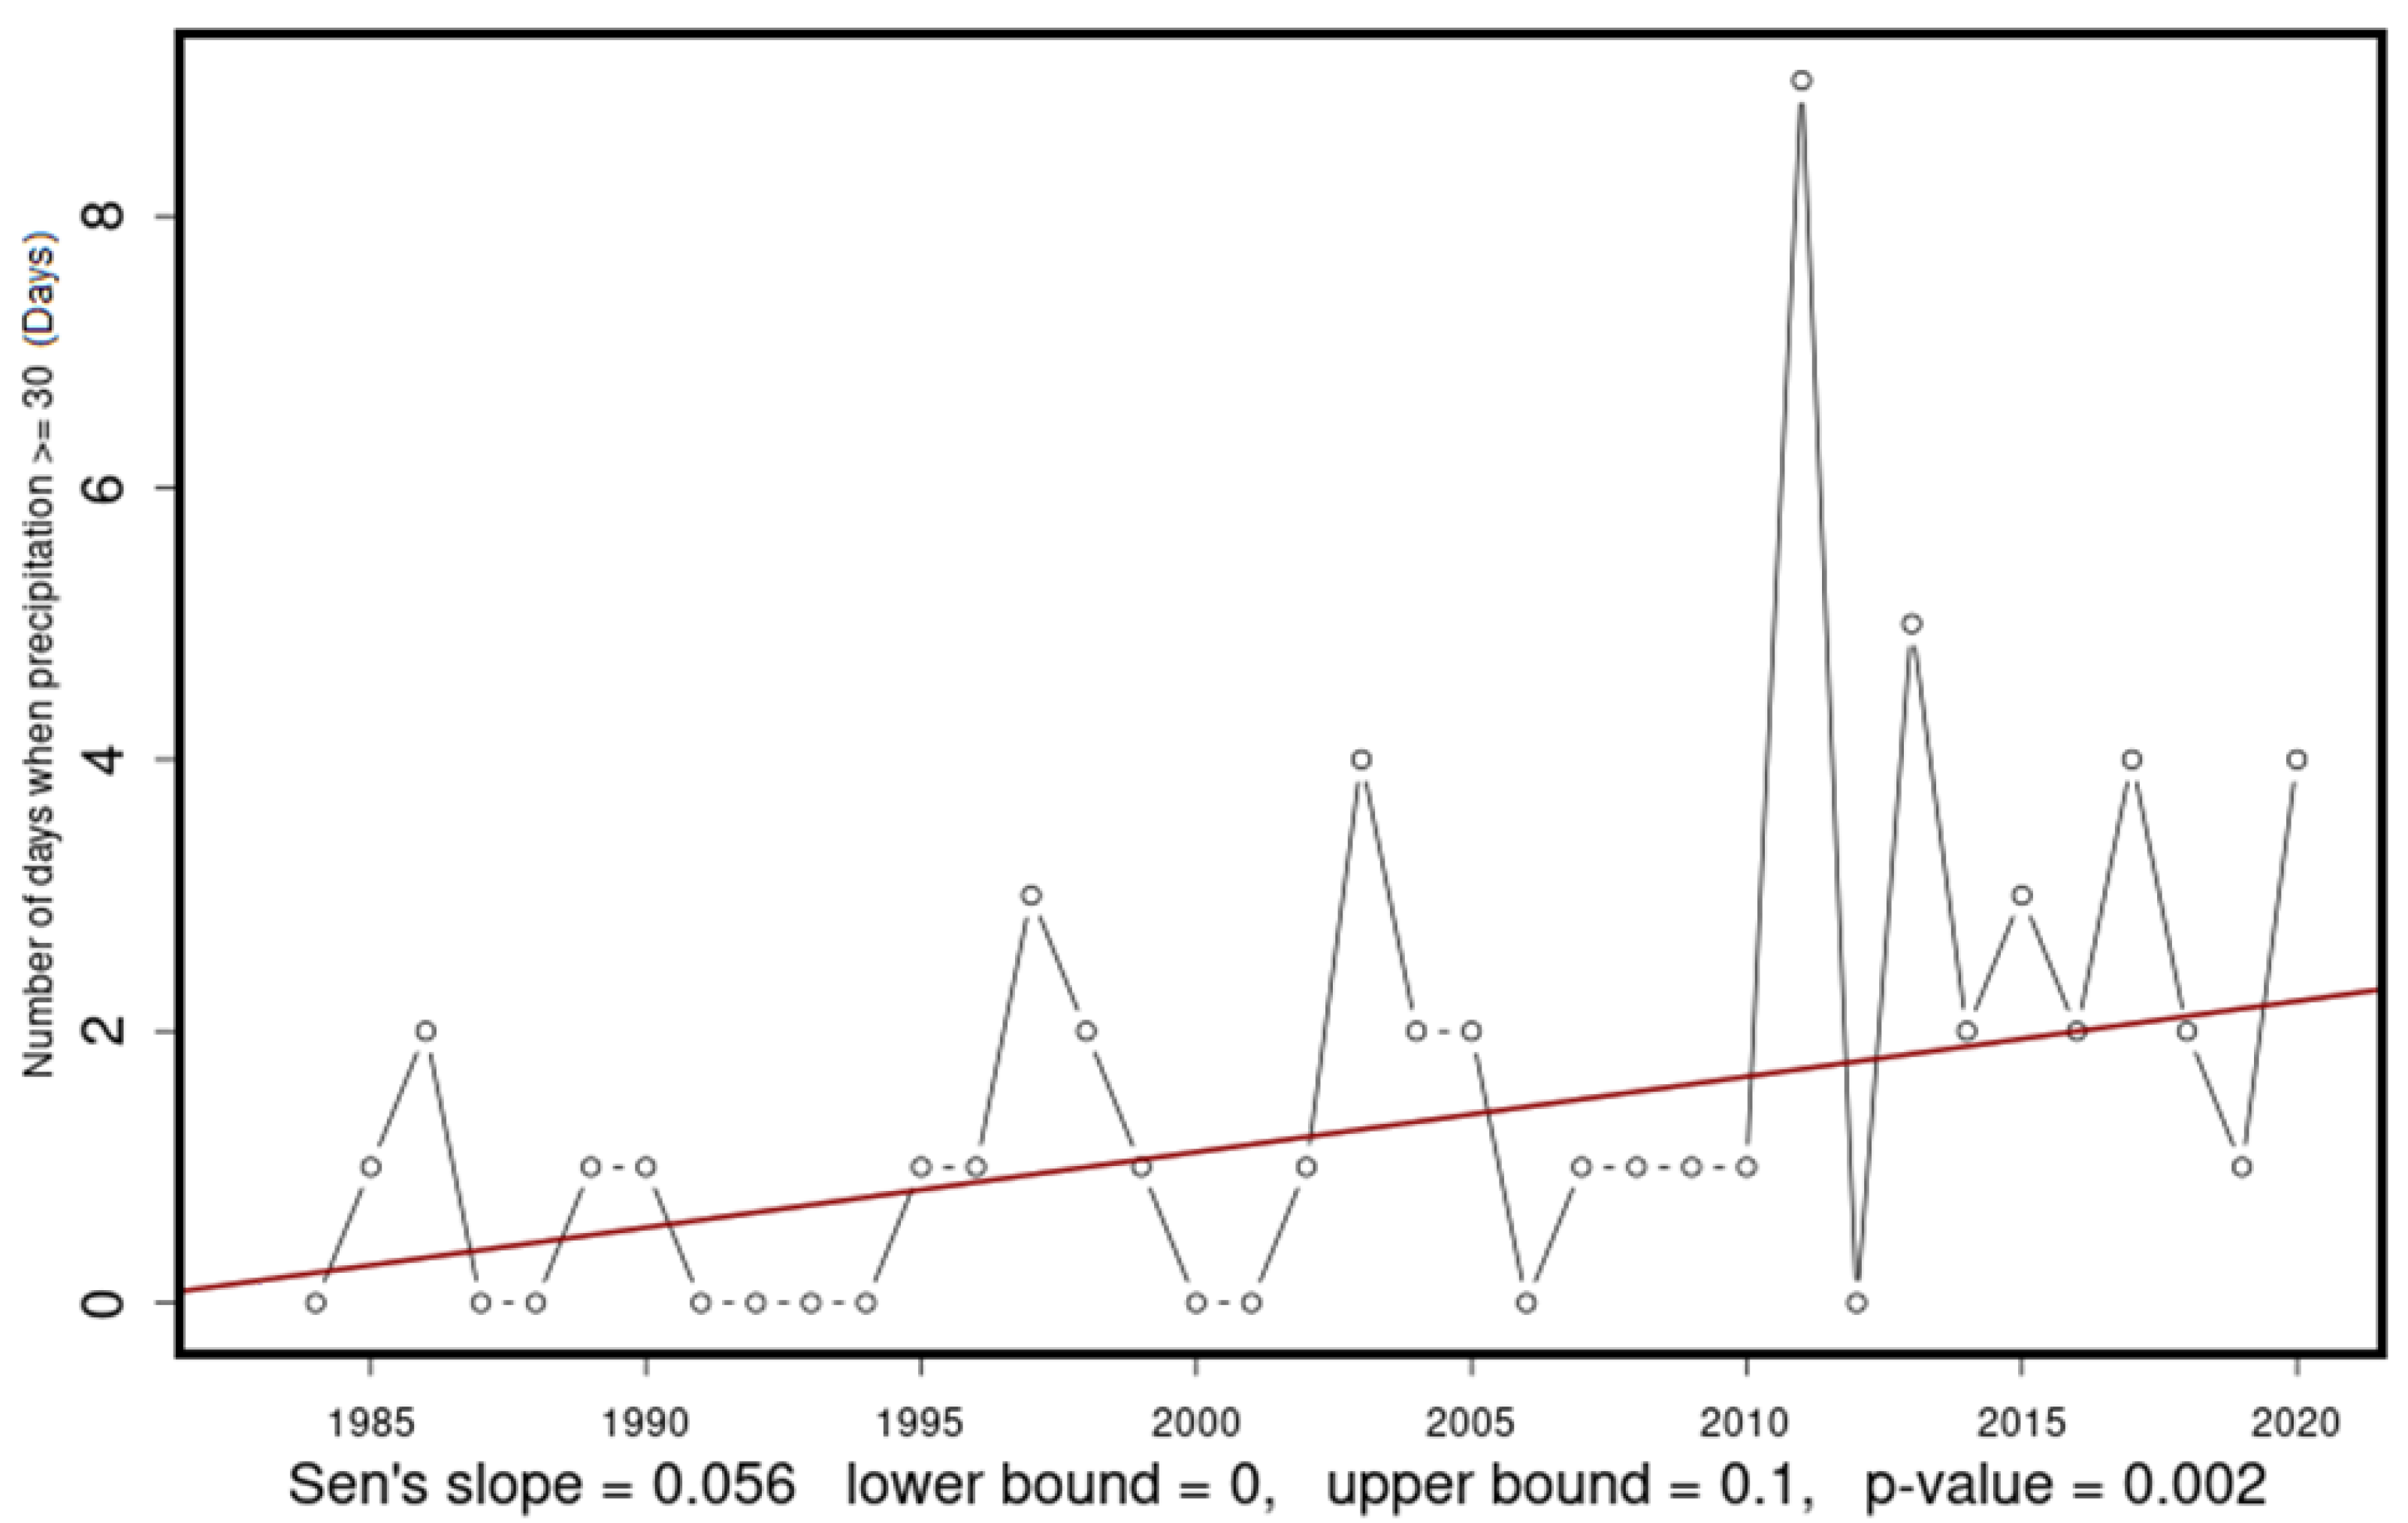
A significant trend (p = 0.001—red line) was observed in the number of days when precipitation exceeded 30 mm (Figure 3). Although the number was increasing, the frequency of such amounts in a year remained low.
The trend (red line) in extreme and very rare rainfall events (greater than the 99th percentile) further confirms that extreme amounts of high rainfall are increasing from 1985 to 2020 (Figure 4). They increased at a rate of 1.702 events/year, which was statistically significant (p = 0.001).
3.2. Discriminability of Land Use/Cover Classes for Cropland Mapping in Harare
The TDSI values ranged from 1.01 to 1.95 in 1984. In 2018, the TDSI values ranged between 1.27 and 2, showing a general improvement compared to 1984 (Table 3). In 1984, croplands and high-density residential classes were the least separable, while in 2018, it was the CBD and high-density residential areas. The most separable were CBD and vegetation and vegetation and water classes in 1984 and 2018, respectively. A higher TDSI in 2018 than in 1984 can be explained by the fact that Landsat 8 provided data with higher quality than the Landsat 5 that was used in 1984. Landsat 8 has a reduced noise-to-signal ratio as well as high radiometric and spectral resolution, which enhances mapping capabilities. The other reason could be that ground truth points obtained by extrapolation of 2018 survey points to 1984 become less accurate as one goes back further in time.
3.3. Land Use/Cover (LULC) Maps for 1984 and 2018
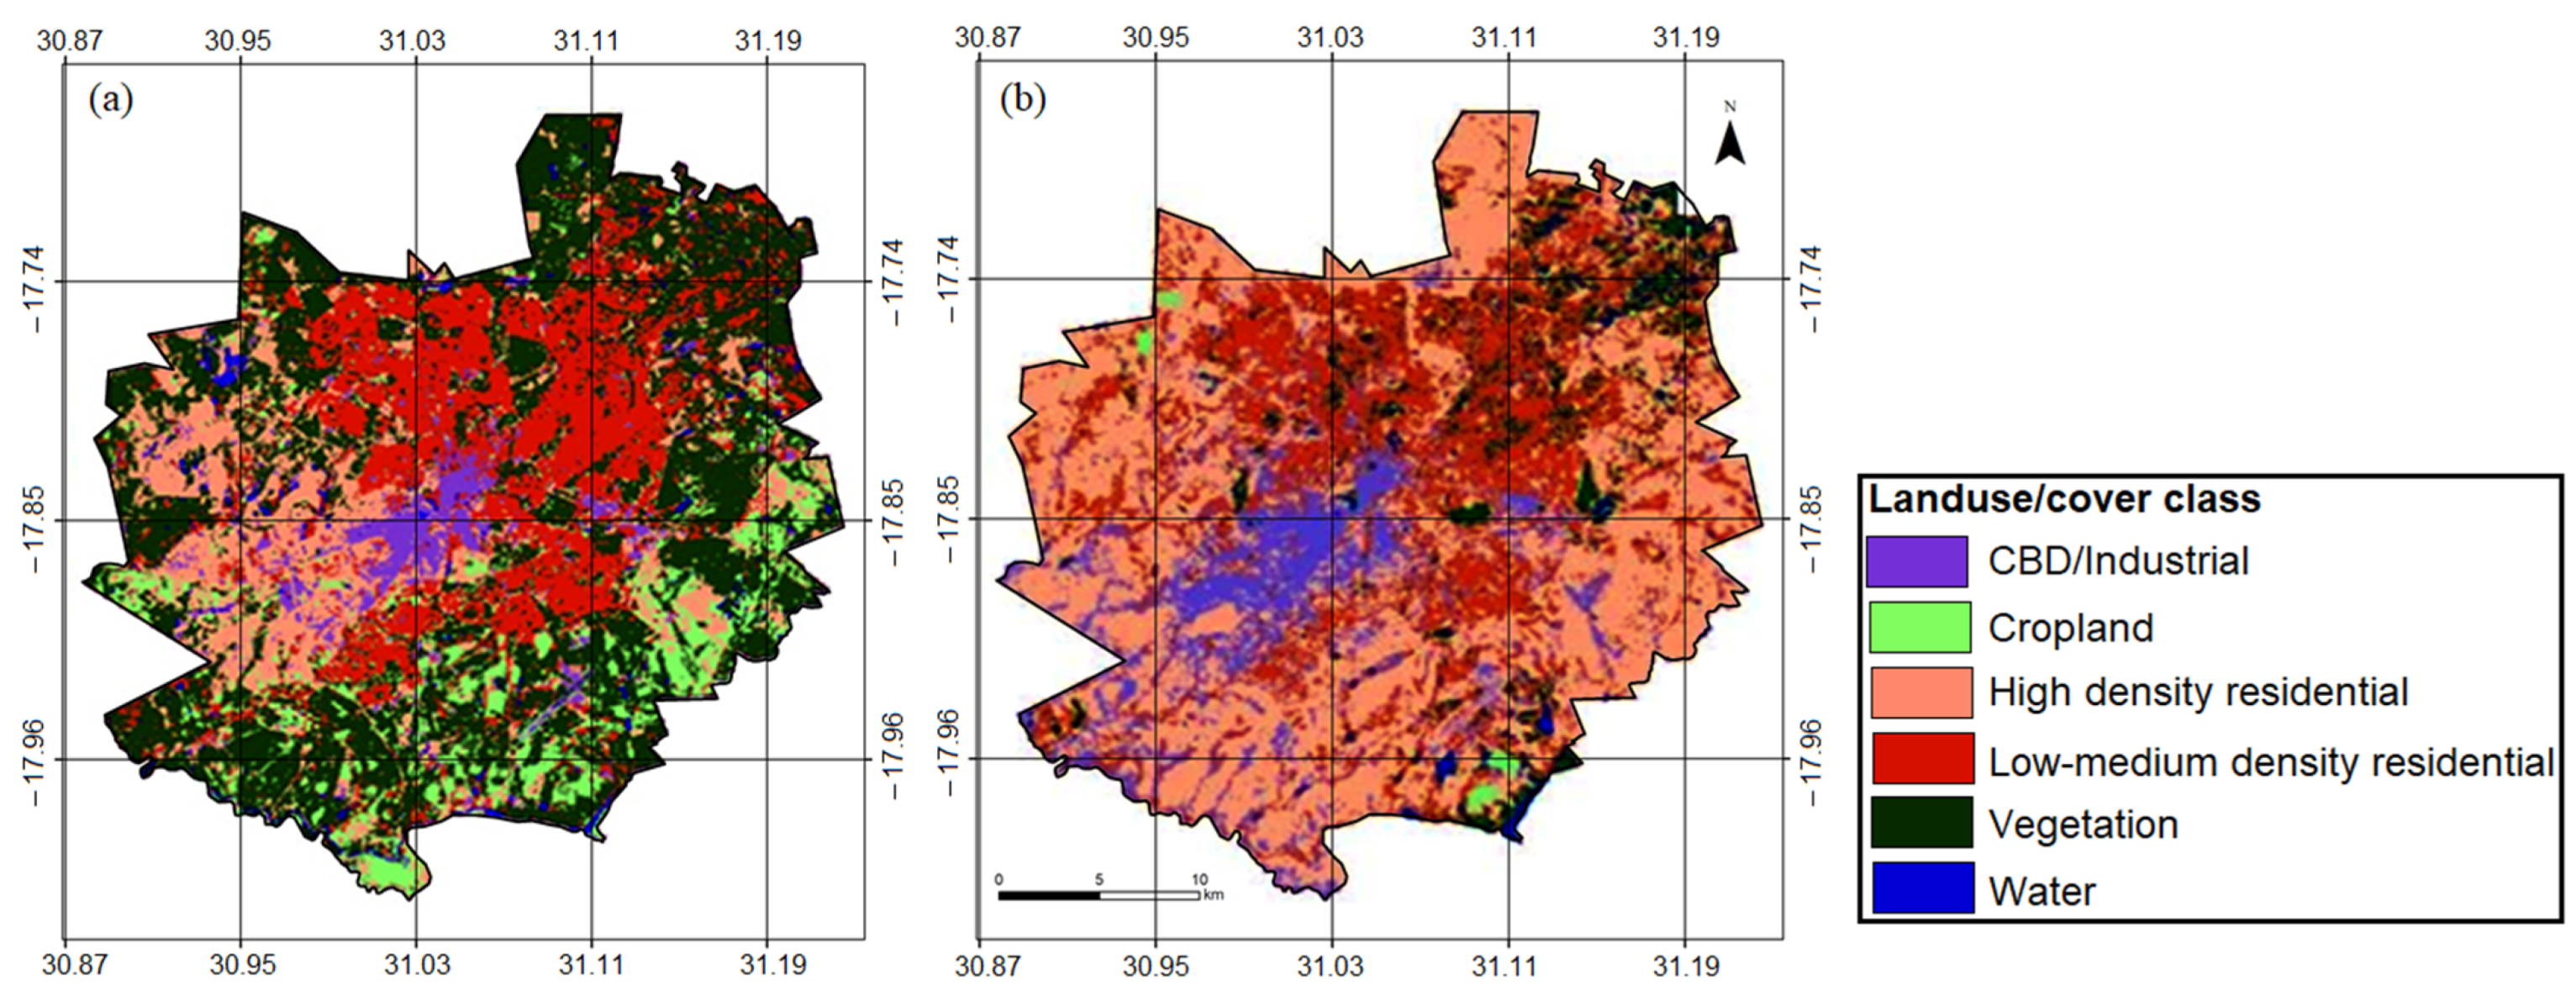
The LULC maps in Figure 5 provide the spatial distribution of classes and changes between 1984 and 2018. Visual inspection of the two images reveals that from 1984 to 2018, there has been a reduction in vegetation and cropland area. While there are modest increases in CBD and LDR areas, there has been a substantial increase in area under HDR from 1984 to 2018. The increase in HDR area is mainly at the expense of vegetation and croplands. Vegetation left is predominantly found in the North-East, where LDR are located.
3.4. Accuracy of Support Vector Machine (SVM)-Based LULC Mapping for 1984 and 2018 in Harare
The producer’s accuracy for the classes was in the range of 68–93% for 1984 and 74–95% for 2018 (Table 4). The user’s accuracy for the classes ranged from 82 to 97% for 1984 and from 83 to 92% for 2018. The overall accuracy values were above 86% for 1984 and 2018, which was good. The Kappa coefficient is one measure of inter-observer agreement, with values from 0.61–0.80 showing substantial agreement and values from 0.81 to 0.99 signifying almost perfect agreement [37]. The kappa coefficient values were above 0.82 for 1984 and 2018, just on the lower side of almost perfect agreement. This study obtained overall accuracies of 87.03% and 86.67% for 1984 and 2018, respectively. Due to improved Landsat 8 data, it was expected that accuracy would be higher in 2018 than in 1984, but results show otherwise. This could be explained by the fact that a city becomes more complex as it grows.
3.5. Observed LULC and Transitions from 1984 to 2018
Post-classification change detection means image classification is performed for two periods and the results are compared. Table 5 displays quantitative LULC dynamics that were observed between 1984 and 2018 as the city was expanding. Built-up areas increased with the decrease in vegetation and cropland areas from 1984 to 2018 in Harare. The highest increase is in high density residential areas, which increased in coverage from 27,650 ha in 1984 to 49,741 ha in 2018, while Low-Medium density residential areas increased from 23,733 ha to 24,246 ha. Vegetation and croplands decreased from 24,470 ha and 11,120 ha to 8230 ha and 2631 ha, respectively. LULC maps obtained after SVM classification and post-classification provided quantitative data to show that cropland area has dropped from 1984 to 2018. Most of the cropland area has been lost to HDR. This is a result of urban sprawl due to normal urban growth and illegal settlements. The results agree with growth patterns obtained from similar studies by Mushore et al. [25] and Kamusoko et al. [24] in Harare.
3.6. Estimation of Best, Average, and Worst Maize Yield in Harare
Using the maize yield data from UZ farm for three seasons, the mean yield and standard deviation from the mean were calculated and found to be 4.67 and 0.39 tons per hectare, respectively. Table 6 shows the summary of seasonal yield data and the computed mean yield and standard deviation for Harare. From the mean yield and standard deviation, the best, average, and worst-case yield per hectare estimated values are 5.1 T/ha, 4.7 T/ha, and 4.3 T/ha, respectively.
The national average yields in communal lands are about 1 to 1.5 tons per hectare, compared with about 5.0 tons per hectare in the former commercial farming sector [38]. Communal areas are predominantly dryland farming areas susceptible to drought, poor soil and fertilizer management, low plant populations, late planting, poor weed control; labor shortages, and insufficient inputs and draught power [38,39,40]. The study area is characterized by a warm, wet season from November to April [24] and favorable conditions for urban farming [5]. Therefore, the mean yield estimate of 4.67 tonnes per hectare derived from Mhizha [35] data is a reasonable estimate to use for Harare to estimate the maize yield given the total cropland area.
3.7. Estimated Maize Yield Change Analysis from 1984 to 2018 in Harare
Using cropland class area and the three estimated maize yield per hectare scenarios in Harare, the estimated change in maize from 1984 to 2018 is shown in Table 7. Table 7 reveals that cropland area for maize, and hence maize produced in Harare, decreased by approximately four times from 1984 to 2018.
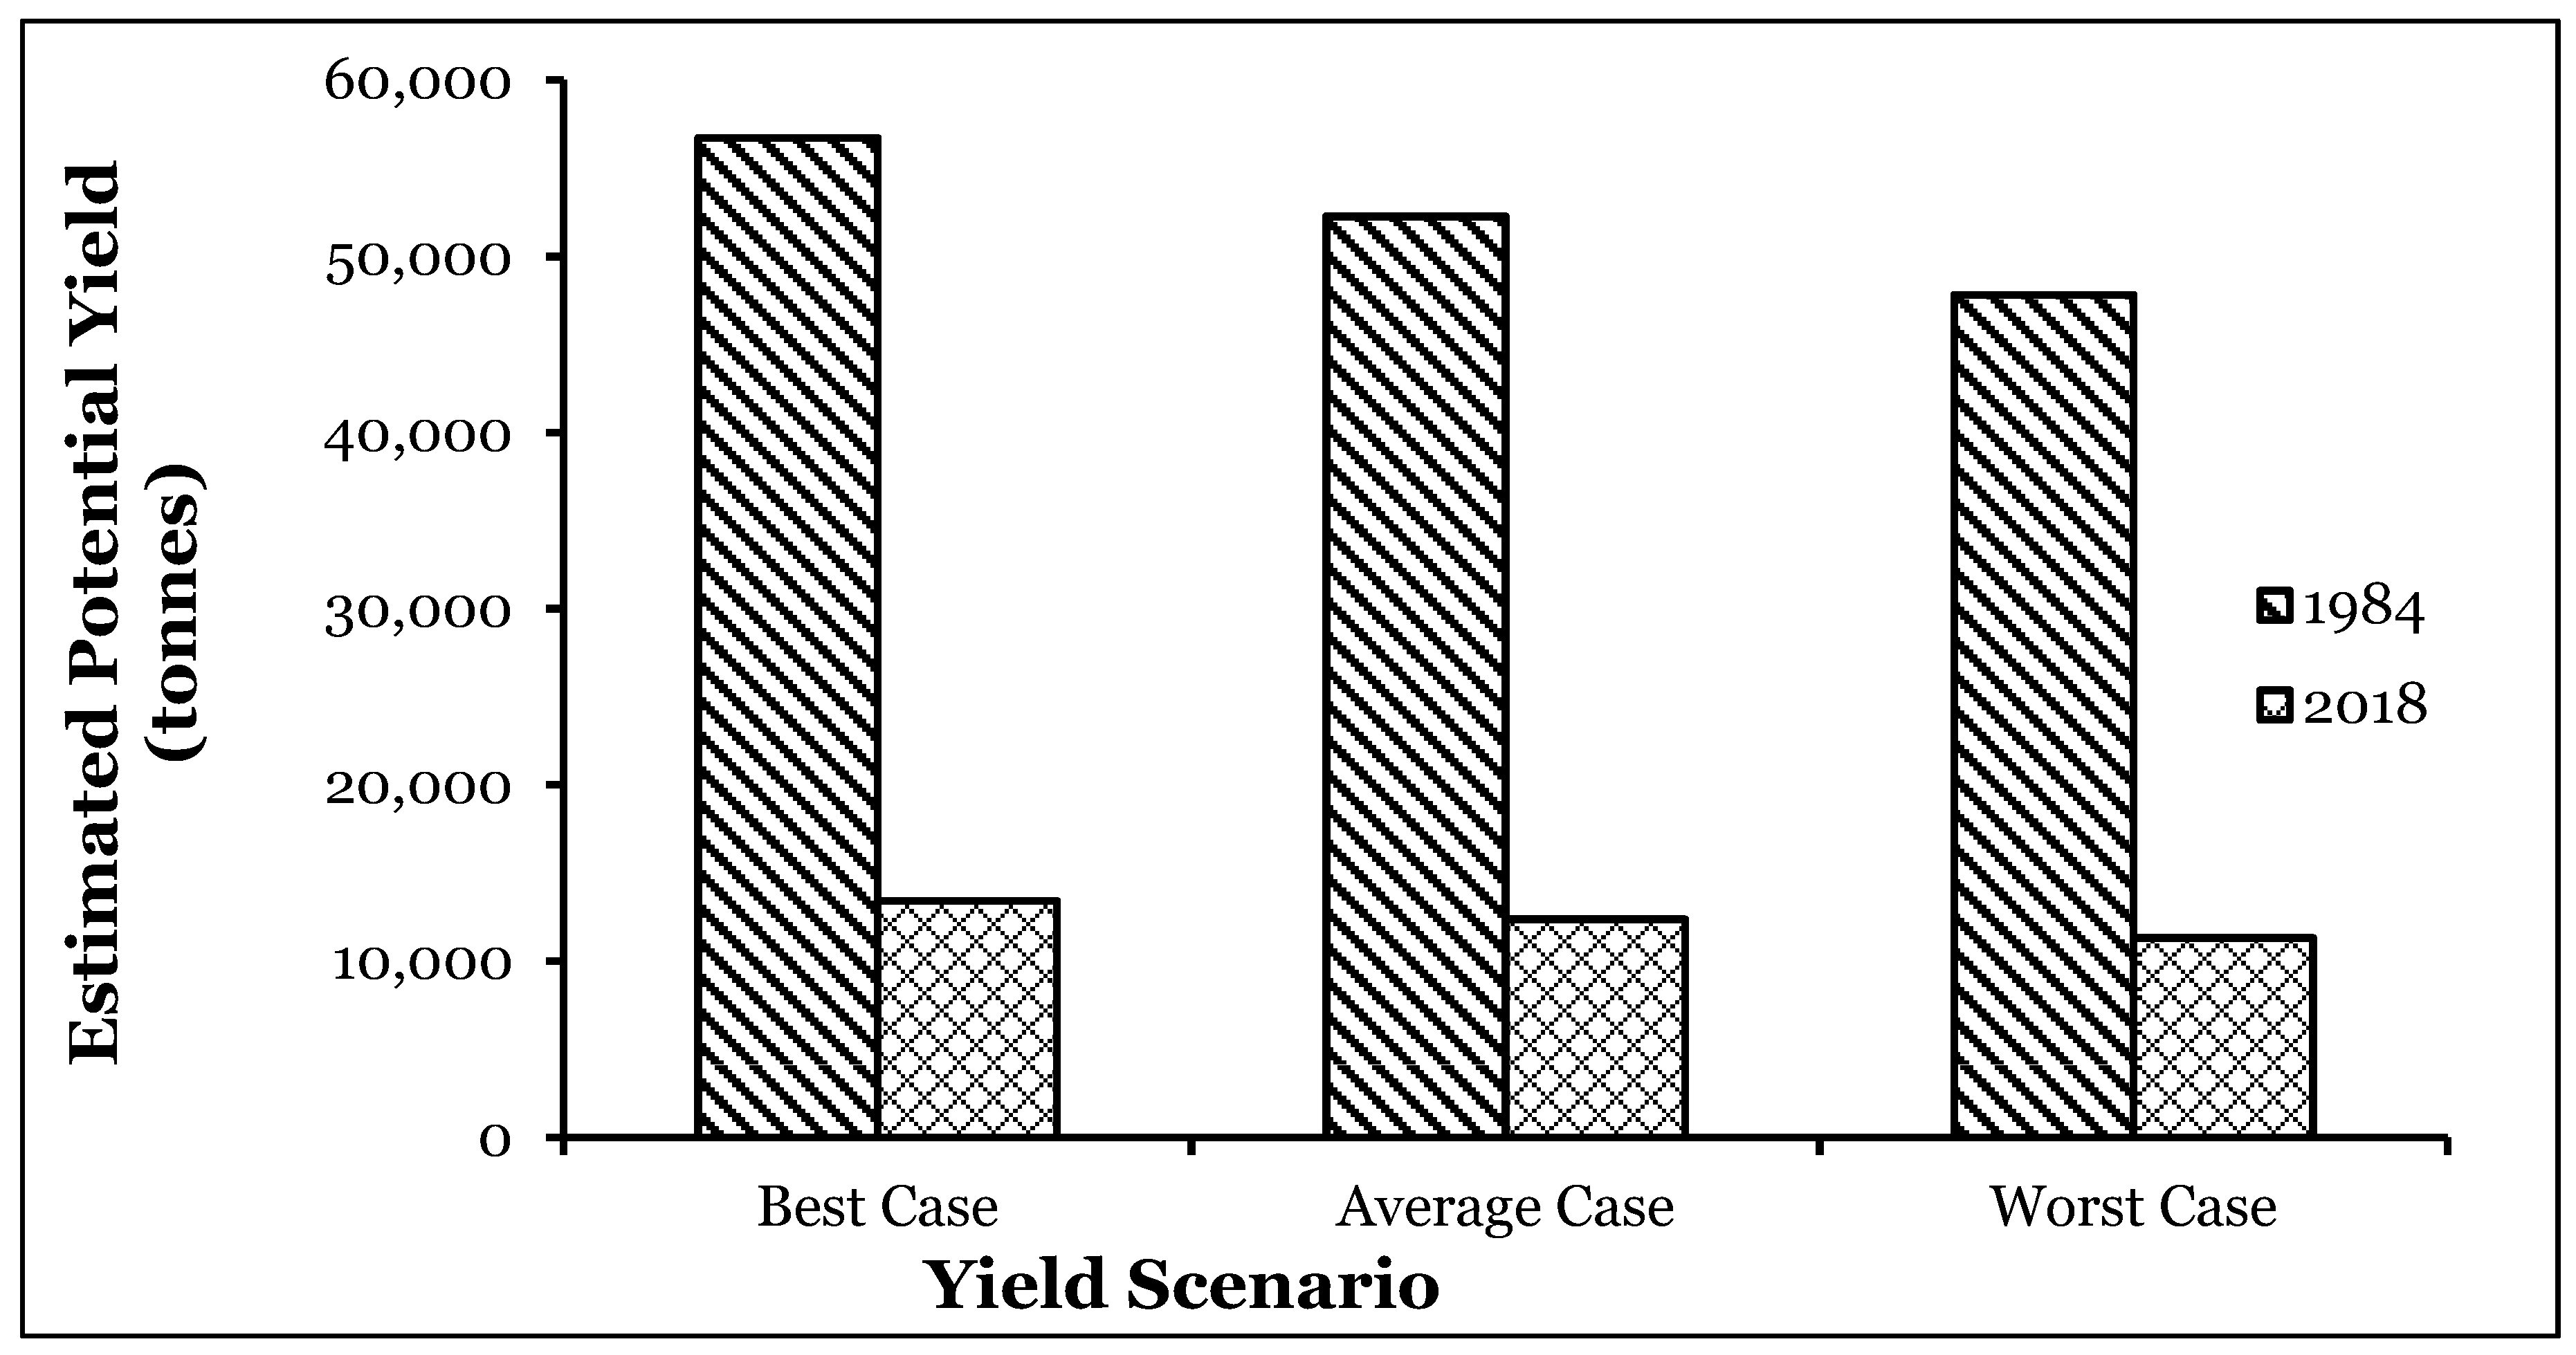
The trend in yield scenarios from 1984 to 2018 is shown in Figure 6. The differences in estimated yield are more apparent from the best-to-worst case scenario for 1984 than 2018 because of the much reduced arable land, as shown in Table 5. As most cropland is under maize crop in Harare Metropolitan, this implies that there has been a reduction in maize production in Harare Metropolitan from 1984 to 2018. Estimated maize yield has been substantially reduced from 1984 to 2018 due to a reduction in cropland area in Harare at the expense of growth in high-density residential areas. The areas constitute both formal house developments and illegal settlements.
4. Conclusions
The study aimed at using remote sensing to estimate changes in maize yield in the Harare metropolitan area between 1984 and 2018. Cropland areas for 1984 and 2018 were retrieved from LULC maps classified with high accuracy using multispectral Landsat 5 and Landsat 8 imageries. Higher overall classification accuracy in 1984 than in 2018 was attributed to misclassifications due to increased complexity as the city grew. Generally high mapping accuracy in both periods was attributed to increased interclass separability due to the use of multispectral data and the high performance of the SVM classification. The growth patterns in Harare were characterized by the replacement of natural and pervious LULC with buildings and impervious surfaces. This resulted in the shrinking of cropland areas between 1984 and 2018. The findings further revealed that Harare’s urban sprawl, which reduced cropland area, was mainly characterized by expansion in high-density residential areas more than other built-up LULC categories. On the other hand, indicators of changes in rainfall showed statistically insignificant patterns over the same period. This implies that rainfall patterns had a minimal effect on the changes in crop production between the periods under study. The growth patterns could be compromising food availability and livelihoods, especially for the low-income strata. Overall, the study showed that using remote sensing can be a useful and inexpensive technique to understand the implications of urban growth on the food security of residents. Future studies should aim to update the investigation to current years or even develop predictive tools to study likely trends in the future. Subsequent studies should also use dynamic yield estimation for different periods and incorporate other factors that act together with land use changes to affect urban crop yield. Urban and agricultural policies and planning should consider the value of sustainable urban agriculture, as it sustains livelihoods and has the potential to significantly contribute to urban agriculture.
Author Contributions
Conceptualization, T.D.M.; Methodology, T.M. and T.D.M.; Formal analysis, H.M. and T.M.; Investigation, H.M. and T.D.M.; Resources, T.M.; Writing–original draft, H.M. and T.D.M.; Writing–review & editing, T.M.; Supervision, T.M. and T.D.M. All authors have read and agreed to the published version of the manuscript.
Funding
This research received no external funding.
Data Availability Statement
The datasets used in this study are readily available upon request.
Conflicts of Interest
The authors declare no conflict of interest.
References
- Zezza, A.; Tasciotti, L. Fighting Poverty and Hunger What Role for Urban Agriculture? [Economic and Social Perspectives; Policy Brief 10]; FAO: Rome, Italy, 2010. [Google Scholar]
- Badmos, O.S.; Rienow, A.; Callo-concha, D.; Greve, K.; Jurgens, C. Urban Development in West Africa—Monitoring and Intensity Analysis of Slum Growth in Lagos: Linking Pattern and Process. Remote Sens. 2018, 10, 1044. [Google Scholar] [CrossRef]
- Ahmed, B.; Ahmed, R. Modeling urban land cover growth dynamics using multioral satellite images: A case study of Dhaka, Bangladesh. ISPRS Int. J. Geoinf. 2012, 1, 3–31. [Google Scholar] [CrossRef]
- Moyo, P. Urban agriculture and poverty mitigation in Zimbabwe: Prospects and obstacles in Bulawayo townships. J. Hum. Ecol. 2013, 42, 125–133. [Google Scholar] [CrossRef]
- Mbiba, B. Urban Agriculture in Harare: Between Suspicion and Repression; University of Sheffield: Sheffield, UK, 1999. [Google Scholar]
- Ncube, N.; Ncube, D. Urban Agriculture and Food Security: A Case Study of Old Pumula suburb of Bulawayo in Zimbabwe. 2016. Available online: https://api.semanticscholar.org/CorpusID:132955272 (accessed on 25 July 2023).
- McDonald, R.I.; Green, P.; Balk, D.; Fekete, B.M.; Revenga, C.; Todd, M.; Montgomery, M. Urban growth, climate change, and freshwater availability. Proc. Natl. Acad. Sci. USA 2011, 108, 6312–6317. [Google Scholar] [CrossRef] [PubMed]
- Zhang, H.; Qi, Z.-F.; Ye, X.-Y.; Cai, Y.-B.; Ma, W.-C.; Chen, M.-N. Analysis of land use/land cover change, population shift, and their effects on spatiotemporal patterns of urban heat islands in metropolitan Shanghai, China. Appl. Geogr. 2013, 44, 121–133. [Google Scholar] [CrossRef]
- Zhou, X.; Wang, Y. Spatial-temporal dynamics of urban green space in response to rapid urbanization and greening policies. Landsc. Urban Plan. 2011, 100, 268–277. [Google Scholar] [CrossRef]
- Gusso, A.; Bordin, F.; Veronez, M.; Cafruni, C.; Lenz, L.; Crija, S. Multitemporal Analysis of Thermal Distribution Characteristics for Urban Heat Islands Management. In Proceedings of the 4th WOrld Sustainability Forum, Basel, Switzerland, 1–30 November 2014; p. f009. [Google Scholar] [CrossRef]
- Moyo, S.; Jha, P.; Yeros, P. The classical agrarian question: Myth, reality and relevance today. Agrar. South J. Political Econ. 2013, 2, 93–119. [Google Scholar] [CrossRef]
- Uddin, S.; Al Ghadban, A.N.; Al Dousari, A.; Al Murad, M.; Al Shamroukh, D. A remote sensing classification for land-cover changes and micro-climate in Kuwait. Int. J. Sustain. Dev. Plan. 2010, 5, 367–377. [Google Scholar] [CrossRef]
- Martilli, A.; Clappier, A.; Rotach, M.W. An urban surface exchange parameterisation for mesoscale models. Bound. Layer Meteorol. 2002, 104, 261–304. [Google Scholar] [CrossRef]
- Feng, H.; Zhao, X.; Chen, F.; Wu, L. Using land use change trajectories to quantify the effects of urbanization on urban heat island. Adv. Space Res. 2014, 53, 463–473. [Google Scholar] [CrossRef]
- Leconte, F.; Bouyer, J.; Claverie, R.; Petrissans, M. Using Local Climate Zone scheme for UHI assessment: Evaluation of the method using mobile measurements. Build. Environ. 2014, 83, 39–49. [Google Scholar] [CrossRef]
- Ogashawara, I.; Bastos, V. A Quantitative Approach for Analyzing the Relationship between Urban Heat Islands and Land Cover. Remote Sens. 2012, 4, 3596–3618. [Google Scholar] [CrossRef]
- Gwenzi, W.; Nyamadzawo, G. Hydrological Impacts of Urbanization and Urban Roof Water Harvesting in Water-limited Catchments: A Review. Environ. Process. 2014, 1, 573–593. [Google Scholar] [CrossRef]
- Mushore, T.; Manatsa, D.; Pedzisai, E.; Muzenda-Mudavanhu, C.; Mushore, W.; Kudzotsa, I. Investigating the implications of meteorological indicators of seasonal rainfall performance on maize yield in a rain-fed agricultural system: Case study of Mt. Darwin District in Zimbabwe. Theor. Appl. Clim. 2017, 129, 1167–1173. [Google Scholar] [CrossRef]
- Easterling, D.; Oceanic, N. CCl/CLIVAR Workshop to develop priority climate indices. Bull. Am. Meteorol. Soc. 2003, 84, 1403–1407. [Google Scholar] [CrossRef]
- Kruger, A.C. Observed trends in daily precipitation indices in South Africa: 1910–2004. Int. J. Climatol. 2006, 2285, 2275–2285. [Google Scholar] [CrossRef]
- Zhang, X.; Yang, F. RClimDex (1.0) User Manual. Clim. Res. Branch Environ. Can. 2004, 22, 13–14. [Google Scholar]
- Athar, H. Trends in observed extreme climate indices in Saudi Arabia during 1979–2008. Int. J. Climatol. 2013, 1574, 1561–1574. [Google Scholar] [CrossRef]
- Dashkhuu, D.; Pil, J.; Ahn, J.; Lee, W. Long-term trends in daily temperature extremes over Mongolia. Weather Clim. Extrem. 2015, 8, 26–33. [Google Scholar] [CrossRef]
- Kamusoko, C.; Gamba, J.; Murakami, H. Monitoring urban spatial growth in Harare Metropolitan province, Zimbabwe. Adv. Remote Sens. 2013, 2, 40776. [Google Scholar] [CrossRef]
- Mushore, T.D.; Odindi, J.; Dube, T.; Mutanga, O. Prediction of future urban surface temperatures using medium resolution satellite data in Harare metropolitan city, Zimbabwe. Build. Environ. 2017, 122, 397–410. [Google Scholar] [CrossRef]
- Gamanya, R.; de Maeyer, P.; de Dapper, M. Object-oriented change detection for the city of Harare, Zimbabwe. Expert Syst. Appl. 2009, 36, 571–588. [Google Scholar] [CrossRef]
- Zimbabwe National Statistics Agency. Zimbabwe Population Census, 2012; Zimbabwe National Statistics Agency: Harare, Zimbabwe, 2012.
- ITT Industries Inc. Solutions. ENVI 4.9; ITT Industries Inc.: Colorado Springs, CO, USA, 2009. [Google Scholar]
- Gibson, A. Installing ArcGIS Desktop 10.2. 2 on Campus Computers. 2014. Available online: http://cardinalscholar.bsu.edu/handle/20.500.14291/198343 (accessed on 25 July 2023).
- Santos, C.A.C.; Neale, C.M.U.; Rao, V.R.; Bernardo, B. Trends in indices for extremes in daily temperature and precipitation over Utah, USA. Int. J. Climatol. 2011, 1822, 1813–1822. [Google Scholar] [CrossRef]
- Kamal, A.O.; Ismail, K.; Abdelkrim, A.; Atika, K.; Driss, E. Climate Change Trend Observations in Morocco: Case Study of Beni Mellal-Khenifra and Darâa-Tafilalt Regions. J. Geosci. Environ. Prot. 2018, 6, 34–50. [Google Scholar] [CrossRef]
- Sohrabi, M.M.; Marofi, S.; Ababaei, B. Investigation of temperature and precipitation indices by using RClimDex and R software in Semnan province 1- Introduction 2-Data and Methods. In Proceedings of the International Conference on Water Resources, Pittsburgh, PA, USA, 22–26 October 2006; pp. 1–6. [Google Scholar]
- Richards, J.A.; Richards, J.A. Remote Sensing Digital Image Analysis; Springer: Berlin/Heidelberg, Germany, 1999; Volume 3. [Google Scholar]
- Nemmour, H.; Chibani, Y. Multiple support vector machines for land cover change detection: An application for mapping urban extensions. ISPRS J. Photogramm. Remote Sens. 2006, 61, 125–133. [Google Scholar] [CrossRef]
- Mhizha, T. Increase of Yield Stability by Staggering the Sowing Dates of Different Varieties of Rainfed Maize in Zimbabwe. Ph.D. Thesis, Katholieke Universiteit Leuven, Leuven, Belgium, 2010. [Google Scholar]
- Mazvimavi, D. Investigating possible changes of extreme annual rainfall in Zimbabwe. Hydrol. Earth Syst. Sci. Discuss. 2008, 5, 1765–1785. [Google Scholar] [CrossRef]
- Viera, A.J.; Garrett, J.M. Understanding interobserver agreement: The kappa statistic. Fam. Med. 2005, 37, 360–363. [Google Scholar] [PubMed]
- Mashingaidze, K. Maize Research and Development; University of Zimbabwe (UZ) Publications/Michigan State University (MSU): East Lansing, MI, USA, 2006. [Google Scholar]
- Mataruka, D.F. Review of the constraints to maize production in the communal areas in Natural Regions III, IV and V. Zimb. Agric. J. 1985, 82, 171–175. [Google Scholar]
- Mataruka, D.F.; Whingwiri, E.E. Maize production in communal areas of Zimbabwe and the research options for improving productivity. In 2. Eastern, Central and Southern Africa Regional Maize Workshop, Harare (Zimbabwe), 15–21 March 1987; CIMMYT: Mexico City, Mexico, 1988. [Google Scholar]
Figure 1.
Location of the study area. District boundaries for Harare (Urban and Rural), Chitungwiza, and Epworth are overlaid on the Landsat 8 image in bands 4, 3, and 2 (R, G, and B) acquired on 20 June 2018.
Figure 1.
Location of the study area. District boundaries for Harare (Urban and Rural), Chitungwiza, and Epworth are overlaid on the Landsat 8 image in bands 4, 3, and 2 (R, G, and B) acquired on 20 June 2018.

Figure 2.
Standardized Precipitation Evapotranspiration Index (SPEI) rainfall anomalies between 1984 and 2020 in Harare.
Figure 2.
Standardized Precipitation Evapotranspiration Index (SPEI) rainfall anomalies between 1984 and 2020 in Harare.

Figure 3.
Trend in extreme high rainfall intensities in Harare.

Figure 4.
Trends in extremely high rainfall events.

Figure 5.
LULC maps obtained from the SVM algorithm: (a) 1984 and (b) 2018.

Figure 6.
Estimated potential maize yield for three scenarios for 1984 and 2018.


Table 1.
Land use/cover classification scheme.
| Land Use/Cover | Description |
|---|---|
| CBD and Industrial | Commercial and services, industrial, transportation, communication and utilities, construction sites, and solid waste landfills |
| High density residential (HDR) | Residential houses with yard area of 300 m2 and below |
| Low and medium density residential (LMR) | Residential houses with yard area above 300 m2 |
| Vegetation | Wooded areas, riverine vegetation, shrubs and bushes, grass cover, golf courses, and parks |
| Croplands | Cultivated land or land being prepared for raising crops, land under irrigation |
| Water | Rivers and reservoirs |
Table 2.
Summary of Landsat images used in the study.
| Sensor | Date | Path/Row |
|---|---|---|
| Landsat 5 TM | 22 June 1984 | 170/072 |
| Landsat 8 | 20 June 2018 | 170/072 |
Table 3.
ROI Separability Test results for ROI classes used in 1984.
| Class Pair Separation | 1984 | 2018 |
|---|---|---|
| Croplands and HDR | 1.01 | 1.52 |
| Croplands and Vegetation | 1.02 | 1.72 |
| LDR and Vegetation | 1.10 | 1.55 |
| Vegetation and Water | 1.26 | 2.00 |
| CBD/Industrial and HDR | 1.36 | 1.27 |
| LDR and Water | 1.41 | 1.96 |
| Croplands and Water | 1.53 | 1.99 |
| Croplands and LDR | 1.61 | 1.45 |
| HDR and LDR | 1.71 | 1.46 |
| HDR and Vegetation | 1.75 | 1.69 |
| CBD/Industrial and Water | 1.76 | 1.99 |
| HDR and Water | 1.77 | 1.99 |
| CBD/Industrial and Croplands | 1.79 | 1.84 |
| CBD/Industrial and LMR | 1.89 | 1.79 |
| CBD/Industrial and Vegetation | 1.95 | 1.93 |
Table 4.
Land use/cover classification accuracies (%) for 1984 and 2018.
| Class | 1984 | 2018 | ||
|---|---|---|---|---|
| Producer’s | User’s | Producer’s | User’s | |
| CBD Industrial | 89.51 | 97.10 | 83.77 | 88.89 |
| Croplands | 68.30 | 82.30 | 84.63 | 92.17 |
| High density | 92.41 | 86.44 | 84.81 | 88.58 |
| Low-Medium density | 90.72 | 86.10 | 94.59 | 83.16 |
| Vegetation | 92.96 | 86.78 | 74.10 | 88.78 |
| Water | 69.56 | 93.19 | 82.65 | 88.54 |
| Overall Accuracy | 87.03 | 86.67 | ||
| Kappa Coefficient | 0.8220 | 0.8236 | ||
Table 5.
Changes in proportional coverage of LULC categories between 1984 and 2018.
| Class | Coverage (Ha) and in Brackets Is Percentage (%) of Total Area | |
|---|---|---|
| 1984 | 2018 | |
| CBD Industrial | 2359 (2.6) | 4672 (5.2) |
| Cropland | 11,120 (12.4) | 2631 (2.9) |
| High density residential | 27,650 (30.7) | 49,741 (55.2) |
| Low-medium density residential | 23,733 (26.4) | 24,246 (26.9) |
| Vegetation | 24,470 (27.2) | 8230 (9.1) |
| Water | 698 (0.8) | 510 (0.6) |
Table 6.
Average maize yields in Harare for the June 2005, July 2006, and August 2007 seasons.
| Season | Yield (T/ha) |
|---|---|
| 2005–06 | 4.97 |
| 2006–07 | 4.23 |
| 2007–08 | 4.81 |
| Mean | 4.67 |
| Standard Deviation | 0.39 |
Table 7.
Estimated maize yield (tons) derived from cropland area and estimated yield (tons/ha).
| Year | Arable Land (ha) | Potential Maize Yield (Tonnes) | ||
|---|---|---|---|---|
| Best Case | Average Case | Worst Case | ||
| 1984 | 11,120 | 56,712 | 52,264 | 47,816 |
| 2018 | 2631 | 13,418 | 12,366 | 11,313 |
Disclaimer/Publisher’s Note: The statements, opinions and data contained in all publications are solely those of the individual author(s) and contributor(s) and not of MDPI and/or the editor(s). MDPI and/or the editor(s) disclaim responsibility for any injury to people or property resulting from any ideas, methods, instructions or products referred to in the content. |
© 2023 by the authors. Licensee MDPI, Basel, Switzerland. This article is an open access article distributed under the terms and conditions of the Creative Commons Attribution (CC BY) license (https://creativecommons.org/licenses/by/4.0/).
Share and Cite
MDPI and ACS Style
Mandigo, H.; Mhizha, T.; Mushore, T.D. Analysis of Urban Maize Yield Response to Urban Sprawl in a Changing Climate: Case of Harare Metropolitan City. Appl. Sci. 2023, 13, 10259. https://doi.org/10.3390/app131810259
AMA Style
Mandigo H, Mhizha T, Mushore TD. Analysis of Urban Maize Yield Response to Urban Sprawl in a Changing Climate: Case of Harare Metropolitan City. Applied Sciences. 2023; 13(18):10259. https://doi.org/10.3390/app131810259
Chicago/Turabian StyleMandigo, Herbert, Teddious Mhizha, and Terence Darlington Mushore. 2023. "Analysis of Urban Maize Yield Response to Urban Sprawl in a Changing Climate: Case of Harare Metropolitan City" Applied Sciences 13, no. 18: 10259. https://doi.org/10.3390/app131810259
Note that from the first issue of 2016, this journal uses article numbers instead of page numbers. See further details here.