
Characteristics and Evolution of the Response of the Lower Atmosphere to the Tonga Volcanic Eruption

1
Wuxi Research Institute, Nanjing Information Engineering University, Wuxi 214100, China
2
School of Remote Sensing and Geomatics Engineering, Nanjing University of Information Science & Technology, Nanjing 210044, China
3
School of Resources and Environmental Engineering, Tianshui Normal University, Tianshui 741001, China
4
The Meteorological Observation Center of China Meteorological Administration, No. 46, South Street, Zhongguan Village, Haidian District, Beijing 100081, China
5
School of Automation, Beijing Institute of Technology, Beijing 100081, China
*
Author to whom correspondence should be addressed.
Appl. Sci. 2023, 13(18), 10095; https://doi.org/10.3390/app131810095
Submission received: 21 June 2023
/
Revised: 4 September 2023
/
Accepted: 5 September 2023
/
Published: 7 September 2023
Abstract
:Research concerning the response characteristics of lower atmosphere to volcanic eruption is a key and hot topic in the field of volcanic environment research. Against the background of a submarine volcano in the South Pacific island country of Hunga Tonga–Hunga Ha’apai (HTHH) on 15 January 2022, this paper explores the response characteristics of this volcanic eruption on environmental factors in the lower atmosphere region using a priori data such as ERA5 reanalysis data, water vapor data from GNSS inversion and surface temperature data from Landsat inversion for the Tonga Islands region. Among them, (1) The amount of precipitable water (PWV) in Tonga was abnormally high on 15 January. (2) The water vapor flux was mainly in the lower space below 850 hPa. (3) The average surface temperature in December 2021 was higher. In February 2022, the average surface temperature was lower. (4) There was a low-pressure center near 30° S on the south side of Tonga volcano on 14 January, and a new low-pressure center was formed on the east side of Tonga volcano after the eruption of Tonga volcano on 15 January. Furthermore, the precipitation area of Tonga increased in January and decreased in February 2022. The PWV values, water vapor fluxes, temperature and circulation response characteristics, and precipitation characteristics show that the volcanic eruption affected part of the atmospheric and oceanic circulation, and water vapor was transported to the low-pressure center along the direction of atmospheric circulation. With the continuous water vapor transport, precipitation formed in Tonga, and the intensity and area of precipitation in Tonga increased significantly in January. Thus, the volcanic eruption could have significantly triggered the response between the low-pressure center, PWV, precipitation and surface temperature in the lower atmosphere, which influenced the environmental characteristics of this eruption.
1. Introduction
The lower atmosphere refers to the Earth’s atmosphere below 25 km in altitude [1]. It includes the troposphere and the lower and middle stratosphere. The lower atmosphere contains more than 80 percent of the air in the entire Earth’s atmosphere and has a direct impact on weather and climate. In particular, most environmental responses to natural disasters such as volcanoes, earthquakes, and tsunamis occur in the lower atmosphere. For example, volcanic eruptions emit a large amount of ash and gases, mainly residing in the stratosphere and seriously impacting the Earth’s climate [2]. Seismological and climatological methods mainly study the environmental response of volcanic eruptions in the lower atmosphere. However, these methods study mainly one environmental factor and need help to obtain the response characteristics of the whole lower atmosphere. The results are most powerful when combined with other methods, such as low-pressure centers, water vapor, precipitation, surface temperature, and volcanological studies [3,4].
Significant volcanic eruptions regulate atmospheric and oceanic circulation in the lower atmosphere and thus determine the genesis and activity of cyclones in the Pacific [5]. Meanwhile, cyclone and Sea Surface temperature (SST) [6], large-scale circulation [7,8] and precipitation [9] were directly related. Cyclones will affect the direction of circulation and thus affect water vapor transport, which is a necessary condition for forming precipitation [10]. Tonga is located in the Southwest Pacific Convergence Zone (SPCZ), which is generally regarded as a breeding area for cyclones [11] because the region within 10 degrees of the polar position of the average SPCZ has favorable conditions for the occurrence of tropical cyclones [12,13].
Volcanoes release large amounts of volcanic gases in the lower atmosphere when they erupt, with water vapor accounting for 60% to 90% of the total gas volume [14]. During its change, water vapor absorbs and releases large amounts of latent heat, directly affecting ground and air temperatures and thus influencing the formation and evolution of weather systems. Numerous studies have shown anomalous changes in water vapor both before and after geological hazards [15,16,17]; for example, there may be a sudden increase in columnar water vapor in the atmosphere before an earthquake, and this is attributed to increased evaporation due to increased surface heat flux. Water vapor may decrease after an earthquake, while over the ocean, water vapor is found to increase after an earthquake [18]. Severe weather conditions related to significant transient changes in atmospheric water content, such as low pressure and storms, can be well identified by the abrupt change in precipitable water vapor (PWV) [19,20]. Atmospheric water vapor content is also a critical factor in studying climate change and volcanic activity through latent atmospheric heat and surface evaporation, and small changes in water vapor content can amplify temperature changes caused by other greenhouse gases [21,22,23]. PWV can also determine atmospheric temperature [24]. Both climate models and observations confirm that regional increases (decreases) in PWV are strongly correlated with increases (decreases) in surface temperature [25,26,27].
Volcanic eruptions release large amounts of gas into the atmosphere, where the volcanic gases undergo a series of chemical reactions to form volcanic aerosols [28]. Aerosols reduce the direct solar radiation and increase the scattering amplitude, ultimately reducing the total solar emissivity, possibly lowering surface temperatures [29,30,31]. Wang et al. [32] observed negative surface temperature anomalies after eruptions in a volcanic eruption. Okazaki et al. [33] found similar temperature decreases between ~10.5 and ~11.5 km altitude for the April 2010 Eyjafjallajökull eruption and the June 2011 Puyehue eruption. The advantages and effectiveness of satellite remote sensing for volcanoes are demonstrated by a large number of thermal infrared images for the time-series monitoring of surface temperatures [34,35,36,37].
In response to the preliminary and incomplete study of the environmental response of the lower atmosphere during the volcanic eruption, this paper describes the environmental response characteristics of the lower atmosphere of the eruption in terms of PWV, water vapor flux, surface temperature, low-pressure center, and precipitation. The analysis found that the volcanic eruption could have significantly triggered the response between the low-pressure center, PWV, precipitation, and surface temperature in the lower atmosphere, which influenced the environmental characteristics of this eruption.
2. Datasets and Methodology
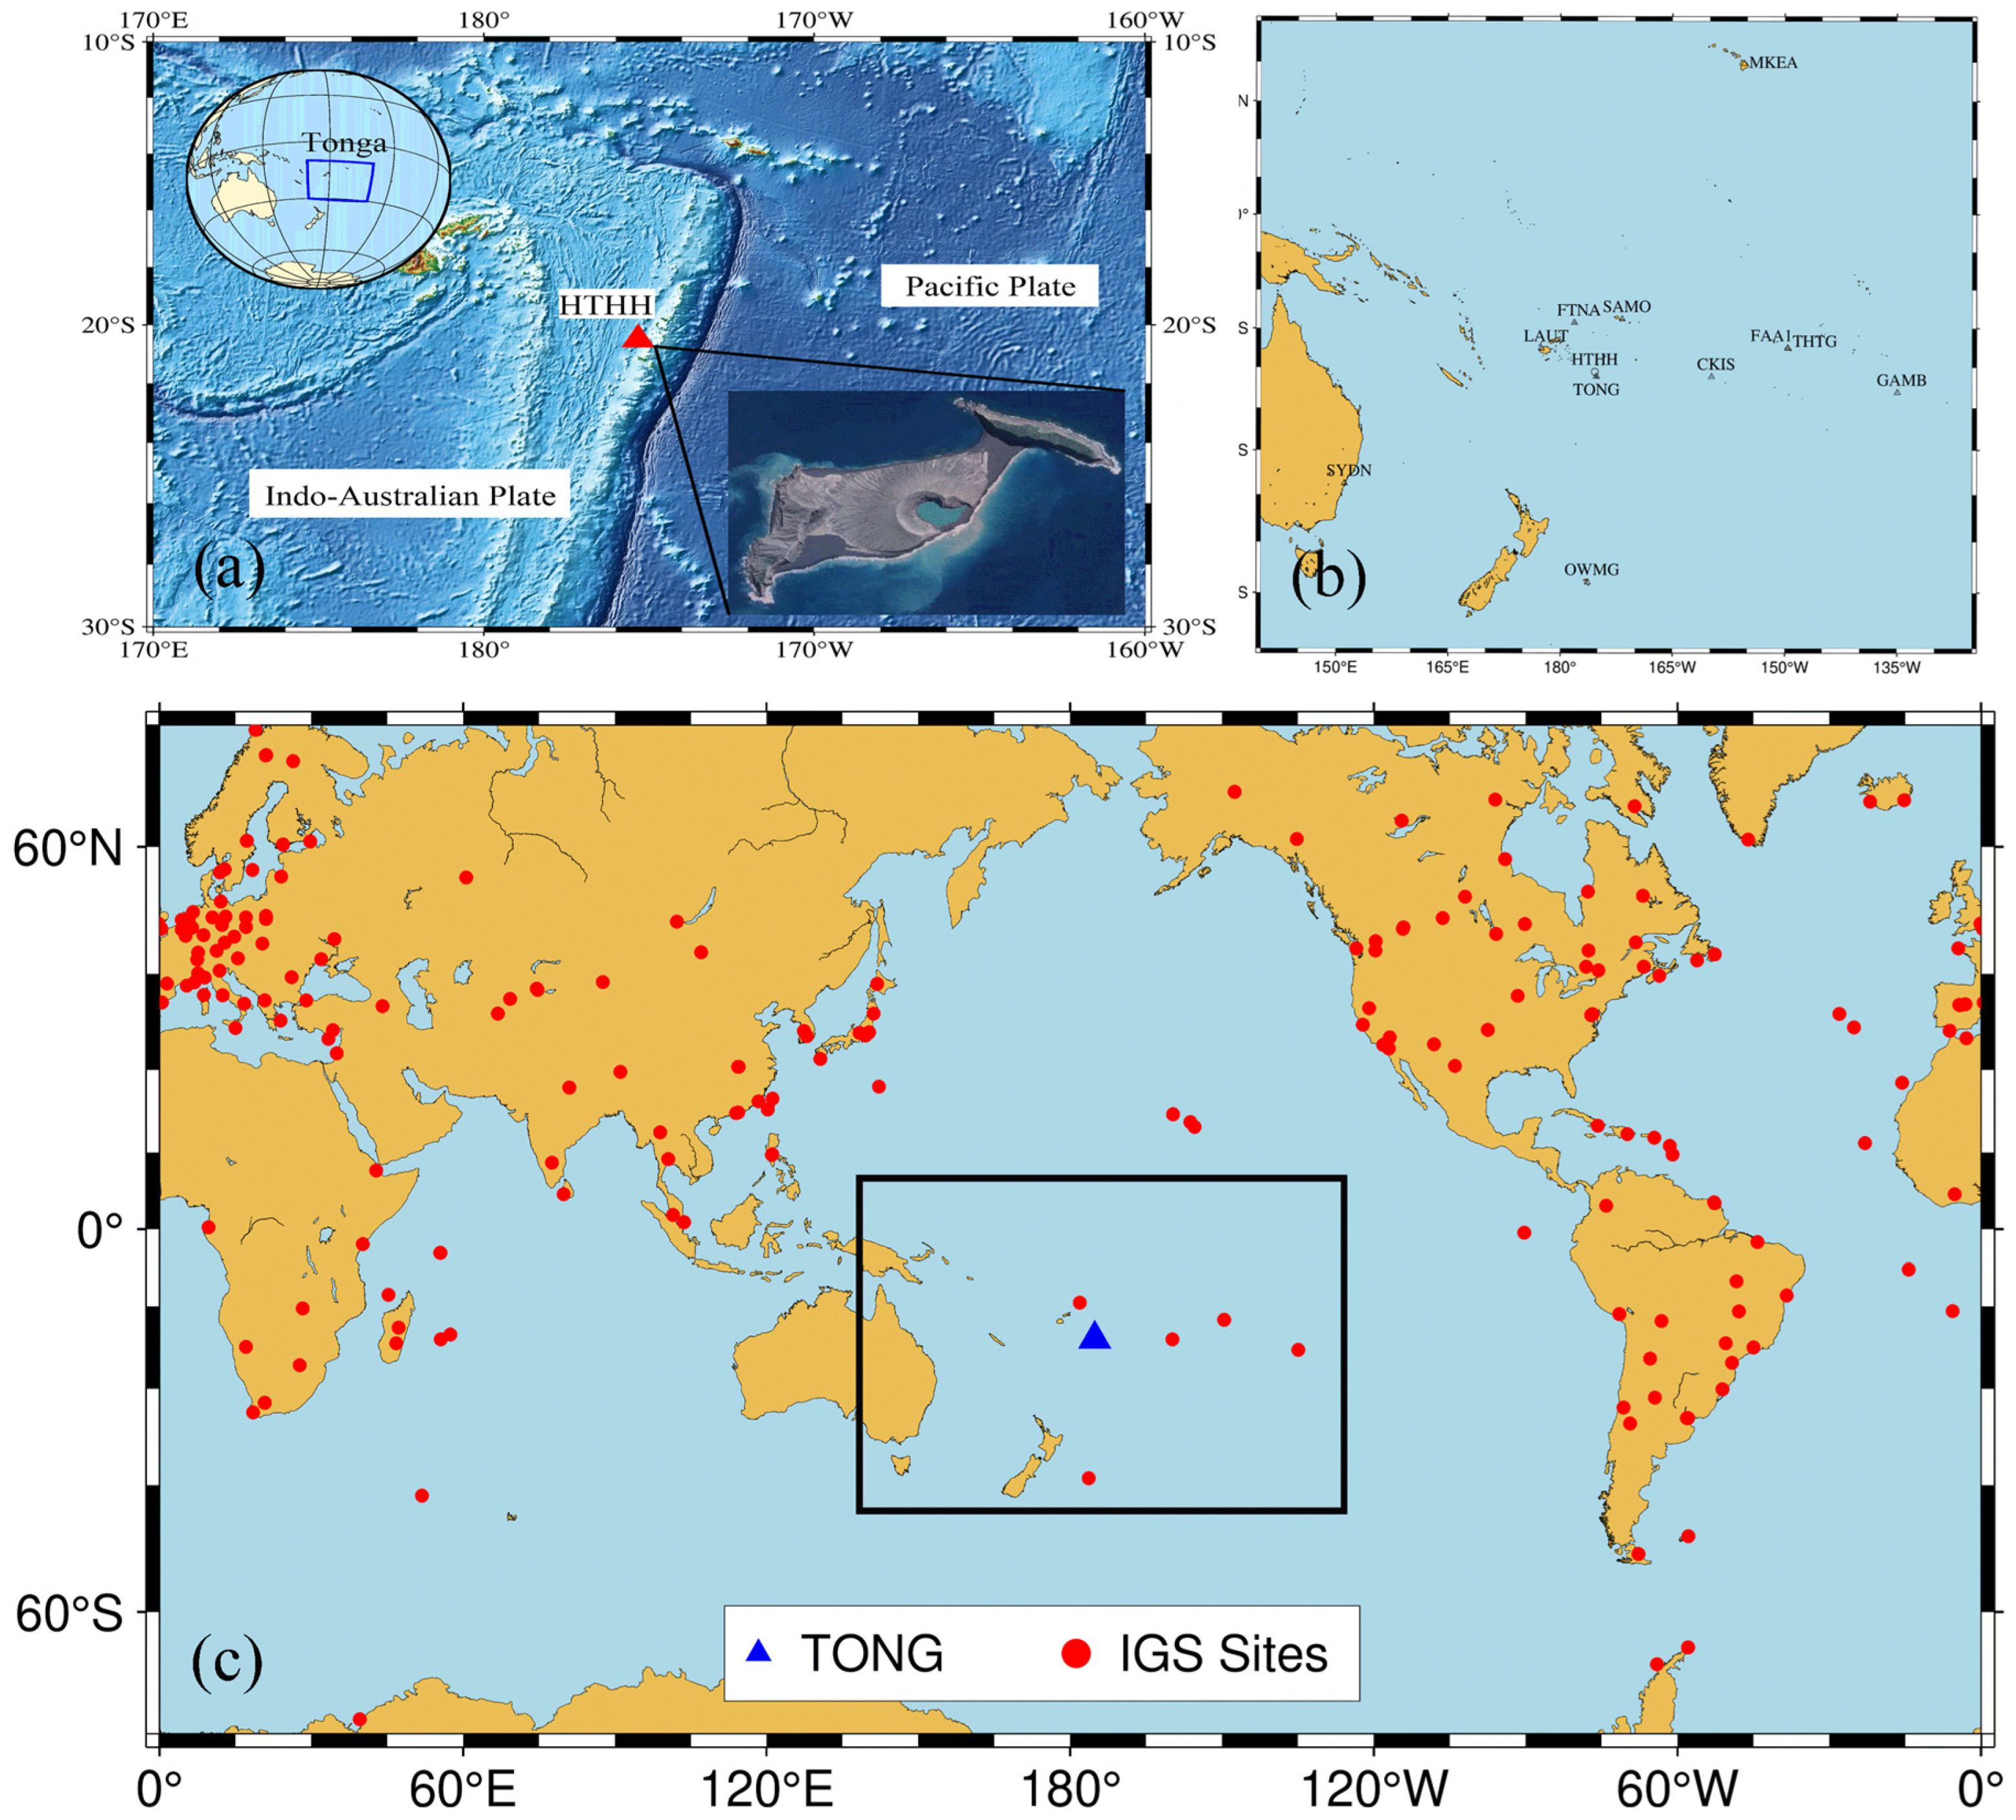
The violent eruption of a submarine volcano and tsunami on Ahapai Island (HTHH) (Figure 1a), Tonga, on 15 January 2022, has attracted widespread international attention. In this paper, we investigate the response characteristics of this volcanic eruption to environmental factors in the lower atmosphere region using a priori data such as ERA5 reanalysis data, water vapor data from GNSS inversion and surface temperature data from Landsat inversion for the Tonga Islands region.
The surface temperature data are Landsat OLI/TIRS sensor data released by the United States Geological Survey (USGS) and cropped from April 2019 to April 2022 at a spatial resolution of 30 m. The atmospheric circulation, precipitation, water vapor flux, and water vapor flux dispersion data used in the experiment are from the European Centre for Medium-Range Weather Forecasts (ECMWF) ERA5 reanalysis. The climate state used for the experiment is from 1981 to 2010. The GNSS data used in the experiment are provided by an international collaboration established by the International Association of Geodesy (IAG), which provides GNSS observations from various tracking stations and various products of the IGS. Data from 11 regional IGS stations (Figure 1b) worldwide and 237 IGS stations (Figure 1c) in Tonga were selected from January 2020 to March 2022 for the GNSS/MET net inversion of water vapor using GAMIT/GlobK software (version 10.71).
The surface temperature inversion is mainly based on the surface thermal radiation observed via the thermal infrared sensor of the satellite. Then, the atmospheric influence is subtracted from it to obtain the surface thermal radiation intensity, and finally, the surface temperature is obtained by converting the thermal radiation intensity. PWV is obtained based on the basic theory of the ground-based GNSS inversion of atmospheric precipitable water, i.e., the inversion of PWV via the PWV and ZWD relationship equation. The water vapor flux and water vapor flux divergence are calculated from meteorological elements such as air density, specific humidity, and wind speed.
2.1. Calculation of Blackbody Radiant Brightness and Surface Temperature
Using the radiative transfer equation:
where is the surface-specific emissivity; is the actual surface temperature (in ); is the thermal luminosity of the blackbody; is the atmospheric transmittance in the thermal infrared band. Then, the radiant luminosity of a blackbody at temperature in the thermal infrared band is
For TIRSBand10 data, ,.
2.2. GNSS PWV Inversion
When GNSS signal passes through the atmosphere, the signal delay is caused by the atmosphere, namely Zenith Total Delay (ZTD). ZTD is mainly composed of ionospheric delay and tropospheric delay, among which, the ionospheric delay can eliminate 99% of the influence via a dual-frequency receiver. Tropospheric delay is mainly composed of Zenith Hydrostatic Delay (ZHD) and Zenith Wet Delay (ZWD), that is, ZWD = ZTD − ZHD.
where , and represent atmospheric refraction constants, respectively. is dry air gas constant; and are the local pressure and compressibility coefficient of water vapor, respectively. and represent the top tropospheric height and the height of the station, respectively. ZHD can be obtained from site information and ground pressure.
where is the ground pressure of the station, in units of ; is the geographical latitude of the station, and is the altitude of the station, in km.
where represents water density; ; is the weighted average temperature of the atmosphere, which can be obtained via the IGPT2w model proposed by Huang [38].
2.3. Water Vapor Flux
The whole layer water vapor flux can be written as [39]:
where is the acceleration of gravity, is the specific humidity, is the surface pressure, is the upper boundary pressure and represents the wind speed vector. The wind speed can be divided into a latitudinal component (, positive to the east) and a longitudinal component (, favorable to the north), so the whole layer of water vapor flux can also be written in the form of latitudinal and longitudinal members:
3. Results and Discussion
3.1. Analysis of PWV Values
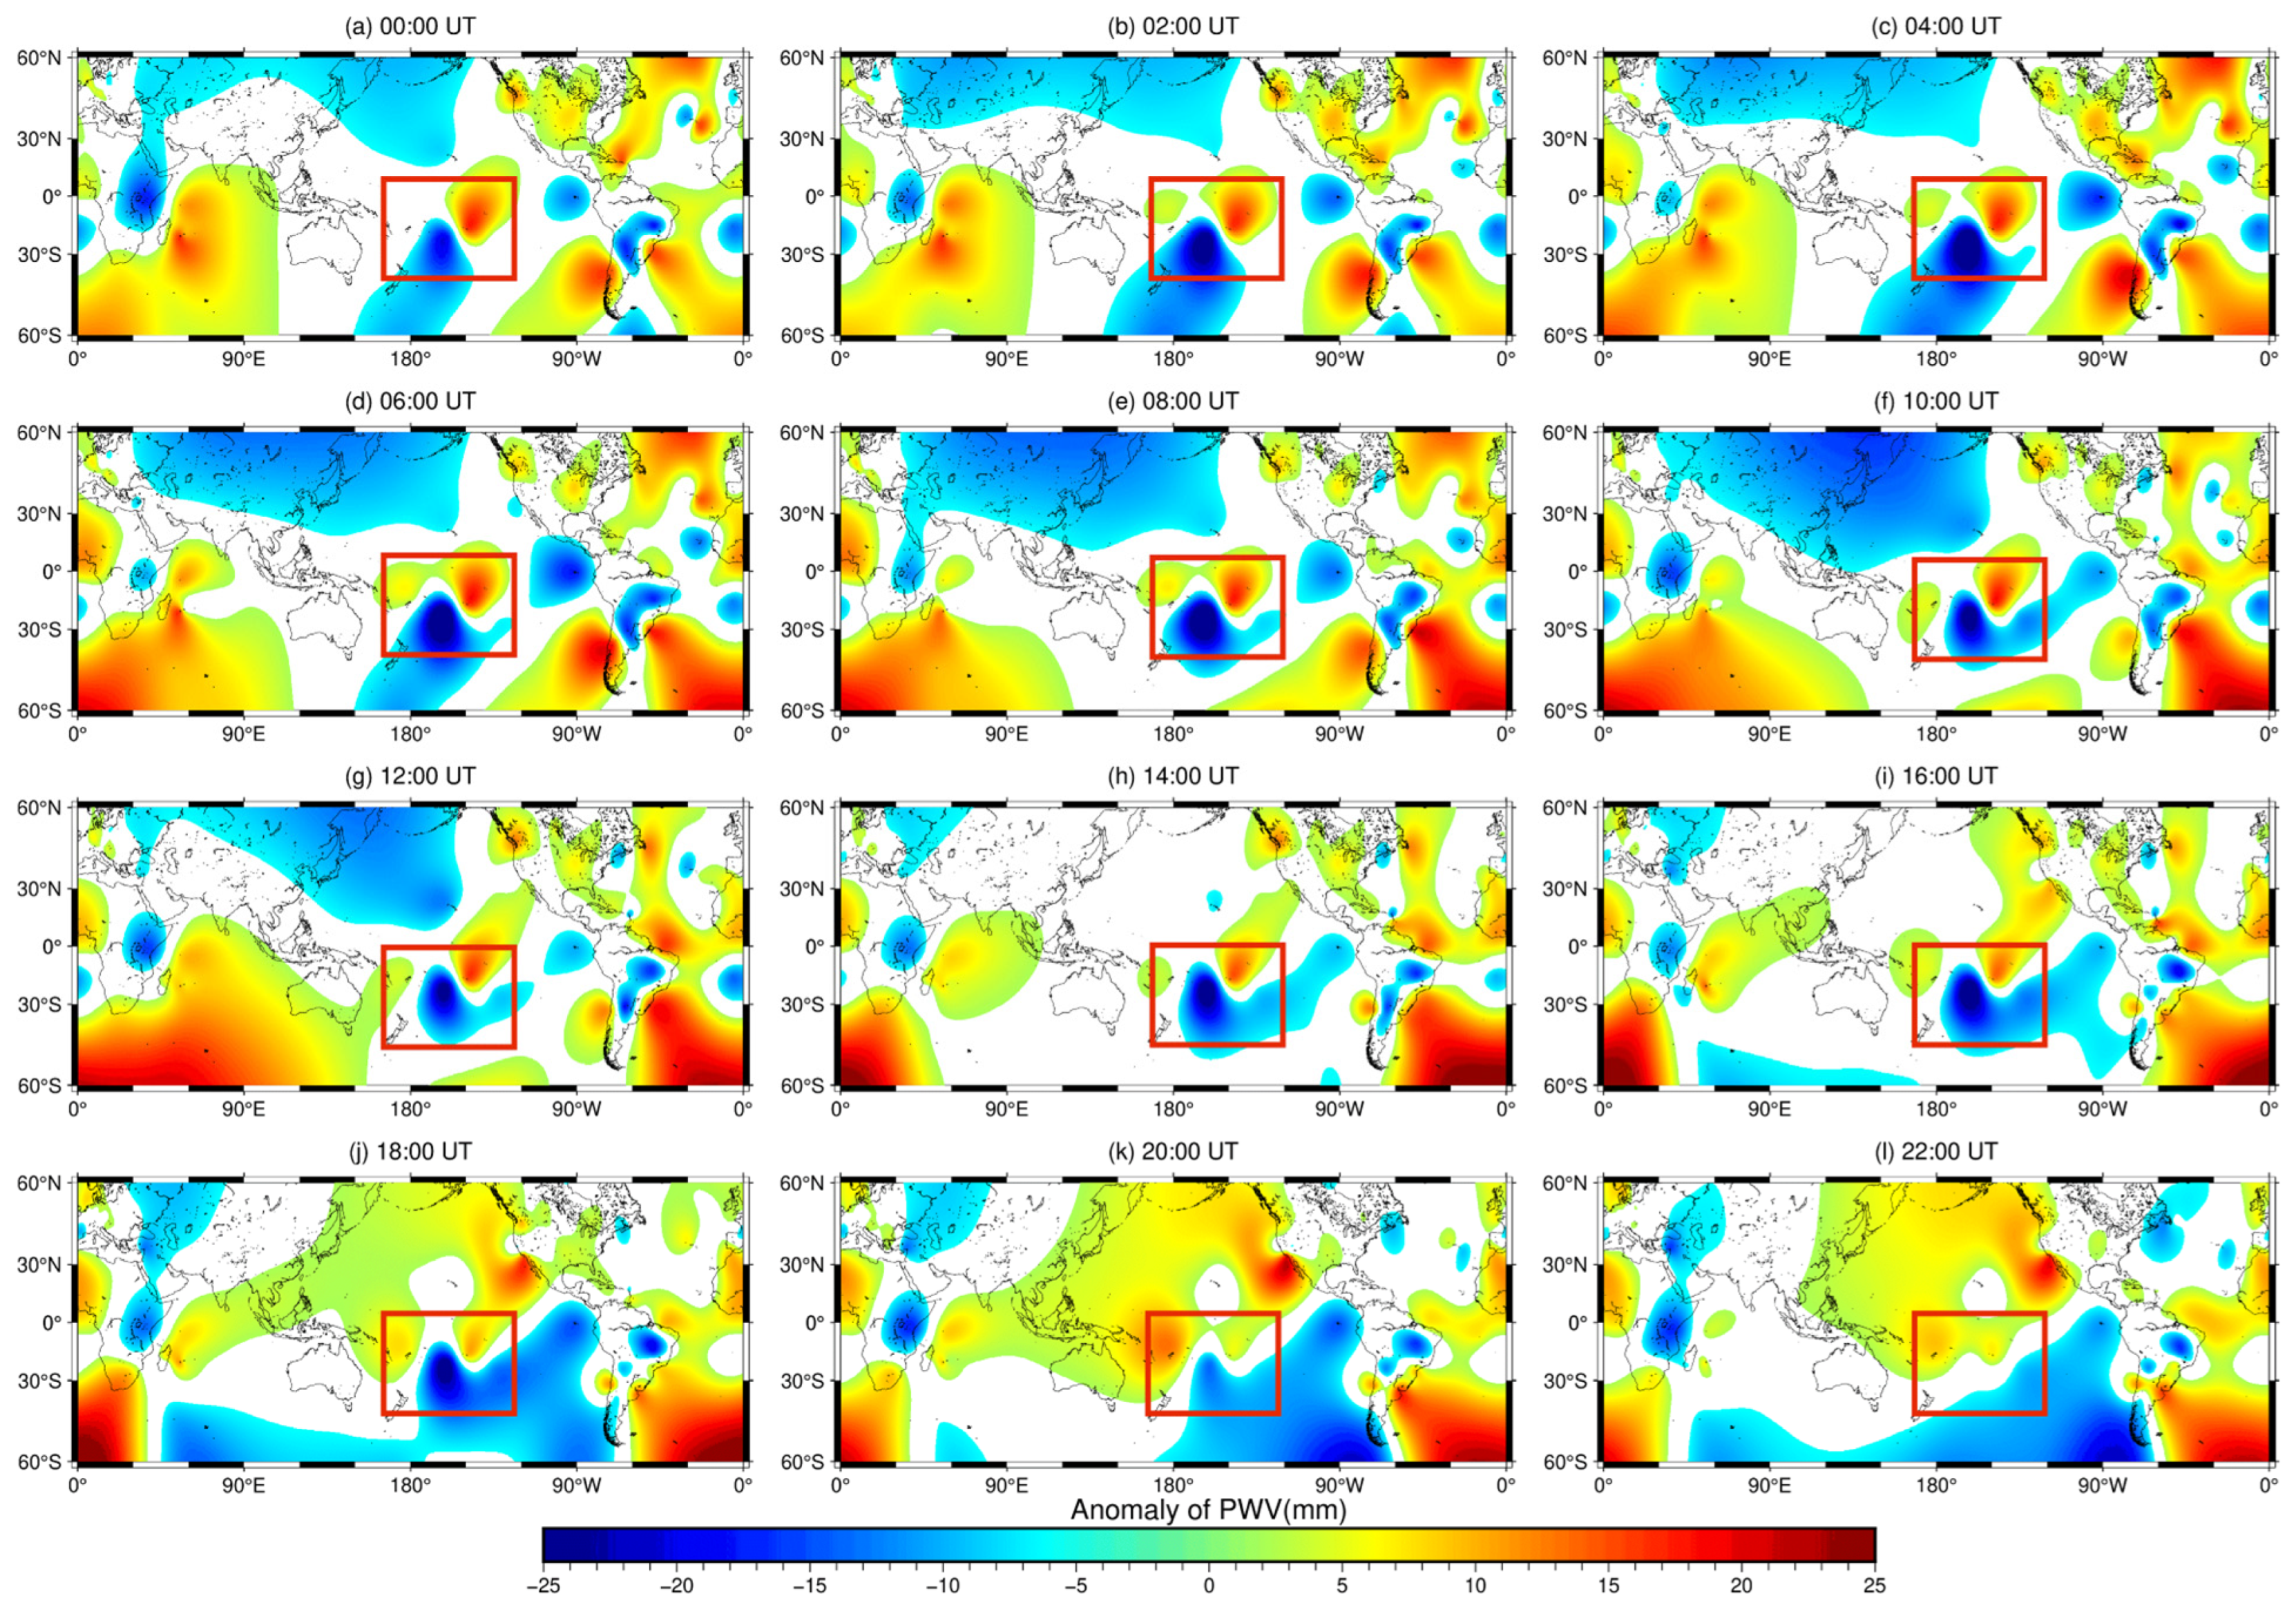
Precipitable water volume (PWV) has indicative significance for small-scale catastrophic weather forecasting and is one of the critical parameters in response to low-level atmospheric characteristics. This article explores the relationship between PWV changes and volcanic eruptions by studying the global PWV distribution on 15 January 2022. Specifically, the global PWV anomaly distribution on 15 January 2022 was obtained by using the 15 January 2020 and 2021 data as the background value and finding the difference between the date of 15 January 2022 and the background value (Figure 2). At 0:00 (Figure 2a), the PWV anomaly was mainly distributed in the Tonga region, northern Africa, the Indian Ocean, and southern South America. From 2:00 to 16:00 (Figure 2b–i), the PWV remained unusually significant in Tonga, but the Northern Hemisphere anomaly began to disappear at 1400 (Figure 2h). From 18:00 to 22:00 (Figure 2j–l), the negative PWV variation gradually spread from the Tonga region to the whole South Pacific, while the North Pacific PWV was positive. It can be seen from Figure 2 that the PWV changes were mainly concentrated in the Tonga region, and the degree of PWV anomalies in the Tonga region was the largest before and after the HTHH volcanic eruption. Thus, there is a specific correlation between PWV anomalies and volcanic eruptions.
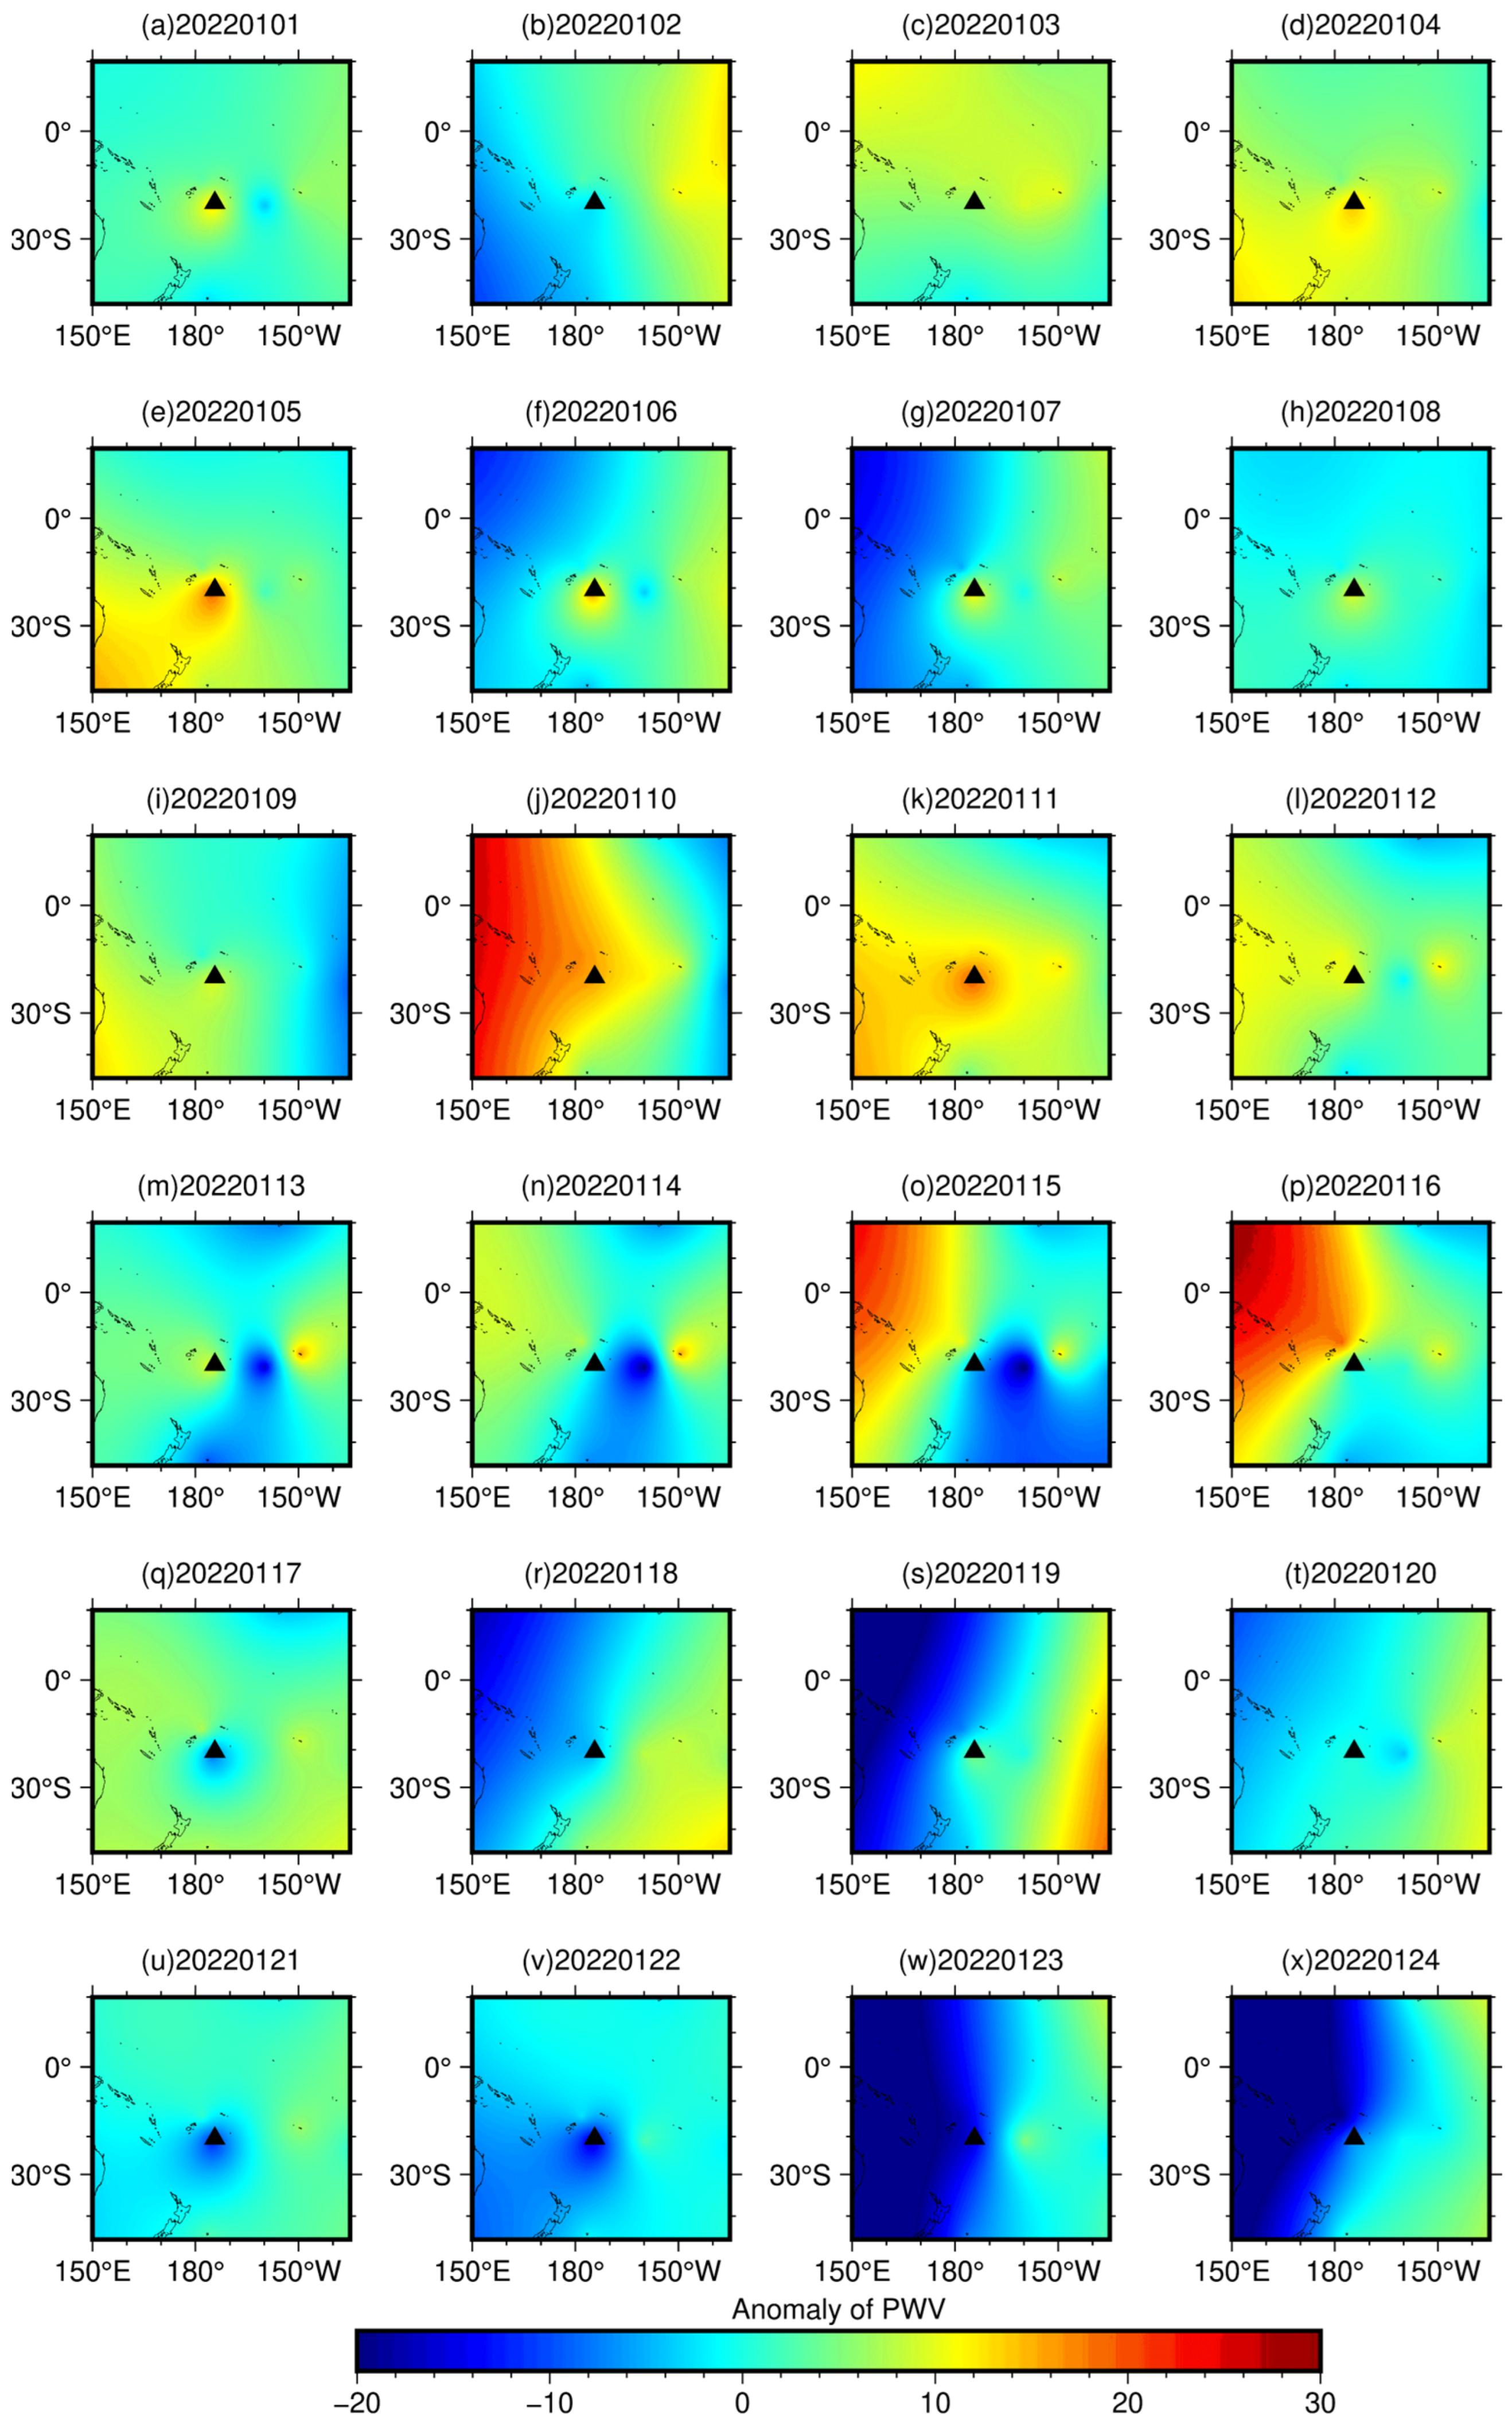
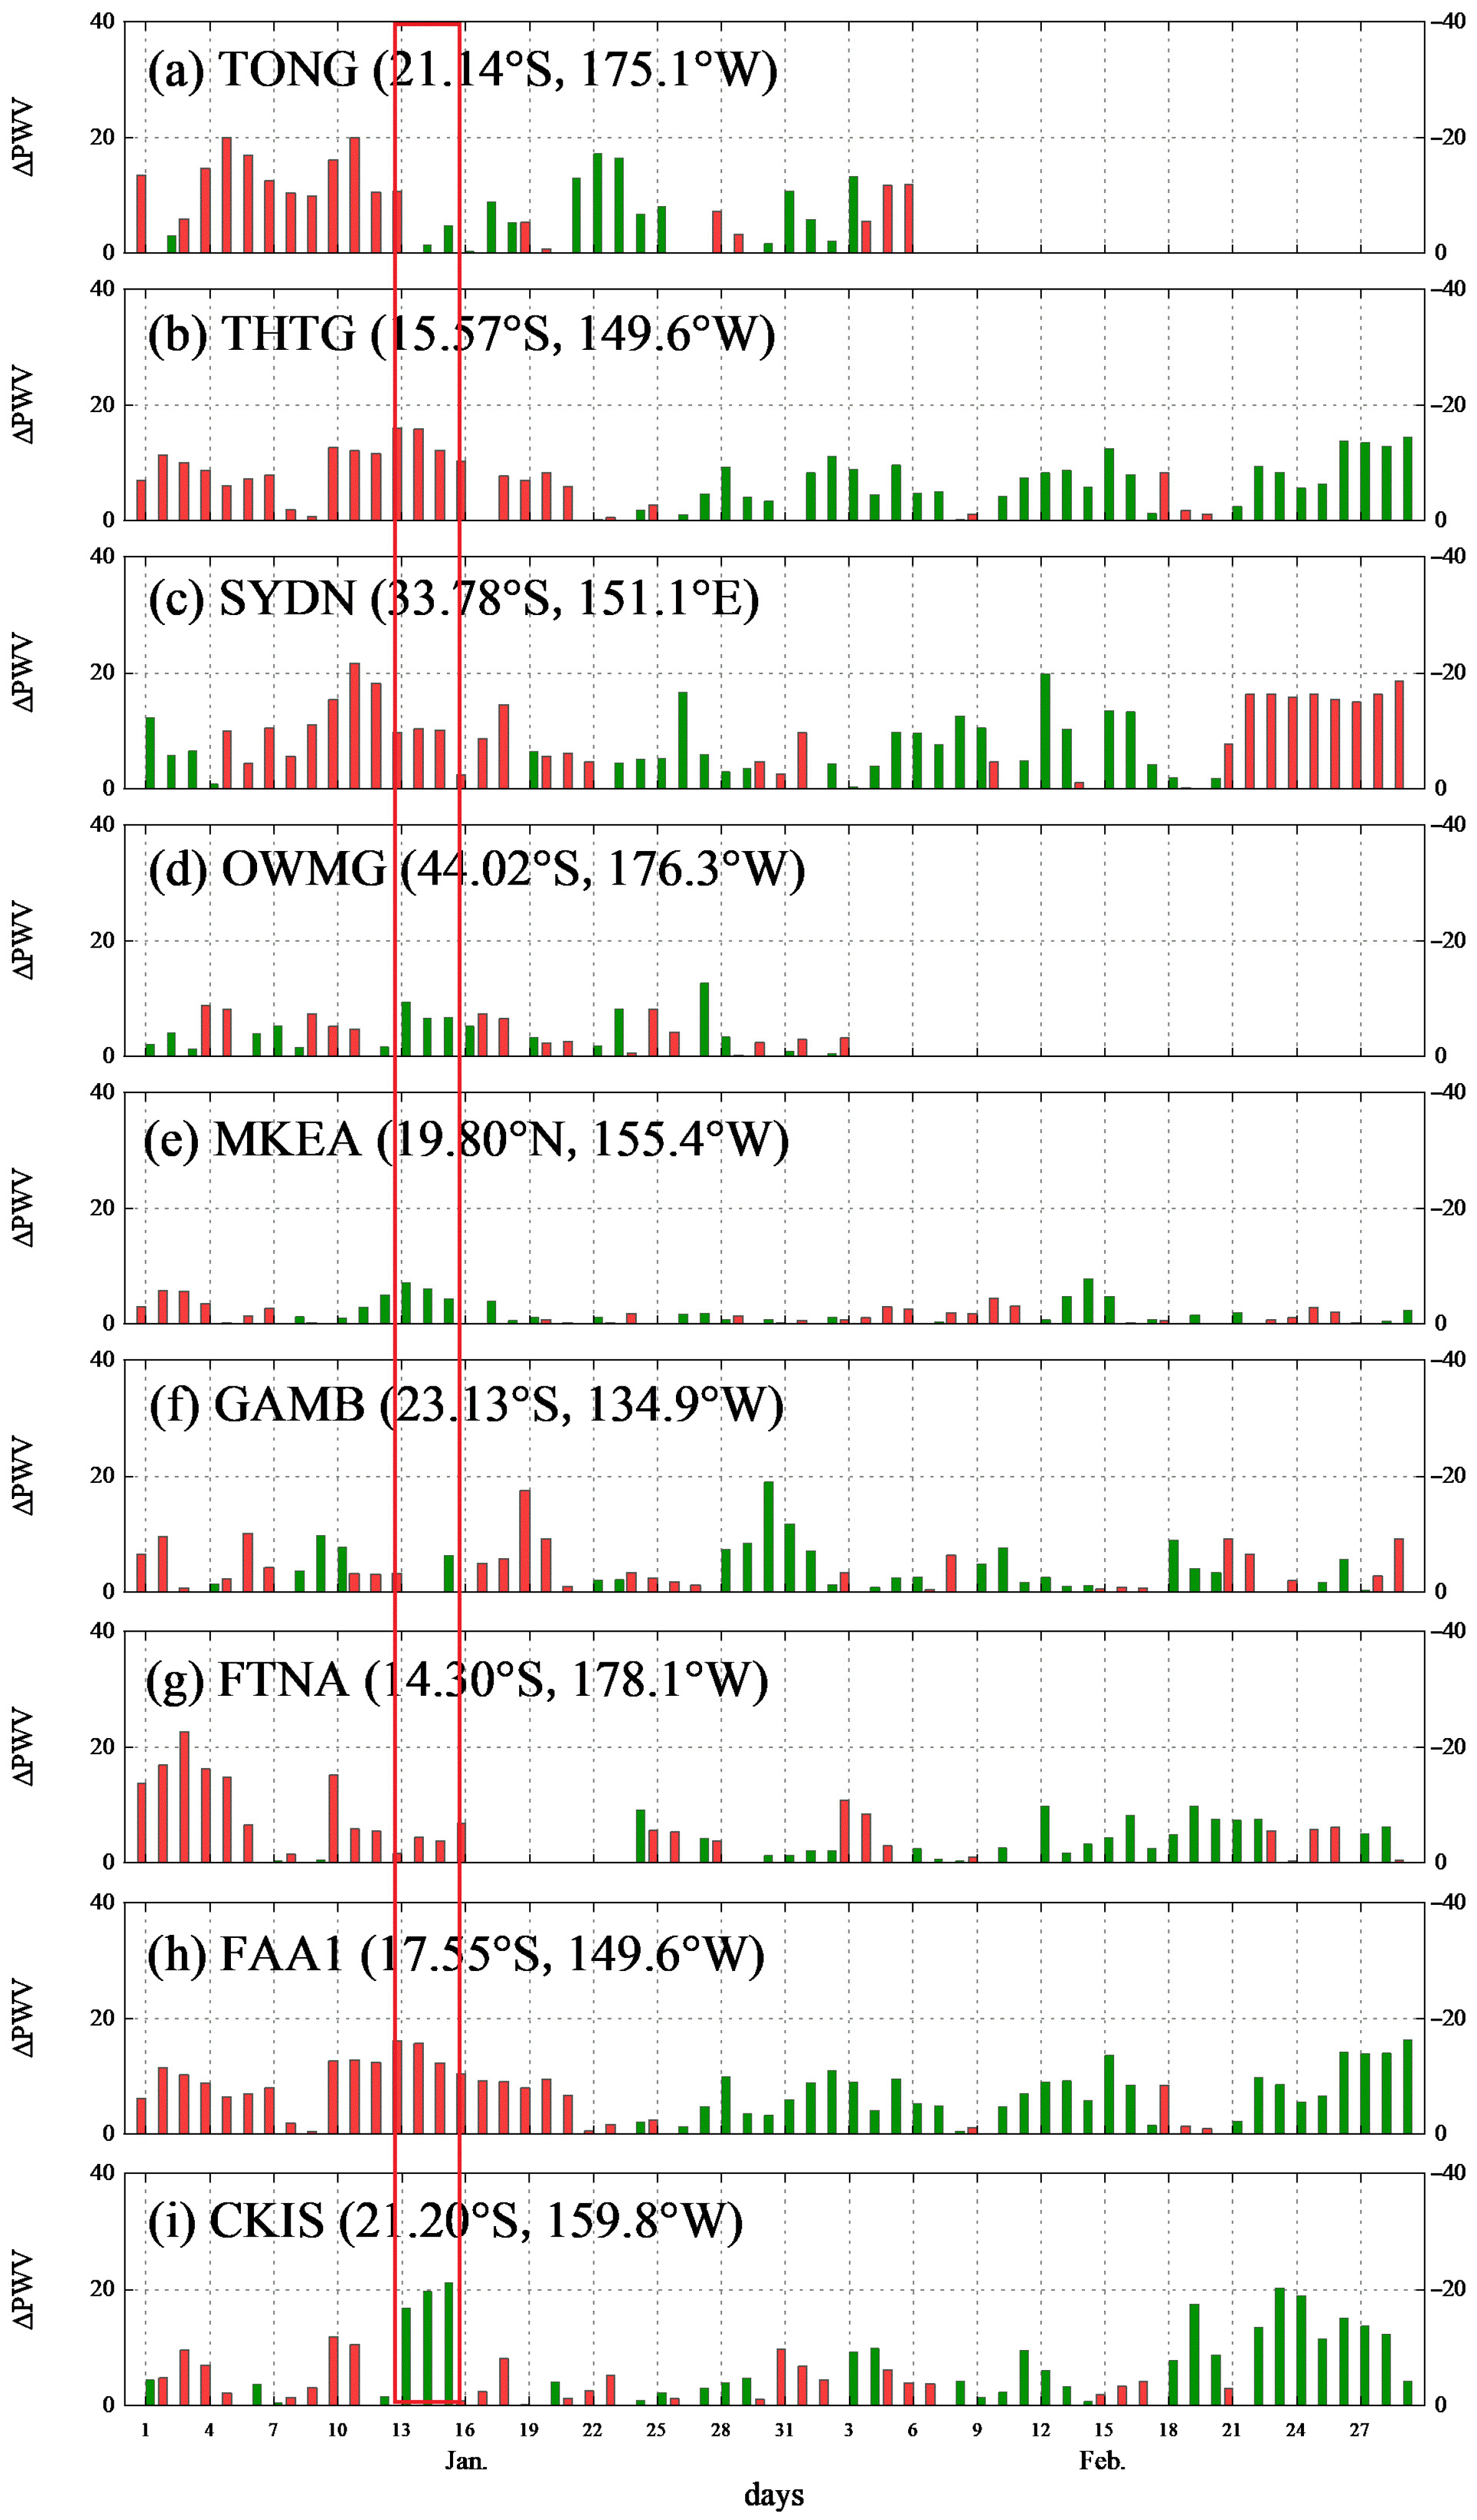
In addition, in order to more accurately reflect the characteristics of PWV anomalies during volcanic eruptions, in this paper, data from 11 stations in the Tonga region were selected for analysis (Figure 1). Using the data of January 2020 and 2021 as the background values and finding the difference between the data of January 2022 and the background values, we obtained the water vapor anomaly map for the period from 1 January 2022 to 24 January 2022 for the 11 stations (Figure 3).
As can be seen from Figure 3, the PWV around Tonga was normal from 1 January to 9 January (Figure 3a–i), and the PWV on the south side of Tonga was positively weird on 10 January and remained so until 12 January (Figure 3j–l), when the PWV returned to normal. A negative water vapor anomaly was observed in the lower right of Tonga on 13 January (Figure 3m), and a positive water vapor anomaly north of Tonga and a negative water vapor anomaly east of Tonga occurred on the 14th (Figure 3n). The anomaly reached its highest value on the 15th (Figure 3o). The positive water vapor anomaly was the highest on the 16th (Figure 3p), and after the 16th, the water vapor did not increase, but the anomaly decreased (Figure 3q–x). From Figure 4, it can be seen that the PWV anomaly in Tonga was an overall increase in January, and the PWV anomaly was an overall decrease in February. Therefore, volcanic activity has a strong impact on the changes in PWV in the lower atmosphere of the surrounding area.
3.2. Analysis of Atmospheric Circulation
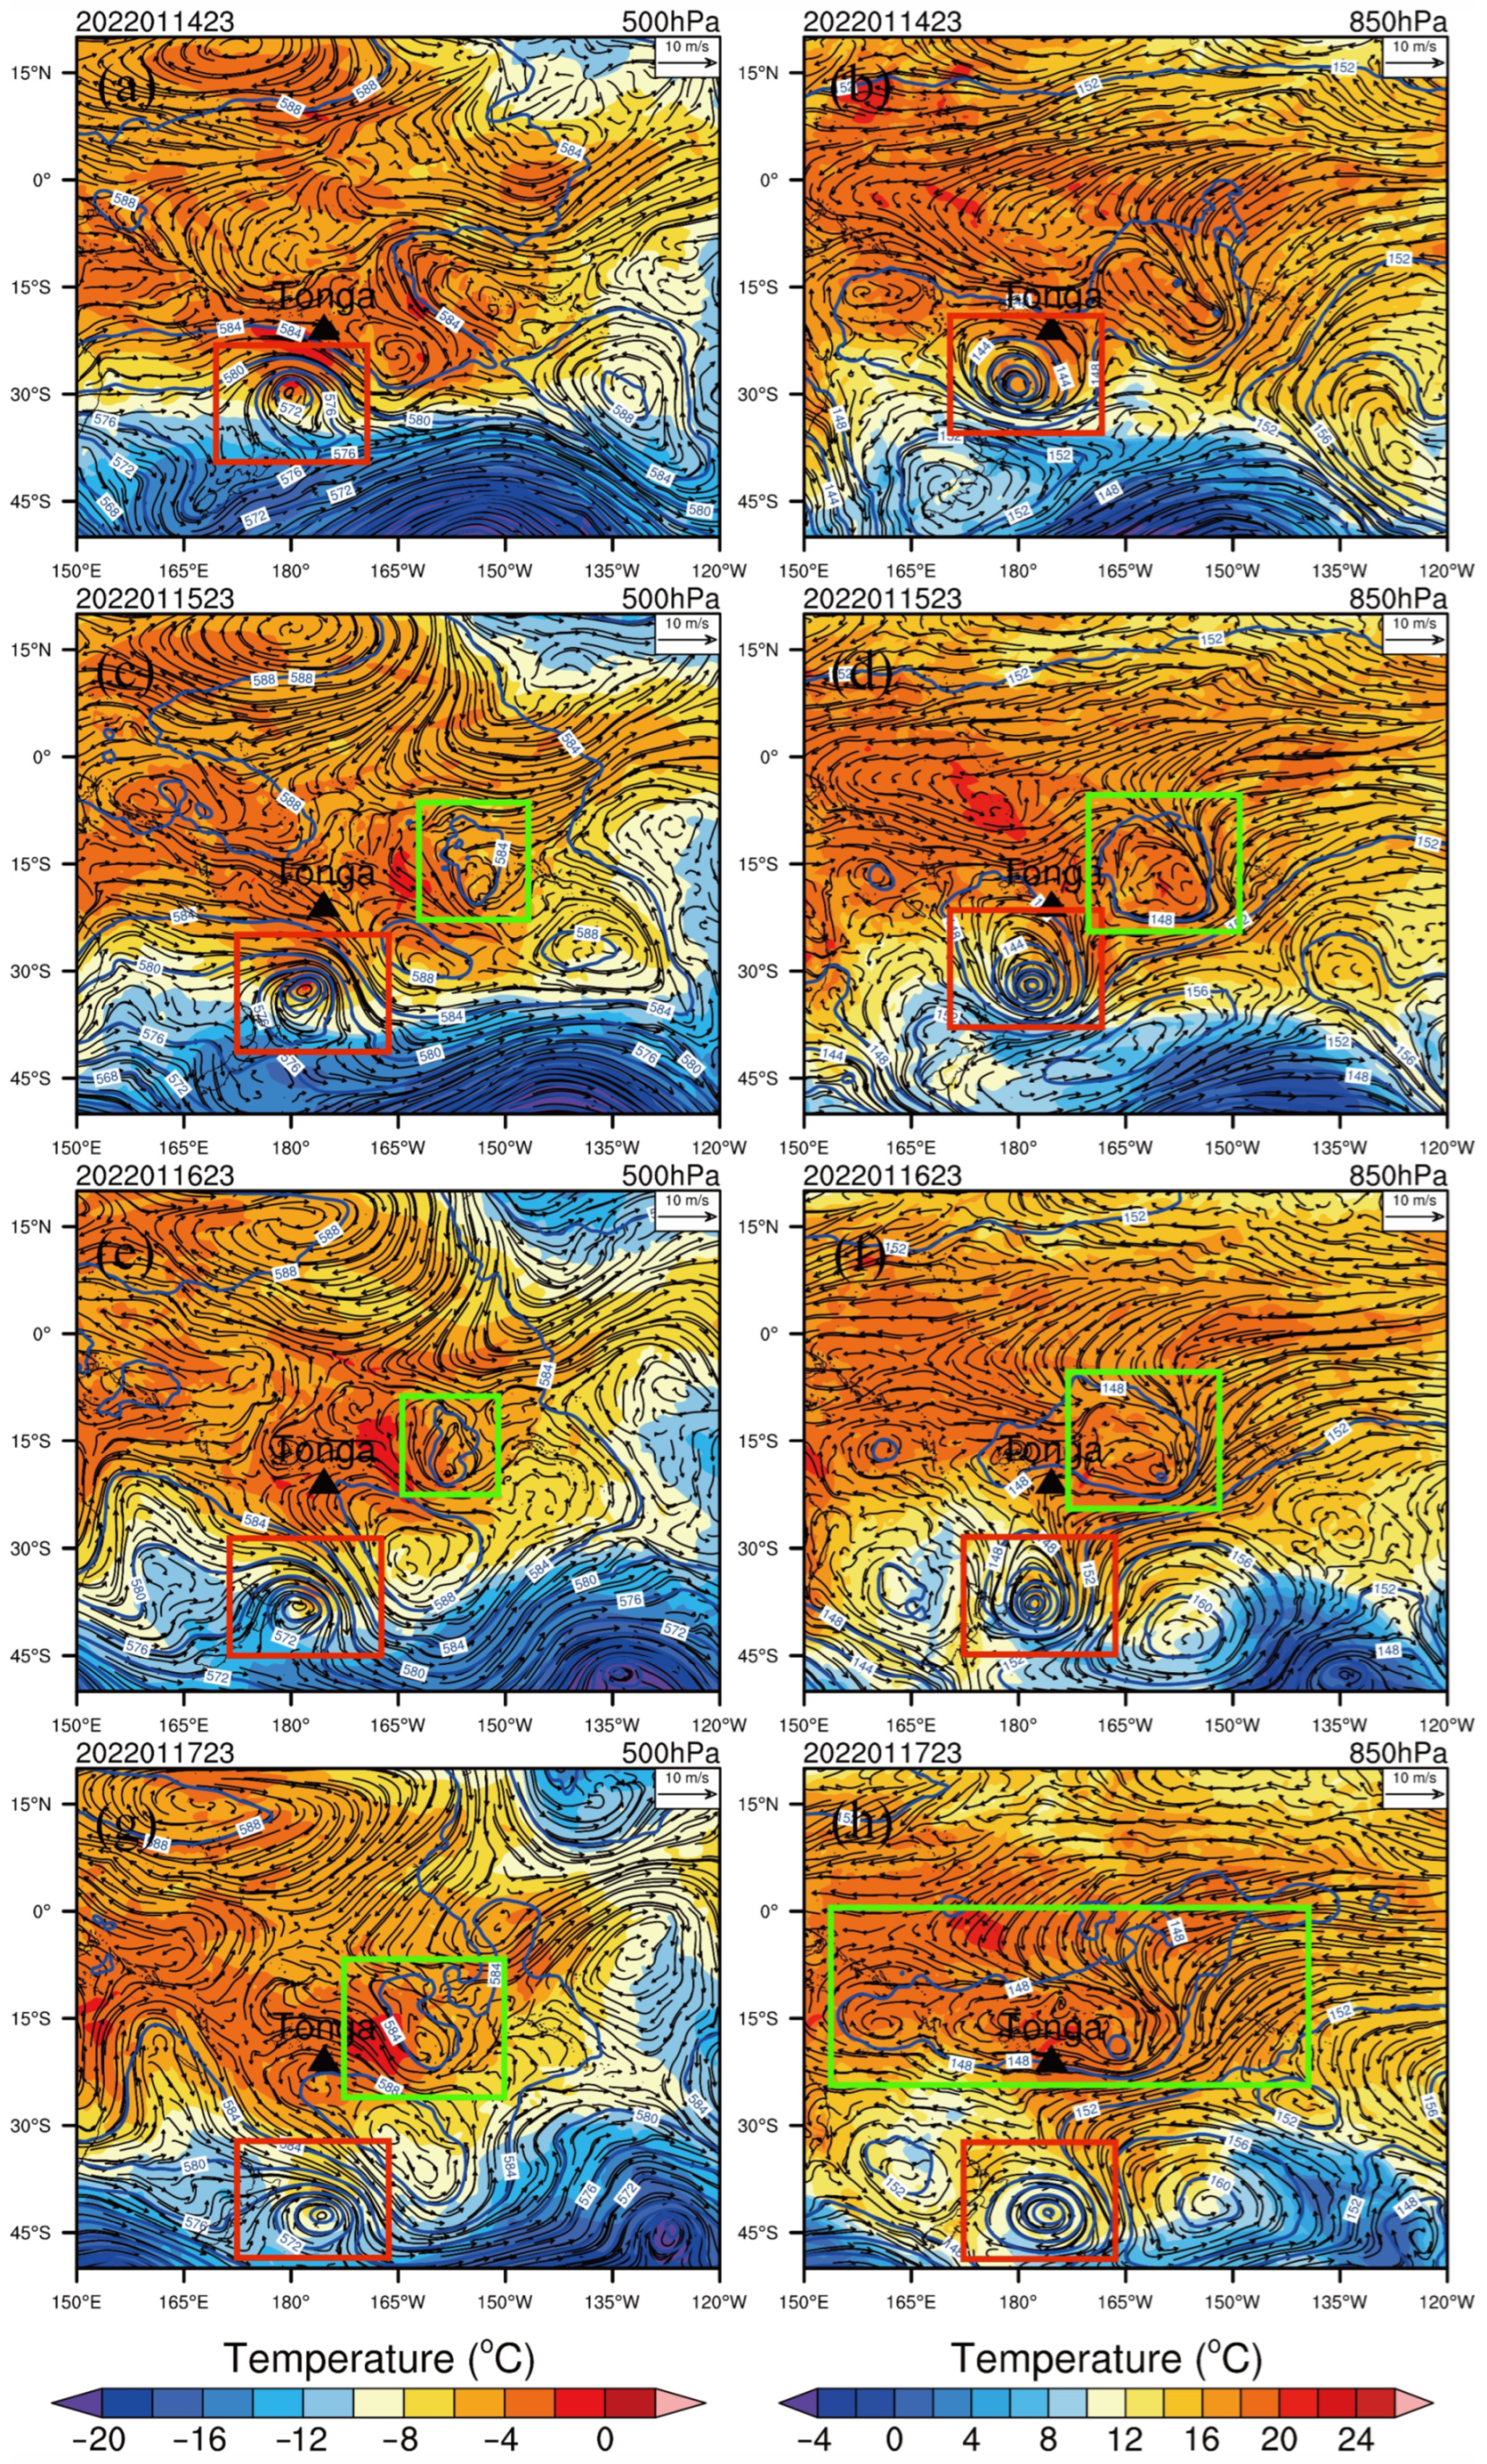
In addition, atmospheric circulation serves as a direct factor affecting water vapor flux and water vapor flux divergence. This article also studied the characteristics of regional circulation changes during volcanic eruptions. Specifically, from Figure 5a, it can be seen that there was low pressure near 30° S on the south side of the 500 hpa Tonga volcano on 14 January. High pressure on the north side, corresponding to the low-level 850 hpa Tonga volcano, also had low pressure near 30° S on the south side (Figure 5b), while the high-pressure field was south of 30° S as well as on the north side of Tonga volcano, which was located on the north side of the cyclone with a prevailing northwest wind. The low pressure at 500 hPa on the south side of the volcano moved southward on 15 January (Figure 5c), and the volcano was covered by high pressure with solid northwesterly winds; the low pressure at 850 hPa on the south side of the volcano also moved southward (Figure 5d), while weak low pressure appeared on its northeast side. On the 16th (Figure 5e), the 500 hpa volcano was located on the west side of the high pressure, and easterly winds prevailed over it.
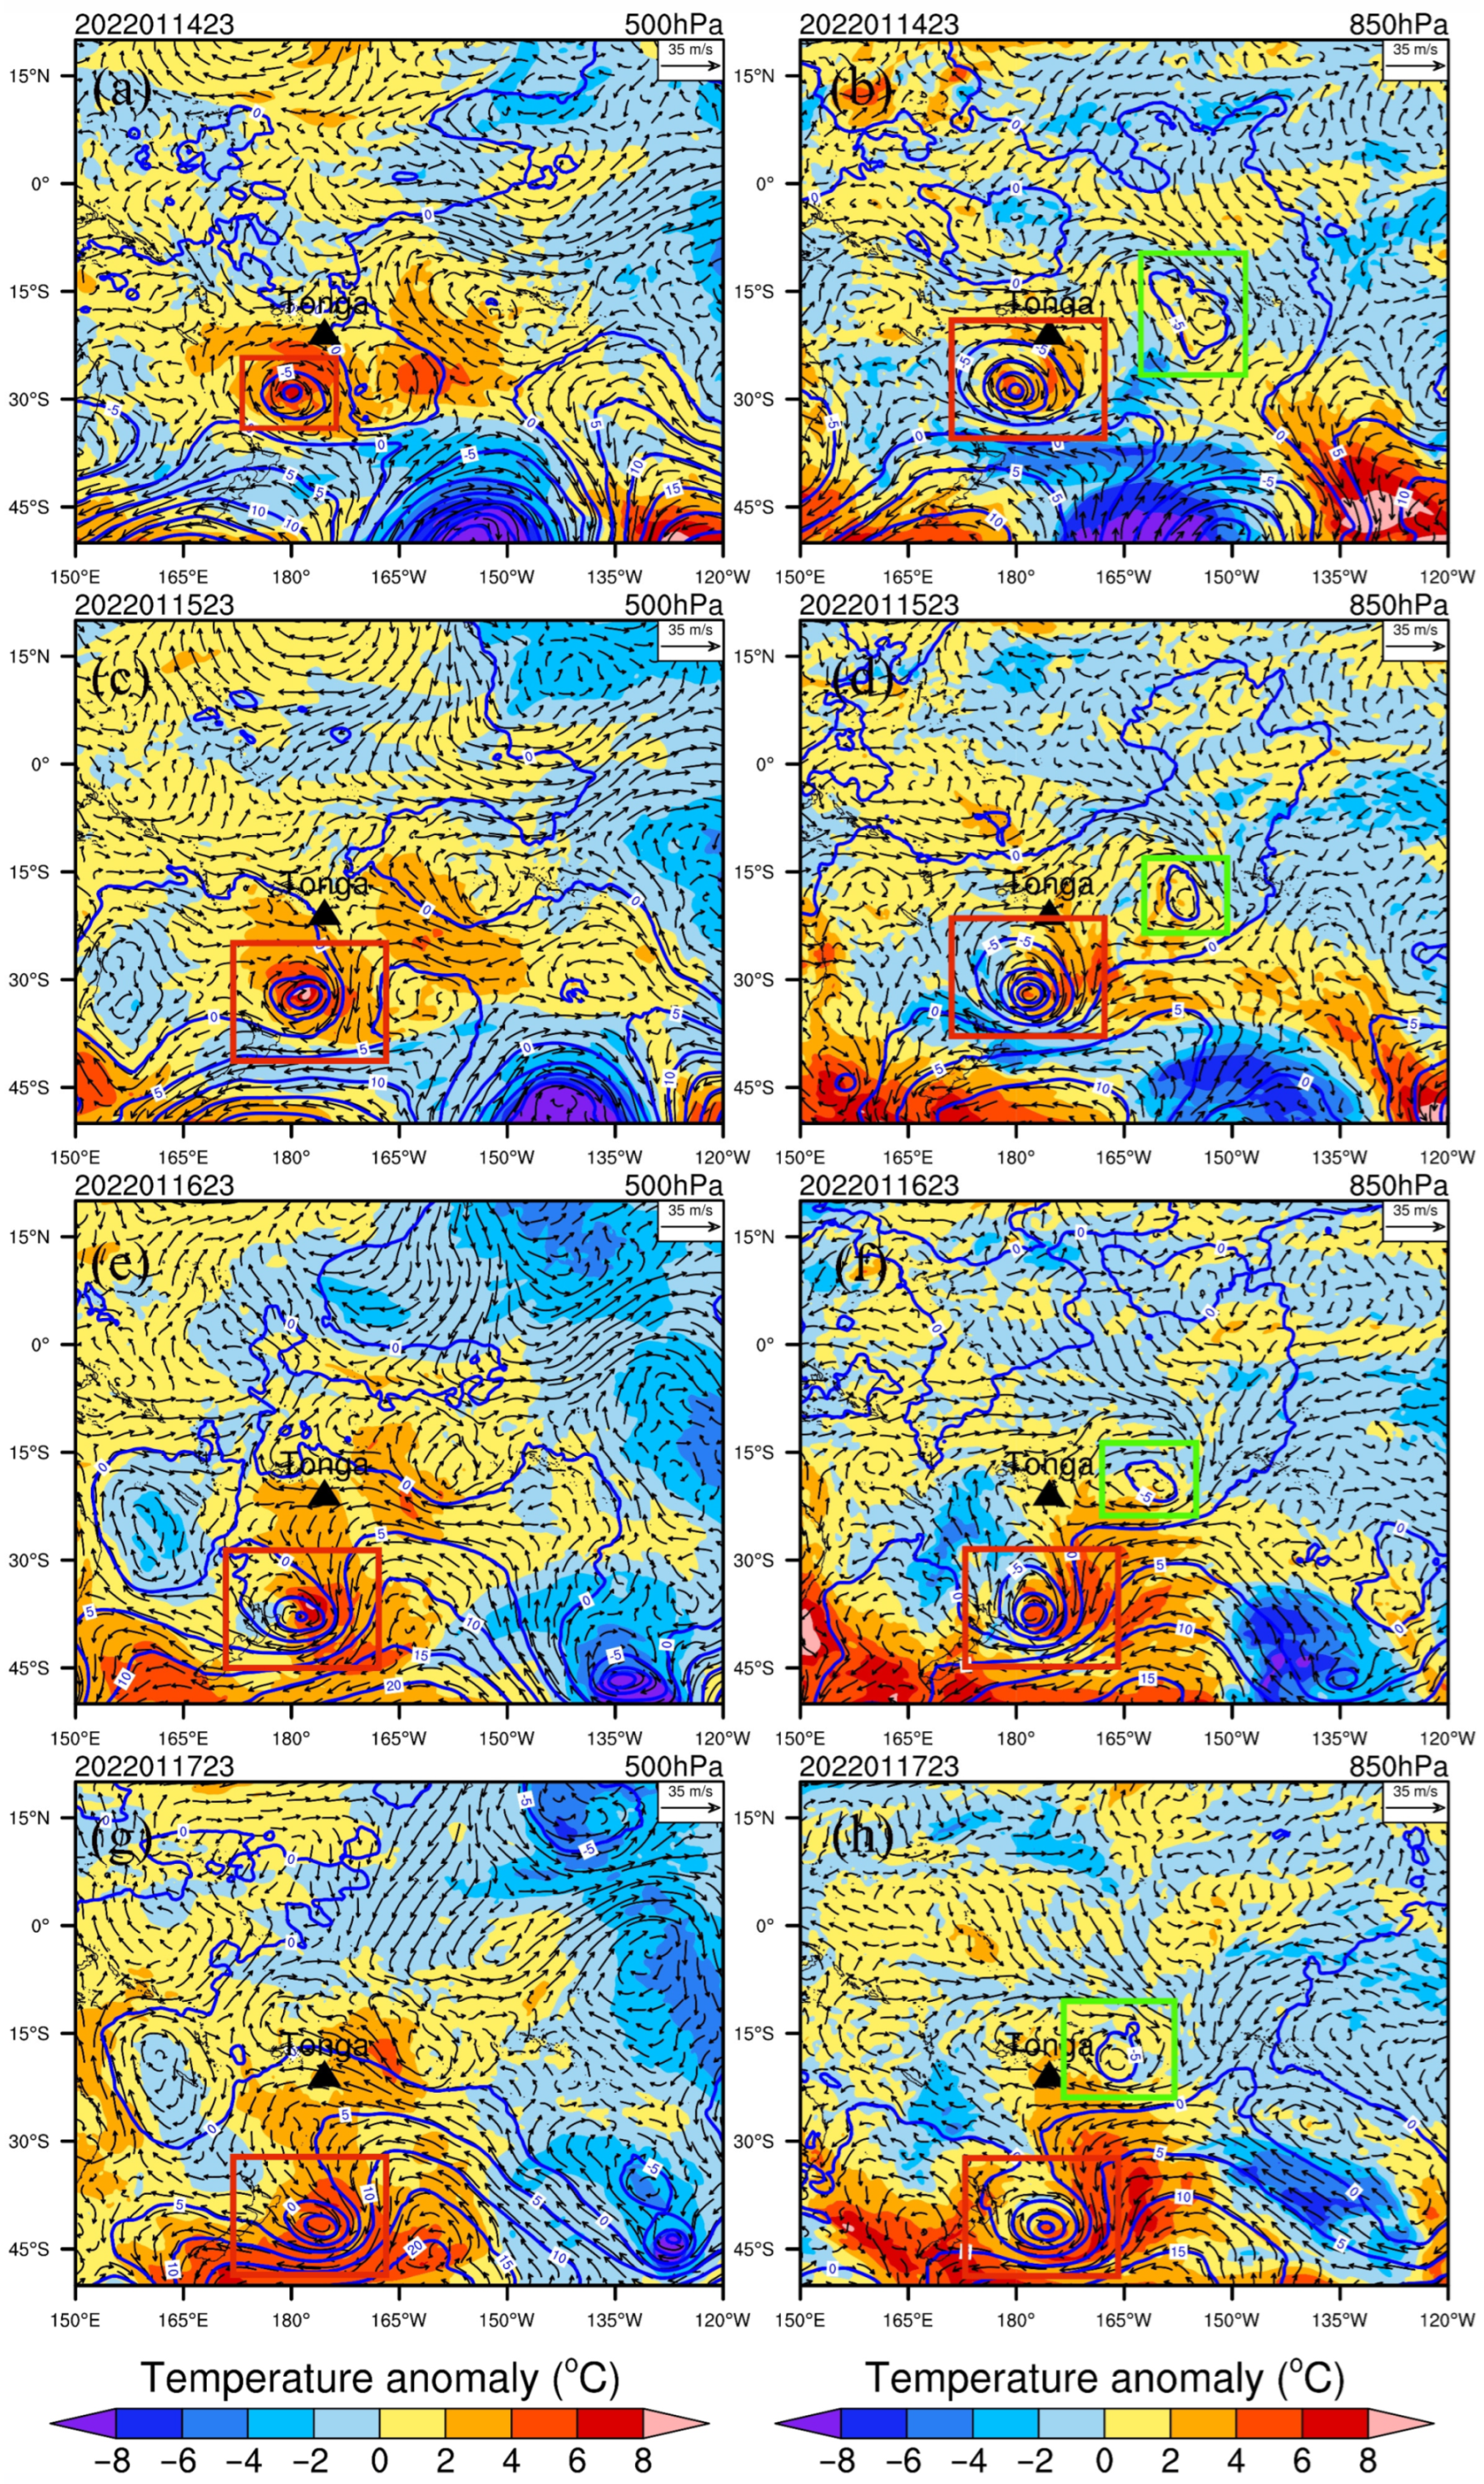
In contrast, the corresponding 850 hpa volcano was located on the south side of the low pressure (Figure 5f), and easterly winds prevailed, bringing warm advection. On the 17th (Figure 5g), the 500 hpa volcano was still located on the west side of the high pressure, and easterly winds prevailed over it. In contrast, the corresponding 850 hpa volcano was located on the south side of the low pressure (Figure 5h), and easterly winds brought warm advection. Using the circulation data from 1981 to 2010 as the climate state, anomaly levels of 850 hPa and 500 hPa geopotential height field, temperature field, and wind field were obtained from 14 to 17 January 2022 (Figure 6).
From Figure 6, we can see a low-pressure anomaly on the southwest side of 500 hpa Tonga volcano on 14 January (Figure 6a) and a low-pressure anomaly on the corresponding lower 850 hpa (Figure 6b), with westerly winds prevailing over the volcano, bringing cold advection from the south. The wind field converged on the volcano’s east side, and the convergence of cold and warm advection was conducive to precipitation. By the 16th (Figure 6e), the 500 hpa Tonga volcano was located on the north side of the high-pressure anomaly, with prevailing easterly winds bringing cold advection at high latitudes; a weak low-pressure anomaly was found on the south and east sides of the corresponding 850 hpa volcano (Figure 6f), with the convergence of wind fields and convergence of cold and warm advection overhead. By the 17th (Figure 6g), the 500 hpa Tonga volcano was located on the north side of the low-pressure anomaly, with prevailing easterly winds and cold advection overhead; a weak low-pressure anomaly was found on the east side of the lower 850 hpa volcano (Figure 6h). There was a weak low-pressure anomaly with easterly winds prevailing over it, bringing cold advection transport. From the temperature field, the temperature overlapped with the low-pressure center in southern Tonga, and the sea around Tonga was warmer. Based on the discussion of the circulation above, it can be concluded that volcanic activity can cause changes in the regional circulation layer in different directions and amplitudes.
3.3. Analysis of Surface Temperature
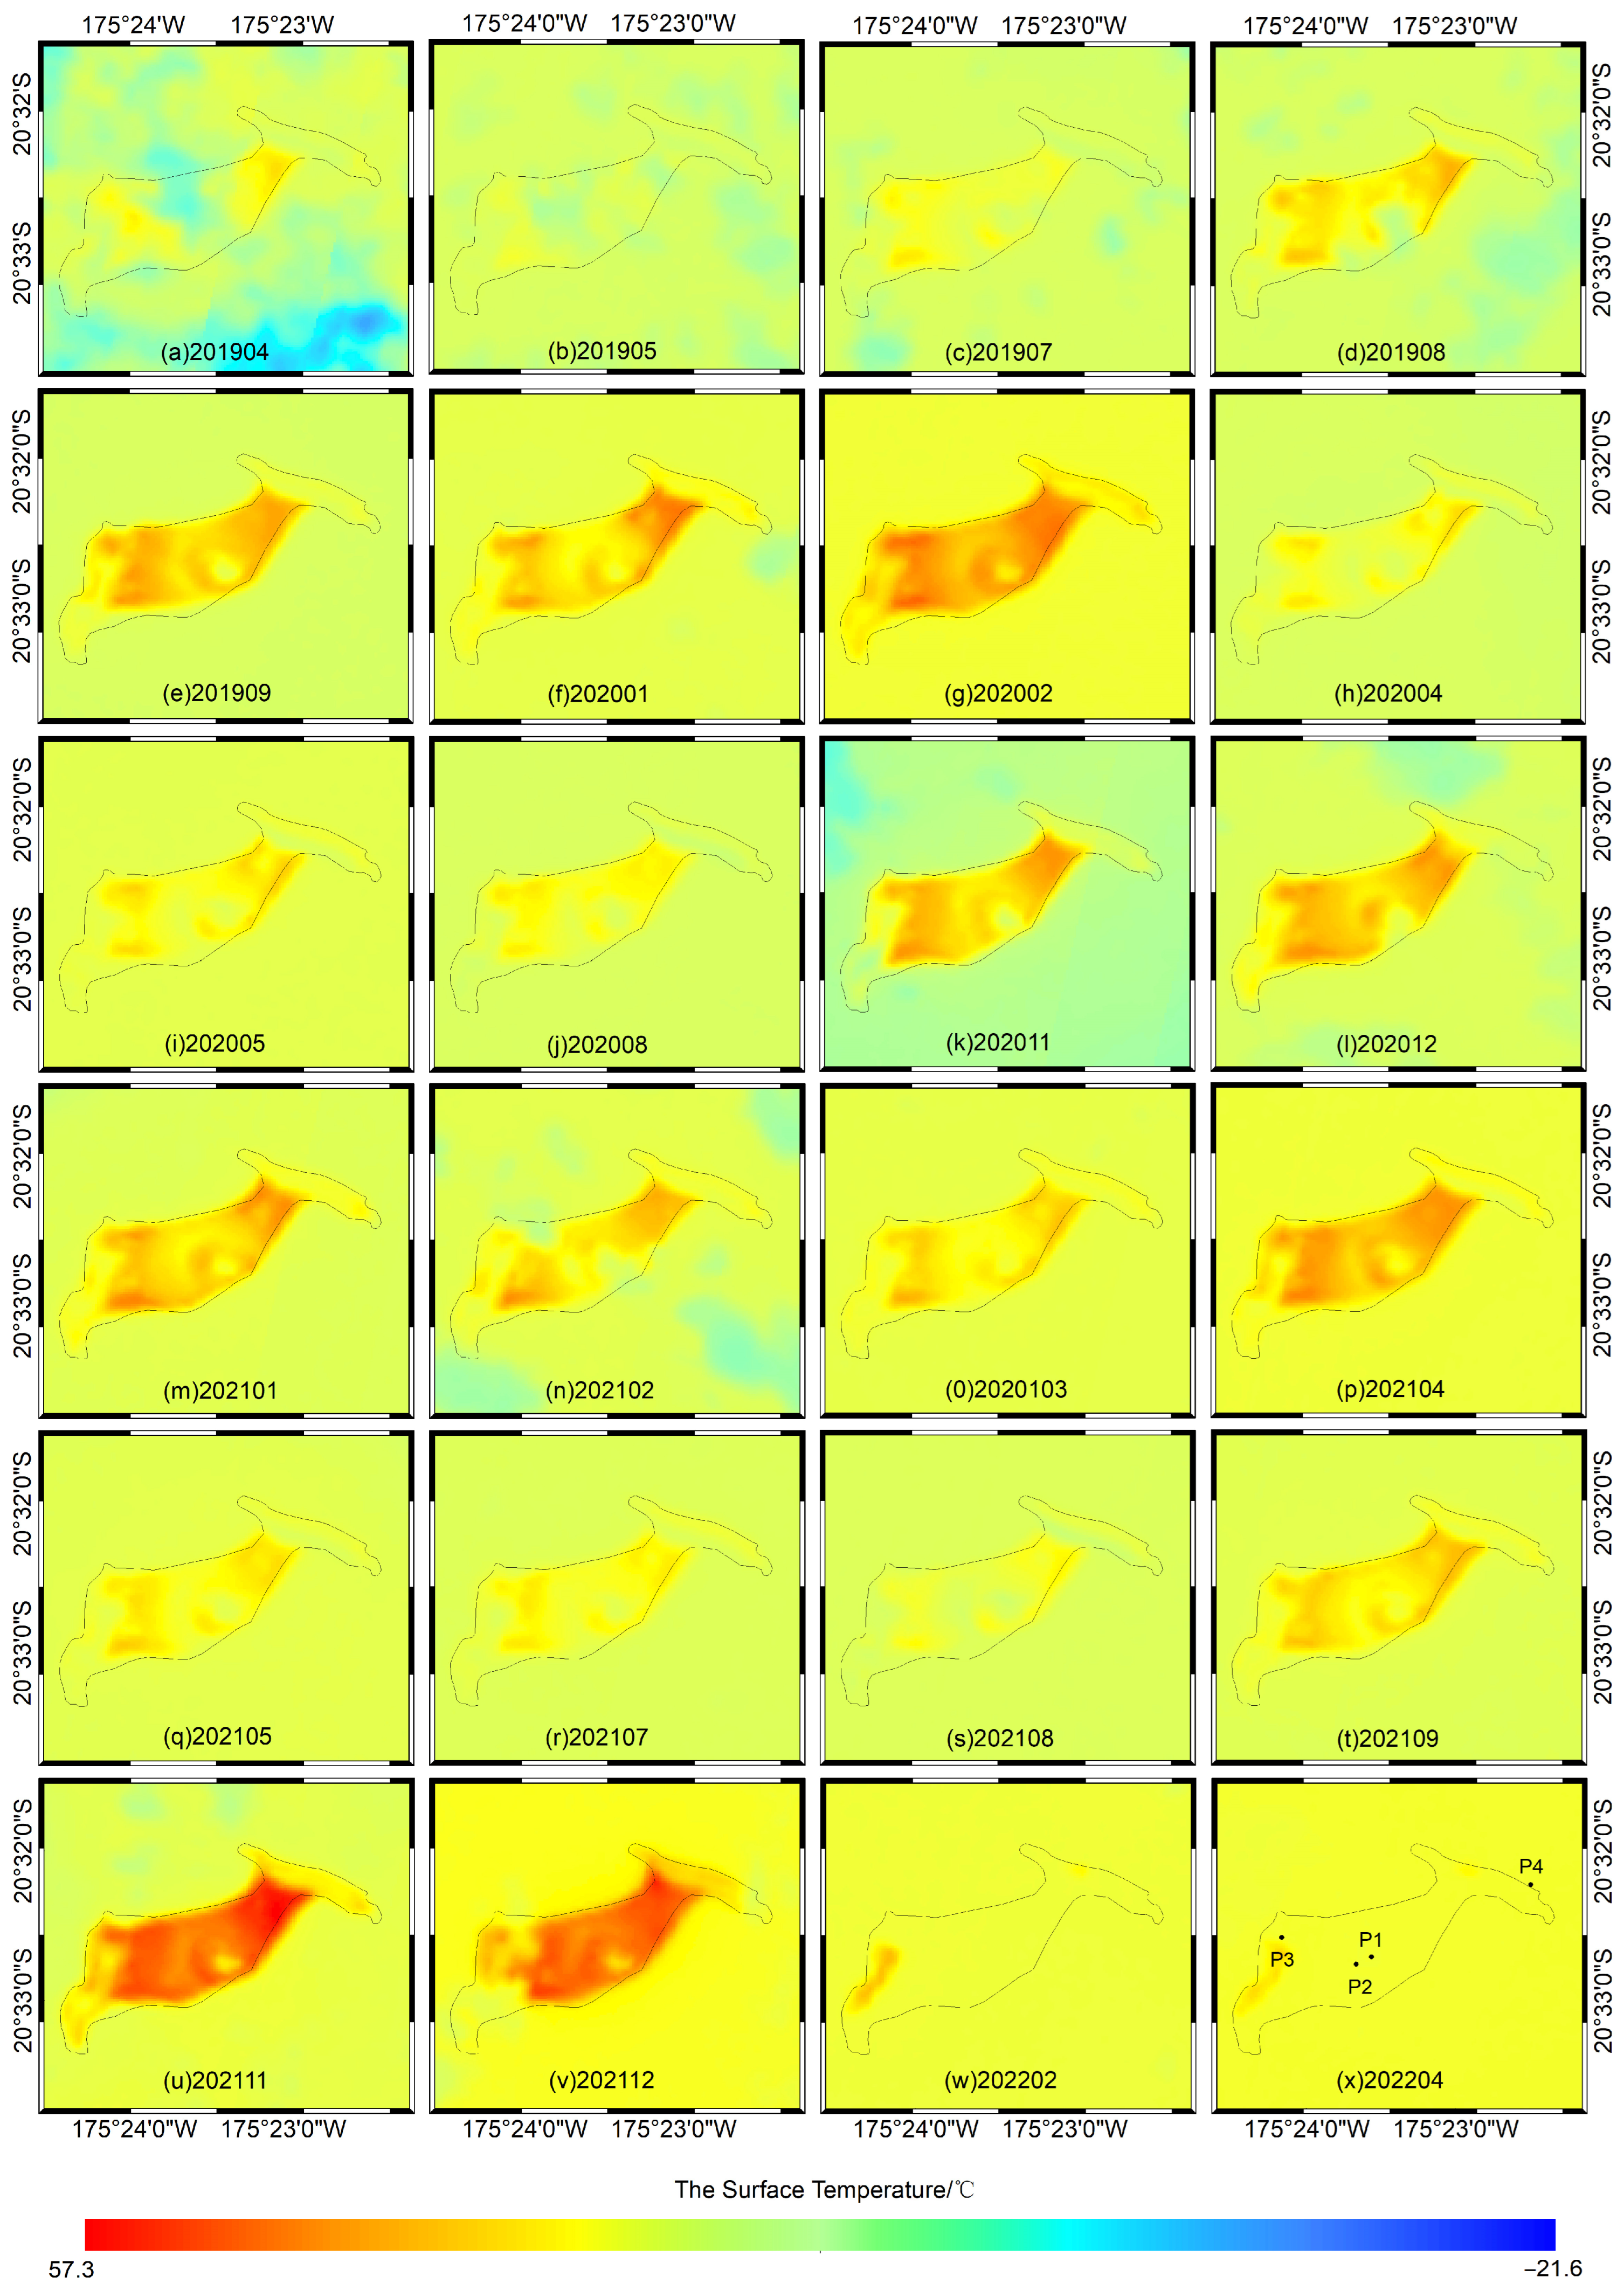
As the most directly affected factor of volcanic activity, the characteristic change trend of temperature is also one of the research contents in the lower atmospheric region. In this paper, we used USGS Landsat 8 data to obtain the surface temperature of the small island of Tonga between April 2019 and April 2022, as shown in Figure 7, where the solid black line indicates the profile before the 15 January 2022 eruption and P1 to P4 are the selected feature points.
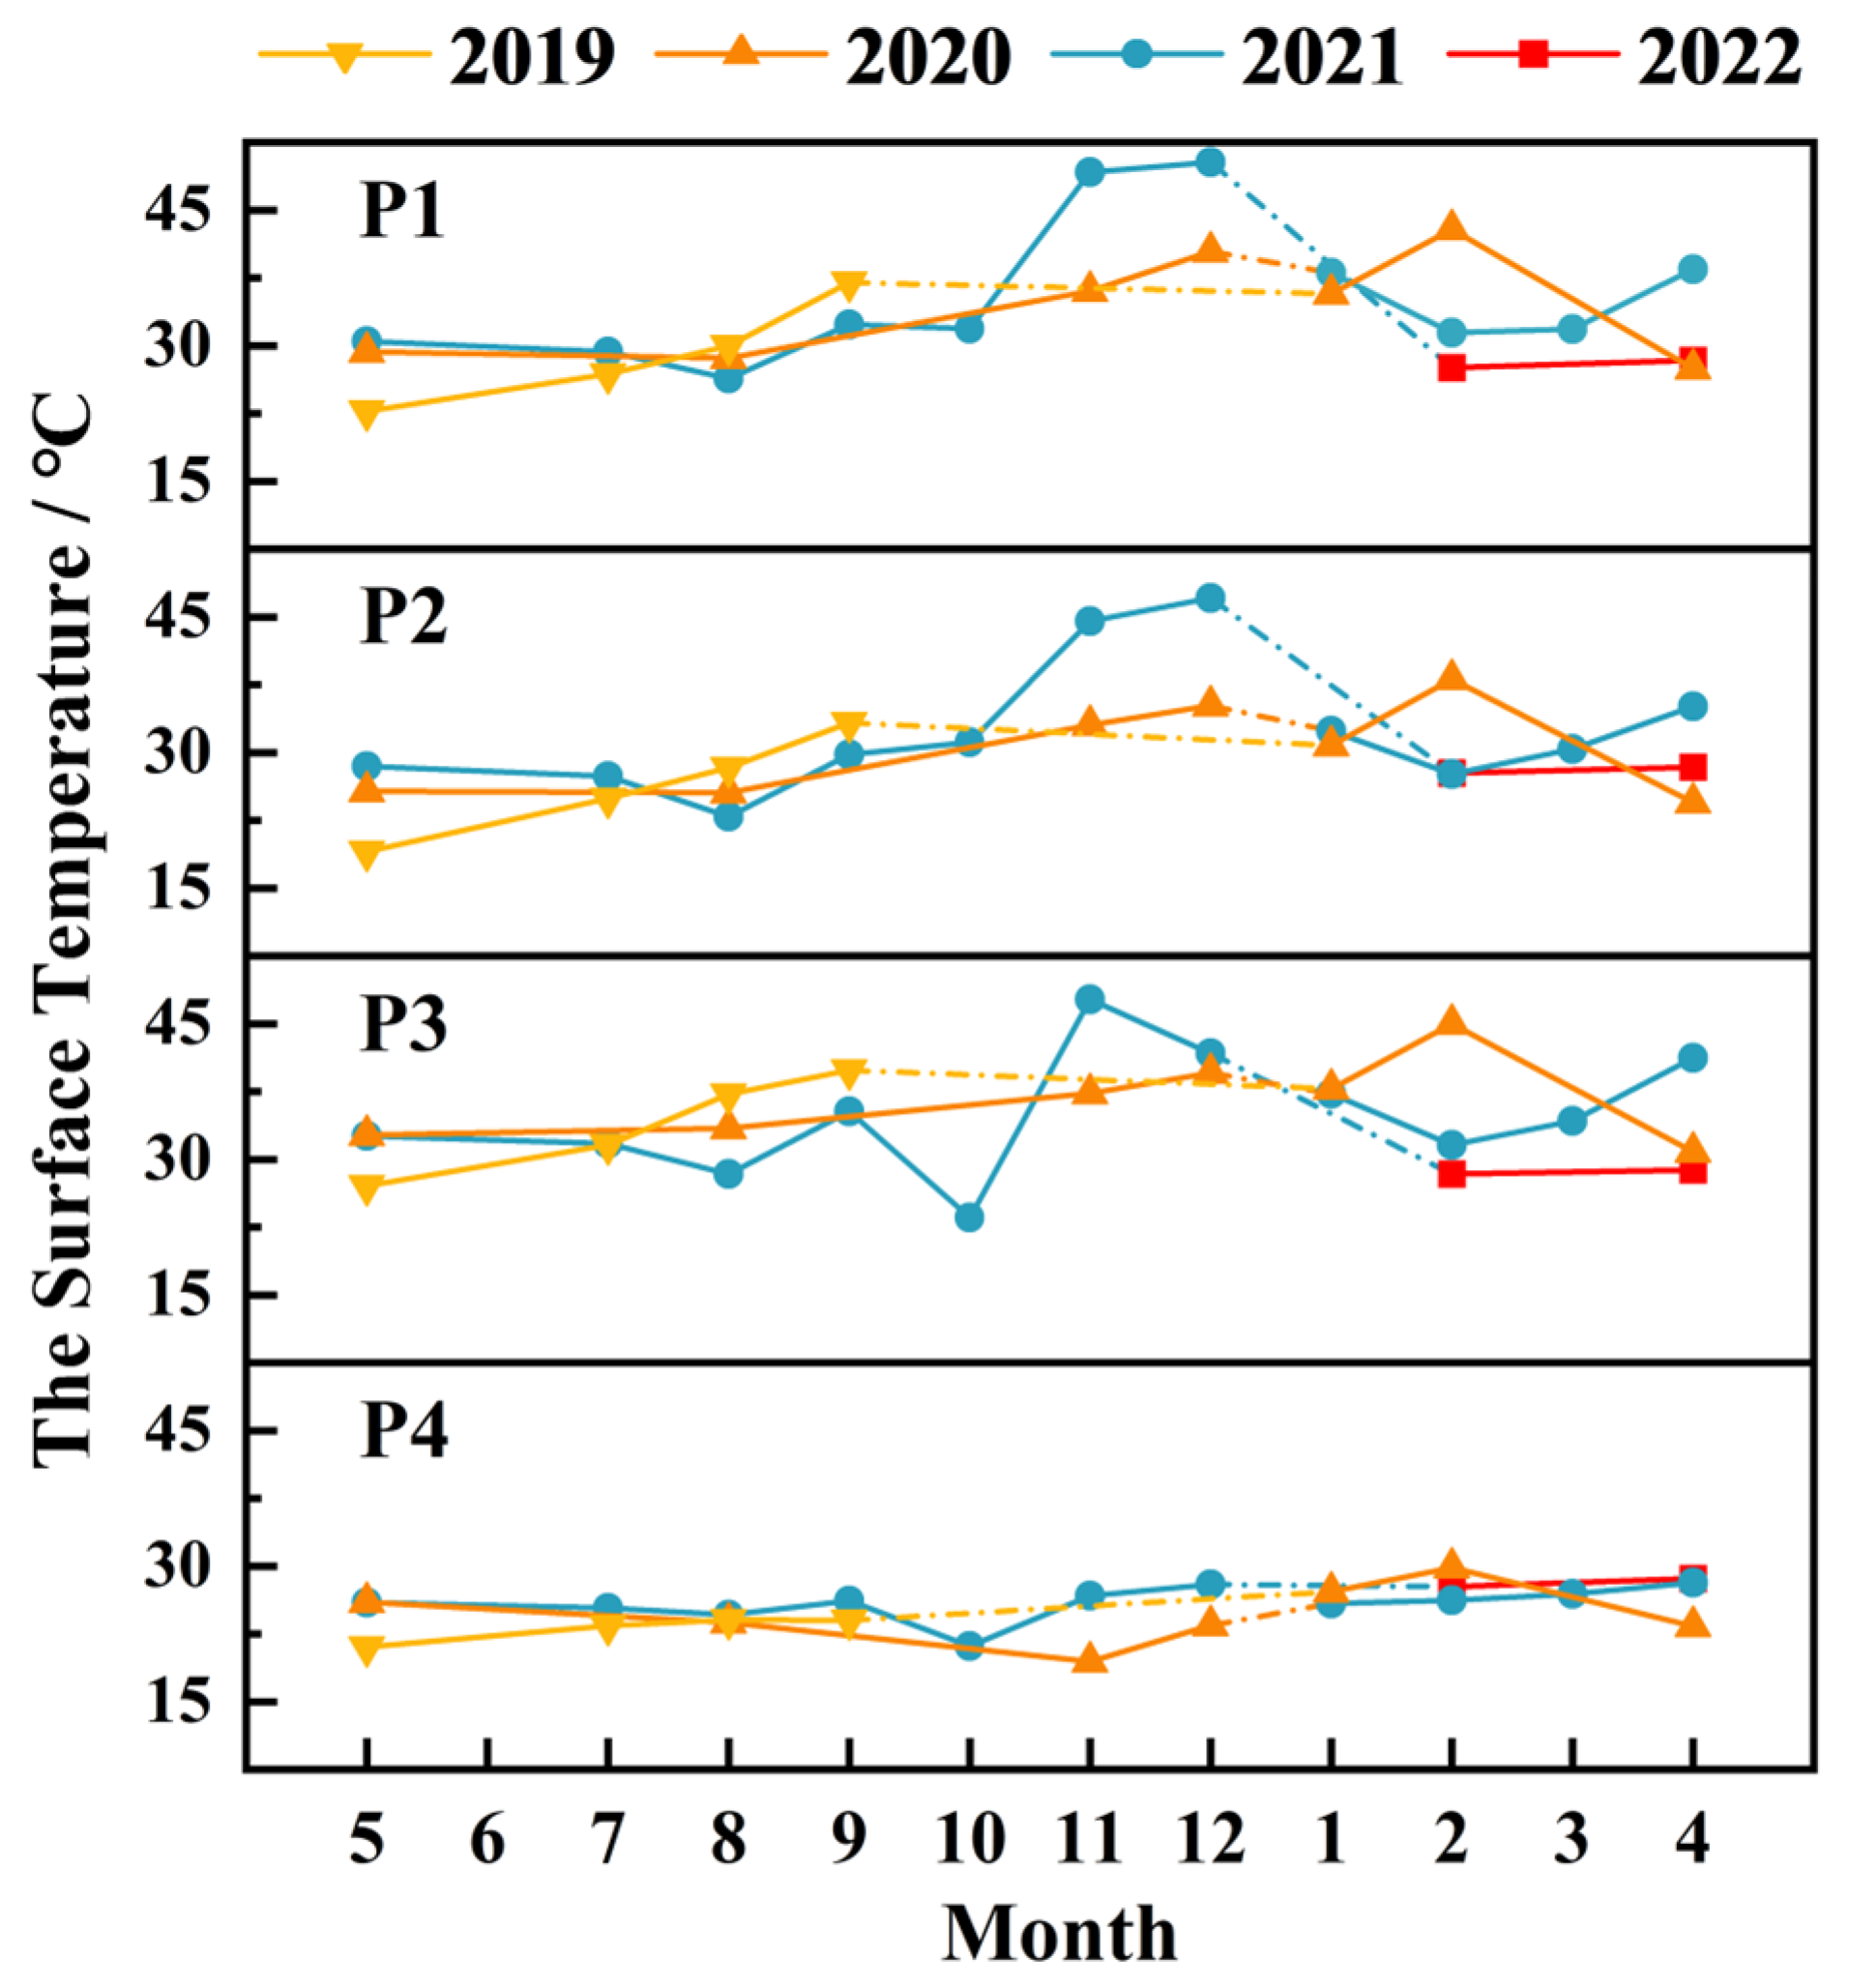
As shown in Figure 7, the surface temperature around Tonga varies cyclically, with cooler temperatures from April to August (Figure 7a–d,h–j,p–s) and warmer temperatures from November to February (Figure 7f,g,k–n,u–w). However, in November and December 2022, the temperature on Ahapai Island was unusually high (Figure 7v,w), and the surface temperature of the crater was 10 °C Celsius higher than that in previous years (Figure 7). The surface temperature of Ahapai Island decreased in February 2022. In this paper, four feature points were selected for time series analysis in Ahapai Island (Figure 7x). Points P1 and P2 were located near the crater, and P3 and P4 were located on the east and west ridges. The time series results of the feature points are shown in Figure 8. Until November 2022, the surface temperature at point P3 was always higher than that at points P1 and P2 in the crater, and the surface temperature at point P4 was the lowest. However, starting from October 2022, the surface temperatures at points P1 and P2 suddenly increased, and their values were also more significant than those at point P1. The temperatures were P1, P2, P3, and P4 in descending order, and this order became clearer in December 2022.
Overall, the HTHH volcano had an apparent change in surface temperature before and after the eruption, with the HTHH volcano having an anomalously high surface temperature before the eruption and a decrease in surface temperature after the HTHH eruption [40,41]). The decrease in the surface temperature of Ahapai Island may have come from gases released by the eruption [42], such as sulfur dioxide, water vapor, and other volcanic gases.
3.4. Analysis of Water Vapor Flux Divergence and Water Vapor Flux
Water vapor flux and water vapor flux divergence are the most direct types of evidence for predicting precipitation [43]. Therefore, this article also considers water vapor flux and water vapor flux divergence as feedback factors for changes in low-level atmospheric environmental characteristics. Among them, water vapor flux was introduced to quantify the direction and magnitude of water vapor transport and where it was concentrated. Water vapor flux divergence describes the amount of water vapor dissipated per unit time and per unit volume.
In this paper, the water vapor flux, water vapor flux dispersion, and the anomaly level of water vapor flux dispersion and water vapor flux from 14 to 17 January 2022, were analyzed, where the climate state was the data from 14 to 17 January 1981 to 2010.
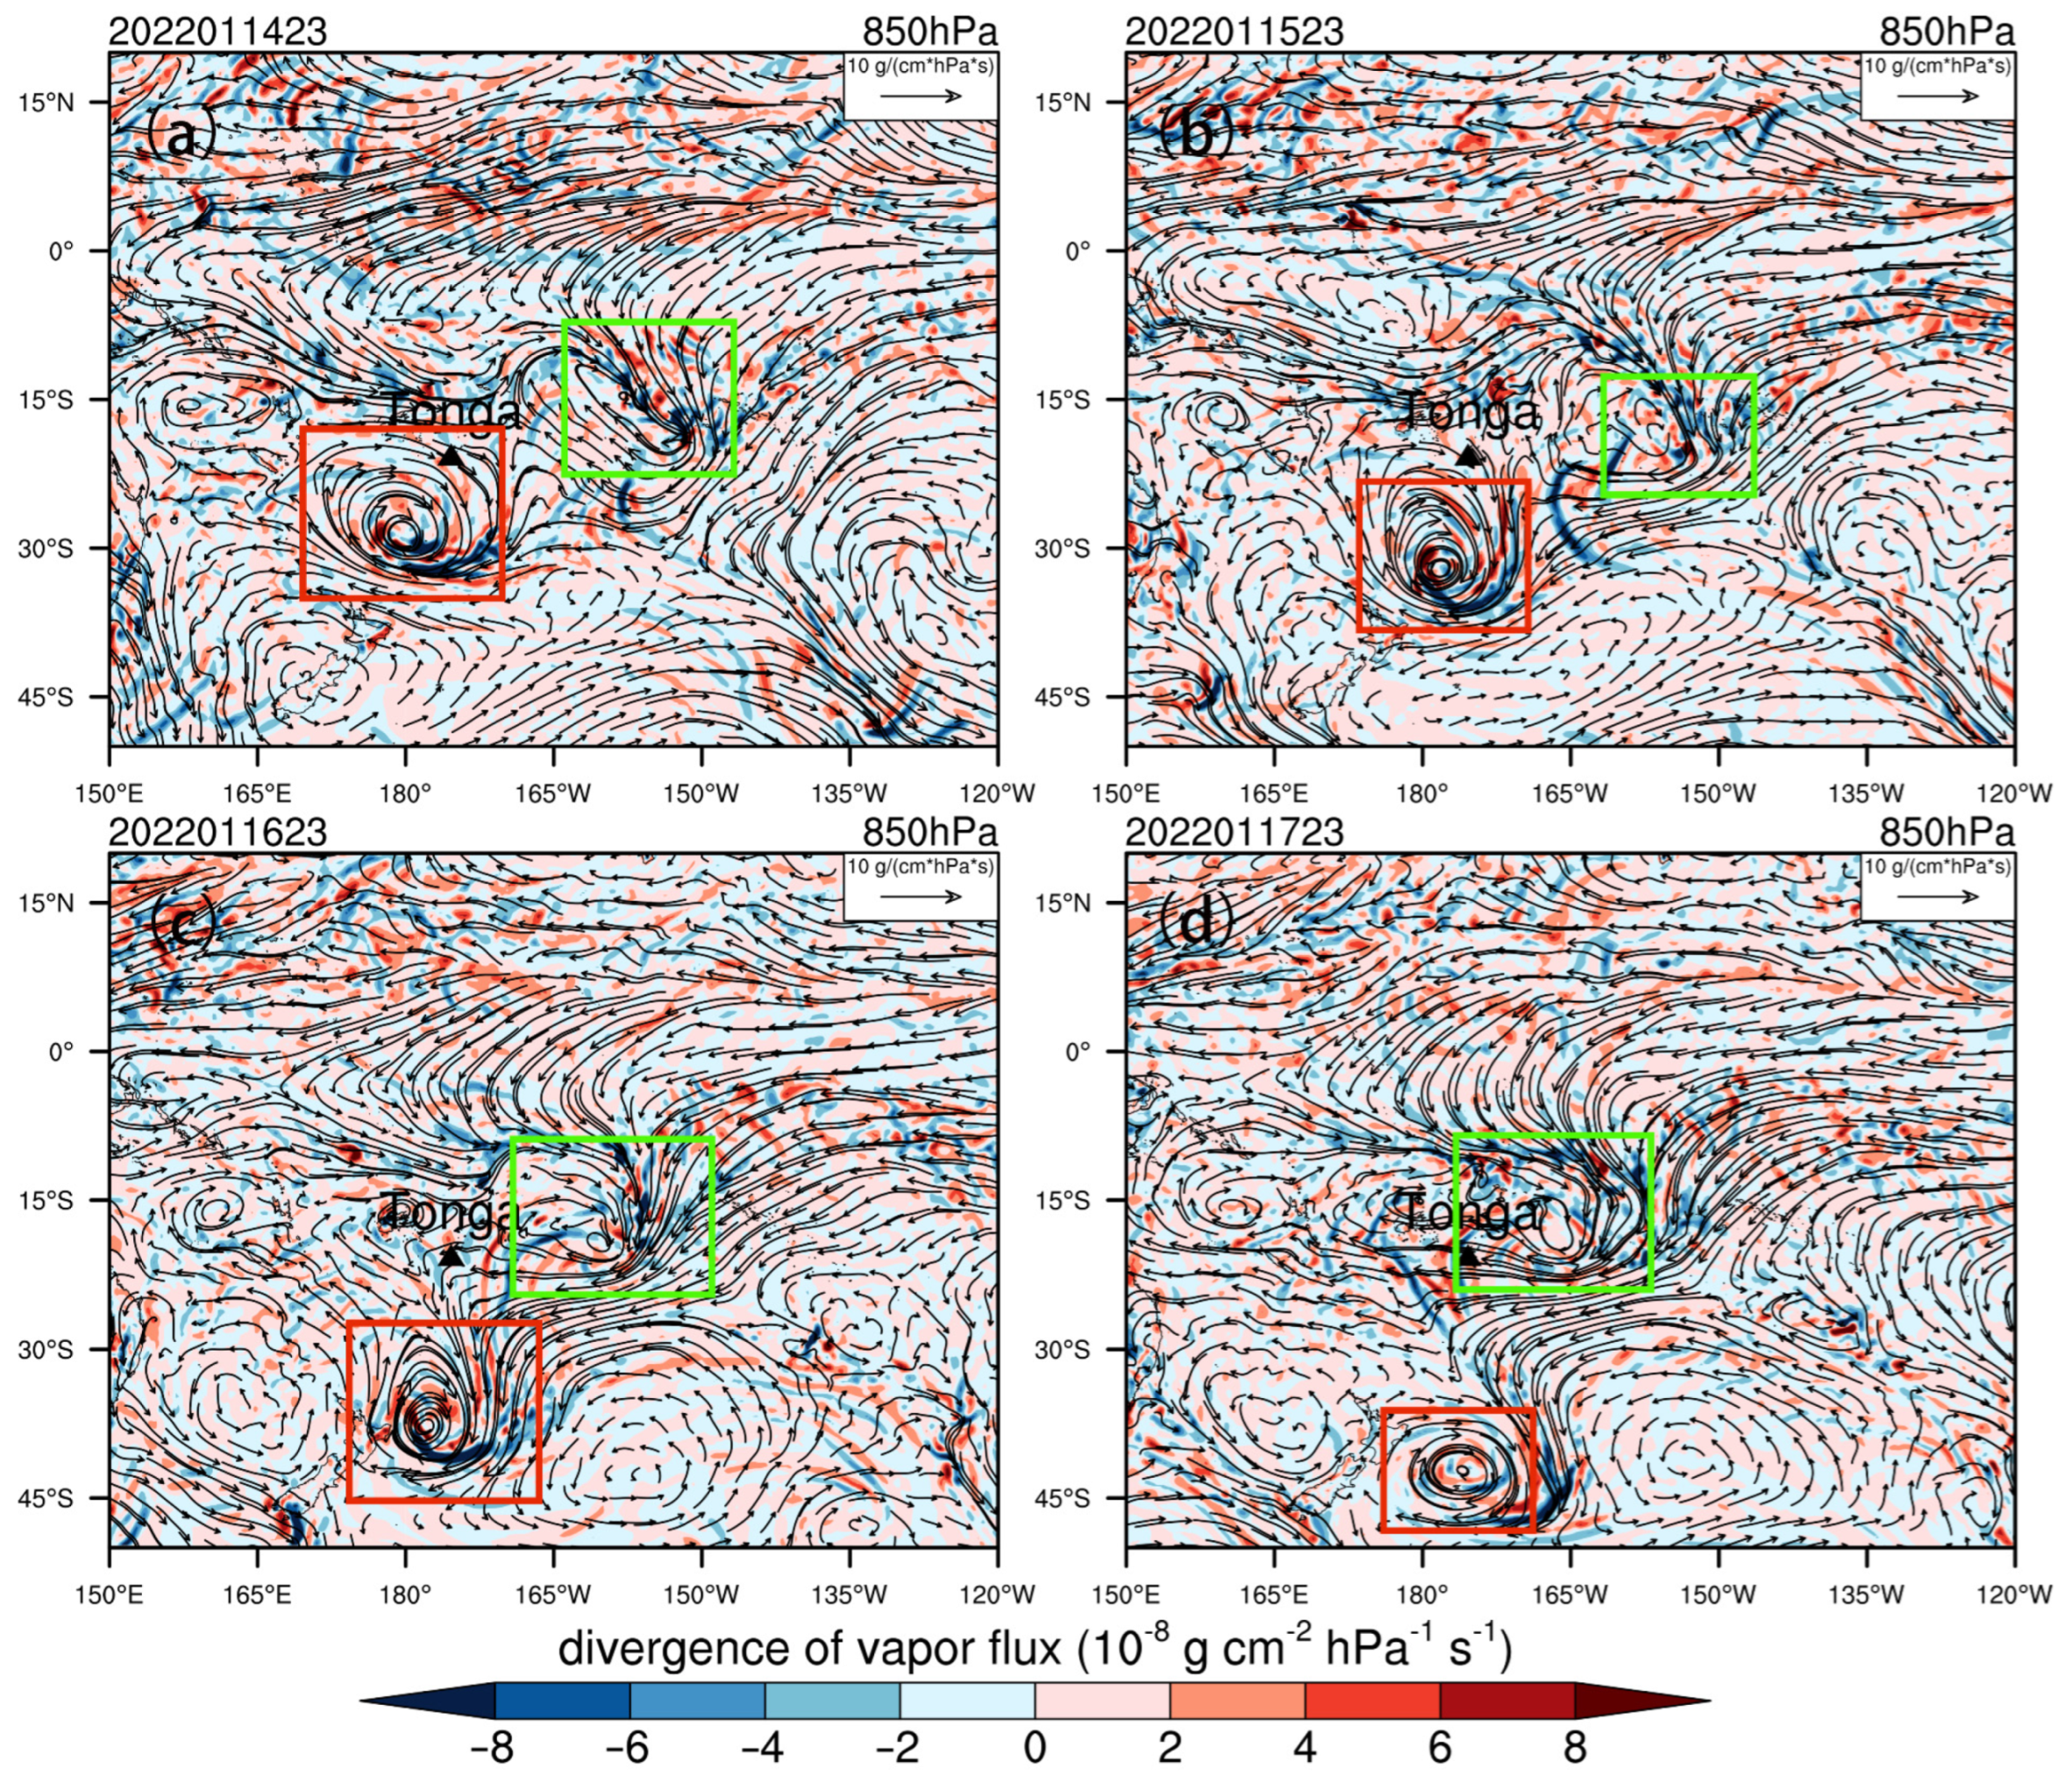
As shown in Figure 9, a positive divergence of water vapor flux indicates that water vapor is diverging, while a negative divergence indicates that water vapor is converging. On 14 January (Figure 9a), there was a weak water vapor convergence zone over the Tonga volcano, and on 15 January (Figure 9b), this weak water vapor convergence zone strengthened due to increased water vapor transport from high latitudes. On the 16th (Figure 9c), the Tonga volcano had a weak water vapor divergence zone over 850 hpa, and the northeast air flow inhibited the water vapor transport. On the 17 January (Figure 9d), the water vapor divergence increased, and the easterly airflow increased, inhibiting water vapor transport over the ocean at high latitudes.
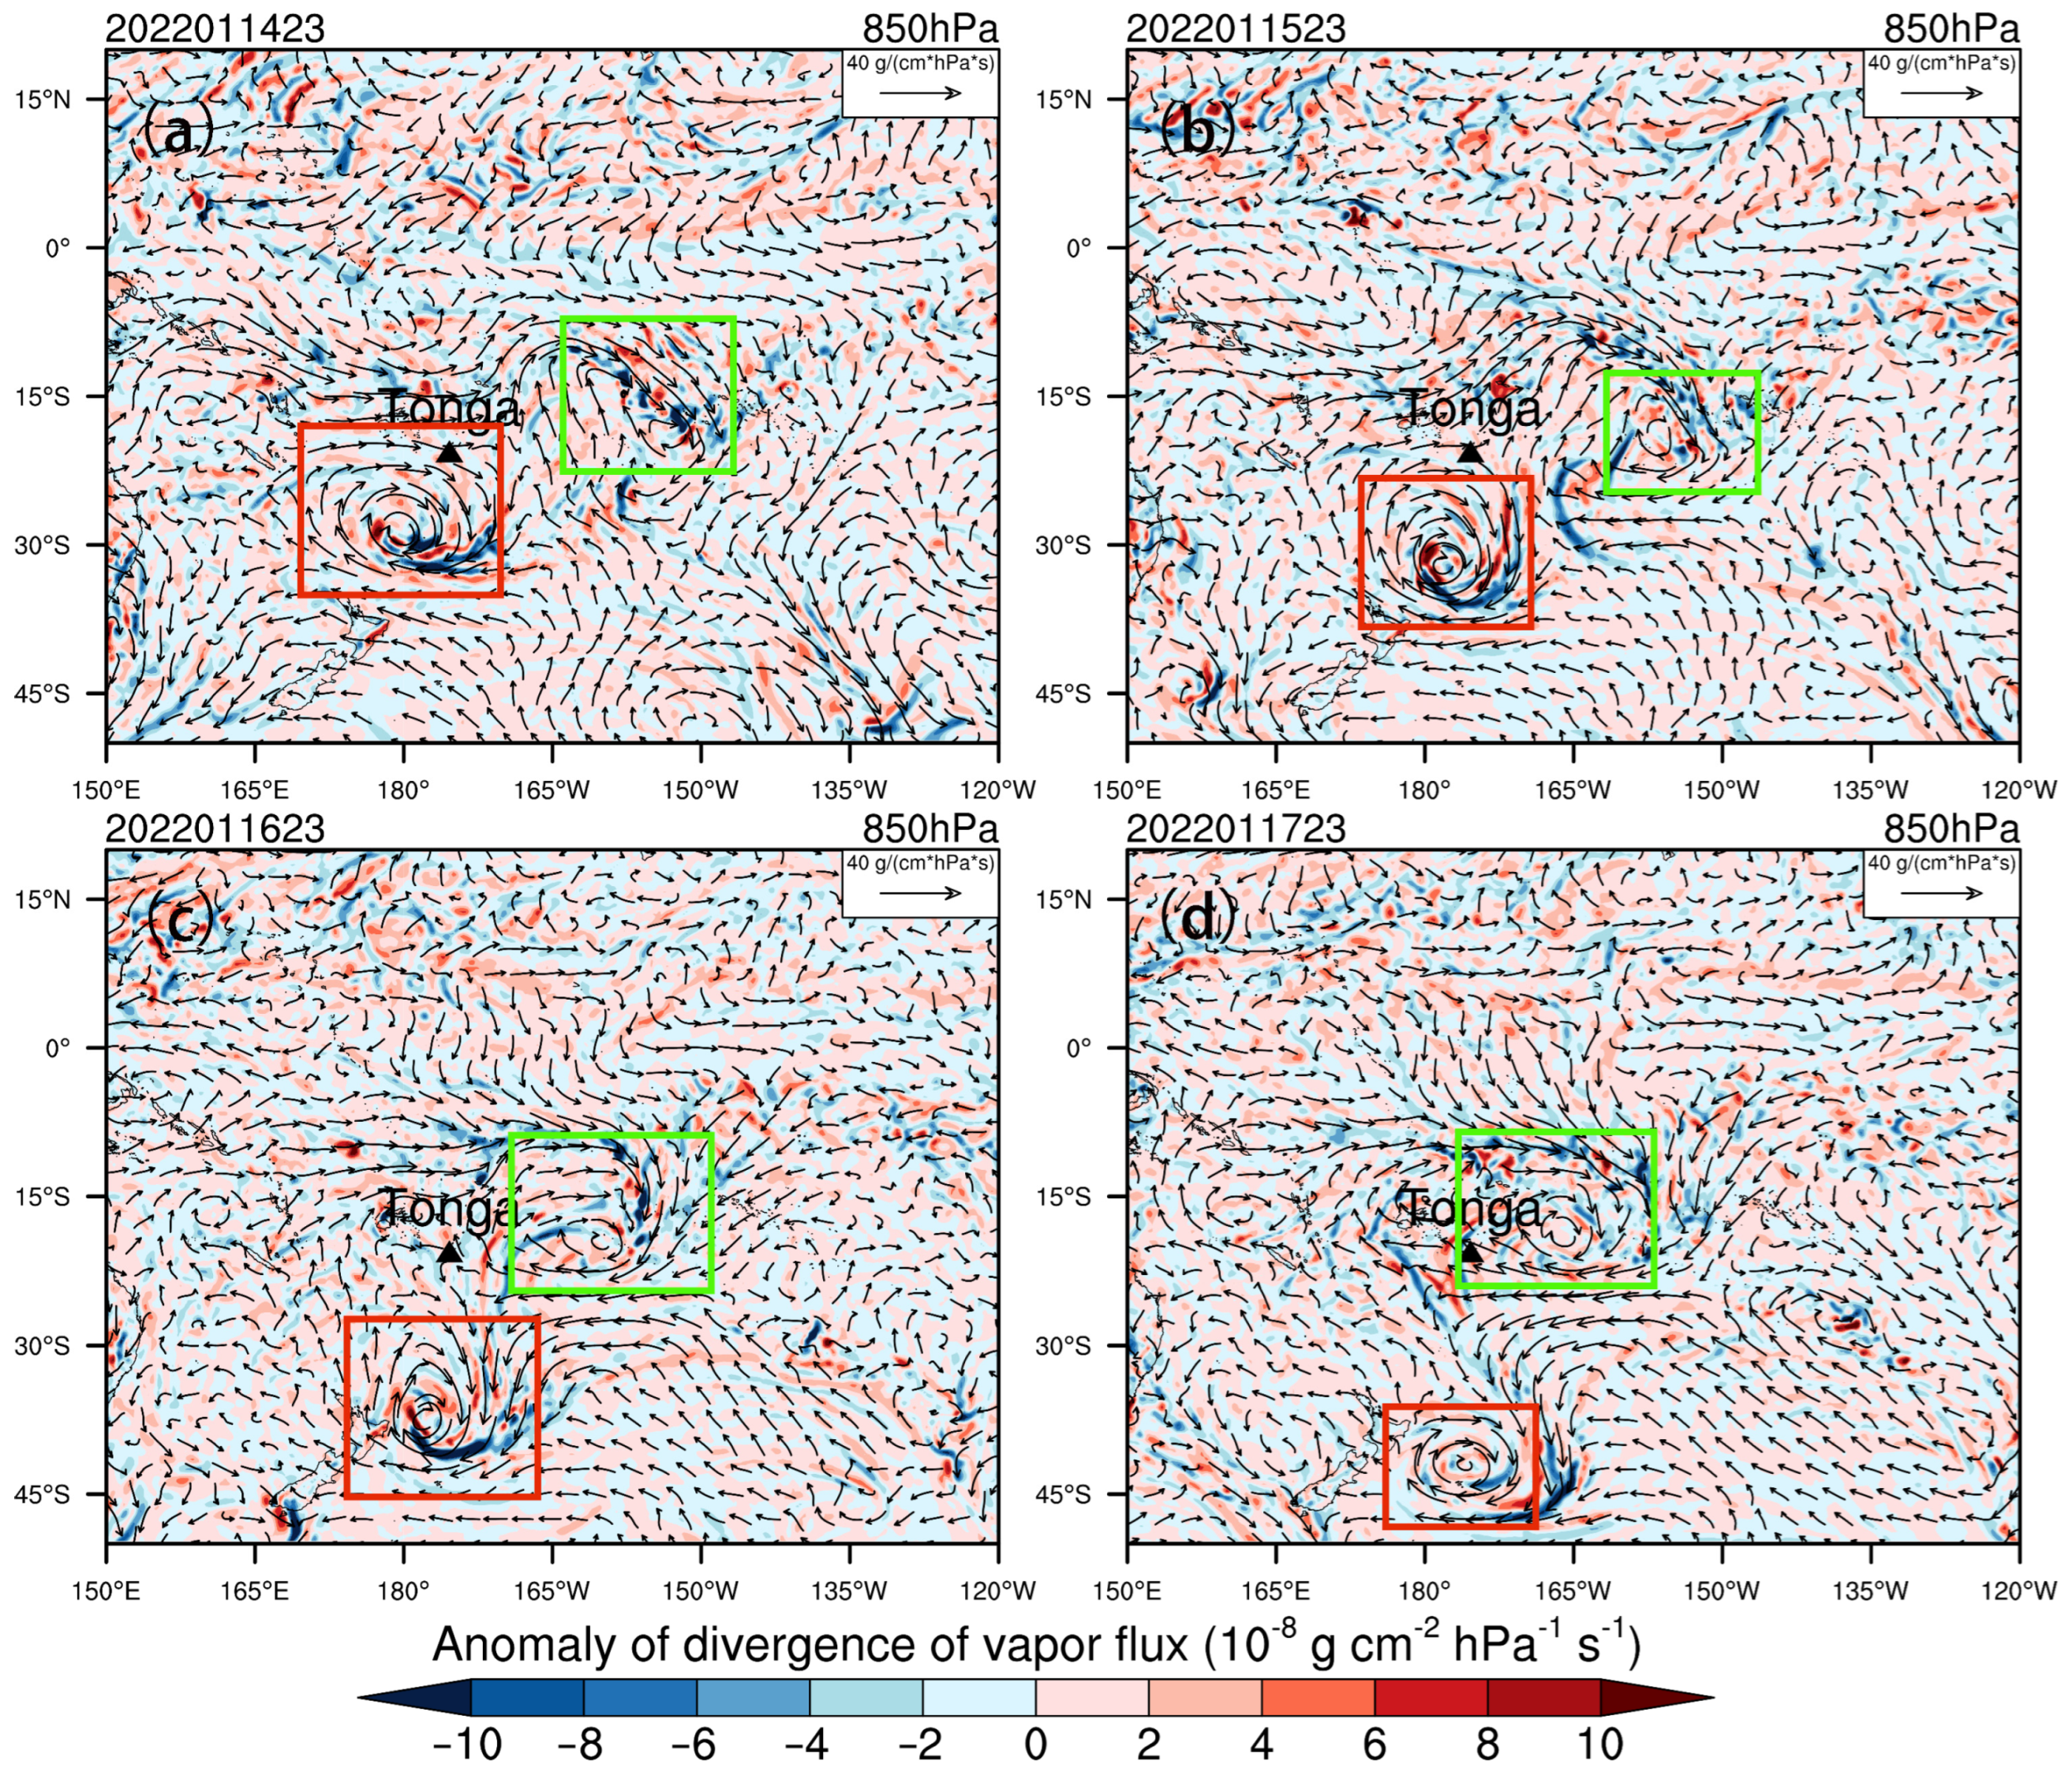
As shown in Figure 10, there was an anomalous area of water vapor irradiation over Tonga volcano on 14 January (Figure 10a), and the westerly airflow brought high-latitude water vapor transport, and this anomalous area of irradiation over Tonga volcano was strengthened on 15 January (Figure 10b). Water vapor transport was also strengthened at 850 hPa. On 16 January (Figure 10c), there was a weak anomalous area of water vapor irradiation over Tonga volcano, and the easterly airflow suppressed water vapor transport. On 17 January (Figure 10d), the anomalous area of water vapor irradiation was strengthened, and the easterly airflow was also strengthened.
A low-pressure center is also known as a cyclone [44]. Figure 9 shows that the direction of water vapor transport largely coincides with the direction of atmospheric circulation [45,46]. A large amount of water vapor is accumulated in the southern cyclone of Tonga, where most of the water vapor comes from the diversion of the low-pressure center in eastern Tonga. The intensity of water vapor transport in the southern cyclone reached the highest value on the second day after the eruption of the HTHH volcano (Figure 9c). On 15 January, the southern cyclone of Tonga moved toward New Zealand under the influence of the volcanic eruption (Figure 9b). At the same time, a low-pressure center in eastern Tonga began to build up and move towards Tonga, transporting large amounts of water vapor to Tonga. As shown in Figure 10, a westerly wind formed under the influence of the low-pressure center in southern and eastern Tonga. This westerly wind transported a large amount of water vapor to southern and eastern Tonga. The water vapor transport intensity of the southern cyclone in Tonga reached the highest value on the 16th (Figure 10c), consistent with the PWV results. The anomalous water vapor of the southern cyclone in Tonga on the 16th was most likely from the water vapor released by the HTHH volcanic eruption [47]. The eastern low-pressure center was moving toward Tonga after the eruption (Figure 10d), and the influence of water vapor on CKIS was weakened (Figure 4i), so the PWV of CKIS returned to normal after 17 January [48]. The formation of the cyclone in eastern Tonga may have been related to the eruption of the HTHH volcano and may have affected precipitation in the South Pacific [49,50,51]. It is worth noting that the volcanic activity in Tonga volcano was also intense on the 15th. Therefore, we can conclude that volcanoes have a certain correlation with water vapor activity.
3.5. Analysis of Rainfall
Whether it is PWV, atmospheric circulation, temperature, water vapor flux, or water vapor flux divergence, the ultimate focus is on precipitation, so changes in precipitation characteristics are important characterizations in the lower atmosphere. For precipitation characteristics, the two cyclones mentioned above continuously transport water vapor to the surrounding areas of Tonga, and the water vapor delivery may bring rainfall [10,43]. The eruption of the HTHH volcano may have had an impact on the precipitation around Tonga. In this paper, the precipitation in January and February in Tonga in the recent seven years was analyzed, and the precipitation distribution in the surrounding area of Tonga in January and February was obtained.
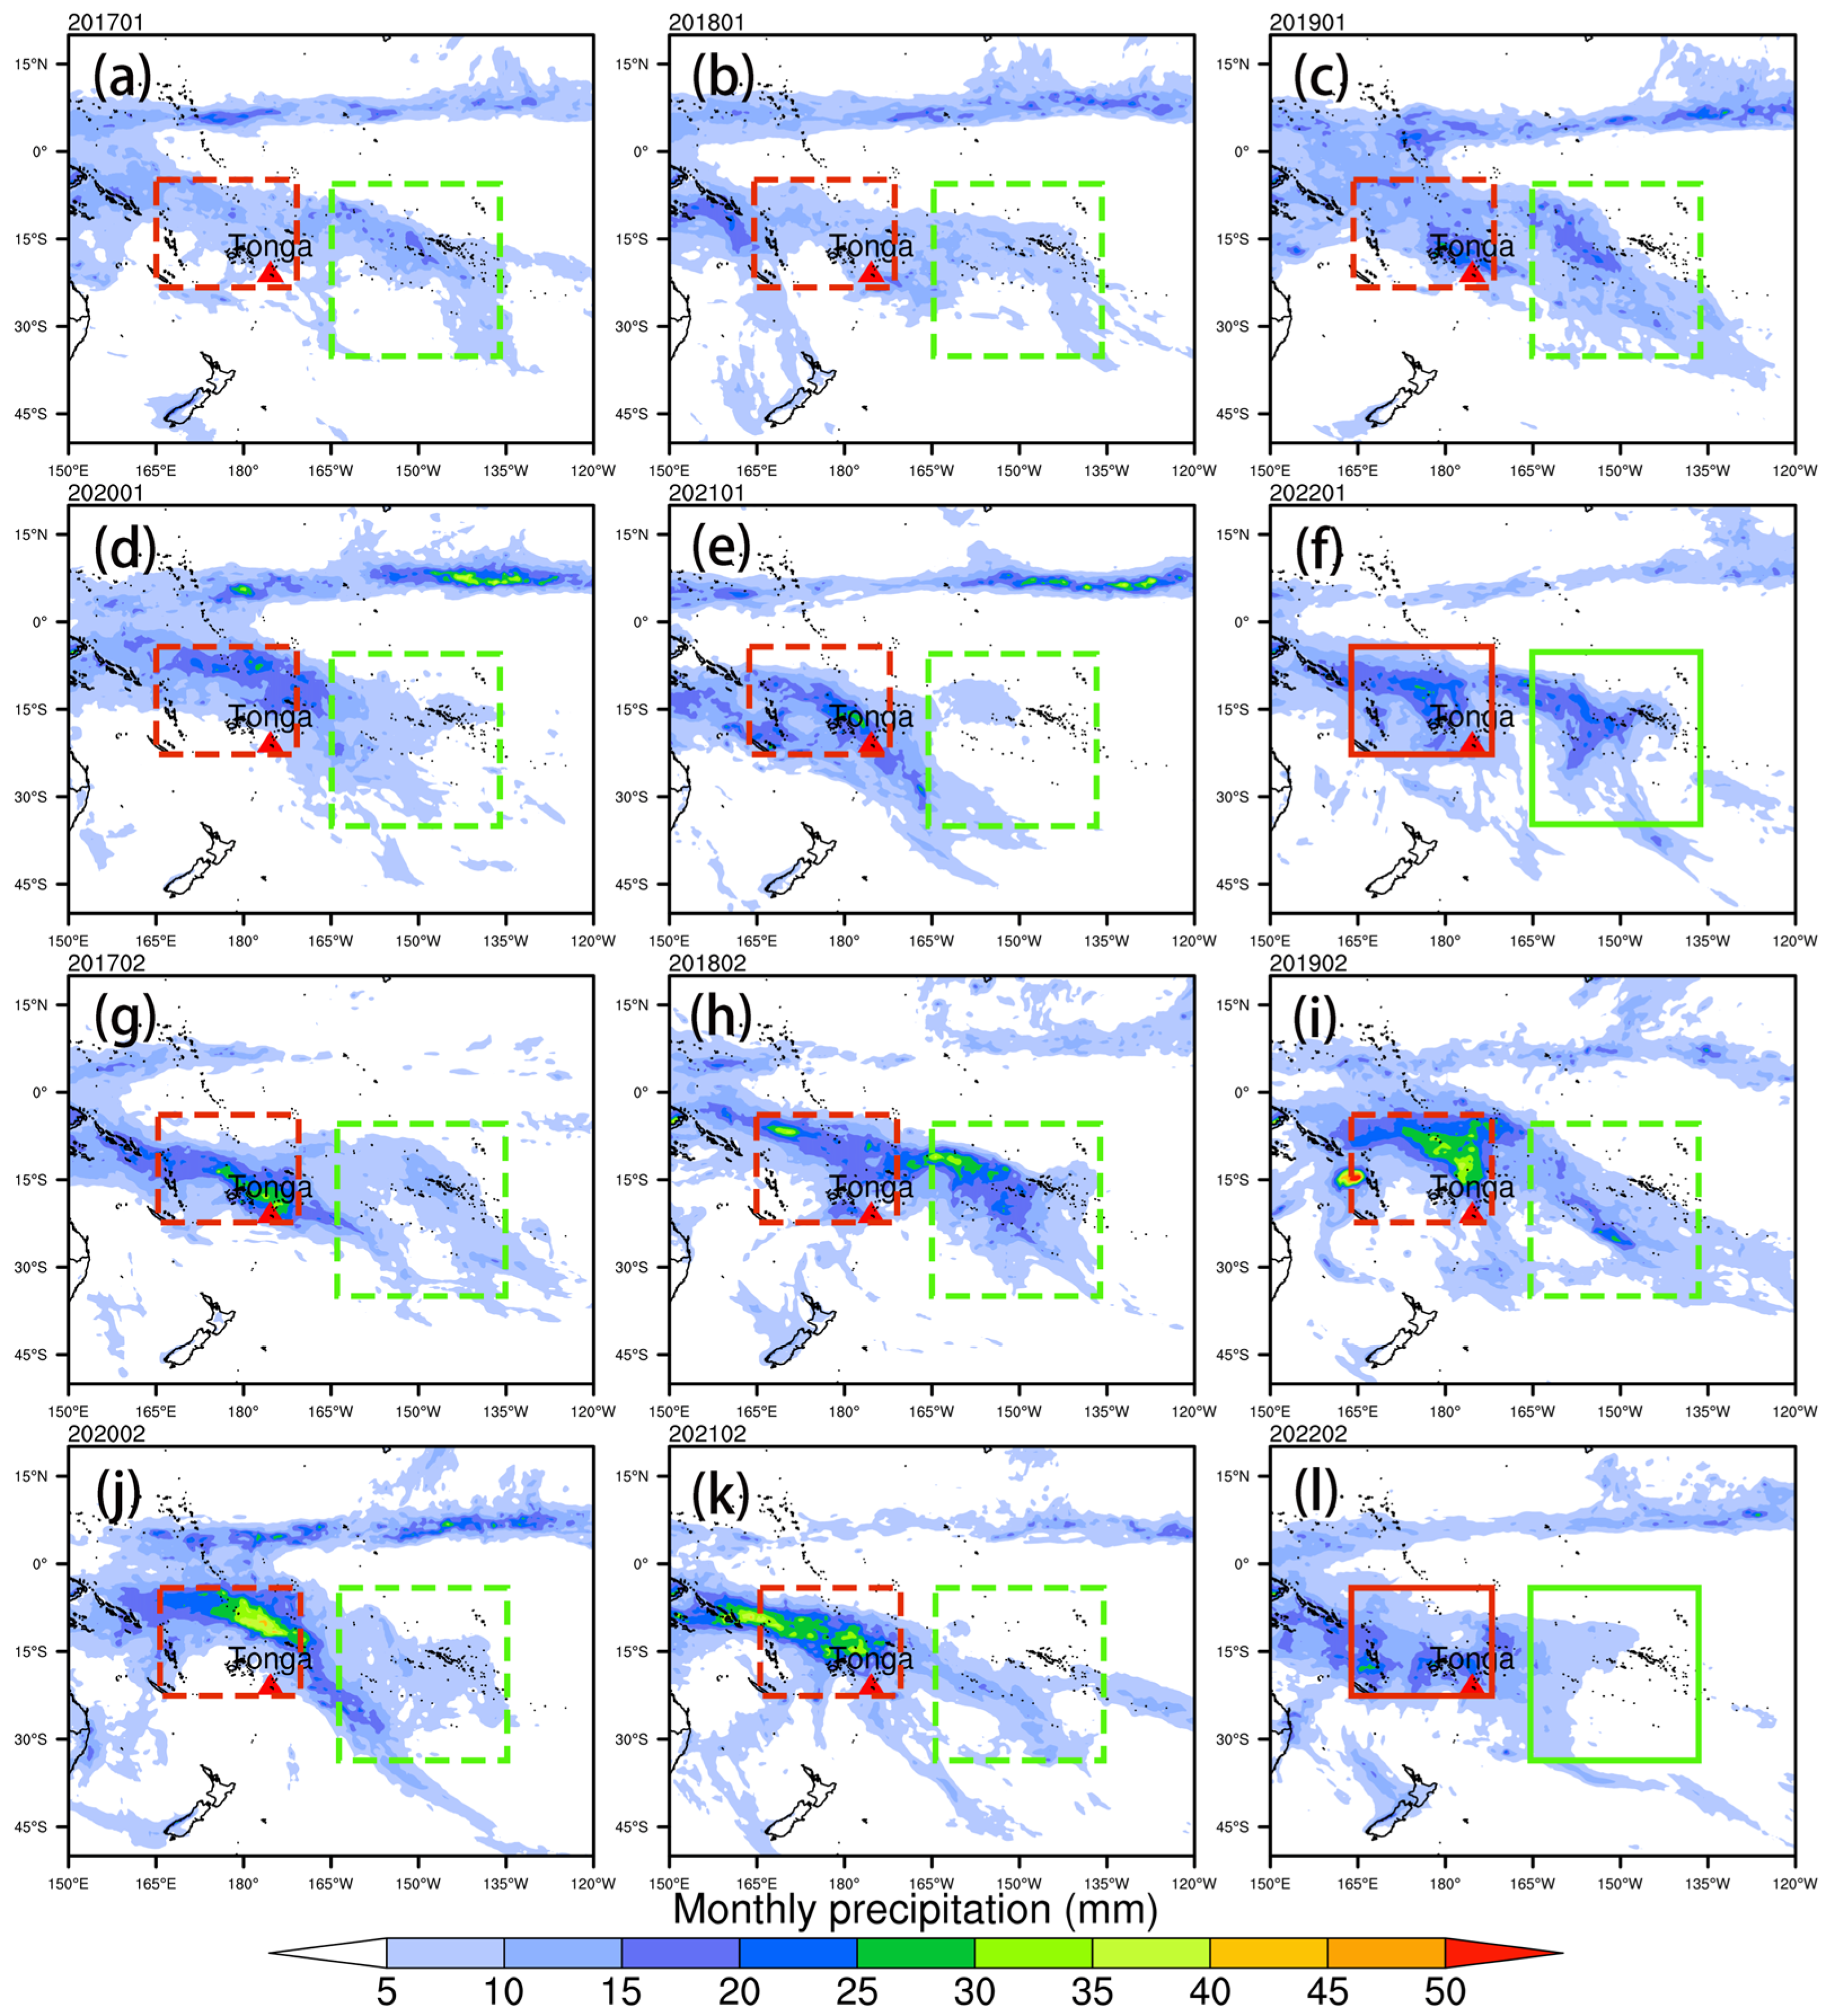
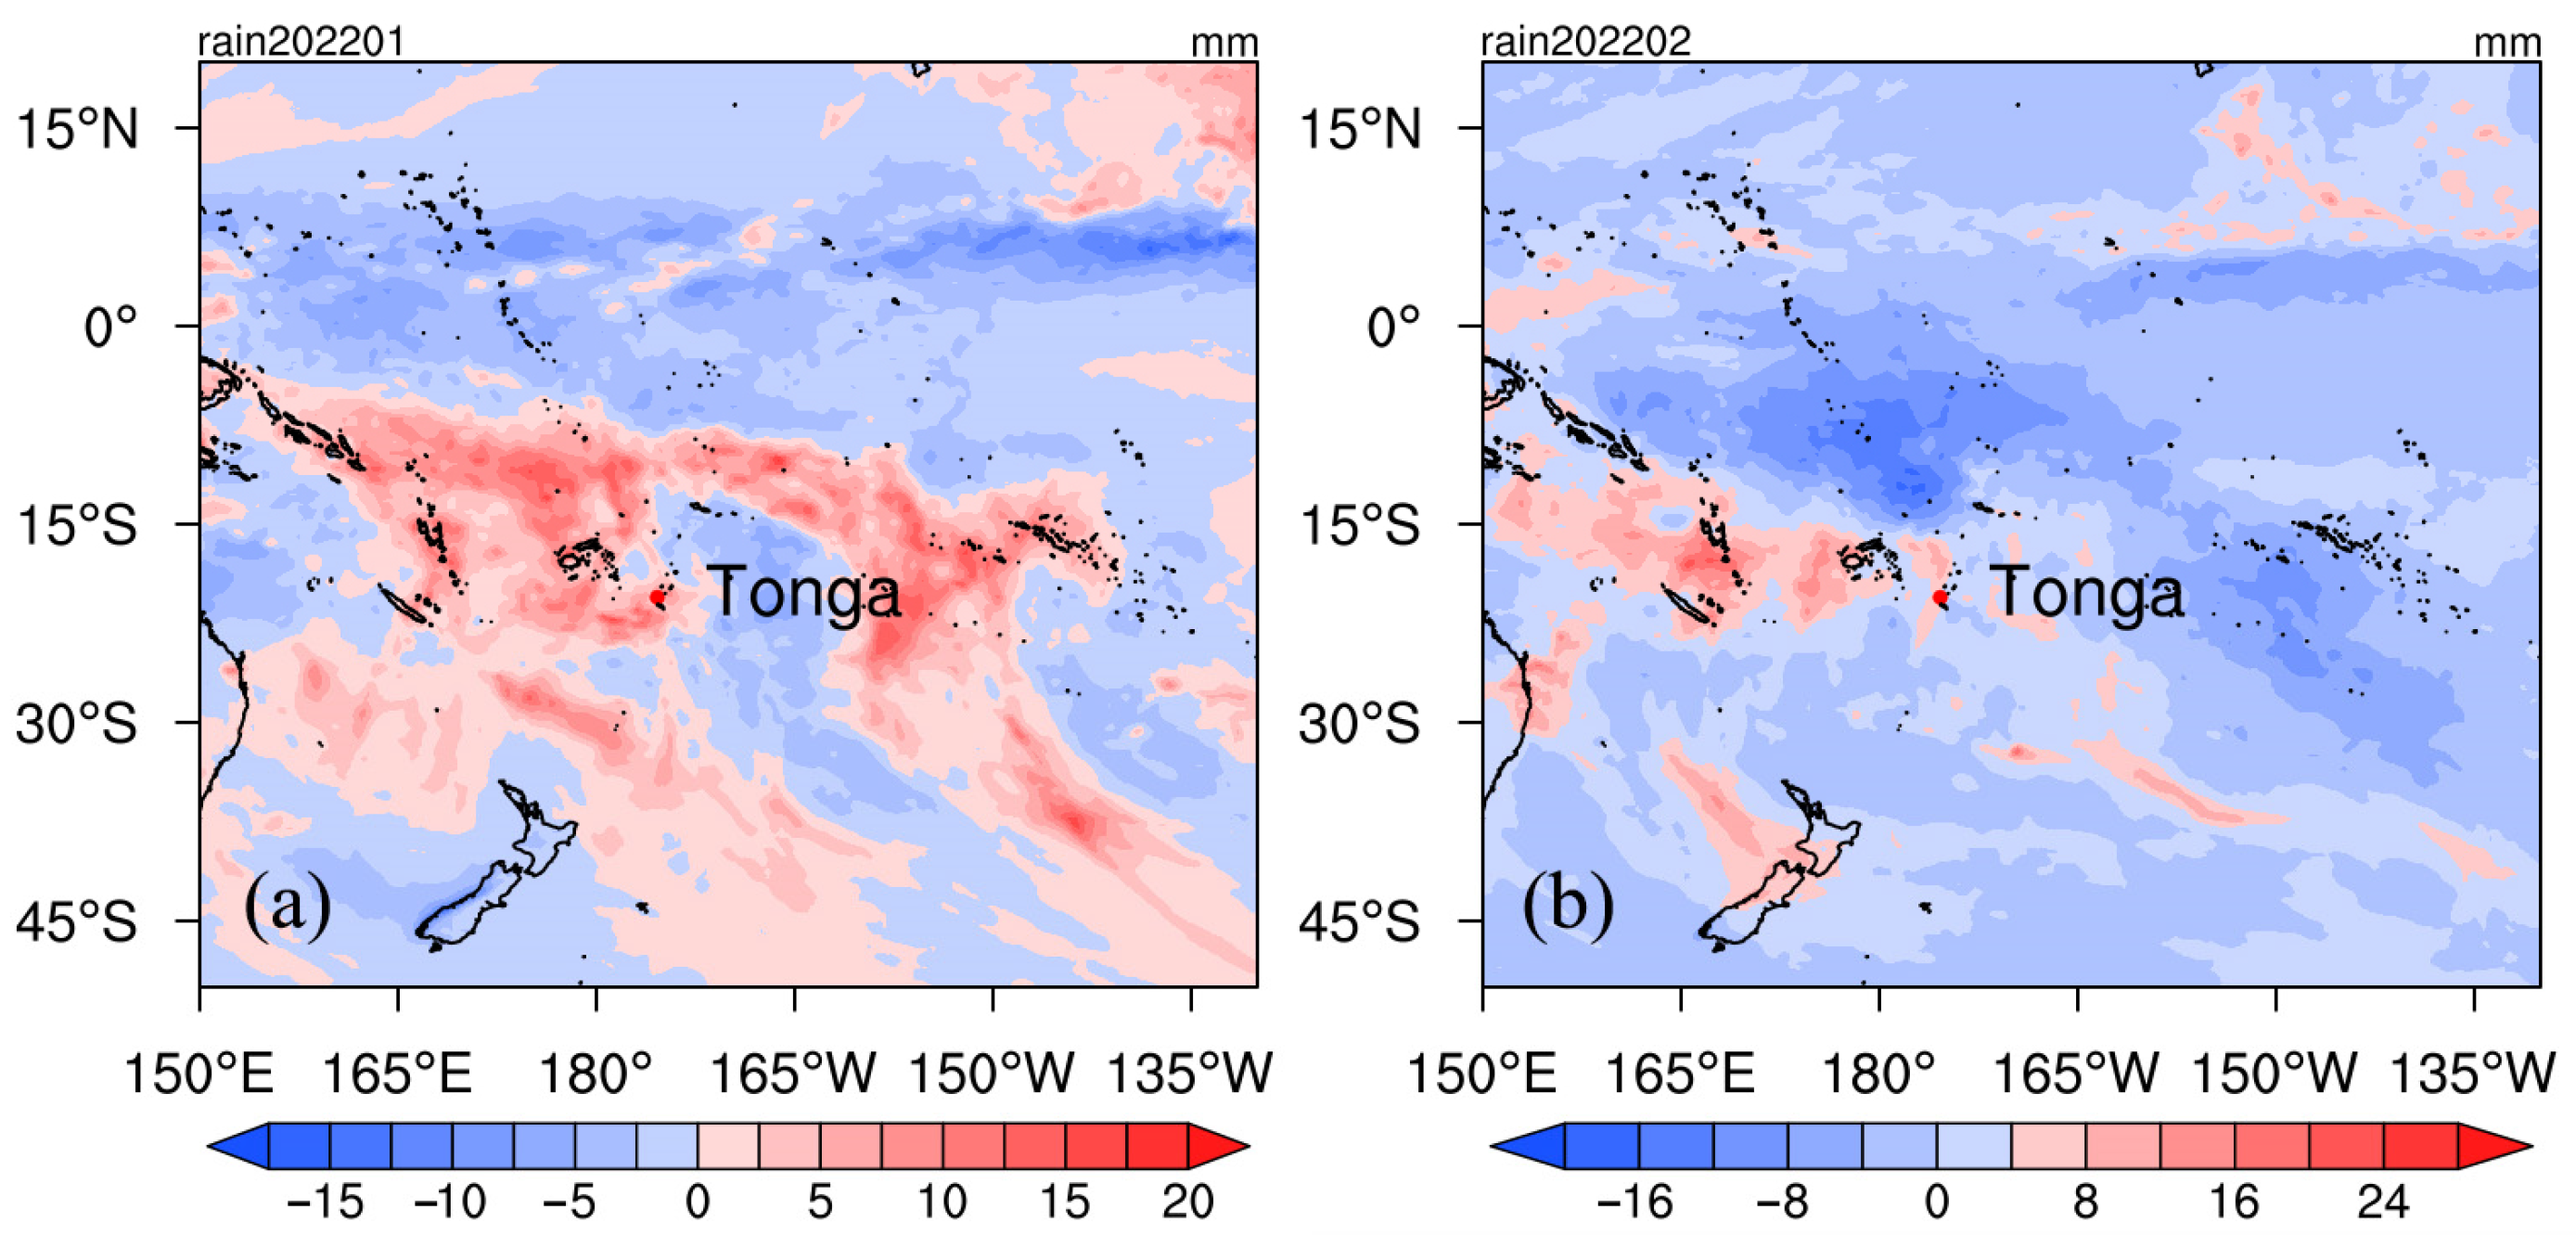
As shown in Figure 11a–e, the precipitation in the eastern part of Tonga in January was significantly less than in the central part of Tonga. However, in January 2022 (Figure 11f), the precipitation in the Tonga region increased significantly, especially in the eastern part of Tonga, forming a large precipitation region. This area of precipitation was consistent with the location of the low-pressure center in eastern Tonga [52,53,54]. As can be seen in Figure 11g–k, there was significant precipitation in the central and eastern parts of Tonga in February. The precipitation area in the east of Tonga was more extensive, but in February 2022 (Figure 11l), the precipitation area in the east of Tonga was significantly reduced. Taking the average precipitation in January of the past six years as the background value, the precipitation anomaly map for January 2022 (Figure 12a) was obtained, which shows that the precipitation in Tonga and the eastern region has significantly increased. Taking the average precipitation in February in the recent six years as the background value, the precipitation anomaly map for February 2022 was obtained (Figure 12b). It can be seen that only Tonga and a few areas (concentrated around 20° S) experienced an increase in precipitation, while most of the rest experienced a decrease in precipitation. In February 2022, the surface temperature decreased (Figure 7), PWV values around Tonga generally reduced (Figure 4), and precipitation around Tonga also decreased significantly (Figure 11l). It can be concluded that there is a strong correlation between volcanic activity and rainfall characteristics.
In conclusion, it can be seen that PWV, water vapor flux, temperature, and precipitation are closely related [55,56]. When the water vapor flux increases abnormally, the PWV value also changes, precipitation increases, and surface temperature increases. When PWV generally decreases, precipitation decreases, and surface temperature decreases. At the time of a volcanic eruption, the temperature of the surrounding sea rises, and the PWV located in the troposphere begins to be anomalous. The water vapor flux at the height of 500 hpa from the surface is transported to the low-pressure center by the circulation. Rainfall begins to form in the path of the transport of the water vapor flux, and they jointly influence the environmental characteristics in the lower atmosphere.
4. Conclusions
The lower layers account for more than 80 percent of the entire Earth’s atmosphere and directly impact weather and climate. Most natural hazards are affected in the lower atmosphere. The environmental response characteristics of volcanic eruptions are generally obtained from a single environmental factor. In this paper, the environmental response characteristics and evolution of the 2022 Tonga volcanic eruption in the lower space were obtained from the combined analysis of multiple environmental factors such as PWV, circulation, water vapor flux, surface temperature, and precipitation. Two cyclones appeared in the east and south of Tonga before and after the HTHH eruption. The southern cyclone strongly influenced water vapor transport and precipitation around Tonga, and the intensity of water vapor flux in the south of Tonga reached its maximum on the second day of the eruption (16 January). The eastern cyclone appeared after the volcanic eruption and was probably regulated by the volcanic eruption on the atmospheric and oceanic circulation, resulting in a new cyclone. The two cyclones affect water vapor, precipitation, and temperature around Tonga. PWV also appeared to be anomalous after the eruption, with anomalous values reaching a maximum on the day after the violent eruption (16 January 2022). After the volcanic eruption, the southern cyclone of Tonga moved toward New Zealand, and the eastern cyclone gradually formed and moved toward Tonga. After obtaining the anomalous water vapor flux through the climate state, it could be found that a large amount of water vapor released from the HTHH volcanic eruption on 15 January may have been transported to the cyclone in the eastern part of Tonga and brought a large amount of rainfall to the area. The changes in PWV, surface temperature, and precipitation before and after the HTHH volcanic eruption are closely related. It could be found that when PWV increased in Tonga, the surface temperature increased and precipitation increased in February 2022. When PWV decreases, surface temperature decreases, and precipitation decreases.
Author Contributions
F.K. and X.H. conceived and designed the experiments; L.M. and X.H. performed the experiments; B.S. and X.H. analyzed the data; L.M. contributed materials; X.H. wrote the paper. Provision of meteorological data and mapping by G.H. All authors have read and agreed to the published version of the manuscript.
Funding
The Natural Science Foundation of Jiangsu Province (grant no. BK20211037), the National Natural Science Foundation of China (grant no. 41674036), and Talents of Six Peaks in Jiangsu Province (grant no. XYDDX-045).
Institutional Review Board Statement
Not applicable.
Informed Consent Statement
Not applicable.
Data Availability Statement
Landsat OLI/TIRS sensor data is downloaded from https://earthexplorer.usgs.gov/ from April 2019 to April 2022. The Circulation, Water vapor flux and Precipitation datasets are available from the European Centre for Medi-um-Range Weather Forecasts (https://cds.climate.copernicus.eu/cdsapp#!/search?type=dataset). Global Positioning System raw data of IGS are downloaded via https://cddis.nasa.gov/archive/gnss/data/.
Acknowledgments
We acknowledge the International Association of Geodesy (IAG) for the IGS raw data and the European Centre for Medium-Range Weather Forecasts for providing us with the circulation, water vapor flux, and precipitation dates. Finally, we are grateful for the USGS Landsat OLI/TIRS sensor data support.
Conflicts of Interest
The authors declare no conflict of interest.
References
- Yang, Z.; Gu, S.-Y.; Qin, Y.; Teng, C.-K.-M.; Wei, Y.; Dou, X. Ionospheric Oscillation with Periods of 6–30 Days at Middle Latitudes: A Response to Solar Radiative, Geomagnetic, and Lower Atmospheric Forcing. Remote Sens. 2022, 14, 5895. [Google Scholar] [CrossRef]
- Ridley, A.D.; Solomon, S.; Barnes, E.J.; Burlakov, V.D.; Deshler, T.; Dolgii, S.I.; Herber, A.B.; Nagai, T.; Neely, R.R.; Nevzorov, A.V.; et al. Total volcanic stratospheric aerosol optical depths and implications for global climate change. Geophys. Res. Lett. 2014, 41, 7763–7769. [Google Scholar] [CrossRef]
- Paik, S.; Min, S.K.J.C.D. Climate responses to volcanic eruptions assessed from observations and cmip5 multi-models. Clim. Dyn. 2016, 48, 1017–1030. [Google Scholar] [CrossRef]
- Wilson, R.M. Variation of surface air temperatures in relation to El Niño and cataclysmic volcanic eruptions, 1796–1882. J. Atmos. Sol. Terr. Phys. 1999, 77, 1307–1319. [Google Scholar] [CrossRef]
- Altman, J.; Saurer, M.; Dolezal, J.; Maredova, N.; Song, J.-S.; Ho, C.-H.; Treydte, K. Large volcanic eruptions reduce landfalling tropical cyclone activity: Evidence from tree rings. Sci. Total Environ. 2021, 775, 145899. [Google Scholar] [CrossRef]
- Scoccimarro, E.; Bellucci, A.; Storto, A.; Gualdi, S.; Masina, S.; Navarra, A. Remote subsurface ocean temperature as a predictor of atlantic hurricane activity. Proc. Natl. Acad. Sci. USA 2018, 115, 11460–11464. [Google Scholar] [CrossRef]
- Hu, Y.; Huang, H.; Zhou, C.J.S.B. Widening and weakening of the hadley circulation under global warming. Sci. Bull. 2018, 63, 640–644. [Google Scholar] [CrossRef]
- Sharmila, S.; Walsh, K.J.E. Recent poleward shift of tropical cyclone formation linked to Hadley cell expansion. Nat. Clim. Chang. 2018, 8, 730–736. [Google Scholar] [CrossRef]
- Owen, L.E.; Catto, J.L.; Stephenson, D.B.; Dunstone, N.J. Compound precipitation and wind extremes over Europe and their relationship to extratropical cyclones. Weather Clim. Extrem. 2021, 33, 100342. [Google Scholar] [CrossRef]
- Jiang, Y.; Zhai, R.; Wang, Q.J. Variability of summer atmospheric moisture flux and its effect on precipitation over east china. Acta Meteorol. Sin. 2005, 19, 469–478. [Google Scholar]
- Brown, J.R.; Lengaigne, M.; Lintner, B.R.; Widlansky, M.J.; Wiel, K.V.D.; Dutheil, C.; Linsley, B.K.; Matthews, A.J.; Renwick, J.J. South pacific convergence zone dynamics, variability and impacts in a changing climate. Nat. Rev. Earth Environ. 2020, 1, 530–543. [Google Scholar] [CrossRef]
- Kuleshov, Y.; Qi, L.; Fawcett, R.; Jones, D.J.G.R.L. On tropical cyclone activity in the southern hemisphere: Trends and the enso connection. Geophys. Res. Lett. 2008, 35, 148–161. [Google Scholar] [CrossRef]
- Vincent, E.M.; Lengaigne, M.; Menkes, C.E.; Jourdain, N.C.; Marchesiello, P.; Madec, G.J.C.D. Interannual variability of the south pacific convergence zone and implications for tropical cyclone genesis. Clim. Dyn. 2011, 36, 1881–1896. [Google Scholar] [CrossRef]
- Gas, V.J.L. Usgs Volcano Hazards Program: Volcanic Gases and Their Effects; United States Geological Survey: Reston, VA, USA, 2015.
- Dey, S.; Sarkar, S.; Singh, R.J.A.i.S.R. Anomalous changes in column water vapor after gujarat earthquake. Adv. Space Res. 2004, 33, 274–278. [Google Scholar] [CrossRef]
- Zhao, Q.; Yao, Y.; Yao, W.J.J.o.A.; Physics, S.-T. Gps-based pwv for precipitation forecasting and its application to a typhoon event. J. Atmos. Sol. Terr. Phys. 2018, 167, 124–133. [Google Scholar] [CrossRef]
- Akilan, A.; Azeez, K.A.; Schuh, H.; Padhy, S.; Kotluri, S.K.J.P.S. Perturbations in atmospheric gaseous components over coastal antarctica detected in gps signals and its natural origin to volcanic eruption. Polar Sci. 2019, 19, 69–76. [Google Scholar] [CrossRef]
- Liu, S.; Cui, L.; Wu, L.X.; Wang, Z. Analysis on the Water Vapor Anomaly before Wenchuan Earthquake Based on Modis Data; Geoscience & Remote Sensing Symposium; IEEE: New York, NY, USA, 2009. [Google Scholar]
- Rocken, C.; Ware, R.; Van Hove, T.; Solheim, F.; Alber, C.; Johnson, J.; Bevis, M.; Businger, S. Sensing atmospheric water vapor with the global positioning system. Geophys. Res. Lett. 1993, 20, 2631–2634. [Google Scholar] [CrossRef]
- Akilan, A.; Azeez, K.A.; Balaji, S.; Schuh, H.; Srinivas, Y.J.J.o.A.; Physics, S.-T. Gps derived zenith total delay (ztd) observed at tropical locations in south india during atmospheric storms and depressions. J. Atmos. Sol. Terr. Phys. 2015, 125, 1–7. [Google Scholar] [CrossRef]
- Held, I.M.; Soden, B.J. Water Vapor Feedback and Global Warming. Annu. Rev. Energy Environ. 2000, 25, 441–475. [Google Scholar] [CrossRef]
- Wang, J.; Dai, A.; Mears, C. Global water vapor trend from 1988 to 2011 and its diurnal asymmetry based on gps, radiosonde, and microwave satellite measurements. J. Clim. 2016, 29, 5205–5222. [Google Scholar] [CrossRef]
- Wagner, T.; Beirle, S.; Grzegorski, M.; Platt, U. Global trends (1996–2003) of total column precipitable water observed by global ozone monitoring experiment (gome) on ers-2 and their relation to near-surface temperature. J. Geophys. Res. Atmos. 2006, 111, D12. [Google Scholar] [CrossRef]
- Yang, P.; Zhao, Q.; Li, Z.; Yao, W.; Yao, Y. High temporal resolution global pwv dataset of 2005–2016 by using a neural network approach to determine the mean temperature of the atmosphere. Adv. Space Res. 2021, 67, 3087–3097. [Google Scholar] [CrossRef]
- Held, I.M.; Soden, B.J. Robust responses of the hydrological cycle to global warming. J. Clim. 2006, 19, 5686–5699. [Google Scholar] [CrossRef]
- Santer, B.D.; Wigley, T.; Gleckler, P.; Bonfils, C.; Wehner, M.; AchutaRao, K.; Barnett, T.; Boyle, J.; Brüggemann, W.; Fiorino, M. Forced and unforced ocean temperature changes in atlantic and pacific tropical cyclogenesis regions. Proc. Natl. Acad. Sci. USA 2006, 103, 13905–13910. [Google Scholar] [CrossRef]
- Zhang, L.; Wu, L.; Gan, B. Modes and mechanisms of global water vapor variability over the twentieth century. J. Clim. 2013, 26, 5578–5593. [Google Scholar] [CrossRef]
- Trepte, C.R.; Hitchman, M.H. Tropical stratospheric circulation deduced from satellite aerosol data. Nature 1992, 355, 626–628. [Google Scholar] [CrossRef]
- Angell, J.K. Stratospheric warming due to agung, el chichón, and pinatubo taking into account the quasi-biennial oscillation. J. Geophys. Res. 1997, 102, 9479–9485. [Google Scholar] [CrossRef]
- Robock, R. Volcanic eruptions and climate. Rev. Geophys. 2000, 38, 191–219. [Google Scholar] [CrossRef]
- Ramaswamy, V.; Chanin, M.L.; Angell, J.; Barnett, J.; Gaffen, D.; Gelman, M.; Keckhut, P.; Koshelkov, Y.; Labitzke, K.; Lin, J.-J.R.; et al. Stratospheric temperature trends: Observations and model simulations. Rev. Geophys. 2001, 39, 71–122. [Google Scholar] [CrossRef]
- Wang, K.Y.; Lin, S.C.; Lee, L.C. Immediate impact of the mt chaiten eruption on atmosphere from formosat-3/cosmic constellation. Geophys. Res. Lett. 2009, 36. [Google Scholar] [CrossRef]
- Okazaki, I.; Heki, K. Atmospheric temperature changes by volcanic eruptions: Gps radio occultation observations in the 2010 icelandic and 2011 chilean cases. J. Volcanol. Geotherm. Res. 2012, 245, 123–127. [Google Scholar] [CrossRef]
- Blackett, M. London, Special Publications. Review of the utility of infrared remote sensing for detecting and monitoring volcanic activity with the case study of shortwave infrared data for lascar volcano from 2001–2005. Geol. Soc. Lond. Spéc. Publ. 2013, 380, 107–135. [Google Scholar] [CrossRef]
- Blackett, M. An initial comparison of the thermal anomaly detection products of modis and viirs in their observation of indonesian volcanic activity. Remote Sens. Environ. 2015, 171, 75–82. [Google Scholar] [CrossRef]
- Chan, H.-P.; Konstantinou, K.I.; Research, G. Multiscale and multitemporal surface temperature monitoring by satellite thermal infrared imagery at mayon volcano, philippines. J. Volcanol. Geotherm. Res. 2020, 401, 106976. [Google Scholar] [CrossRef]
- Babu, S.R.; Liou, Y.-A.; Research, G. Day-to-day variability of upper troposphere and lower stratosphere temperature in response to taal volcanic eruption inferred from cosmic-2 ro measurements. J. Volcanol. Geotherm. Res. 2022, 421, 107445. [Google Scholar] [CrossRef]
- Huang, L.; Liu, L.; Chen, H.; Jiang, W. An improved atmospheric weighted mean temperature model and its impact on gnss precipitable water vapor estimates for china. GPS Solut. 2019, 23, 51. [Google Scholar] [CrossRef]
- Sun, B.; Zhu, Y.; Wang, H. The recent interdecadal and interannual variation of water vapor transport over eastern china. Adv. Atmos. Sci. 2011, 28, 1039–1048. [Google Scholar] [CrossRef]
- Duan, J.; Li, L.; Ma, Z.; Esper, J.; Büntgen, U.; Xoplaki, E.; Zhang, D.; Wang, L.; Yin, H.; Luterbacher, J. Summer cooling driven by large volcanic eruptions over the tibetan plateau. J. Clim. 2018, 31, 9869–9879. [Google Scholar] [CrossRef]
- Sigl, M.; Winstrup, M.; McConnell, J.R.; Welten, K.C.; Plunkett, G.; Ludlow, F.; Büntgen, U.; Caffee, M.; Chellman, N.; Dahl-Jensen, D. Timing and climate forcing of volcanic eruptions for the past 2500 years. Nature 2015, 523, 543–549. [Google Scholar] [CrossRef]
- Ward, P.L. Sulfur dioxide initiates global climate change in four ways. Thin Solid Film 2009, 517, 3188–3203. [Google Scholar] [CrossRef]
- Jin, L.Y.; Jiao-Lan, F.U.; Chen, F. Spatial and temporal distribution of water vapor and its relationship with precipitation over northwest china. Theor. Appl. Climatol. 2006, 123, 683–691. [Google Scholar]
- Trigo, R.M.; Valente, M.A.; Trigo, I.F.; Miranda, P.; Sciences, R. The impact of north atlantic wind and cyclone trends on european precipitation and significant wave height in the atlantic. Ann. N. Y. Acad. Sci. 2009, 1146, 212–234. [Google Scholar] [CrossRef] [PubMed]
- Guan, X.; Yang, L.; Zhang, Y.; Li, J.J.G.; Change, P. Spatial distribution, temporal variation, and transport characteristics of atmospheric water vapor over central asia and the arid region of china. Glob. Planet. Chang. 2019, 172, 159–178. [Google Scholar] [CrossRef]
- Jain, S.; Kar, S.J.; Physics, S.-T. Transport of water vapour over the tibetan plateau as inferred from the model simulations. J. Atmos. Sol. Terr. Phys. 2017, 161, 64–75. [Google Scholar] [CrossRef]
- Maltagliati, L.; Titov, D.V.; Encrenaz, T.; Melchiorri, R.; Forget, F.; Garcia-Comas, M.; Keller, H.U.; Langevin, Y.; Bibring, J.P. Observations of atmospheric water vapor above the tharsis volcanoes on mars with the omega/mex imaging spectrometer. Icarus 2008, 194, 53–64. [Google Scholar] [CrossRef]
- Guha, A.J.A. Transport of water vapor from tropical cyclones to the upper troposphere. Atmosphere 2021, 12, 1506. [Google Scholar]
- Chengzhi, Y.E.; Yun-Ying, L.I.; Zu-Xian, L.I. Numerical study on the water vapor transports of the two landfalling cyclones affecting hunan province. Plateau Meteorol. 2009, 28, 98–107. [Google Scholar]
- Gushchina, D.Y.; Arakelyan, T.G.; Petrosyants, M.A. The relation between circulation intensity in the temperate latitude cyclone and air temperature and precipitation anomalies. Russ. Meteorol. Hydrol. 2008, 33, 681–691. [Google Scholar] [CrossRef]
- Wei, W.U.; Chen, J.L. Sensitivity of tropical cyclone precipitation to atmospheric moisture content: Case study of bilis (2006). Atmos. Ocean. Sci. Lett. 2012, 5, 420–425. [Google Scholar] [CrossRef]
- Pfahl, S.; Wernli, H. Quantifying the relevance of cyclones for precipitation extremes. J. Clim. 2012, 25, 6770–6780. [Google Scholar] [CrossRef]
- Hawcroft, M.; Shaffrey, L.; Hodges, K.; Dacre, H.J. How much northern hemisphere precipitation is associated with extratropical cyclones? Geophys. Res. Lett. 2012, 39, 24809. [Google Scholar] [CrossRef]
- Catto, J.L.; Pfahl, S. The importance of fronts for extreme precipitation. J. Geophys. Res. Atmos. 2013, 118, 10791–10801. [Google Scholar] [CrossRef]
- Lien, T.-Y.; Yeh, T.-K.; Hong, J.-S.; Hsiao, T.-Y. Variations in gps precipitable water vapor and rainfall during the 2006–2019 mei-yu season in taiwan. Adv. Space Res. 2022, 70, 1375–1387. [Google Scholar] [CrossRef]
- Zhou, L.; Fan, L.; Zhang, W.; Shi, C. Long-term correlation analysis between monthly precipitable water vapor and precipitation using gps data over china. Adv. Space Res. 2022, 70, 56–69. [Google Scholar] [CrossRef]
Figure 1.
(a) Tonga location distribution, the red triangle is the HTHH volcano. (b) Distribution of 11 IGS sites in Tonga region. (c) Global distribution of 237 IGS sites; the blue triangle is the location of the HTHH volcano, and the red circles are the locations of IGS sites. The black box is the range of (b) graph.

Figure 2.
Global PWV anomaly distribution from 0:00 to 22:00 (UTC) on 15 January 2022. Blue is the PWV anomaly reduction area. Red is the PWV anomaly increase area. Red box indicates Tonga region.
Figure 2.
Global PWV anomaly distribution from 0:00 to 22:00 (UTC) on 15 January 2022. Blue is the PWV anomaly reduction area. Red is the PWV anomaly increase area. Red box indicates Tonga region.

Figure 3.
Distribution of water vapor anomalies from 1 January 2022 to 24 January 2022; blue is the area of PWV anomaly decrease, and red is the area of PWV anomaly increase. Black triangle is Tonga’s position.
Figure 3.
Distribution of water vapor anomalies from 1 January 2022 to 24 January 2022; blue is the area of PWV anomaly decrease, and red is the area of PWV anomaly increase. Black triangle is Tonga’s position.

Figure 4.
Water vapor differences at regional stations in Tonga for January and February 2022; red is positive, green is negative and colorless locations indicate missing data for that day. The red box is the HTHH volcano eruption time. The red box indicates the time period from 13 January to 16 January, when the Tonga volcano erupted.

Figure 5.
The 850 hPa (b,d,f,h) and 500 hPa (a,c,e,g) temperature fields (color shaded areas, unit: °C) and wind fields (arrows, unit: m·s−1) for January 2022. All red boxes indicate low pressure centers south of Tonga, and all green boxes indicate low pressure centers east of Tonga. The red and green boxes indicate changes in the two low pressure centers.

Figure 6.
The 850 hPa (b,d,f,h) and 500hPa (a,c,e,g) temperature anomaly fields (color shaded areas, unit: °C) and wind anomaly fields (arrows, unit: m·s−1) for January 2022. Climate state is from 1981 to January 2010 data. The red box indicates the low pressure center on the south side of Tonga. The green box indicates the low pressure center on the east side of Tonga.

Figure 7.
Surface temperature map for Tonga, April 2019–April 2022. The black line depicts the volcano’s outline before it erupted on 15 January 2022. P1, P2, P3, and P4 are the feature points.
Figure 7.
Surface temperature map for Tonga, April 2019–April 2022. The black line depicts the volcano’s outline before it erupted on 15 January 2022. P1, P2, P3, and P4 are the feature points.

Figure 8.
Time series curve of temperature at four characteristic points in Tonga, April 2019–April 2022. The dotted line indicates missing data for the month.
Figure 8.
Time series curve of temperature at four characteristic points in Tonga, April 2019–April 2022. The dotted line indicates missing data for the month.

Figure 9.
The 850 hPa water vapor flux divergence (color shaded areas, unit: g·cm−2·h·Pa−1·s−1) and 850 hPa water vapor flux (arrows, Unit: g·cm−1·hPa−1·s−1) from 14 to 17 January 2022 at 23:00 (UT). The red and green boxes indicate the main areas of water vapor flux concentration. All red and green boxes indicate variations in the same water vapor flux concentration area.

Figure 10.
The 850 hPa water vapor flux divergence anomaly fields (color shaded areas, unit: g·cm−2·h·Pa−1·s−1) and 850 hPa water vapor flux (arrows, unit: g·cm−1·hPa−1·s−1) anomaly fields from 14 to 17 January 2022 at 23:00 (UT). Red boxes and green boxes indicate areas of abnormal water vapor flux. All red and green boxes indicate variations in the same water vapor flux concentration area.

Figure 11.
Precipitation distribution maps for January (a–f) and February (g–l) for Tonga region from 2017 to 2022 (color shaded areas, unit: mm); red triangles are HTHH volcano locations. Dashed boxes indicate precipitation in January (a–f) and February (g–l) of previous years, and solid boxes indicate precipitation in January (a–f) and February (g–l) of 2022.

Figure 12.
Distribution of precipitation anomalies for January (a) and February (b) 2022 in Tonga color shaded areas, unit: mm), with areas of increased rainfall in red and decreased rainfall in blue.
Figure 12.
Distribution of precipitation anomalies for January (a) and February (b) 2022 in Tonga color shaded areas, unit: mm), with areas of increased rainfall in red and decreased rainfall in blue.

Disclaimer/Publisher’s Note: The statements, opinions and data contained in all publications are solely those of the individual author(s) and contributor(s) and not of MDPI and/or the editor(s). MDPI and/or the editor(s) disclaim responsibility for any injury to people or property resulting from any ideas, methods, instructions or products referred to in the content. |
© 2023 by the authors. Licensee MDPI, Basel, Switzerland. This article is an open access article distributed under the terms and conditions of the Creative Commons Attribution (CC BY) license (https://creativecommons.org/licenses/by/4.0/).
Share and Cite
MDPI and ACS Style
Ke, F.; Hu, X.; Hong, G.; Ming, L.; Song, B. Characteristics and Evolution of the Response of the Lower Atmosphere to the Tonga Volcanic Eruption. Appl. Sci. 2023, 13, 10095. https://doi.org/10.3390/app131810095
AMA Style
Ke F, Hu X, Hong G, Ming L, Song B. Characteristics and Evolution of the Response of the Lower Atmosphere to the Tonga Volcanic Eruption. Applied Sciences. 2023; 13(18):10095. https://doi.org/10.3390/app131810095
Chicago/Turabian StyleKe, Fuyang, Xiangxiang Hu, Guan Hong, Lulu Ming, and Bao Song. 2023. "Characteristics and Evolution of the Response of the Lower Atmosphere to the Tonga Volcanic Eruption" Applied Sciences 13, no. 18: 10095. https://doi.org/10.3390/app131810095
Note that from the first issue of 2016, this journal uses article numbers instead of page numbers. See further details here.