
Noise-Assessment-Based Screening Method for Remote Photoplethysmography Estimation
by
 ,
,
Kunyoung Lee
1,†,
Seunghyun Kim
2,†,
Byeongseon An
2,
Hyunsoo Seo
2,
Shinwi Park
2 and
Eui Chul Lee
3,* 1
Department of Computer Science, Graduate School, Sangmyung University, Seoul 03016, Republic of Korea
2
Department of AI & Informatics, Graduate School, Sangmyung University, Seoul 03016, Republic of Korea
3
Department of Human-Centered Artificial Intelligence, Graduate School, Sangmyung University, Seoul 03016, Republic of Korea
*
Author to whom correspondence should be addressed.
†
These authors contributed equally to this work.
Appl. Sci. 2023, 13(17), 9818; https://doi.org/10.3390/app13179818
Submission received: 1 August 2023
/
Revised: 25 August 2023
/
Accepted: 28 August 2023
/
Published: 30 August 2023
(This article belongs to the Special Issue Advances in Image and Video Processing: Techniques and Applications)
Abstract
:Remote vital signal estimation has been researched for several years. There are numerous studies on rPPG, which utilizes cameras to detect cardiovascular activity. Most of the research has concentrated on obtaining rPPG from a complete video. However, excessive movement or changes in lighting can cause noise, and it will inevitably lead to a reduction in the quality of the obtained signal. Moreover, since rPPG measures minor changes that occur in the blood flow of an image due to variations in heart rate, it becomes challenging to capture in a noisy image, as the impact of noise is larger than the change caused by the heart rate. Using such segments in a video can cause a decrease in overall performance, but it can only be remedied through data pre-processing. In this study, we propose a screening technique that removes excessively noisy video segments as input and only uses signals obtained from reliable segments. Using this method, we were able to boost the performance of the current rPPG algorithm from 50.43% to 62.27% based on PTE6. Our screening technique can be easily applied to any existing rPPG prediction model and it can improve the reliability of the output in all cases.
1. Introduction
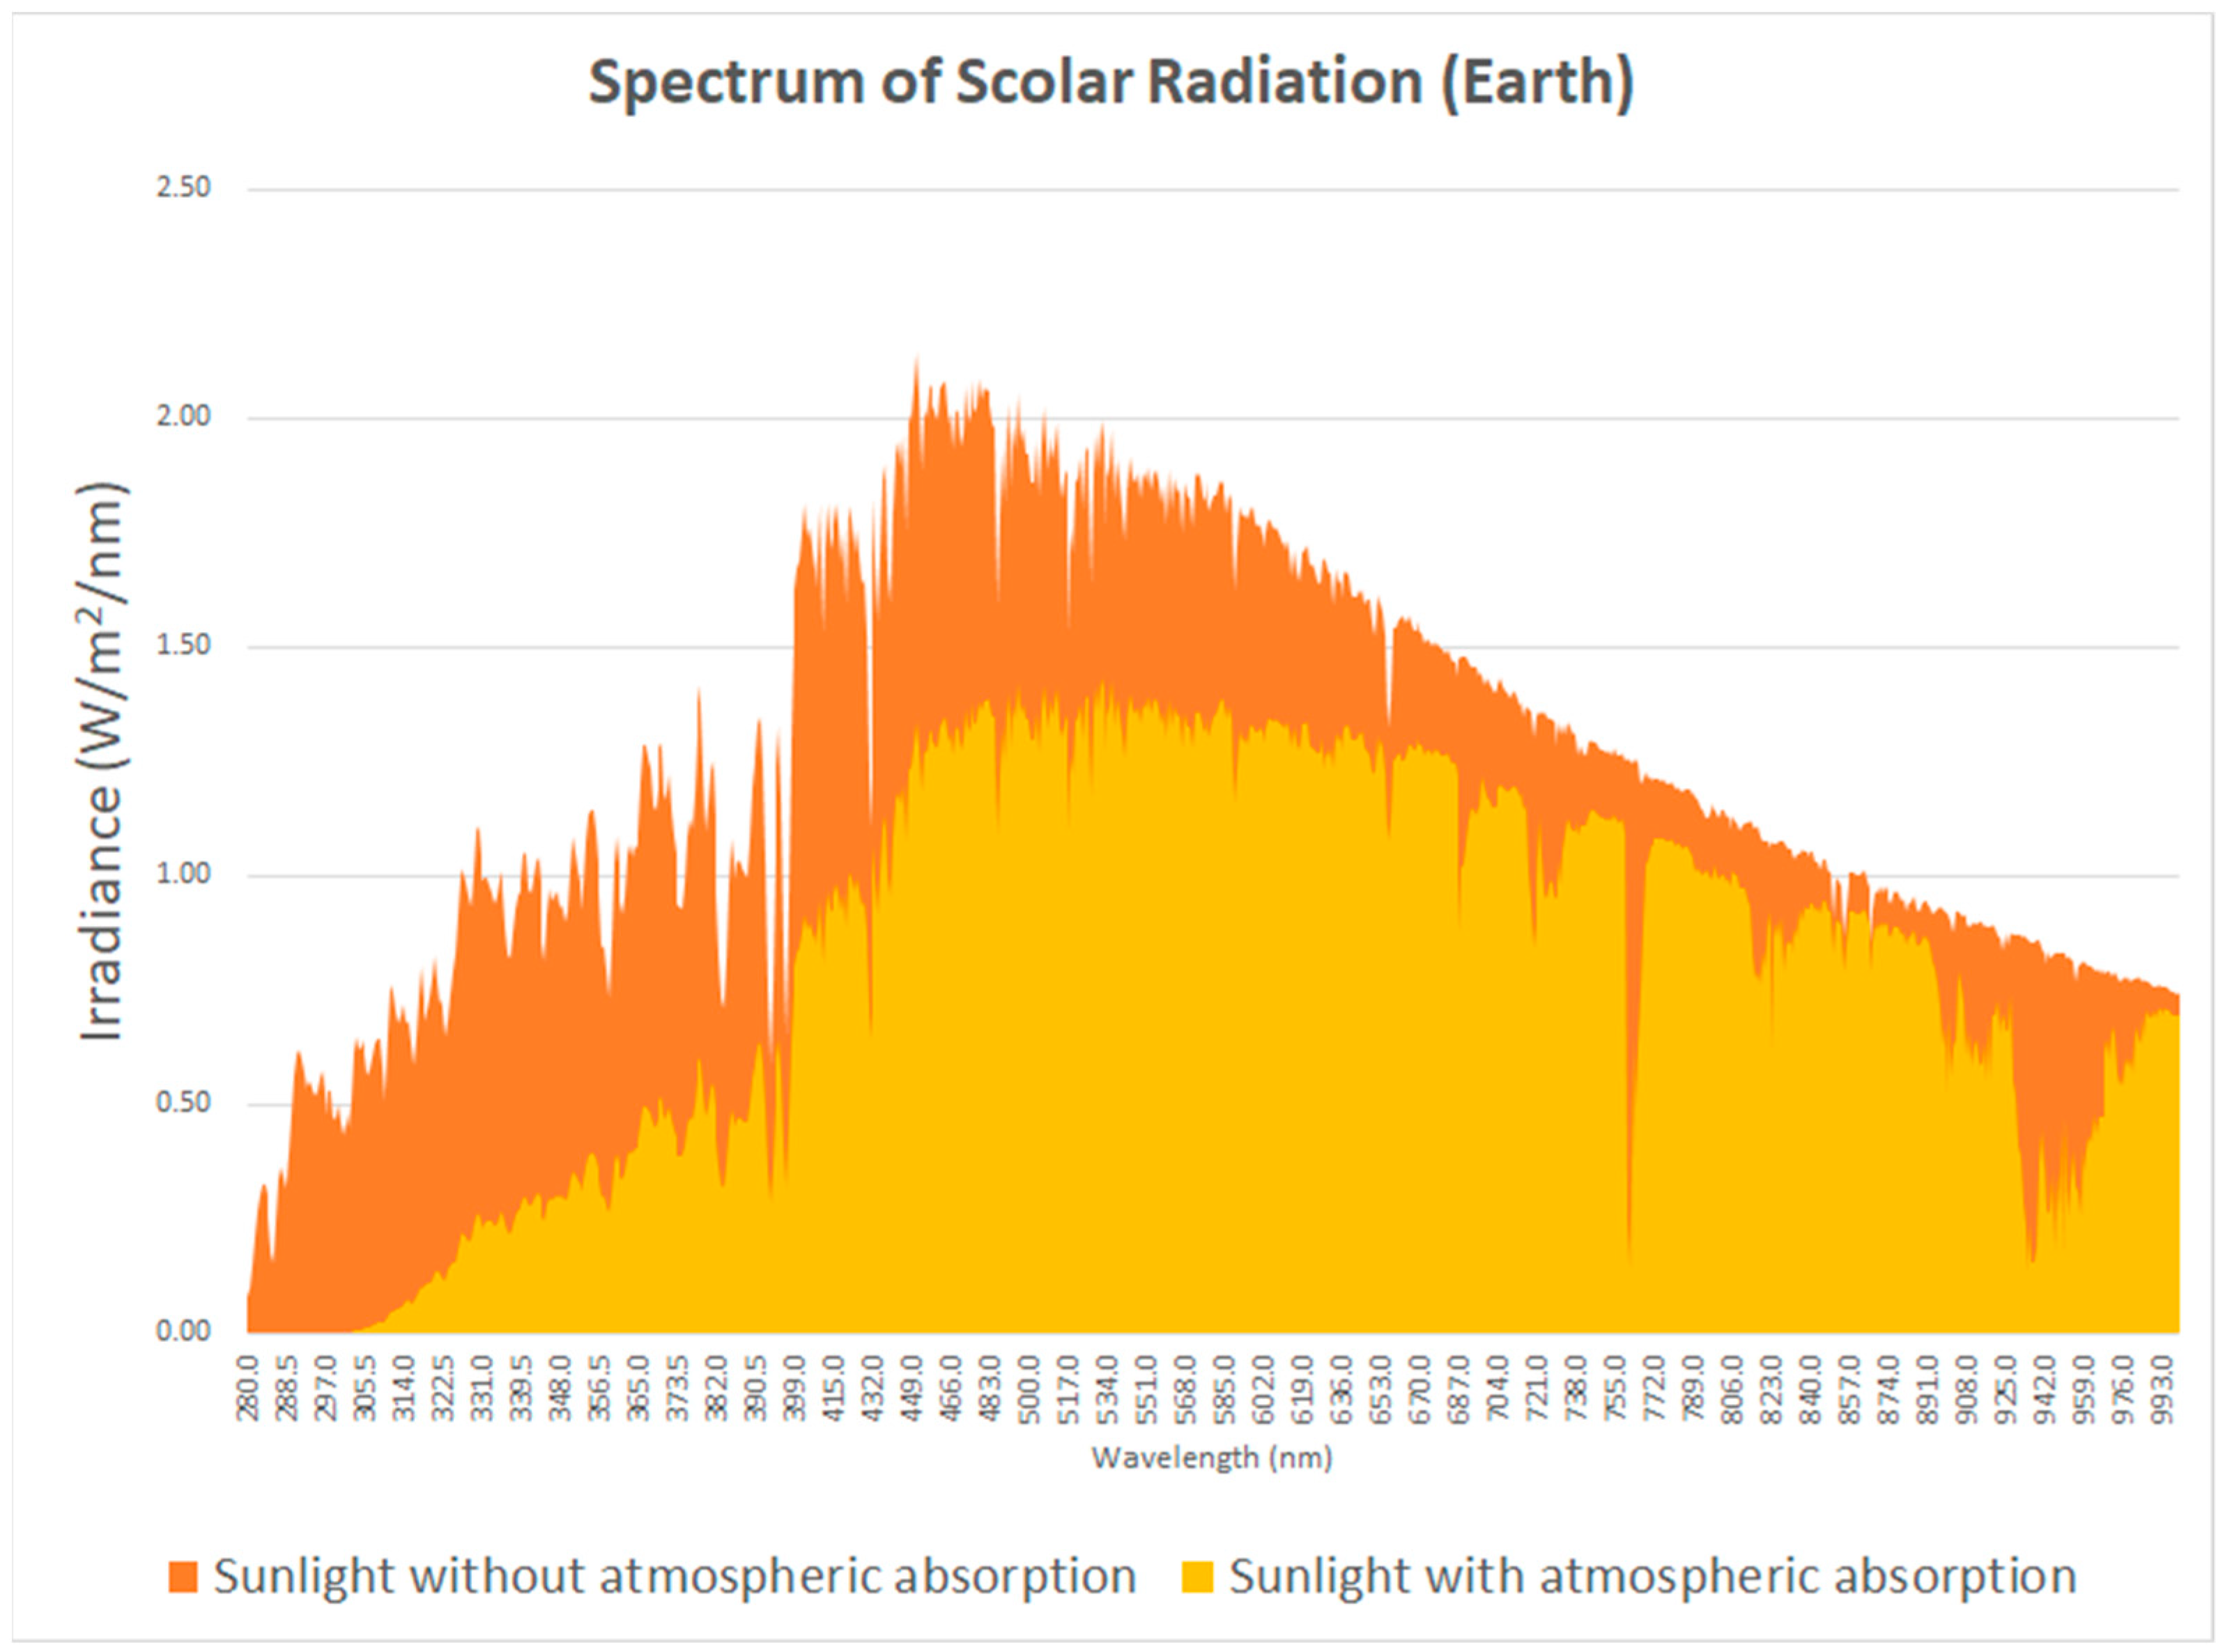
The method of attaching a contact photoplethysmography (PPG) sensor to a subject causes discomfort to the wearer. Remote photoplethysmography (rPPG) studies have been conducted to address the inconvenience of contact-type PPG devices. Heart rate measurement serves as a crucial technology for not only monitoring health conditions but also for other applications such as emotion recognition based on heart rate variability (HRV) indicators and driving monitoring, encompassing factors like concentration and drowsiness [1,2]. However, remote photoplethysmography (rPPG) techniques possess optical limitations, rendering them more vulnerable to the influence of multiple sources of noise, such as user movements or fluctuations in lighting conditions, in comparison to contact-based measurement methods. This susceptibility can be attributed to the fact that rPPG relies on pixel signals captured by camera sensors, which encompass not only subtle alterations in skin color induced by cardiac activity but also various forms of noise, including object movements and changes in illumination. Much related work has been undertaken to identify and isolate the pulse signal’s cycle or waveform from the pixel signal, which comprises a complex amalgamation of the pulse signal itself, motion-induced noise, and instabilities in illumination [3]. However, despite a lot of efforts to mitigate noise and enhance the accuracy of remote sensing pulse signal measurements, methods based on remote photoplethysmography (rPPG) still exhibit limitations that render them susceptible to motion and illumination noise. This vulnerability arises due to the propensity for skin color changes resulting from cardiac activity to be easily contaminated by noise on a significantly larger scale [4]. Particularly in driving environments, remote heart rate measurements frequently contend with variations in external lighting conditions, encompassing factors such as solar light (both during daytime and night-time), traffic lights, and headlights. To address these challenges, related works within vehicular settings have explored the application of infrared cameras as an alternative to RGB cameras. Figure 1 illustrates the intensity of light across different wavelength bands, corresponding to various light sources. Notably, within the 940 nm wavelength band, the influence of sunlight diminishes considerably compared to other bands, owing to the impact of H2O in the atmosphere [5]. Consequently, by implementing bandpass filtering within the 940 nm wavelength band, the adverse effects of sunlight can be substantially mitigated, thereby alleviating noise caused by this specific light source. However, it is important to acknowledge that an infrared camera operating at a wavelength of 940 nm remains susceptible to the subject’s motion as well as other light sources emitting light within the same wavelength range.
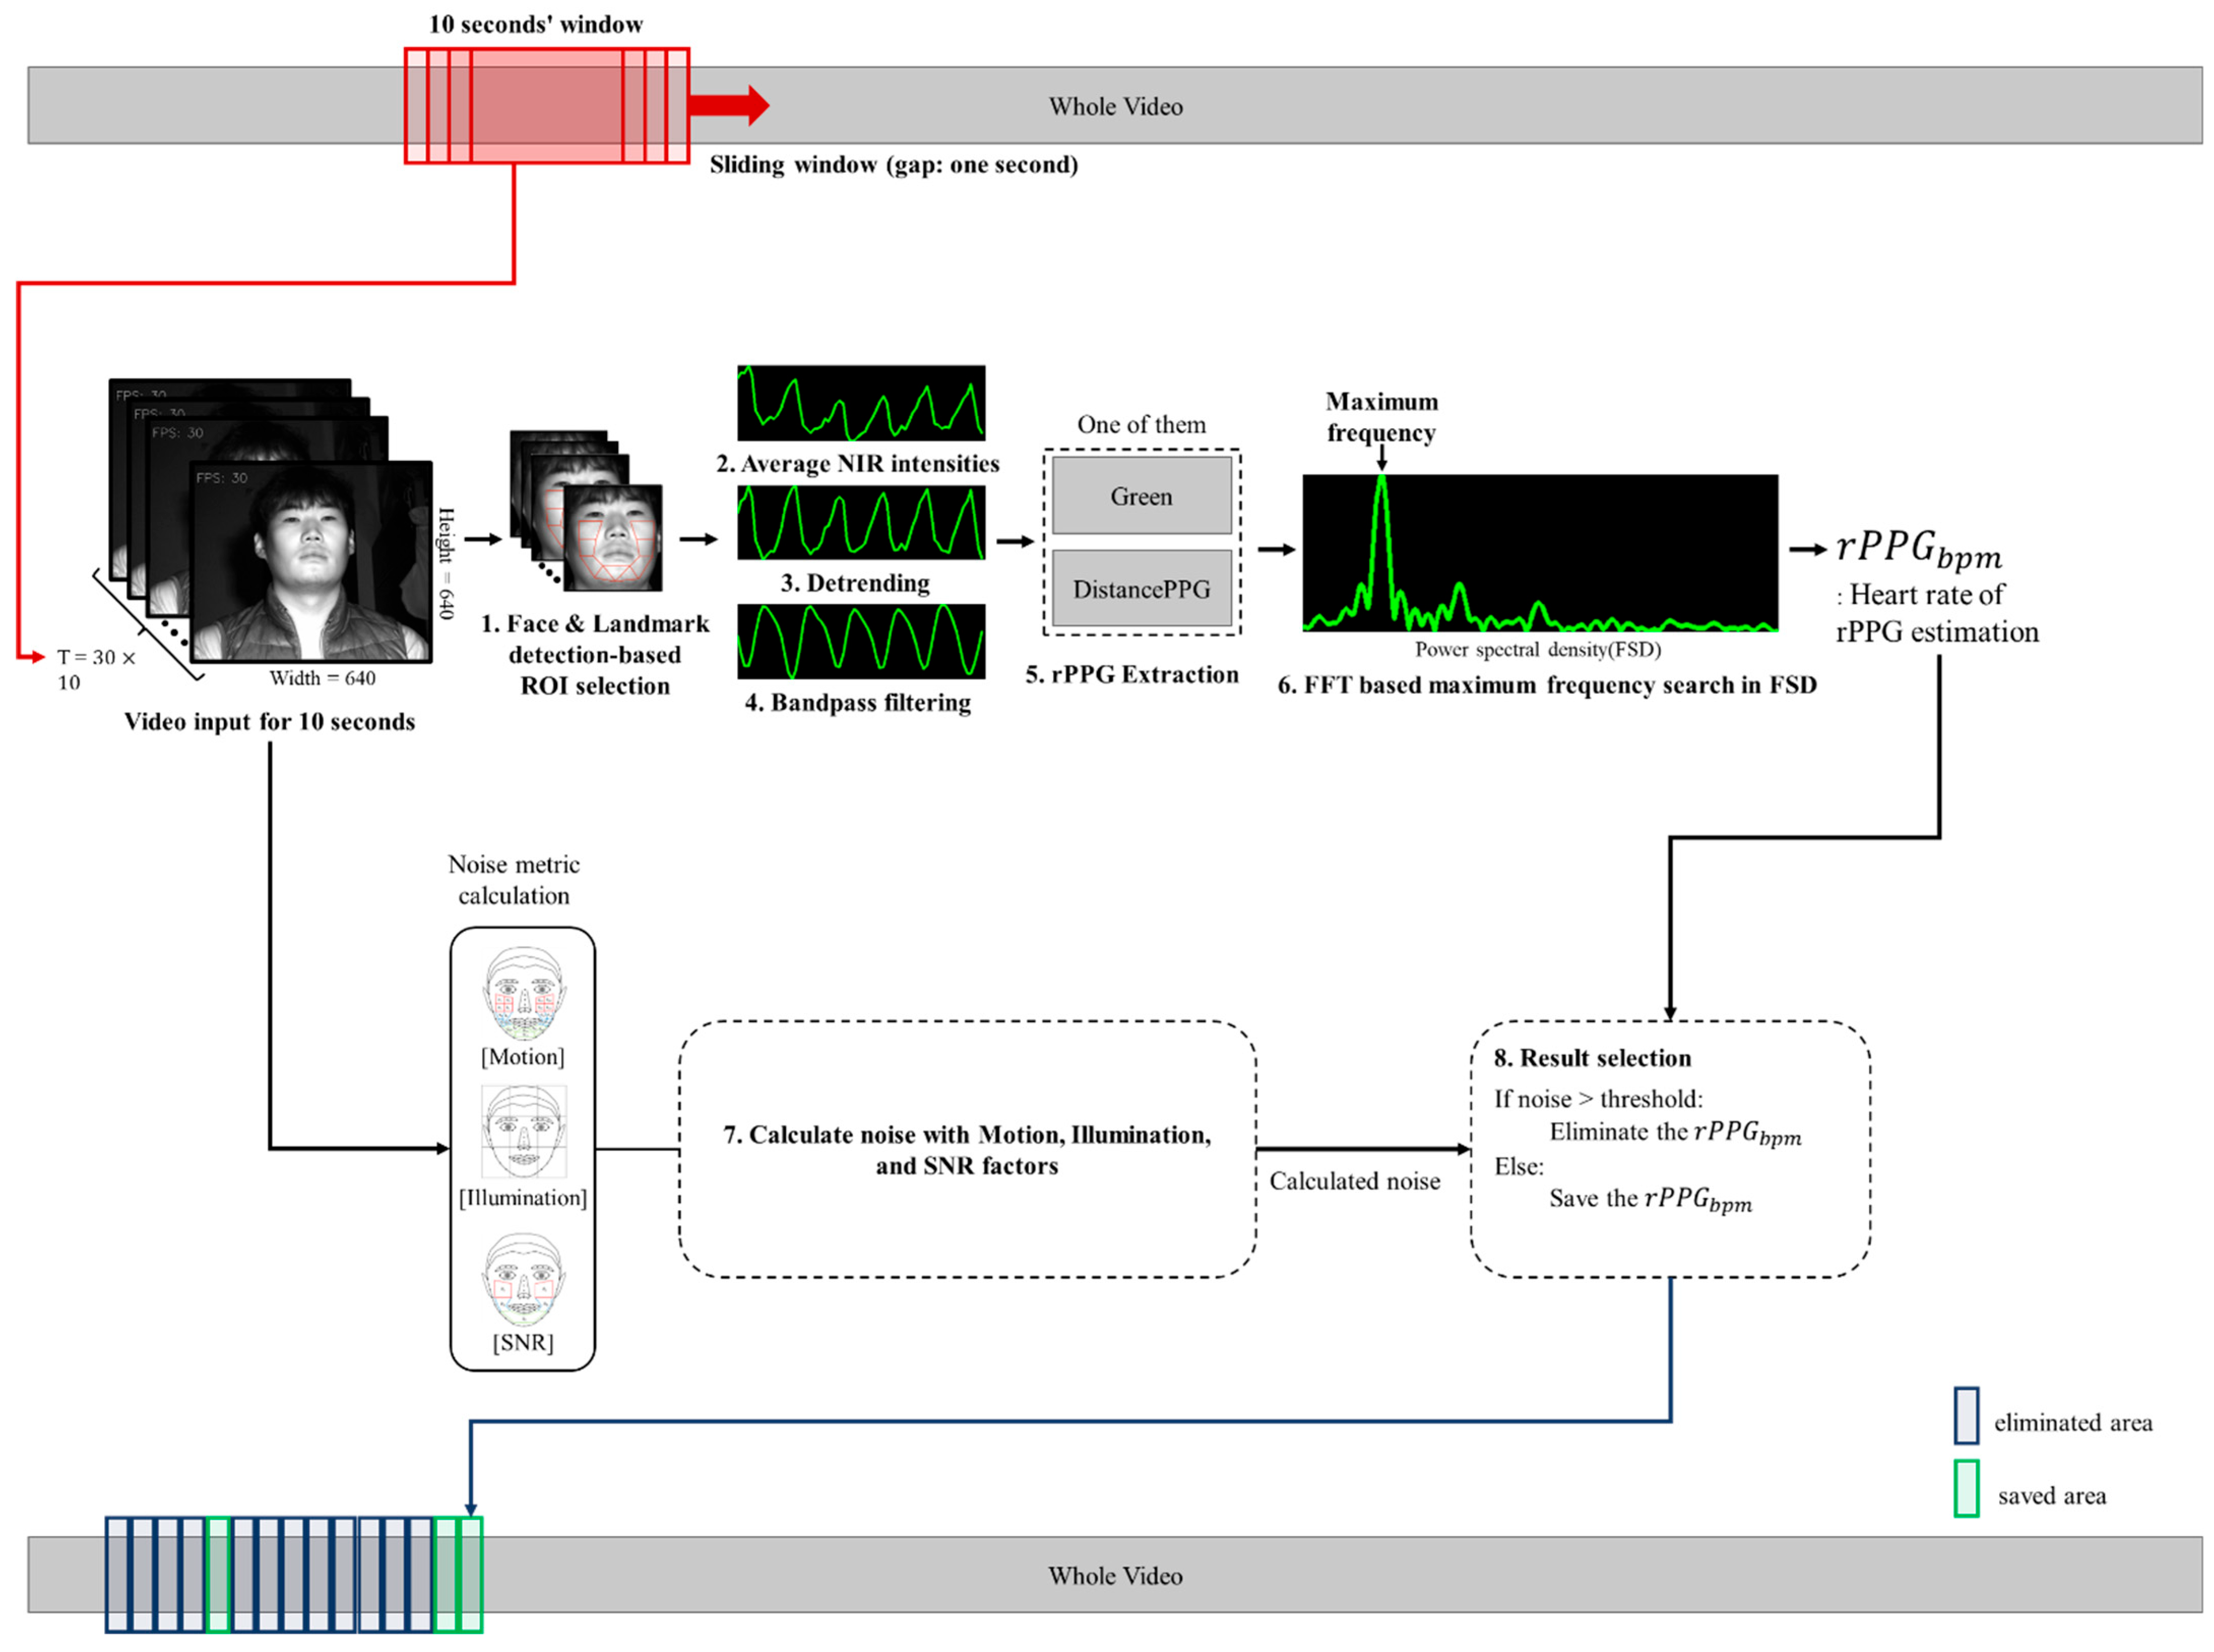
In this paper, we present a novel rPPG screening method that facilitates remote photoplethysmography (rPPG) measurements within complex environments, especially for driving situations, without the need for additional attachment equipment. Our proposed method works within an infrared-camera-based measurement environment that can detect light within the 940 nm wavelength band. The proposed method introduces a noise-assessment-based pulse signal screening algorithm aimed at enhancing the accuracy of remote heart rate measurement. This algorithm defines metrics for noise assessment, including motion noise, illumination noise, and signal-to-noise ratio (SNR) indicators of the heart rate signal. By evaluating video clips that are susceptible to errors in pulse signal measurement, the algorithm selects high-quality clips for pulse signal extraction based on noise assessment. Figure 2 below depicts the overall flow of this research.
Existing studies have primarily focused on steps 2 through 6 from Figure 2, which are the parts of the process that remove noise or extract signal from the image itself. In contrast, our pulse signal screening approach assesses the reliability of each pulse signal by leveraging noise assessment indicators. This method can be applied not only to algorithm-based remote photoplethysmography (rPPG) techniques such as CHROM [6], POS [7], and OMIT [8], but also to deep learning approaches like PULSEGAN [9] and Physnet [10]. Through experimental evaluations, we have verified that the proposed method demonstrates improvements even when applied to rPPG based on RGB cameras, in addition to its applicability to NIR measurements, yielding 100% accuracy. Therefore, we propose a pulse signal screening method based on noise assessment in the NIR environment, which effectively enhances the accuracy of rPPG-based heart rate measurements.
Therefore, we can summarize the contribution points of our research as follows. First, this is the first study to determine and screen the confidence interval (time sequence) of the extracted rPPG signal to obtain higher accuracy. The method proposed in this study quantifies the target person’s movement or excessive light changes, which can be easily acquired from the video itself. Therefore, it can be widely and easily applied to various studies to extract rPPG. Second, we used infrared cameras, which are more robust to sunlight changes than RGB cameras. In addition, the self-collected data used in our experiments were obtained from equipment that is reasonably priced compared to existing studies. We have shown in our experiments that the data have an acceptable level of accuracy. Finally, we have shown through discussion that high accuracy was indeed obtained in the selected intervals.
2. Related Work
2.1. Single Channel rPPG Method
Green [11] demonstrated the feasibility of conducting remote photoplethysmography (rPPG) measurements using a consumer-level webcam. They observed that the green bandwidth of visible light exhibits the highest number of heart rate signals due to the significant absorption of light by hemoglobin in the green bandwidth. To extract a pulse signal from the time series data, they continuously recorded the average pixel value of a region of interest (ROI) corresponding to the skin pixels. The findings of this investigation validate the applicability of remote photoplethysmography in medical and sports domains. Moreover, they established that remote sensing using a monochrome camera is viable not only in the visible light spectrum but also in the infrared wavelength bands [11].
DistancePPG [12] is a camera-based algorithm designed for non-contact estimation of vital signs by extracting photoplethysmography (PPG) signals using readily available cameras. The algorithm specifically focuses on utilizing the green channel within the RGB channels to capture skin color variations across different regions of the face. This is achieved by employing a weighted average approach, where the weights are determined based on the blood flow dynamics and the impact of light on specific facial regions. To calculate the weights for the time series signals obtained from multiple regions of interest (ROIs), a quality assessment of the pulse signals was performed [12].
2.2. Multi Channel rPPG Method
CHROM [6] is a chrominance-based method that primarily focuses on extracting diffuse reflection associated with pulsation while eliminating specular reflection, which does not contain pulsatile signals. By utilizing a linear combination within the RGB domain, a chrominance space is defined where specular reflections are effectively suppressed. This method is commonly classified as a model-based approach, as it leverages the optical properties of remote photoplethysmography (rPPG). Among the algorithm-based approaches, CHROM demonstrates state-of-the-art (SOTA) performance and has been employed in the experiments conducted for this study. The effectiveness of the proposed method in enhancing performance has been verified [6].
POS [7] introduced a motion-noise robust method based on the chrominance-based approach. The proposed method by POS effectively eliminates noise components and extracts the pulse signal by employing a projection plane orthogonal to the skin tone. Similar to CHROM, POS is considered a model-based method that demonstrates state-of-the-art (SOTA) performance among the proposed techniques. Through experimental validation using our proposed approach, significant performance enhancement has been confirmed [7].
The 3DCNN [13] method employs deep learning techniques. This approach utilizes a three-dimensional input structure, where image data from each frame are treated as two-dimensional input, and the 3D data are constructed along the temporal axis of the video. To facilitate training and testing, the OBF dataset [14] and the MAHNOB-HCI dataset [15], both comprising RGB images, are employed. However, this study also identified several challenges inherent in deep learning models. These challenges encompass the requirement for a substantial amount of training data, difficulties in utilizing 3DCNN within embedded environments, and the model’s dependency on the specific training dataset, which hampers its generalization to different datasets. Addressing these limitations in future investigations is crucial to enhancing the applicability and effectiveness of the 3DCNN method [13].
2.3. rPPG Extraction with Screening Method
In the context of infrared-environment-acquired rPPG signals, a noise-resistant heart rate estimation was conducted by assessing signal quality. To evaluate the quality of the signal, frequency domain analysis was employed, accompanied by the incorporation of hand-crafted features. Specifically, three features were defined. Firstly, the signal-to-noise ratio (SNR) was computed by dividing the power of the maximum value in the power spectral density (PSD) and its two first harmonics by the remaining power. Secondly, bandwidth (BW) was determined as the range encompassing 99% of the power, centered around the maximum value of the PSD. Lastly, ratio peaks (RP) represented the ratio between the power of the highest peak in the PSD and the power of the second highest peak. By utilizing these characteristics, the performance was compared to the classic rPPG algorithm using the mean absolute error (MAE) metric. Furthermore, different video segments were evaluated using the same quality algorithm to compare performance. While the proposed quality-based rPPG method exhibited improved performance compared to the classic rPPG algorithm, it demonstrated relatively poor performance in cases where the video segments were longer [16].
As shown in Table 1, previous studies mainly extracted rPPG signals through ROI detection, chrominance-based methods, or deep learning techniques. However, there are limitations in extracting signals from NIR environments using DistancePPG, CHROM, POS, and 3D CNN approaches. Moreover, previous studies except for Hernandez-Ortega, J. et al. [16], did not incorporate rPPG screening methods. The proposed method in this study enables rPPG signal extraction in NIR environments and allows for more robust pulse signal extraction through a noise-assessment-based rPPG screening method. Additionally, unlike Hernandez-Ortega, J. et al. [16], our method utilizes motion, illumination, and pulse signal quality as noise assessment indicators. The proposed method enhances the accuracy of the first-step rPPG extraction result through the second-step screening method, and can be applied to all existing rPPG extraction methods. To confirm this, we checked the screening results using Green, DistancePPG, which is applicable to the NIR environment. As can be seen in the result section, the application of the screening method confirmed performance improvements in the two rPPG methods.
3. Method
In this study, we propose a method for extracting robust pulse signals in NIR environments through noise-assessment-based rPPG screening. Our approach leverages motion, illumination, and pulse signal quality as indicators to evaluate the presence of noise, thereby enhancing the performance of pulse signal extraction compared to existing methods. Notably, our method offers the advantage of minimal computational requirements, making it suitable for real-time applications. Moreover, the rPPG screening technique can be seamlessly integrated with various existing methods, enabling performance improvements and adaptability to diverse scenarios. Overall, this research contributes to the advancement of efficient and effective heart rate extraction methods in infrared environments, with potential applications in healthcare and other relevant fields.
3.1. Dataset
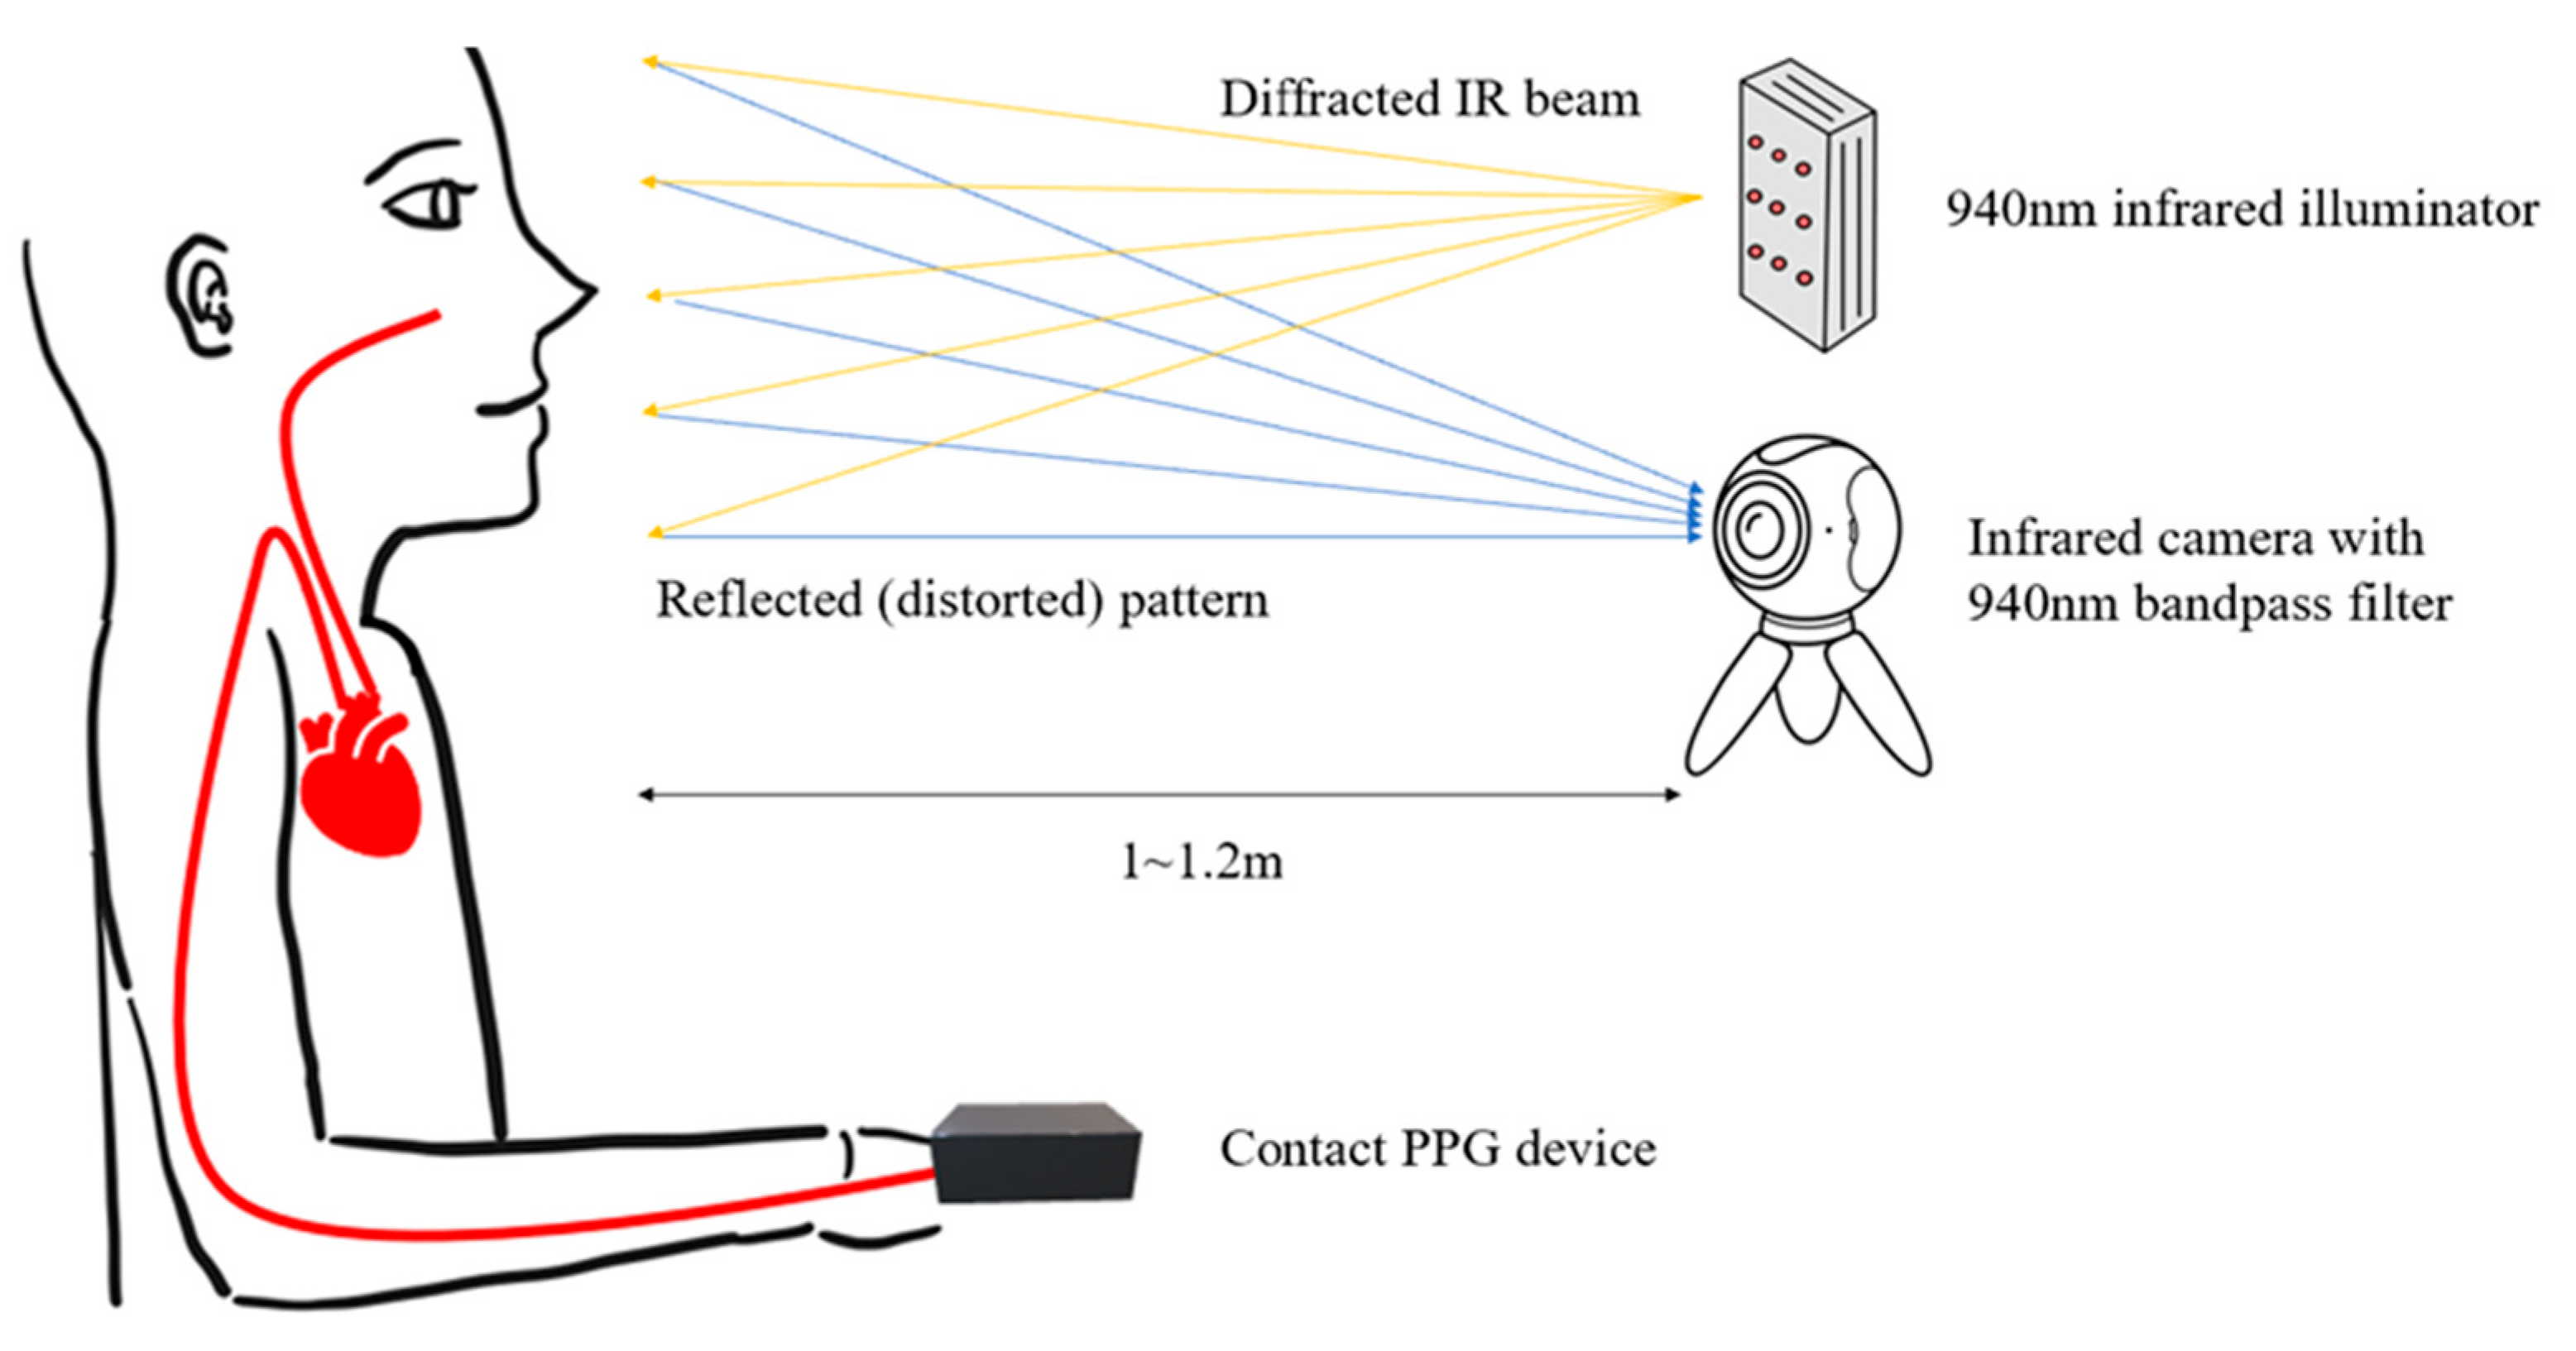
In the present study, data were collected from Sangmyung University, replicating the conditions of an established open dataset. Twenty participants were included, comprising nine males and eleven females, engaged in four distinct scenarios, with each scenario lasting for two minutes. During these scenarios, participants were instructed to execute the following tasks: maintain a steady gaze, speak while maintaining a steady gaze, rotate their faces at varying angles without speaking, and rotate their faces at varying angles while speaking. As depicted in Figure 3, infrared cameras equipped with a 940 nm bandpass filter and infrared illuminator were utilized for data collection. Moreover, ground truth signals were obtained by leveraging a contact photoplethysmography (PPG) device. Among the acquired dataset, two subjects exhibited light skin values, leading to significant saturation. Consequently, the data from these two subjects were excluded, resulting in a dataset containing information from 18 individuals. The final dataset, consisting of 72 cases, was employed for both training and testing purposes. Details of camera equipment and experimental setup of the dataset are shown in Table 2.

Table 2.
Dataset specification.
| Camera (Image Sensor) | CM3-U3-13Y3M-CS (On Semi PYTHON 1300; Teledyne FLIR, Wilsonville, OR, USA) [19] |
|---|---|
| Infrared illuminator | EI-100 (irradiation angle: 70°, DC 12 V 0.8 A 10 W; Nikon Instruments, Tokyo, Japan) |
| Contact PPG sensor | Ubpulse 360 (LAXTHA, Daejeon, Republic of Korea) [20] |
| Image resolution/fps | 640 × 512/30 fps |
| Experiment setup | Wild environment (head movements, facial expressions, and conversations allowed) |
| Illumination setup | Indoor environment with infrared illuminator |
| Number of subjects | 18 subjects (male: 9, female: 9) |
| Recording time | Total 144 min (72 samples, 2 min per sample) |
Figure 3.
Example of the data acquisition setup employed for collecting the dataset in the present study.
Figure 3.
Example of the data acquisition setup employed for collecting the dataset in the present study.

3.2. Noise-Assessment-Based Screening Method
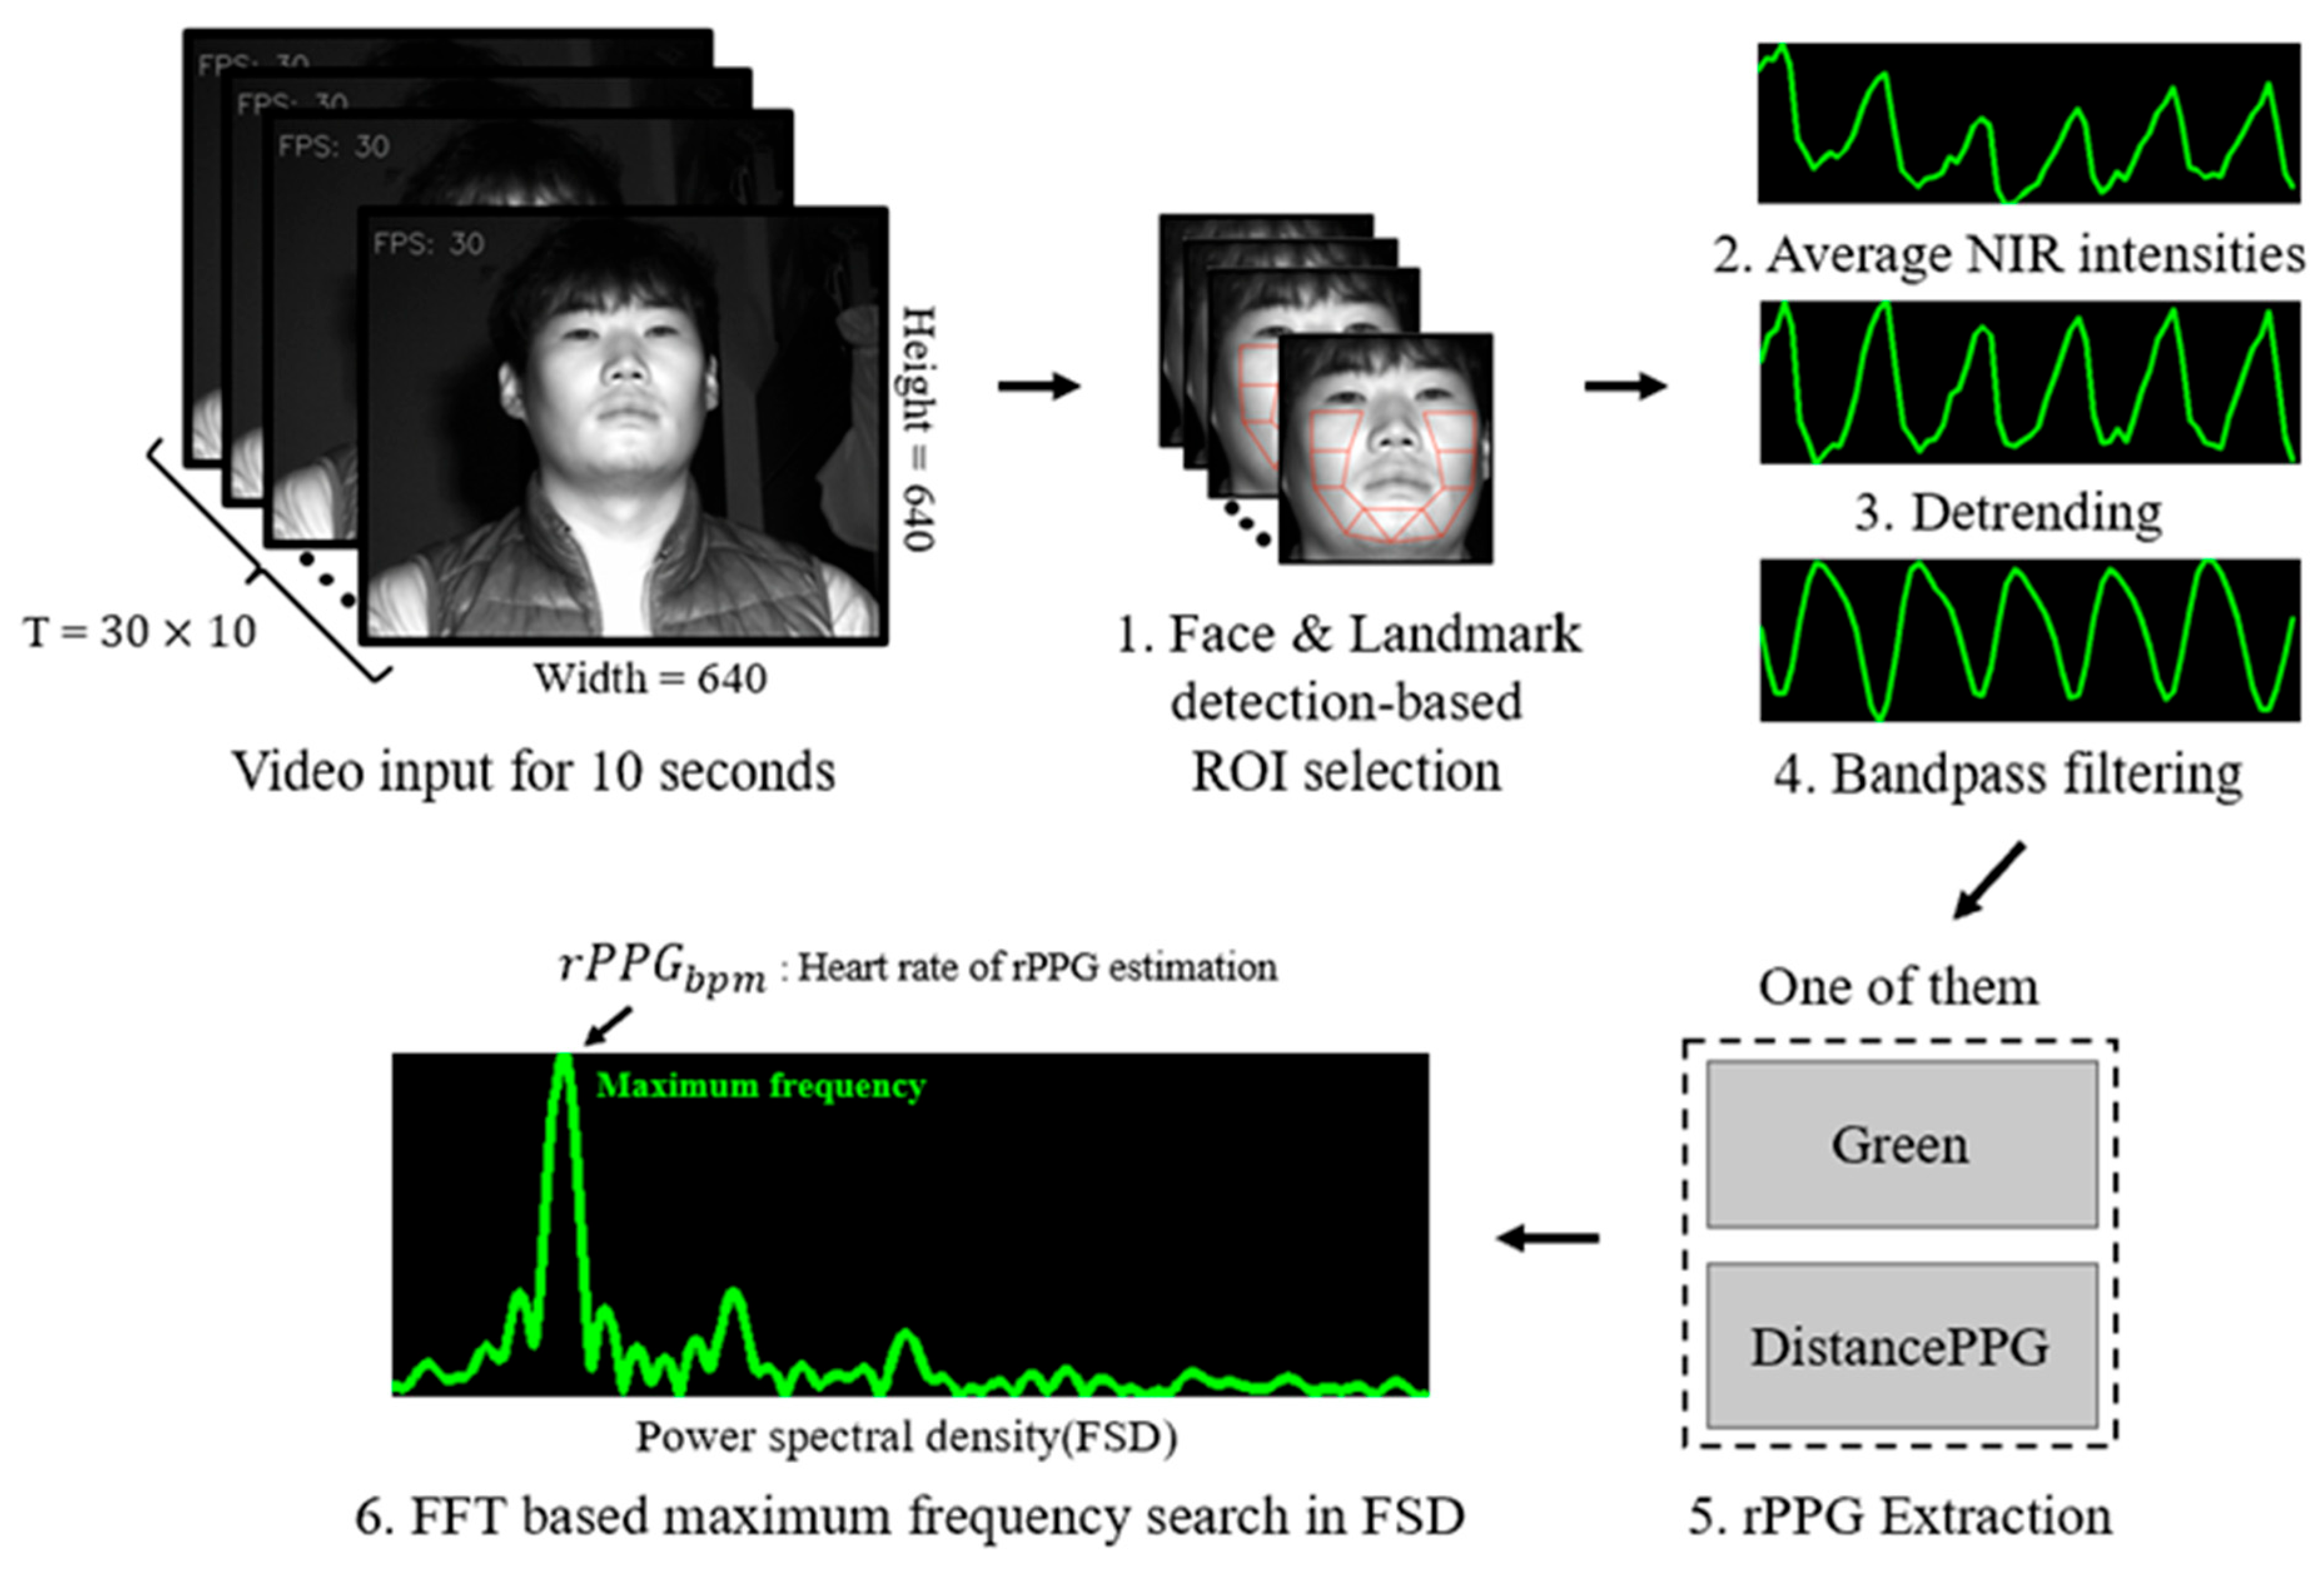
Figure 4 presents the overall process of acquiring rPPG in an infrared environment. Initially, a 10 s video with a frame rate of 30 fps is utilized as the input. Subsequently, facial regions in the video are detected, and the region of interest (ROI) is selected. This pre-processing step is commonly employed by numerous algorithms, including Green and DistancePPG, for rPPG extraction. Following this, the average of pixel changes within the region is extracted as a signal, which then undergoes detrending and bandpass filtering within the heart rate range to eliminate motion and noise. The refined signal is consequently fed into algorithms such as Green or DistancePPG to extract the rPPG. Ultimately, the Fourier transform is employed to ascertain the most frequently occurring frequency value, which is expressed as the final predicted heart rate in terms of frequency.
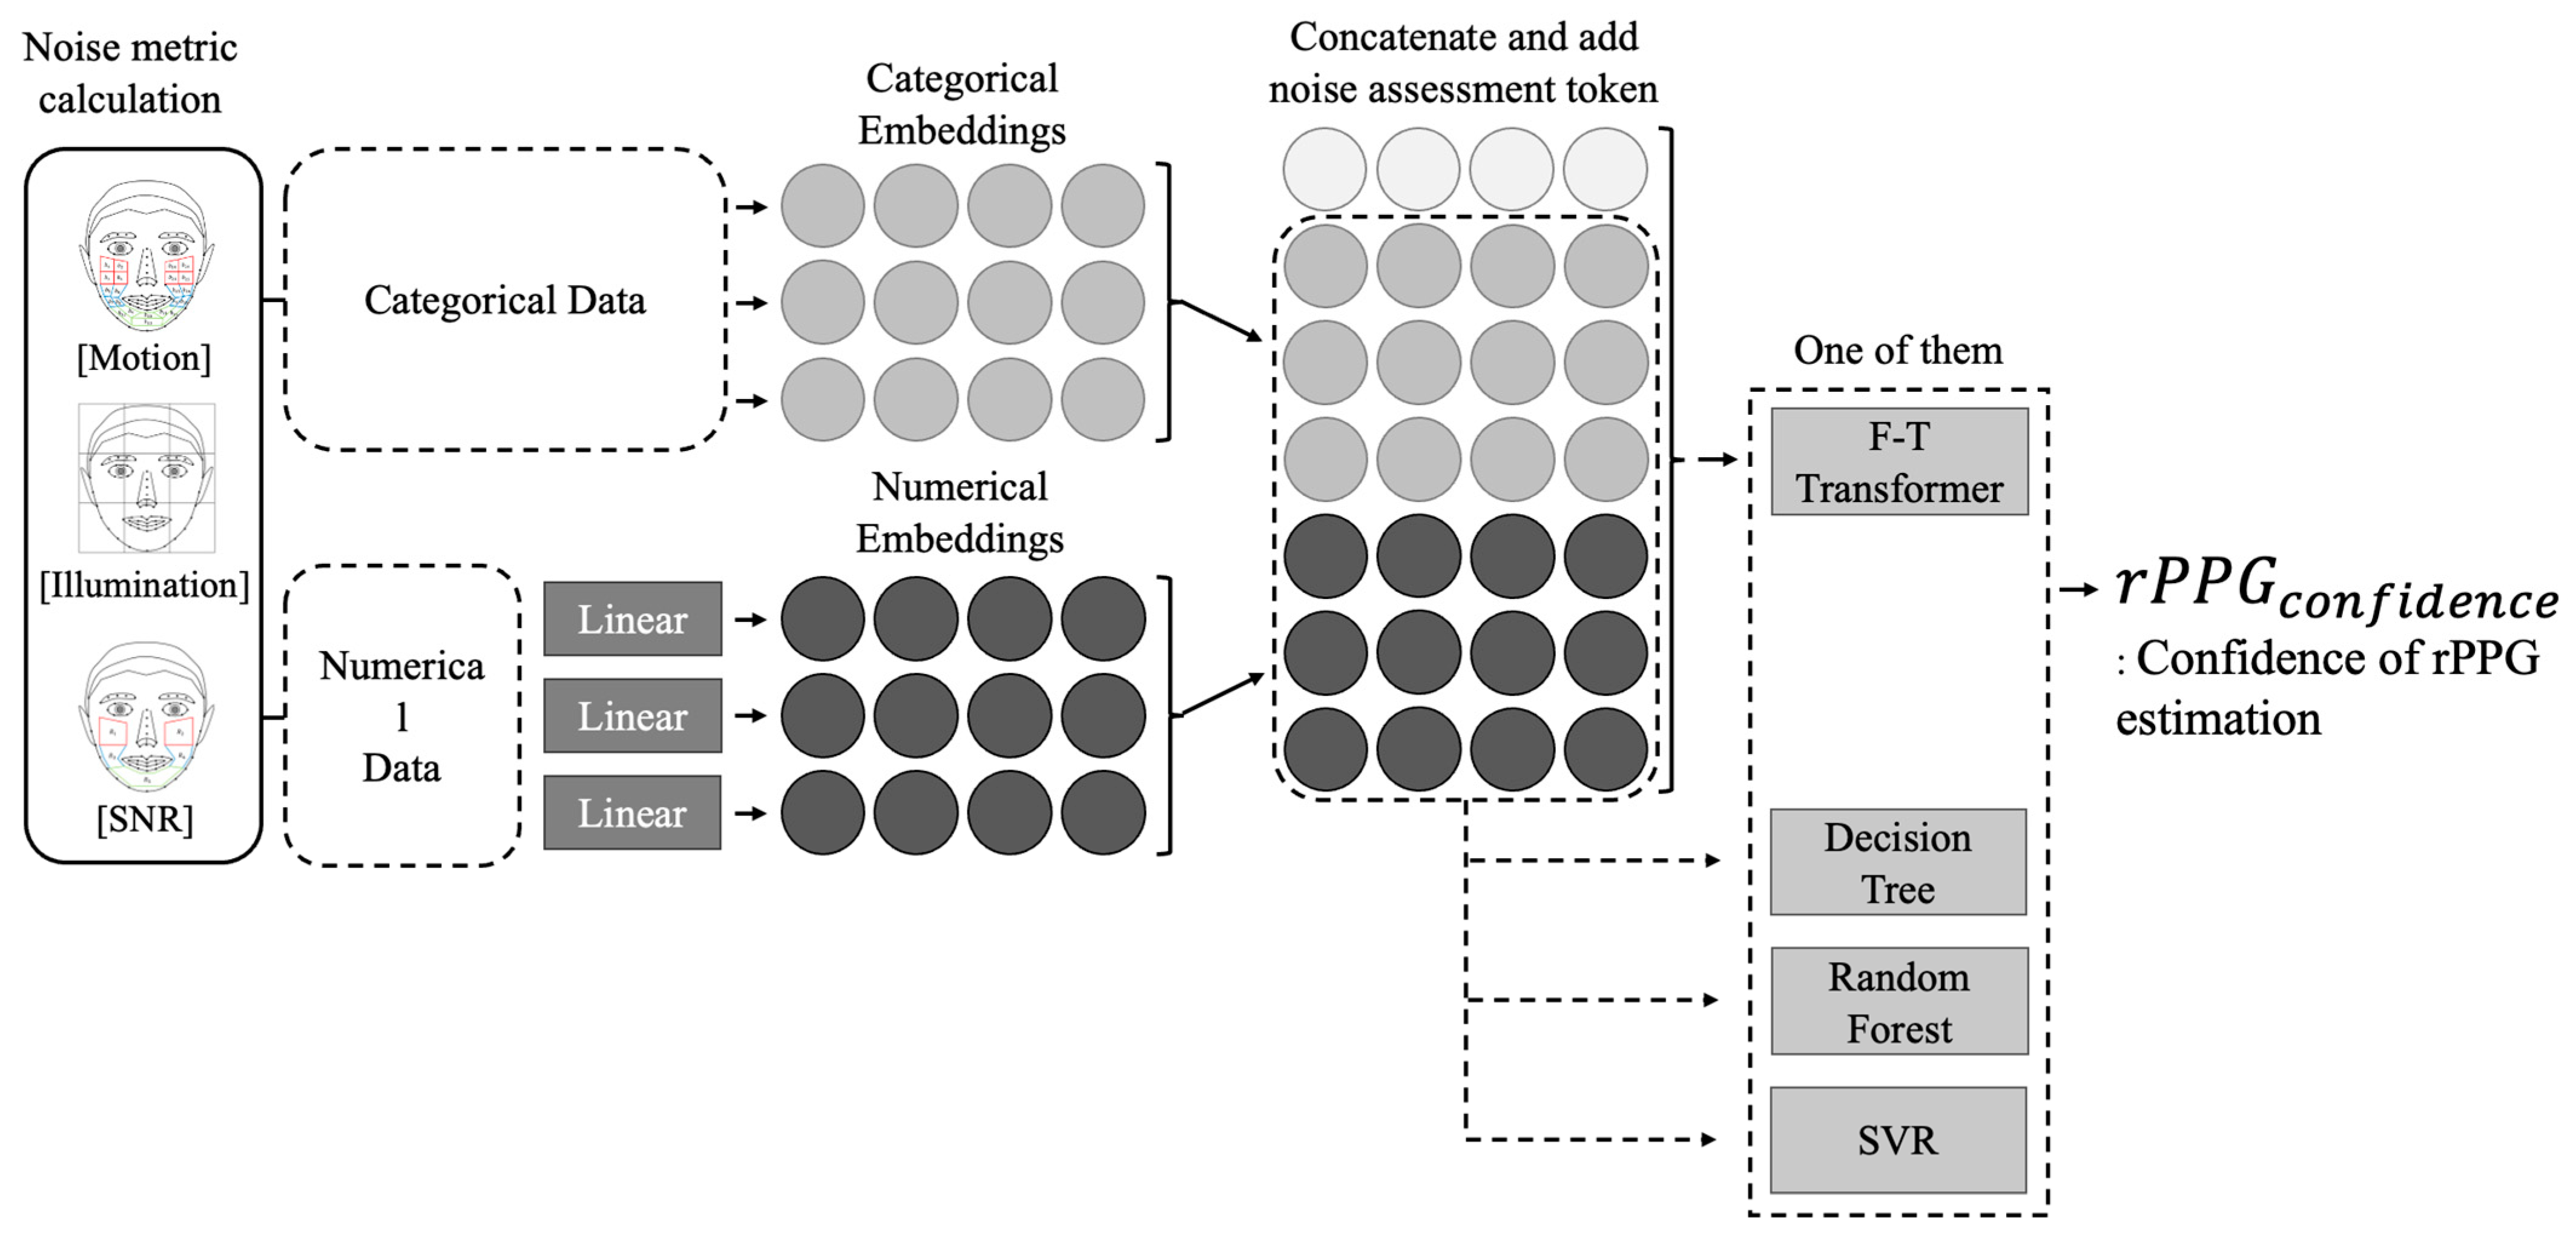
The screening method was applied to the derived heart rate, and the overall process is depicted in Figure 5. In essence, the rPPG screening method utilizes only reliable heart rates among those predicted from the rPPG signal, with reliability determined by the image quality. Factors such as substantial motion or significant illumination changes within the image inevitably diminish the acquired signal’s quality, making it challenging for the algorithm to compensate. Additionally, if the signal-to-noise ratio (SNR) value is exceedingly low, noise impact becomes disproportionately large compared to the signal. As a result, we implemented measures to assess whether the predicted heart rate—determined by detecting motion amount, light changes, and the SNR within the video—can be considered reliable.
The judgment process is derived from various models, with the confidence level of the determined by the model. This allows for a numerical expression of the predicted BPM’s reliability. If the derived exceeds a certain threshold (T), the predicted heart rate is utilized. Conversely, if it falls below T, the derived heart rate is disregarded. This is illustrated in Equation (1). In this equation, k represents the total number of samples for the derived heart rate. The optimal T value was also determined through training. Subsequently, the derived is used to perform the . This method employs only the predicted heart rates with values greater than or equal to T among all predicted rPPGs. In Equation (2), denotes the number of elements with greater than or equal to T among the total number of K predictions. signifies the average BPM post-filtering. This equation demonstrates the process of screening solely reliable heart rates from the extracted heart rates.
3.3. Feature Extraction
3.3.1. Motion Noise Assessment
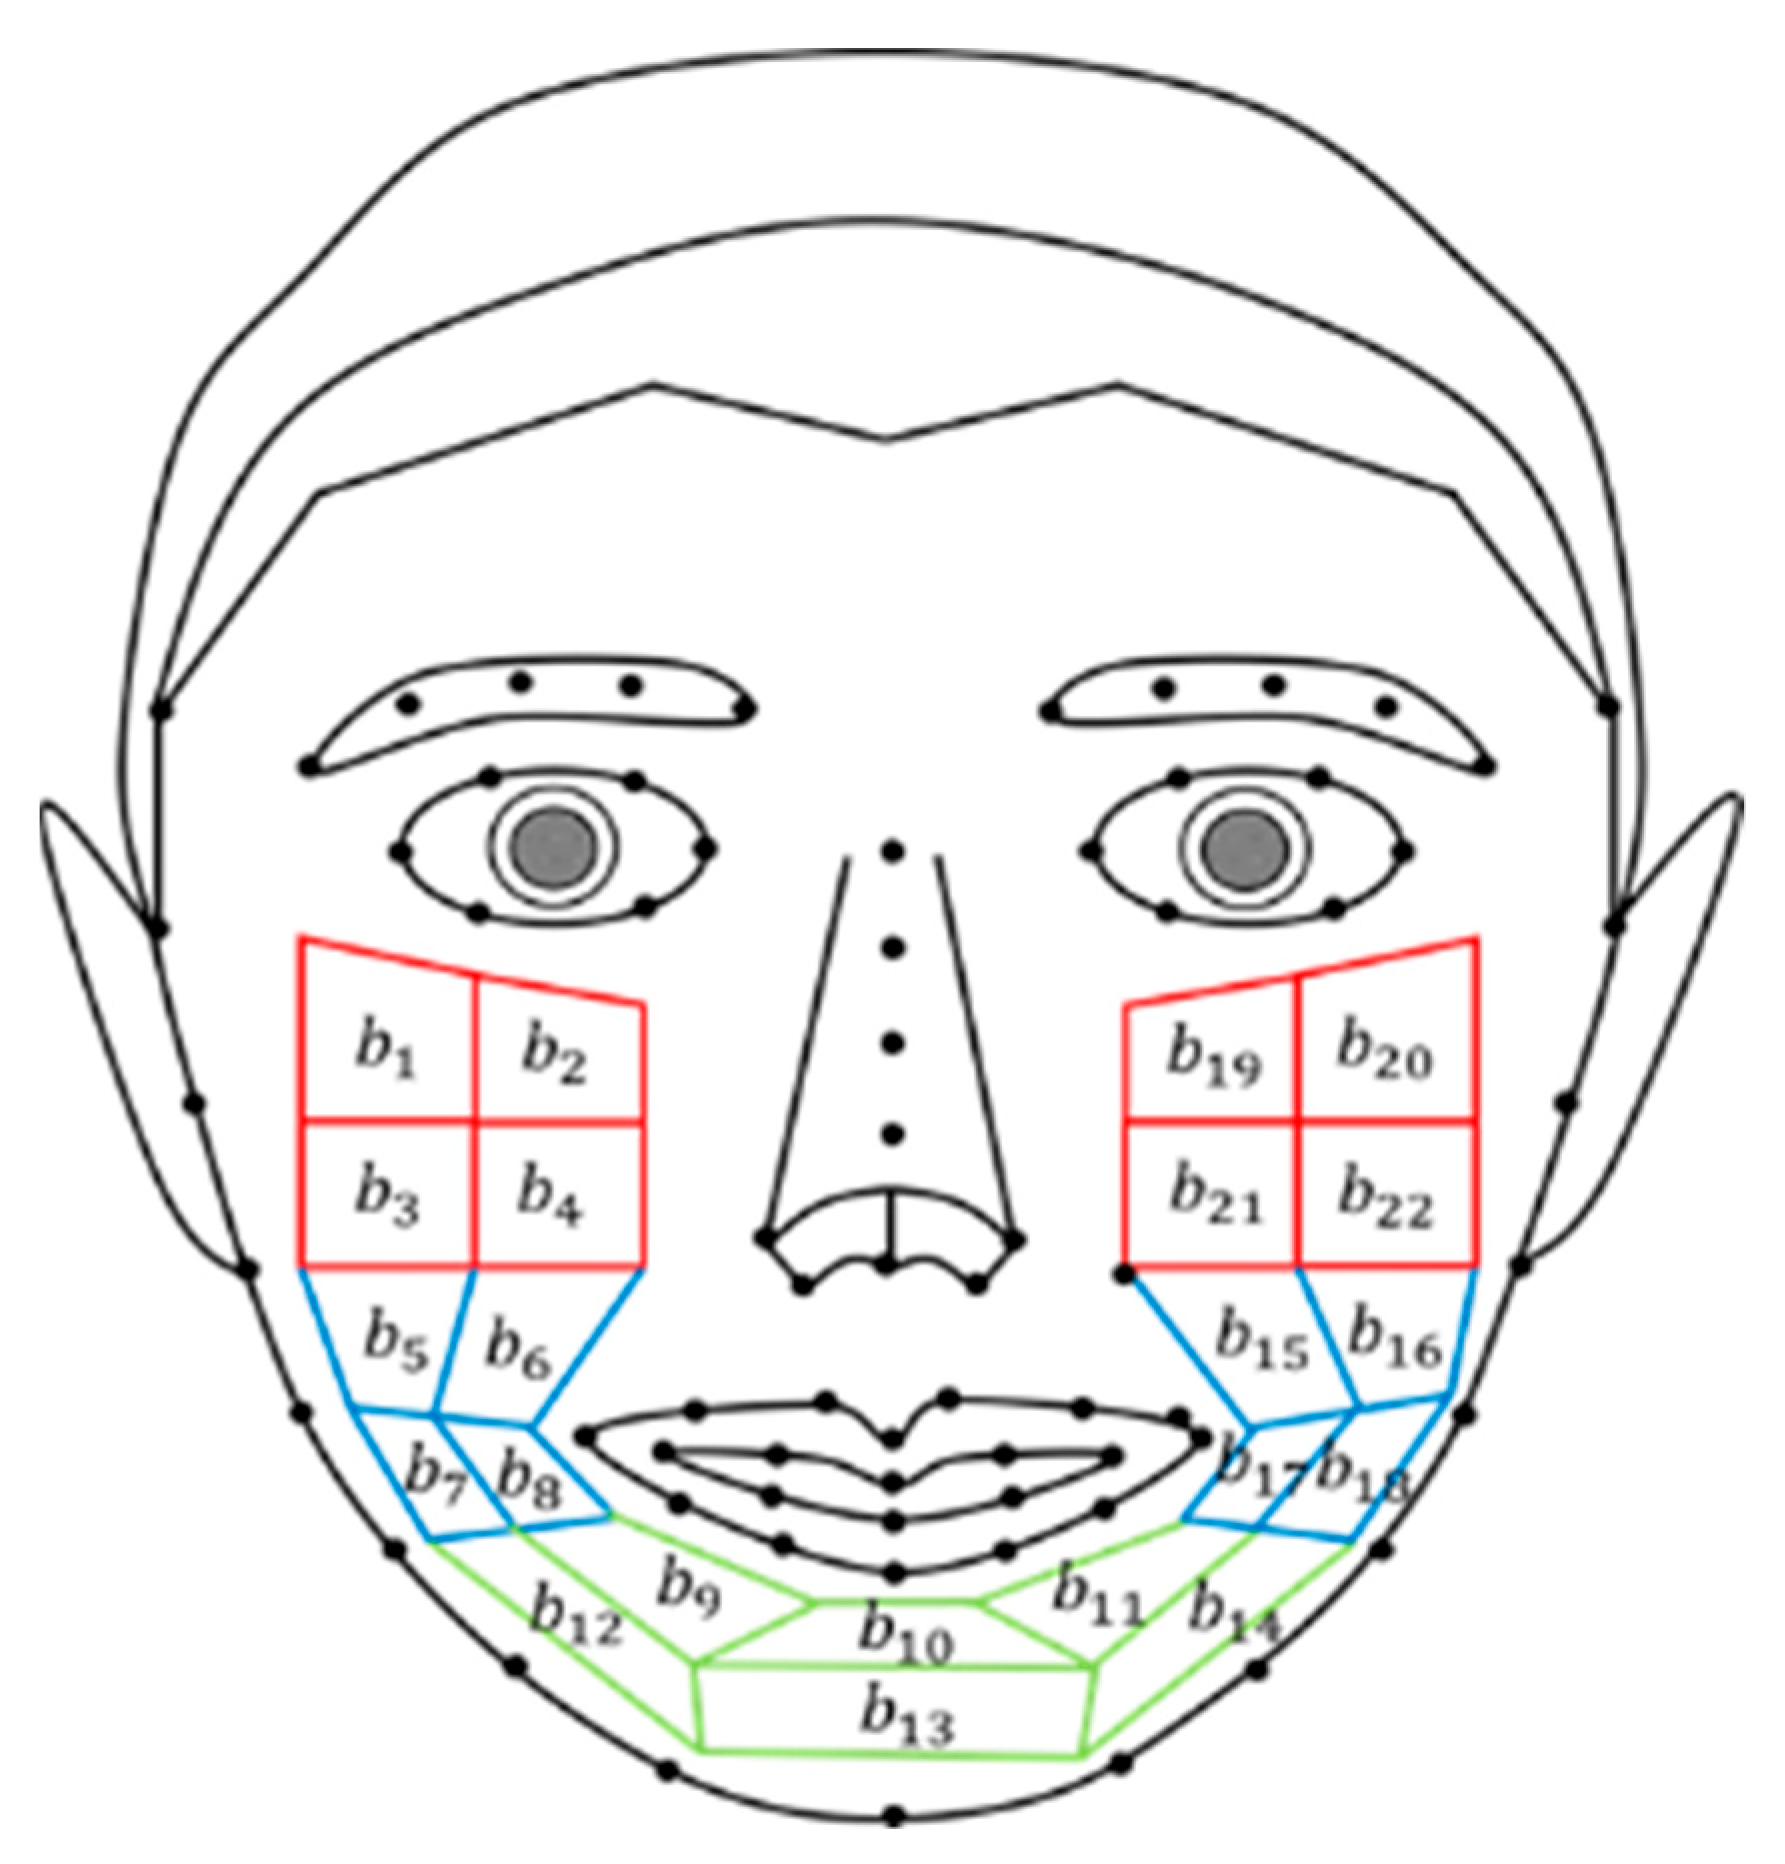
To quantify the motion noise of the face, the facial area is divided into 22 segments, with each segment’s activity subsequently measured. In this study, we utilized the OpenFace library to detect 68 facial landmarks for facial landmark analysis [21]. As illustrated in Figure 6, an interpolation insertion technique was applied to the detected landmarks, resulting in a total of 104 points, excluding the forehead area. Our focus was on the cheek and chin areas, not the forehead. These areas were defined using 36 additional landmarks, excluding the initial 68 landmarks. We created a total of 22 regions of interest (ROIs) by designating one area using four landmarks. The 22 ROIs for motion detection were established around the mouth and cheeks, which are the most sensitive areas during speech or facial expression among facial movements. By employing the bounding box of the face, we minimized the influence of background and non-skin facial areas. Furthermore, we did not designate the forehead as an ROI due to the potential presence of noise from bangs or hair, opting instead to focus on the lower part of the face.
Motion measurement for each segment is calculated using the location difference of the landmarks composing the segment. Euclidean distance is employed to determine the location of each landmark, and the motion of the segment is assessed through the average of the landmarks comprising each segment. Consequently, 22 motion values are generated for each frame which are then utilized for further analysis. The equation for motion measurement is presented below:
In Equation (3), k denotes the number of areas, n represents the vertex constituting the area, b corresponds to the current frame’s vertex position, and b′ refers to the previous frame’s vertex position. By evaluating the vertex changes between two frame sequences, the movement of the four vertices within the region is determined, and the average is calculated as M, the motion of the region. Subsequently, the 22 movement values are utilized, as procured through the above-described method.
3.3.2. Illumination Noise Assessment
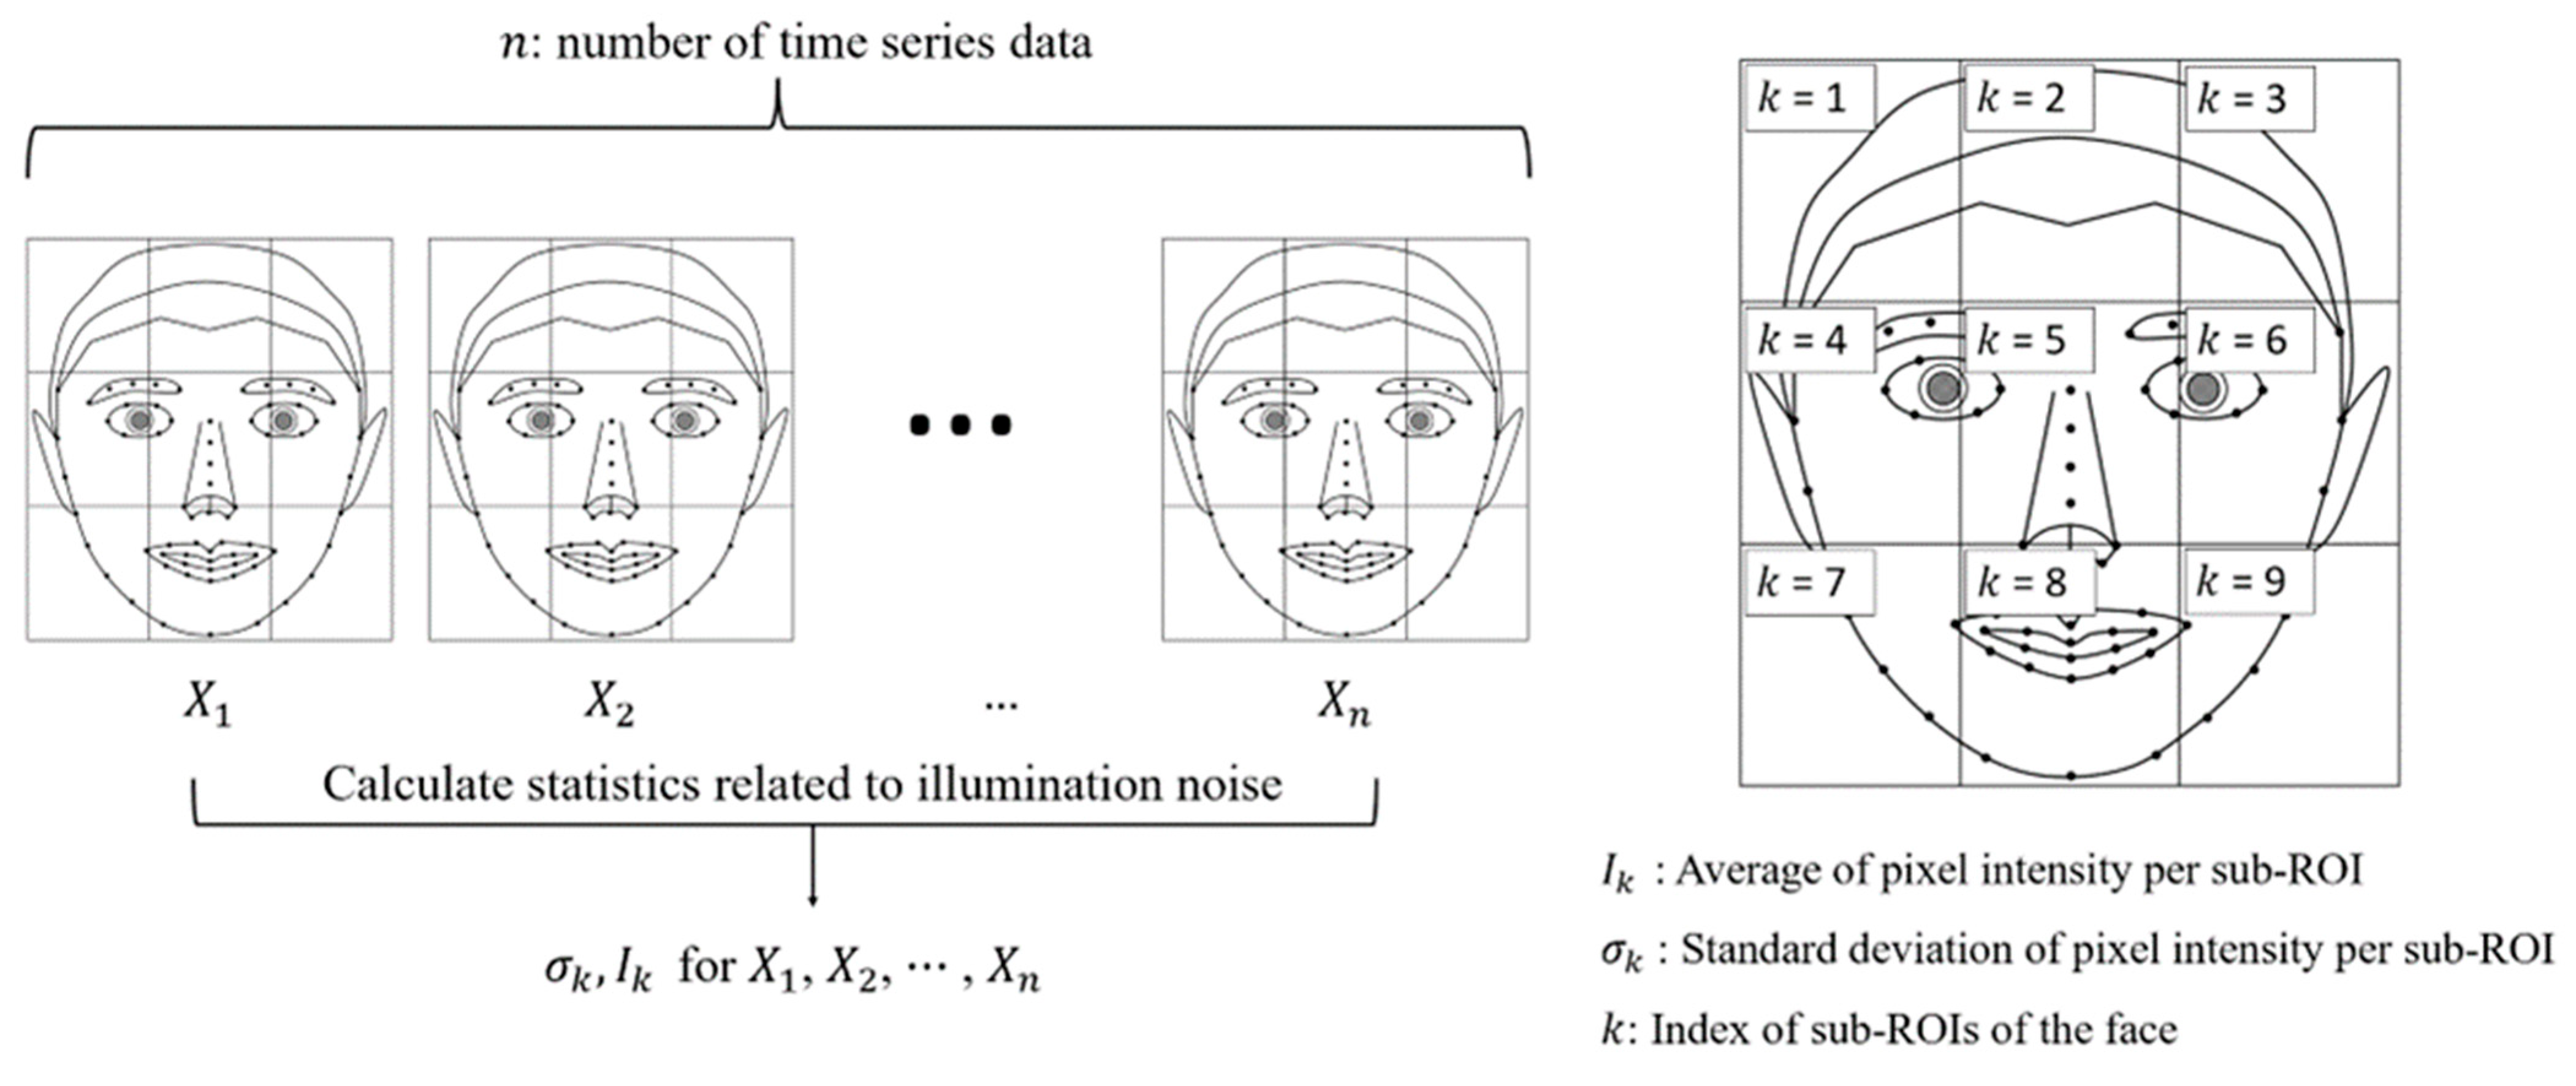
To quantify the illumination noise within the region of interest (ROI) pertaining to facial analysis, the ROI was partitioned into nine distinct areas, as illustrated in Figure 7.
The evaluation of illumination noise was conducted by computing the average pixel values for both the entire facial region and the nine segmented facial areas. To assess the temporal fluctuations in illumination within each area, standard deviation and the difference between the maximum and minimum values were calculated based on the time series of average pixel signals. The standard deviation of the time series data ( to ) representing the average brightness values for each area was determined using the following formula:
In the equation, represents the average value of the time series data from to , while k denotes the specific area of the face under consideration. The calculation of the difference between the maximum and minimum values in the time series data for the average brightness values ( to ) of each area was performed using the following formula:
Hence, the assessment of illumination noise entails considering both the standard deviation and the difference between the maximum and minimum values. Consequently, the resulting illumination noise indicator comprises a total of 20 vectors.
3.3.3. Signal-to-Noise Ratio Assessment
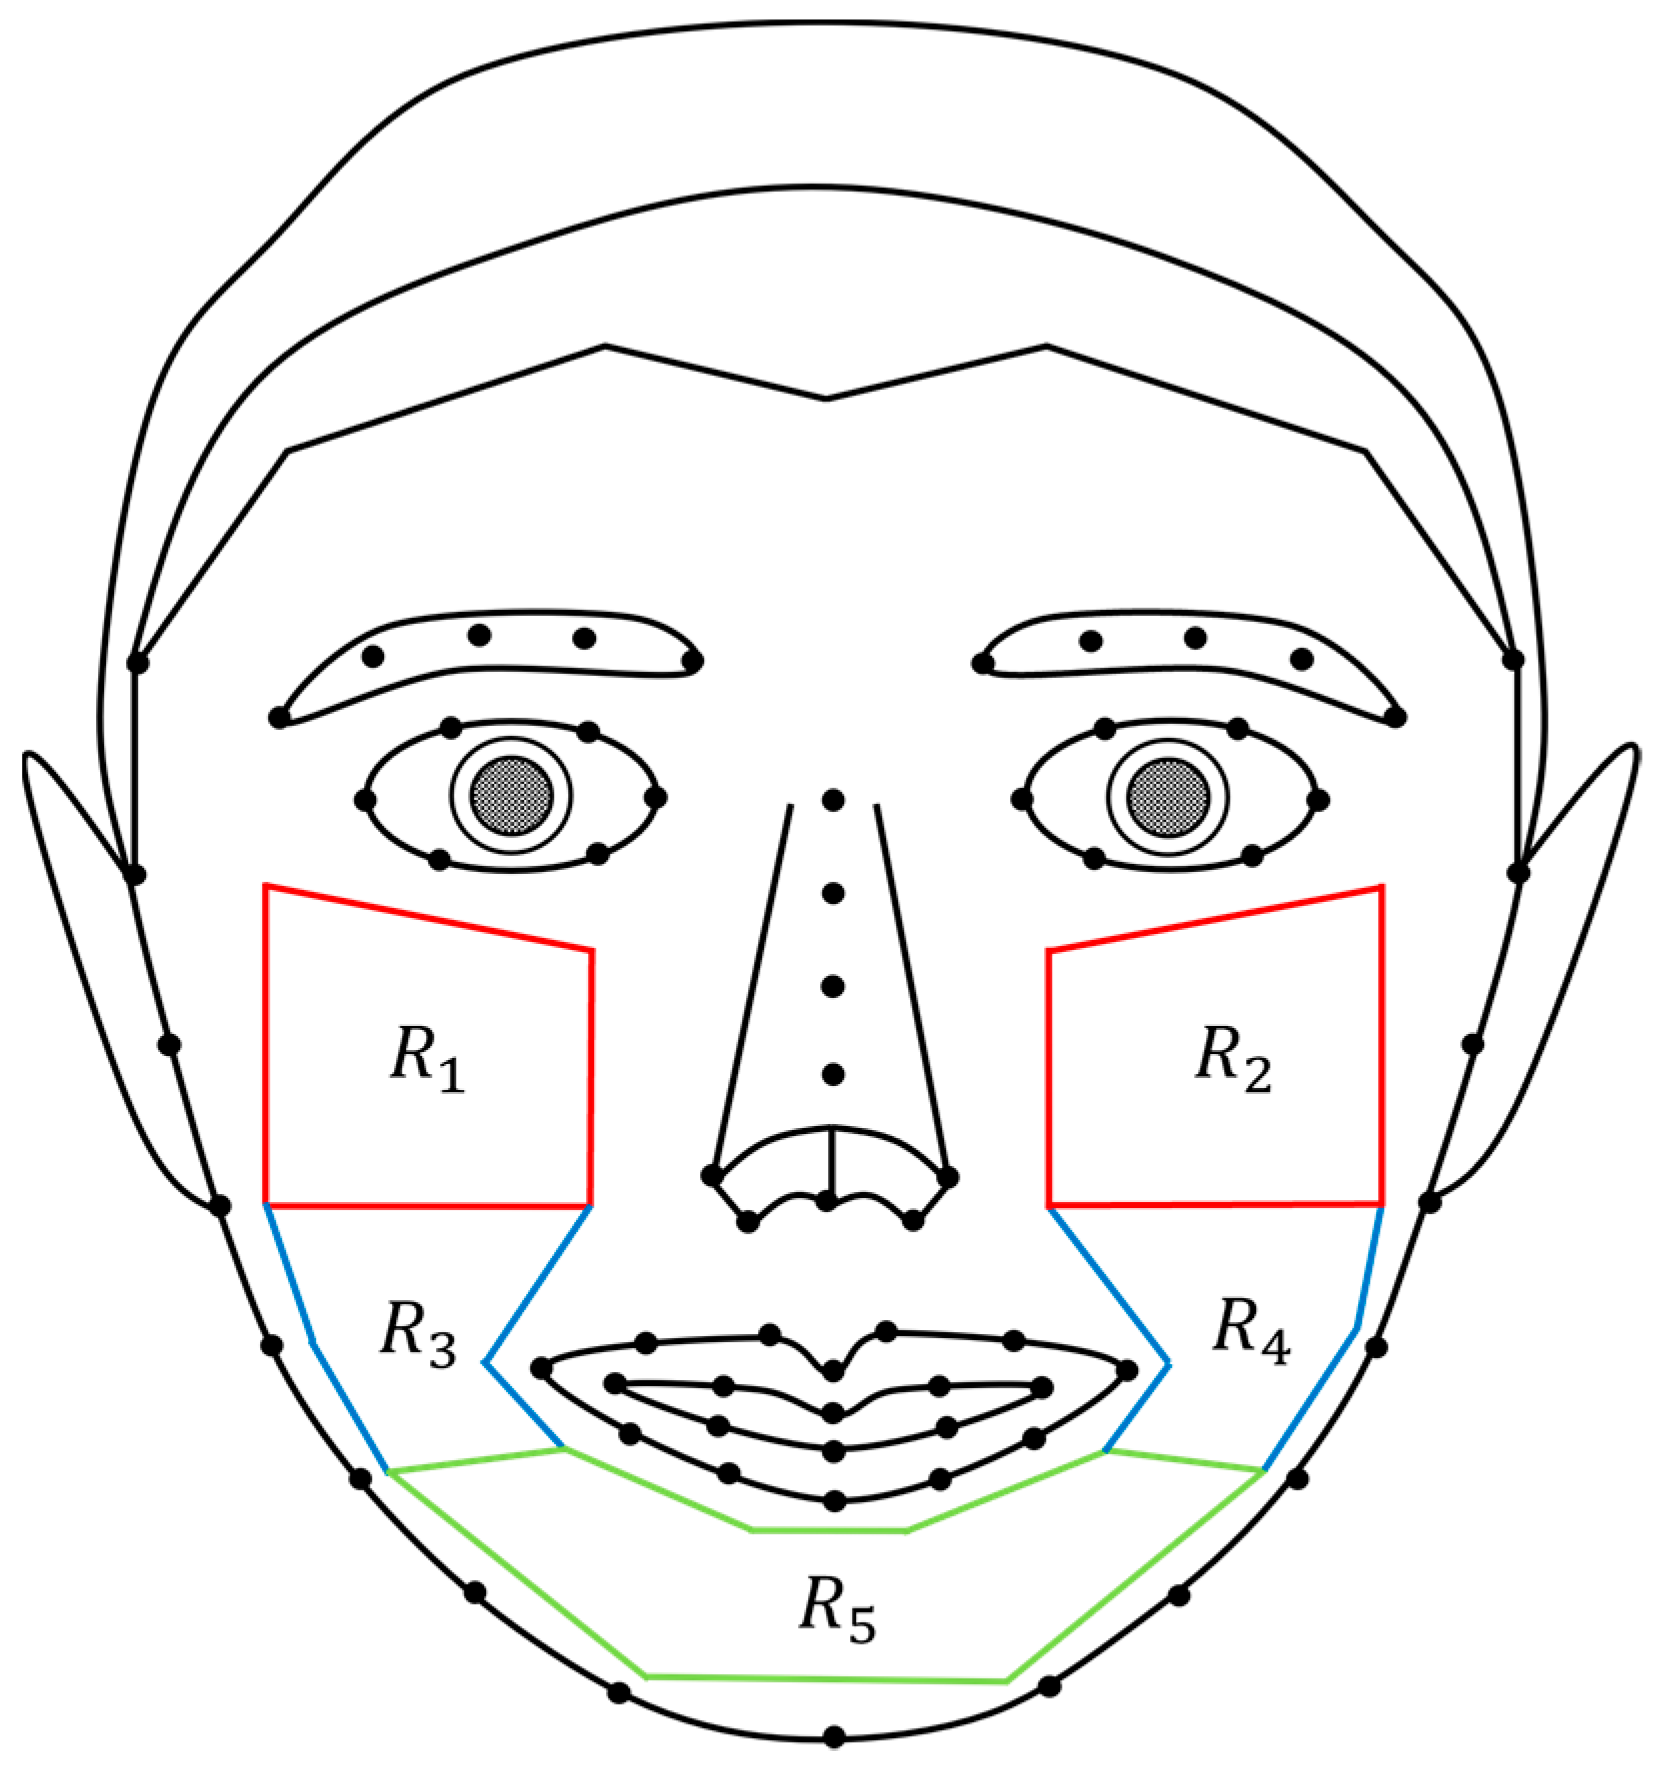
To enhance the precision of photoplethysmography (PPG) measurements and assess the signal quality obtained for different regions, we subdivided the entire facial area into five distinct regions, excluding the eyes, nose, mouth, and forehead, as illustrated in Figure 8 below.
Following the conversion of heart rate estimates obtained through remote photoplethysmography into a frequency spectrum, the maximum peak within the heart rate bandwidth range of 0.7 to 3 Hz was designated as the first peak. The second peak was set at a frequency point twice that of the first peak.
The function Ut(f) denotes the heart rate per minute signal within the first bandwidth, which includes a margin of (−α) and (+α) to the left and right, centered around the first peak. Similarly, the function S(f) represents the power spectrum density corresponding to heart rate per minute within the second bandwidth, including a margin of (−β) and (+β) to the left and right, centered around the second peak.
To calculate the signal-to-noise ratio (SNR) for each facial area, which represents the ratio of the heart rate signal-to-noise, the following equation was utilized [22].
3.4. Model Training for Noise-Assessment-Based Pulse Signal Screening
3.4.1. Random Forest
The random forest technique, an ensemble method of decision trees [19], is employed to achieve accurate predictions. This approach involves generating multiple training datasets through random sampling, training decision trees on these datasets, and aggregating the predictions of each decision tree to obtain the final prediction [23].
To create a random forest model, we utilized the ‘RandomForestClassifier’ class. In order to mitigate the risk of overfitting, we set the maximum depth of each decision tree to 2 using the max_depth parameter. Additionally, considering the characteristic of random forest where it learns randomly from each decision tree, we set the random_state to 0 to ensure consistent learning results across the model. Random forest is particularly effective for handling large amounts of data and mitigating overfitting issues that can arise from excessive noise within the model, thereby improving the predictive performance.
3.4.2. Support Vector Regression
Support vector regression (SVR) is a widely recognized method employed in diverse applications, wherein it seeks an optimal hyperplane by defining data points as support vectors to train a regression model. Similar to other methodologies, noise assessment metrics (Ik, k, Mk, SNR) are utilized as inputs with the objective of training a model that performs regression on the absolute error value between the ground truth heart rate and the rPPG-based heart rate. The model training was conducted using the LIBSVM method, employing a radial basis function kernel-based regression model. Additionally, the hyperparameter for learning, gamma, was determined using Equation (7), and an optimal regularization parameter was obtained through grid search.
where is the length of the input. The grid search for the regularization parameter was performed over a search range of 0.01 to 1000, with intervals defined as a geometric sequence of 10 [24].
3.4.3. FT-Transformer
Tab transformer utilizes a transformer block to process categorical embeddings and generate contextual embeddings [25]. The contextual embeddings are then combined with the numerical features and fed through a multilayer perceptron (MLP) for prediction. However, in order to address the limitation of utilizing numerical features only in the final layers, we propose a model called the FT-Transformer that incorporates numerical embeddings [26]. The FT-Transformer’s encoder receives numerical data as a list and employs linear embeddings for numerical representation. The numerical embeddings have a dimension of 64, and the model consists of 3 transformer blocks and 6 attention heads. Both the attention layer and dense layer employ a dropout rate of 0.3. The numerical embeddings, along with the noise assessment token embedding, are processed by the transformer block, resulting in contextual embeddings that are then passed through the MLP for prediction. During model training, Adam optimizer was employed, mean squared error (MSE) served as the loss function, and root mean squared error (RMSE) was used as the evaluation metric. Furthermore, early stopping was implemented to determine an appropriate epoch for training.
4. Results
In order to evaluate the methods proposed in this study, the leave-one-out cross-validation method was employed [27]. The accuracy calculations were based on the data collected from all 18 participants, obtained through experiments conducted within the same controlled environment. In each iteration, the data from one participant were set aside as the validation set, while the data from the remaining 17 participants were utilized as the training set to fit the model. The model’s predicted heart rate values were compared against the ground truth heart rate values, and the accuracy was measured using the PTE6 (percentage of time that the heart rate error is less than 6 bpm) calculation [28].
PTE6 is as shown in Equation (8), where represents the ground truth of heart rate corresponding to a th time window. is the remote heart rate measurement result measured in a th time window.
Additionally, mean absolute percentage error (MAPE) is used as a metric. PTE6 classifies success and failure based on 6 bpm, so PTE6 is not affected by outliers such as an error of 15 bpm or more. But, MAPE has the characteristic of reflecting errors with large errors. MAPE is expressed as Equation (9).
where is the th time window. is the correct heart rate corresponding to the ground truth. is the remote heart rate measurement result.
This process was repeated for all 18 participants, and the average results were computed to determine the overall accuracy. Among the four scenarios, the situations in which the subjects maintained a steady gaze and spoke while maintaining a steady gaze were grouped as still situations. The situation of moving their faces at various angles without speaking and moving their faces at various angles while speaking was grouped into motion situations. The results of calculating the accuracy using the two situations and all data are shown in the following Table 3.
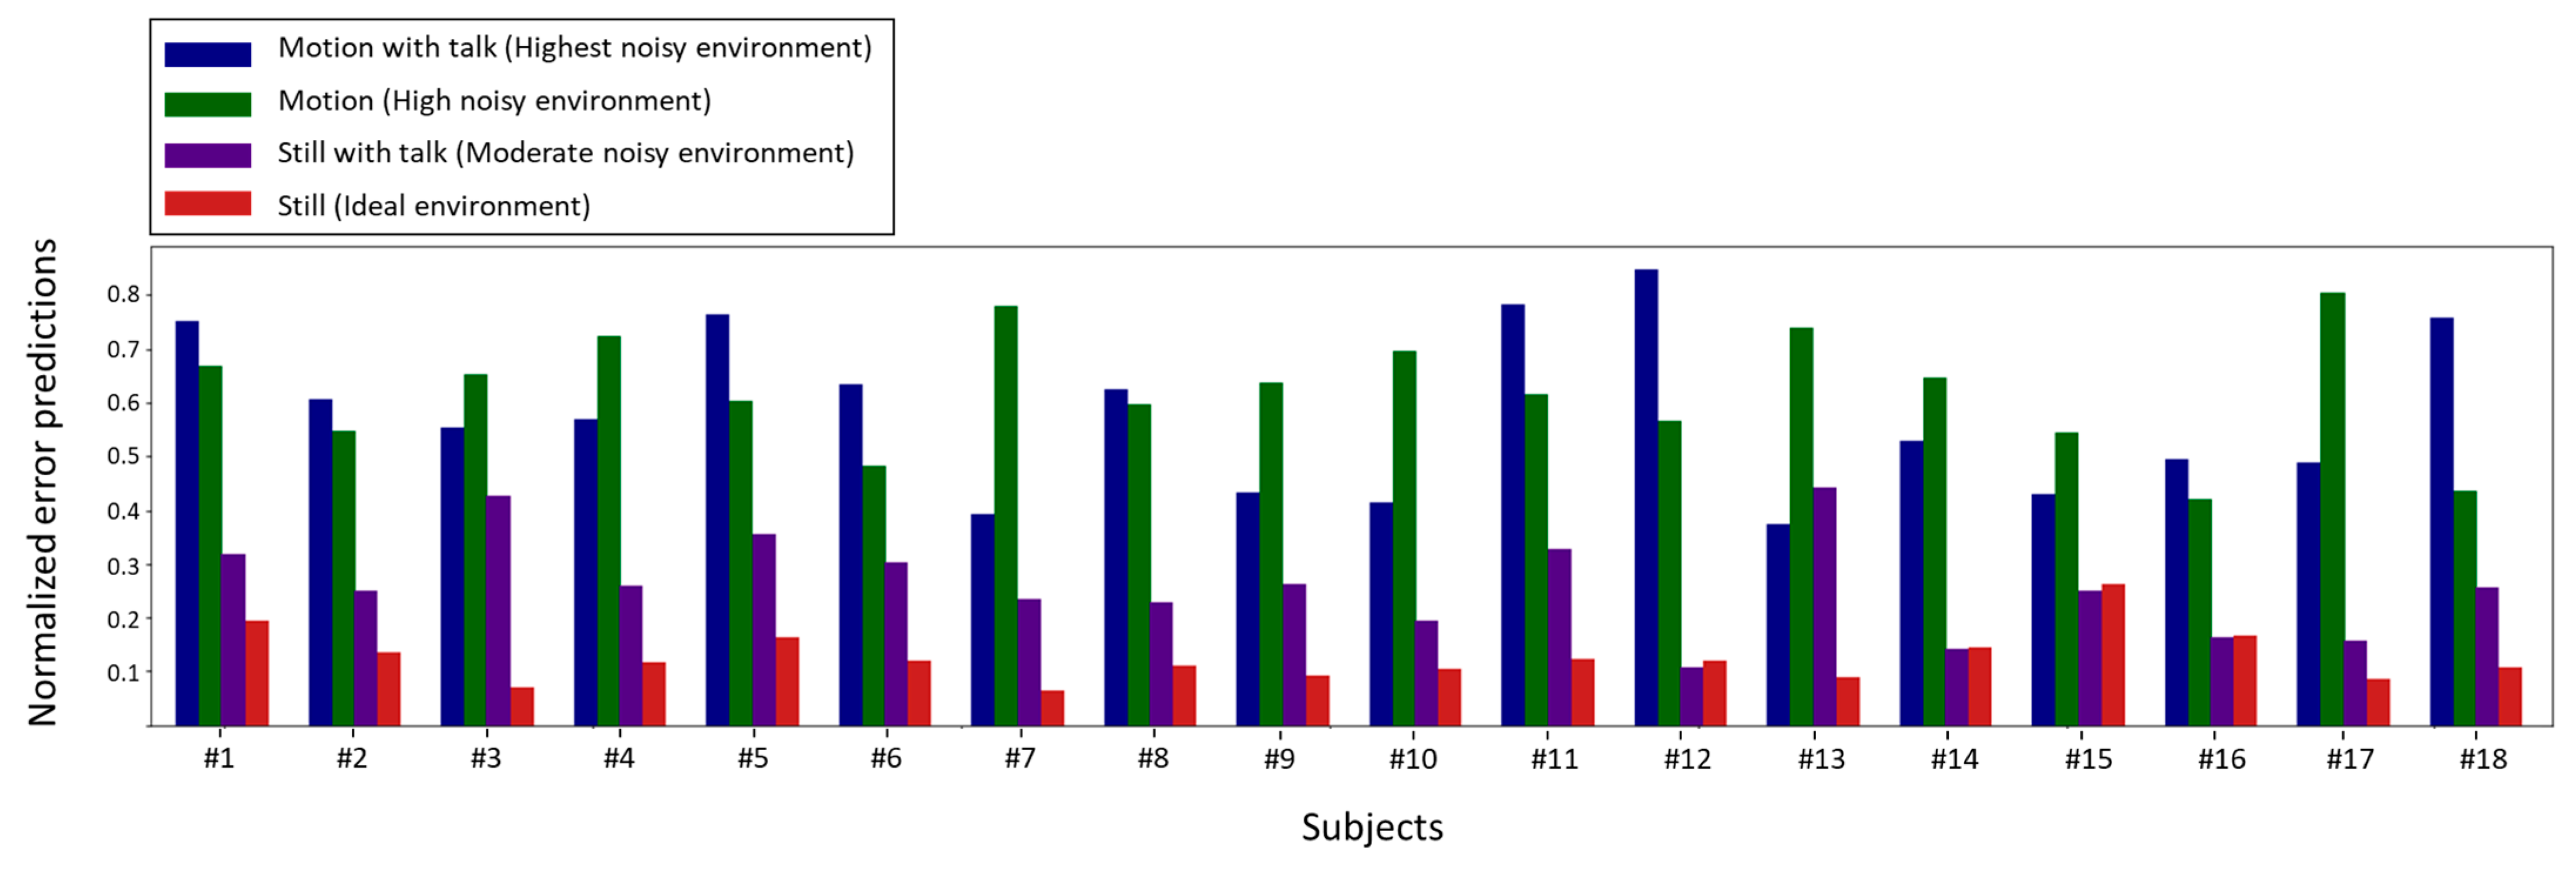
The results suggest that the rPPG screening models refine high-error segments of the video and selectively use low-error segments. We compared how accurately the model’s predicted errors for each situation and person ID. Figure 9 and Figure 10 demonstrate the predicted error values for each situation by person ID.
As shown in Figure 9, the model’s predicted error is usually high when there is motion and talk in most cases. This indicates that the model is adept at detecting instances in the input video that contain a considerable amount of noise, including motion, light, and SNR.
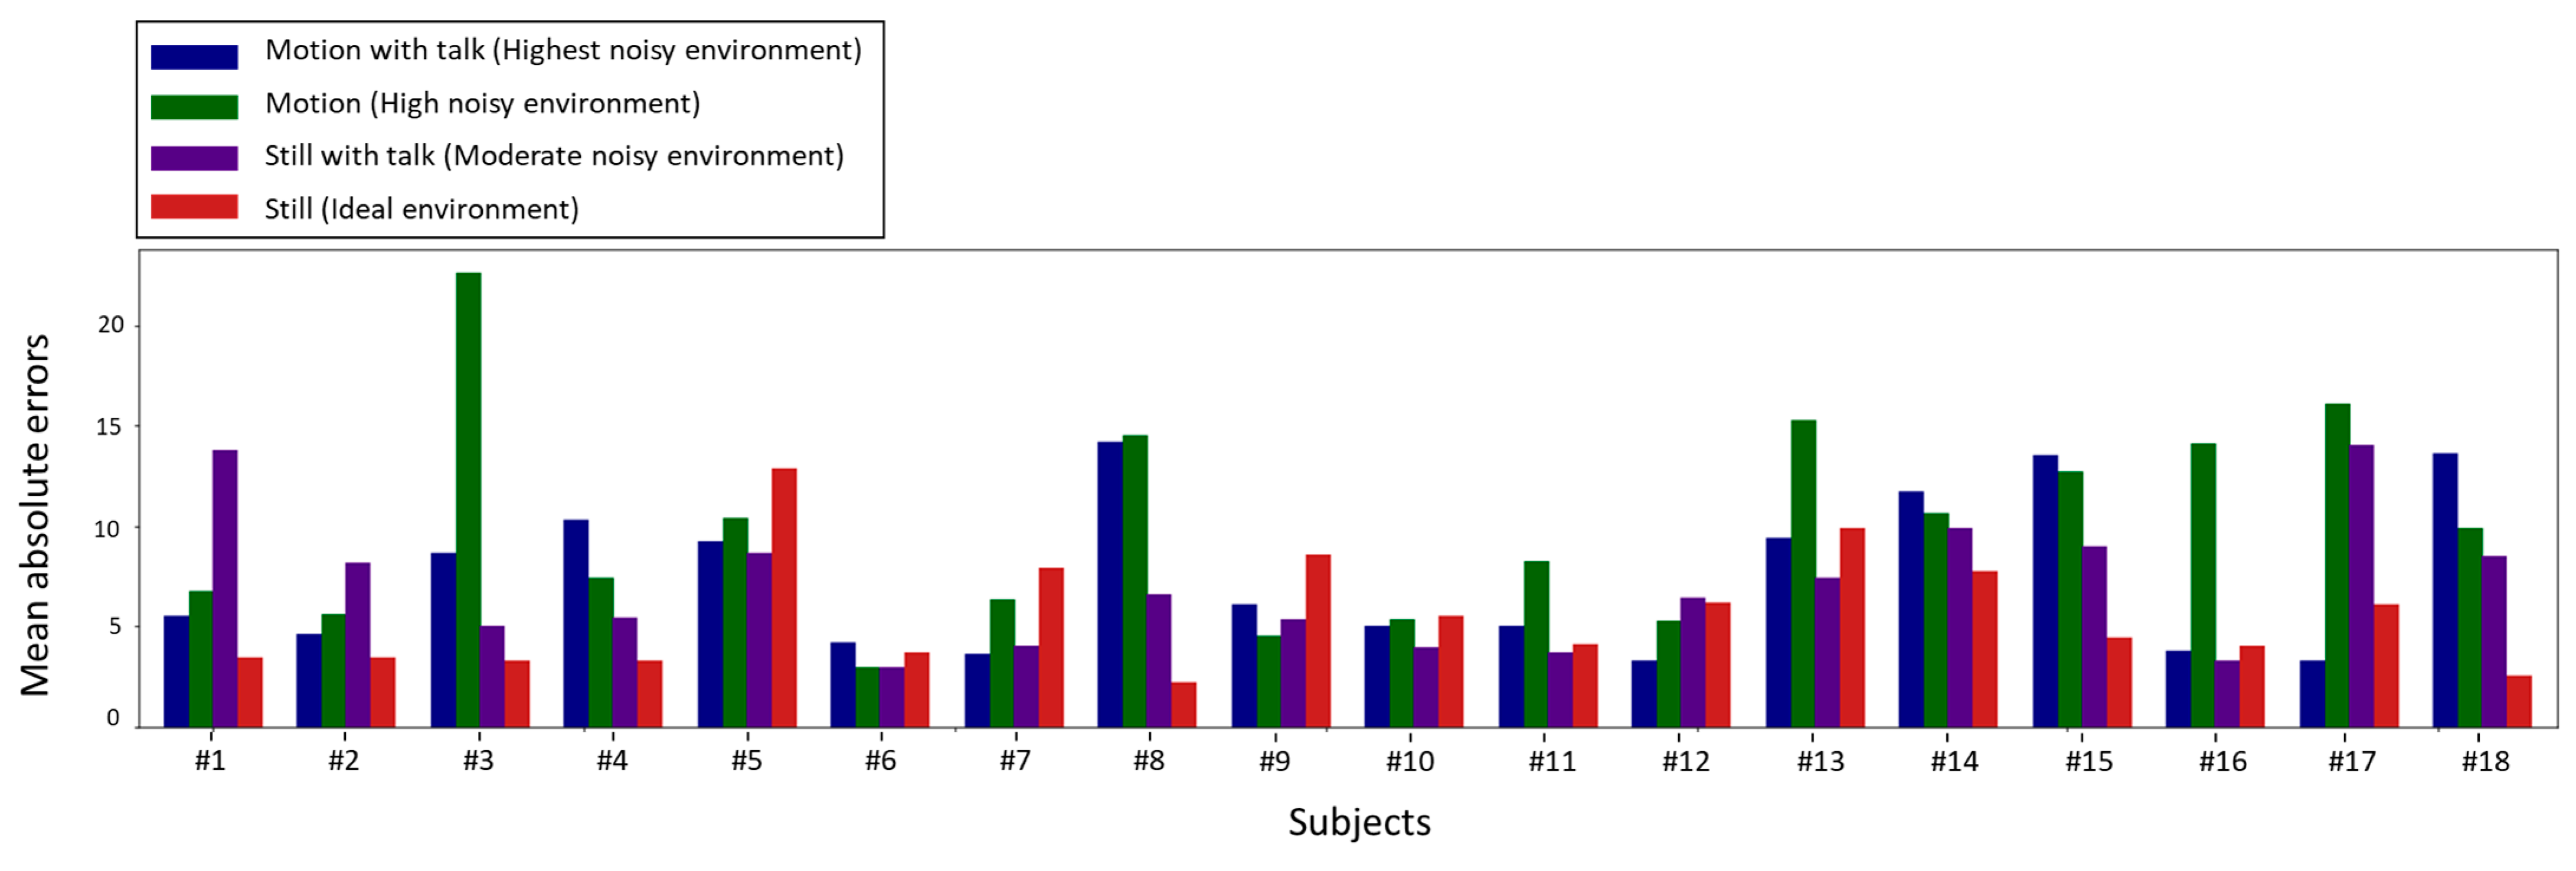
The MAE without rPPG screening for each person ID and scenario is presented in Figure 10 [29]. In most cases, the largest MAE is observed for Motion with talk and Motion with large movements, as shown in the graph. This observation is consistent with the size of the errors predicted by the model in Figure 9. Furthermore, it can be observed that in Still (Ideal environment), where noise is minimal, the majority of the errors are under 5 bpm. This correlation between the two graphs supports our hypothesis that our proposed rPPG screening model can improve the accuracy of predicting rPPG through the identification and removal of video regions with significant errors.
5. Discussion (and Future Work)
The results indicate that our proposed rPPG screening method outperformed the existing approaches across all scenarios. Among them, random forest exhibited the best performance in both still and motion environments, while SVR achieved the highest accuracy in the overall dataset, where all the data were trained and tested together. For a more comprehensive analysis, we evaluated the accuracy for each individual. Table 4 presents the accuracy results for each person in the decision tree and random forest models, while Table 5 displays the accuracy for each person in the SVR and transformer models. Notably, the results demonstrate a substantial dependence on the individual’s identity. Generally, individuals with lighter skin tended to exhibit higher infrared light saturation. Furthermore, individuals wearing glasses displayed lower accuracy, particularly in motion scenarios. Specifically, Person IDs 3, 8, 15, and 17 serve as examples of individuals wearing glasses.
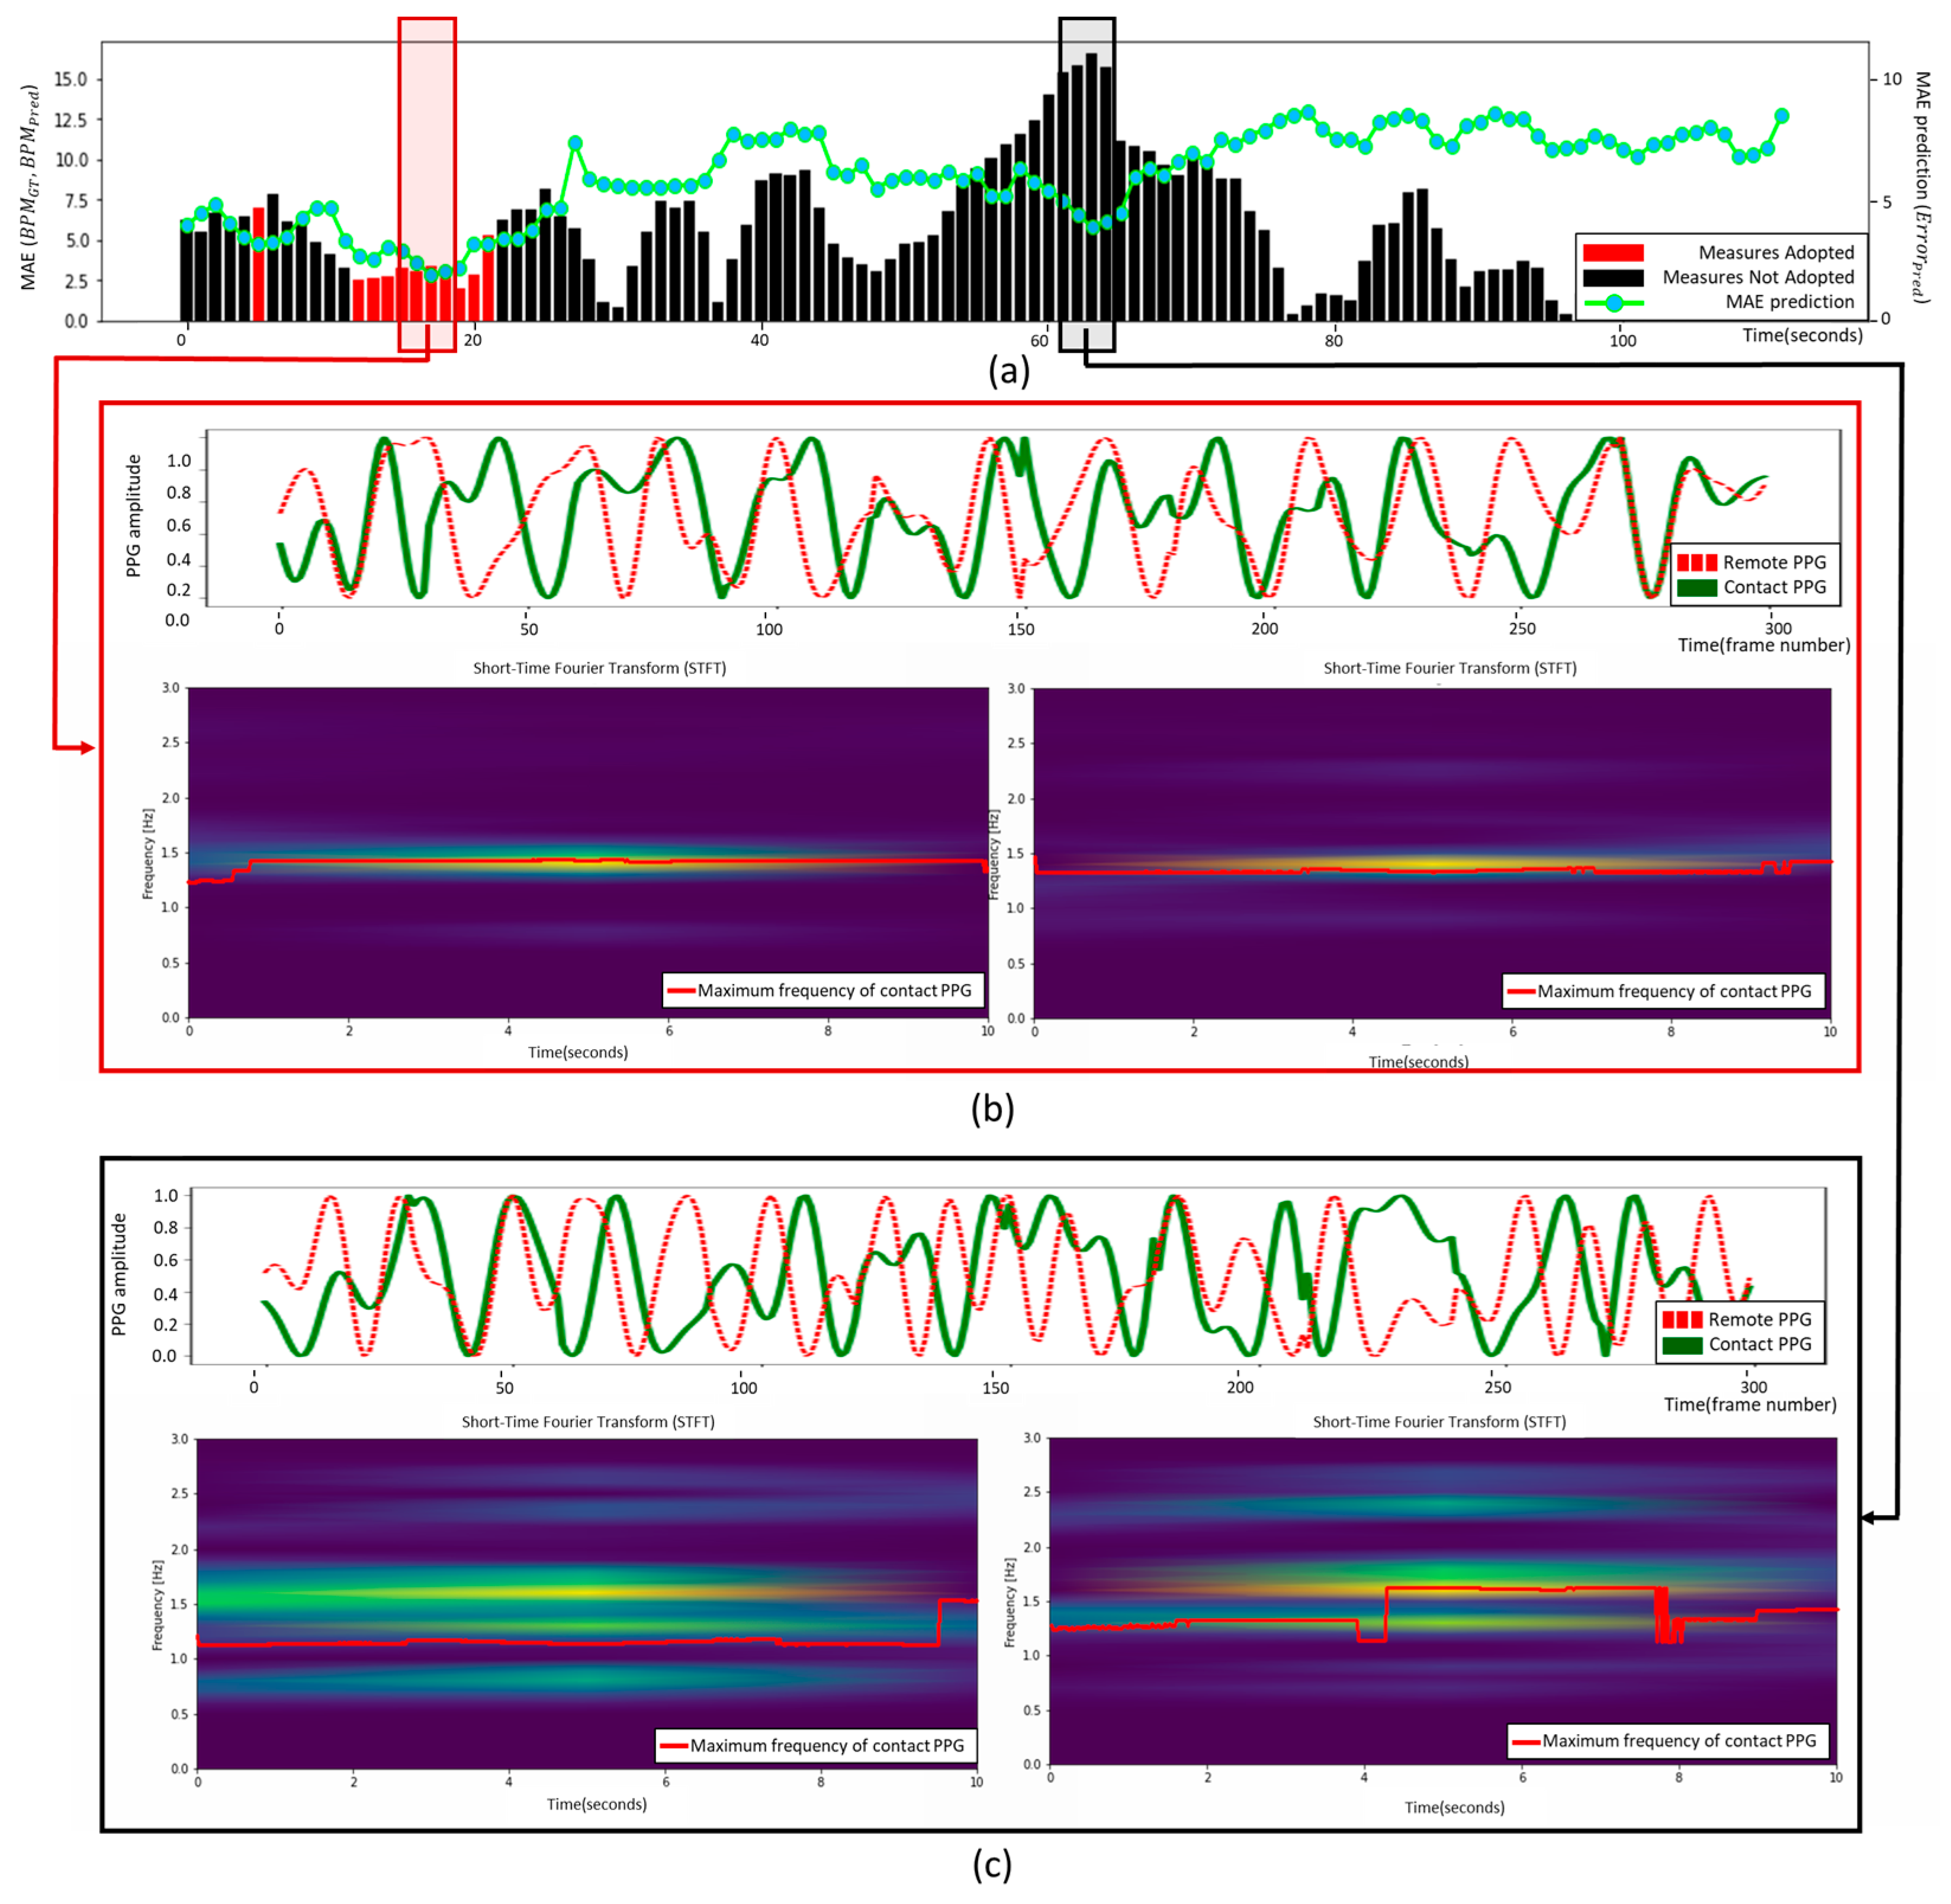
Finally, we compared the error size of the actual and predicted BPMs with the error size predicted by the model. Results of comparison are shown in Figure 11. Figure 11a illustrates a comparison example in a scenario considering the motion and talk of subject 2. In the bar graph, the red bar corresponds to the area predicted by the model to have low error and selected by the filter, while the black bar represents the area not selected by the model. The dotted plot displays the size of the predicted error at that time, which indicates that the red bars have the smallest values among all the bins. We compared the cPPG and predicted rPPG during the approximately 2 s interval (16–17 s) of the red bars that were selected by the filter, and the interval (64–65 s) that were not selected. The results are shown in Figure 11b,c, respectively. Regarding the first graph in Figure 11b which displays the PPG amplitude, the comparison of cPPG and rPPG through each interval indicates that rPPG, highlighted by a red line, has a similar spacing to cPPG. Below, there is a graph that displays the time–frequency spectrum of the 1-s signal’s rPPG for both 16 and 17, with the correct value of cPPG represented by a red line [30]. It is evident that the time–frequency spectrum aligns precisely with the correct cPPG for both seconds 16 and 17. Figure 11c displays the time–frequency spectrum of the rPPG at 64 and 65 s, respectively, with the frequency of the cPPG shown as the red line. The unselected intervals exhibit a noisy predicted signal, as the rPPG at 64 and 65 s does not have the same frequency spectrum as the maximum frequency of the cPPG.
To summarize the contributions of this study, we have proposed a model to evaluate the confidence of rPPG measurement and proposed a screening method for rPPG through the confidence based on model’s predicted error. The model for measuring confidence is a universal method that can be applied to any rPPG method because it uses facial region and landmark data and rPPG signal as inputs. Through experiments, it was confirmed and verified that performance is improved in all cases when the proposed method is applied to the Green [10] and DistancePPG [11] methods applicable to infrared environments. For the widespread use of rPPG, high-accuracy measurement is required even in wild environments such as vehicles, mobile, and fitness environments, and the proposed screening method is expected to be applied.
However, this study has limitations. First, the dataset used in the experiment includes only Asian participants and was measured in an indoor environment. Therefore, additional experiments including participants of multiple races should be conducted as part of future works. The second is that this study utilized an experimental environment with no restrictions on subjects’ movements and conversations, but its data were acquired and verified only in an indoor environment, so verification in outdoor, driving, and fitness environments should be conducted. Finally, although an improvement in accuracy was confirmed via a method with low coverage for the actual total time, there is a limitation in that the heart rate measurement accuracy does not cover the entire section. To overcome this limitation, a method of compensating all the sections based on high-confidence data with low predicted error margins should also be conducted as part of future works.
6. Conclusions
The performance enhancement of an algorithm itself has inherent limitations. Therefore, it is often necessary to refine and extract essential data through pre-processing or rPPG screening techniques to achieve improved performance. For instance, research focused on enhancing the performance of remote photoplethysmography (rPPG) includes methods such as skin segmentation or pre-processing approaches that identify regions with prominent blood flow changes. In this paper, we propose an rPPG screening method for selecting reliable data from the extracted rPPG signals. Our proposed method has demonstrated significant performance improvements in most cases compared to the absence of rPPG screening. Notably, when applied to the total dataset, which contains not only still videos but also videos with motion, the method yields a remarkable 23.47% (=) PTE6 performance increase, particularly when SVR is utilized (from Table 3). Furthermore, the proposed method exhibits a low computational complexity, enabling real-time application and integration with existing rPPG extraction methods. Future work can involve investigating data in more challenging scenarios with frequent interferences, such as in vehicular environments or under various light movements. Additionally, the effectiveness of the algorithm in RGB camera environments warrants further exploration. Furthermore, we anticipate that the rPPG screening method will find applications not only in rPPG enhancement but also in other vital sign measurements, such as remote respiration and blood pressure measurement [31,32,33].
Author Contributions
Conceptualization, K.L. and E.C.L.; methodology, K.L.; software, K.L. and S.K.; validation, K.L., S.K., B.A., H.S. and S.P.; formal analysis, K.L. and S.K.; investigation, K.L., B.A., H.S. and S.P.; resources, S.K., B.A., H.S. and S.P.; data curation, B.A., H.S. and S.P.; writing—original draft preparation, K.L. and S.K.; writing—review and editing, E.C.L.; visualization, K.L., B.A., H.S. and S.P.; supervision, E.C.L.; project administration, E.C.L. All authors have read and agreed to the published version of the manuscript.
Funding
This paper was supported by the Field-Oriented Technology Development Project for Customs Administration through National Research Foundation of Korea (NRF) funded by the Ministry of Science & ICT and Korea Customs Service (2022M3I1A1095155).
Institutional Review Board Statement
Based on the 13-1-3 of the Enforcement Regulations of the Act on Bioethics and Safety of the Republic of Korea, ethical review and approval were waived (IRB-SMU-C-2023-1-008) for this study by Sangmyung University Institutional Review Board, because this study uses only simple contact-measuring equipment or observation equipment that does not follow physical changes.
Informed Consent Statement
Informed consent was obtained from all subjects involved in the study.
Data Availability Statement
The obtained data cannot be shared because it was agreed that it could be used only for this study.
Conflicts of Interest
The authors declare no conflict of interest.
References
- Huang, P.-W.; Wu, B.-J.; Wu, B.-F. A Heart Rate Monitoring Framework for Real-World Drivers Using Remote Photoplethysmography. IEEE J. Biomed. Health Inform. 2021, 25, 1397–1408. [Google Scholar] [CrossRef] [PubMed]
- Sikander, G.; Anwar, S. Driver Fatigue Detection Systems: A Review. IEEE Trans. Intell. Transp. Syst. 2019, 20, 2339–2352. [Google Scholar] [CrossRef]
- Cho, D.; Kim, J.; Lee, K.J.; Kim, S. Reduction of Motion Artifacts from Remote Photoplethysmography Using Adaptive Noise Cancellation and Modified HSI Model. IEEE Access 2021, 9, 122655–122667. [Google Scholar] [CrossRef]
- Stricker, R.; Müller, S.; Gross, H.-M. Non-Contact Video-Based Pulse Rate Measurement on a Mobile Service Robot. In Proceedings of the 23rd IEEE International Symposium on Robot and Human Interactive Communication, Edinburgh, UK, 25–29 August 2014; pp. 1056–1062. [Google Scholar]
- Halthore, R.N.; Eck, T.F.; Holben, B.N.; Markham, B.L. Sun Photometric Measurements of Atmospheric Water Vapor Column Abundance in the 940-Nm Band. J. Geophys. Res. 1997, 102, 4343–4352. [Google Scholar] [CrossRef]
- de Haan, G.; Jeanne, V. Robust Pulse Rate from Chrominance-Based RPPG. IEEE Trans. Biomed. Eng. 2013, 60, 2878–2886. [Google Scholar] [CrossRef]
- Wang, W.; den Brinker, A.C.; Stuijk, S.; de Haan, G. Algorithmic Principles of Remote PPG. IEEE Trans. Biomed. Eng. 2017, 64, 1479–1491. [Google Scholar] [CrossRef] [PubMed]
- Casado, C.A.; López, M.B. Face2PPG: An Unsupervised Pipeline for Blood Volume Pulse Extraction from Faces. arXiv 2022, arXiv:2202.04101. [Google Scholar] [CrossRef] [PubMed]
- Song, R.; Chen, H.; Cheng, J.; Li, C.; Liu, Y.; Chen, X. PulseGAN: Learning to Generate Realistic Pulse Waveforms in Remote Photoplethysmography. IEEE J. Biomed. Health Inform. 2021, 25, 1373–1384. [Google Scholar] [CrossRef]
- Unke, O.T.; Meuwly, M. PhysNet: A Neural Network for Predicting Energies, Forces, Dipole Moments and Partial Charges. J. Chem. Theory Comput. 2019, 15, 3678–3693. [Google Scholar] [CrossRef]
- Verkruysse, W.; Svaasand, L.O.; Nelson, J.S. Remote Plethysmographic Imaging Using Ambient Light. Opt. Express 2008, 16, 21434. [Google Scholar] [CrossRef]
- Kumar, M.; Veeraraghavan, A.; Sabharwal, A. DistancePPG: Robust Non-Contact Vital Signs Monitoring Using a Camera. Biomed. Opt. Express 2015, 6, 1565. [Google Scholar] [CrossRef] [PubMed]
- Yu, Z.; Yu, Z.; Li, X.; Li, X.; Zhao, G.; Zhao, G. Remote Photoplethysmograph Signal Measurement from Facial Videos Using Spatio-Temporal Networks. arXiv 2019, arXiv:1905.02419. [Google Scholar]
- Li, X.; Alikhani, I.; Shi, J.; Seppanen, T.; Junttila, J.; Majamaa-Voltti, K.; Tulppo, M.; Zhao, G. The OBF Database: A Large Face Video Database for Remote Physiological Signal Measurement and Atrial Fibrillation Detection. In Proceedings of the 2018 13th IEEE International Conference on Automatic Face & Gesture Recognition (FG 2018), Xi’an, China, 15–19 May 2018; IEEE: New York, NY, USA, 2018; pp. 242–249. [Google Scholar]
- Soleymani, M.; Lichtenauer, J.; Pun, T.; Pantic, M. A Multimodal Database for Affect Recognition and Implicit Tagging. IEEE Trans. Affect. Comput. 2012, 3, 42–55. [Google Scholar] [CrossRef]
- Hernandez-Ortega, J.; Nagae, S.; Fierrez, J.; Morales, A. Quality-Based Pulse Estimation from NIR Face Video with Application to Driver Monitoring. In Pattern Recognition and Image Analysis; Morales, A., Fierrez, J., Sánchez, J.S., Ribeiro, B., Eds.; Springer International Publishing: Cham, Switzerland, 2019; pp. 108–119. [Google Scholar]
- Yu, Z.; Shen, Y.; Shi, J.; Zhao, H.; Torr, P.; Zhao, G. PhysFormer: Facial Video-Based Physiological Measurement with Temporal Difference Transformer. In Proceedings of the 2022 IEEE/CVF Conference on Computer Vision and Pattern Recognition (CVPR), New Orleans, LA, USA, 18–24 June 2022; pp. 4176–4186. [Google Scholar] [CrossRef]
- Speth, J.; Vance, N.; Flynn, P.; Czajka, A. Non-Contrastive Unsupervised Learning of Physiological Signals from Video. arXiv 2023, arXiv:2303.07944v1. [Google Scholar]
- Chameleon3 USB3|Teledyne FLIR. Available online: https://www.flir.eu/products/chameleon3-usb3?vertical=machine+vision&segment=iis (accessed on 18 August 2023).
- Ubpulse 360-Sensor-Integrated Full Digital PPG (Pulse Wave) Sensor. Bluetooth/USB Simultaneous Communication. LAXTHA. Available online: https://laxtha.com/ProductView.asp?Model=ubpulse%20360# (accessed on 18 August 2023).
- Baltrušaitis, T.; Robinson, P.; Morency, L.-P. OpenFace: An Open Source Facial Behavior Analysis Toolkit. In Proceedings of the 2016 IEEE Winter Conference on Applications of Computer Vision (WACV), Lake Placid, NY, USA, 7–9 March 2016; pp. 1–10. [Google Scholar]
- Parsaoran, A.; Mandala, S.; Pramudyo, M. Study of Denoising Algorithms on Photoplethysmograph (PPG) Signals. In Proceedings of the 2022 International Conference on Data Science and Its Applications (ICoDSA), Bandung, Indonesia, 6–7 July 2022; pp. 289–293. [Google Scholar]
- Breiman, L. Random Forests. Mach. Learn. 2001, 45, 5–32. [Google Scholar] [CrossRef]
- Basak, D.; Pal, S.; Patranabis, D.C. Support Vector Regression. Neural Inf. Process. 2007, 11, 203–224. [Google Scholar]
- Huang, X.; Khetan, A.; Cvitkovic, M.; Karnin, Z. TabTransformer: Tabular Data Modeling Using Contextual Embeddings. arXiv 2020, arXiv:2012.06678. [Google Scholar]
- Gorishniy, Y.; Rubachev, I.; Khrulkov, V.; Babenko, A. Revisiting Deep Learning Models for Tabular Data. Adv. Neural Inf. Process. Syst. 2021, 34, 18932–18943. [Google Scholar]
- Hastie, T.; Tibshirani, R.; Friedman, J. The Elements of Statistical Learning; Springer Series in Statistics; Springer: New York, NY, USA, 2009; ISBN 978-0-387-84857-0. [Google Scholar]
- Nowara, E.M.; Marks, T.K.; Mansour, H.; Veeraraghavan, A. SparsePPG: Towards Driver Monitoring Using Camera-Based Vital Signs Estimation in Near-Infrared. In Proceedings of the 2018 IEEE/CVF Conference on Computer Vision and Pattern Recognition Workshops (CVPRW), Seattle, WA, USA, 18–23 June 2018; IEEE: Salt Lake City, UT, USA, 2018; pp. 1272–1281. [Google Scholar]
- Hodson, T.O. Root-Mean-Square Error (RMSE) or Mean Absolute Error (MAE): When to Use Them or Not. Geosci. Model Dev. 2022, 15, 5481–5487. [Google Scholar] [CrossRef]
- Wang, W.; den Brinker, A.C.; de Haan, G. Single-Element Remote-PPG. IEEE Trans. Biomed. Eng. 2019, 66, 2032–2043. [Google Scholar] [CrossRef] [PubMed]
- Othman, W.; Kashevnik, A.; Ryabchikov, I.; Shilov, N. Contactless Camera-Based Approach for Driver Respiratory Rate Estimation in Vehicle Cabin. In Intelligent Systems and Applications; Arai, K., Ed.; Springer International Publishing: Cham, Switzerland, 2023; pp. 429–442. [Google Scholar]
- Hwang, H.; Lee, K.; Lee, E.C. A Real-Time Remote Respiration Measurement Method with Improved Robustness Based on a CNN Model. Appl. Sci. 2022, 12, 11603. [Google Scholar] [CrossRef]
- Schrumpf, F.; Frenzel, P.; Aust, C.; Osterhoff, G.; Fuchs, M. Assessment of Deep Learning Based Blood Pressure Prediction from PPG and RPPG Signals. In Proceedings of the 2021 IEEE/CVF Conference on Computer Vision and Pattern Recognition Workshops (CVPRW), Nashville, TN, USA, 19–25 June 2021; IEEE: New York, NY, USA, 2021; pp. 3815–3825. [Google Scholar]
Figure 1.
Spectrum of solar radiation according to the wavelength range.

Figure 2.
Overall flow of proposed method.

Figure 4.
Depiction of the rPPG extraction method utilizing Green or DistancePPG prior to the implementation of the proposed screening technique.
Figure 4.
Depiction of the rPPG extraction method utilizing Green or DistancePPG prior to the implementation of the proposed screening technique.

Figure 5.
Illustration of the rPPG confidence measurement employed in the proposed rPPG screening method.
Figure 5.
Illustration of the rPPG confidence measurement employed in the proposed rPPG screening method.

Figure 6.
Facial segmentation for motion movement detection in various areas.

Figure 7.
Divided areas for illumination noise assessment feature extraction.

Figure 8.
Region of interest for signal-to-noise ratio extraction.

Figure 9.
Normalized error prediction of each person ID by different scenarios.

Figure 10.
Mean absolute error of each person ID by different scenarios (bpm).

Figure 11.
Detailed analysis of the motion with talk scenario in Subject 02. (a) Ground truth MAE presented in a bar graph, where red bars represent accepted regions and black bars represent abandoned regions, alongside the predicted MAE displayed in a dotted-line graph. (b) Comparison of cPPG and rPPG signals within the accepted area. (c) Comparison of cPPG and rPPG signals within the abandoned area.

Table 1.
Related rPPG works.
| Related Works | NIR Applicable | Screening Method | rPPG Extraction |
|---|---|---|---|
| Green [11] | ✓ | Face ROI detection | |
| DistancePPG [12] | SNR-based ROI selection | ||
| CHROM [6] | Chrominance | ||
| POS [7] | Chrominance | ||
| 3D CNN [13] | Supervised learning | ||
| Physformer [17] | Supervised learning | ||
| Speth, Jeremy et al. [18] | Unsupervised learning | ||
| Hernandez-Ortega, J. et al. [16] | ✓ | ✓ | Face ROI detection |
| Proposed method | ✓ | ✓ | SNR-based ROI selection |
Table 3.
Results of original methods and proposed methods.
| Algorithm | Still | Motion | Total | ||||
|---|---|---|---|---|---|---|---|
| PTE6 | MAPE | PTE6 | MAPE | PTE6 | MAPE | ||
| Without screening method | Green [10] | 39.89% | >15% | 29.98% | >15% | 34.97% | >15% |
| DistancePPG [11] | 54.08% | 9.97% | 45.44% | 13.13% | 50.43% | 11.53% | |
| Green with screening method (Ours) | Random Forest | 56.77% | 9.46% | 42.90% | 12.4% | 56.04% | 10.92% |
| SVR | 56.67% | 9.14% | 41.79% | 11.83% | 55.91% | 10.75% | |
| Transformer | 55.33% | 10.27% | 37.07% | >15% | 52.73% | 11.4% | |
| DistancePPG with screening method (Ours) | Random Forest | 65.44% | 7.76% | 59.31% | 8.54% | 57.04% | 8.94% |
| SVR | 61.26% | 8.14% | 56.09% | 9.16% | 62.27% | 8.63% | |
| Transformer | 60.29% | 8.23% | 48.13% | 11.73% | 54.61% | 9.45% | |
Table 4.
Results of proposed methods (decision tree, random forest) in person ID.
| Person ID | Decision Tree | Random Forest | ||||
|---|---|---|---|---|---|---|
| Still | Motion | Total | Still | Motion | Total | |
| Person 1 | 37.70% | 79.17% | 41.98% | 35.59% | 42.86% | 39.68% |
| Person 2 | 79.22% | 88.00% | 64.68% | 82.26% | 81.58% | 61.07% |
| Person 3 | 91.09% | 7.14% | 71.17% | 91.43% | 26.67% | 81.82% |
| Person 4 | 82.91% | 50.00% | 70.65% | 82.46% | 4.35% | 74.54% |
| Person 5 | 0.00% | 7.69% | 25.68% | 0.00% | 38.89% | 4.44% |
| Person 6 | 90.91% | 95.24% | 86.15% | 88.89% | 71.43% | 92.23% |
| Person 7 | 21.74% | 65.85% | 31.72% | 20.88% | 67.57% | 15.84% |
| Person 8 | 91.18% | 0.00% | 71.97% | 63.11% | 0.00% | 94.55% |
| Person 9 | 72.00% | 57.89% | 90.91% | 70.00% | 70.59% | 88.24% |
| Person 10 | 86.14% | 78.67% | 75.49% | 88.78% | 68.75% | 90.48% |
| Person 11 | 71.62% | 86.67% | 56.72% | 67.69% | 50.00% | 53.33% |
| Person 12 | 93.42% | 85.25% | 73.15% | 90.00% | 85.45% | 57.89% |
| Person 13 | 9.09% | 7.69% | 10.47% | 9.09% | 7.14% | 2.35% |
| Person 14 | 12.82% | 4.76% | 19.30% | 37.10% | 14.29% | 14.93% |
| Person 15 | 20.69% | 16.67% | 21.78% | 18.75% | 46.67% | 15.09% |
| Person 16 | 84.48% | 54.55% | 89.07% | 85.42% | 60.00% | 54.86% |
| Person 17 | 58.14% | 100.00% | 34.29% | 58.14% | 57.14% | 49.00% |
| Person 18 | 92.16% | 39.13% | 37.00% | 59.70% | 20.00% | 50.00% |
Table 5.
Results of proposed methods (SVR, transformer) in person ID.
| Person ID | SVR | Transformer | ||||
|---|---|---|---|---|---|---|
| Still | Motion | Total | Still | Motion | Total | |
| Person 1 | 31.11% | 50.00% | 41.30% | 18.18% | 45.61% | 54.55% |
| Person 2 | 76.09% | 100.00% | 77.08% | 36.36% | 70.97% | 87.50% |
| Person 3 | 84.00% | 0.00% | 89.58% | 91.67% | 7.02% | 75.00% |
| Person 4 | 72.00% | 46.15% | 98.00% | 50.00% | 23.33% | 72.00% |
| Person 5 | 8.70% | 100.00% | 0.00% | 63.36% | 33.87% | 16.67% |
| Person 6 | 97.83% | 100.00% | 93.75% | 100.00% | 91.80% | 65.21% |
| Person 7 | 28.00% | 23.08% | 22.00% | 33.33% | 62.30% | 37.50% |
| Person 8 | 88.00% | 30.77% | 94.00% | 50.00% | 11.48% | 8.33% |
| Person 9 | 54.00% | 100.00% | 50.00% | 25.00% | 57.38% | 79.17% |
| Person 10 | 94.00% | 83.33% | 94.00% | 100.00% | 66.67% | 62.50% |
| Person 11 | 76.47% | 42.86% | 82.35% | 84.62% | 71.43% | 68.00% |
| Person 12 | 95.56% | 78.57% | 87.50% | 100.00% | 68.25% | 83.33% |
| Person 13 | 20.00% | 0.00% | 4.35% | 18.18% | 18.97% | 47.83% |
| Person 14 | 21.28% | 30.77% | 12.77% | 33.33% | 24.56% | 34.78% |
| Person 15 | 8.89% | 41.67% | 8.70% | 54.55% | 19.30% | 18.18% |
| Person 16 | 85.11% | 25.00% | 93.48% | 75.00% | 65.45% | 45.45% |
| Person 17 | 57.78% | 83.33% | 64.44% | 54.55% | 90.91% | 63.64% |
| Person 18 | 93.88% | 69.23% | 95.92% | 91.67% | 33.33% | 58.33% |
Disclaimer/Publisher’s Note: The statements, opinions and data contained in all publications are solely those of the individual author(s) and contributor(s) and not of MDPI and/or the editor(s). MDPI and/or the editor(s) disclaim responsibility for any injury to people or property resulting from any ideas, methods, instructions or products referred to in the content. |
© 2023 by the authors. Licensee MDPI, Basel, Switzerland. This article is an open access article distributed under the terms and conditions of the Creative Commons Attribution (CC BY) license (https://creativecommons.org/licenses/by/4.0/).
Share and Cite
MDPI and ACS Style
Lee, K.; Kim, S.; An, B.; Seo, H.; Park, S.; Lee, E.C. Noise-Assessment-Based Screening Method for Remote Photoplethysmography Estimation. Appl. Sci. 2023, 13, 9818. https://doi.org/10.3390/app13179818
AMA Style
Lee K, Kim S, An B, Seo H, Park S, Lee EC. Noise-Assessment-Based Screening Method for Remote Photoplethysmography Estimation. Applied Sciences. 2023; 13(17):9818. https://doi.org/10.3390/app13179818
Chicago/Turabian StyleLee, Kunyoung, Seunghyun Kim, Byeongseon An, Hyunsoo Seo, Shinwi Park, and Eui Chul Lee. 2023. "Noise-Assessment-Based Screening Method for Remote Photoplethysmography Estimation" Applied Sciences 13, no. 17: 9818. https://doi.org/10.3390/app13179818
Note that from the first issue of 2016, this journal uses article numbers instead of page numbers. See further details here.