

Interlayer Isolation Structures Considering Soil–Structure Interaction under Long-Period Ground Motions: An Experimental Analysis
1
Key Laboratory of Earthquake Engineering and Engineering Vibration, Institute of Engineering Mechanics, Haerbin 150080, China
2
Key Laboratory of Earthquake Disaster Mitigation, Ministry of Emergency Managements, Harbin 150080, China
3
School of Civil Engineering and Architecture, Southwest University of Science and Technology, Mianyang 621010, China
4
Fujian Architectural Design and Research Institute Co., Ltd., Fuzhou 621010, China
5
College of Civil Engineering, Fuzhou University, Fuzhou 350108, China
*
Author to whom correspondence should be addressed.
Appl. Sci. 2023, 13(16), 9090; https://doi.org/10.3390/app13169090
Submission received: 4 July 2023
/
Revised: 2 August 2023
/
Accepted: 5 August 2023
/
Published: 9 August 2023
(This article belongs to the Special Issue Advanced Research in Seismic and Dynamic Engineering for Structures and Infrastructures)
Abstract
:After coupling long-period seismic motions with the soil–structure interaction (SSI) effect, isolated structures can easily be resonated, and the seismic response of the structure is significantly enhanced. The SSI effect can alter the dynamic characteristics of a structure, resulting in a deviation between the assumed seismic-isolation effect of the rigid foundation and the theoretical results. To investigate the dynamic characteristics and seismic-response laws of interlayer structures considering SSI under long-term seismic motion, four types of ground motions (near-field ordinary, far-field ordinary, near-field pulse, and far-field harmonic ground motions) were selected, and two structural models (rigid-foundation and soft soil foundation interlayer seismic-isolation structure models) were established. Experiments were conducted using a combination of shaking-table tests and finite-element simulations. The results show that the use of the SSI effect caused the decrease in the acceleration response of the upper structure of both models under four types of seismic motions and increased the seismic peak ground acceleration (PGA). In addition, the weakening of the acceleration response of the upper structure under ordinary seismic motion is significant for longer periods of seismic motion. Furthermore, when considering the SSI effect, the displacement response ratio under long periods and ordinary ground motions is greater than that of rigid foundations, and the horizontal deformation of the isolation layer under long-period ground motions is greater than that under ordinary ground motions. This shows that the SSI effect weakens the interlayer shear force under ordinary seismic action more than that under long-period seismic action. When PGA increases, the interlayer shear force response of the interlayer isolation structure model with a soft soil foundation under a long-period seismic action may be smaller than that of the rigid-foundation model.
1. Introduction
In recent years, studies have determined that seismic buildings located far from the earthquake-source produce strong seismic responses [1,2,3]. The ground motion of a component is rich for a long period, and this type of natural long vibration periods easily cause isolation structure resonance and enhance its seismic response; therefore, the potential of the damaging ability of long-period ground motions should be seriously considered [4]. The current research on interlayer isolation structures is mostly based on the assumption of rigid foundations while ignoring the influence of soil–structure interaction (SSI) effects on isolation structures [5]. The use of a deep soft soil foundation could change the characteristics of ground motion, increase structural damping, and enhance the structure itself over an extended period; this in turn may affect the dynamic reaction of the seismic-isolation structure, causing a large deviation between the actual seismic responses of the isolated structures created using soft- and rigid-foundation soils [6,7,8].
Rocha et al. [9] analyzed the dynamic response of the isolation structure by considering the SSI by simulating the foundation with springs and dampers, and they pointed out that the SSI effect obviously increased the displacement and shear force of the bottom layer of the isolation structure. By establishing the lumped parameter SR model, Changping et al. [10] derived a mathematical formula suitable for analyzing soil-isolation structure interaction and verified its applicability through numerical examples, pointing out that the SSI effect showed a greater impact on high-rise isolation structures than on mid–low isolation structures. Based on Changping’s research results, Xu et al. [11] improved the simplified analysis method of interlayer shear force and interlayer deformation of a soil-isolated structure. The results of their theoretical analysis showed that the influence of the rotation effect of the isolation layer on the interlayer shear of the isolation structure should be considered only in the case of large earthquakes. Tsai et al. [12] used the isolation structure model of the soil–friction pendulum system to study the structural dynamic response, and the results showed that SSI effect enhanced the seismic response of isolated structures. Xu and Hongjie et al. [13,14] used the ABAQUS software (version 2021) to build a three-dimensional finite-element model to numerically analyze the seismic response of soil-isolation structures with isolation supports. They stated that the utilization of the SSI effect makes the entire isolation system more flexible, its natural vibration frequency slightly decreases, and its seismic response increases substantially. Haiyang et al. [15,16] further compared the seismic responses of isolation structures among rigid, hard soil and soft interlayer foundations using the shaking-table test. The results showed that the SSI effect has different influences on the seismic responses of the isolated structures under different foundations; however, the effect on hard soil seismic-isolation structures was not obvious. Wu et al. [17] studied the seismic-response characteristics and isolation effects of interlayer isolation structures under the rigid and soft soil foundation conditions using the shaking-table test. Their results showed that the natural vibration frequency and isolation efficiency of the isolated structures decreased significantly while the damping ration increased significantly with the softening of the foundation soil. Liying et al. [18] conducted a bidirectional shaking-table test of eccentric-foundation isolation structures with rigid and soft soil foundations. The results showed that the interlayer torsional response of the isolation structure decreases to some extent while the torsion angle of the isolation layer increases significantly when considering the SSI effect.
In summary, theoretical and numerical simulation studies on soil-isolation structure interactions have advanced, and the corresponding model tests have progressed. However, most of the relevant studies are based on the type of foundation isolation, and few have been conducted on interlayer isolation structures. Nevertheless, studies on the seismic-response laws of interlayer isolation structures coupled with long-period ground motions and the SSI effect are insufficient and lack data supported by the shaking-table test.
In this study, the shaking-table test and numerical simulation were used to investigate the seismic-response changes of rigid interlayer isolation models and soft soil interlayer isolation models under near-field pulse, far-field quasi-harmonic ground motions (collectively referred to as long-period ground motions), and near- and far-field ordinary ground motions (collectively referred to as ordinary ground motions). The research results can effectively support the construction of seismic-isolation buildings on a deep soft soil foundation in the coastal area of southeast China, and the application range of the propose methods can be expanded to building isolation technology.
2. Design of the Shaking-Table Test of the Pile–Soil-Layer Interval Seismic Structure
2.1. Test Prototype Structure and Similar Relationship
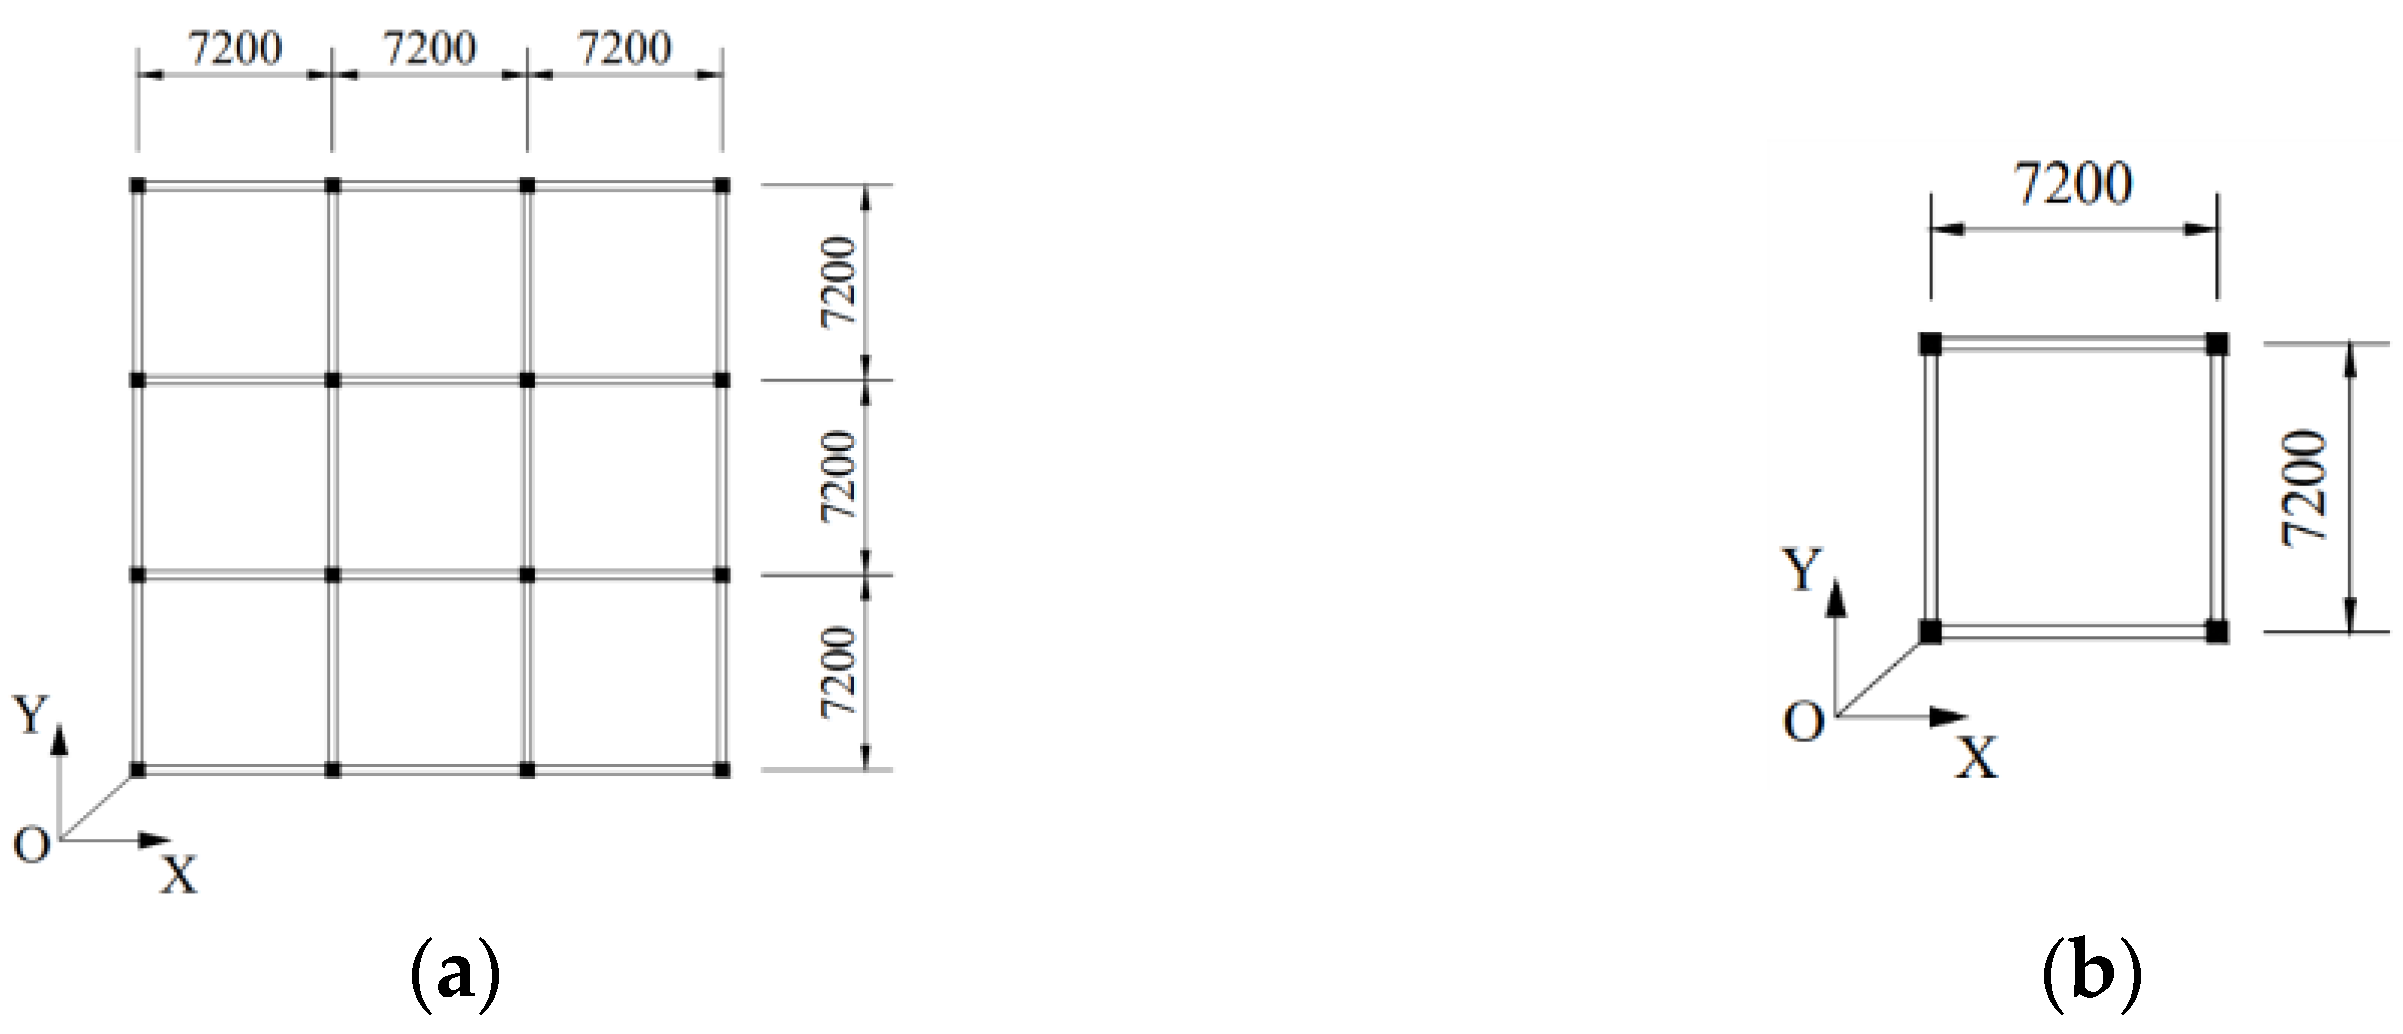
A typical and engineering planar-rule building was used, as shown in Figure 1a. Next, experimental models were designed and developed after simplification. In this study, we analyzed the stress characteristics of this type of architecture under the non-isolated and interlayer-isolated conditions under the horizontal (x) and bidirectional seismic actions. The lower substructure was a three span in horizontal and longitudinal directions, the column grid was 7.2 m × 7.2 m, and the substructure had two floors with a two-story height of 4.8 m. The upper substructure was also a three span in the horizontal and longitudinal directions, with a column grid of 7.2 m × 7.2 m, and six floors with a two-story height of 3.3 m. The total height of the building was 29.4 m. The upper and lower substructures have a 1:1 plane area ratio. The aspect ratio of the upper substructure was 1:2.75. The building’s seismic-fortification intensity was 8° (0.2 g), the construction site was classified as a class Ⅲ, and the earthquake types are grouped into the second group. The standard values of the live load of the lower and upper substructures were 3.5 and 2.0 kN/m2, respectively. The concrete strength grade of the building ranged from C30 to C35. The cross-sectional dimensions of the lower and upper substructure frame columns were 600 mm × 600 mm and 500 mm × 500 mm, respectively, and the frame beam was 300 mm × 700 mm. The thickness of the isolation plate was 160 mm, and the thickness of the other slab was 120 mm. As the maximum board size of the vibration table was 4 m × 4 m, the maximum bearing capacity was only 22 t. Therefore, the size and quality of the prototype structure should be simplified; however, the dynamic response characteristics of the simplified structure should be kept constant. The simplified structure is shown in Figure 1b.
The parameters of the test model could not fully satisfy or were not the same as the parameters of the prototype structure system because of the use of various materials. Therefore, the main parameters of the soil-isolation structure system were the same as those used in the prototype structure system, and the secondary parameters were almost similar. Combined with the test conditions and material performance, the principle of the vibration stress of the isolation and the dynamic responses of the soil were met. The acceleration, length, and elastic modulus were the basic similar parameters, with the similarity ratios of the length and acceleration ratio being Sl = 1/12 and Sa = 1, respectively, and similarity ratios of the structure and soil being SE = 1 and SE = 1/4, respectively. In addition, the similarity ratios of the other physical quantities were derived according to Bockingham’s π theorem. The similarity coefficients of the model are listed in Table 1.
2.2. Model Scale Design
A steel-framed model was used in this study, with Q235 hollow square steel used as the steel column and beam with dimensions of 50 mm × 50 mm × 50 mm, and a flat steel plate with a thickness of 10 mm was used. The substructure of the model was 2, with a height of 400 mm. As the characteristics of the upper substructure in seismic action was translation, to facilitate the development of the production model and the vibration table test, the upper substructure was reduced to three layers from its original six layers, with the height of 550 mm. The model was single spanned in both the vertical and horizontal directions, with a size of 600 mm × 600 mm. The upper and lower substructure models were composed of a steel column, steel beam, and steel plate, each welded together. Both these models were created separately, and four seismic supports were assembled in the pre-welded steel plates to be assembled into a layer interval shock model before the experiment. The experimental excitation direction was divided into x and y forms, and the model structure and size are shown in Figure 2. The total quality of the model framework was approximately 0.30 t. After the quality similarity ratio was converted, each layer had to weigh 0.40 t to allow for the total weight of the model to be approximately 2.70 t.
2.3. Pile Foundation Design and Production
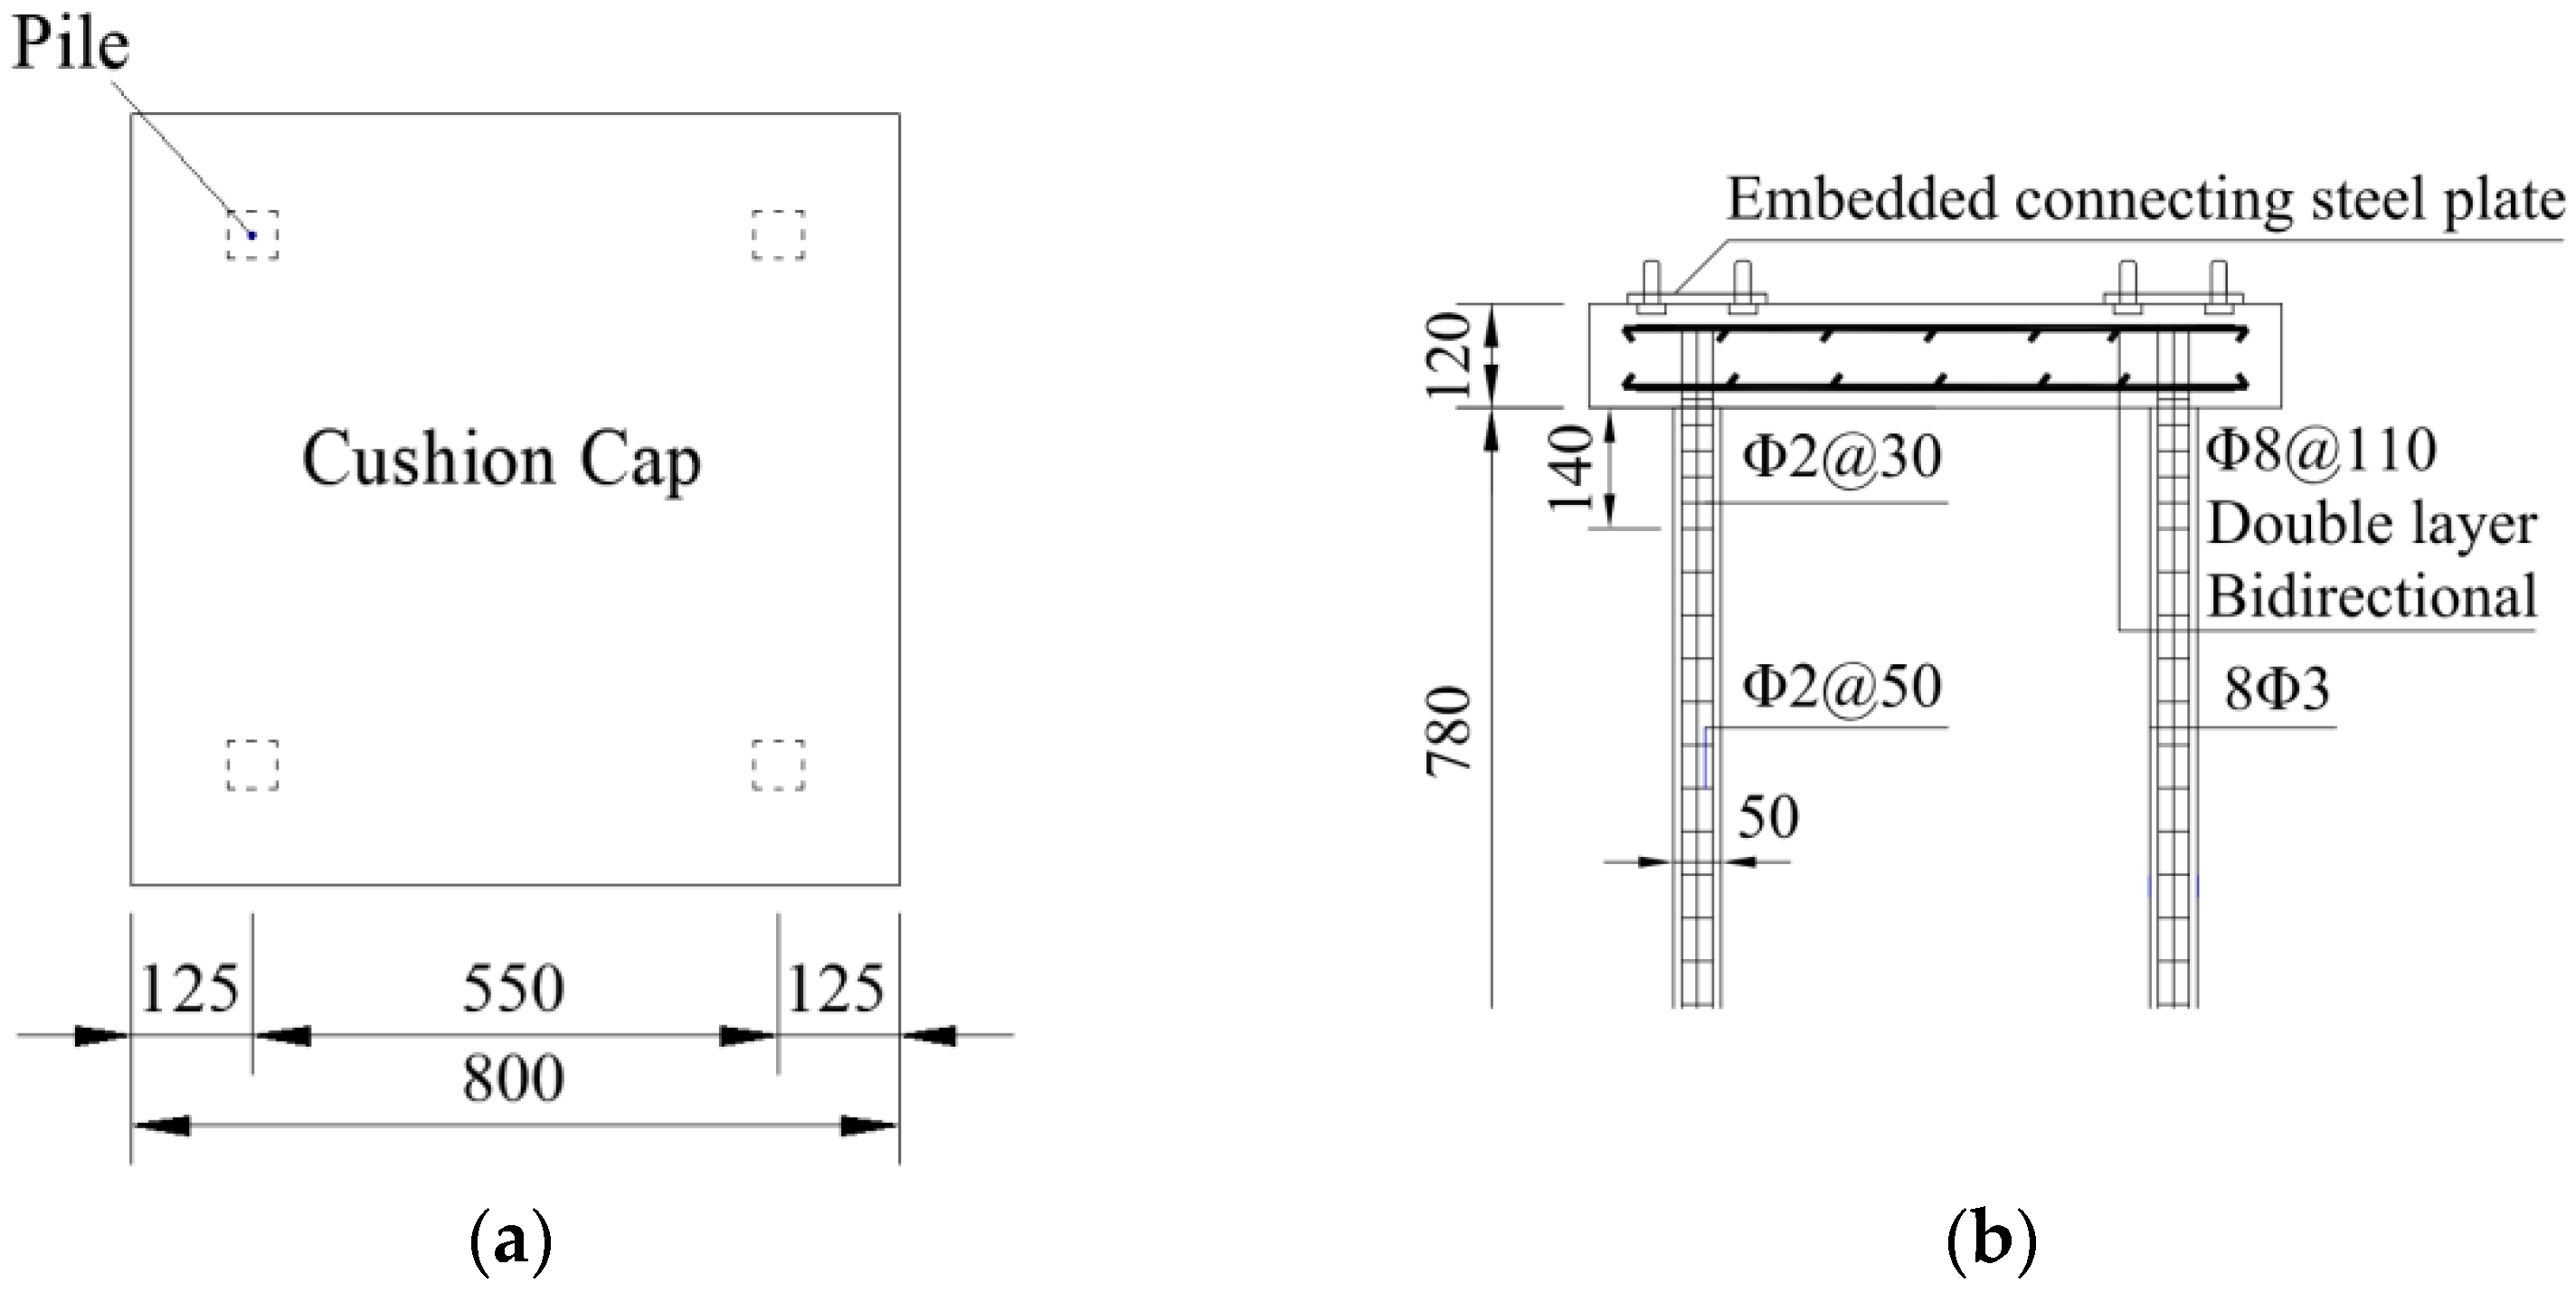
The model foundation included the current concrete pile foundation. The steel reinforced frame was made up of galvanized steel wire and steel bindings, and the concrete resistance was C30. The size of the square pile bearing platform was 0.8 m × 0.8 m × 0.12 m. By comprehensively considering multiple factors, such as the length–diameter ratio, and pile and soil contact surface products, the length of the design pile was 780 mm, and the dimension of the pile was 50 mm × 50 mm. The socket and pile foundation are shown in Figure 3. This study was aimed at analyzing the law of the seismic response of the structure at every layer; the bearing capacity of the pile foundation was strengthened to prevent pile failure in the trial process.
2.4. Isolation Bearing
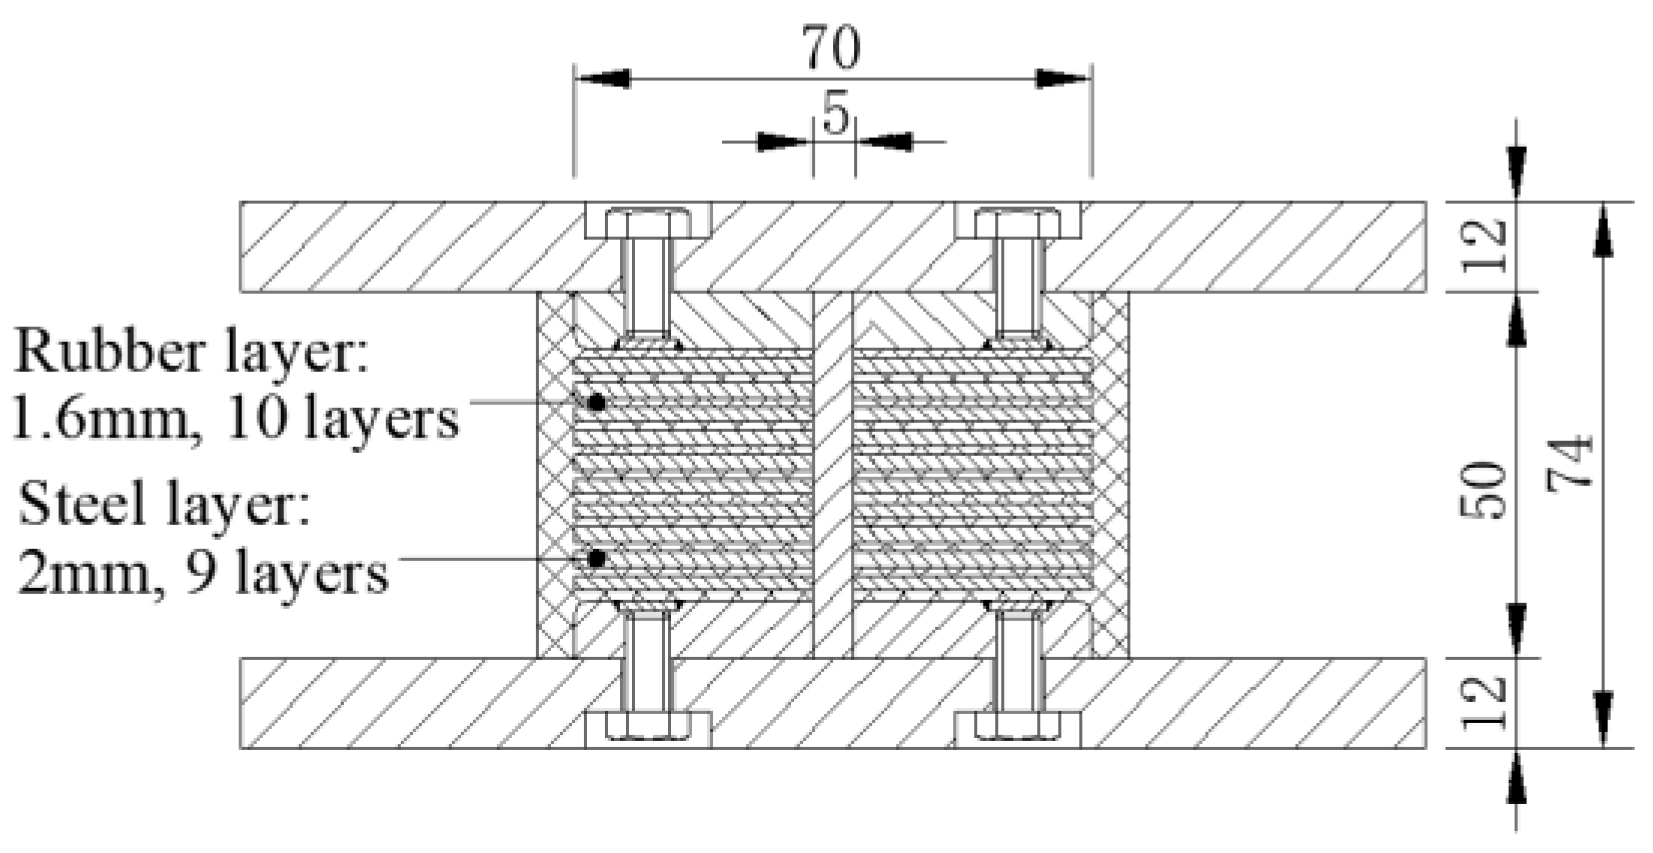
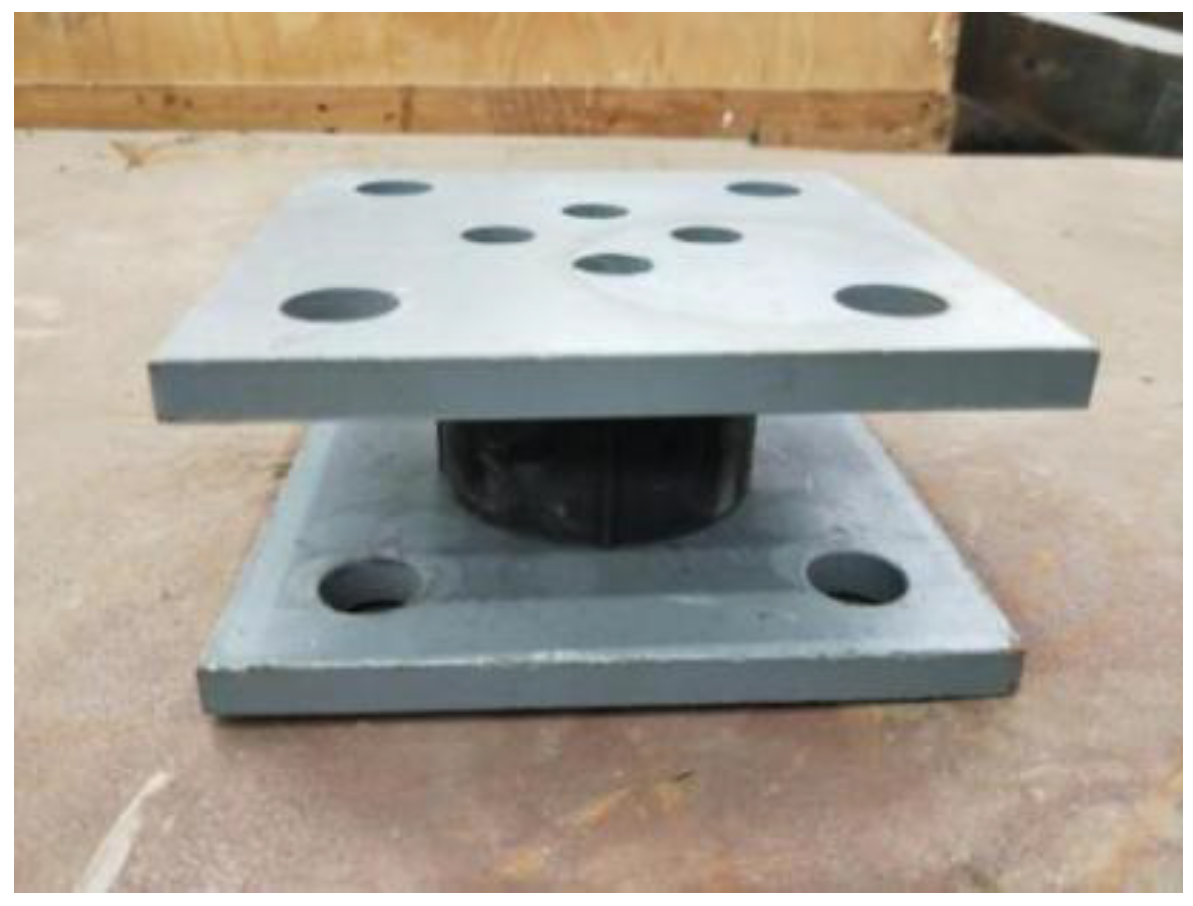
This paper presents a comprehensive research on the vibration isolation structure using the shaking-table test, along with the quality of the steel frame, similarity relations of the horizontal and vertical surface-pressures to factors, such as the damping coefficient and LRB technology. The test model has a diameter of 70 mm and comprises four lead rubber bearings (LRB70-5). Figure 4 shows the structure and size of the LRB figure, Figure 5 displays the physical figure, and Table 2 lists the size and mechanical properties of the LRB structure.
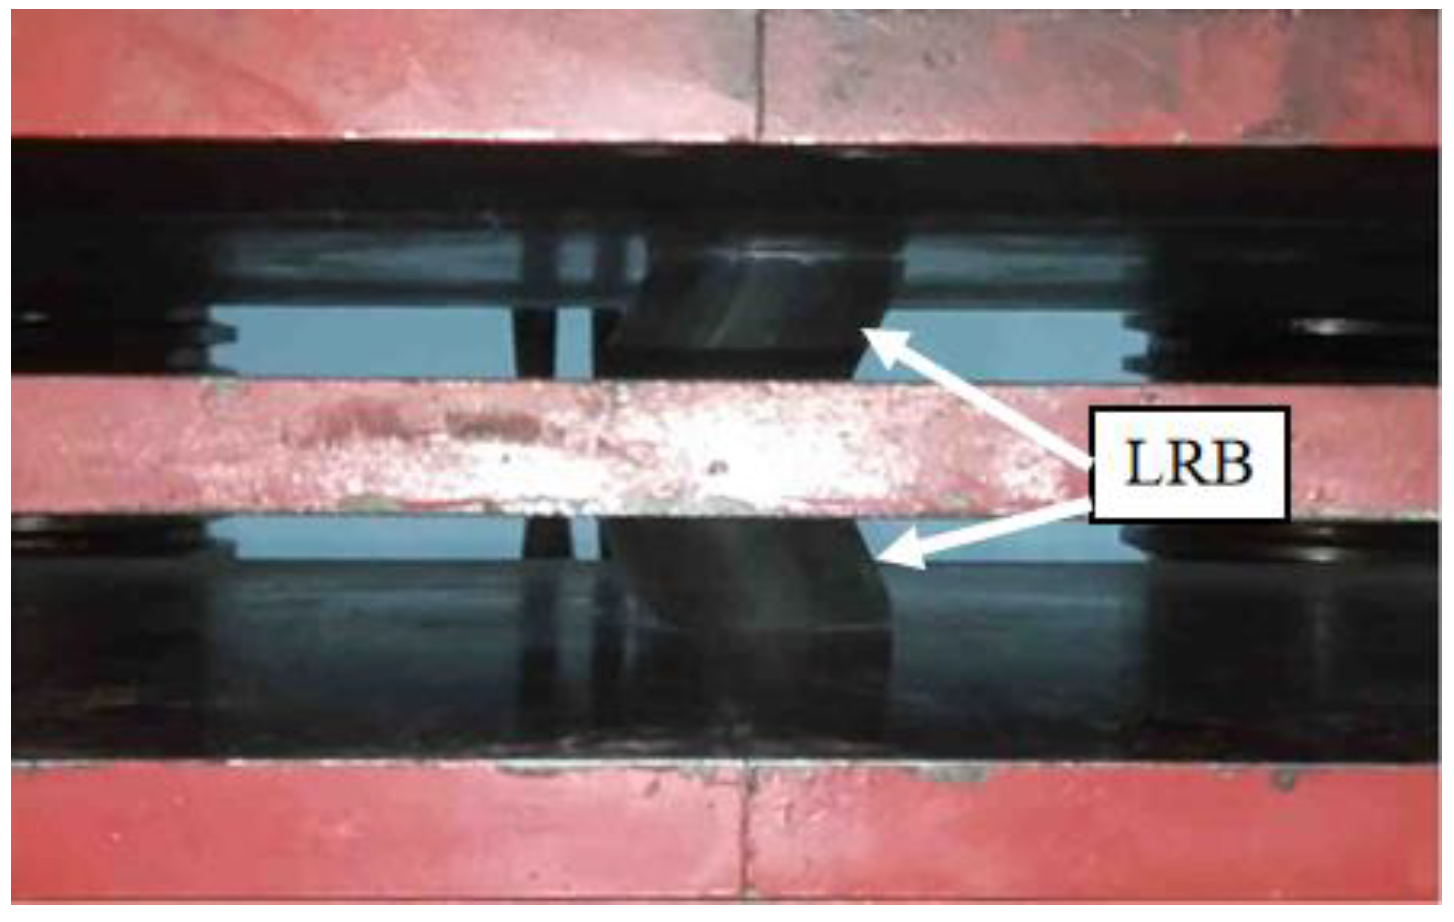
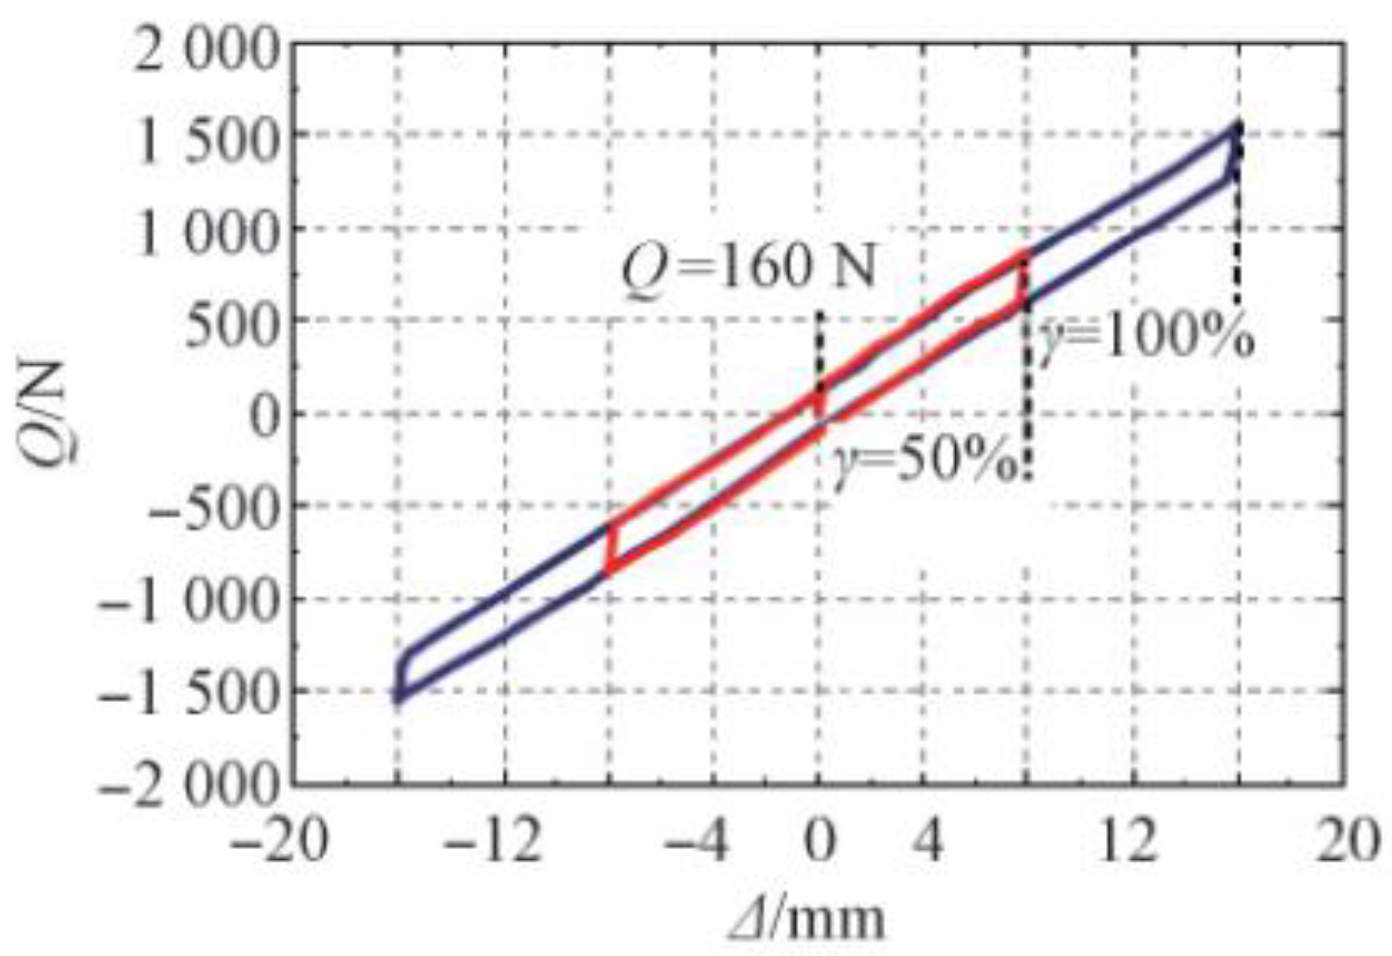
To verify that the test using LRB70-5 level stiffness could meet the requirements, YJW-10000-type electrohydraulic servo pressure shear-testing machine was used on the same level to the compression-shear tests LRB70-5, as shown in Figure 6. Displacement of the diaphragm with respect to the control variables of the test was 8 and 16 mm corresponding to the displacement ratio for the LRB70-5 levels to shear strain of 50% and 100% for the equivalent level of first degrees. The experimental results showed that the LRB70-5 levels to the average shear strain of 100% when the equivalent level of rigidity is 0.091 kN/mm. The hysteresis curve is shown in Figure 7.
2.5. Soil Box Design and Production
In practical engineering, the boundary of foundation soil is infinite; however, the volume and mass of model soil in the test were limited, resulting in the finite boundary of model soil during then shaking-table test. To reflect the seismic wave effect in the test, the soil in the soil box must be as high as possible. However, limited by the maximum bearing capacity of the shaking table of 215 kN, the plane size of the model soil had to be adjusted and the soil volume had to be reduced, thus reducing the mass of the soil. Therefore, before the shaking-table test, it was necessary to design a limited and more suitable soil box to fill the clay so as to eliminate the boundary effect of the limited boundary soil. However, the artificial boundary might have affected the reflection, transmission, refraction, and scattering of the ground motions and restrict the free deformation of the model soil. In summary, the test soil box had to meet three conditions: first, the boundary conditions of model soil were close to the actual soil. The shear deformation of the model soil was close to that of the actual soil [19]. The height of the model soil was increased as much as possible while the volume was reduced thus reducing the total mass of the model soil.
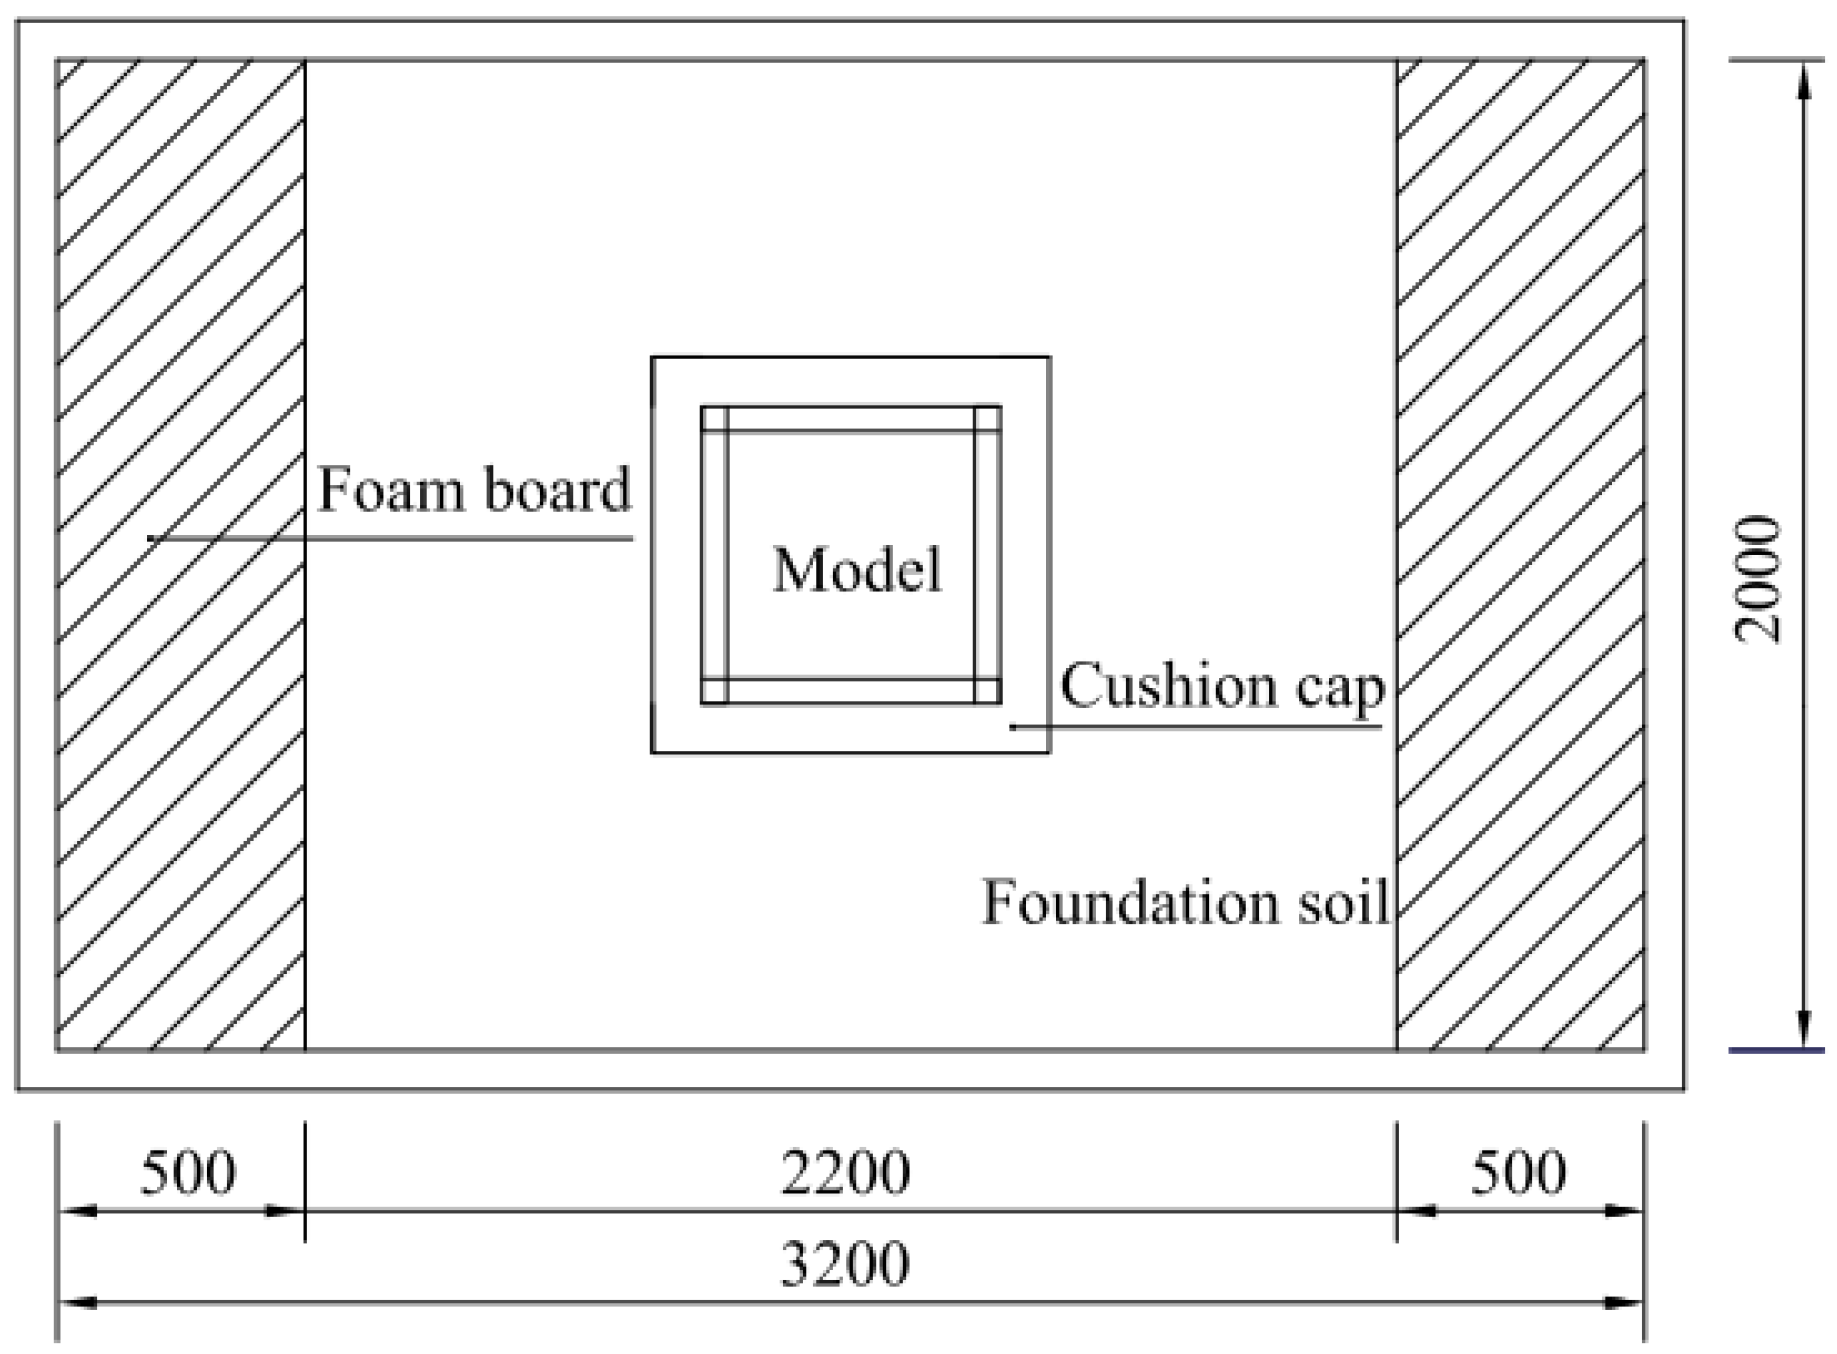
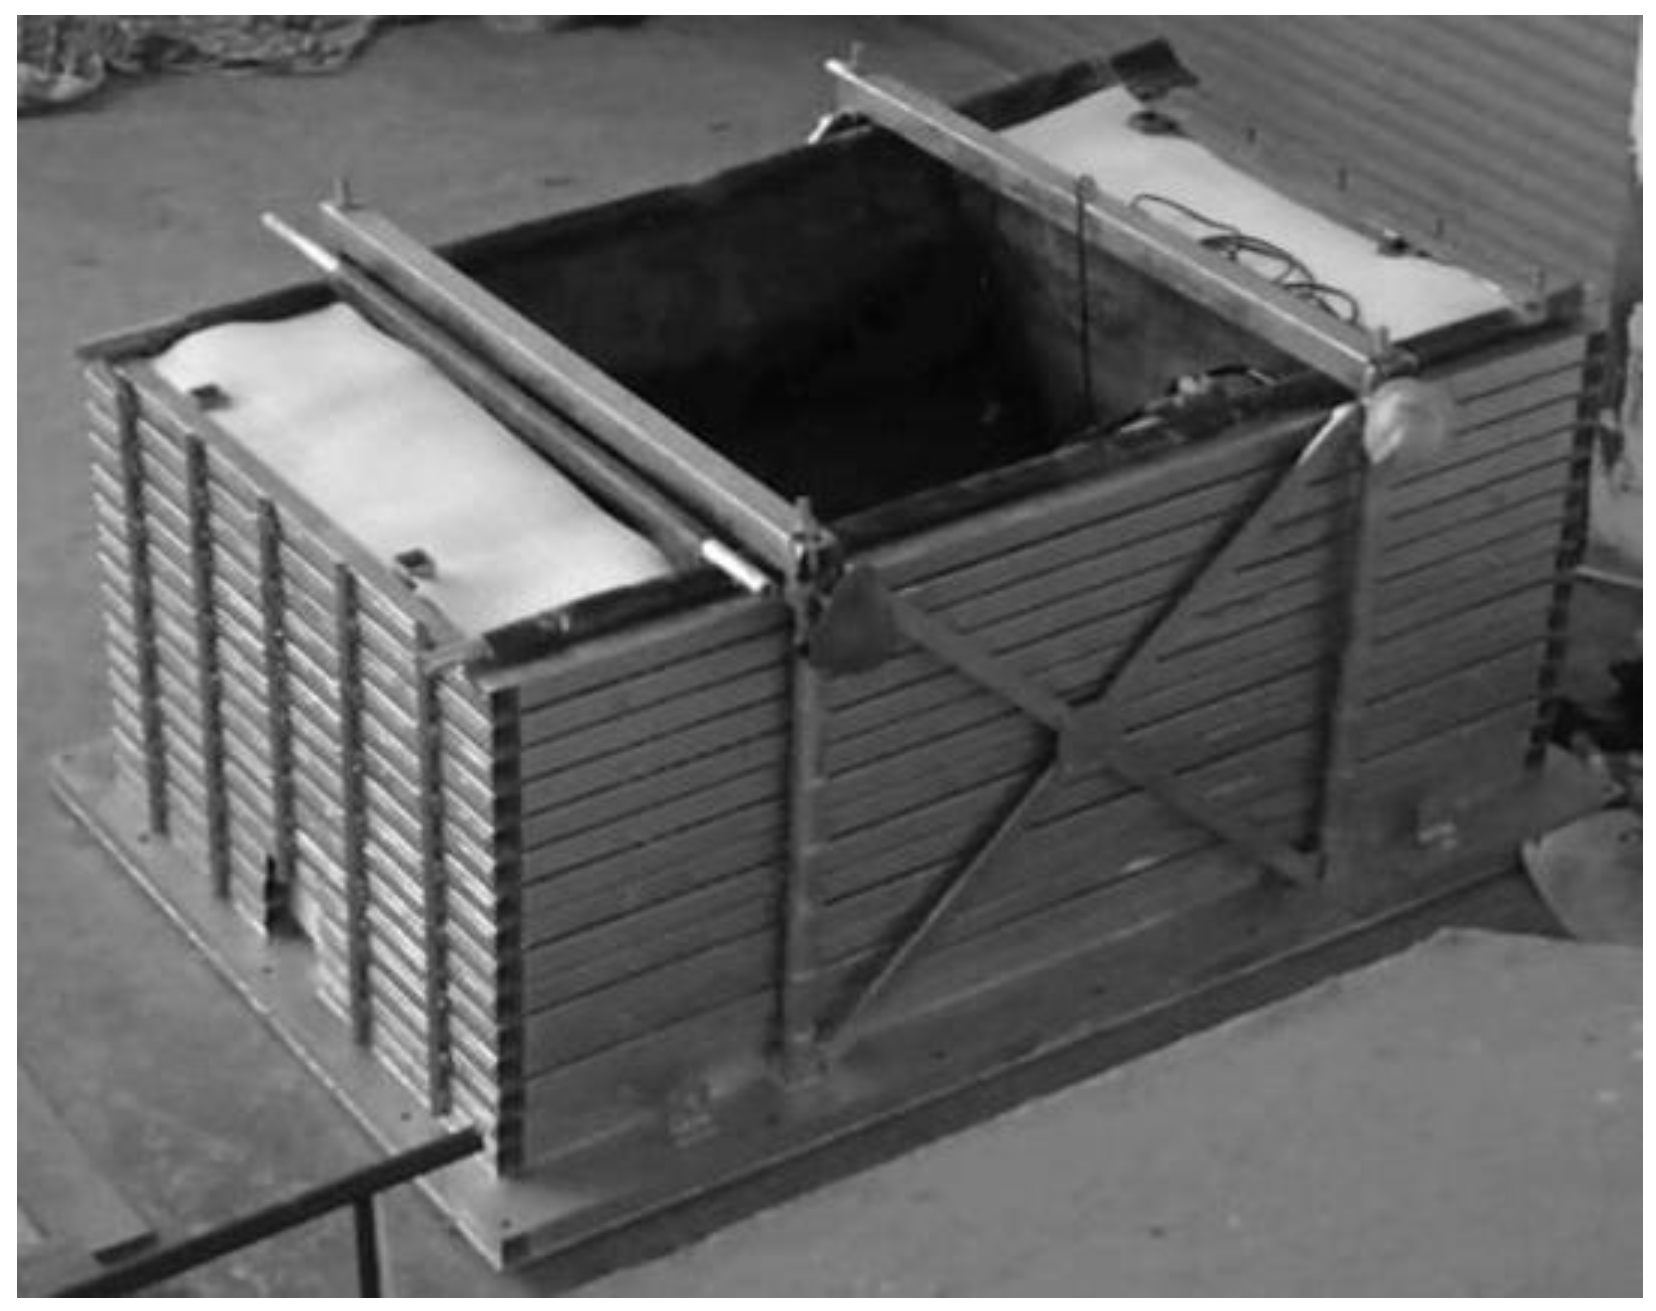
A layered shear soil box with a net size of 3.2 m (X-direction) × 2 m (Y-direction) × 1.4 m (Z direction) was developed based on factors such as the shaking-table surface size of 4 m × 4 m and the ultimate bearing capacity of 215 kN. To achieve the goal that the model soil in the soil box was as high as possible but the total mass of the soil was reduced, foam boards were filled on both sides of the soil box. Thus, the long side of the original 3.2 m was adjusted to 2.2 m, and the short side size remained unchanged. The position plane of the soil box and cap after the foam board is shown in Figure 8, and the photos of the soil box on site are shown in Figure 9.
2.6. Preparation of Model Soil
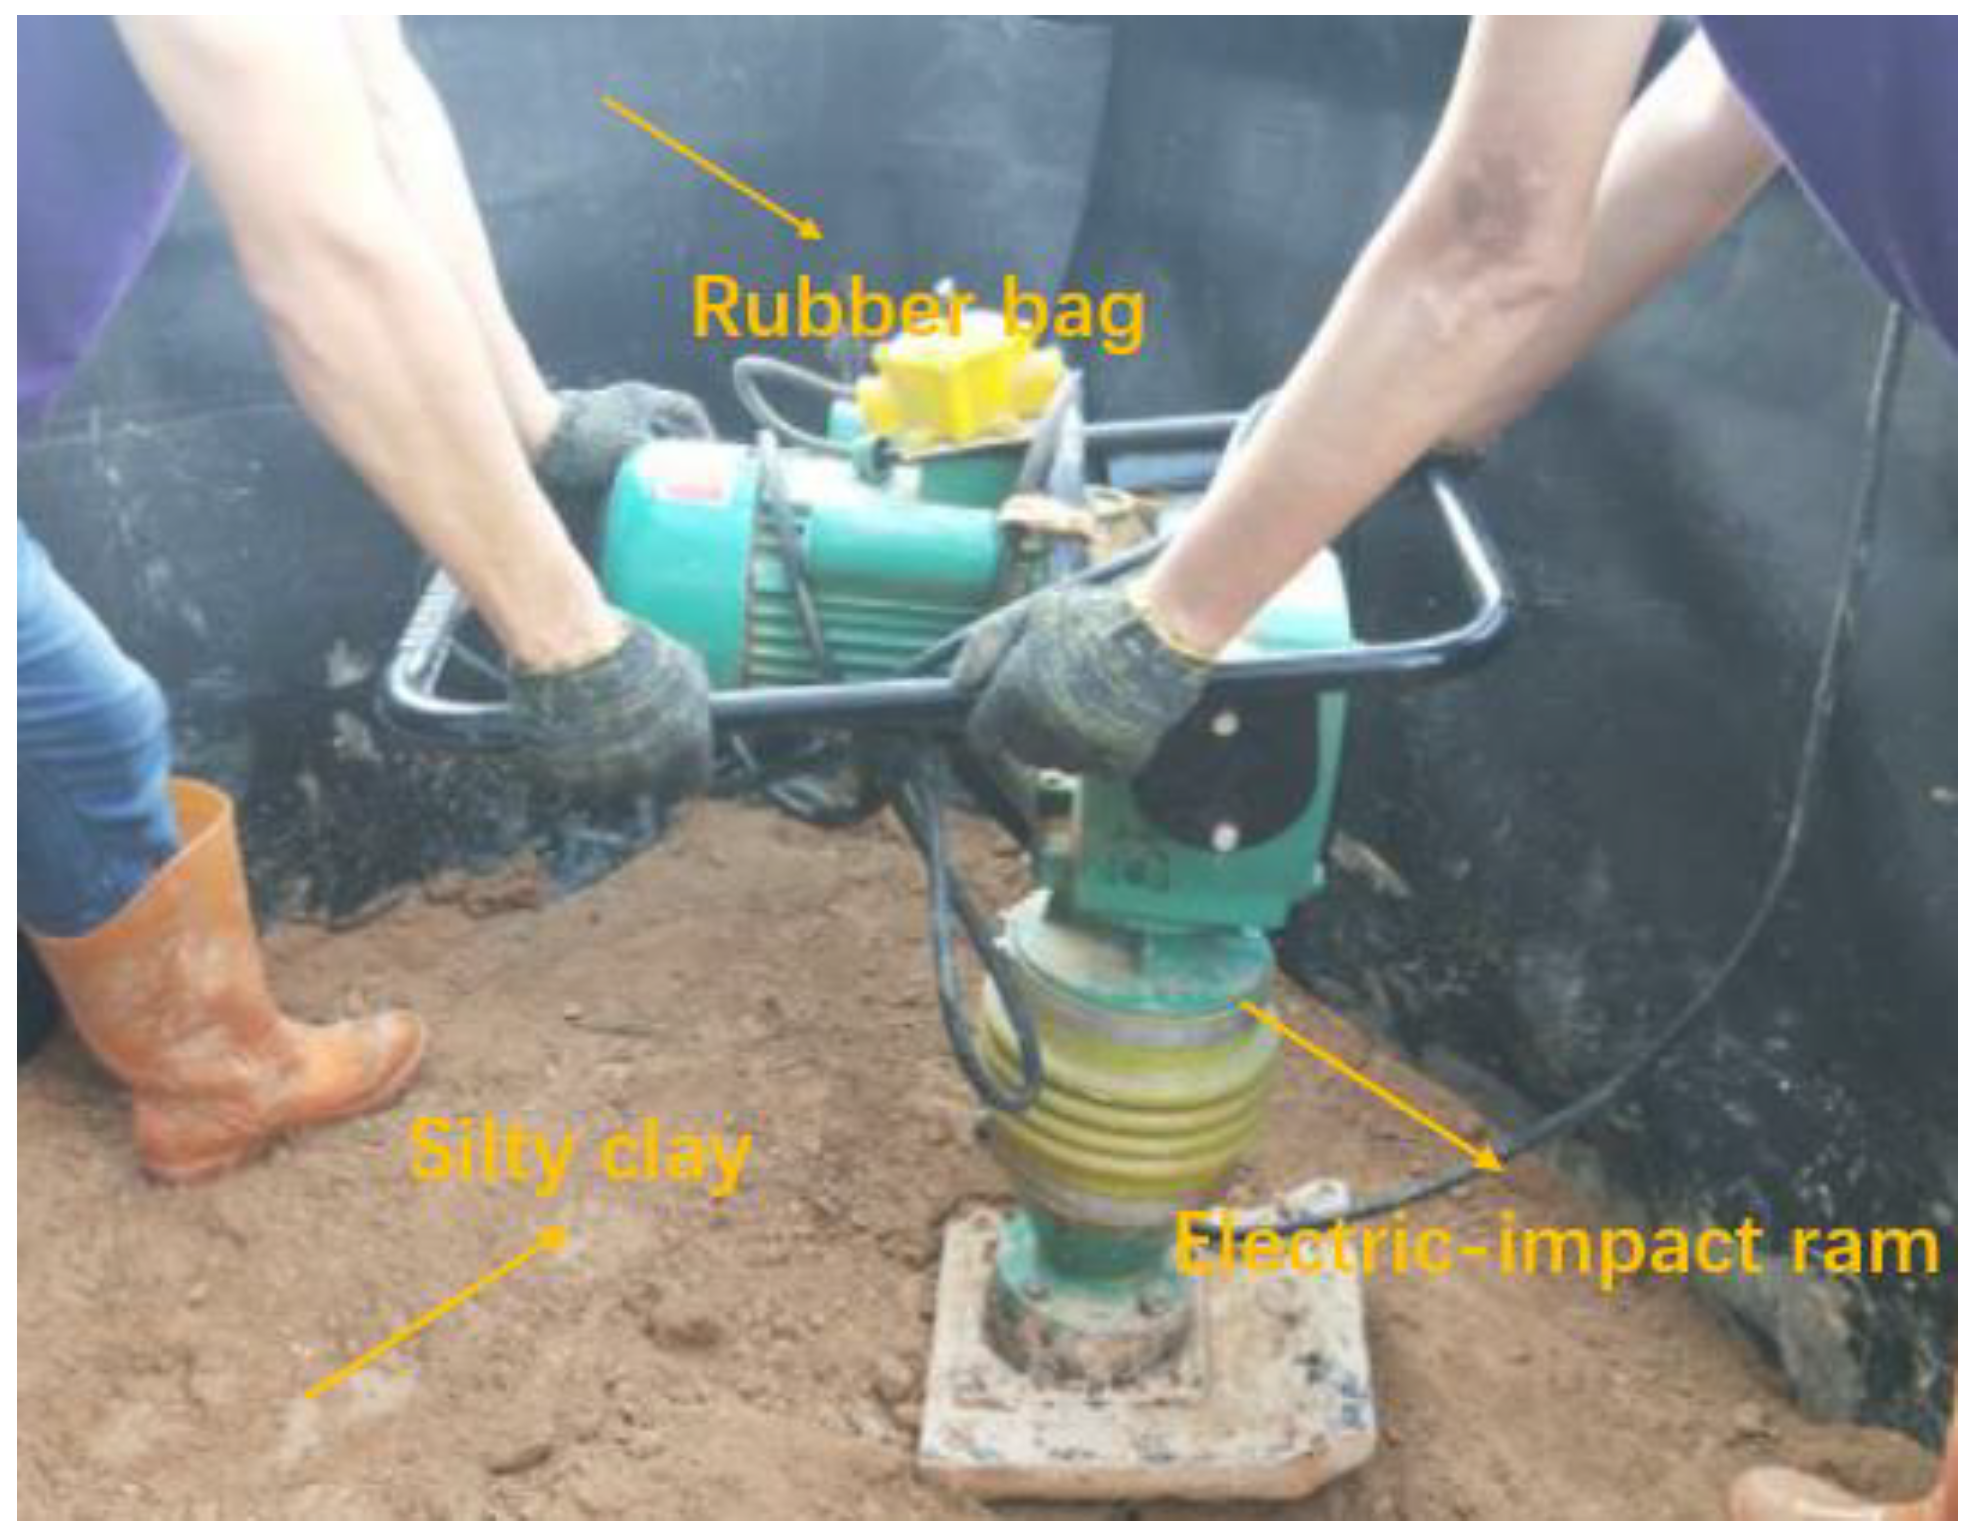
The test foundation was prepared with uniform silty clay. A 20-mm-thick rubber bag was placed in the soil box to prevent the water and silty clay added during the filling of the soil box from flowing out of the cracks in the soil box. Moreover, in [20], the authors verified that the rubber bag can better eliminate the boundary effect of the soil box through the shaking-table test.
The total height of the model soil was 1.4 m. Before the test, the water content and compactness of the model foundation were controlled using the layering compaction method and a simultaneous geotechnical test. The filling of the model foundation was divided into eight layers, with the two bottom layers measuring 250 mm and the remaining six layers measuring 150 mm. After filling each layer of the foundation soil, a large amount of water was added and allowed to stand for seven days to retain the model soil in a plastic state. Then, the foundation soil was sampled and geotechnical tests were conducted to measure parameters, such as water content, density, and plastic liquid limit. With reference to the test results in [21], the mechanical property parameters of each layer of the foundation soil were controlled to ensure that the model foundation conforms to the test conditions of the soft soil foundation. Then, the next layer of soil was filled. When manually filling the bottom two layers of the foundation soil, electric impact ramming was used to consolidate the soil so that the bottom model soil layer could meet the requirements of being the supporting layer of the pile foundation. Figure 10 shows the soil mass developed through electric-impact ramming. In practical engineering, the soil around the pile was compacted with a rubber hammer to simulate the compaction of the soil at the pile side.
The Poisson’s ratio of the model foundation soil was 0.35 according to the Engineering Geology Manual of China [22]. In addition, the shear wave velocity of the soil was approximately 60 m/s according to the results of the white-noise test obtained from the shaking table below, and the elastic modulus of the soil was 20 MPa according to reference [23]. The physical indexes of soil samples are shown in Table 3.
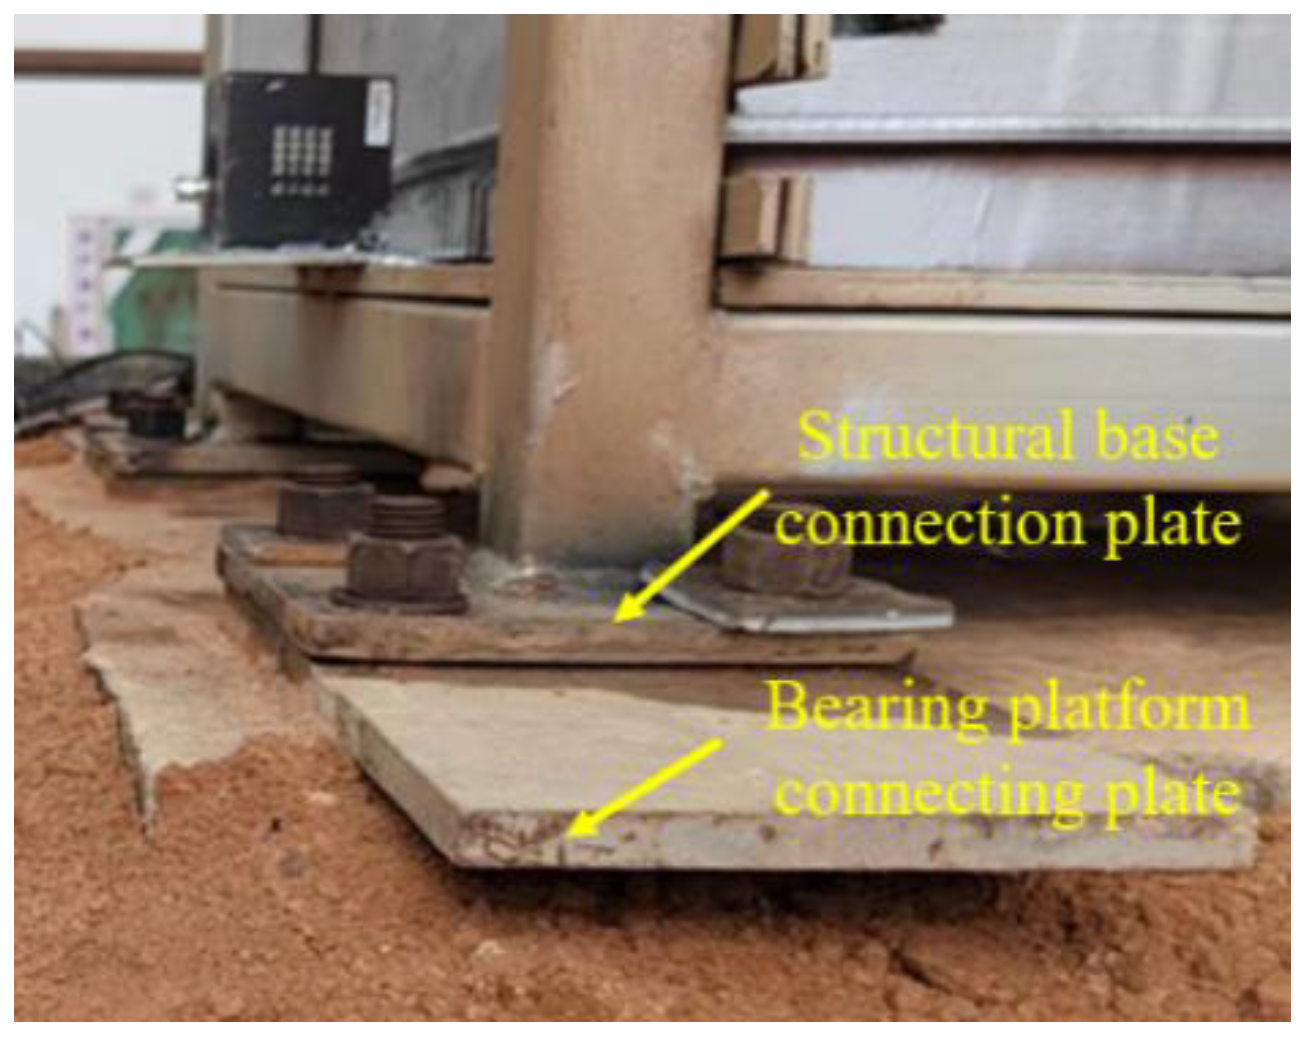
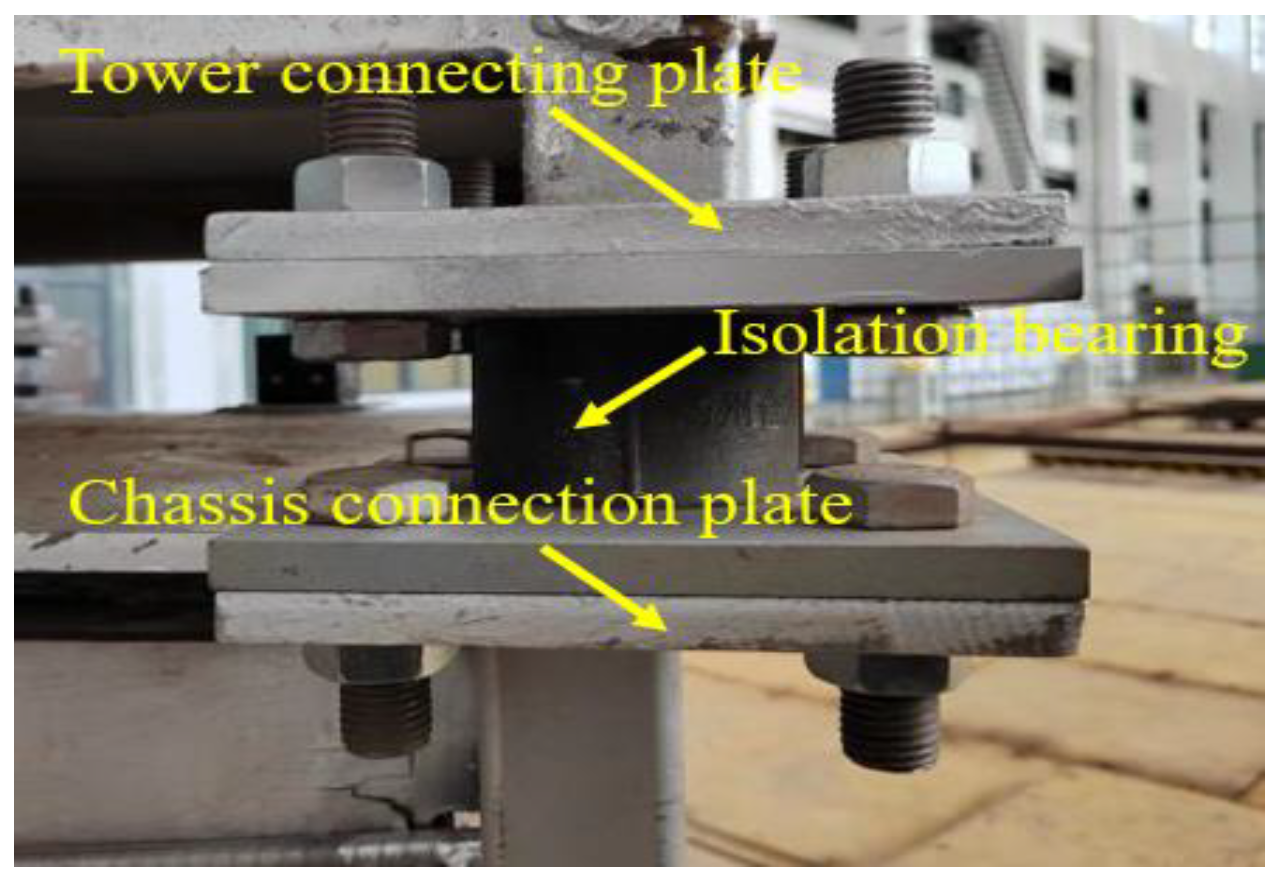
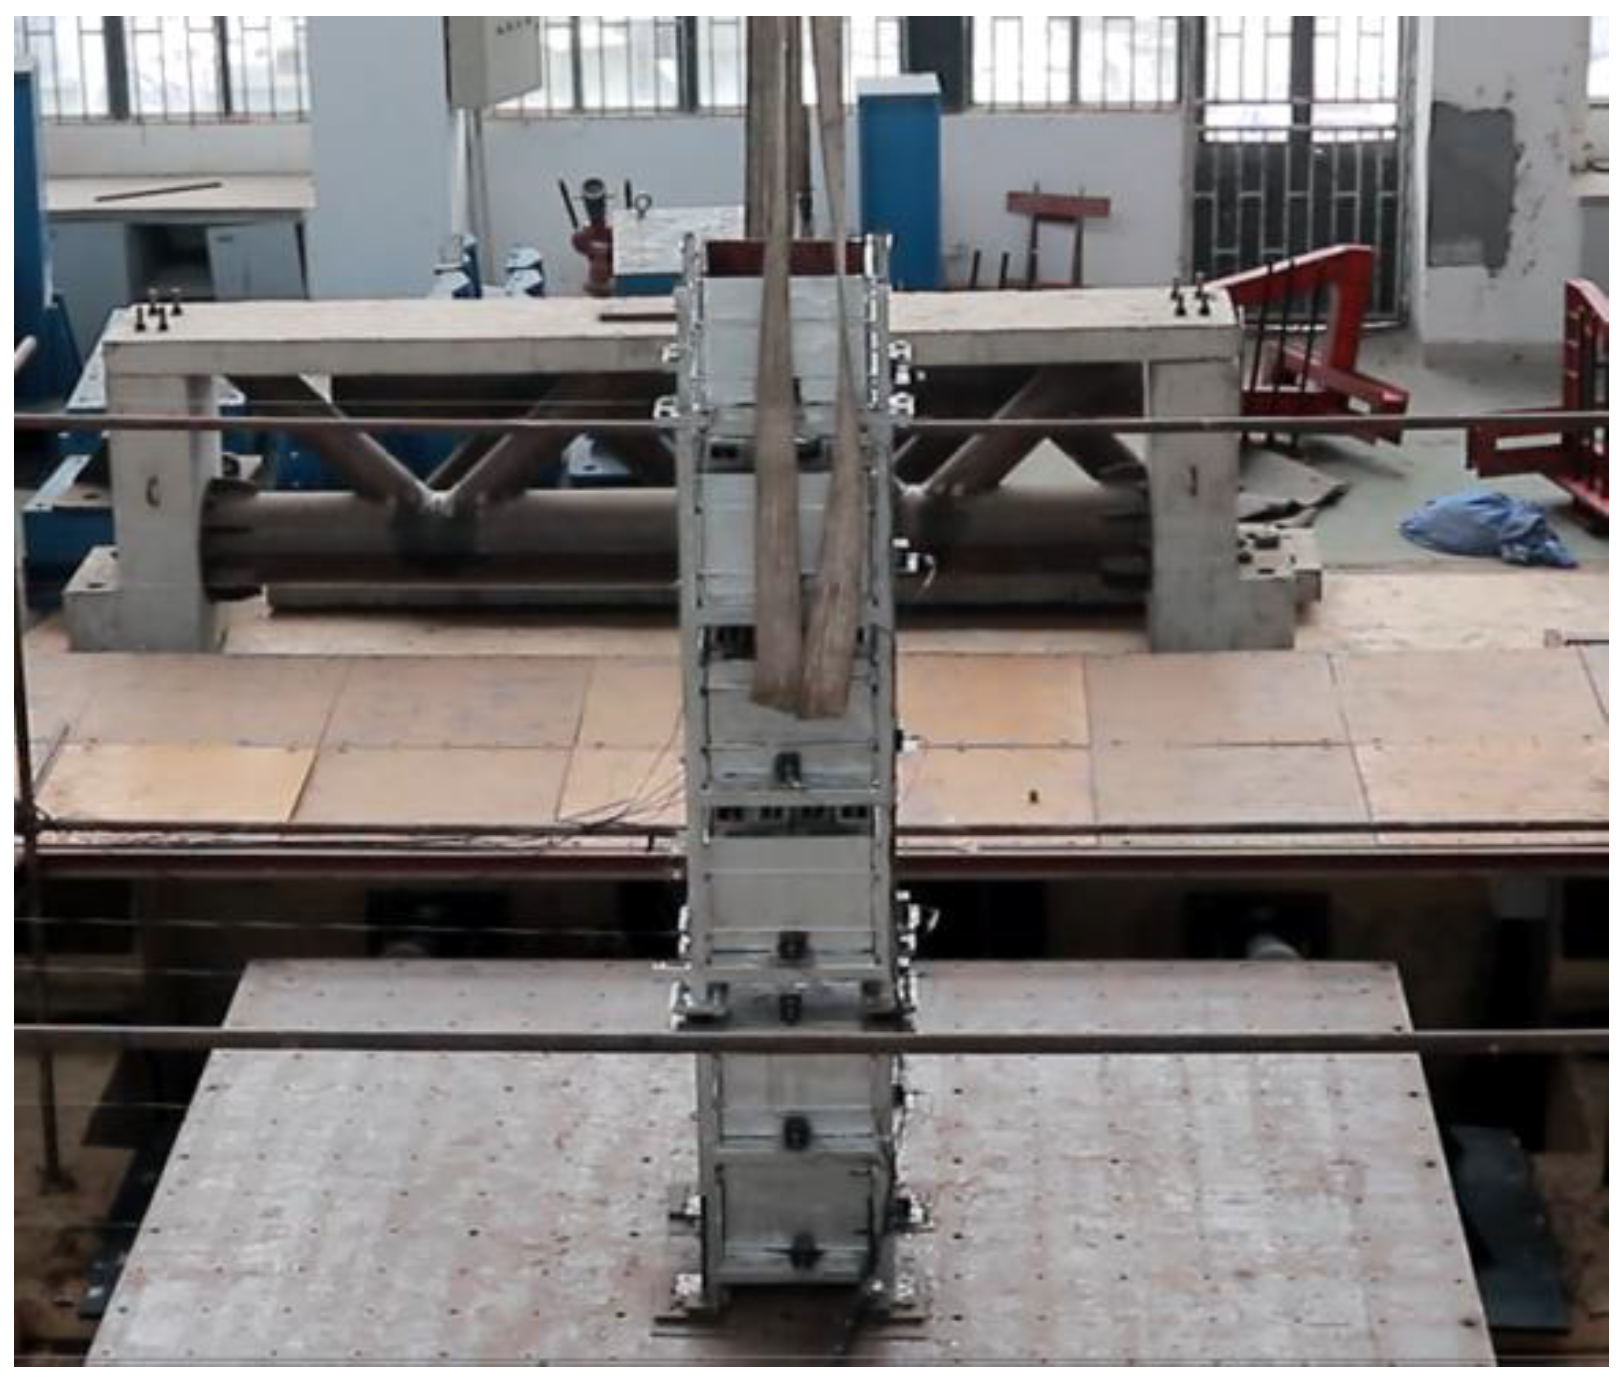
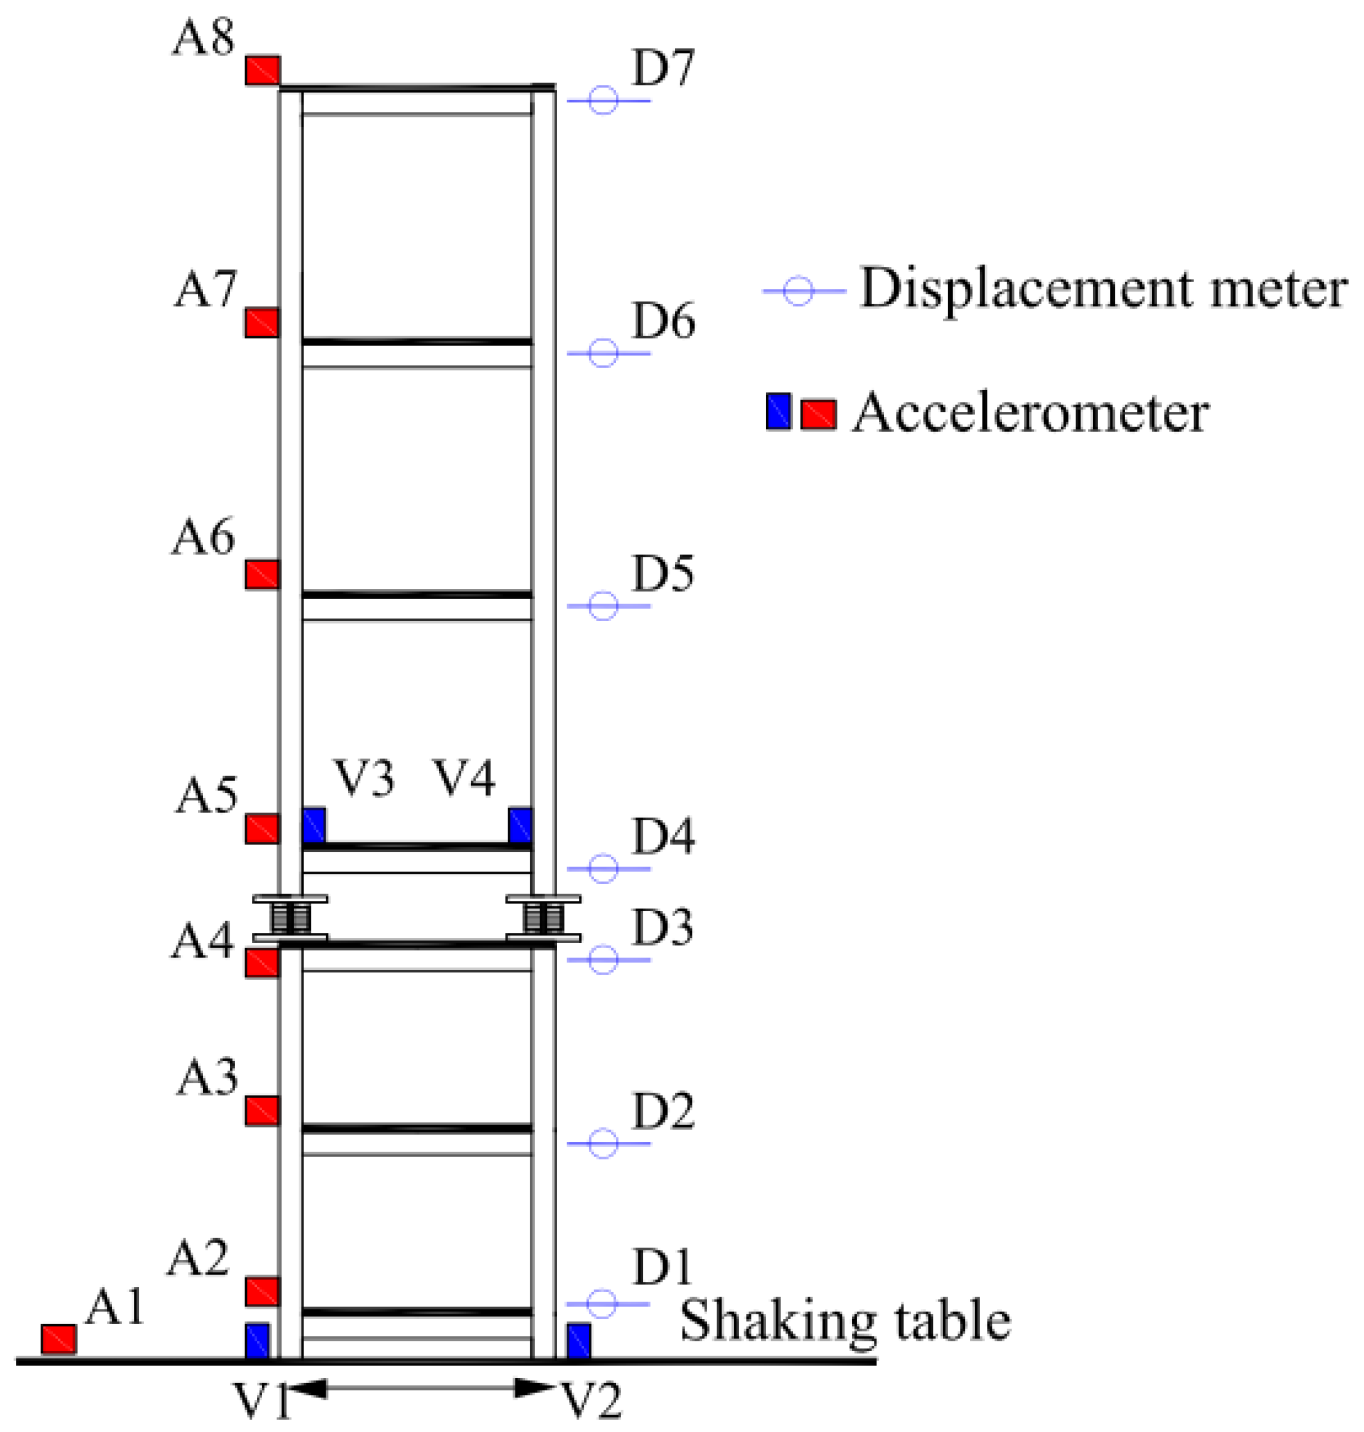
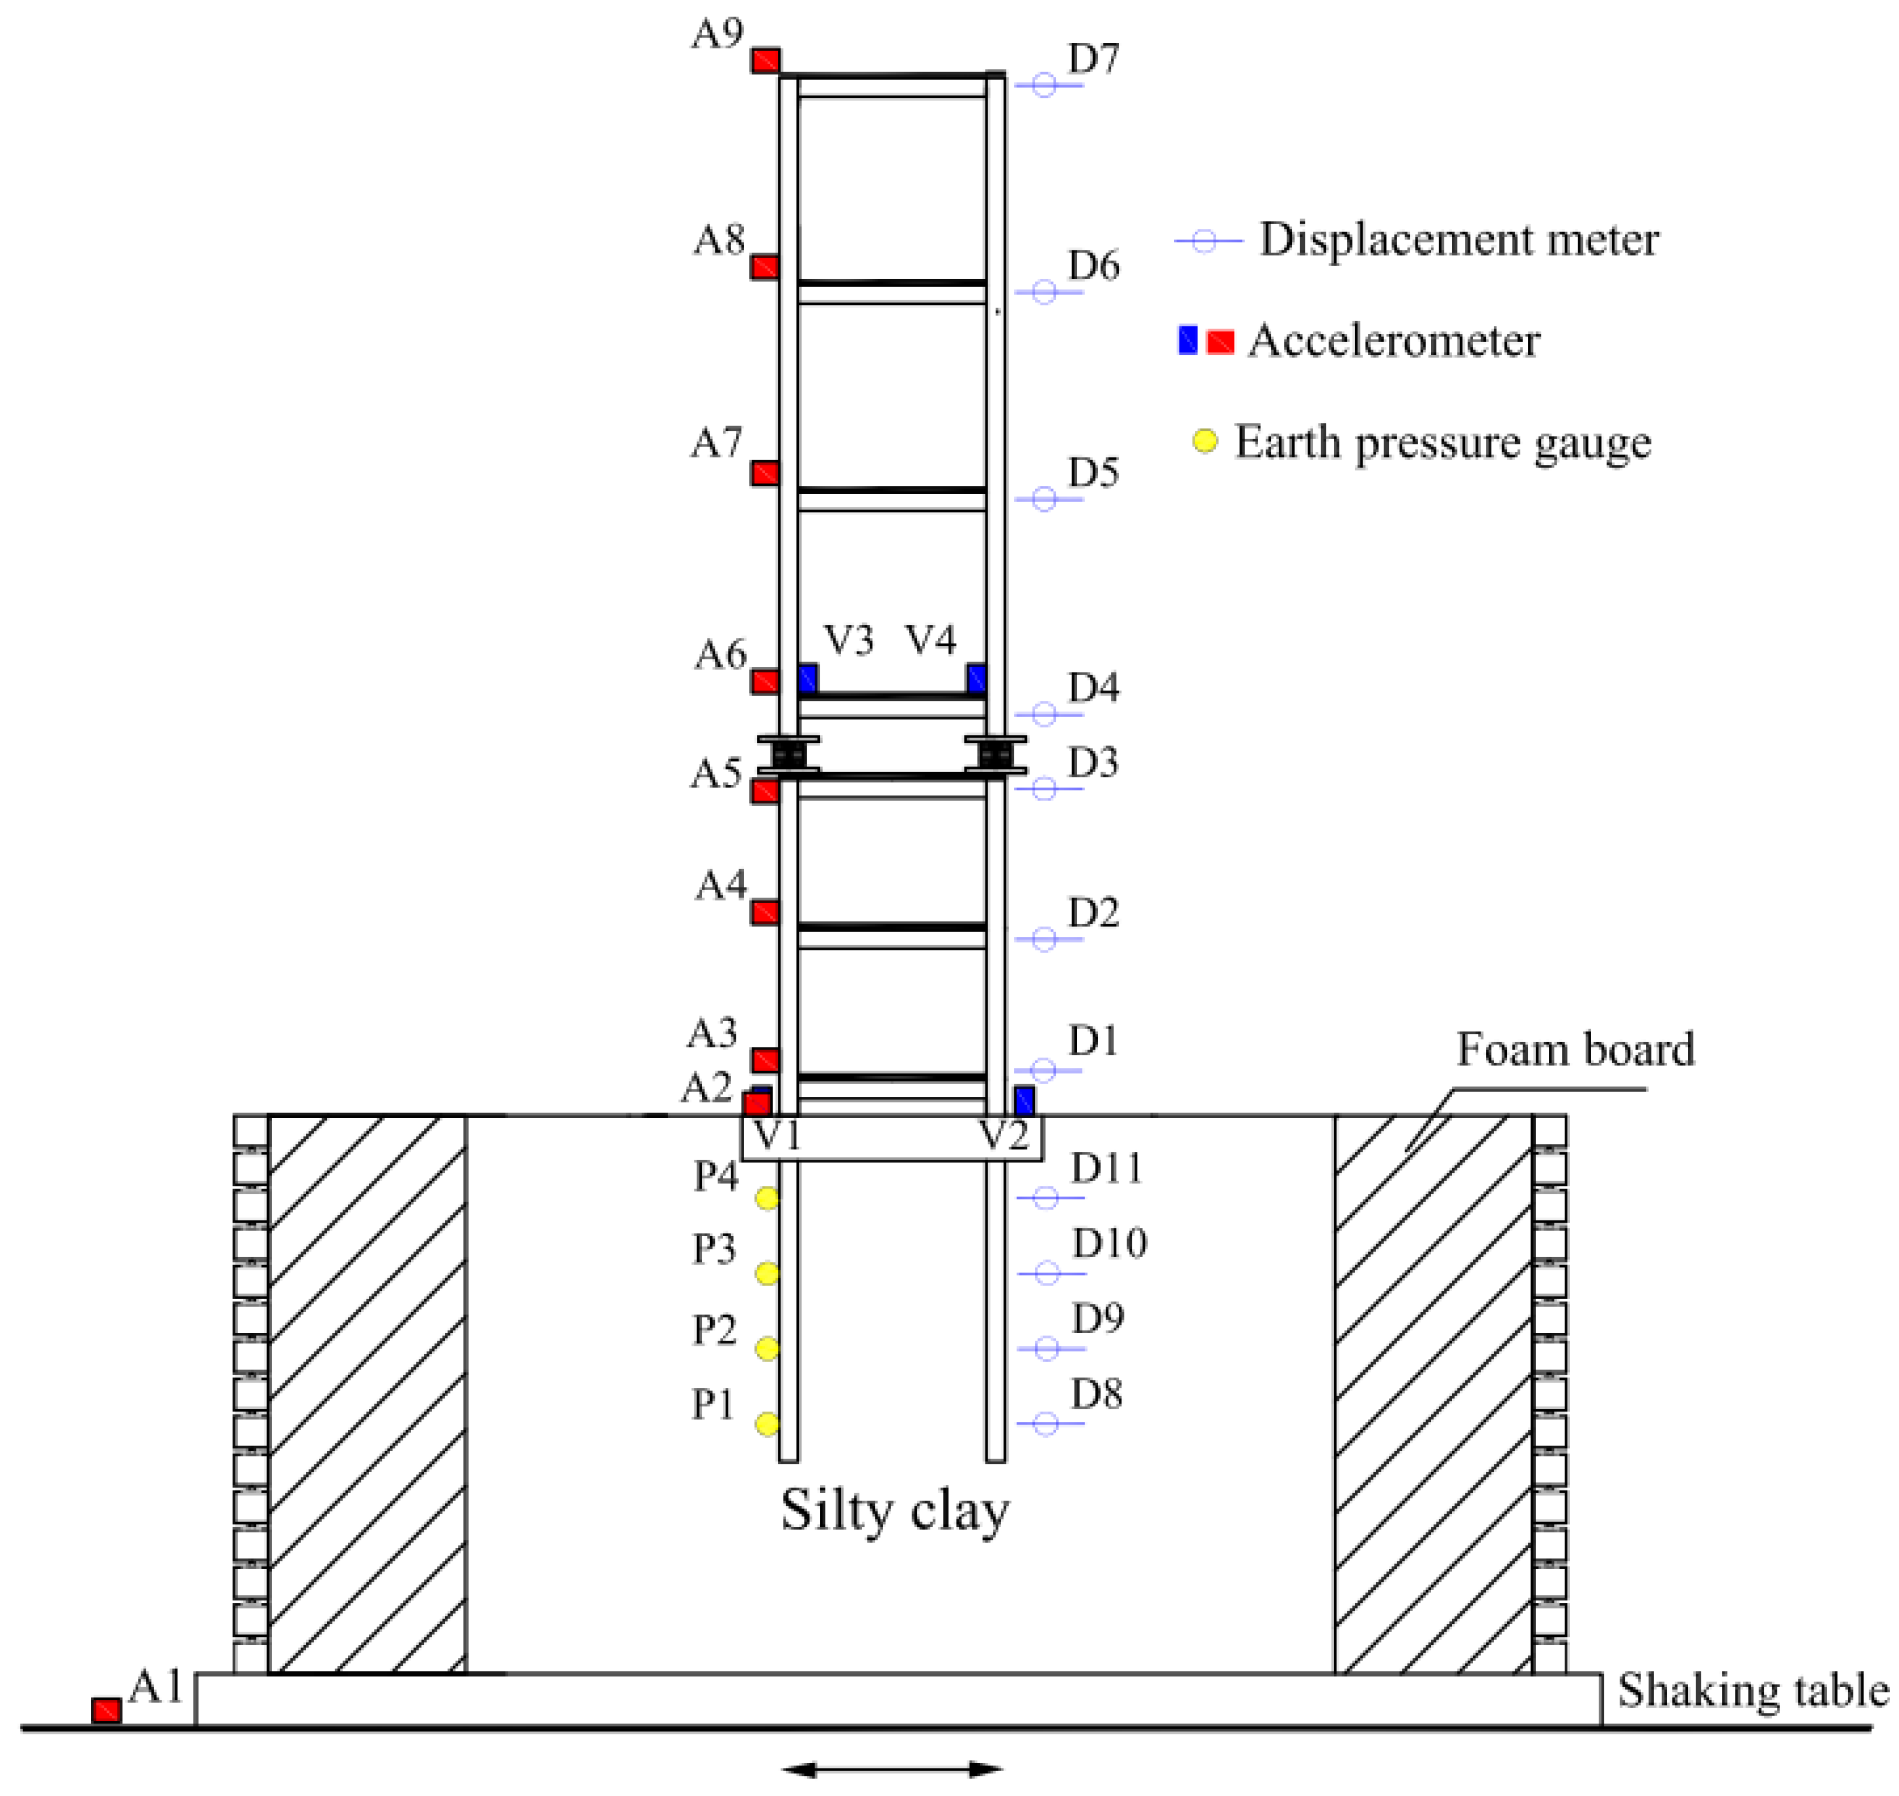
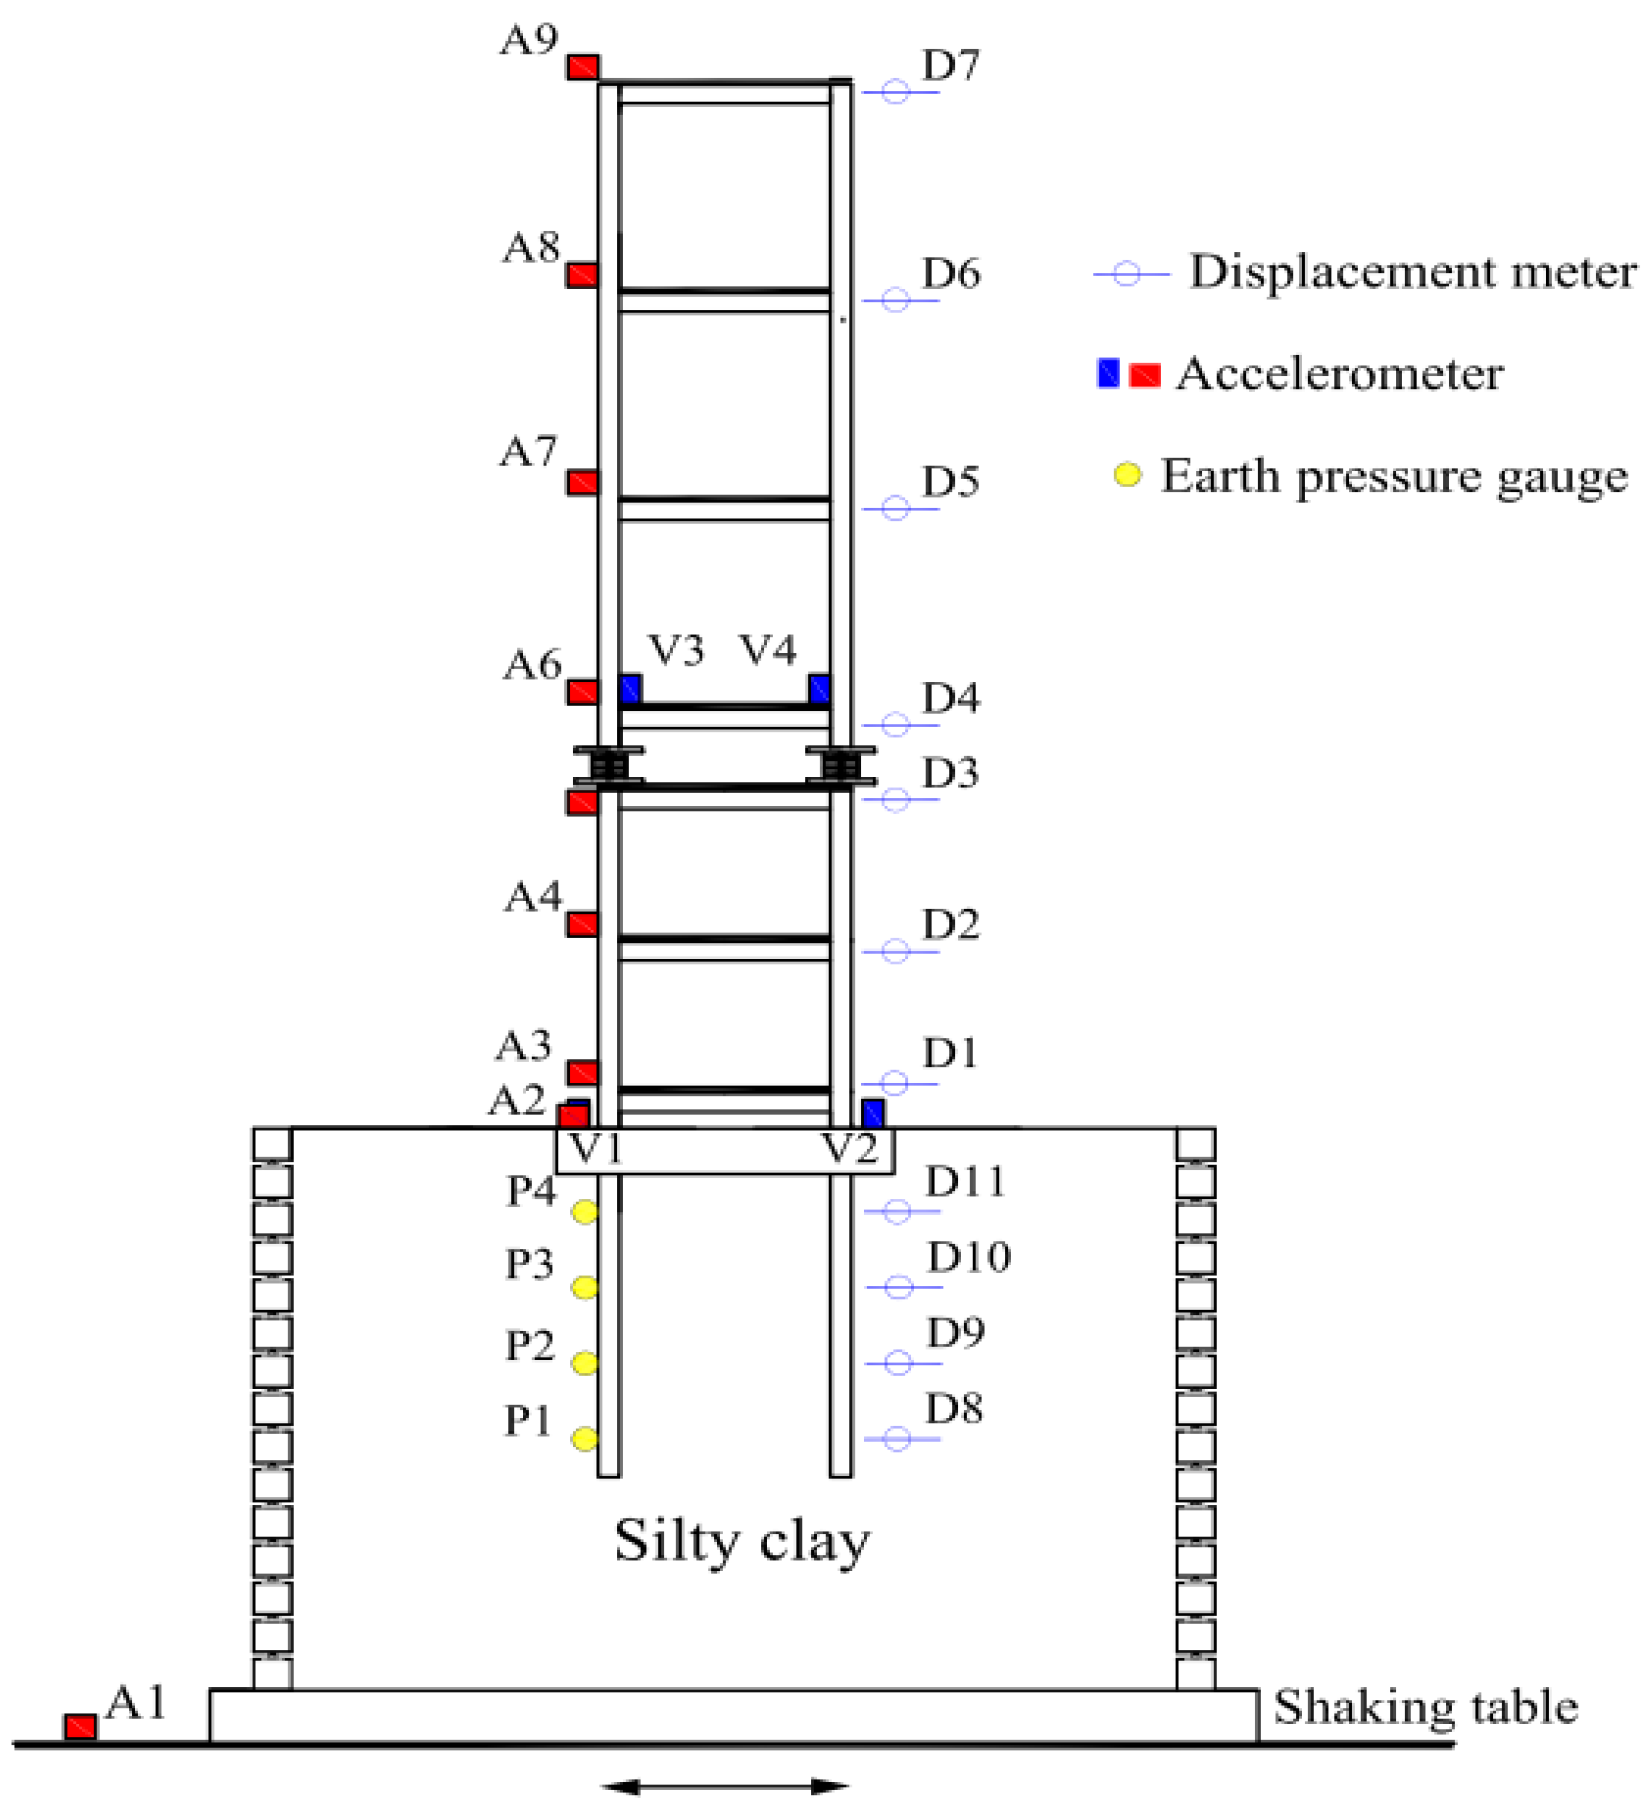
2.7. Model Assembly and Measurement-Point Layout
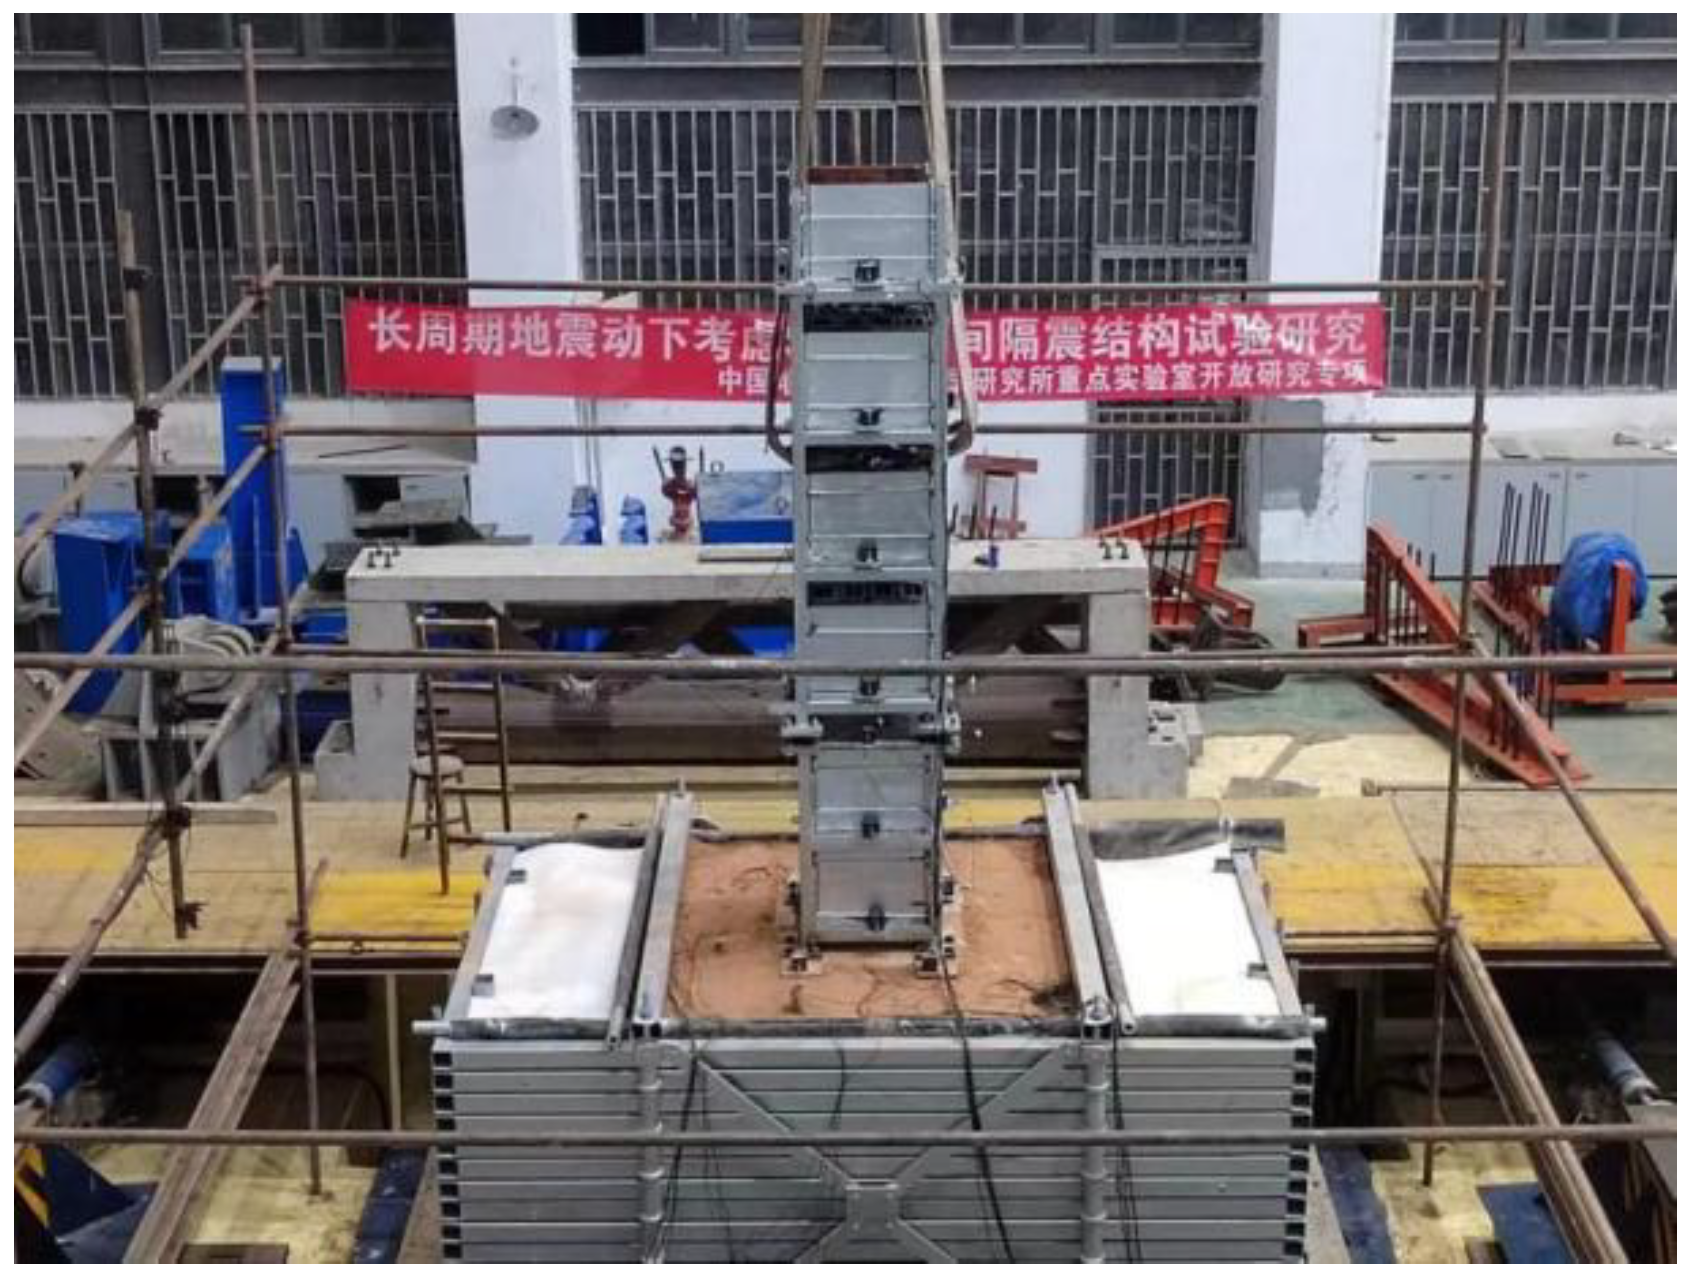
The assembly sequence of the rigid interlayer isolation model was as follows: installation and testing of connectors, lower substructures, isolation bearings, upper substructures, counterweights, acceleration sensors, and displacement sensors. The assembly sequence of the soft soil interlayer isolation model was as follows: soil box, bearing platform, installation and testing of sensors on soil and piles, installation and testing of lower substructure, isolation support, upper substructure, counterweight block, acceleration sensor, and displacement sensor. The nonisolated model was constructed by removing the isolation support from the interlayer isolation model and connecting the upper and lower structures with bolts. The model assembly and sensor installation are displayed in Figure 11, Figure 12, Figure 13 and Figure 14.
2.8. Ground-Motion Selection
By considering the results of references [24,25] on long-period ground motions, three near-field ordinary, far-field ordinary, near-field pulse, and far-field harmonic ground motions were selected from the database of the Pacific Earthquake engineering Research Center. Table 4 lists the ground-motion information. The selection criteria for various types of seismic motions were as follows. (1) The distance between the near-field seismic-motion faults had to be less than 20 km while the distance between the far-field seismic-motion faults was to be greater than 80 km. (2) The average period, Tr, of the acceleration spectrum of the long-period ground motions was to be greater than 2 s. (3) Finally, the ratio of seismic peak velocity (PGV) to seismic peak acceleration (PGA) of ordinary seismic motion was to be less than 0.2.
2.9. Loading System and Working Conditions
To reduce experimental errors due to structural damage to the model in the experiments, the input sequence of the ground motion in the shaking-table test conditions was as follows: near-field ordinary, far-field ordinary, near-field pulse, and far-field harmonic ground motion. The peak ground motion acceleration was as follows: 0.1 g in the X-direction (unidirectional), 0.085 g in the Y-direction (bidirectional), and 0.2 g in the X-direction (unidirectional). The order of the models was the rigid interlayer isolation model and soft soil interlayer isolation model. The test conditions are shown in Table 5.
3. Results and Analysis of the Shaking-Table Test
3.1. Test Macro Phenomenon
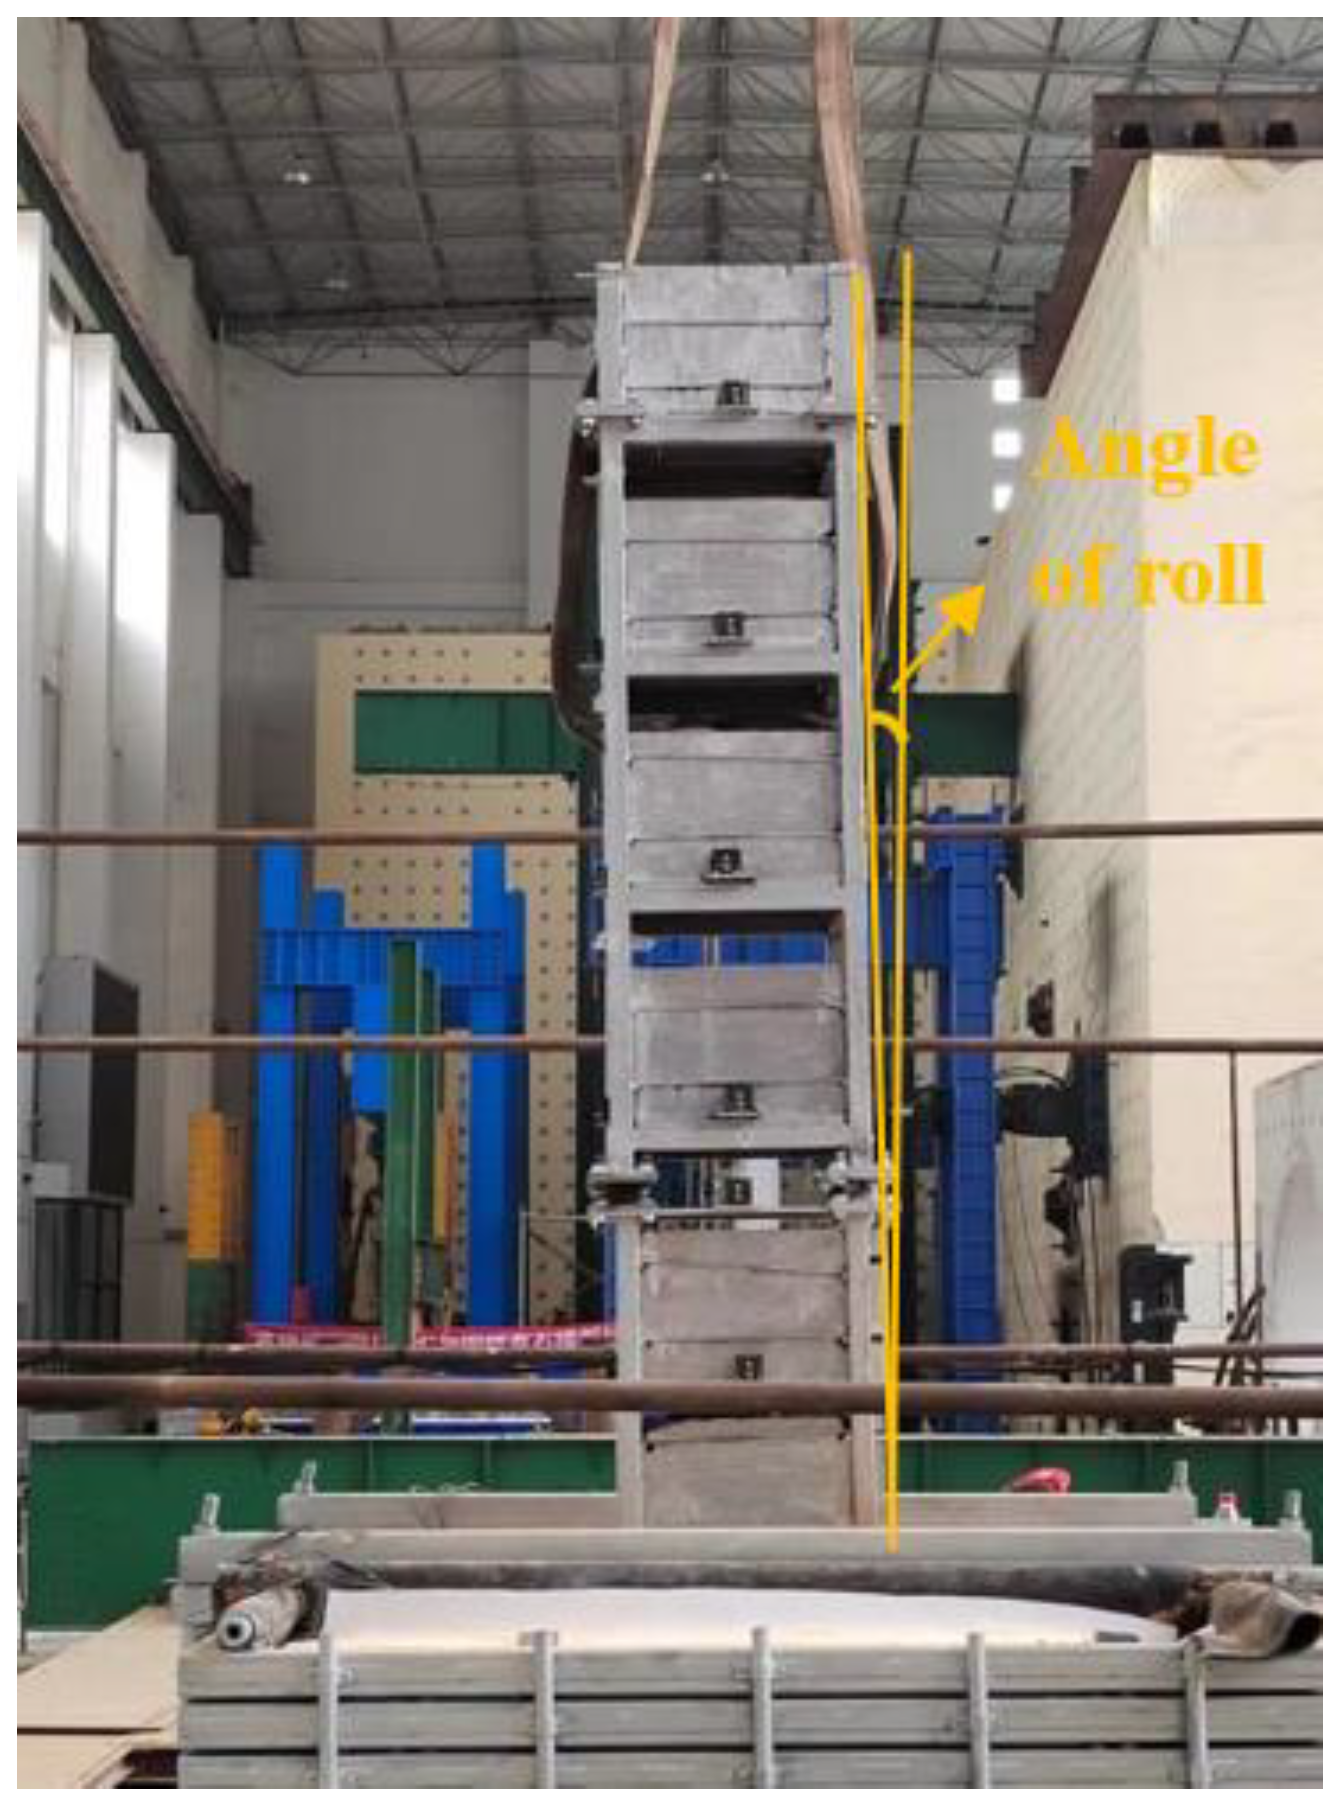
The macro phenomena of the shaking-table test with different foundation conditions of the layer spacing structure model are similar. With the increase in the peak value of vibration acceleration in the input fields, the layer interval displacement response of the structure is enhanced, and the structure shows maximal displacement mainly in the isolation layer. These results are consistent with the phenomenon observed in a layer interval of a seismic response of the structure. The long-period seismic action between the displacement response of the structure than ordinary strong ground motion. After the test, on the soft soil layer structure between the existence of small subsidence and tilt, which presumably, with softening of foundation soil, the structure of the subsidence and tilt rate increase. Figure 18 shows the upper structure on a soft soil ground tilt.
3.2. Dynamic Characteristics of the Model Structure
The structure was constructed using the shaking-table 0.05 g white-noise function; the top acceleration data of test modal analysis again after can get two types of models of the first-order natural vibration period, as shown in Table 6.
As shown in Table 6, after the test, the natural vibration period of the layer interval shock model is longer under the condition of rigid or soft soil. In addition, before and after the test, the damping ratios of the model structure under the condition of rigid foundation are close to each other; however, for the soft soil foundation, the damping ratio increases slightly after the test. We determined that with multiple seismic effects, the soft soil foundation became softer after the test; moreover, a week of natural vibrations greatly influences the damping ratio of the model. Seismic wave may not change the base characteristics of structures on bedrock or hard soil layer sites, but for structures on soft soil foundation, especially long-period isolated structures, the soil layer will affect the dynamic response of structures from several aspects. Isolation structures located on soft soil foundations may experience multiple separation, sliding, and compression effects between piles and soil under strong seismic action, which significantly affects the dynamic transmission mechanism between piles and soil and alters the actual dynamic response of the upper structure.
3.3. Soil–Tank Boundary Effect
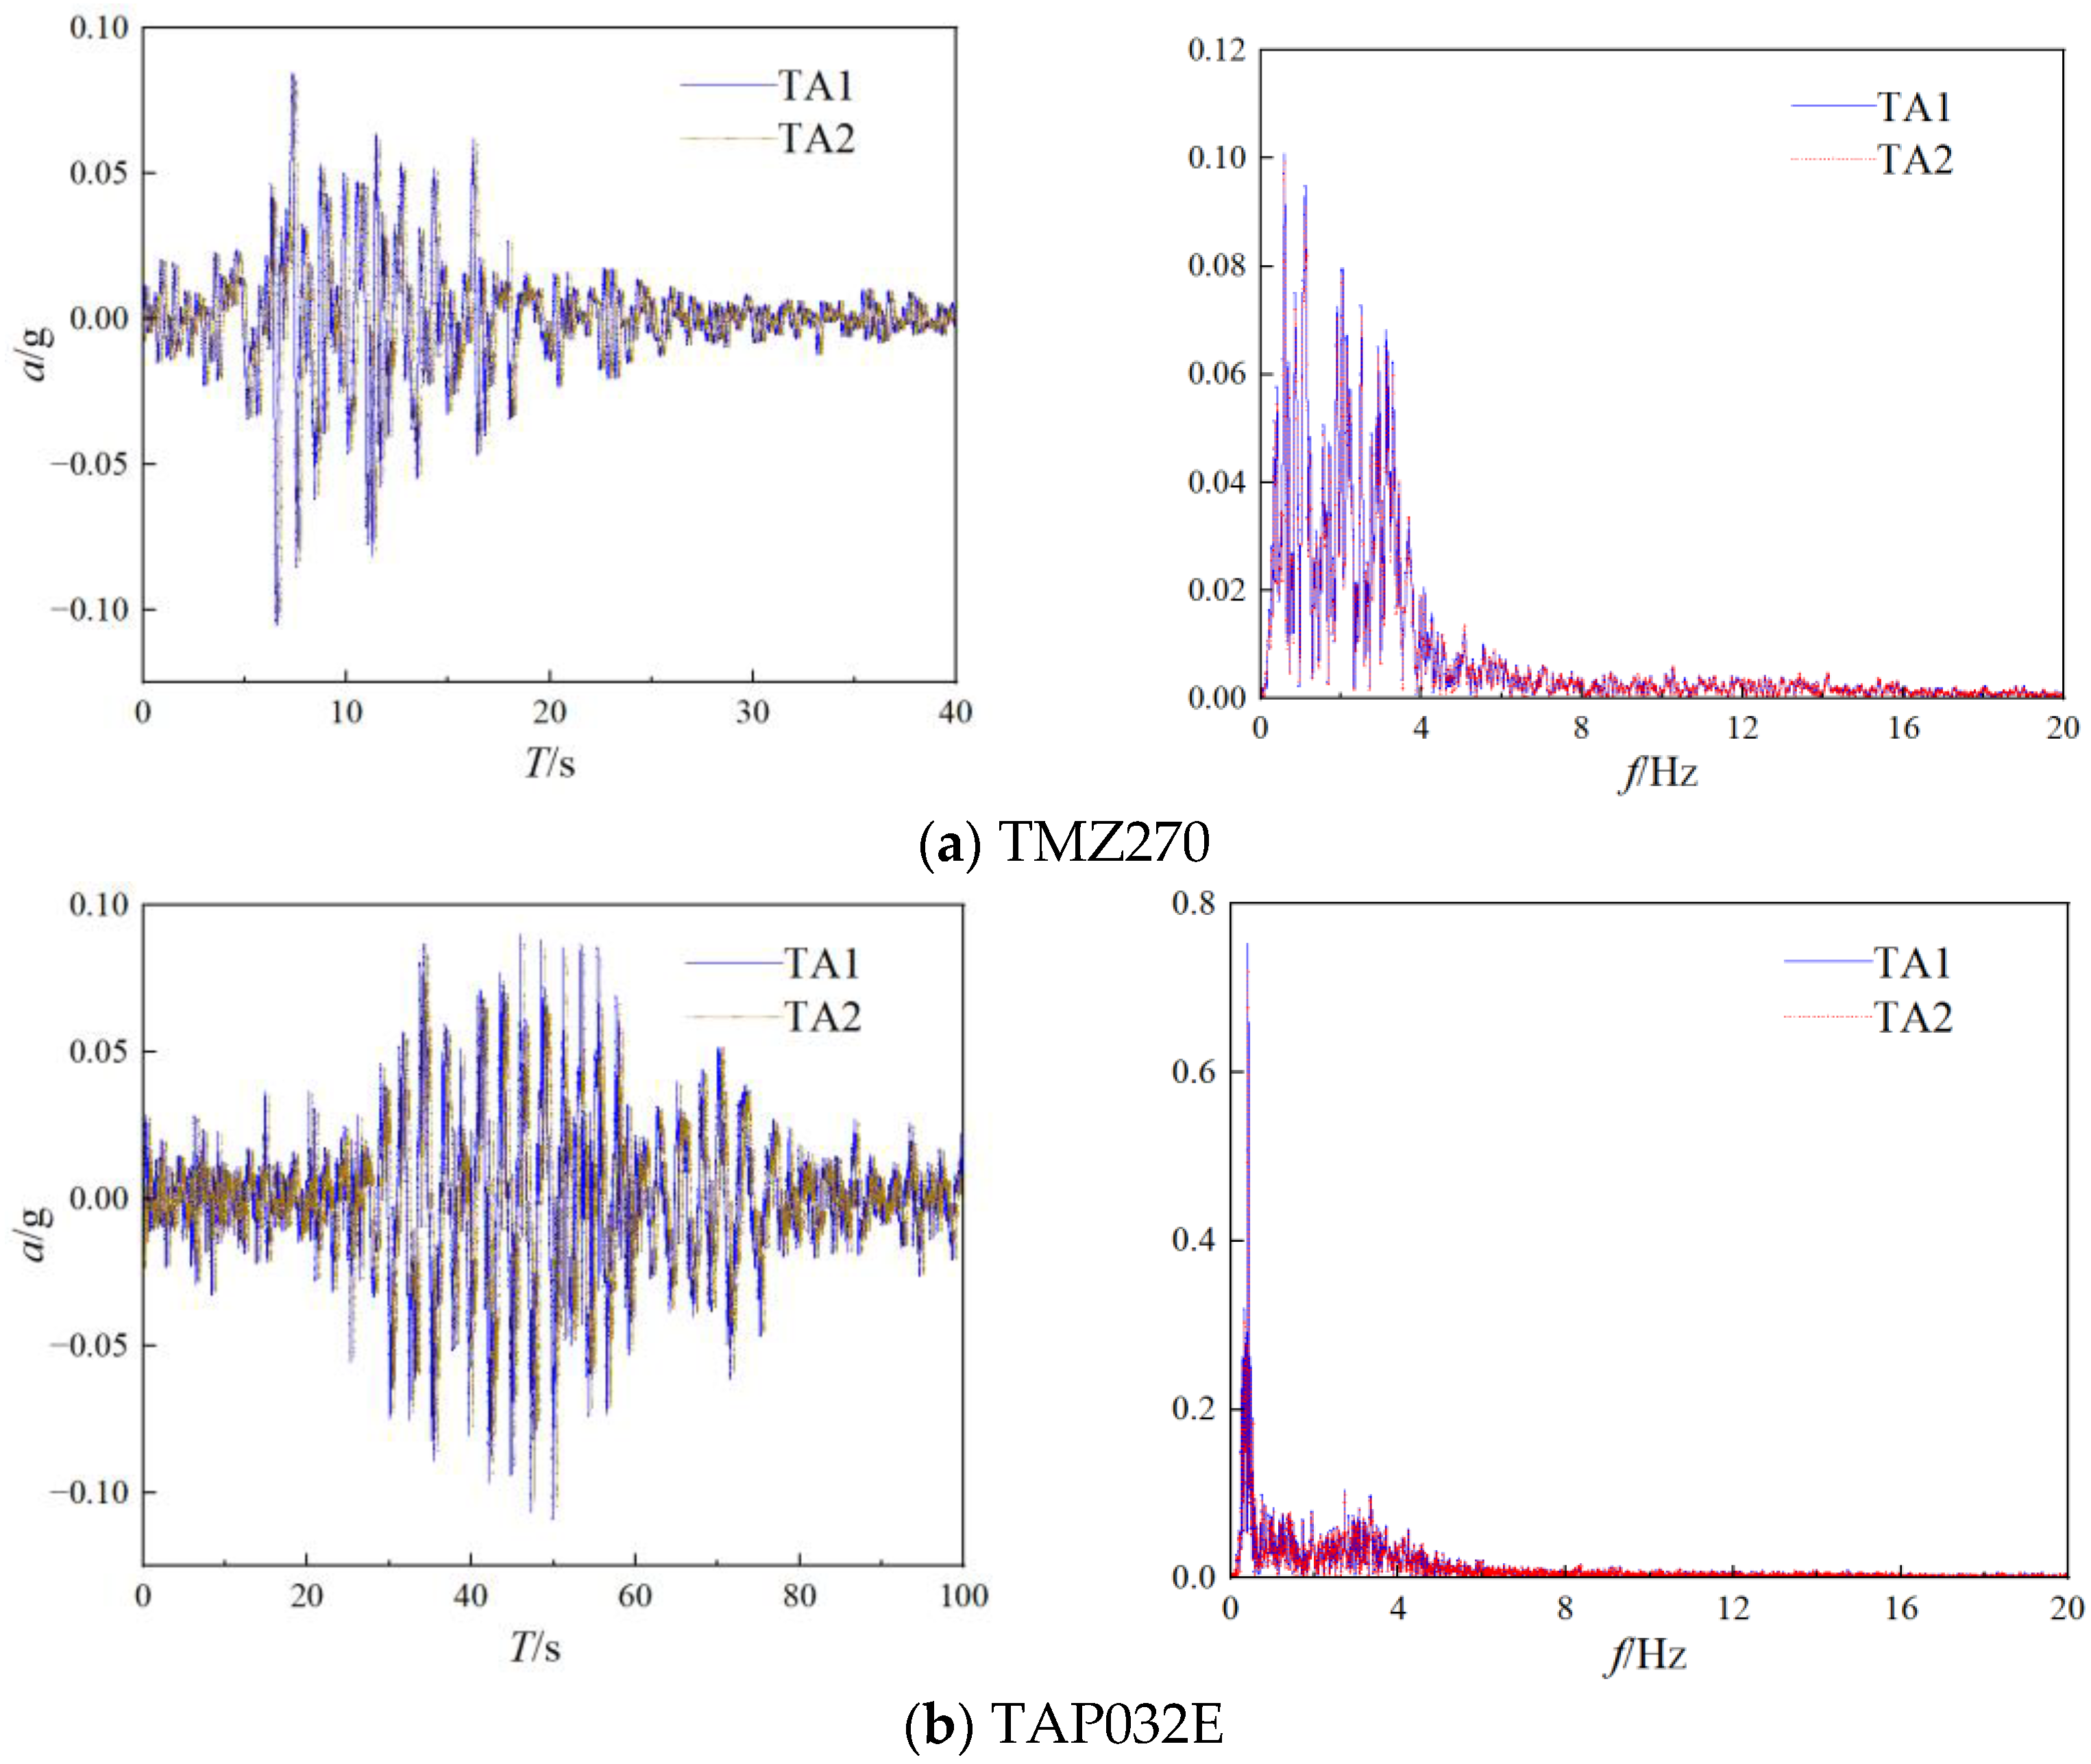
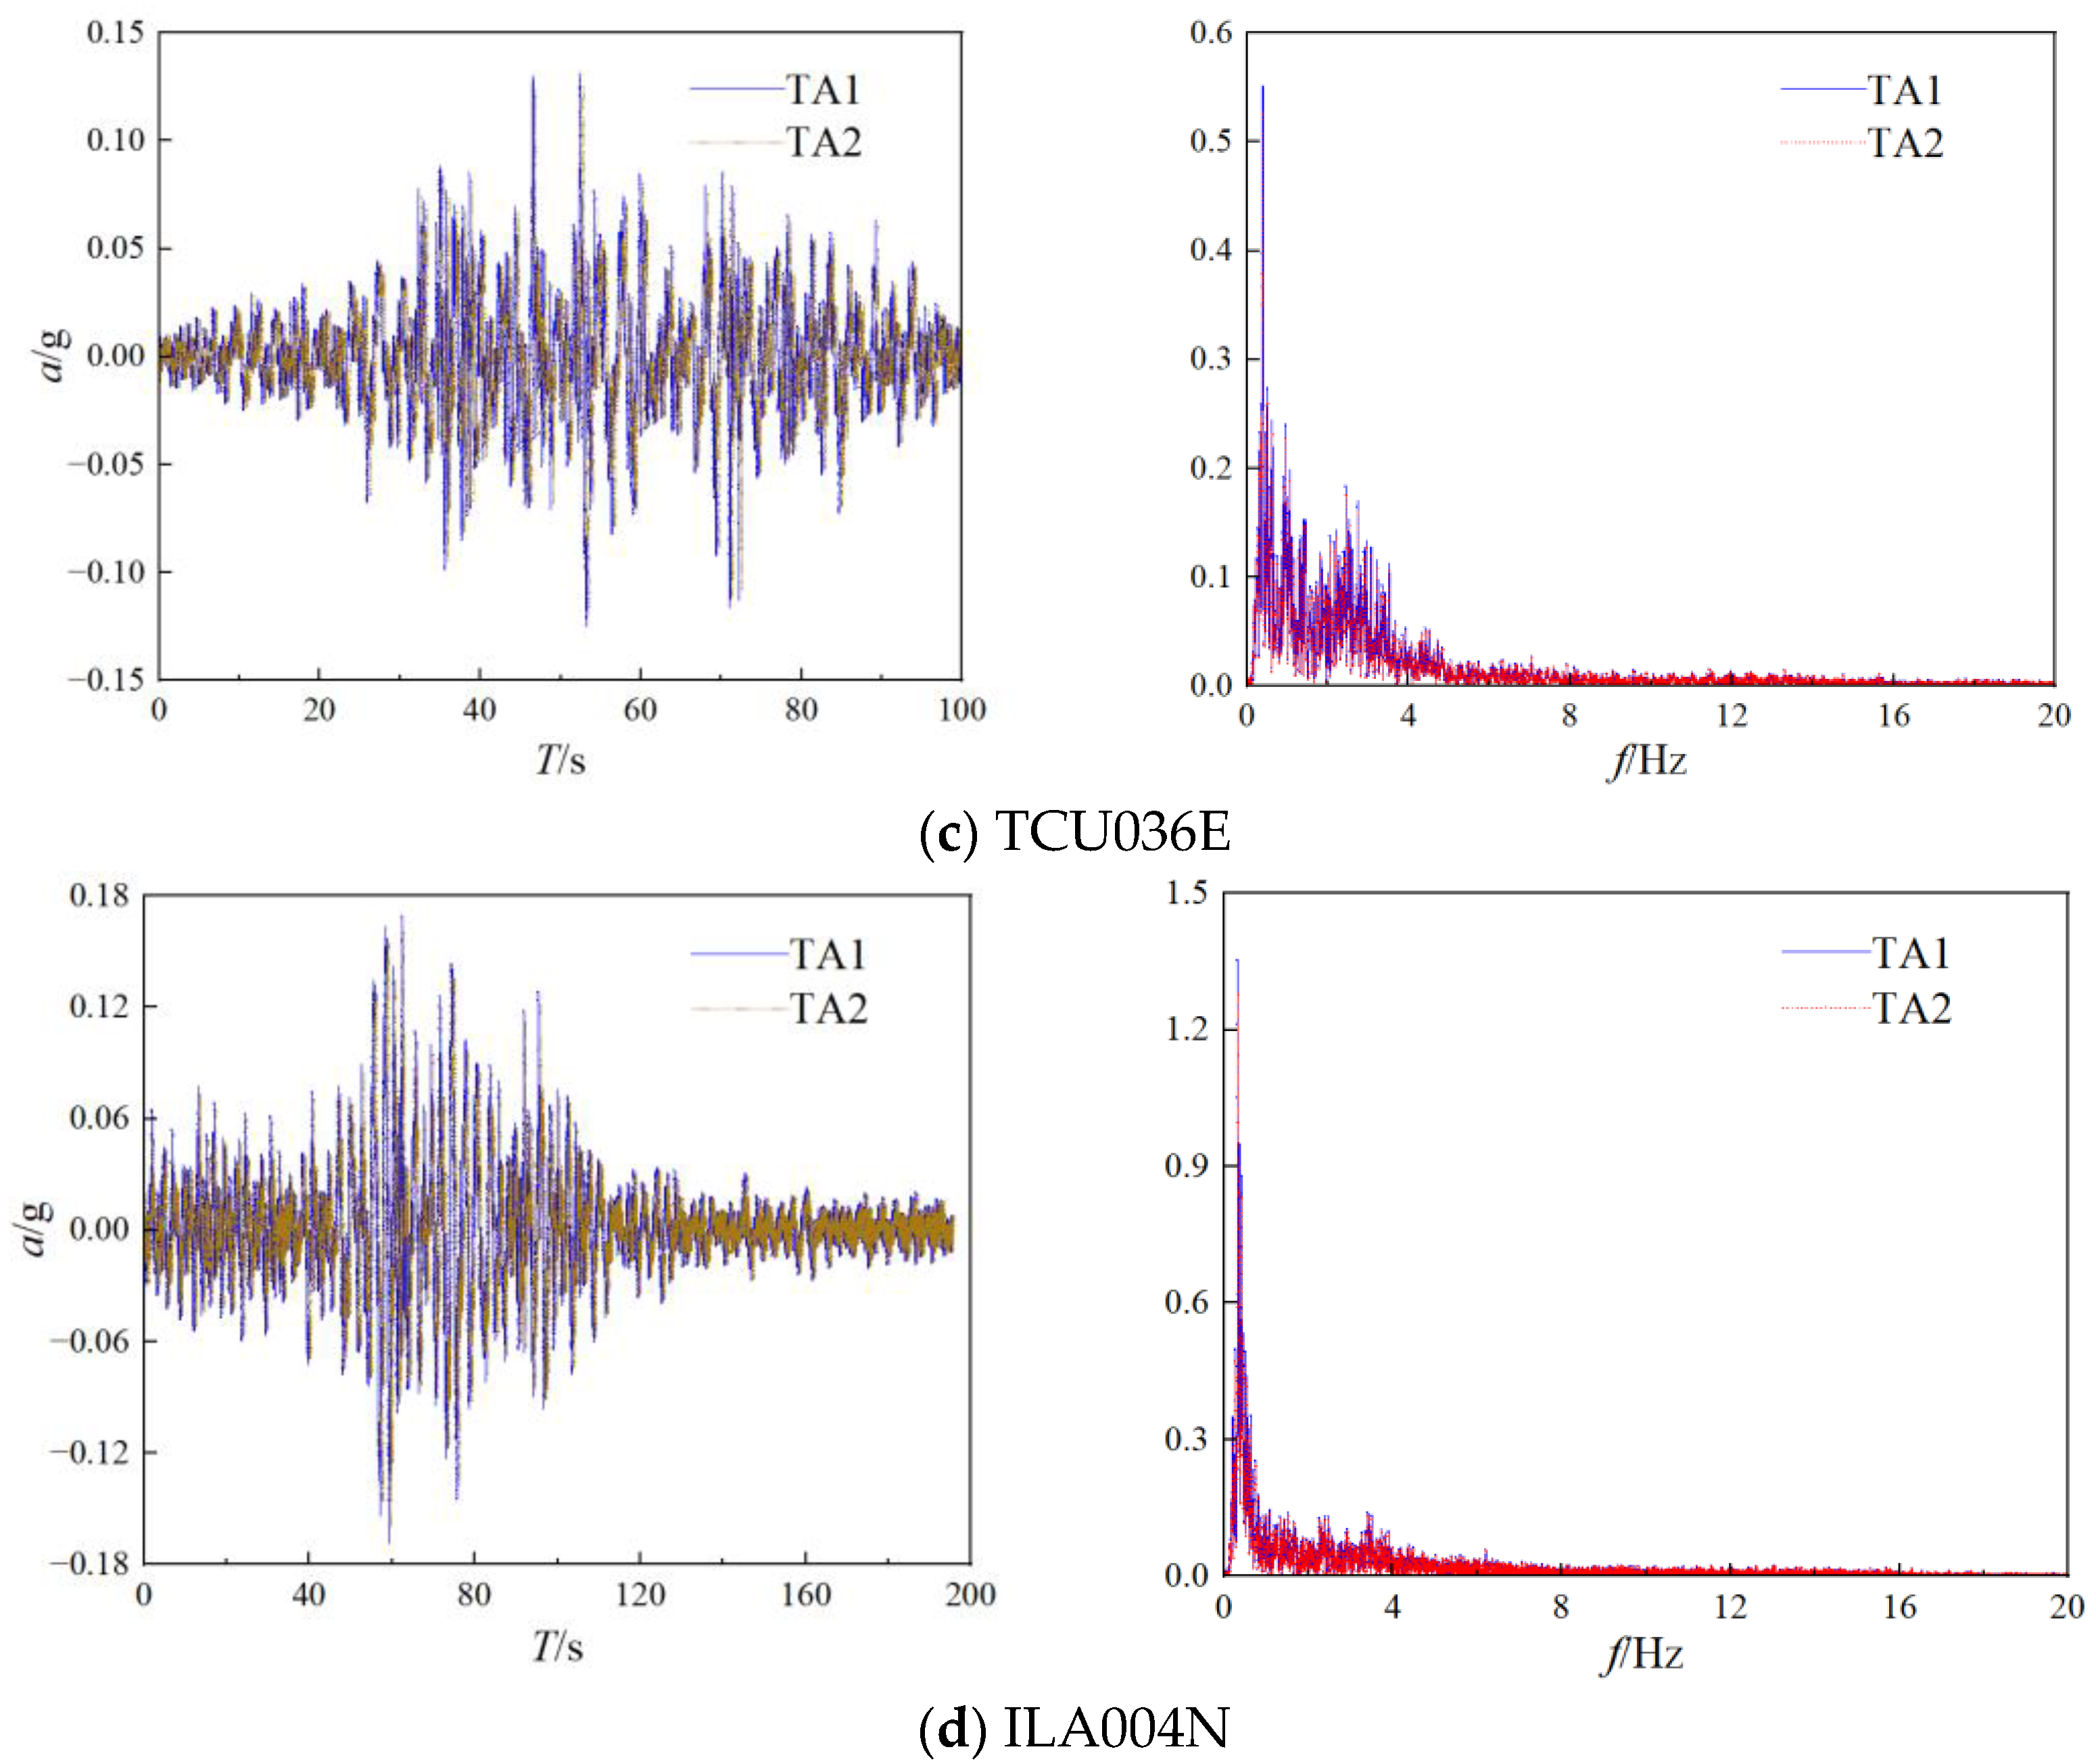
Owing to large amount of ground motions and the condition, the peak acceleration of 0.1 g is selected at the near-field ordinary seismic ground motion TMZ270, ordinary seismic far field (TAP032E), ordinary seismic near-field ground-motion pulse (TCU036E), and far-field harmonic ground motion (ILA004N) for analysis. The acceleration peak value is shown in Table 7, where the X-axis deviates as (TA1-TA2)/A1 and Y axis deviates to (TA3-TA4)/TA3.
Table 7 presents the case analysis, where the soil surfaces at points X and Y with respect to the peak acceleration are relatively close; the site of ordinary soil surface under the earthquake action of slightly less than that experienced during the long-period ground motion showed a deviation of less than 6%. Owing to limited space and the scope of this study, this paper only presents the X–Y acceleration time history curve and Fourier spectrum for the peak acceleration of 0.1 g. Figure 19 shows the X-value for the vibration of the abovementioned four ground motions under the action of earthquake at the soil surface point TA1, acceleration time history curve at TA2, and Fourier spectrum.
As shown in Figure 20, the test was verified using the model of the soil box, and this essentially eliminates the boundary effect caused by seismic scattering, refraction, emission, etc.
3.4. Amplification Effect of the Foundation Soil and Filtering Effect
3.4.1. Amplification Effect
Owing to the two-way ground motion under the action of X, Y, mesa, and soil surface ground motion, the acceleration responses of the point of law and X-axis under the action of earthquake-based ground motion are roughly the same. Because of limited space, Table 8 only lists the input direction of X to the different types of ground motion under the action of soft soil layer interval shock, model mesa, and the site of the peak value of the ground motion acceleration of the soil surface.
As shown in Table 8, during the shaking-table test for the different types of ground motions input for different degrees of foundation soils, the peak acceleration of the soil surface and mesa peak acceleration are not the same. Overall, the far-field class harmonic ground motion amplification coefficient of the foundation soil, the regular ground motion and the near-field pulse ground motion, and the far-field of common ground motion amplification coefficient are less than the other three types of foundation soil ground motion; the far-field class harmonic ground motion in the low-frequency component of rich and energy spectrum amplitude is large and abundant, which shows that the model of foundation soil on low-frequency components of earthquake ground motion amplification affects it significantly, and the far-field of the ordinary seismic energy spectrum amplitude was generally small. The foundation soil amplification effect is not obvious, which indicates the amplification effect of the foundation soil and the spectrum characteristics of ground motion. With the increase in the mesa input and ground motion acceleration peak value, the foundation soil stops being affected by the acceleration amplification, as stated in [26]. Furthermore, after increasing the PGA, the foundation soil softens, showing nonlinear enhancement, and the increase in energy consumption and energy transfer ability is halted, thus weakening the amplification effect of the foundation soil.
3.4.2. Filtering Effect
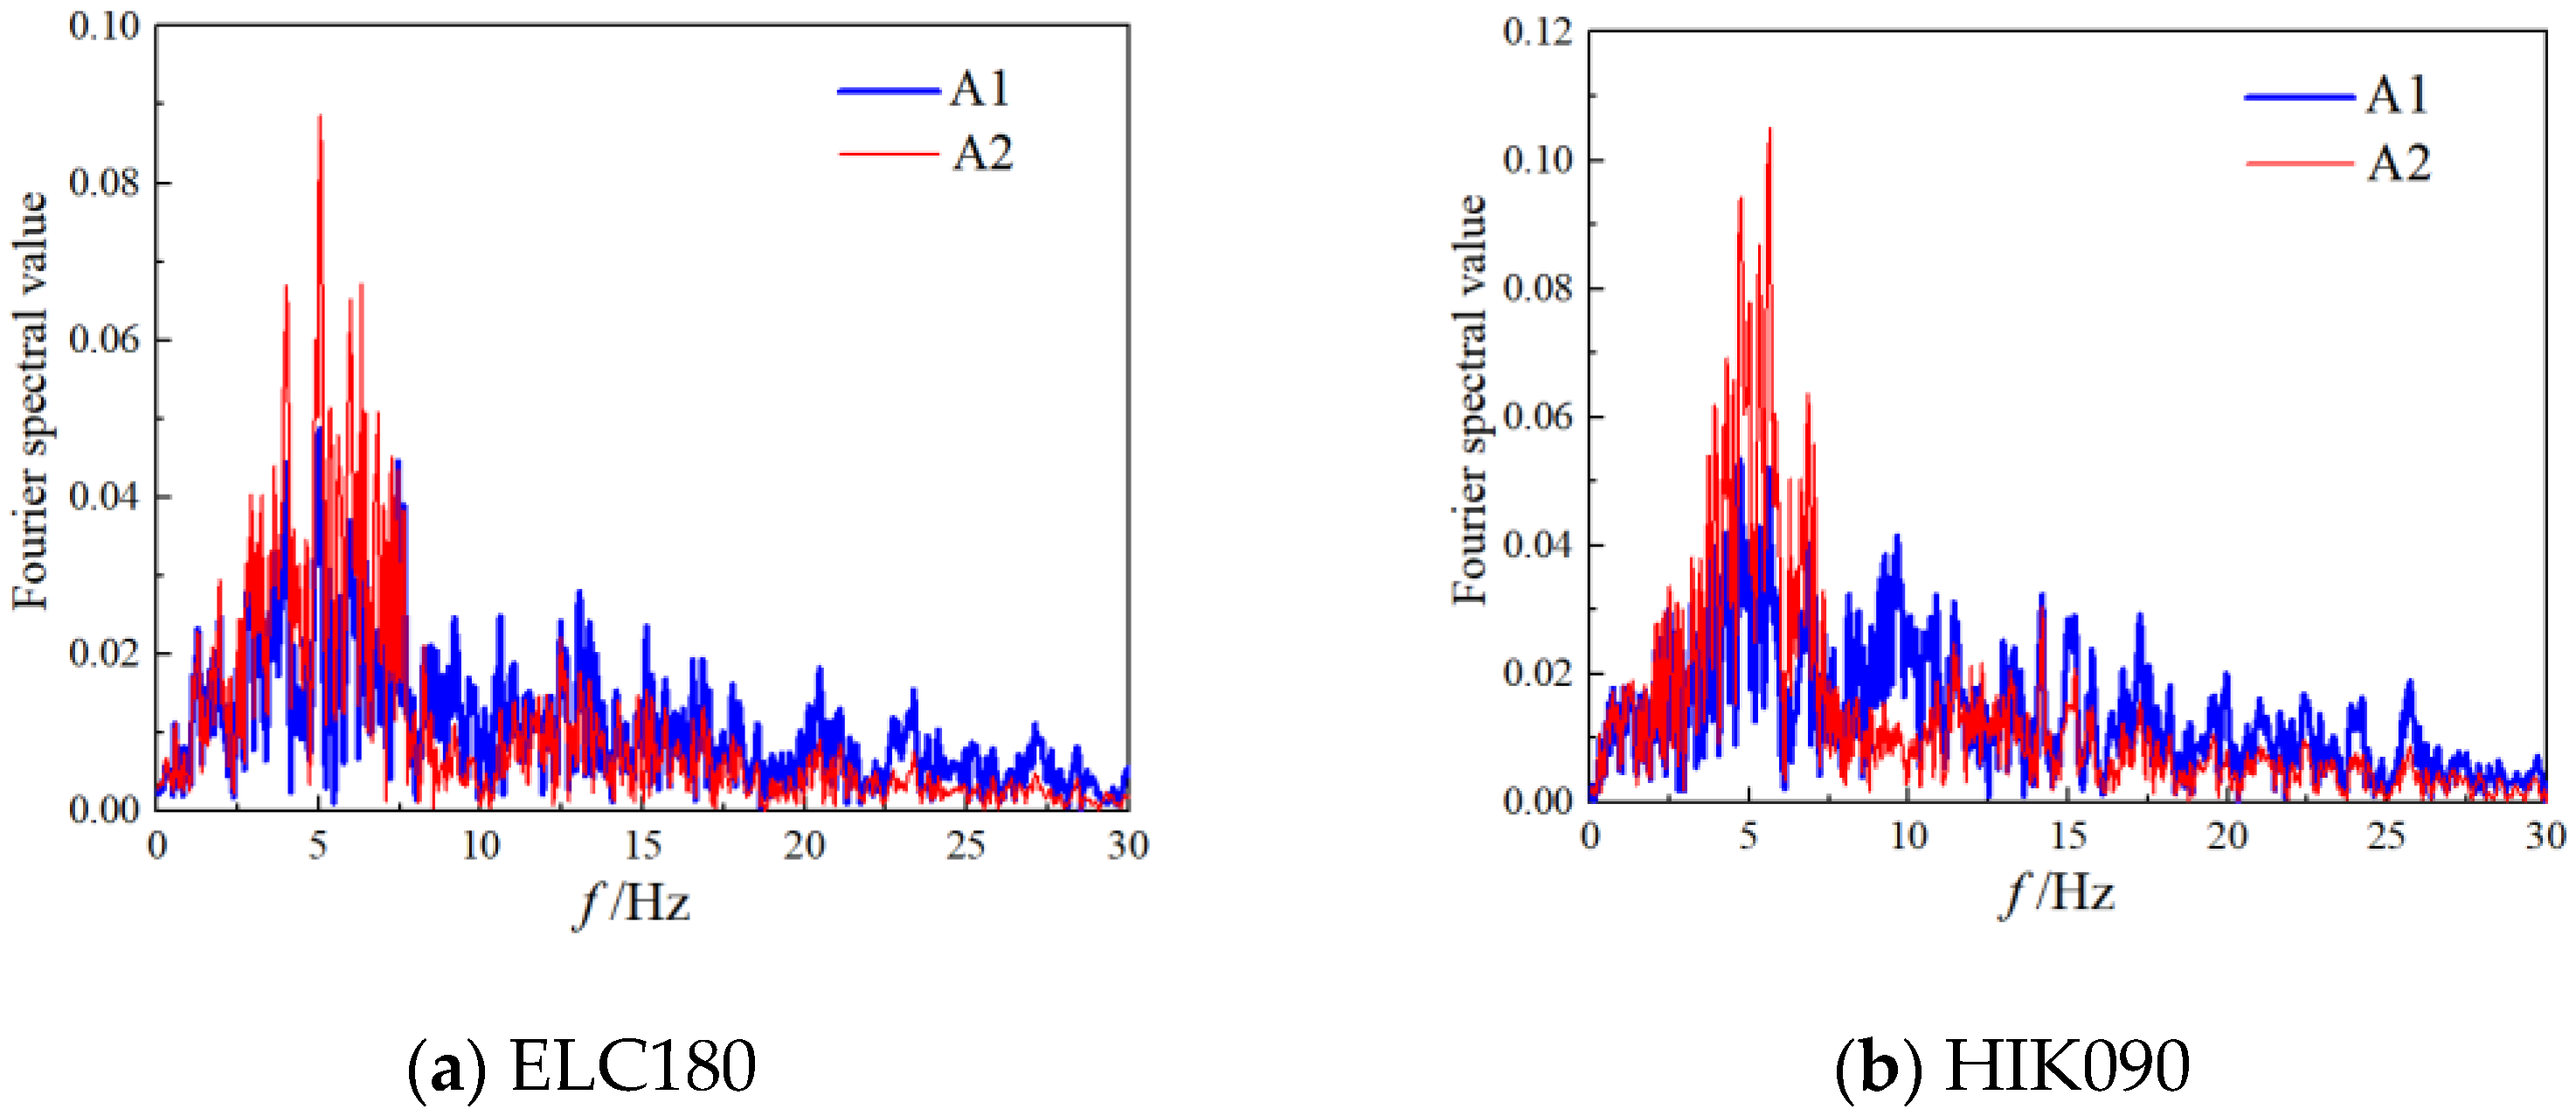
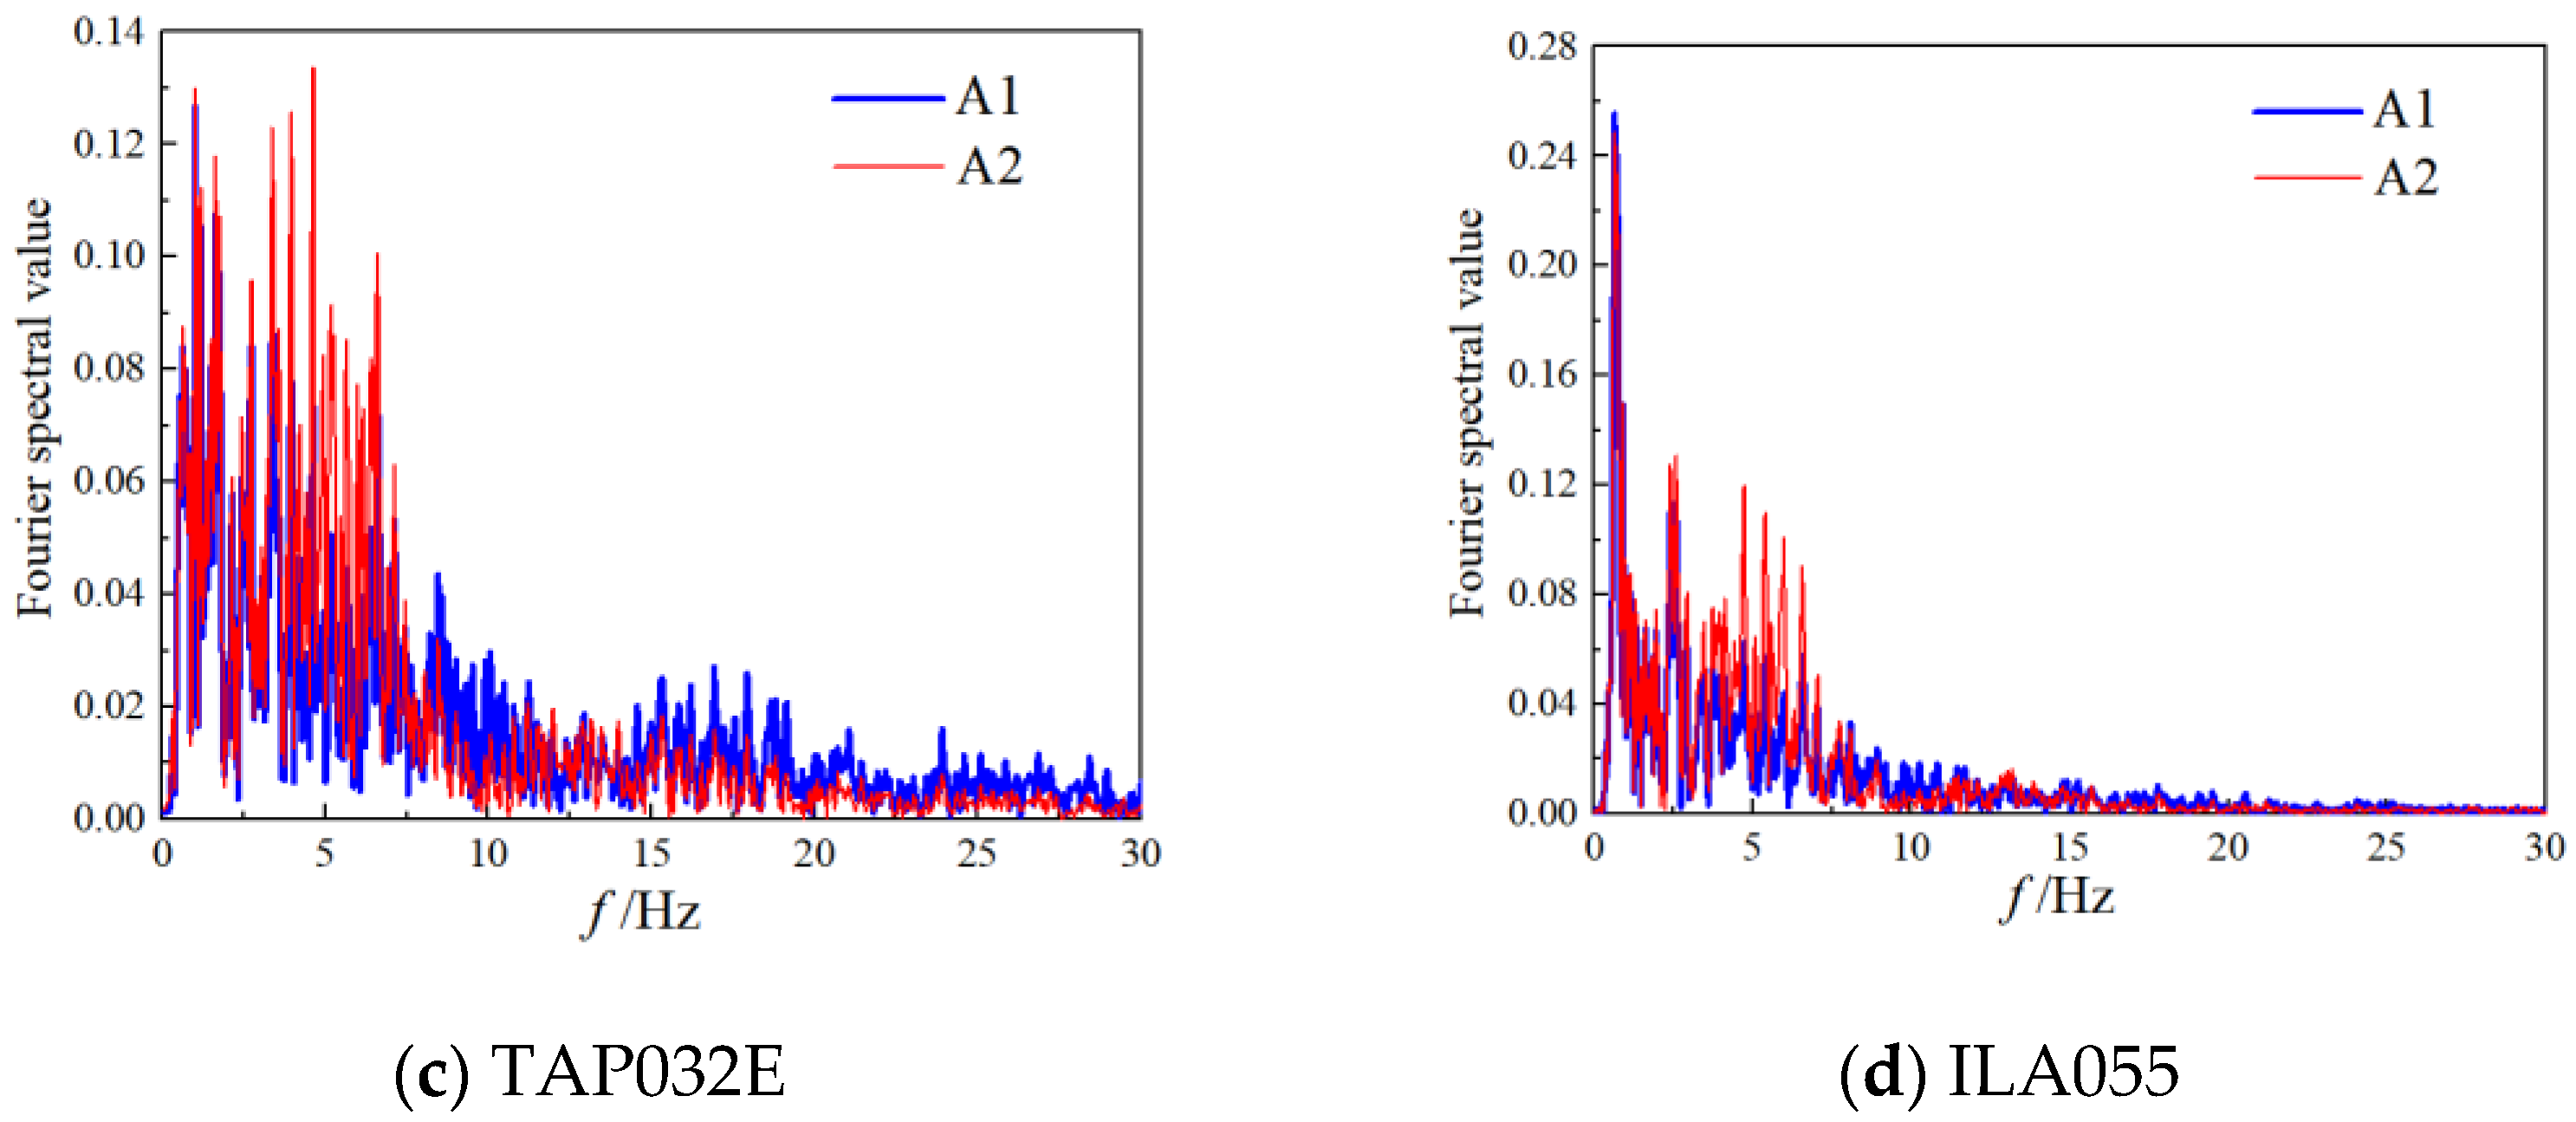
Figure 20 shows the peak value of the imported vibration acceleration of 0.2 g in the four types of seismic motions, namely ELC180, HIK090, TAP032E, and ILA055, at measuring points A1 and A2 of Fourier spectrum of the high-rising layer interval shock system.
As shown in Figure 20, the earthquake-based ground motion amplifies the low-frequency component and filters out the high-frequency component; for example, the far-field common ground motion observed after the foundation soil is filtered, with the energy frequency of 4–6 Hz showing obvious enhancement and that of 8–30 Hz showing a decline. The far-field class harmonic ground motion after the foundation soil is filtered shows an obvious enhancement for the energy frequency of 4–6 Hz and decline at 10–30 Hz. Furthermore, the near-field common and near-field ground motion pulse Fourier spectrum change rule and the far-field are similar to harmonic ground motion.
3.5. Earthquake Response of the Test Model Analysis
3.5.1. Floor Acceleration Response
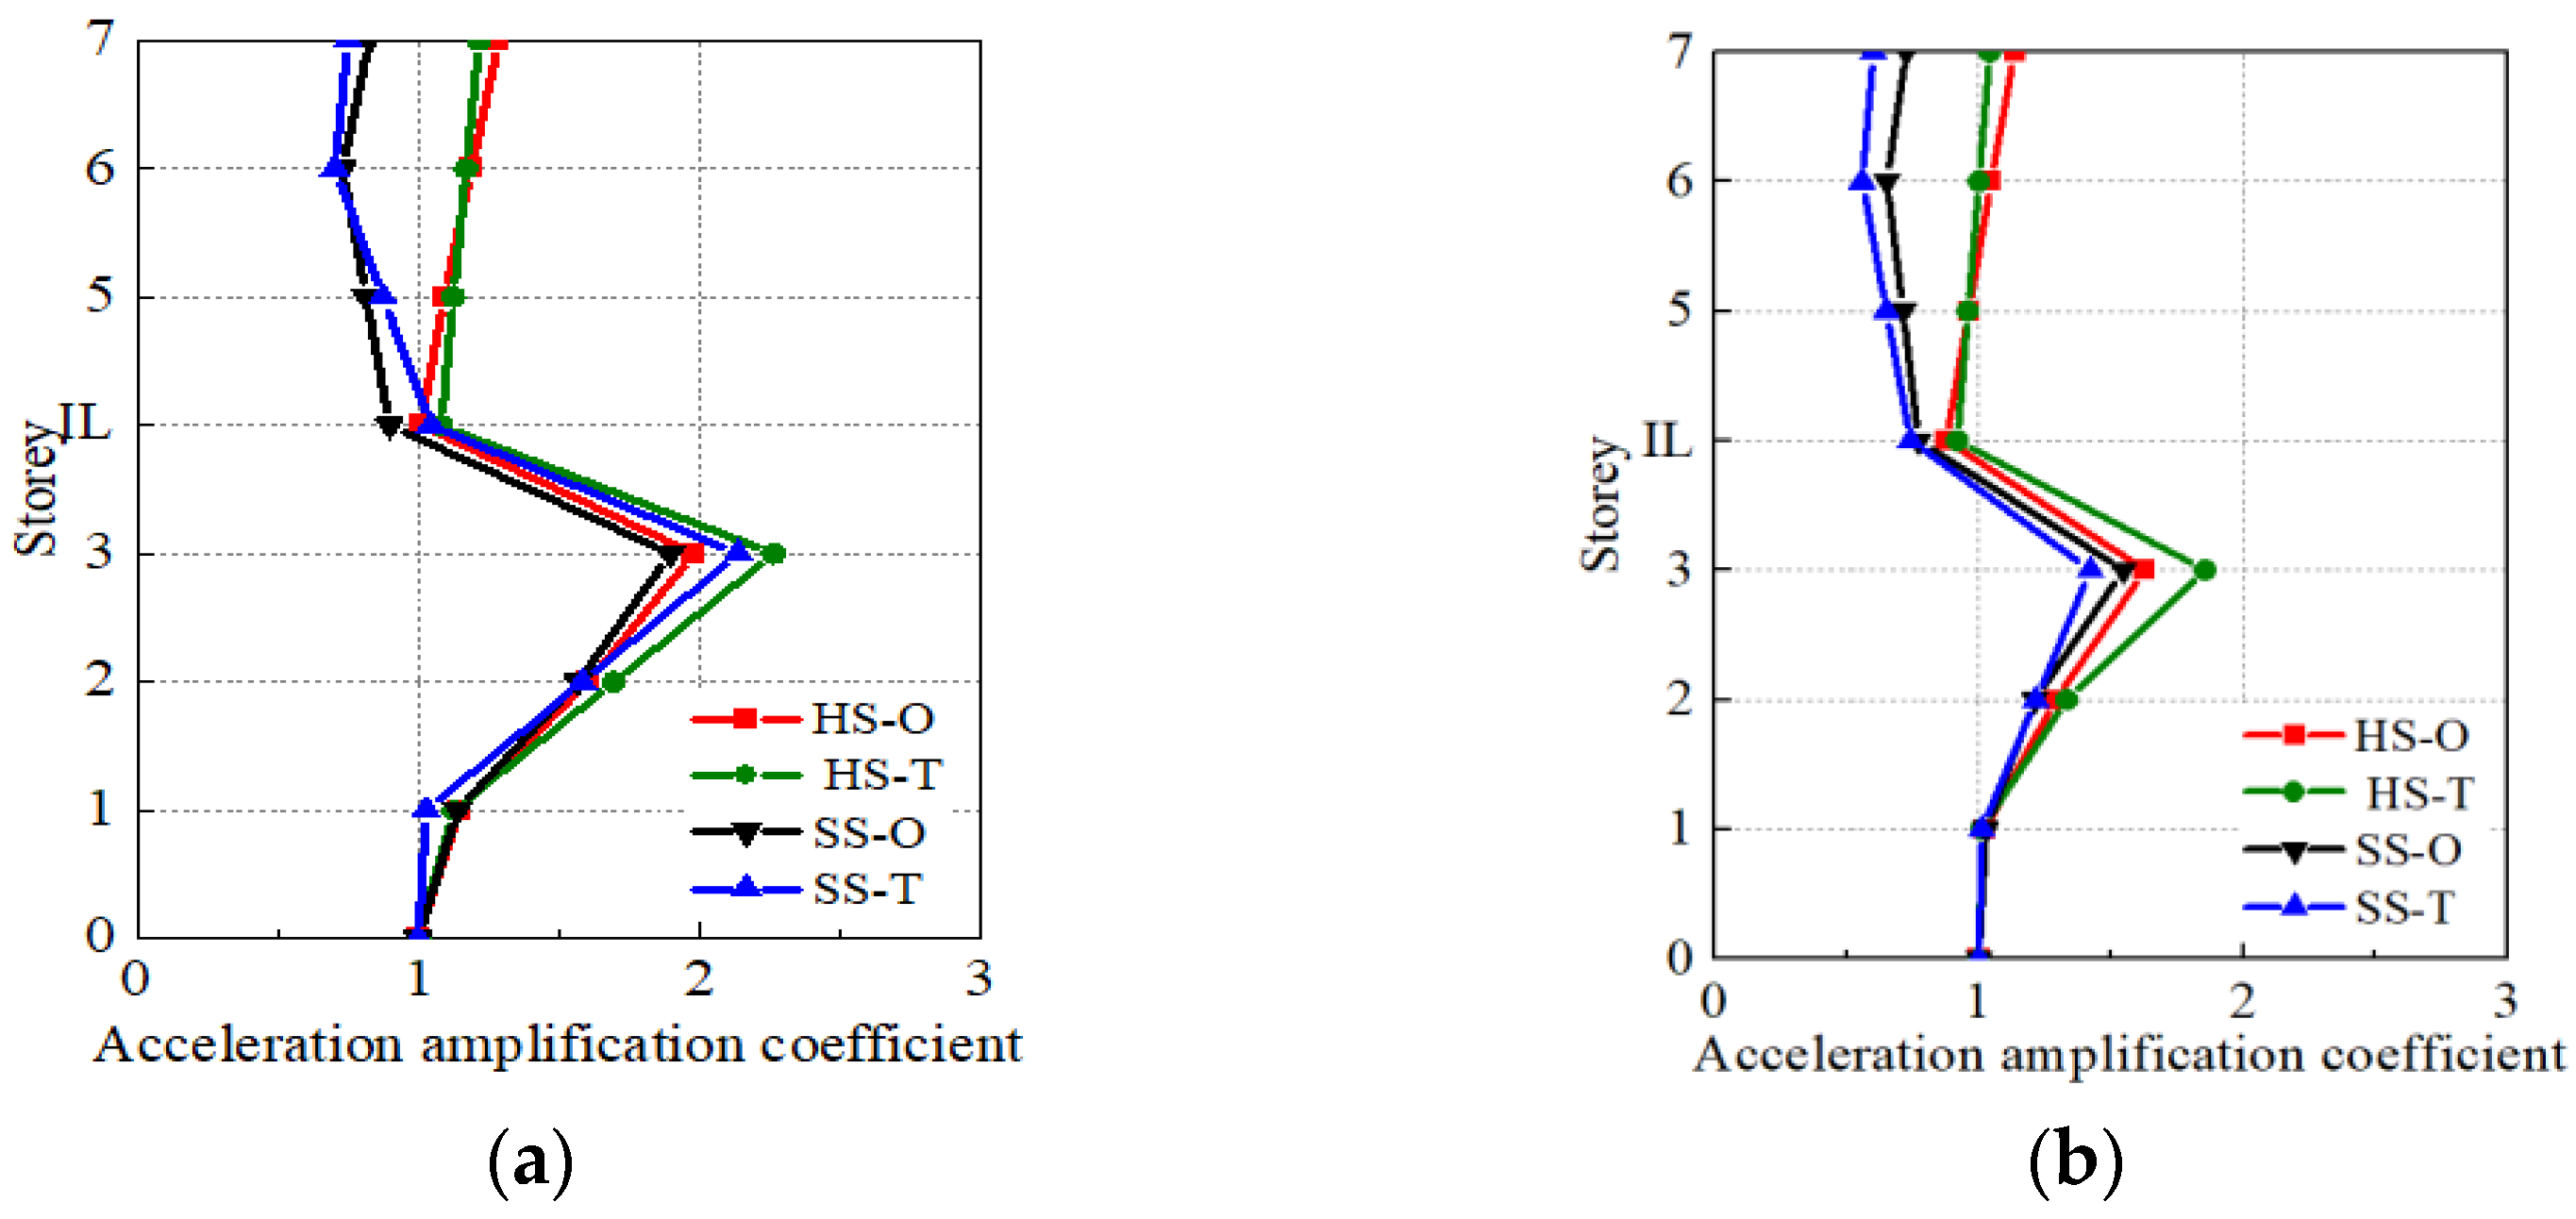
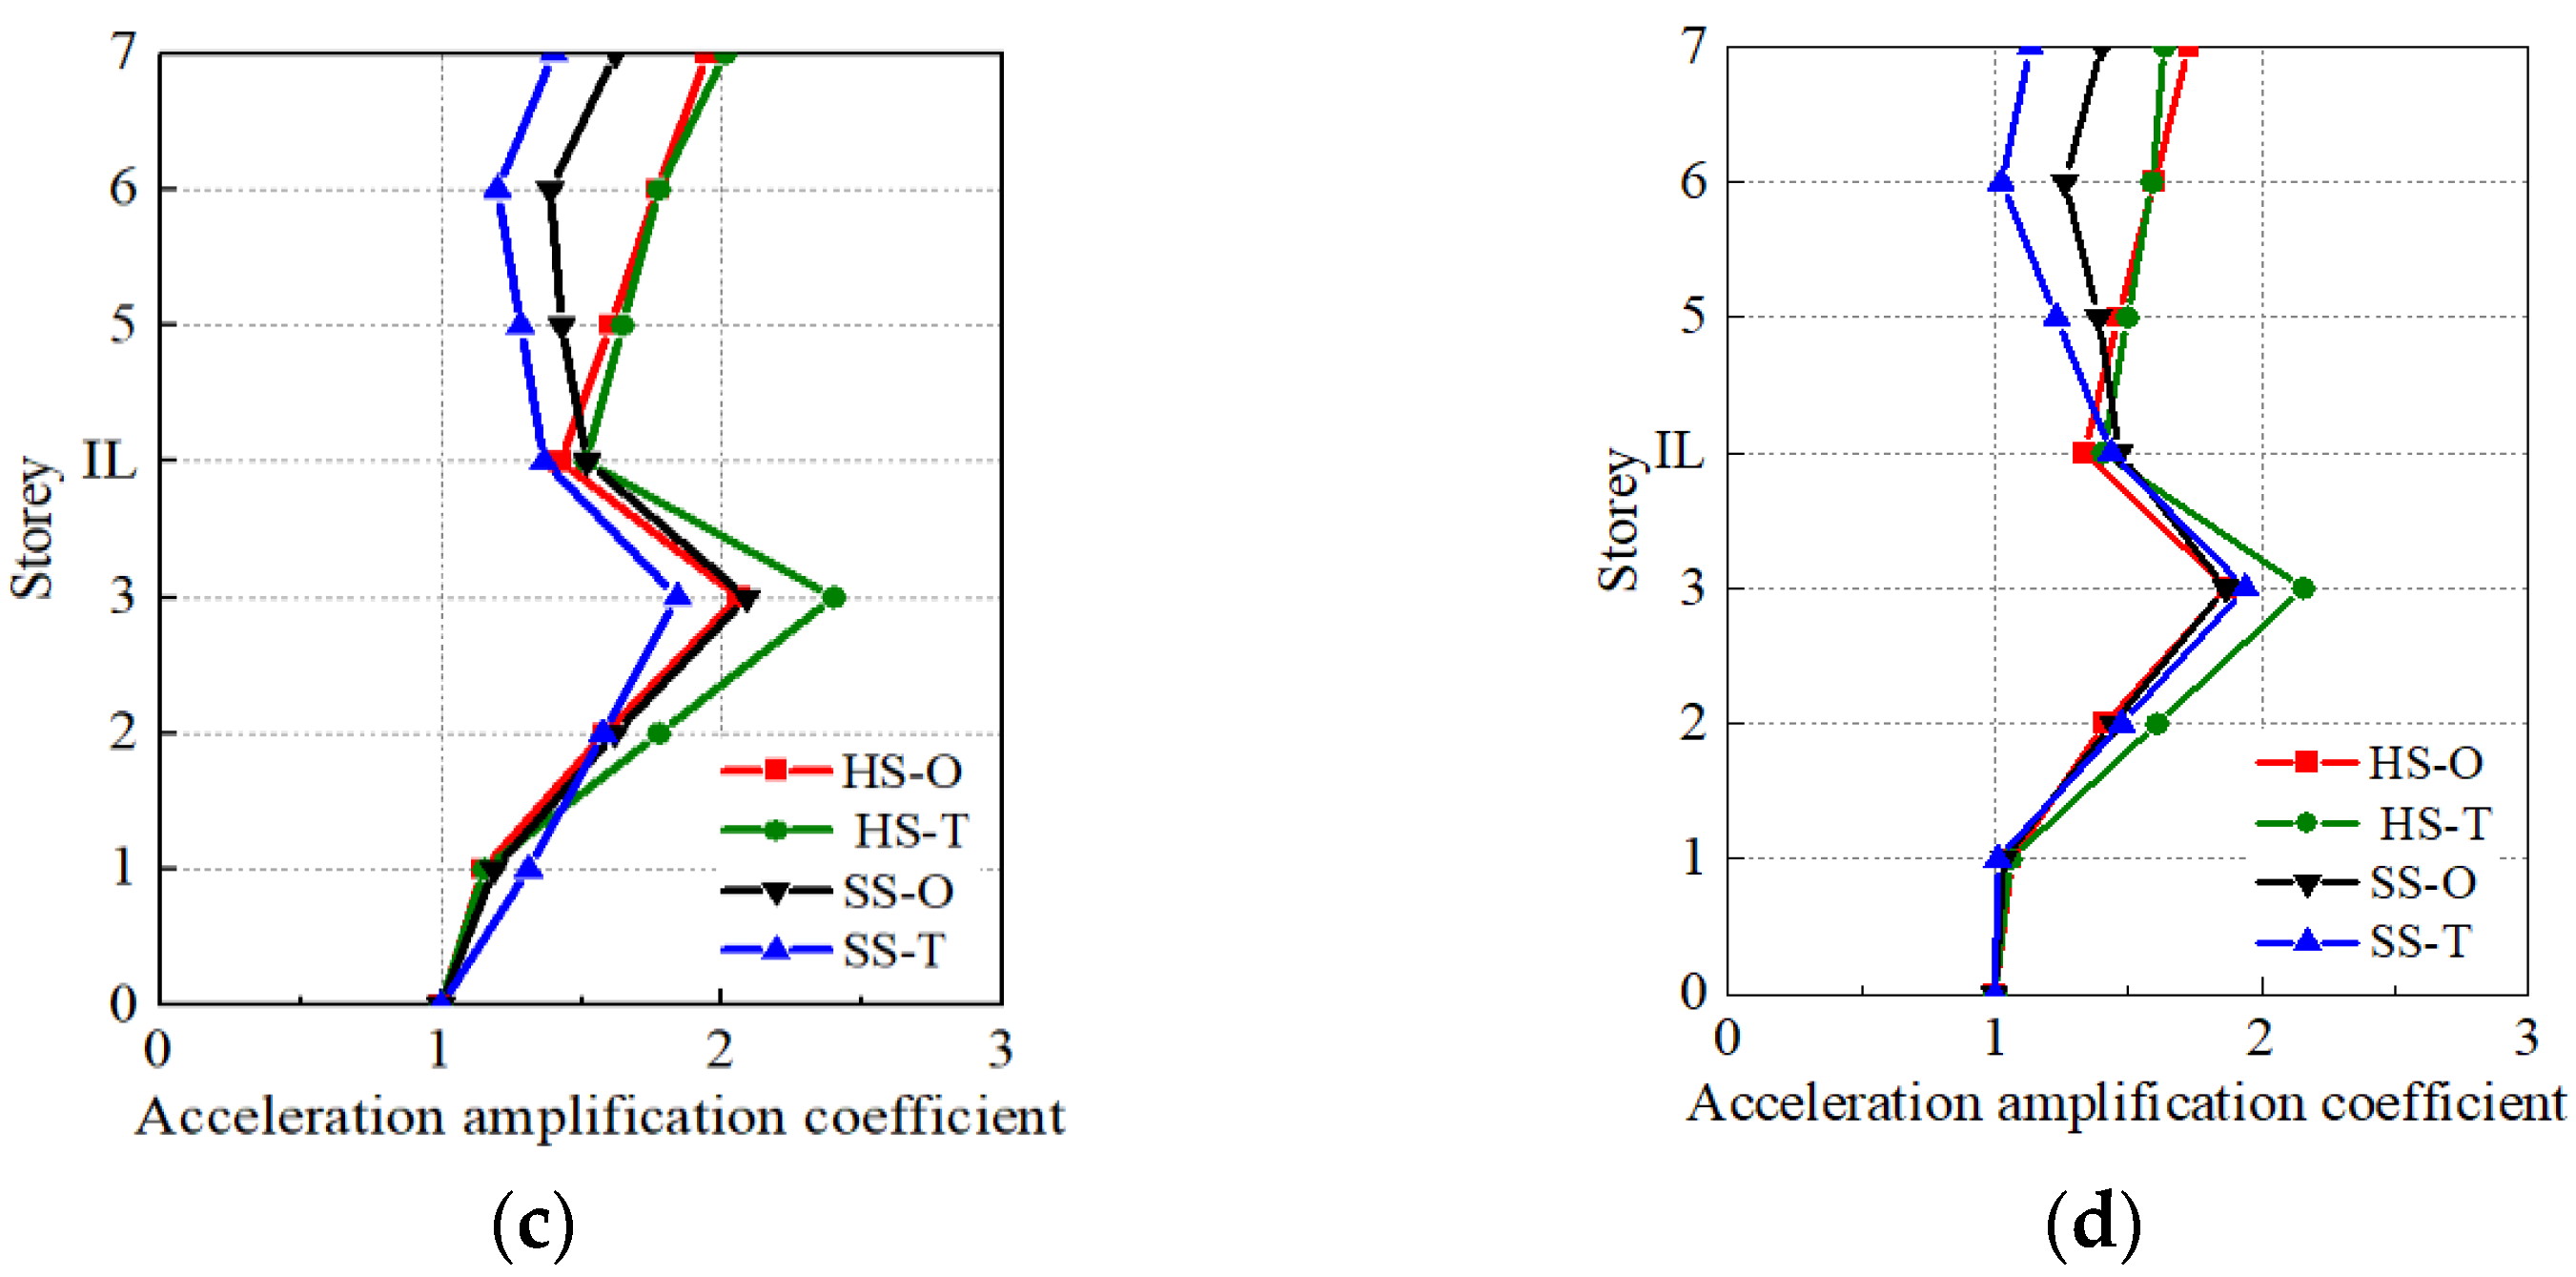
Figure 21 shows under 0.1 g one-way and two-way input of the four types of ground motion under the action of the rigid and soft soil layer interval-shock in the X-direction (acceleration response maximum direction), the acceleration amplification coefficient of contrast.
As shown in Figure 21, (1) for a rigid foundation, the acceleration amplification coefficients of the bottom and upper substructures increase with the increase in the number of floors. In addition, the decrease in the acceleration amplification coefficient is obvious in the isolation layer, and the sound of the one-way input fields and numerical case is close. In the case of a soft soil foundation, the acceleration amplification coefficient of the upper structure increases with the number of floors; however, the performance first decreases, and on the top floor, the performance stabilizes, and the one-way input ground motion is the same. (2) A 0.1 g two-way input in near-field ground motion under the action of ordinary, working condition of rigid–two-way and soft soil–structure of the lower part of the maximum acceleration amplification factor are slightly bigger than the rigid–one-way and soft soil–unidirectional condition, respectively. In the case of the far-field common ground motion, the working condition of the rigid–bidirectional maximum acceleration amplification factor is slightly larger than that of the lower structure under the unidirectional condition. In addition, the working condition of the soft soil–bidirectional amplification coefficient is slightly less than that of the unidirectional soft soil amplification coefficient. Thus, we speculate that the bidirectional input common ground motion increases in the practical test–layer structure between lower rigidity of the structure of the acceleration response; however, the lower part of the soft soil foundation acceleration response of the structure could either increase or decrease. (3) In 0.1 g of the double input of the long-period ground motion, the acceleration amplification coefficient value of the upper structure on rigid foundation and unidirectional input is close, whereas the amplification coefficient on soft soil foundation is slightly less than for the one-way input. The bottom structure of the rigid foundation showed the maximum acceleration amplification coefficient, which was only slightly larger than that for the one-way input. The near-field ground motion under the action of pulse and the lower part of the soft soil foundation of the structure of the maximum acceleration amplification factor are slightly smaller than the one-way input and the far-field kind harmonic ground motion under the action of the slightly larger. Thus, we speculate that the input of two-way, long-period ground motion in the practical test would reduce the acceleration amplification coefficient of the upper structure for the soft soil foundation and increase that of the bottom structure for a rigid foundation, reaching its maximum value. However, the maximum acceleration amplification factor of the structure may also be reduced in the lower part of the soft soil foundation.
3.5.2. Floor-Displacement Response
Figure 22 shows the four types of one-way and two-way input ground motions under the action of rigid isolation and soft soil isolation in the X-direction (maximum displacement response) with respect to the average floor displacement response.
As shown in Figure 22, for a PGA of 0.1 g, four bidirectional types of ground motions are observed under the action of earthquake for the rigid and soft soil foundations; the floor-displacement response on the change rule and the one-way input fields are similar. The common ground motion under the action of two-way input, each layer displacement response peak and one-way approximates to the final input. A two-way input is applied to the near-field ground motion under the action of pulse, and the two peaks of the foundation displacement of the isolation layer were obtained as slightly larger than those obtained using the one-way input conditions; therefore, the displacement of the top floor is large. The two-way input of far-field harmonic ground motion shows two peaks in the foundation displacement of the isolation layer, which are slightly smaller than those obtained under the one-way input conditions; therefore, the top-floor displacement is lesser than that in other cases. Thus, in a practical test between rigid or soft soil layer spacing on the displacement response of the structure, a one-way input situation showed no obvious difference. In comparison, the two-way input ground motion over a long period may increase and/or decrease the displacement response of the isolation layer; thus, the structure of the top floor displacement could be increased or decreased.
3.5.3. Floor-Based Shear Response among Layers
Figure 23 shows the four types of one- and two-way input ground motions in the case of PGA = 0.1 g under the action of rigid and soft soil foundation of the upper structure in the X-direction (direction of maximum shear response between the layers) with respect to the average interlaminar shear contrast.
As shown in Figure 23, for PGA of 0.1 g, four types of bidirectional motions under the action of earthquakes were input for the cases of rigid and soft soil layers between the upper structure between floor shear change rule, and the one-way input fields are similar. For the earthquake-based ground motion, PGA = 0.1 g because the structure between each layer of interlayer shear force is small; therefore, the two-way ground motion under the action of earthquake between floors with interlaminar shear and unidirectional input is relatively close. In a two-way long-period ground motion under the action of earthquake, the interlaminar shear of the structure for both the rigid and soft soil foundations is slightly greater than that in the case of one-way input. However, in the actual experiment, the two-way input ground motion over a long period will enhance the layer structure between floors of the interlaminar shear; this still needs further analysis of the input field vibration for the peak acceleration of 0.2 g.
4. Comparative Analysis of Theoretical and Experimental Results
4.1. Establishment of a 3D Global Finite-Element Model
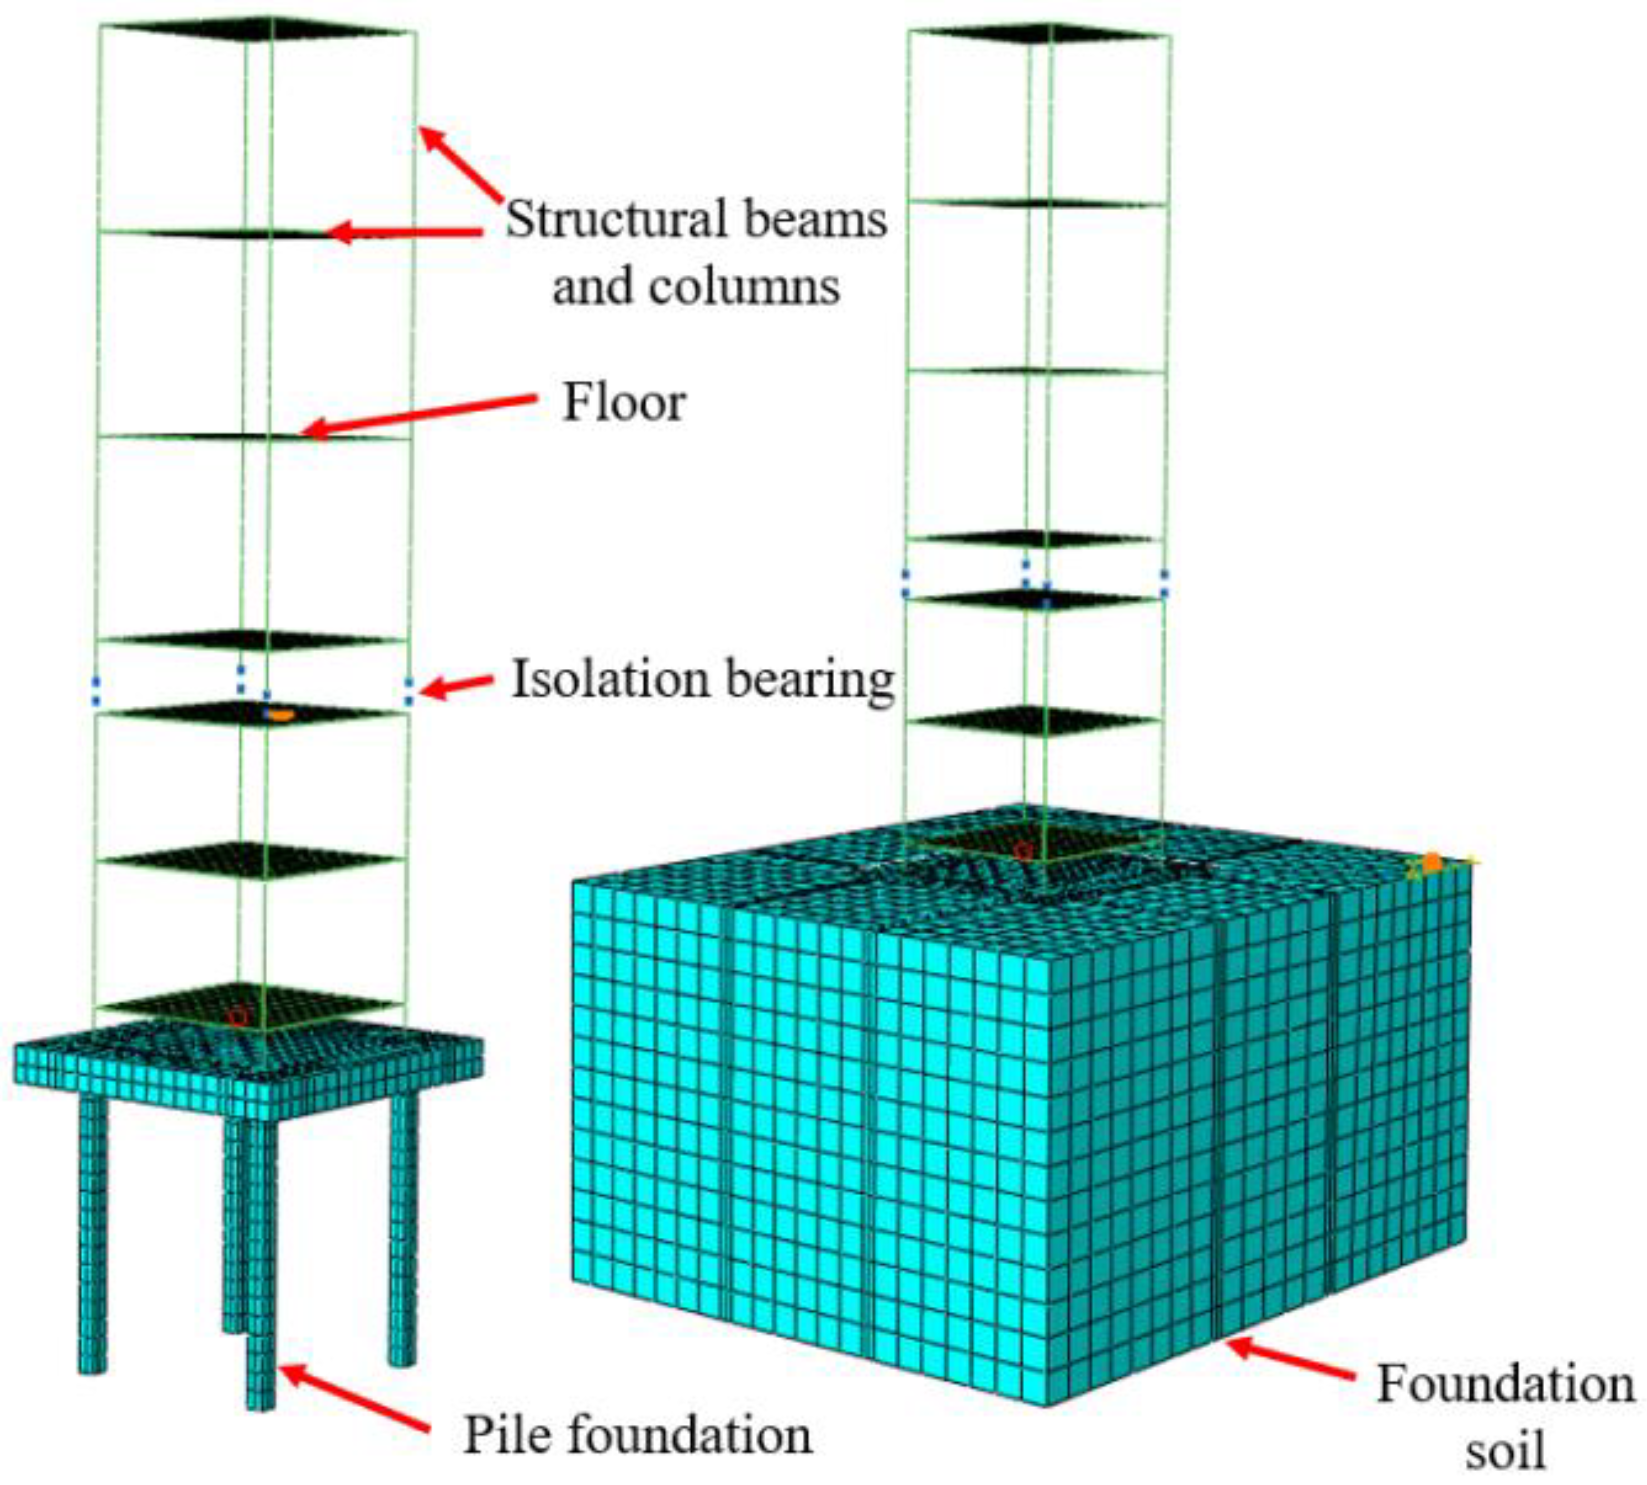
By using 3D wires to simulate beams and columns and by assigning corresponding properties and dimensions, B31 elements were used to simulate their cross-section. Next, a floor slab was simulated using a 3D shell and the required thickness was assigned. The bob-weight of each layer is then converted into density and assigned to the floor slab properties. By using connecting elements to simulate isolation bearings and assigning constitutive properties, the assembly problem of the beams, columns, and plates was solved using common nodes to reduce the calculation time while accurately simulating the dynamic characteristics and seismic response of interlayer isolation structures. The cushion cap, pile foundation, and foundation soil are all simulated using C3D8R solid elements and pairwise contact. The foundation soil was simulated using the M–C constitutive model. In addition, the cushion cap and pile foundation were simulated using a concrete plastic damage constitutive model, and the internal steel bars were simulated using 3D wires, with their respective material properties assigned. Figure 24 shows the model of the pile–soil interlayer isolation structure system.
4.2. Modal Comparative Analysis
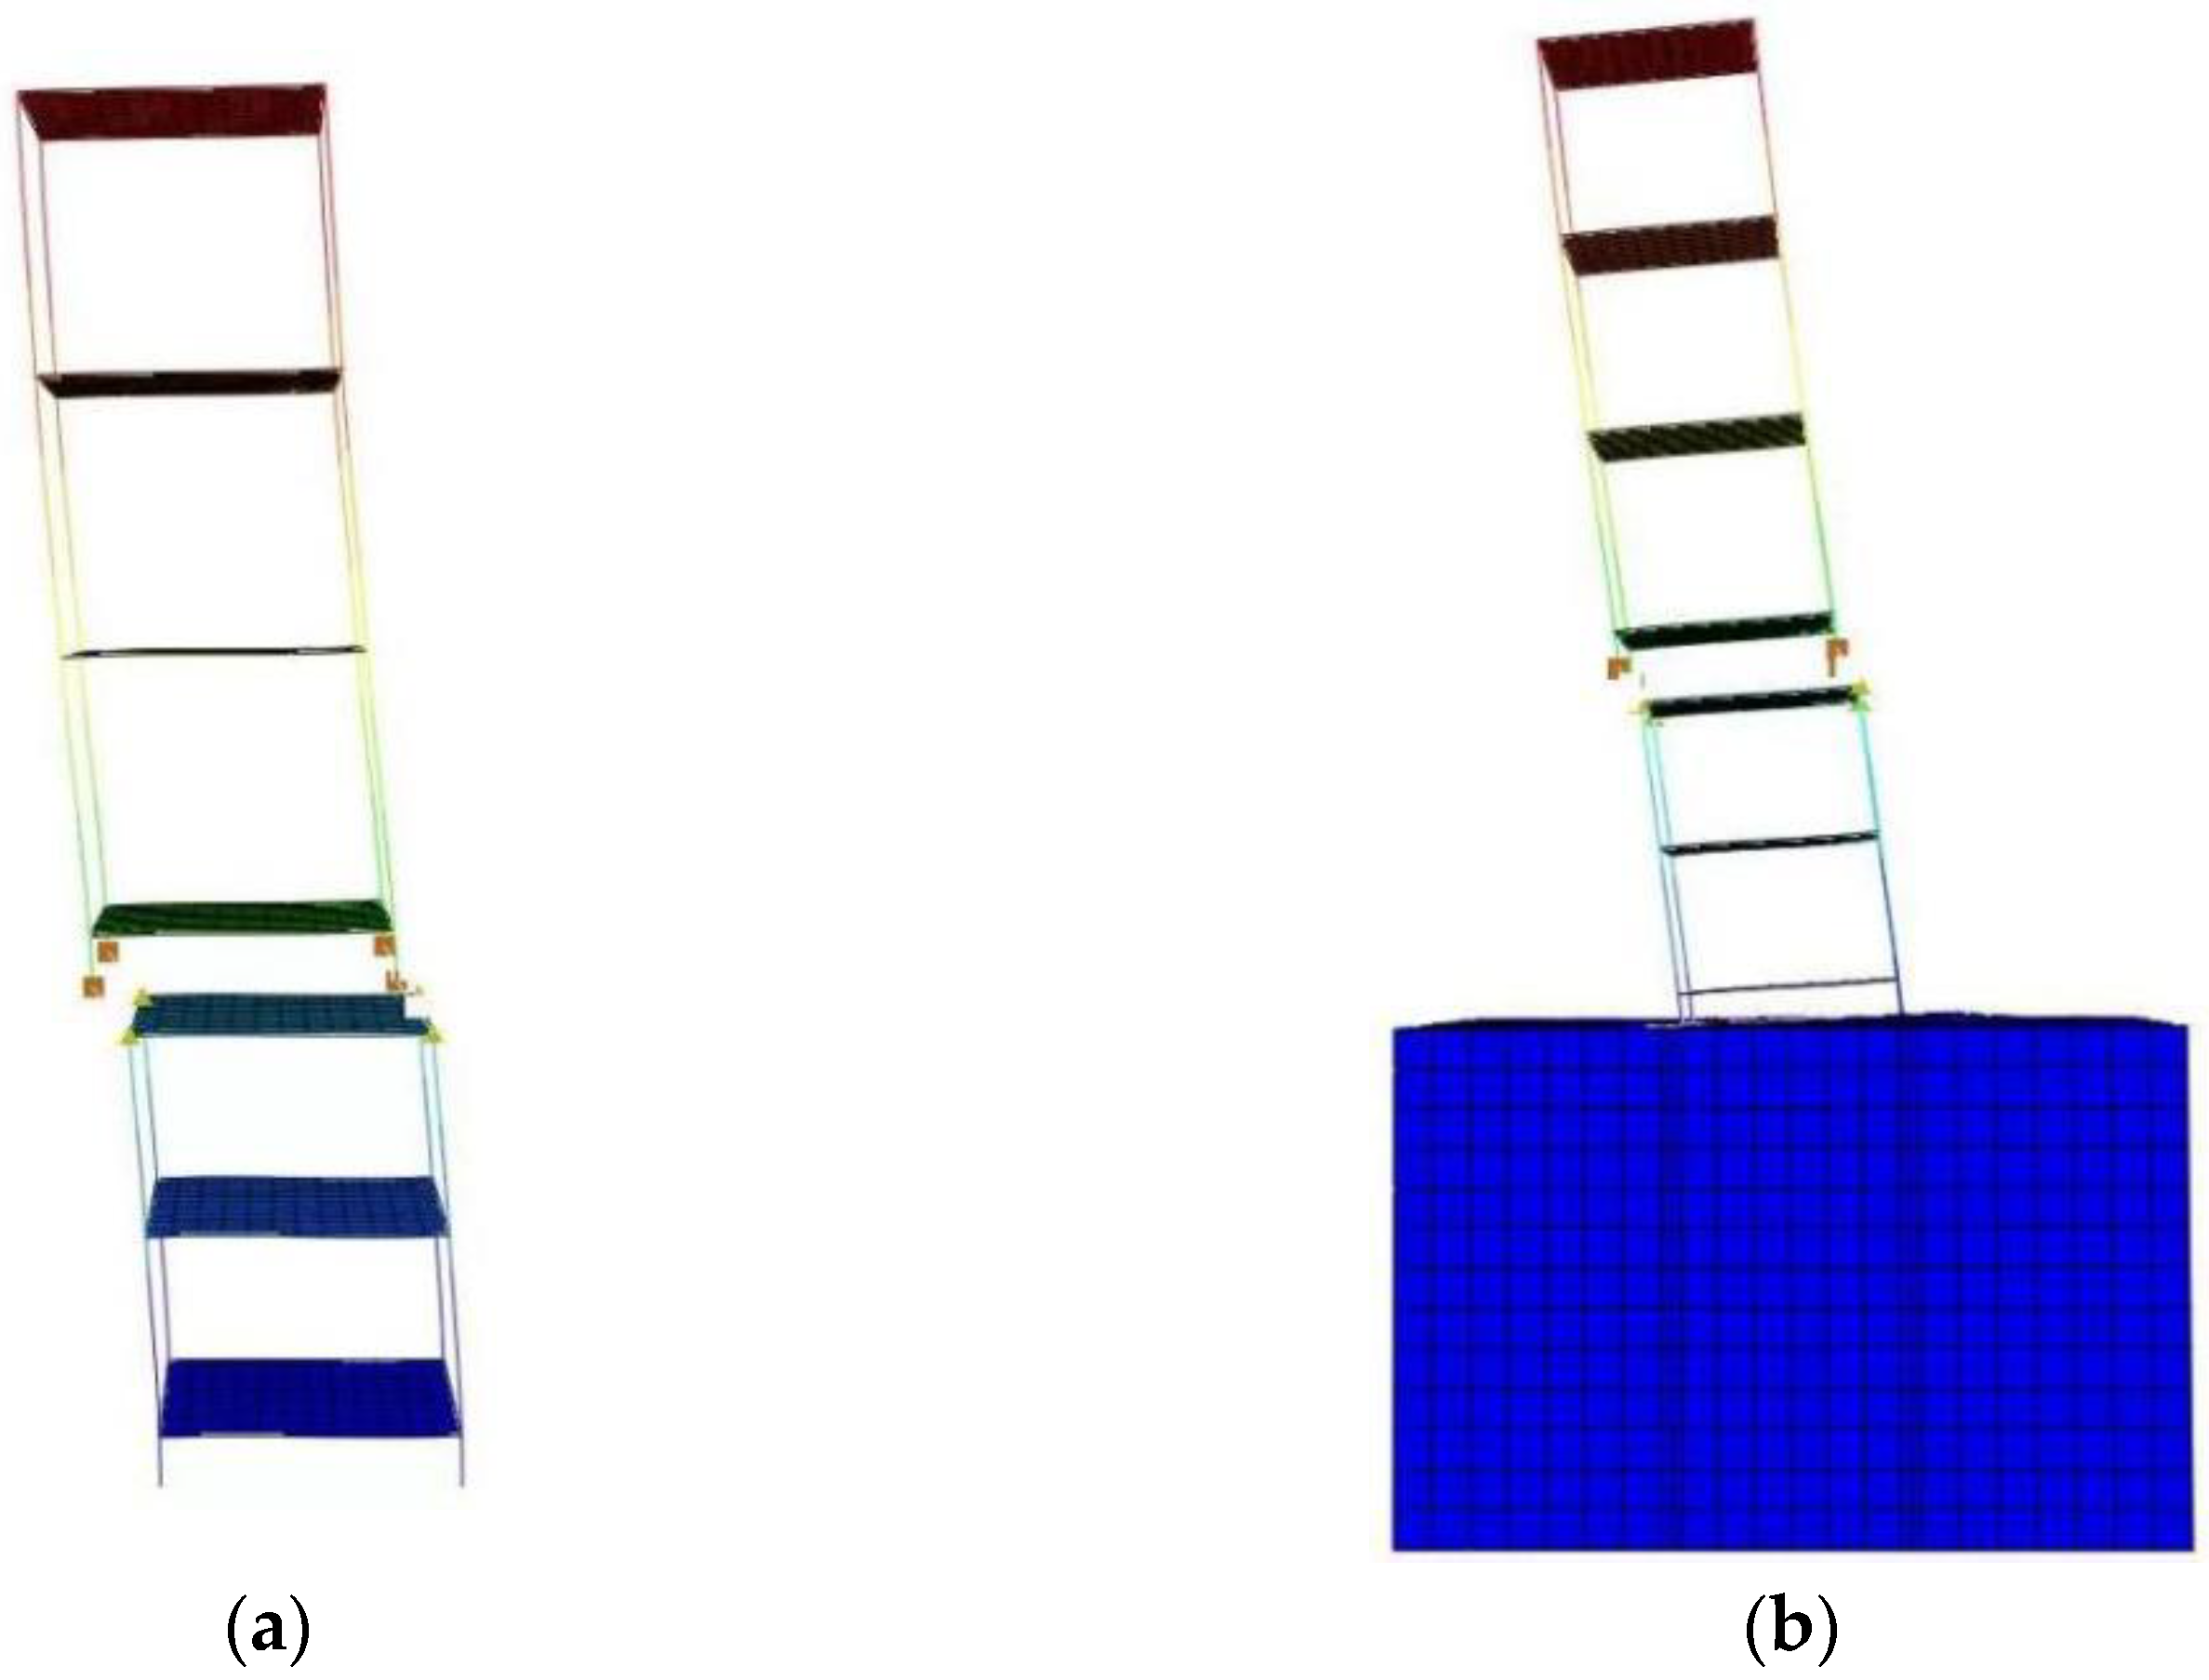
By using the Lanczos method for modal analysis of two models, the natural frequencies and vibrational modes were obtained. Figure 25 shows the first-order mode shapes of two models: rigid and soft soil interlayer isolation models.
The comparative analysis shows that the deformation of the structure in both models is mainly reflected in the lateral displacement and rotation, and the lateral displacement is mainly reflected in the position of the isolation layer. The lateral displacement of the interlayer isolation structure under the rigid foundation conditions is more significant than that on the soft soil foundation. Table 9 provides a comparison between the natural and experimental vibration period values of the two models.
Table 9 shows that the natural vibration period of interlayer isolation structures on the soft soil foundation when considering SSI effect is approximately 1.2 times longer than that in the case of a rigid foundation. The error between the natural and experimental vibration period values of the rigid and soft soil interlayer isolation models is within 3%, thus verifying the reliability of using two finite-element models for seismic-response analysis.
4.3. Seismic-Response Analysis under Single and Bidirectional Seismic Motion
4.3.1. Comparison of Floor Acceleration Response
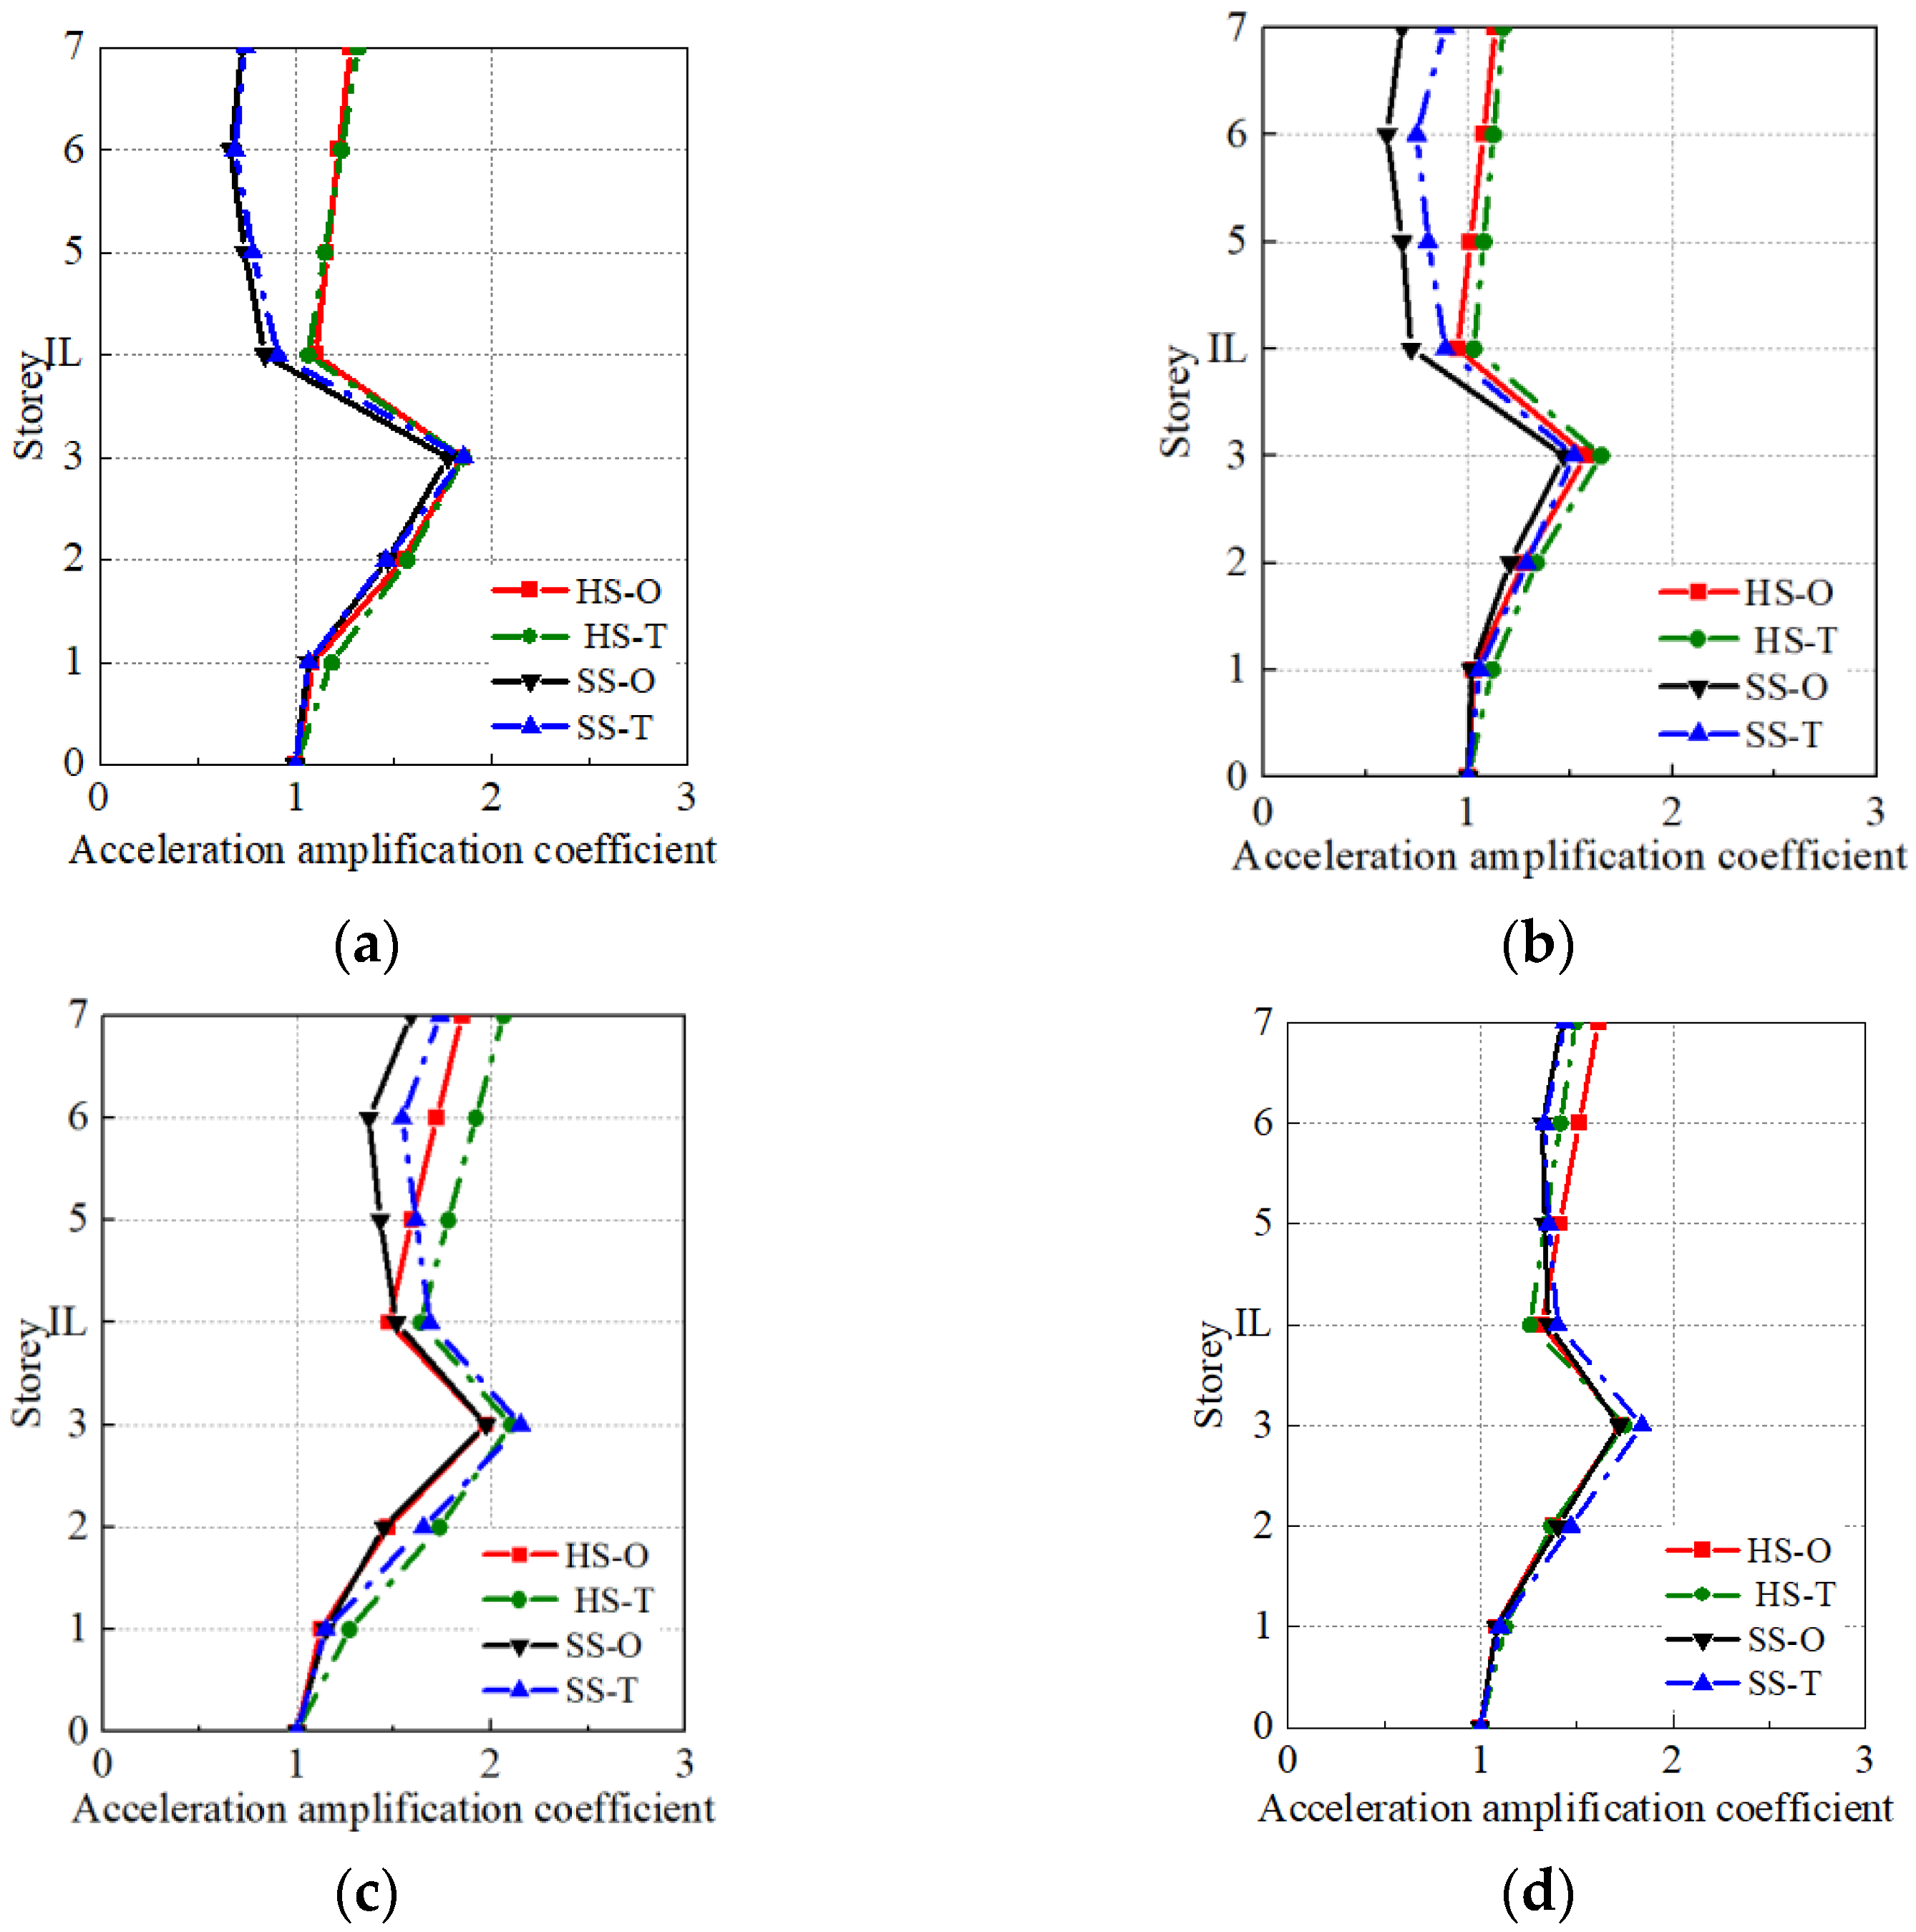
Figure 26 shows the comparison between the average absolute peak acceleration values of rigid and soft soil interlayer isolation under four types of seismic motions with an acceleration of 0.2 g in the X-direction and bidirectional input.
Figure 26 shows that when the PGA is 0.2 g, the impact of different seismic input forms on the acceleration response of the substructure is significantly smaller than when PGA = 0.1 g. The difference in the acceleration response of the substructure between the two systems is relatively small under unidirectional seismic input. It can be inferred that as the peak acceleration of input seismic motion increases, the acceleration response of the rigid and soft soil interlayer isolation systems under the bidirectional seismic motion is closer to that of the unidirectional input seismic motion. Under the action of single and bidirectional input ordinary seismic motions, the maximum acceleration amplification coefficients of the lower structure of the rigid and the soft soil interlayer isolation system are significantly greater than those of the upper structure; especially, after considering the SSI effect, the acceleration response of the upper structure is significantly weakened. Under the action of single and bidirectional input long-period seismic motions, although the SSI effect has a certain weakening effect on the acceleration response of the upper structure, the acceleration amplification coefficient of the top layer of the upper structure is still close to that in the rigid foundation condition. Therefore, for the design of interlayer isolation structures under a soft soil foundation under long-period seismic coupling conditions, the research focus must be on the safety of the top layer of the upper structure. Furthermore, when considering the influence of SSI effect, the acceleration response of the upper structure decreases; however, with the increase of PGA, the weakening of the acceleration response under long-term seismic motion is smaller than that under ordinary seismic motion. Under the action of 0.2 g ordinary seismic motion, the maximum amplification coefficient of the top layer acceleration of the upper structure on the rigid foundation is 1.32, and it is 0.74 on a soft soil foundation. Under the action of 0.2 g long-period seismic motion, the maximum acceleration amplification coefficient of the top layer of the upper structure on the rigid foundation is 2.06, and it is 1.74 on the soft soil foundation. However, considering the SSI effect, the acceleration amplification coefficient at the top of the lower structure is significantly greater than that at the top of the upper structure. Therefore, in the structure design, the safety of the lower structure must be focused on under the earthquake action.
4.3.2. Comparison between Floor-Displacement Responses
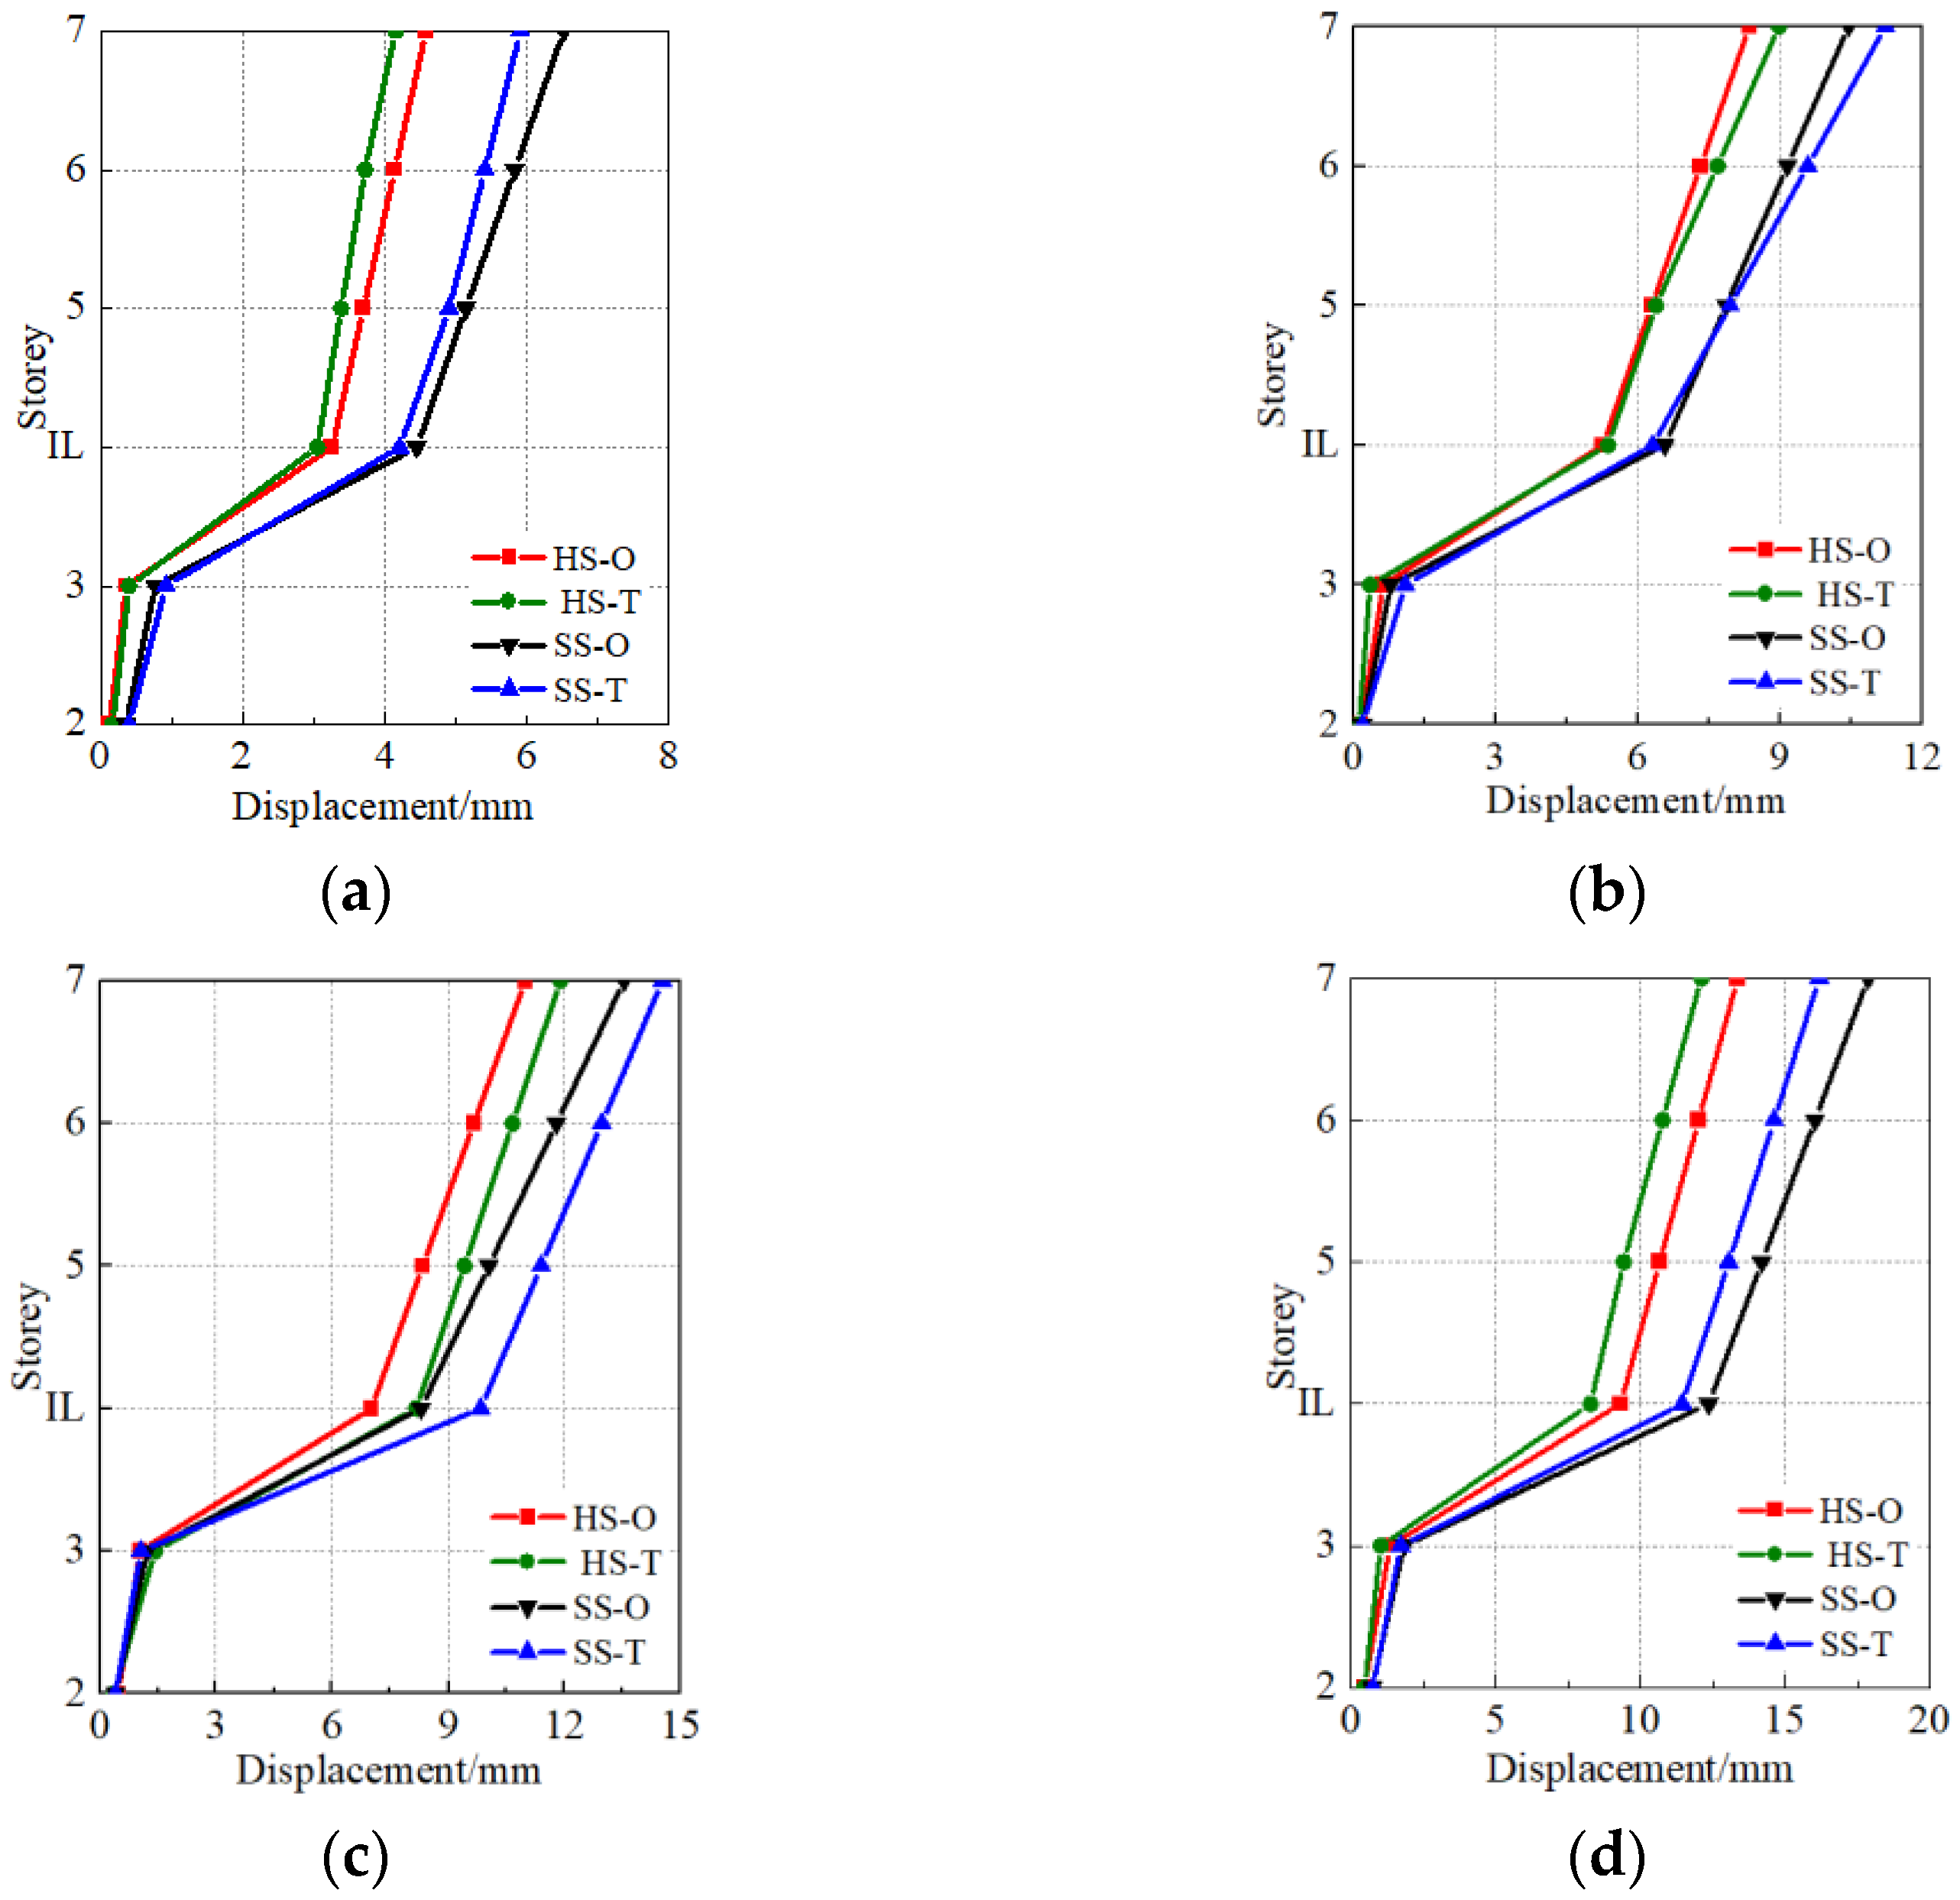
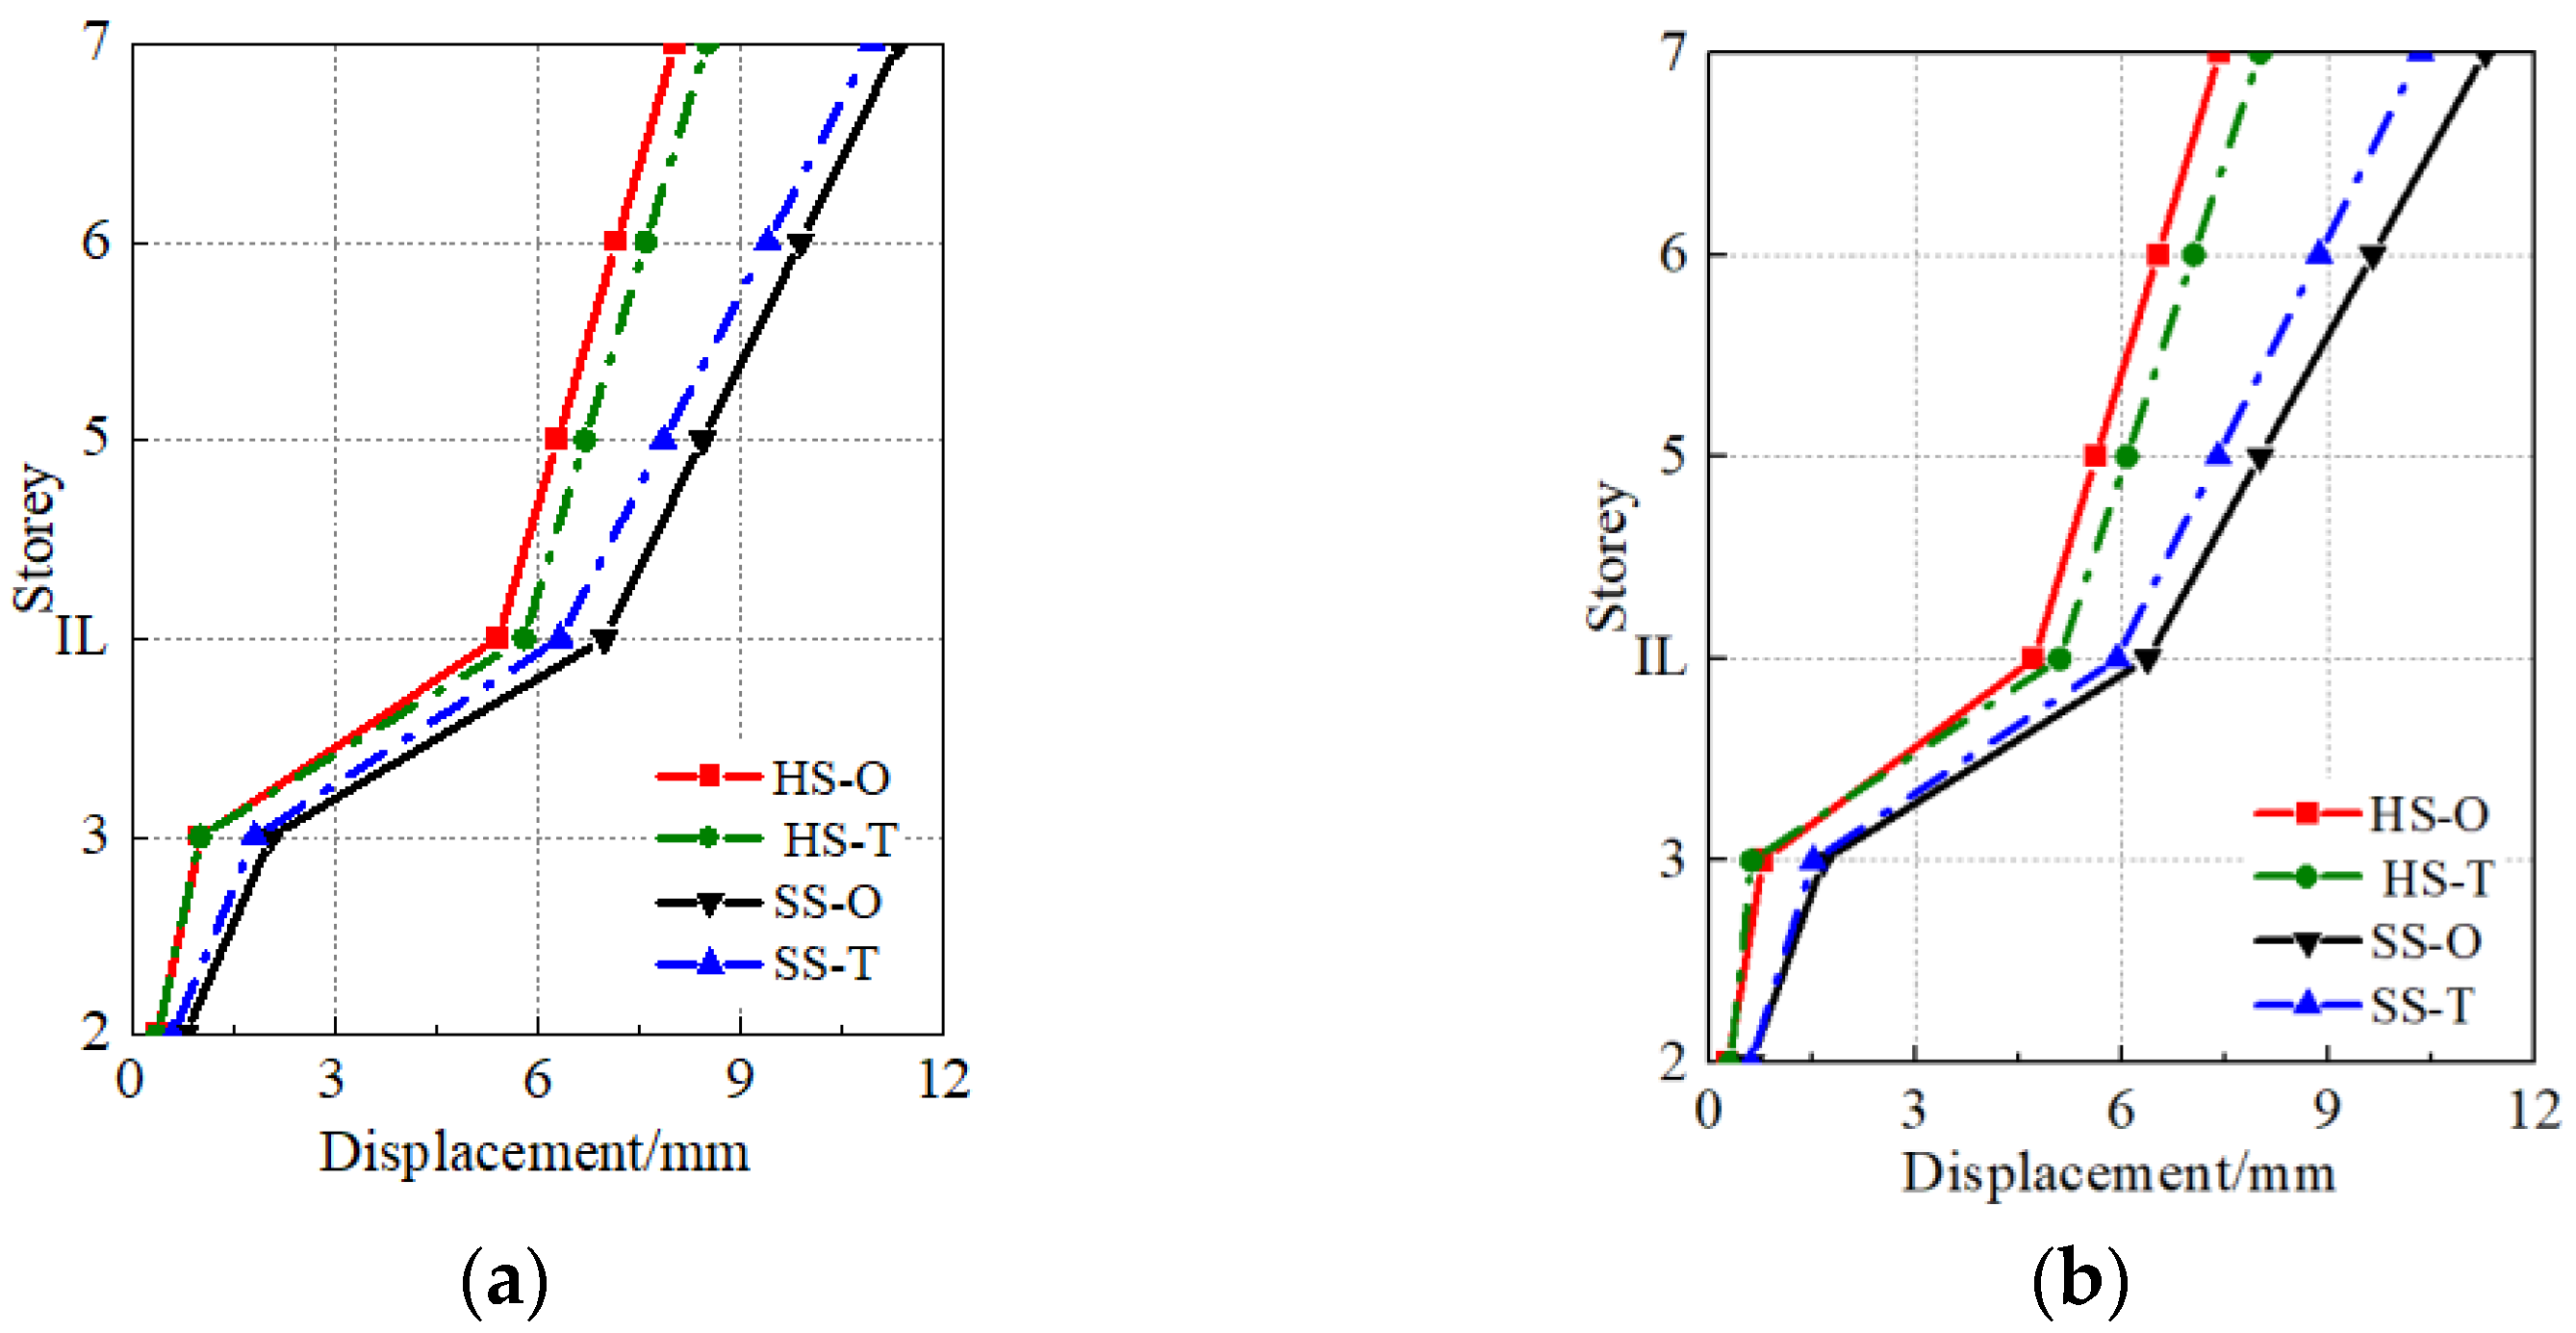
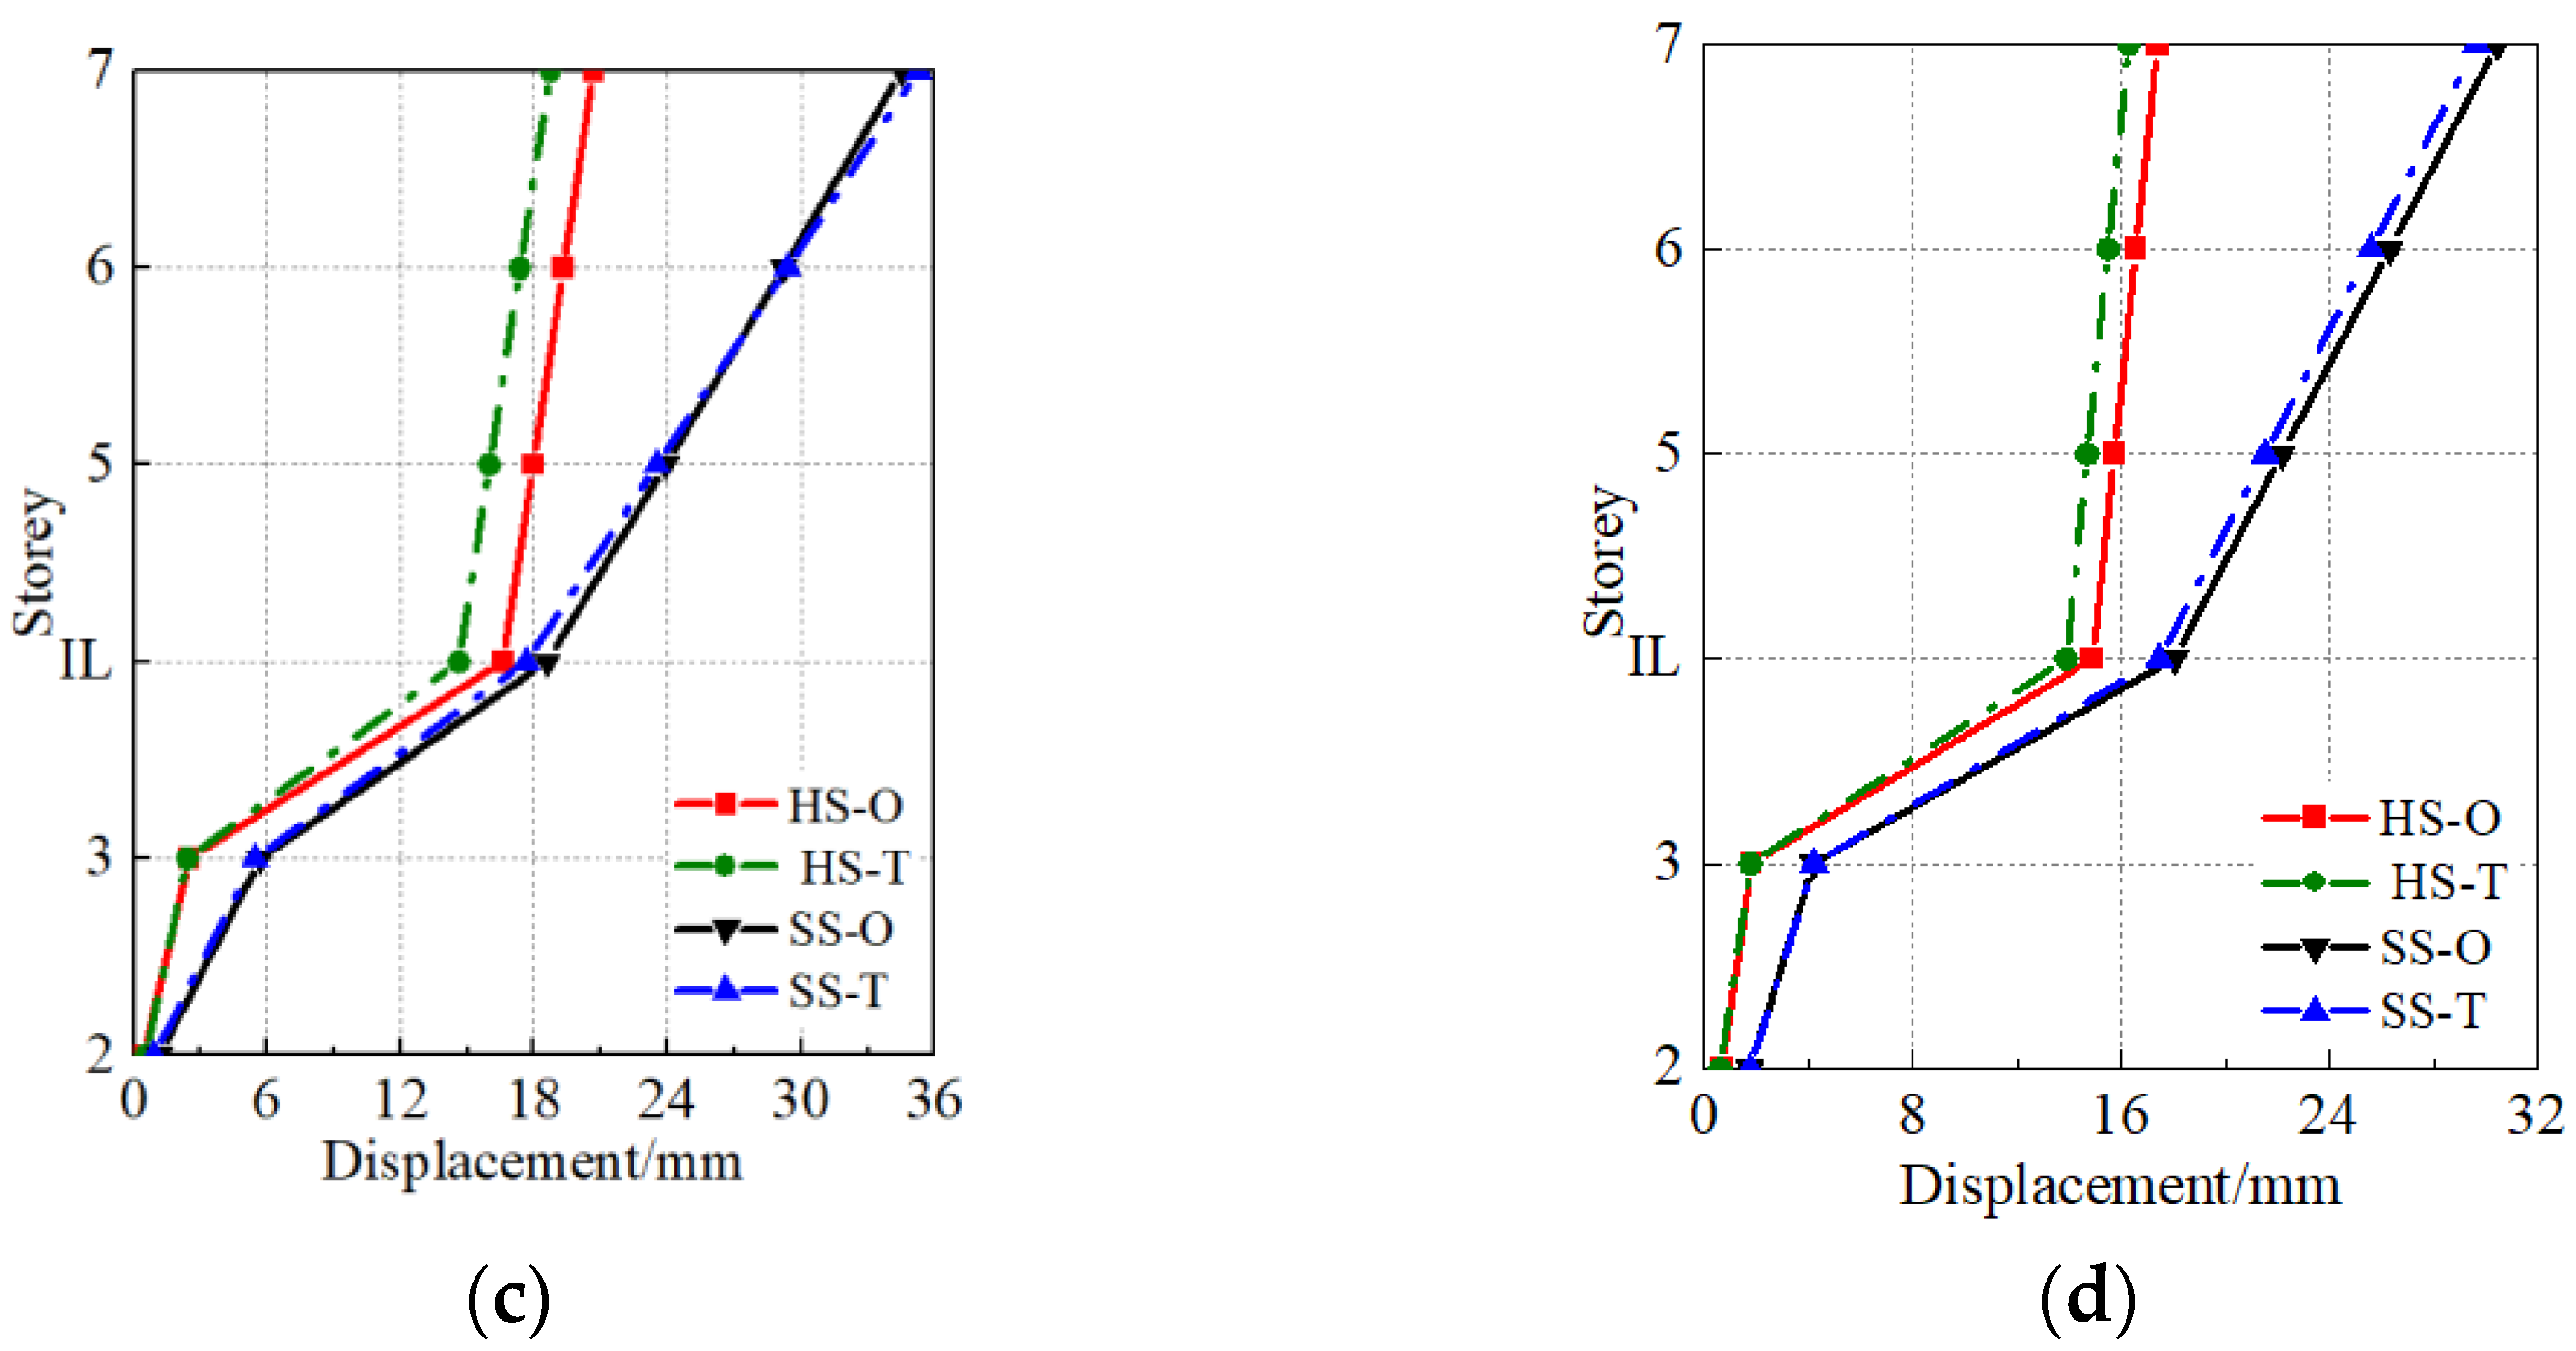
Figure 27 shows the comparison between the average floor-displacement responses of the rigid and soft soil interlayer isolation structures under four types of seismic motions with a 0.2 g input in the X-direction and bidirectional directions.
Figure 27 shows that (1) under the four types of ground motions with a bidirectional input, the floor-displacement response of the interlayer isolation structures is greater on soft soil foundation than rigid foundation. With the increase in the number of floors of the lower structure, its displacement in the case of the soft soil interlayer isolation system changes slightly more than that of the rigid foundation. Under a long-term seismic motion, the top displacement response of the soft soil interlayer isolation system is significantly greater than that of the rigid foundation. This indicates that the coupling of the long-term seismic motion with the soft soil foundation significantly enhances the displacement response of the upper part of the interlayer isolation structure. Therefore, when designing isolation structures, the focus must be on the issue of exceeding the displacement limit of the upper structure under the coupling of long-term seismic motion and the soft-soil foundation. (2) Under long-period ground motion with bidirectional input (PGA = 0.1 g), the displacement change in the isolation layer is slightly different than that in the case of a unidirectional input. However, as PGA increases, the displacement change of the isolation layer is close to that for the case of unidirectional input. With the increase of PGA, the displacement value of the upper structure of the soft soil interlayer isolation system under long-term seismic motion is closer to that in the case of the unidirectional input. However, for other cases, there is still a certain gap between it and unidirectional input. (3) When considering the influence of the SSI effect, the floor-displacement response of the interlayer isolation structure is significantly amplified. Under the action of 0.2 g ordinary ground motion, the displacement response of the top layers of the upper and lower structures built on soft soil foundation is 1.52 and 2.01 times that for the structures on the rigid foundation, respectively. Under the action of 0.2 g long-period seismic motion, the displacement response of the top layers of the upper and lower structures is 1.88 and 2.39 times that of the structure on the rigid foundation, respectively.
4.3.3. Comparison of the Shear Response between Floors
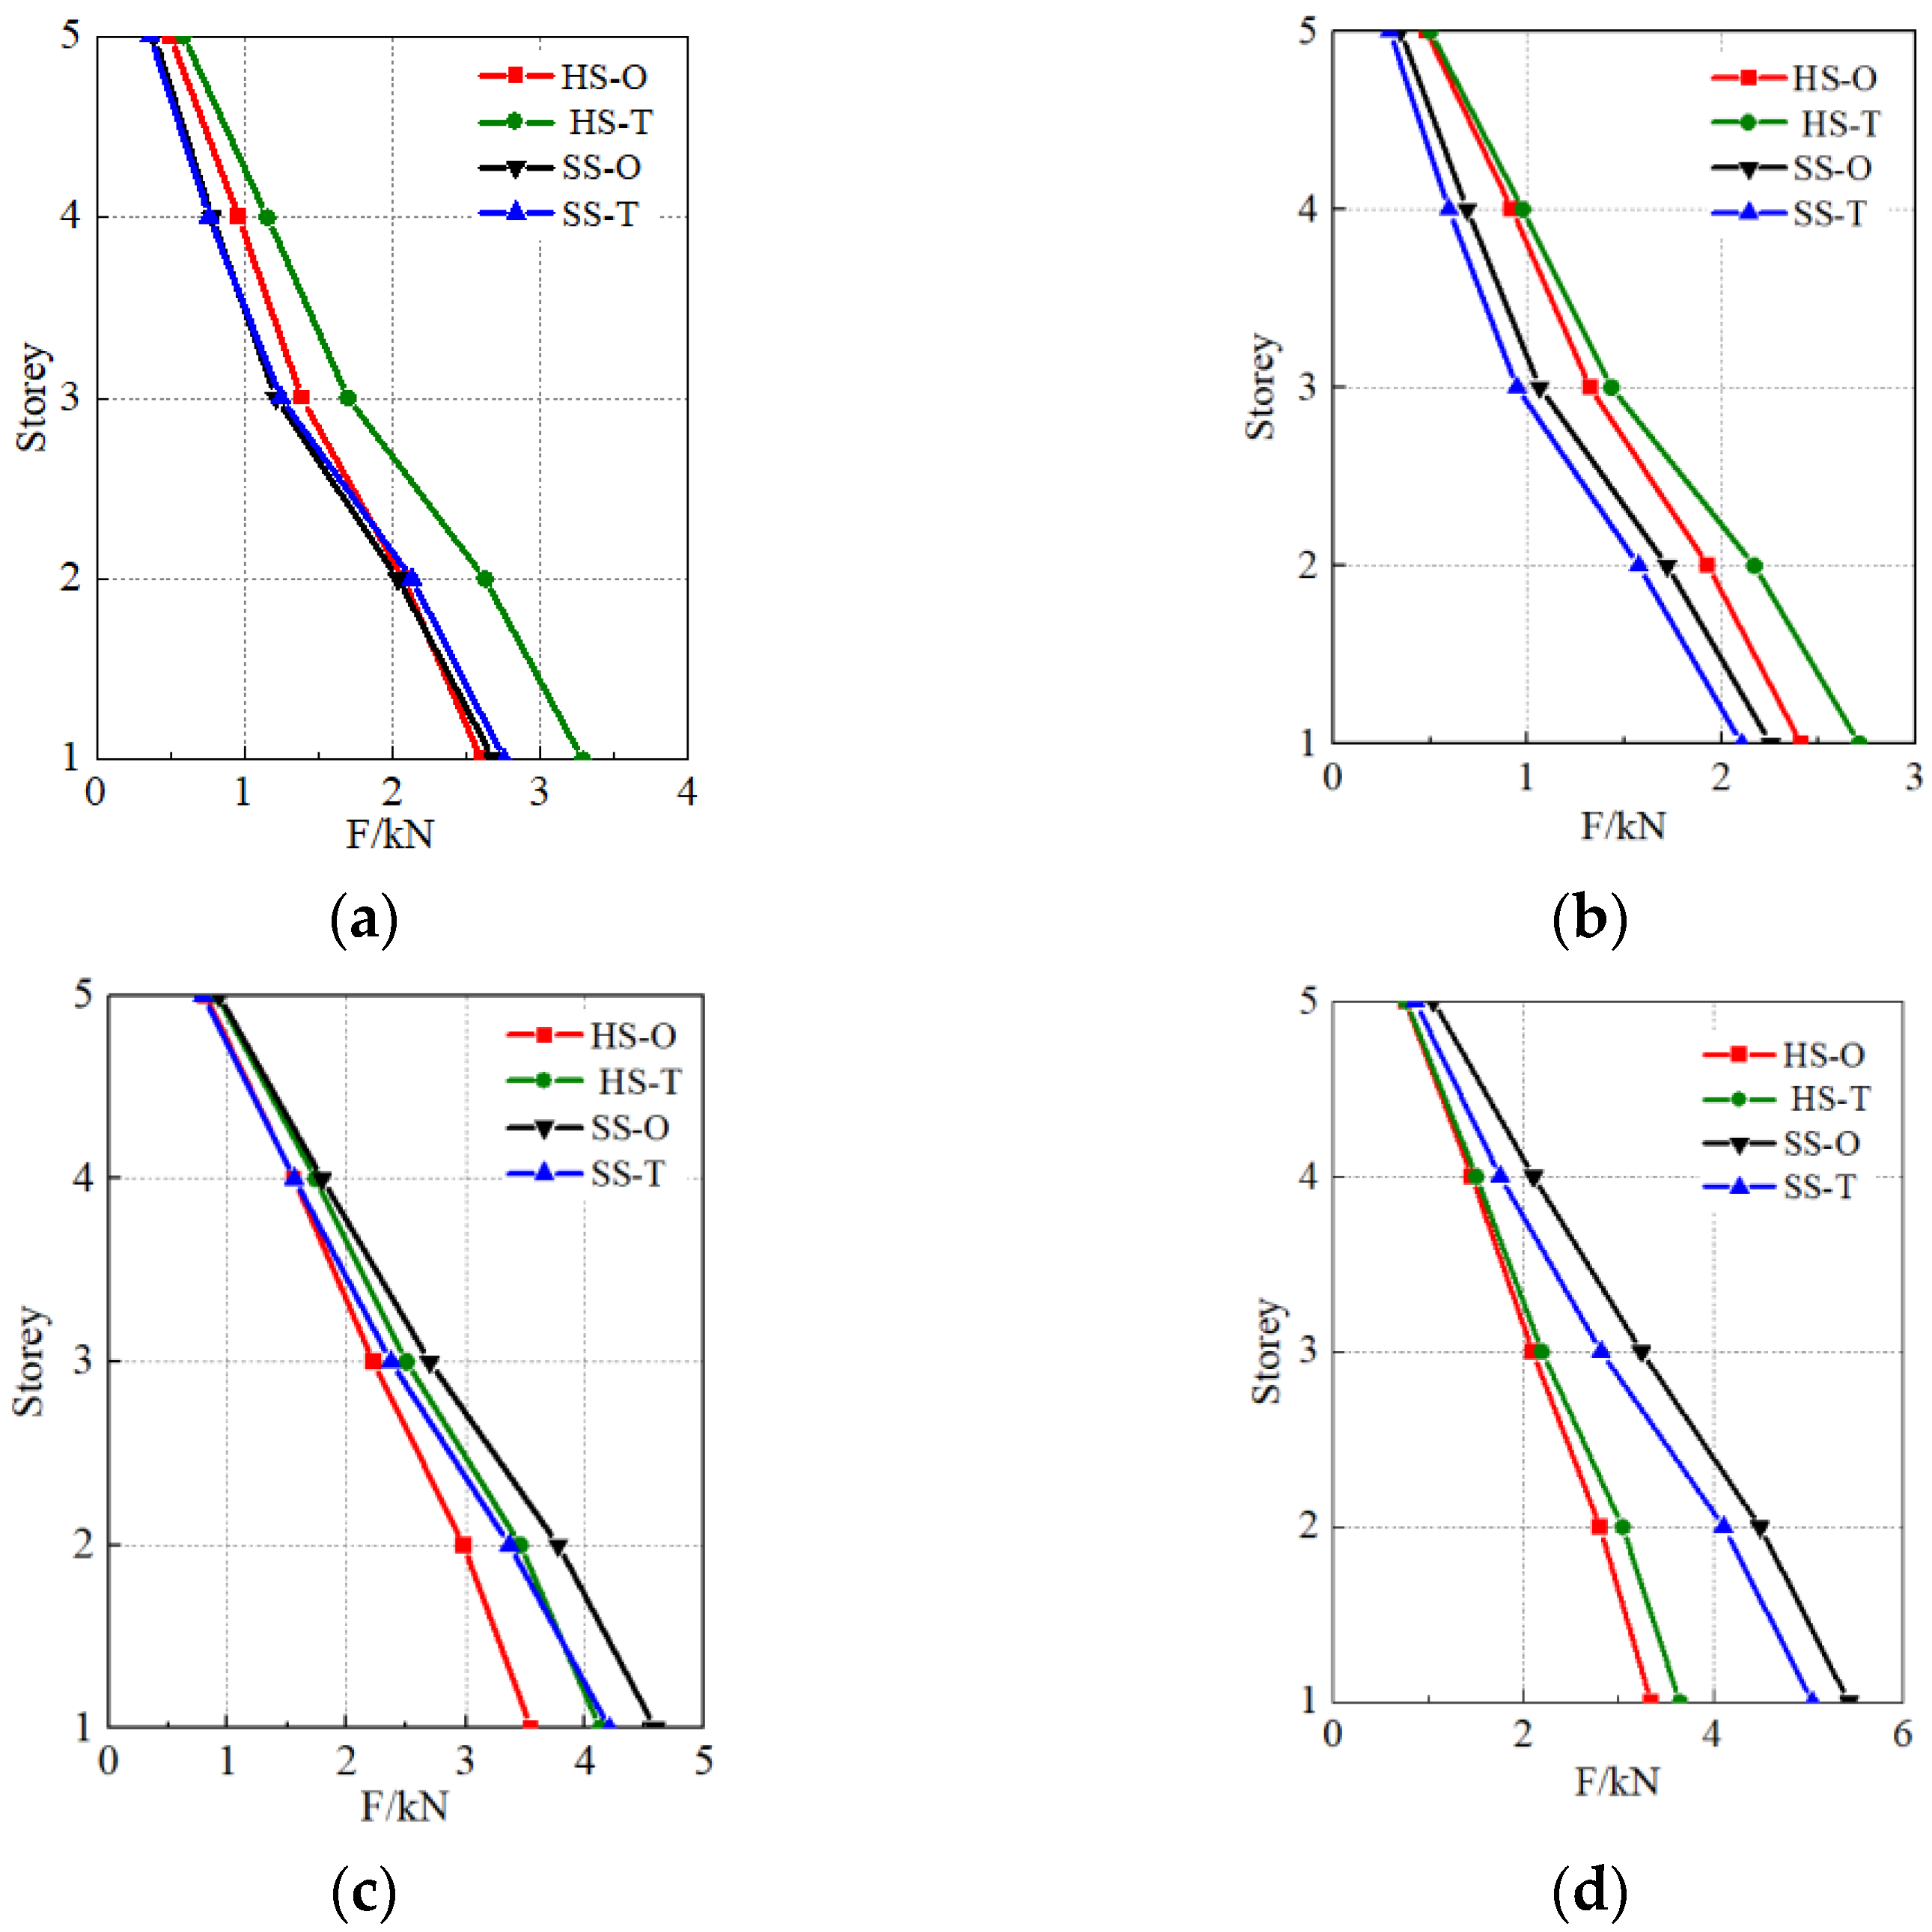
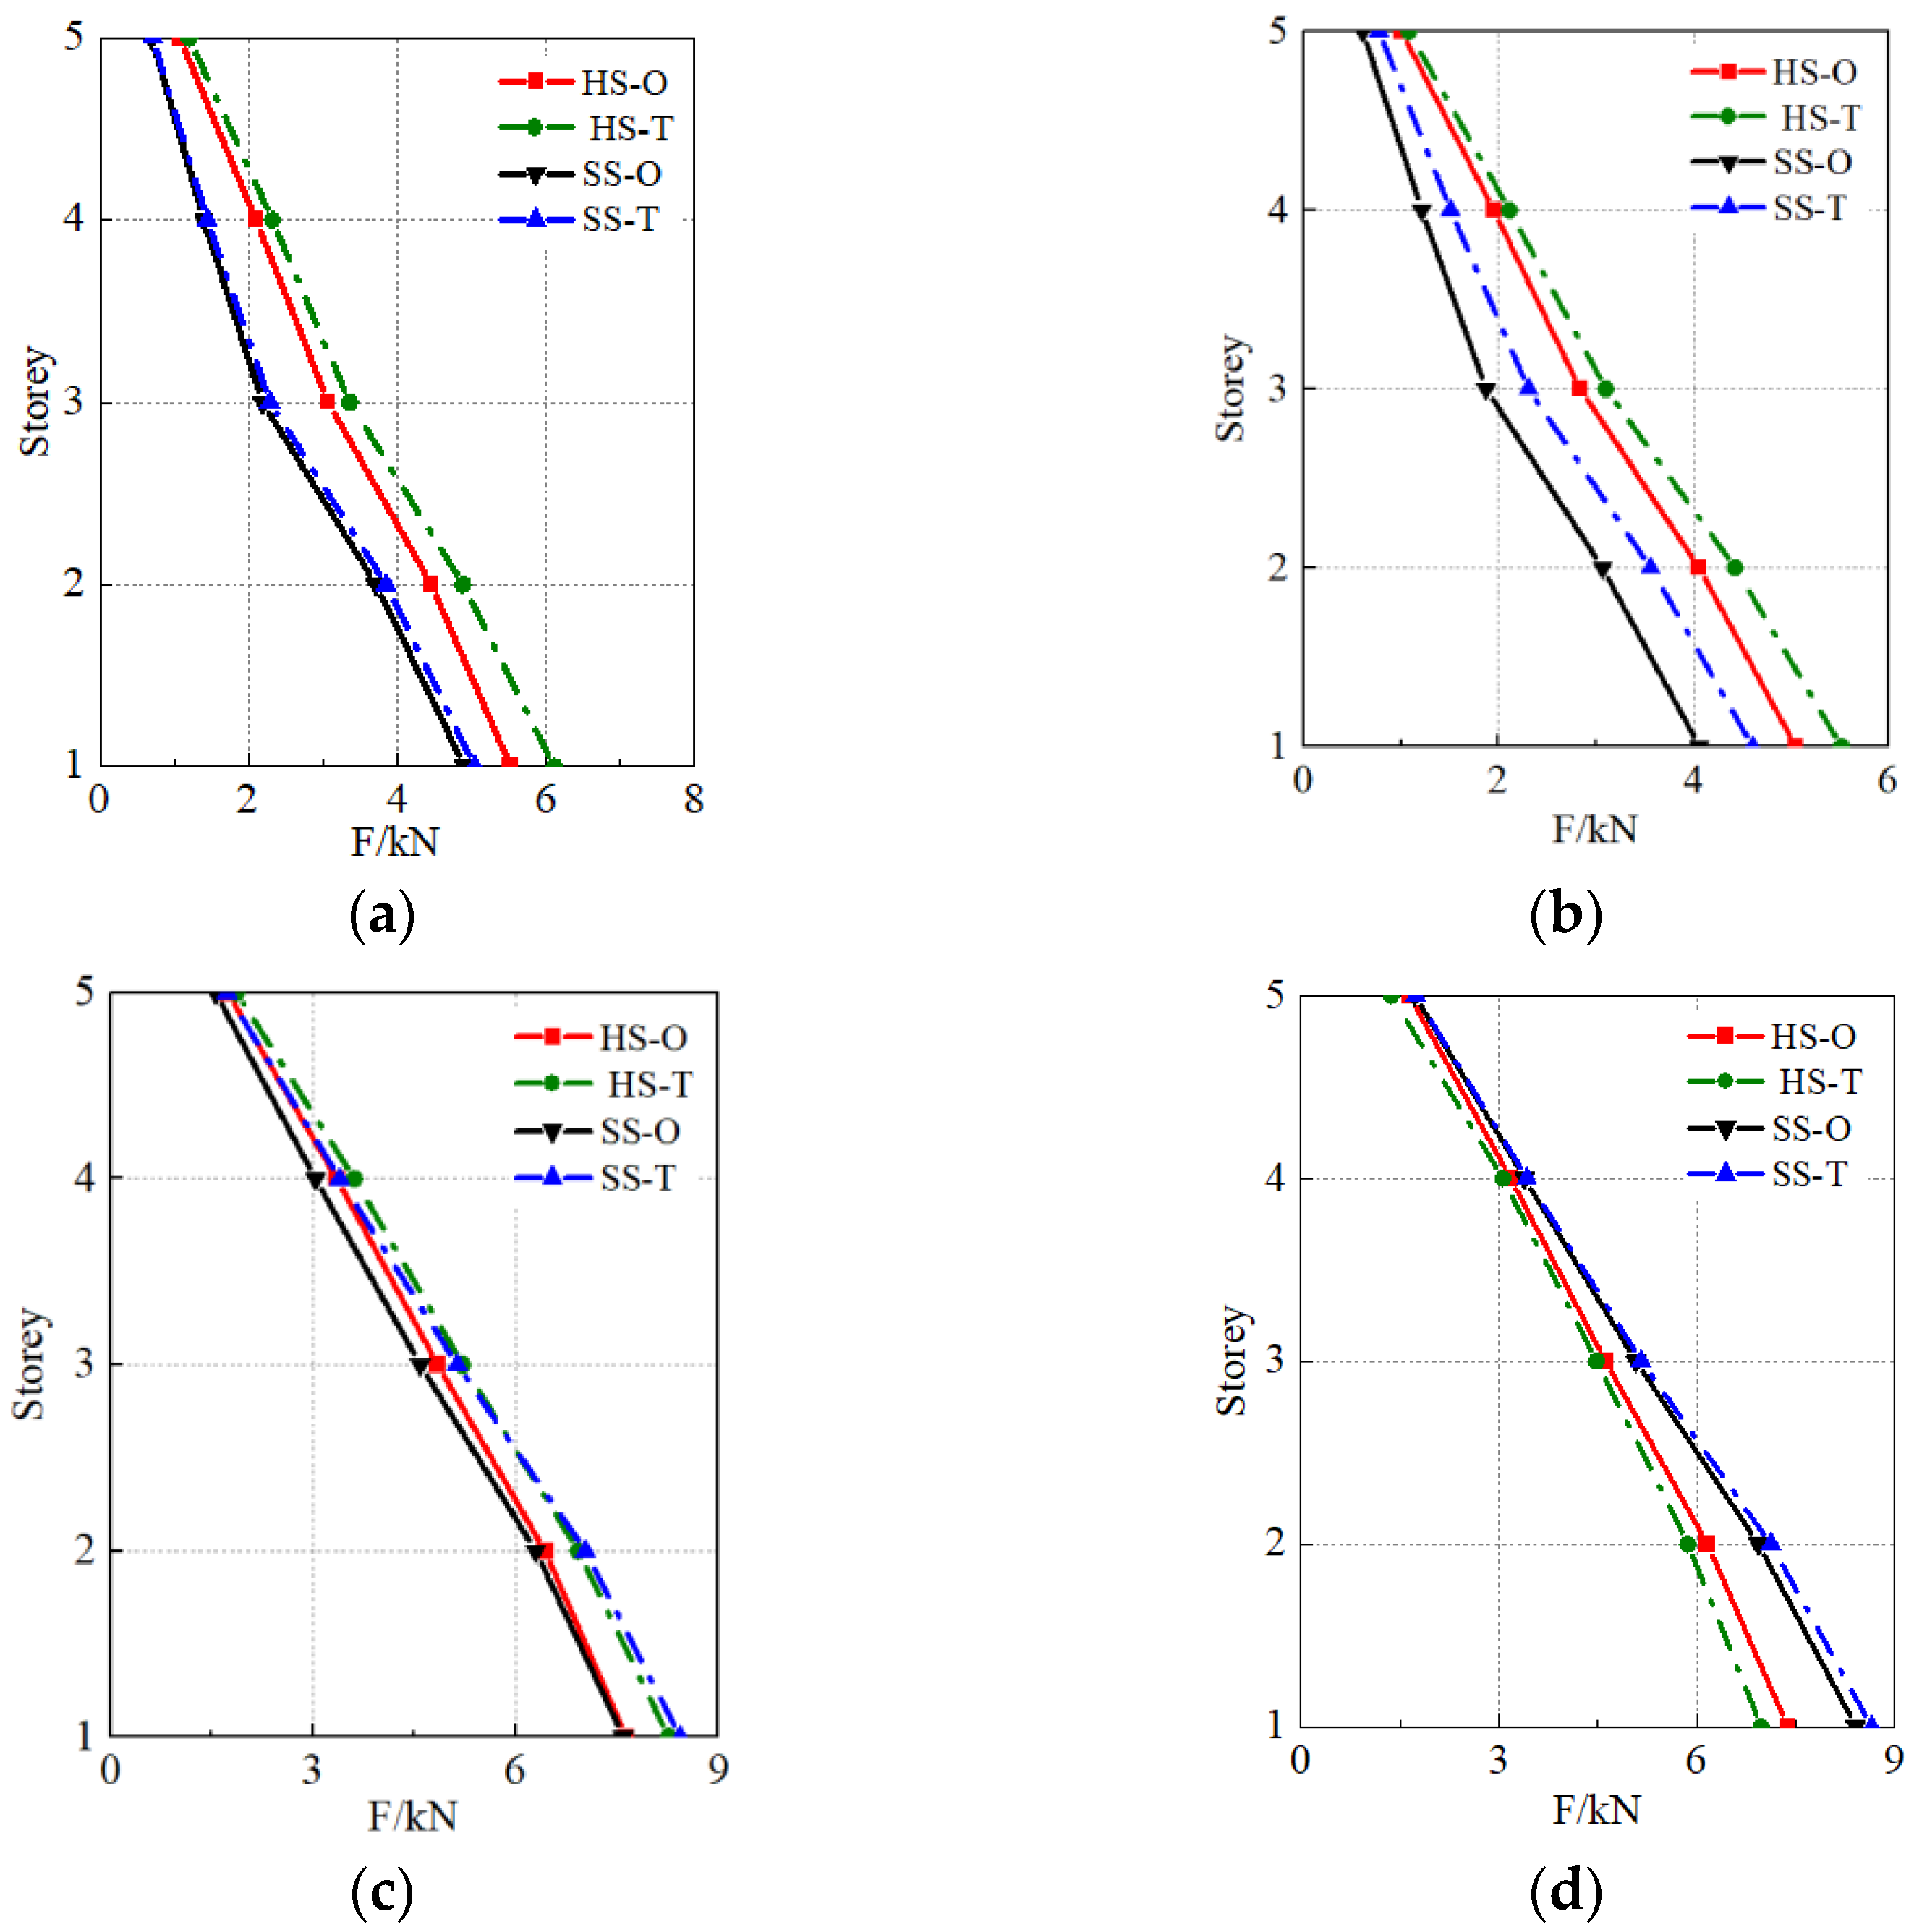
Figure 28 shows the average interlayer shear force comparison between the rigid and soft soil interlayer isolation structures under four types of ground motions with 0.2 g input in the X-direction and both directions.
By analyzing Figure 28, it can be concluded that (1) under long-term seismic action, the interlayer shear response of the interlayer isolation structure is significantly greater than that under ordinary seismic action. When the PGA is 0.2 g, the interlayer shear force of the soft soil interlayer isolation system is similar to that of the rigid interlayer isolation system. With the increase in PGA, the SSI effect weakens its impact on the enhancement of interlayer shear force of the interlayer isolation structure. Therefore, in the design of seismic isolation structures, it is necessary to consider the enhanced effect of long-term ground motions on interlayer shear forces. At the same time, for areas with low seismic fortification intensity, it is also necessary to consider the enhanced effect of SSI on interlayer shear forces in the structure. (2) Under bidirectional seismic motion, there is still a certain gap between the interlayer shear force values of rigid interlayer isolation and soft soil interlayer isolation systems and the unidirectional input situation. The interlayer shear force of the bidirectional input ordinary seismic motion, rigid interlayer isolation system, and soft soil interlayer isolation system is slightly greater than that of the unidirectional input case while the interlayer shear force value of the bidirectional input long period seismic motion is closer to that of the unidirectional input case, indicating that different input seismic motion modes have a smaller impact on the shear response of the structure under long period seismic action than ordinary seismic motion.
5. Discussion and Suggestions
(1) Interlayer isolation structures in engineering applications should consider the SSI effect, and in the design of such structures, the research focus should be on the low structures and isolation layers. Based on the law of the response of acceleration and displacement, the soft land base has a certain amplification effect, which significantly affects the lower structure and isolation layer. The structural displacement effect of the upper and lower parts of the soft land base is greater than that of the upper structure, and the displacement is concentrated at the isolation layer. The isolation layer and lower structure are weak parts, and a large diameter isolation bearing is recommended. In addition, the stiffness of the lower structure is increased, and measures must be considered for the isolation layer in the high intensity area.
(2) The SSI effect is significant on the soft soil foundation and, therefore, must be considered in seismic-isolation buildings built on this foundation type. The displacement response of interlayer isolation structure of the soft soil foundation is obviously greater than that of the rigid foundation, and thus, measures must be taken to improve the damping effect, for example, optimization of the parameters of the isolation layer and the layout of the support.
(3) The interlayer isolation structure of the soft soil foundation is prone to foundation settlement under the action of earthquake, resulting in the inclination of the building. Therefore, studies must focus on the stability of the foundation for the seismic-isolation structure on soft soil foundation.
6. Conclusion
(1) When the SSI effect is considered in the resonance of isolation structures, the natural vibration characteristics of the interlayer isolation system change obviously. According to the modal analysis of the rigid interlayer isolation system and the soft soil interval isolation system, the natural vibration period of the interlayer isolation structure when considering the SSI effect is approximately 1.20 times that of the rigid foundation, and the damping ratio is approximately 1.40 times that of the rigid foundation.
(2) The acceleration response of the upper structure is reduced after considering the impact of the SSI effect; however, as the PGA increases, the acceleration response of the long-periodic seismic action is less than that in the case of a normal earthquake. The maximum PGA at the top of the rigid foundation is 1.32, and the soft land base is 0.74. The PGA was used in the case of 0.2 g long-period seismic action, and the maximum acceleration amplification coefficient of the upper structure on the rigid foundation is 2.06, with the soft land base of 1.74. However, when considering the SSI effect, the acceleration amplification factor of the top of the substructure is obviously greater than that of the top of the superstructure; therefore, in the designing of a seismic structure, the safety of the lower structure under the action of earthquakes must be focused on.
(3) After considering the impact of the SSI effect, the displacement response of the interlayer isolation structure is enlarged. The PGA was calculated under normal seismic action of 0.2 g. In addition, the displacement response of the upper layer of the upper structure was 1.52 times that of the rigid foundation, and that of the lower structure was 2.01 times. The PGA was calculated for the long-periodic seismic action of 0.2 g, and the upper layer of the upper structure is 1.88 times the rigid foundation, and that of the lower structure was 2.39 times that of the rigid foundation.
(4) After considering the impact of the SSI effect, the shear force of the average seismic movement was significantly reduced, and the long-periodic seismic movements for the PGA of 0.1 g were significantly increased in the lower layer; however, the PGA was close to that of the rigid foundation at 0.2 g. In the case of the normal seismic action, PGA = 0.2 g; the shear force of the base of the interlayer isolation structure of the rigid foundation is 1.21 times that of the soft land. The PGA is used for the long-periodic seismic action of 0.1 g, with the base shear force of the soft land base as 1.38 times that of the rigid foundation. The PGA is used for the long-periodic seismic action of 0.2 g, with almost similar base shear forces of the two ground conditions.
Author Contributions
Conceptualization, L.X., J.S. and Y.W.; methodology, L.X., Y.L. and Y.W.; validation, L.X. and Y.W.; investigation, L.X., Y.W. and Y.L.; resources, J.S. and Y.W.; data curation, Y.W. and L.X.; writing—original draft preparation, L.X. and Y.W.; writing—review and editing, Y.W., Y.L. and J.S.; visualization, L.X.; supervision, Y.W., J.S. and Y.L.; project administration, Y.W. and J.S. All authors have read and agreed to the published version of the manuscript.
Funding
This work was supported by Scientific Research Fund of Institute of Engineering Mechanics, China Earthquake Administration (Grant No. 2021D03) and the Sichuan Provincial Natural Science Foundation Project (Grant No:2022NSFSC1174).
Institutional Review Board Statement
Not applicable.
Informed Consent Statement
Not applicable.
Data Availability Statement
Not applicable.
Conflicts of Interest
The authors declare no conflict of interest.
References
- Mylonakis, G.; Gazetas, G. Seismic soil structure interaction: Beneficial or Detrimental? Earthq. Eng. 2000, 4, 277–301. [Google Scholar] [CrossRef]
- Terzi, V.G.; Athanatopoulou, A. Dynamic optimum torsion axis under soil-stucture interaction effects. Eng. Struct. 2023, 274, 115150. [Google Scholar] [CrossRef]
- Vicencio, F.; Alexander, N.A. Dynamic Structure-Soil-Structure Interaction in unsymmetrical plan buildings due to seismic excitation. Soil Dyn. Earthq. Eng. 2019, 127, 105817. [Google Scholar] [CrossRef]
- Faiella, D.; Mele, E. Insights into inter-story isolation design through the analysis of two case studies. Eng. Struct. 2020, 215, 110660. [Google Scholar] [CrossRef]
- Lucom, J.E. Effects of soil–structure interaction on seismic base isolation. Soil Dyn. Earthq. Eng. 2014, 66, 167–177. [Google Scholar] [CrossRef]
- Wu, Y.; Lu, J.; Zhao, X.; Lin, Y. Model Test and Analysis of Horizontal Torsional Coupling Effect for Large Substructure Layer Isolation. Eng. Sci. Technol. 2018, 50, 48–55. [Google Scholar]
- Zhu, X.; Pan, R.; Li, J.; Lin, G. Study of isolation effectiveness of nuclear reactor building with three-dimensional seismic base isolation. Eng. Comput. 2021, 39, 1209–1233. [Google Scholar] [CrossRef]
- Wang, S.J.; Chang, K.C.; Hwang, J.S.; Lee, B.H. Simplified analysis of mid-story seismically isolated buildings. Earthq. Eng. Struct. Dyn. 2011, 40, 119–133. [Google Scholar]
- Rocha, L.E.; Pérez, J.; Avilés López, A.; Colunga, T. Influence of soil-structure interaction on isolated buildings for SF6 gas-insulated substations. In Proceedings of the 4th ECCOMAS Thematic Conference on Computational Methods in Structural Dynamics and Earthquake Engineering, Kos Island, Greece, 12–14 June 2013. [Google Scholar]
- Li, C.; Liu, W.; Wang, S.; Du, D.; Wang, H. Shaking table test on high-rise isolated structure on soft soil foundation. J. Build. Struct. 2013, 34, 72–78. [Google Scholar]
- Ulitsky, V.; Lisyuk, B.M.; Shashkin, G.A. An efficient method for estimating the dynamic response of base-isolated structure with SSI effect. Adv. Soil Mech. Geotech. Eng. 2014, 4, 235. [Google Scholar]
- Tsai, C.S.; Chen, C.S.; Chen, B.J. Effects of unbounded media on seismic responses of FPS-isolated structures. Struct. Control Health Monit. 2004, 11, 1–20. [Google Scholar]
- Haiqing, L.; Zhijiao, S. Influence of soil-structure dynamic interaction on isolation effect of lead-rubber bearing. J. Earthq. Eng. Eng. Vib. 2010, 30, 161–165. [Google Scholar] [CrossRef] [Green Version]
- Yu, X.; Zhuang, H.; Li, S. Investigation into the seismic reduction factor of isolated structure with SSI effect on soft sites. World Inf. Earthq. Eng. 2017, 33, 183–191. [Google Scholar]
- Zhuang, H.; Yu, X.; Zhu, C.; Jin, D. Shaking table tests for the seismic response of a base-isolated structure with the SSI effect. Soil Dyn. Earthq. Eng. 2014, 67, 208–218. [Google Scholar]
- Zhuang, H.; Fu, J.; Yu, X.; Chen, S.; Cai, X. Earthquake responses of a base-isolated structure on a multi-layered soft soil foundation by using shaking table tests. Eng. Struct. 2019, 179, 79–91. [Google Scholar] [CrossRef]
- Wu, Y.; Zheng, Z.; Yan, G.; Wu, Z.; Chen, B.; Liu, N. Shaking table test study on pile soil interlayer isolation structures under far-field long-term seismic motion. J. Build. Struct. 2021, 42, 11–22. [Google Scholar]
- Xu, L.; Wu, Y.; Tian, H. Shaking table test study on eccentric foundation isolation structure of soft soil foundation under long-term seismic action. J. Build. Struct. 2022, 43, 1–11. [Google Scholar]
- Yu, X.; Zhuang, H.Y.; Chen, G.X. Prediction method research of seismic response and seismic isolation effect of isolated structure on soft soil foundation. Zhen dong Gong cheng Xue bao. J. Vib. Eng. 2017, 30, 817–826. [Google Scholar] [CrossRef]
- Wu, Y.; Chen, J.; Fang, H. Shaking table test study on interlayer isolation structure of soft sandwich foundation under long-term seismic motion. J. Vib. Eng. 2023, 36, 345–356. [Google Scholar] [CrossRef]
- Shi, J.; Dong, X.; Lin, Y. Experimental study on base isolation structures considering SSI effect under long-term seismic motion. J. Appl. Fundam. Eng. Sci. 2022, 30, 936–950. [Google Scholar]
- Chang, S.; Zhang, S. Engineering Geological Handbook; China Construction Industry Press: Beijing, China, 2007. [Google Scholar]
- Wu, Y.; Lu, J.; Qi, A. Shaking table test and numerical analysis of mid-story isolation eccentric structure with tower-podium. Adv. Mech. Eng. 2019, 11, 1–16. [Google Scholar] [CrossRef] [Green Version]
- Shi, W.; Chen, W.; Lin, Y.; Wu, Y. Fabrication and Testing of a Laminar Shear Soil Box for a Shaking-Table Test. ASCE Pract. Period. Struct. Des. Constr. 2021, 26, 04021030. [Google Scholar] [CrossRef]
- Jing, L.; Zhuo, X.; Wang, X. Effect of complex site on seismic wave propagation. Earthq. Eng. Eng. Vib. 2005, 25, 16. [Google Scholar]
- Chen, W.; Ma, J.; Cao, S.; Wang, Q.; Wang, M. Shaking table test study on seismic performance of inclined pile foundations in liquefiable soil. Environ. Earth Sci. 2020, 79, 398. [Google Scholar] [CrossRef]
Figure 1.
Structural plan (unit: mm). (a) Prototype structure; (b) Reduced structure.

Figure 2.
Model structure and dimensions (unit: mm). (a) Front Elevation; (b) Side Elevation.

Figure 3.
Diagram of platform and pile foundations. (a) Plan sketch; (b) Reinforcement diagram.

Figure 4.
LRB structure and size chart (unit: mm).

Figure 5.
LRB physical figure.

Figure 6.
LRB70-5 levels with respect to the shear test.

Figure 7.
LRB70-5 hysteresis curve.

Figure 8.
Diagram of soil box and structure model plane (unit: mm).

Figure 9.
Test soil box.

Figure 10.
Soil formed through electric-impact ramming.

Figure 11.
Structure and bearing-platform connection (in assembly).

Figure 12.
Isolation bearing connection.

Figure 13.
Model on rigid foundation (after assembly).

Figure 14.
Model on soft soil foundation.

Figure 15.
Sensor measurement-point arrangement (rigid interlayer isolation).

Figure 16.
Layout of X-direction sensor measurement points (soft soil interlayer isolation).

Figure 17.
Layout of Y-direction sensor measurement points (soft soil interlayer isolation).

Figure 18.
Structure on soft soil ground tilt.

Figure 19.
Measuring point TA1, acceleration time history at TA2, and Fourier spectrum.


Figure 20.
Points A1 and A2 in the Fourier spectrum.


Figure 21.
Comparison of acceleration amplification coefficients under single and bidirectional ground motions (PGA = 0.1 g). (a) Near-field ordinary ground motion; (b) Far-field ordinary ground motion; (c) Near-field pulse ground motion; (d) Far-field harmonic ground motion.
Figure 21.
Comparison of acceleration amplification coefficients under single and bidirectional ground motions (PGA = 0.1 g). (a) Near-field ordinary ground motion; (b) Far-field ordinary ground motion; (c) Near-field pulse ground motion; (d) Far-field harmonic ground motion.


Figure 22.
One- and two-way ground motions under the action of floor-displacement response (PGA = 0.1 g). (a) Near-field ordinary ground motion; (b) Far-field ordinary ground motion; (c) Near-field pulse ground motions; (d) Far-field harmonic ground motions.
Figure 22.
One- and two-way ground motions under the action of floor-displacement response (PGA = 0.1 g). (a) Near-field ordinary ground motion; (b) Far-field ordinary ground motion; (c) Near-field pulse ground motions; (d) Far-field harmonic ground motions.

Figure 23.
Single- and two-way dynamic motion downstairs contrast between shear layer (PGA = 0.1 g). (a) Near-field ordinary ground motion; (b) Far-field ordinary ground motion; (c) Near-field pulse ground motion; (d) Far-field harmonic ground motion.
Figure 23.
Single- and two-way dynamic motion downstairs contrast between shear layer (PGA = 0.1 g). (a) Near-field ordinary ground motion; (b) Far-field ordinary ground motion; (c) Near-field pulse ground motion; (d) Far-field harmonic ground motion.

Figure 24.
Finite-element model of soil isolation structure.

Figure 25.
First-order vibration modes of the finite-element model (X-direction). (a) First-order vibration mode of rigid interlayer isolation model; (b) First-order vibration mode of weak soil interlayer isolation model.
Figure 25.
First-order vibration modes of the finite-element model (X-direction). (a) First-order vibration mode of rigid interlayer isolation model; (b) First-order vibration mode of weak soil interlayer isolation model.

Figure 26.
Comparison of acceleration amplification coefficients under single and bidirectional ground motions (PGA = 0.2 g). (a) Near-field ordinary ground motion; (b) Far-field ordinary ground motion; (c) Near-field pulse ground motion; (d) Far-field harmonic ground motion.
Figure 26.
Comparison of acceleration amplification coefficients under single and bidirectional ground motions (PGA = 0.2 g). (a) Near-field ordinary ground motion; (b) Far-field ordinary ground motion; (c) Near-field pulse ground motion; (d) Far-field harmonic ground motion.

Figure 27.
Comparison of floor-displacement response under single and bidirectional seismic excitations (PGA = 0.2 g). (a) Near-field ordinary ground motion; (b) Far-field ordinary ground motion; (c) Near-field pulse ground motion; (d) Far-field harmonic ground motion.
Figure 27.
Comparison of floor-displacement response under single and bidirectional seismic excitations (PGA = 0.2 g). (a) Near-field ordinary ground motion; (b) Far-field ordinary ground motion; (c) Near-field pulse ground motion; (d) Far-field harmonic ground motion.


Figure 28.
Comparison between the interlayer shear responses under the single and bidirectional seismic excitations (PGA = 0.2 g). (a) Near-field ordinary ground motion; (b) Far-field ordinary ground motion; (c) Near-field pulse ground motion; (d) Far-field harmonic ground motion.
Figure 28.
Comparison between the interlayer shear responses under the single and bidirectional seismic excitations (PGA = 0.2 g). (a) Near-field ordinary ground motion; (b) Far-field ordinary ground motion; (c) Near-field pulse ground motion; (d) Far-field harmonic ground motion.


Table 1.
Similarity coefficient of the model.
| Types | Physical Quantity | Similarity Relationship | Similarity Ratio | |
|---|---|---|---|---|
| Structure | Foundation Soil | |||
| Property of geometric | Length l | Sl | 1/12 | 1/12 |
| Linear displacement x | Sx = Sl | 1/12 | 1/12 | |
| Properties of materials | Elastic modulus E | SE | 1 | 1/4 |
| Upper structural density ρ | Sρ | 12 | 1 | |
| Upper structural mass m | Sm = SρSl3 | 1/144 | 1/1728 | |
| Support stress σ | Sσ | 1 | / | |
| Soil shear modulus G | SG | / | 1/4 | |
| Properties of dynamic | Stiffness k | Sk = SE Sl | 1/12 | / |
| Time t | St = Sl0.5 Sa−0.5 | 0.288 | 0.288 | |
| Acceleration a | Sa | 1 | 1 | |
Table 2.
Size and mechanical properties of the LRB.
| Performance | Parameter |
|---|---|
| The first shape coefficient of S1 | 10.94 |
| The second shape coefficient of S2 | 4.38 |
| Bearing pressure on the area of /mm2 | 3848 |
| Vertical compressive stiffness, /kN·mm−1 | 59 |
| 100% level equivalent stiffness, /kN·mm−1 | 0.098 |
| The yield strength/kN | 0.16 |
| The stiffness before yielding, /kN·mm−1 | 1.071 |
| The stiffness after yielding, /kN·mm−1 | 0.089 |
| The shear modulus of rubber, /MPa | 0.392 |
| Effective diameter, /mm | 70 |
| Clear height, /mm | 50 |
| Lead core diameter/mm | 5 |
| Sealing plate thickness, /mm | 8 |
| The steel plate thickness, /mm | 2 |
| The layer number of steel plate, /layer | 9 |
| The rubber layer thickness, /mm | 1.60 |
| Rubber layer, /slice | 10 |
Table 3.
Physical indicators of the soil sample.
| Species | Density/ (kg·m−3) | Moisture Content/% | Liquid Limit/ % | Plastic Limit/ % | Status | Friction Angle/ ° | Cohesion/MPa |
|---|---|---|---|---|---|---|---|
| clay | 1760 | 29 | 18.93 | 40.66 | plasticity | 17 | 0.022 |
Table 4.
Ground motion information.
| Type | Name | Magnitude | Station | Fault Distance/km | PGA/g | PGV/PGA | Tr/s | |
|---|---|---|---|---|---|---|---|---|
| Near-field ordinary | Friuli | 6.5 | TMZ270 | 15.82 | 30.02 | 0.09 | 0.52 | |
| Imperial Valley | 6.95 | ELC180 | 6.09 | 30.82 | 0.11 | 0.76 | ||
| Loma Prieta | 6.93 | CYC285 | 20.34 | 40.52 | 0.09 | 0.64 | ||
| Far-field ordinary | Kobe | 6.9 | HIK090 | 95.72 | 15.19 | 0.11 | 0.57 | |
| CHICHI | 7.62 | TAP032E | 94.84 | 25.03 | 0.18 | 0.37 | ||
| Kobe | 6.9 | FUK090 | 158.61 | 5.23 | 0.13 | 0.93 | ||
| Near-field pulse | Kocaeli | 7.51 | YPT060 | 4.83 | 63.18 | 0.23 | 2.18 | |
| CHICHI | 7.62 | TCU036E | 19.83 | 57.21 | 0.43 | 2.89 | ||
| CHICHI | 7.62 | TCU063E | 9.78 | 43.42 | 0.24 | 2.25 | ||
| Far-field harmonic-like | CHICHI | 7.62 | ILA004N | 88.89 | 25.71 | 0.41 | 3.07 | |
| CHICHI | 7.62 | ILA055N | 90.30 | 23.39 | 0.35 | 3.18 | ||
| Landers | 7.28 | ARC172 | 137.25 | 24.28 | 0.39 | 3.32 | ||
Table 5.
Table of test conditions.
| PGA (X-Direction) | PGA (Y-Direction) | Ground-Motion Types and Working Conditions | |||
|---|---|---|---|---|---|
| Near-Field Ordinary | Far-Field Ordinary | Near-Field Pulse | Far-Field Harmonic | ||
| 0.1 g | / | TA1–3 | TA4–6 | TA7–9 | TA10–12 |
| 0.1 g | 0.085 g | TA13–15 | TA16–18 | TA19–21 | TA22–24 |
| 0.2 g | / | TA25–27 | TA28–30 | TA31–33 | TA34–36 |
Table 6.
Natural vibration period and damping ratio of structural model.
| Model Structure | Rigid Layer Interval Model | Soft Soil Layer Interval Shock Model |
|---|---|---|
| Natural vibration period before test (s) | 0.455 | 0.543 |
| Natural vibration period after test (s) | 0.459 | 0.585 |
| Damping ratio before test | 0.104 | 0.141 |
| Damping ratio after test | 0.103 | 0.152 |
Table 7.
Soil box surface of each measuring-point acceleration peak value of contrast.
| Ground Motion | TA1/g | TA2/g | TA3/g | TA4/g | X Deviation | Y Deviation |
|---|---|---|---|---|---|---|
| TMZ270 | 0.105 | 0.102 | 0.087 | 0.085 | 2.94% | 2.34% |
| TAP032E | 0.109 | 0.105 | 0.091 | 0.088 | 3.81% | 3.41% |
| TCU036E | 0.131 | 0.125 | 0.111 | 0.107 | 4.80% | 3.74% |
| ILA004N | 0.169 | 0.160 | 0.142 | 0.135 | 5.63% | 5.19% |
Table 8.
Components under the action of earthquake-based ground motion acceleration amplification factor of foundation soil (X).
Table 8.
Components under the action of earthquake-based ground motion acceleration amplification factor of foundation soil (X).
| Peak Acceleration (g) | Ground Motion | Mesa Peak Acceleration (g) | Soil-Surface Peak Acceleration (g) | Amplification Coefficient of Foundation Soil |
|---|---|---|---|---|
| 0.1 g | TMZ270 | 0.078 | 0.104 | 1.333 |
| ELC180 | 0.085 | 0.105 | 1.235 | |
| CYC285 | 0.092 | 0.112 | 1.217 | |
| 0.1 g | HIK090 | 0.097 | 0.107 | 1.103 |
| TAP032E | 0.098 | 0.111 | 1.133 | |
| FUK090 | 0.089 | 0.103 | 1.157 | |
| 0.1 g | YPT060 | 0.087 | 0.113 | 1.299 |
| TCU036E | 0.109 | 0.136 | 1.248 | |
| TCU063E | 0.104 | 0.141 | 1.356 | |
| 0.1 g | ILA004N | 0.095 | 0.163 | 1.716 |
| ILA055N | 0.097 | 0.166 | 1.711 | |
| ARC172 | 0.107 | 0.177 | 1.654 | |
| 0.2 g | TMZ270 | 0.172 | 0.177 | 1.029 |
| ELC180 | 0.202 | 0.239 | 1.183 | |
| CYC285 | 0.190 | 0.219 | 1.153 | |
| 0.2 g | HIK090 | 0.186 | 0.190 | 1.022 |
| TAP032E | 0.175 | 0.181 | 1.034 | |
| FUK090 | 0.199 | 0.233 | 1.171 | |
| 0.2 g | YPT060 | 0.203 | 0.229 | 1.128 |
| TCU036E | 0.197 | 0.207 | 1.051 | |
| TCU063E | 0.201 | 0.237 | 1.179 | |
| 0.2 g | ILA004N | 0.196 | 0.278 | 1.418 |
| ILA055N | 0.192 | 0.261 | 1.359 | |
| ARC172 | 0.200 | 0.263 | 1.315 |
Table 9.
Comparison of natural vibration periods of model structures.
| Model | Calculated Value/s | Experimental Value/s | Error/% |
|---|---|---|---|
| Rigid-interlayer isolation | 0.463 | 0.455 | 1.76 |
| Weak soil interlayer isolation | 0.558 | 0.543 | 2.76 |
Disclaimer/Publisher’s Note: The statements, opinions and data contained in all publications are solely those of the individual author(s) and contributor(s) and not of MDPI and/or the editor(s). MDPI and/or the editor(s) disclaim responsibility for any injury to people or property resulting from any ideas, methods, instructions or products referred to in the content. |
© 2023 by the authors. Licensee MDPI, Basel, Switzerland. This article is an open access article distributed under the terms and conditions of the Creative Commons Attribution (CC BY) license (https://creativecommons.org/licenses/by/4.0/).
Share and Cite
MDPI and ACS Style
Xu, L.; Shi, J.; Wu, Y.; Lin, Y. Interlayer Isolation Structures Considering Soil–Structure Interaction under Long-Period Ground Motions: An Experimental Analysis. Appl. Sci. 2023, 13, 9090. https://doi.org/10.3390/app13169090
AMA Style
Xu L, Shi J, Wu Y, Lin Y. Interlayer Isolation Structures Considering Soil–Structure Interaction under Long-Period Ground Motions: An Experimental Analysis. Applied Sciences. 2023; 13(16):9090. https://doi.org/10.3390/app13169090
Chicago/Turabian StyleXu, Liying, Jianri Shi, Yingxiong Wu, and Youqin Lin. 2023. "Interlayer Isolation Structures Considering Soil–Structure Interaction under Long-Period Ground Motions: An Experimental Analysis" Applied Sciences 13, no. 16: 9090. https://doi.org/10.3390/app13169090
Note that from the first issue of 2016, this journal uses article numbers instead of page numbers. See further details here.