


Multi-Indicator Weighted Robustness Analysis of Planktonic Community Systems under Different Destructive Factors


1
College of Information Technology, Shanghai Ocean University, Shanghai 201306, China
2
College of Electronic and Information Engineering, Shanghai University of Electric Power, Shanghai 200090, China
*
Author to whom correspondence should be addressed.
Appl. Sci. 2023, 13(15), 8742; https://doi.org/10.3390/app13158742
Submission received: 6 June 2023
/
Revised: 26 July 2023
/
Accepted: 27 July 2023
/
Published: 28 July 2023
(This article belongs to the Topic Sustainable Environmental Technologies)
Abstract
:Marine plankton communities play a vital role in global carbon and nutrient cycles. Ensuring the robustness of these intricate ecosystems is critical for sustainable environmental management. In this paper, we apply complex network analysis to assess plankton community resilience against disturbances. We construct ecological interaction networks and simulate disruptions using four attack strategies targeting vertices and edges. Our multi-indicator evaluation scheme provides a more nuanced measure of robustness compared to single metrics. Our experiments revealed varying vulnerabilities across networks. Targeted attacks caused abrupt collapse, while random failures led to gradual decline. Identifying critical species and linkages is key to guiding protection efforts. Overall, plankton networks proved fragile, especially against deliberate attacks on central hubs. In our simulations, betweenness-based attacks were the most destructive. The multi-indicator robustness coefficient achieved better performance than individual metrics, with under 3% variance. This network methodology reveals hidden topological vulnerabilities and complements traditional plankton research. The quantitative insights provided in this paper can support marine conservation and governance.
1. Introduction
Marine plankton play a crucial role in sustaining and balancing the health of marine food webs, making them essential for the sustainability of environmental technologies [1,2]. They exhibit diverse species, abundant populations, and wide distribution. Their contributions include the production of nutrients and oxygen, which are vital for maintaining ecosystem health. Additionally, they facilitate the decomposition and cycling of organic matter within water bodies. Marine plankton serve as valuable biological indicators, enabling the monitoring of ecological changes and ecosystem health [3]. Ensuring the stability of plankton communities is of the utmost importance, as it supports biogeochemical cycles and enables the proper functioning of marine ecosystems [4]. A decline in plankton abundance can have far-reaching consequences, disrupting the entire food web and negatively impacting the health of fish, marine mammals, and other marine populations. Conversely, rapid increases in phytoplankton populations can result in harmful algal blooms such as red tides, which pose risks to both humans and marine life. Moreover, the decomposition of these blooms consumes large amounts of oxygen, leading to the formation of underwater hypoxic zones [5]. Through study of the resilience of marine plankton communities against environmental disturbances and human activities, we can gain insights that can help to improve and restore marine ecosystems. This knowledge can inform actions such as implementing sustainable harvest practices, utilizing biological controls, and adopting strategies to mitigate harmful algal blooms.
Recent studies have investigated the potential relationship between environmental changes and plankton stability. Gökçe et al. [6] developed an oxygen–plankton diffusion model that incorporated a time delay parameter, enabling analysis of the stability of the coexistence equilibrium of dissolved oxygen concentration and plankton density, and the detection of Hopf bifurcations. While facilitating numerical simulations, this comes at the expense of a rapidly decreasing solution speed with increasing parameters. Vallina et al. [7] examined how phytoplankton functional diversity influences ecosystem productivity and stability under fluctuating environments. They discovered that phytoplankton communities with greater functional diversity exhibited higher and more stable ecosystem productivity. On the other hand, they found that the positive influence of biodiversity on ecosystem function depended primarily on the type of environmental gradient. Thakur et al. [8] developed a nutrient–plankton interaction model to investigate the effects of phytoplankton toxin release on other plants. Their study analyzed the local stability conditions of the time-delayed system and determined critical parameter values for the influence of toxin release delay on phytoplankton community stability. Morozov et al. [9] constructed a generalized integral–differential equation-based plankton model. They proposed a method of finding the equilibrium boundary of ecosystem stability by incorporating both nutrient levels in the water body and zooplankton predatory behavior. A key advantage of their technique is the small deviation range in predicting outcomes for normal water bodies (no more than 20%); however, a different modeling approach is required for atypical environments such as red tide outbreaks.
In summary, traditional research schemes tend to discuss problems by building complex mathematical models with high solution accuracy. However, setting their many parameters can become unwieldy when multiple influential factors are involved. In contrast, complex network modeling and analysis can simplify highly complex systems to help grasp the essence of a problem, offering an effective methodology for studying such systems. The robustness of a complex network refers to how network performance changes under perturbations. and can serve as a key indicator of complex system reliability [10,11,12].
The network perspective on plankton stability reveals fragilities and connectivity patterns overlooked by traditional methods. Mapping these vulnerabilities enables preventive interventions to bolster resilience. Pinpointing keystone species and critical habitat linkages, for instance, can guide ecosystem conservation approaches. Simulating disruption scenarios quantifies robustness in a dynamic context and provides early warning of imminent regime shifts. Comparing network topologies exposes those designs that are most resilient against failures. These findings allow improvements to be implemented prior to collapse. For example, adding modularity with redundancies to the power grid can help to prevent large-scale blackouts. Increasing heterogeneity in cropland landscapes slows transmission of crop diseases. Thus, maintaining network robustness is critical for managers of natural ecosystems, physical infrastructure, supply chains, and human systems. Network approaches transition the analysis from simple dyadic ties to complex system interdependencies. The related methodologies reveal fragilities that are concealed when studying components in isolation. Quantifying network robustness can aid governance by enhancing robustness.
The utility of complex network robustness analysis has been demonstrated across many terrestrial and marine environments. Applications include studying pollination networks [13], trophic interactions in food webs [14], and symbiotic relationships between species [15]. Important discoveries have been made regarding ecosystem stability in forests, coral reefs, and animal gut microbiomes [16]. However, complex network robustness analysis has not been applied to study zooplankton communities. Extending robustness analysis to illuminate zooplankton community dynamics would similarly enhance understanding of this vital biome. The resulting insights can inform conservation strategies to protect marine ecosystems facing growing environmental pressures.
In this paper, we argue that analyzing the robustness of complex ecological networks has become an extremely valuable tool for comprehending the stability and resilience of natural communities. Applying complex network approaches to study interactions between zooplankton species can provide unique insights unavailable with traditional methods [17]. In a community, robustness refers to the ability to maintain characteristic behavior under influences such as species extinction and environmental disturbance [18]. Viewing zooplankton communities as complex networks allows critical species that contribute disproportionately to overall ecosystem stability to be identified. The loss of these highly connected “hub” species can precipitate catastrophic collapse. In addition, network analysis allows us to model how perturbations might propagate through the system.
In order to effectively evaluate marine plankton community resilience, this paper provides insight into different network structures’ roles and patterns of robustness development. Specifically, plankton data are used to construct interaction networks of plankton communities. Various network attack strategies are then selected to simulate different types of network damage. We propose a multi-indicator weighted evaluation scheme, namely, the robustness coefficient, to analyze plankton community robustness across diverse network structures under simulated network damage scenarios. For this purpose, we selected three exemplary biological communities for robustness analysis based on continuous plankton recorder monitoring data. These communities exhibit different levels of biomass and interaction. Moreover, by comparing the robustness coefficient with other existing robustness evaluation metrics and analyzing the standard deviations, our comparative experiments provide additional evidence that using a weighted combination of multiple metrics (our proposed robustness coefficient) results in better performance than reliance on any single metric alone.
2. Materials and Methods
2.1. Materials
The data in this paper were obtained from the Australian Integrated Marine Observing System (IMOS) continuous plankton recorder (CPR) data. These plankton data are classified by genus and the time range is from January, 2009 to September 2022. We analyzed data from three marine plankton communities, with descriptive statistics shown in Table 1.
2.2. Methodology
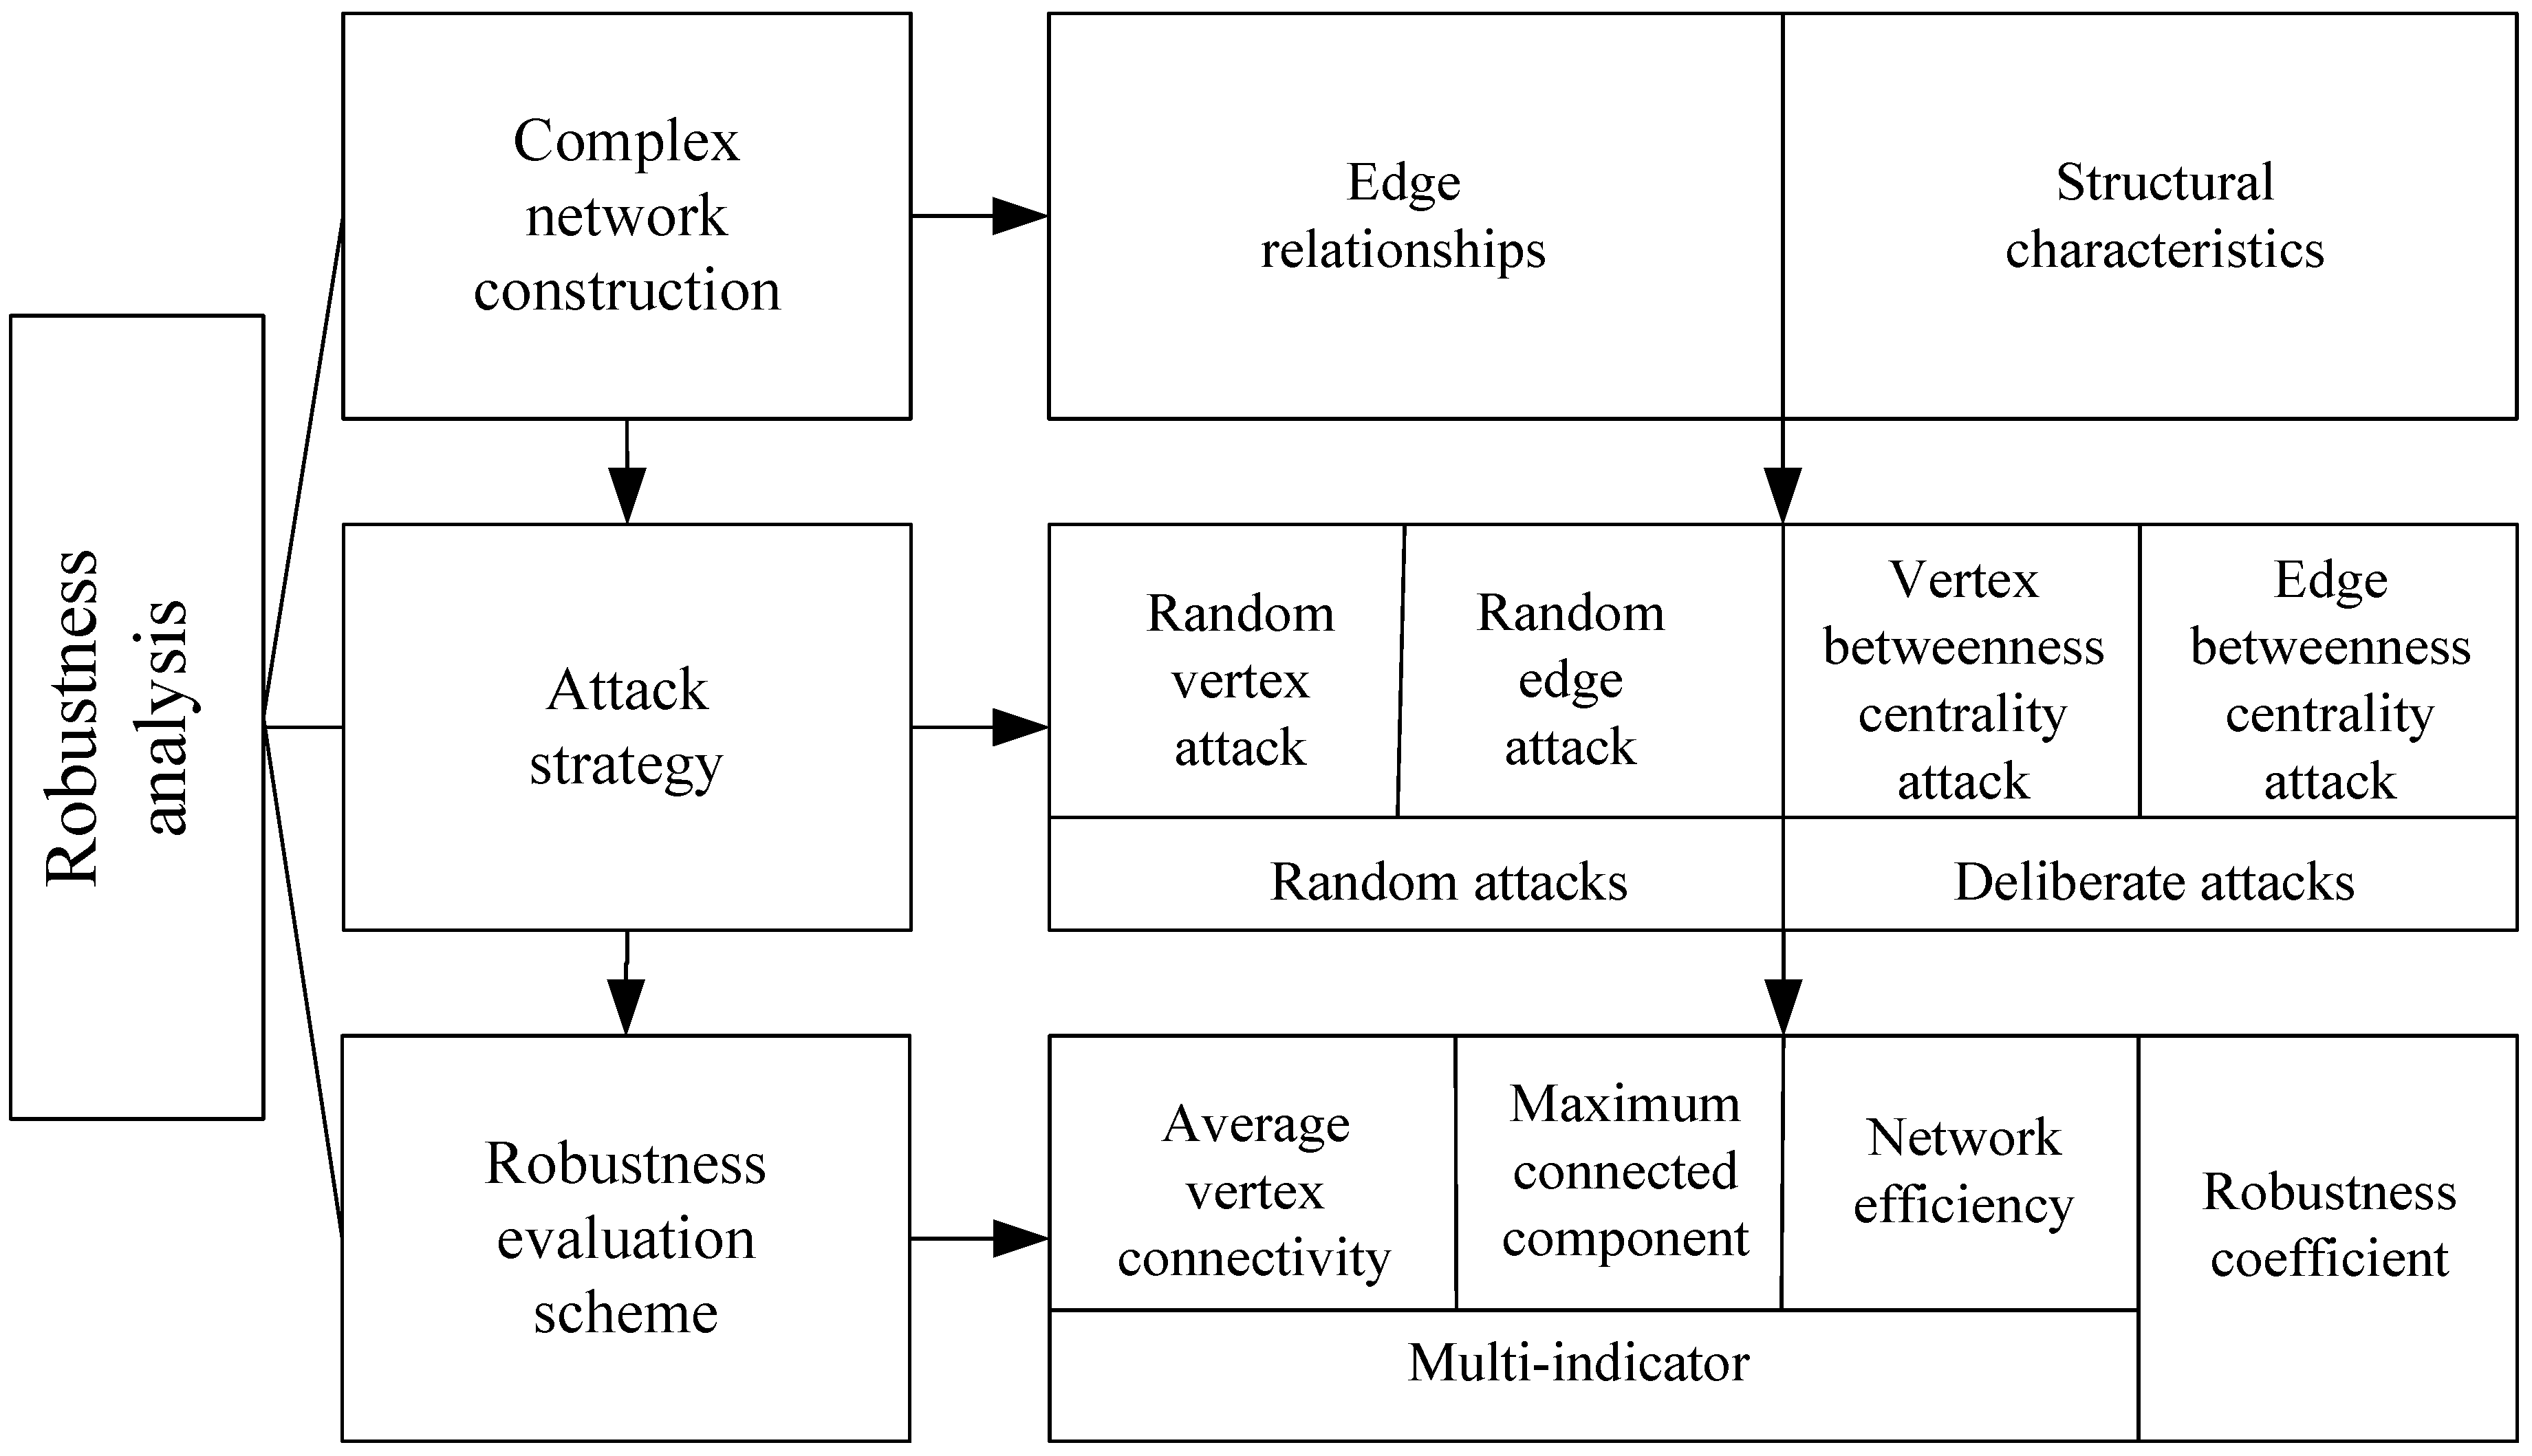
The methodology in this paper consists of two main parts: (1) constructing complex networks using marine plankton community data, and (2) conducting a robustness analysis based on complex network theory, which includes selecting network attack strategies and developing network robustness evaluation schemes. Figure 1 shows the flow chart.
2.2.1. Complex Network Construction
This paper explores the application of complex network theory to model marine plankton community structures [19]. The resulting networks, referred to as marine plankton interaction networks, provide a comprehensive representation of the complex interactions between different plankton species within the marine ecosystem. The network consists of vertices and edges, where the vertices represent plankton community organisms and the edges represent interactions between them.
The marine plankton interaction network can be represented as an undirected weighted network , where constitutes the set of vertices, n denotes the number of vertices, constitutes the set of edges, and m represents the number of edges for any edge , where and
The Spearman rank correlation coefficient (Spearman coefficient) is a statistical measure used to calculate the correlation degree between two variables. It is commonly used in marine biology to determine the correlation between different plankton types. Suppose that two variables X and Y represent two plankton abundance datasets, each with h observations; and denote the ith values of X and Y (), respectively. We sort both X and Y in ascending or descending order, yielding the two variables x and y. The element is the rank of in X, while is the rank of in Y. The Spearman rank correlation coefficient between X and Y can be obtained by the following formula:
where is the mean value of x and is the mean value of y.
In the marine plankton interaction network defined in this paper, each plankton type is represented as a network vertex. Edge weights are determined by the Spearman rank correlation coefficient between two vertices X and Y. No edges exist between X and Y if the p-value is <0.05. The weights of edges between vertices X and Y are defined as follows:
In addition, this paper proposes that the shortest path between vertices i and j has path weights , defined as follows:
where are the vertices on the shortest path between i and j.
Complex networks often possess intricate structures and numerous relationships, making their detailed structural modeling a challenge. Network structural characteristics are often used to concisely describe networks effectively. In this section, three common network metrics, namely, the average degree, average path length, and network diameter, are utilized to describe the overall topology of the marine plankton interaction network.
(1) Average degree: the degree of a vertex describes its connectivity, referring to its associated edge number; the higher the degree, the stronger its connection to other vertices. The average degree of network G is , defined as the average of all vertex degrees:
where denotes the degree of vertex i, or the number of connected edges.
(2) Average path length: in network theory, the path length describes the distance between two vertices, i.e., the minimum edge number a vertex passes through to reach another. A shorter path length indicates higher efficiency and greater information dissemination, while a smaller path length between two vertices indicates higher efficiency. The average path length of network G, denoted , is
where is the minimum edge number between vertices i and j and n is the vertex number of network G.
(3) Network diameter: a network’s diameter refers to the maximum distance between any two vertices, and is used to measure its efficiency and information transfer speed; more specifically, the network diameter refers to the worst link path length. The diameter of network G, denoted , is
2.2.2. Attack Strategies
Robustness analysis aims to analyze network performance under various attacks [20]. Network attacks can simulate removing members based on different strategies [21].
Attacks are currently divided into random attacks and deliberate attacks [22]. Random attacks involve random vertex or edge failures, and can be used to simulate natural disasters or climate effects. Deliberate attacks involve deliberate vertex or edge failures, which can simulate human activities or toxic substances that destroy communities. By using different attack strategies, network robustness can be evaluated from multiple perspectives. In this paper, we selected four attack strategies considering possible destruction of marine plankton communities: two random attacks (random vertex attack [23,24], and random edge attack [25]) and two deliberate attacks (betweenness centrality attack and edge betweenness centrality attack [26]).
(1) Random vertex attack: in the random vertex attack strategy, vertices are randomly deleted from the network [27]. When a vertex is deleted, its connected edges are deleted accordingly. The attack order of vertex is
where n is the network’s vertex number and generates a single random natural number within each time. generates n numbers without repetition.
(2) Random edge attack: in the random edge attack strategy, edges are randomly deleted from the network [28]. When all edges connected to a vertex are deleted, that vertex is deleted accordingly [29]. The attack order of edge is
where m is the network’s edge number and generates a single random natural number within each time. generates m numbers without repetition.
(3) Vertex betweenness centrality attack: this attack strategy sequentially attacks vertices based on betweenness centrality in order from largest to smallest. Two non-neighboring connected vertices’ interaction depends mainly on the other vertices along the path. These vertices act as bridges forthe interaction of edge vertices. The vertex betweenness centrality is used to measure these vertices’ importance:
where is the path number between vertices i and j and is the path number between vertices i and j passing through vertex p.
(4) Edge betweenness centrality attack: this attack strategy sequentially attacks edges based on betweenness centrality in order from largest to smallest. If an edge frequently appears on the path between any two vertices, it is in a relatively central network position with high betweenness centrality. The betweenness centrality of edge is
where is the path number between vertices i and j passing through edge and is the path number between vertices i and j.
2.2.3. Robustness Evaluation Scheme
In this paper, we adopt the average vertex connectivity, maximum connectivity component, and network efficiency as evaluation indicators, drawing on complex network theory and plankton community structure. However, these traditional single indicators present limitations in terms of robustness analysis and measurement. To address this issue, we introduce a novel multi-indicator weighted robustness evaluation scheme.
(1) Average vertex connectivity: vertex connectivity measures the ability of network vertices to remain connected after deleting some number of vertices [30] based on connectivity [31]. In marine plankton communities, a plankton type’s steady-state biomass is closely related to the nutrients it can uptake. If a plankton type feeds only on one food type, any sharp population decline risks severe harm, as a reduction in food availability threatens this food source. Feeding on varied foods reduces this risk, as loss of one food source can be replaced with others. From an energy transfer perspective, fewer bioenergy sources are easily lost through disturbance and destruction. Community stability is often related to interaction diversity, and vertex connectivity measures a similar network property.
In network G, the vertex connectivity between vertices i and j denotes the minimum vertex number needed to disconnect vertices i and j. Then, the average vertex connectivity is
Generally, higher indicates better network robustness. To eliminate dimensional influence on the robustness analysis, the value can be normalized as follows:
(2) Maximum connected component: the maximum connected component refers to the largest subnetwork formed by vertices and edges. In robustness analysis, it reflects a network’s damage degree [32]. When the removed vertex or edge ratio reaches a critical value, the maximum connected component changes [33]. Plankton interactions play a critical role in shaping community characteristics and functions. However, disrupting plankton interaction clusters and hindering material transfer between them significantly changes characteristic functions, leading to collapse of the original plankton community. The maximum connected component change effectively reflects the network structure’s tolerance to attack, providing a good evaluation of the network cluster structure.
In network G, the initial vertex number is N. After attack, the largest connected subnetwork’s vertex number is . Then, the largest connected component’s relative value is
Here, reflects the network structure’s tolerance degree to attacks. To eliminate dimensional influence on the robustness analysis, the values can be normalized as follows:
(3) Network efficiency: network efficiency refers to the efficiency of information exchange throughout the network [34,35]. Energy transfer between plankton often involves losses. The narrower the energy transfer path between any two plankton, the less conducive it is to gaining energy and the more prone it is to being disconnected under disturbances and destruction. In contrast, a wide path is clearly more conducive to maintaining the community in its steady state. Given the shortest path weight in network G, the network efficiency is
Generally, a higher indicates better network robustness. To eliminate dimensional influence, the value can be normalized as follows:
(4) Robustness coefficient: three indicators (average vertex connectivity, maximum connected component, and network efficiency) have been introduced above. Below, we propose a multi-indicator weighted robustness evaluation scheme, called the robustness coefficient, by balancing the weights of these three indicators.
First, let the robustness coefficient be
where represents the three normalized indicators in the robustness evaluation and f denotes the algorithm.
Next, calculate the indicators when the marine plankton interaction network is destroyed. For each indicator, we obtain a changed dataset of quantity t. Now, compute the data mean
Next, calculate the indicator variation variance
Repeat the experimental steps P times to calculate the mean variance . Then, determine each indicator’s weight in the robustness coefficient using , as follows:
Using the normalization method (),
The robustness coefficient can now be summarized as follows:
3. Results
3.1. Network Construction
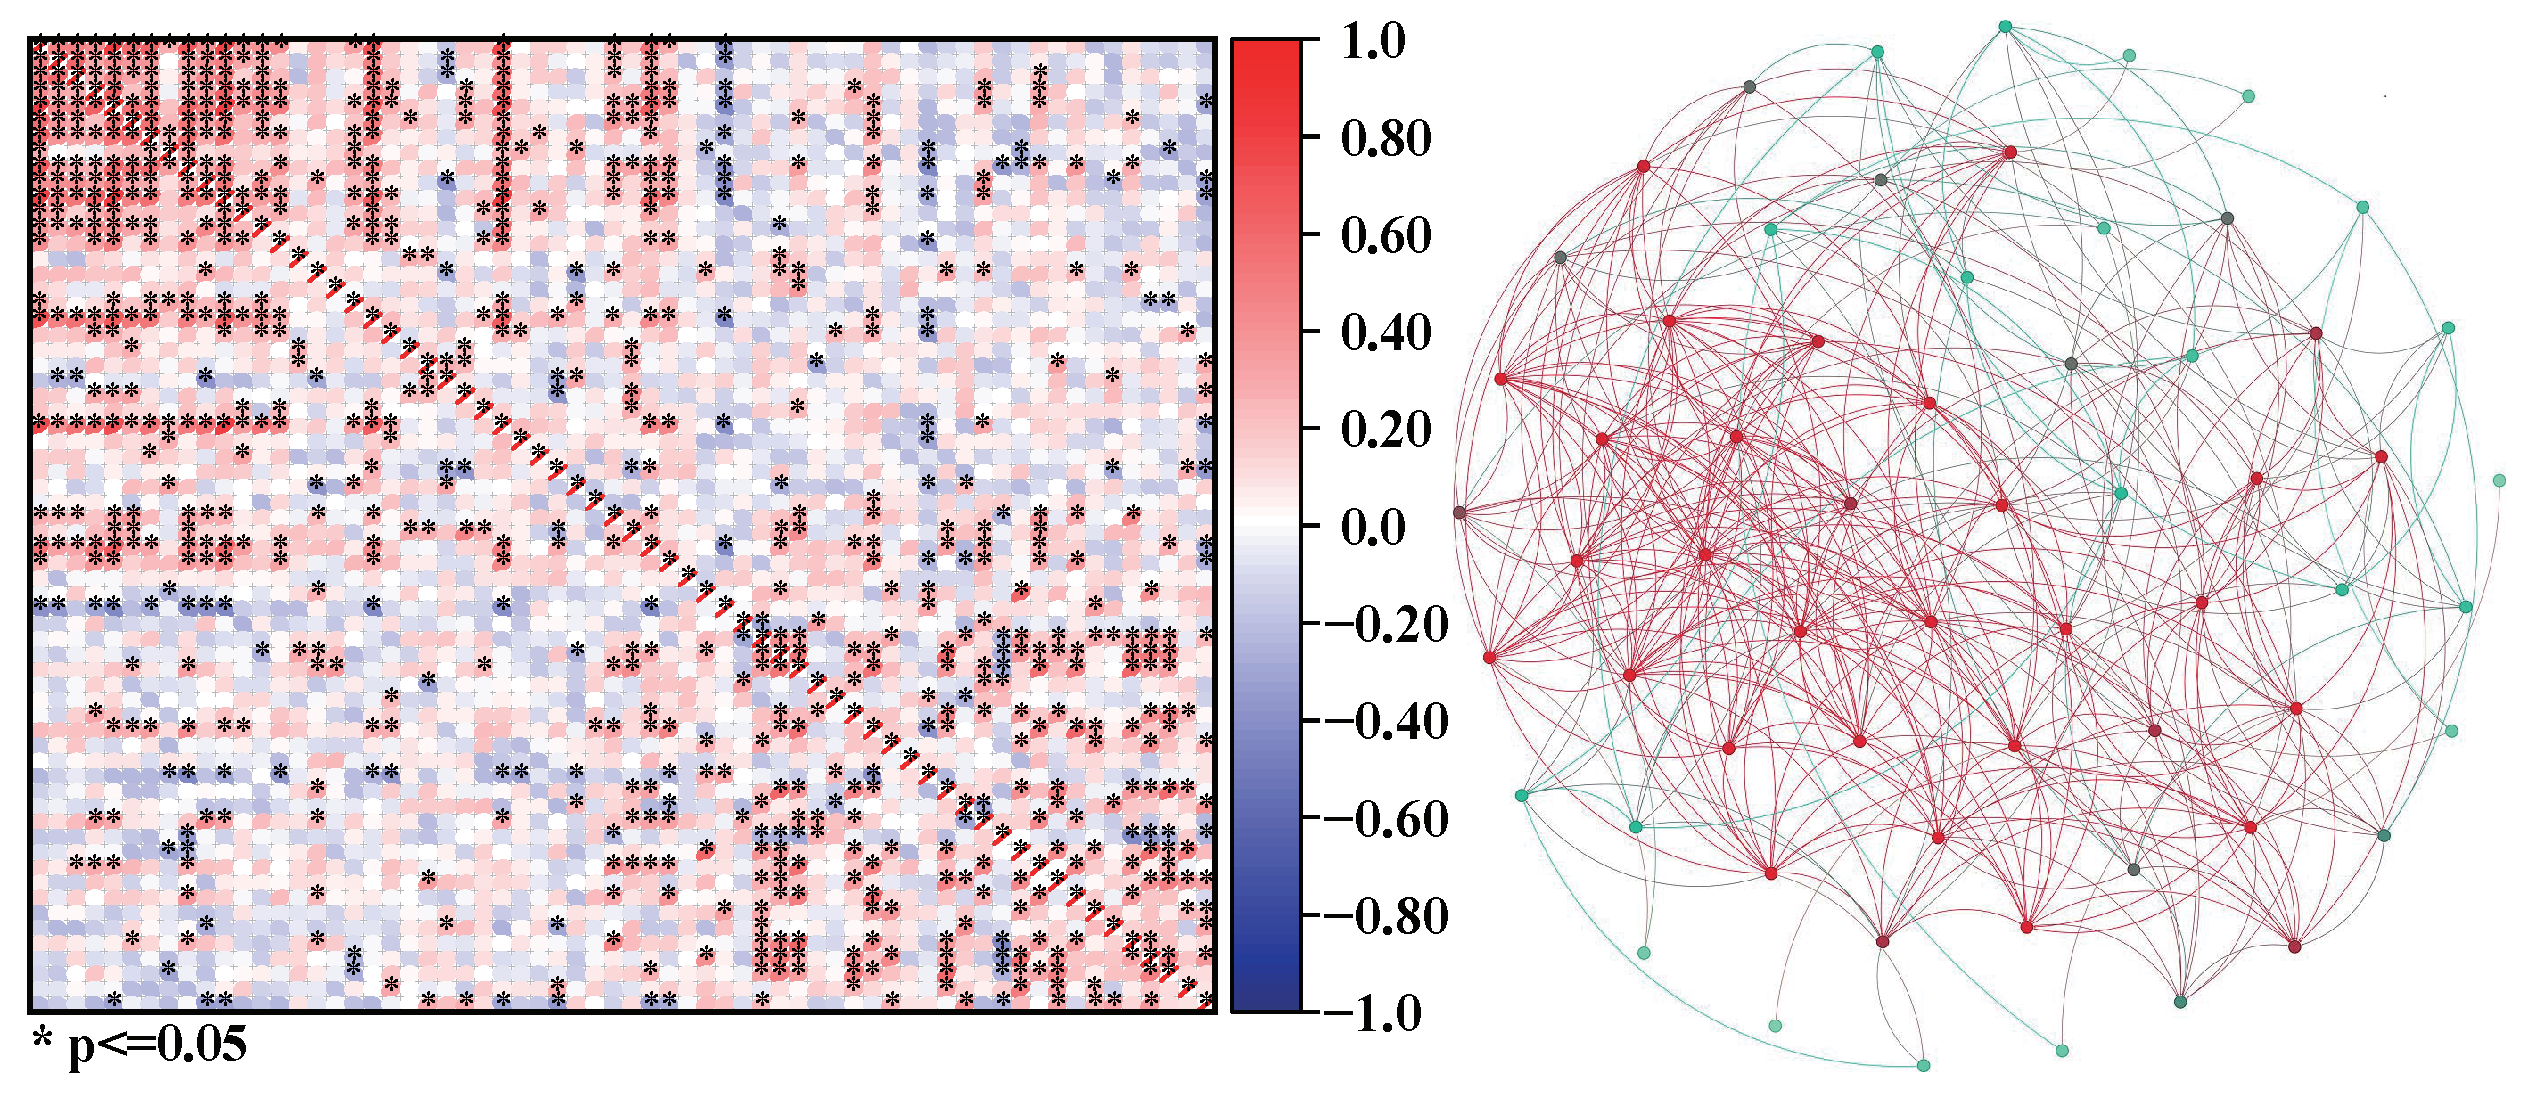
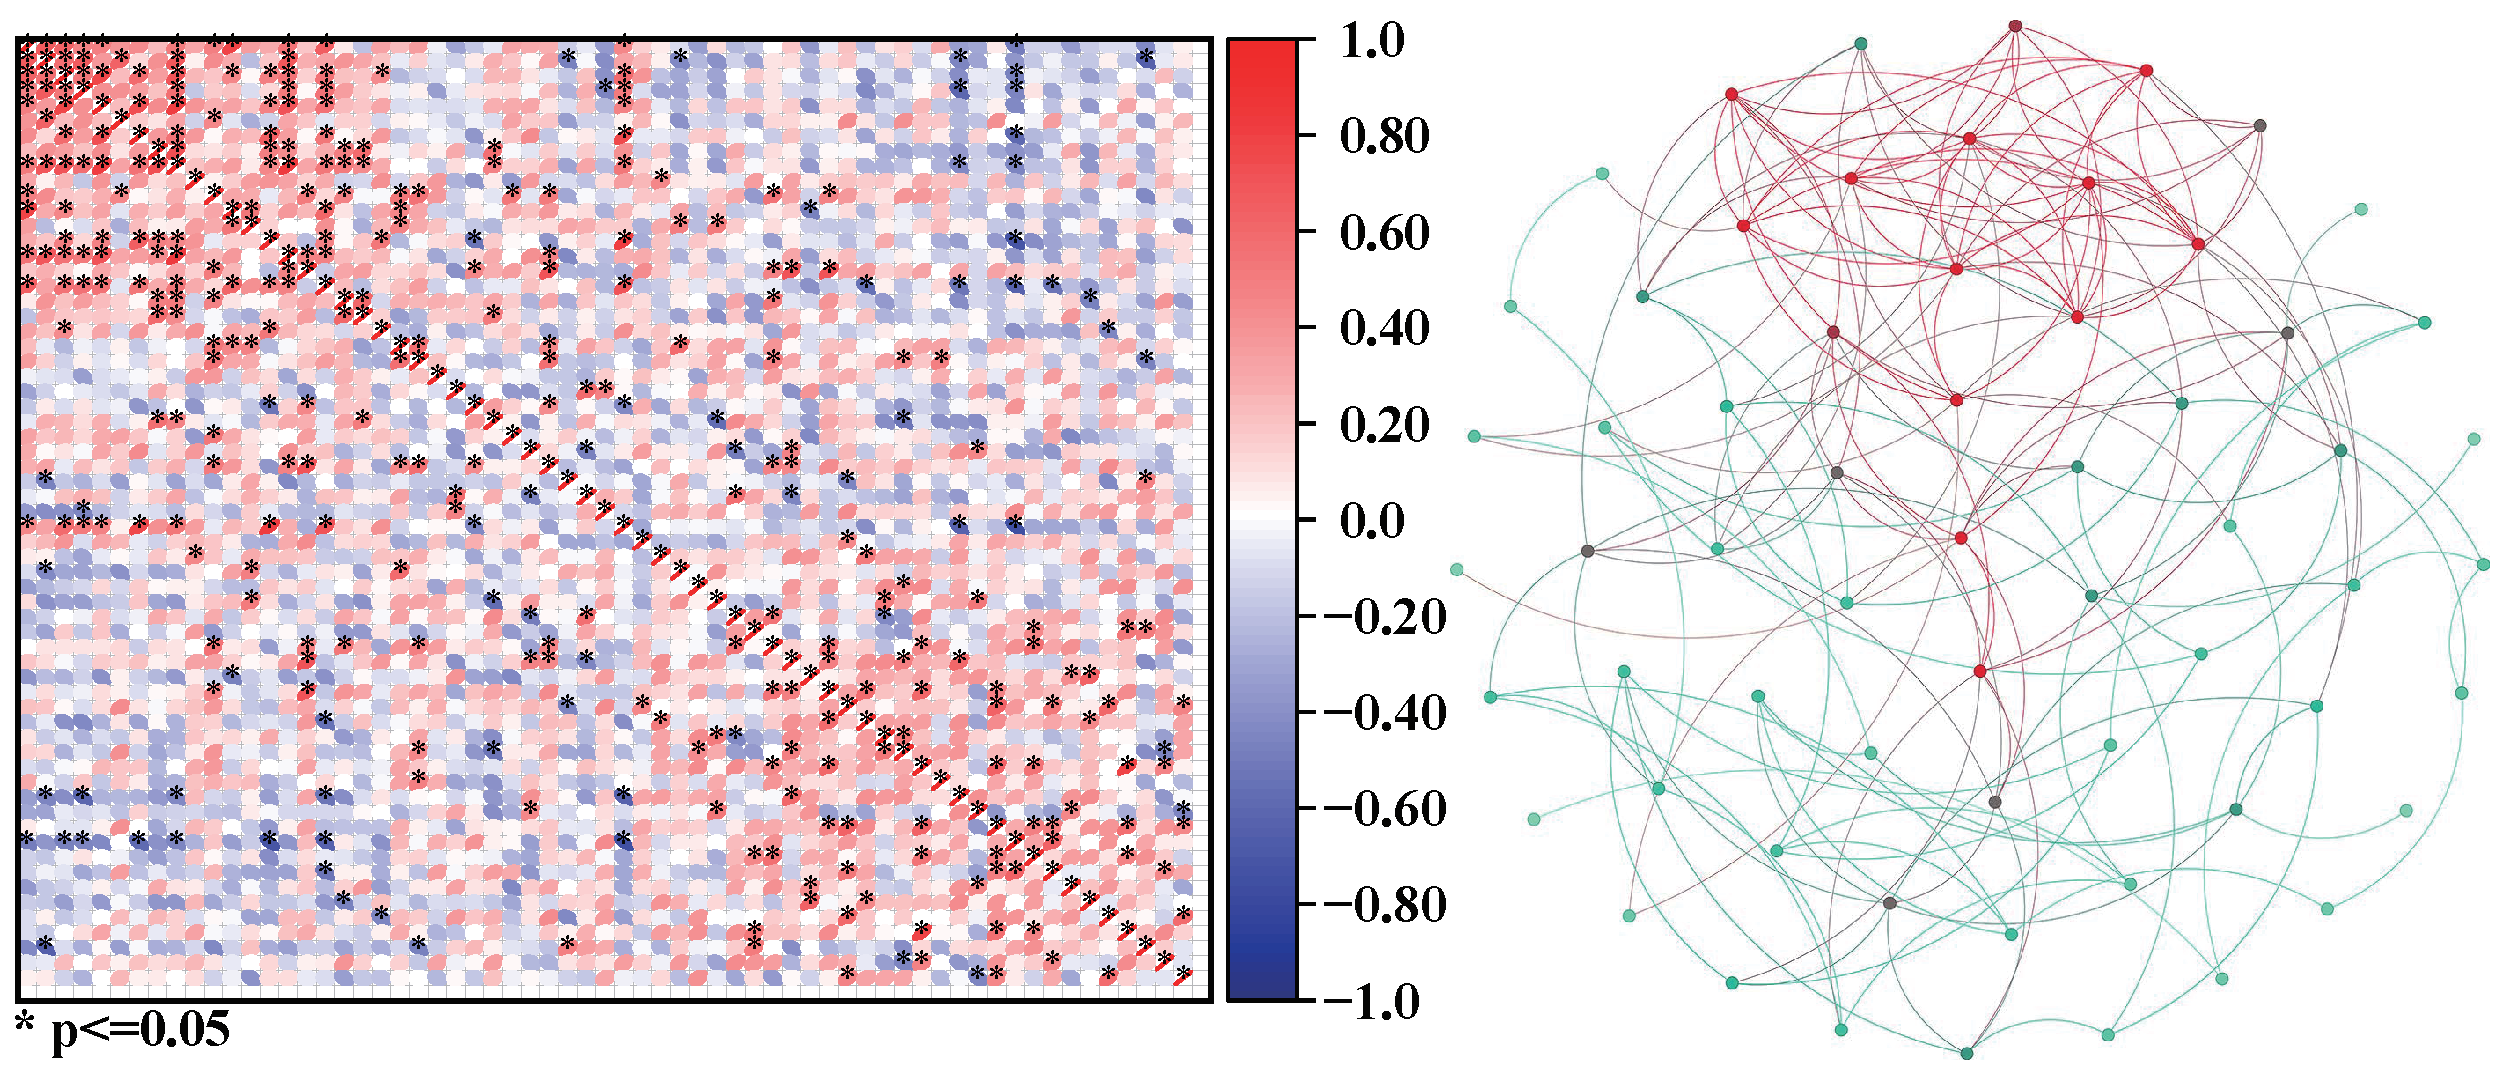
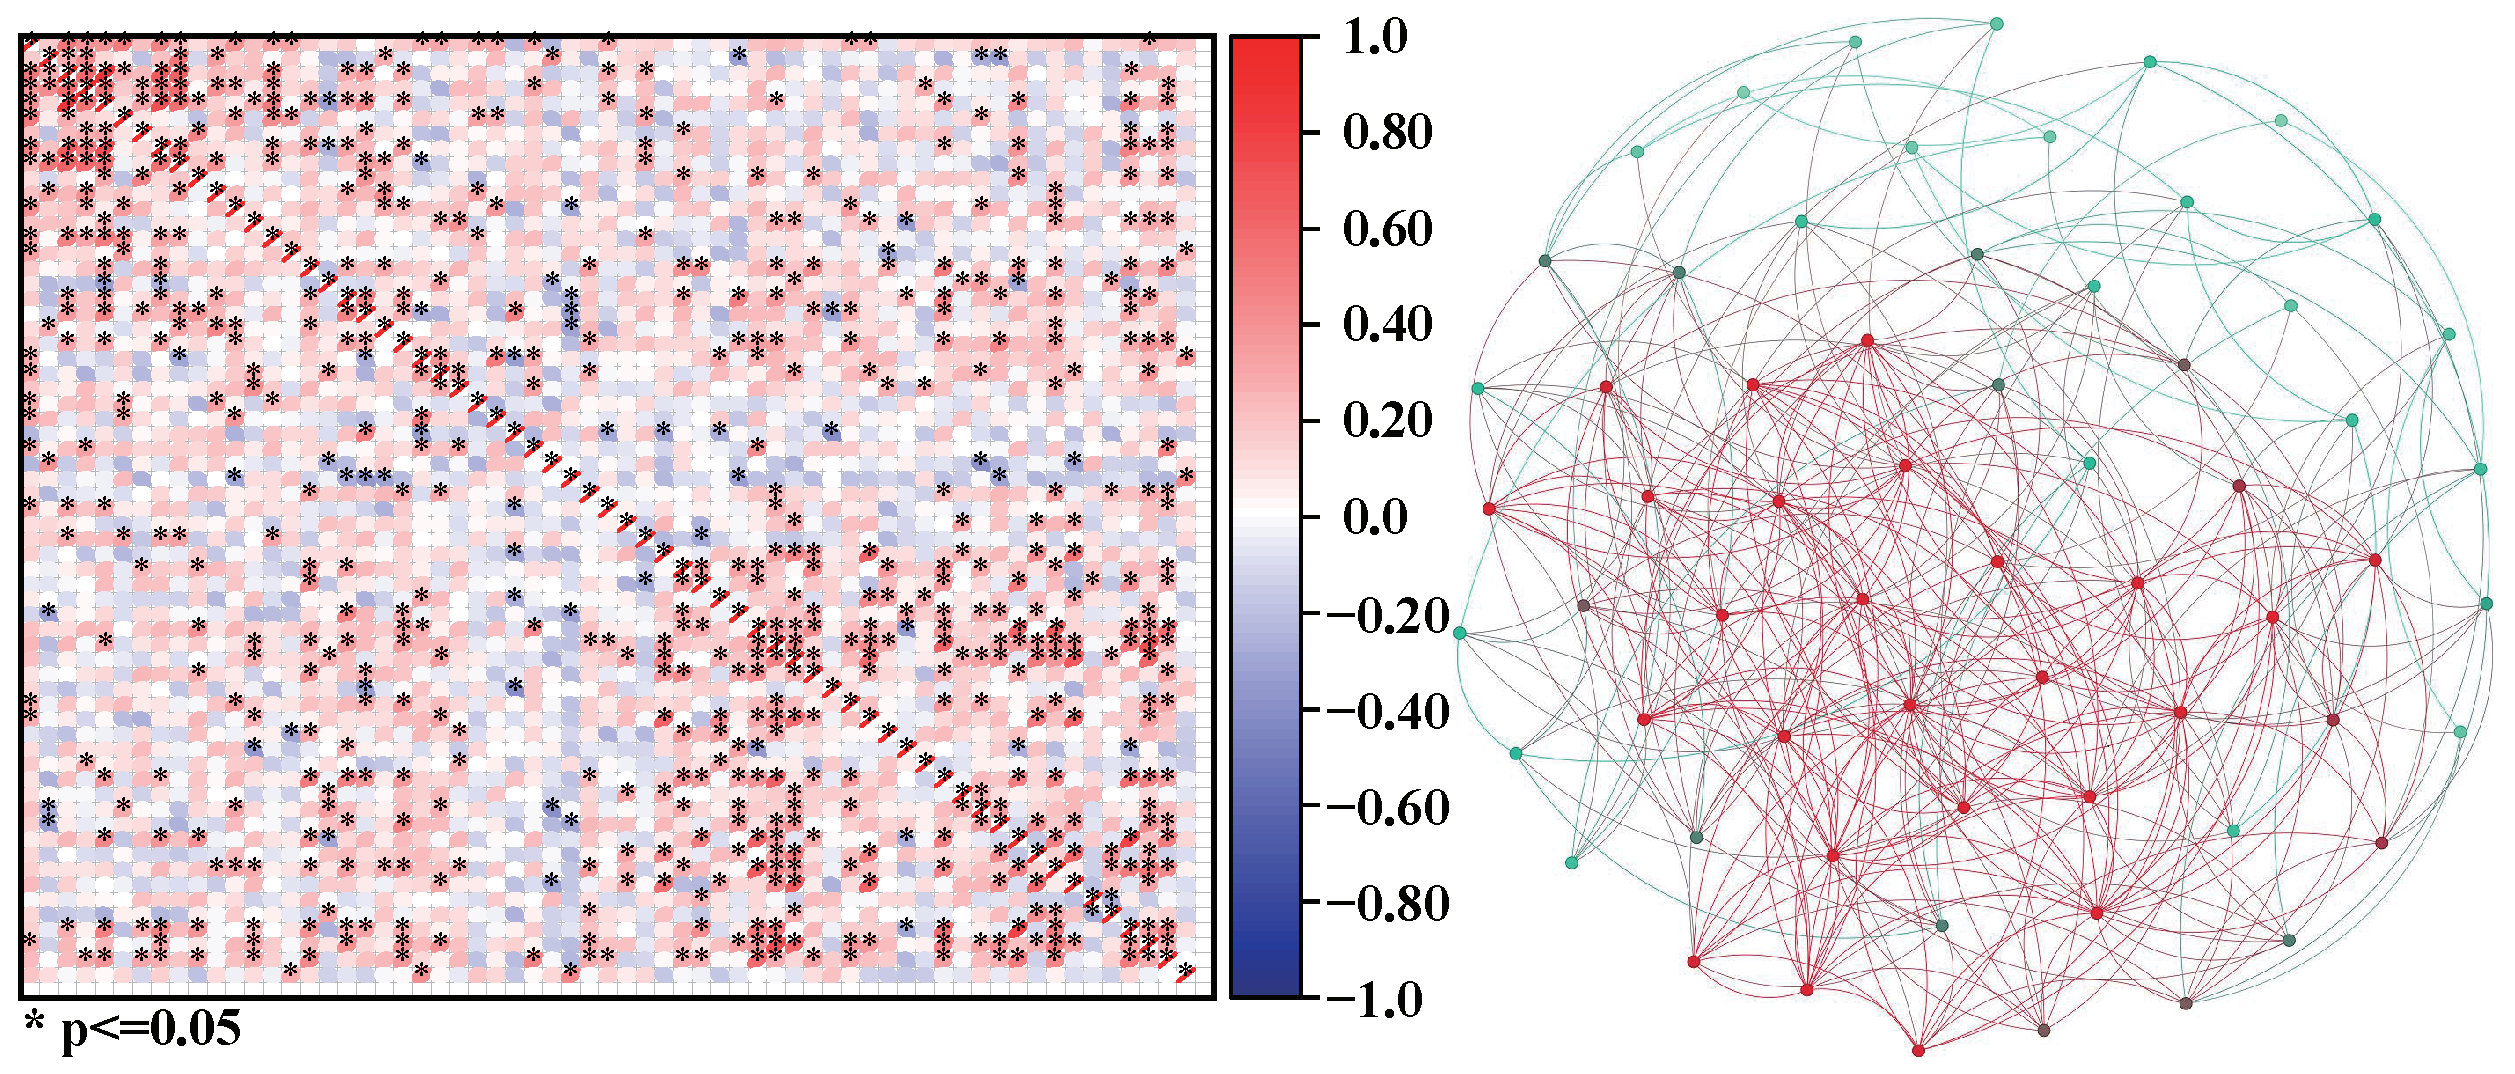
Take the examples of three plankton communities a, b, and c. We can calculate the correlation coefficients among organisms in communities a, b, and c and construct corresponding networks according to the network construction scheme, as shown in Figure 2, Figure 3 and Figure 4.
The results of characterization and comparison of the structural properties of plankton interaction networks constructed from the three plankton communities are shown in Table 2. All three networks have similar vertex numbers, while their edge numbers differ. Network b has substantially fewer edges compared to networks a and c, while networks a and c have comparable edge numbers. Additionally, network b has an average degree of only 5.55, indicating a sparse connection density.
3.2. Network Robustness Analysis
We performed the plankton interaction network robustness analysis according to the network attack strategies and robustness evaluation schemes presented in Section 2.2. First, the number of different plankton types (1, 2, 3, …, n) by genus was set before starting the experiment. Then, attacks were carried out in certain proportions following different attack strategies. During network attacks, both the structure and characteristics of the network change. To assess the impacts of attacks on the network, we calculated the robustness evaluation indicators for the network at different attack degrees. Variations in the robustness evaluation indicators for the three networks under four attack strategies are shown through the curves in Figure 5, Figure 6, Figure 7 and Figure 8, and changes in the robustness coefficients are displayed in Figure 5.
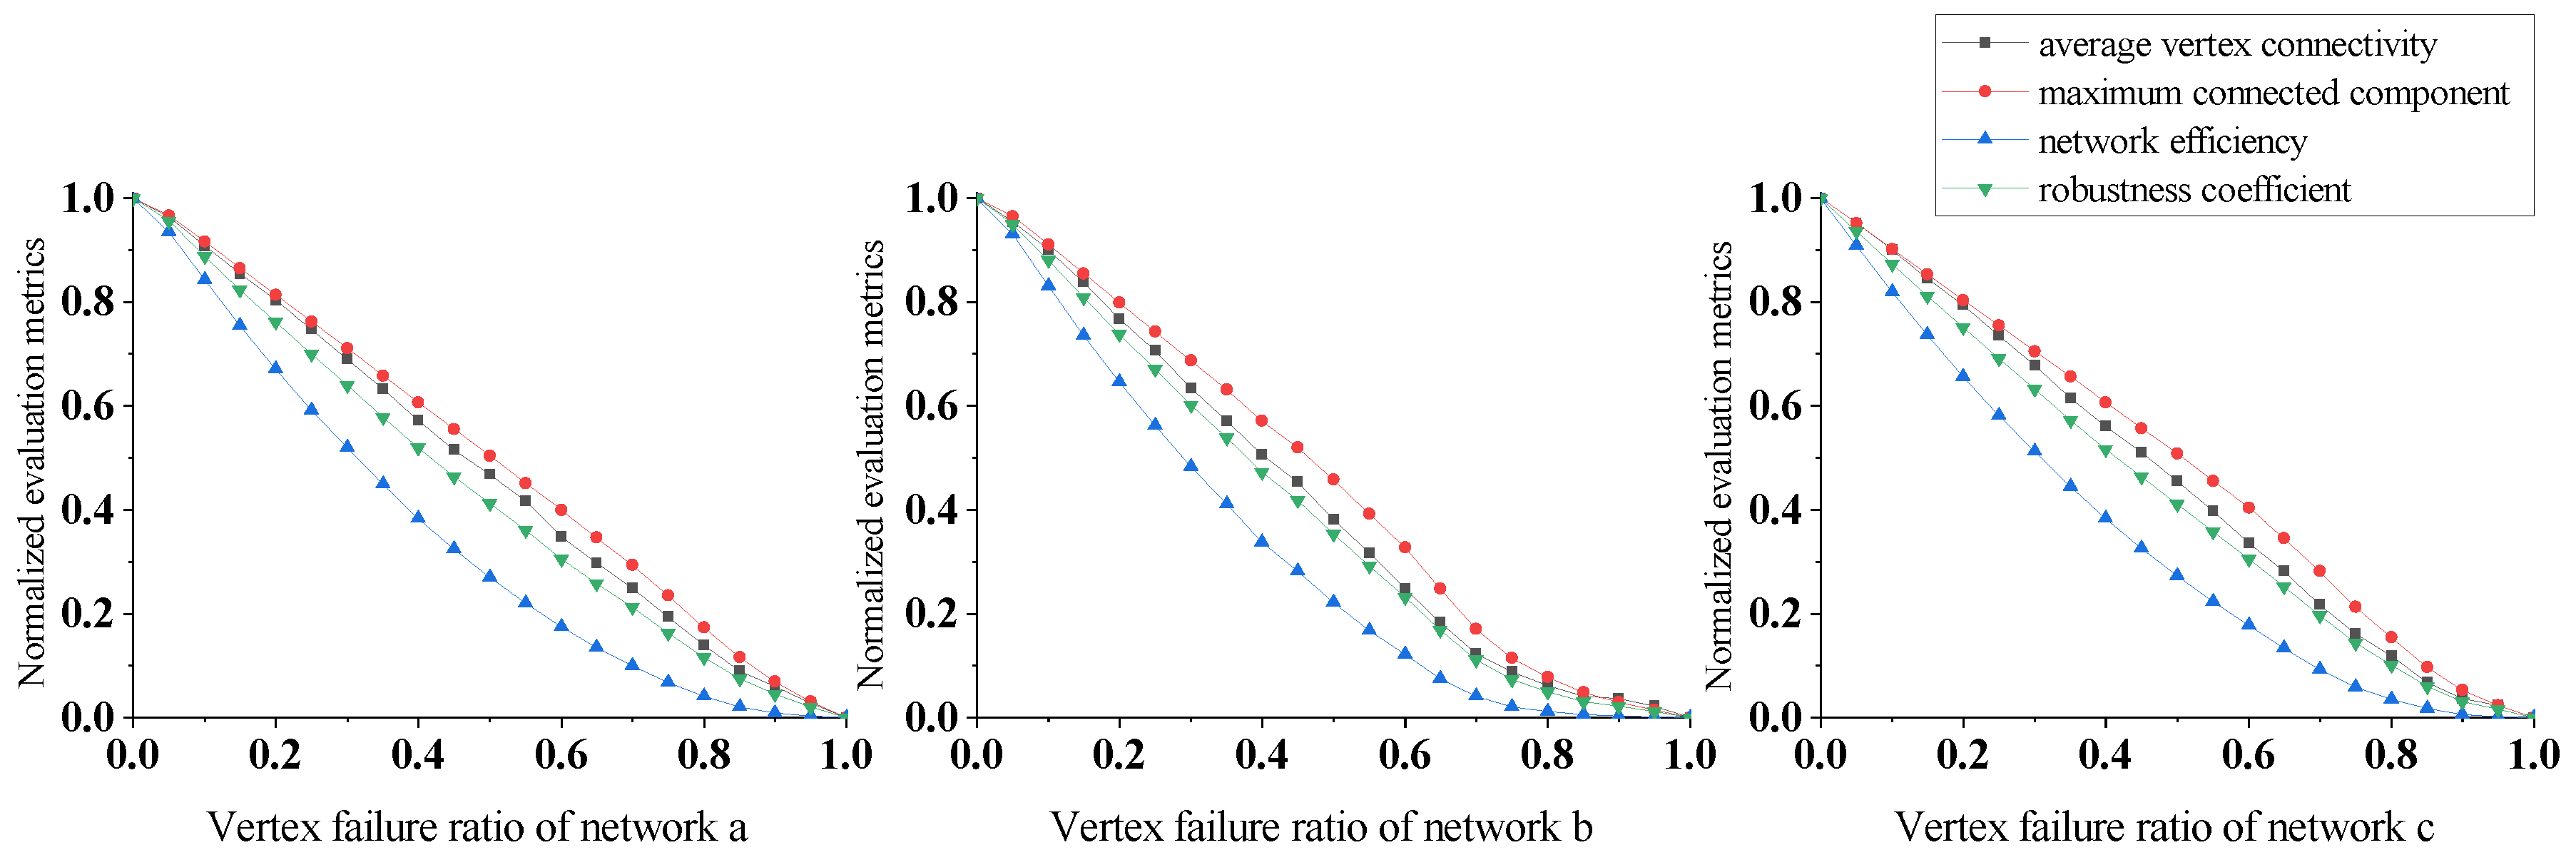
In Figure 6, the evaluation indicators decrease rapidly under random vertex attacks for all three networks. Although the changes in the indicators differ across networks, their robustness is similar. This suggests that plankton communities can undergo dangerously rapid collapse when certain organisms disappear regardless of their community structure. Furthermore, the maximum connected component of all three networks decreases the most slowly, followed by the average vertex connectivity, while the network efficiency declines the fastest. This shows that even though the community remains structurally sound under random vertex attacks, its function is severely damaged.
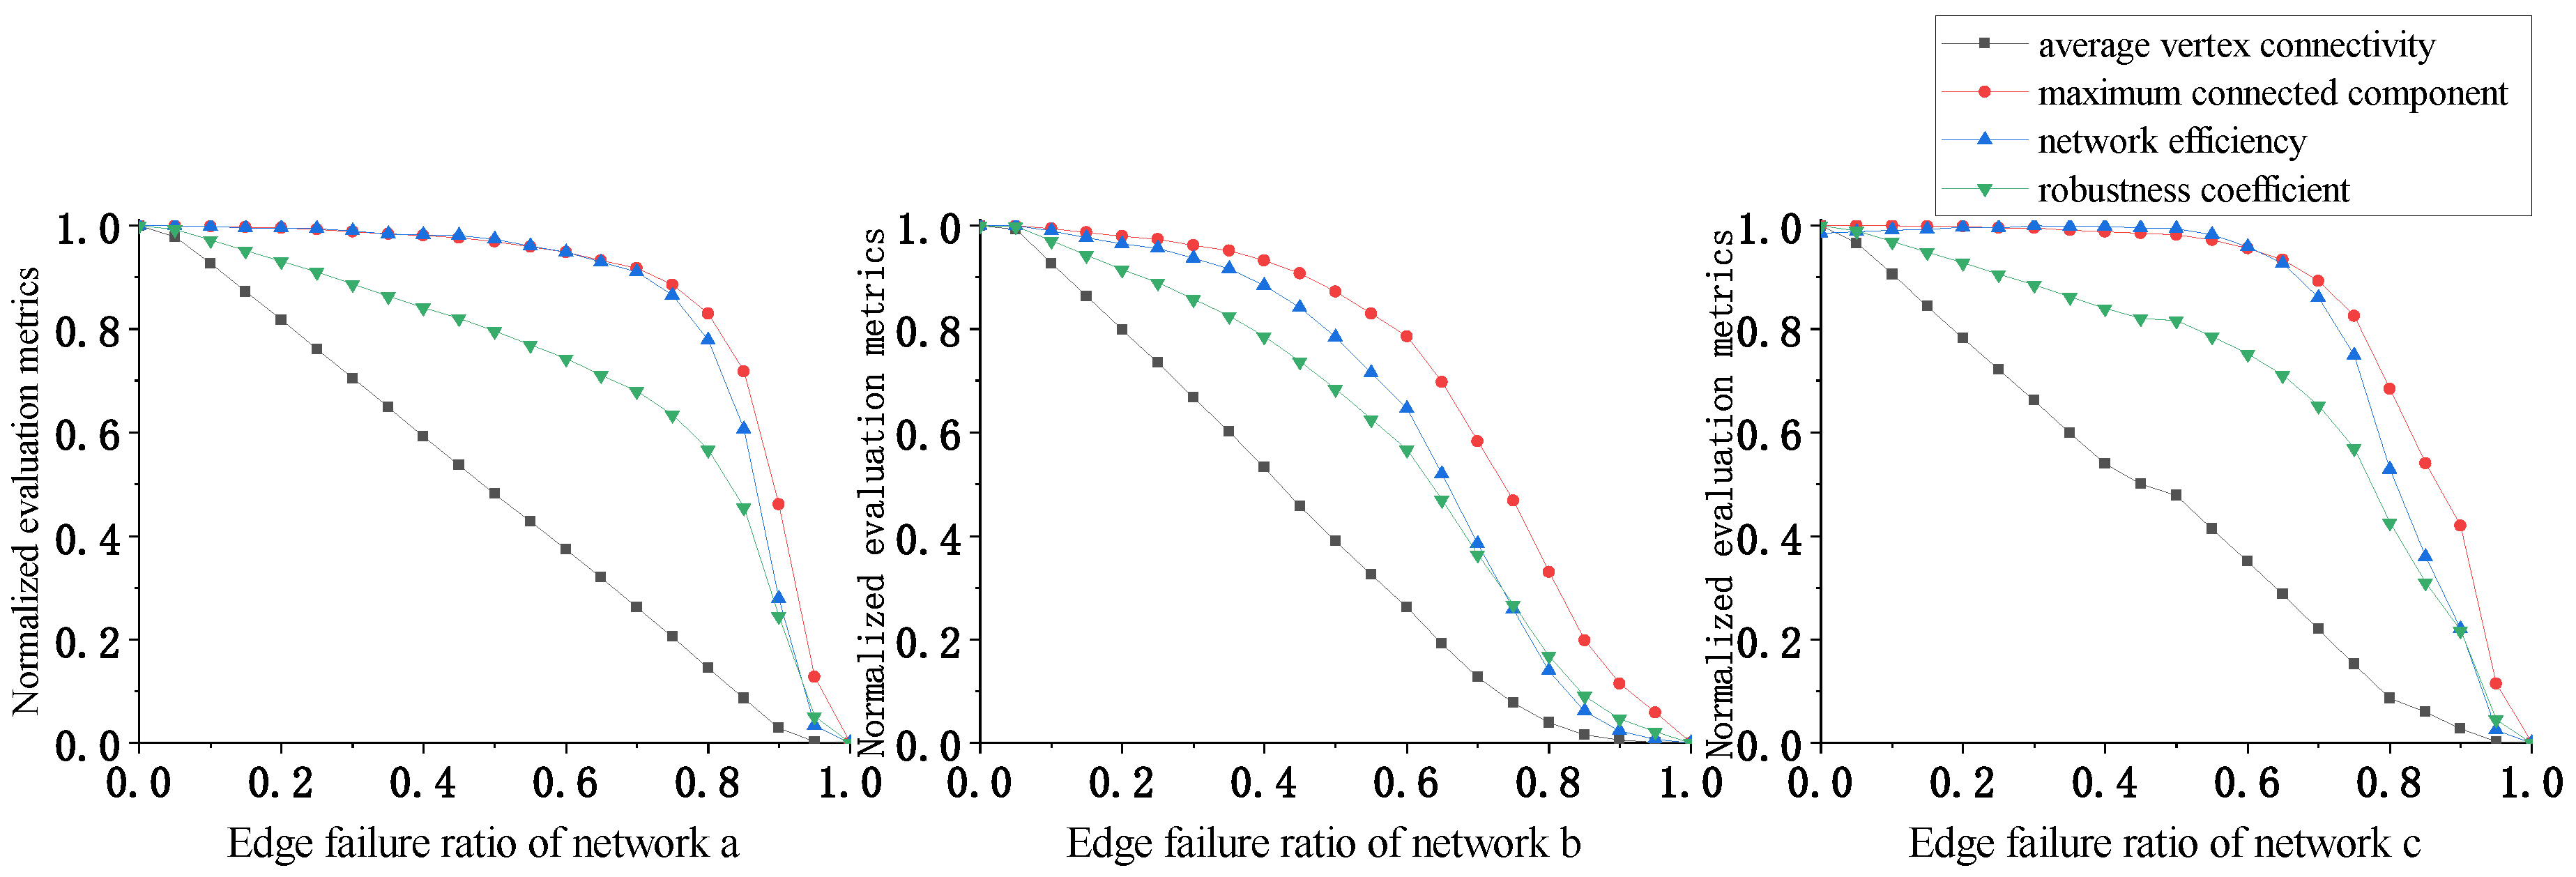
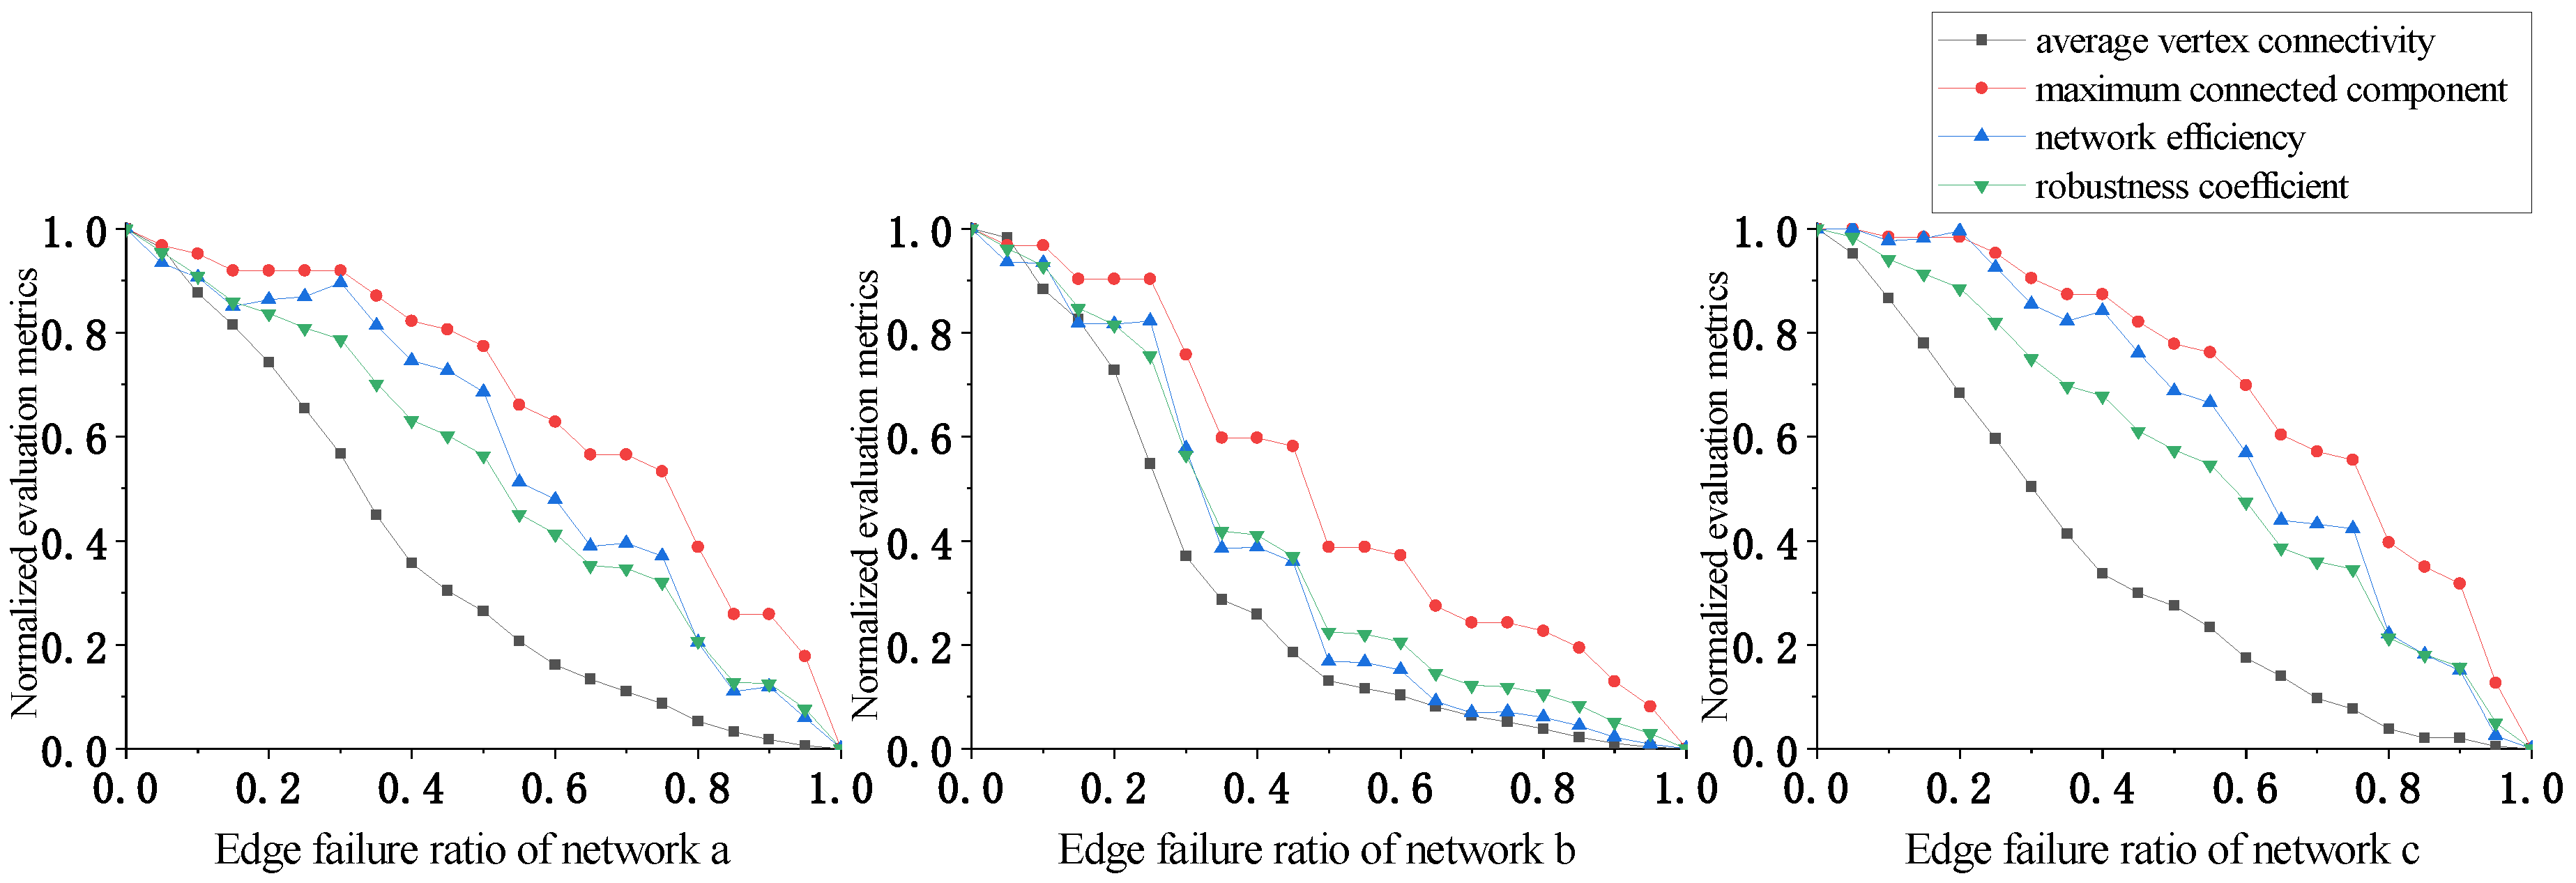
In Figure 7, the evaluation indicators perform better under random edge attacks for all three networks as compared to random vertex attacks. Networks a and c exhibit slow early stage declines, while network b is slightly less robust than networks a and c; however, this difference is insignificant. These results suggest that random edge attacks have weaker destructive power than random vertex attacks. In the early attack stages, networks with more edges, such as a and c, are less affected. This shows that plankton communities can resist natural disruptions well, especially highly interconnected communities such as a and c.
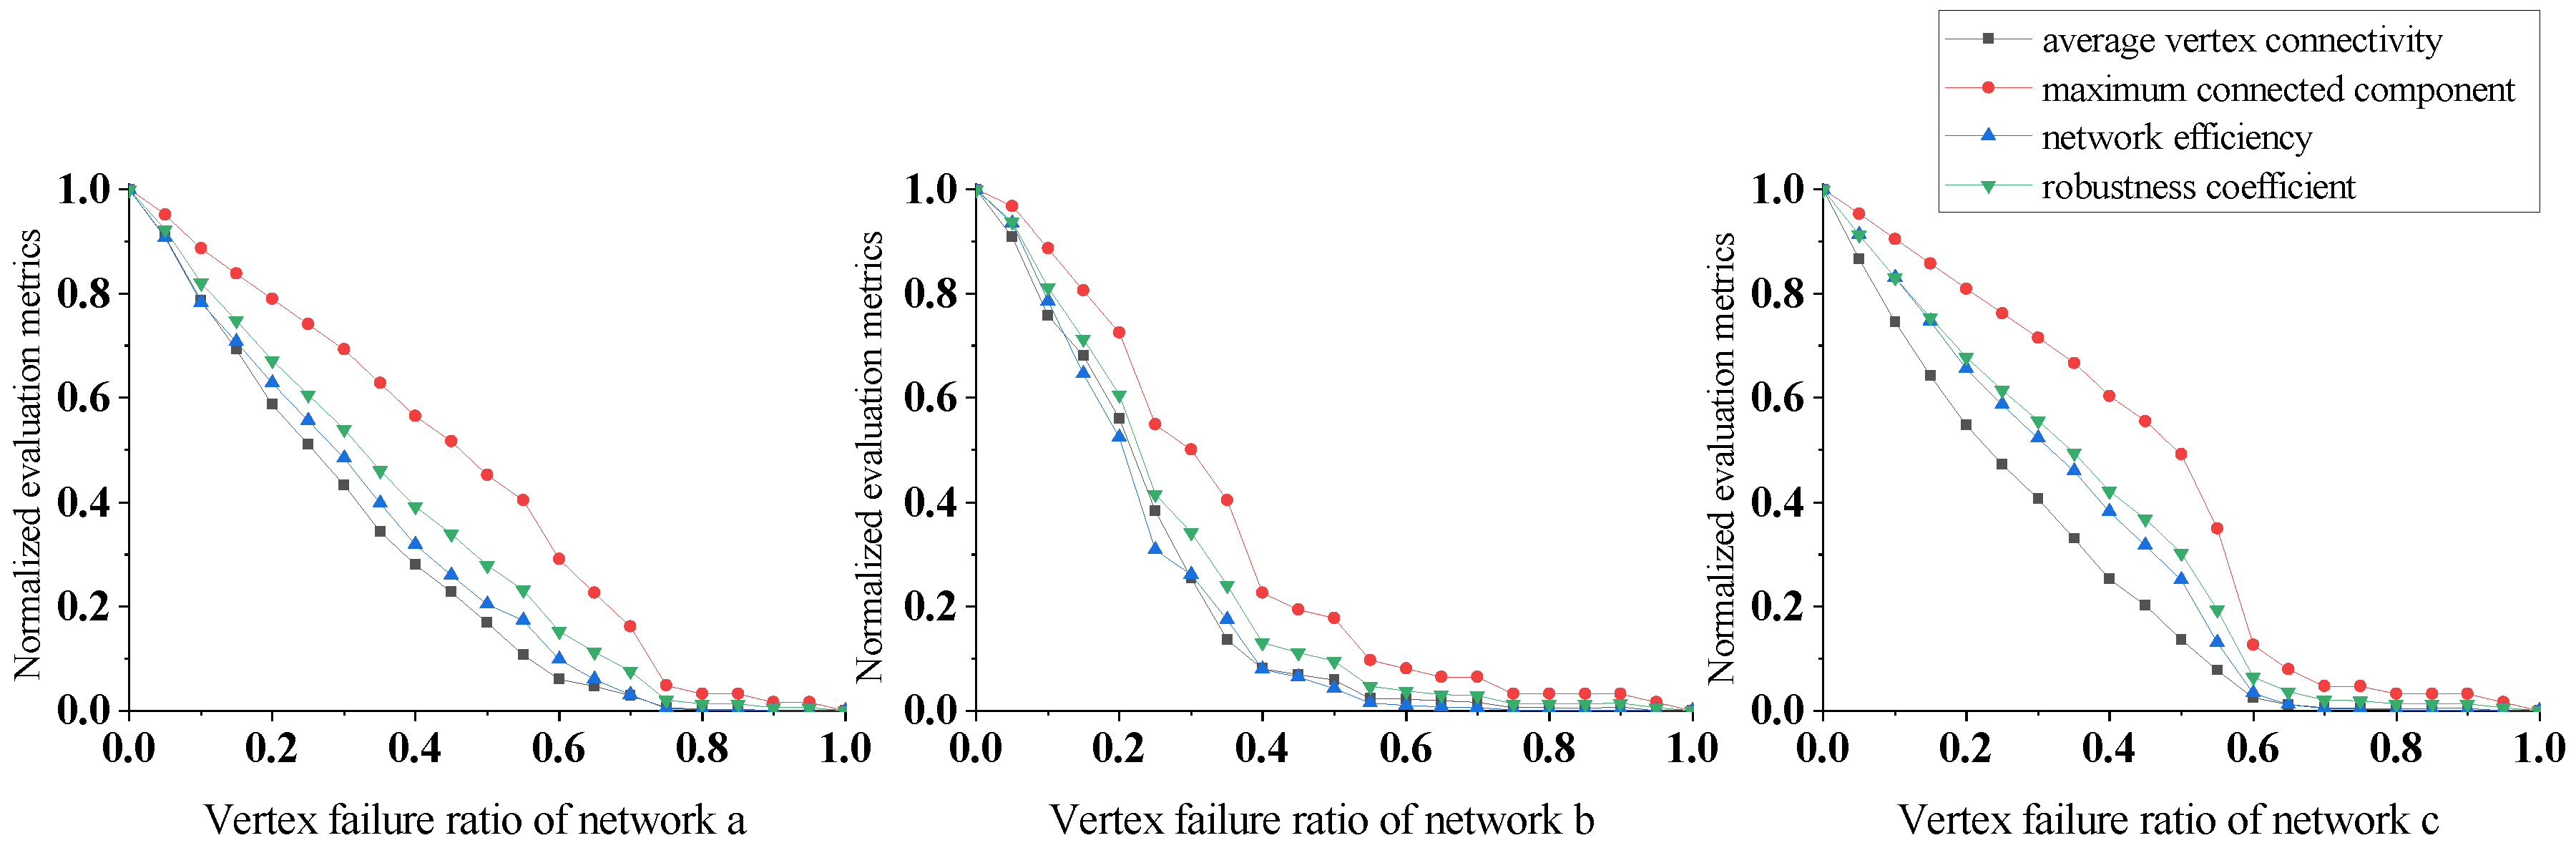
In Figure 8, the evaluation indicators decrease rapidly under vertex betweenness centrality attacks for all three networks, especially network b. In network b, when the vertex failure rate reaches 60%, the values of the average vertex connectivity and the network efficiency both drop to almost 0. At this point, the maximum connected component value is only about 10% of the original network. This shows that plankton communities can rapidly collapse under vertex betweenness centrality attacks, and that degradation of function is inevitable even if community biomass remains high.
In Figure 9, the evaluation indicators under edge betweenness centrality attacks perform better than under vertex betweenness centrality attacks for all three networks. The maximum connected components and the network efficiency of networks a and c exhibit show slow decreases, while network b decreases more rapidly, which is likely related to its having fewer edges. This suggests that more interspecies connections confer higher plankton community robustness. However, the intensity of damage under edge betweenness centrality attacks is greater compared to random edge attacks, despite both attack types targeting edges. This shows that deliberate attacks, whether on vertices or edges, consistently cause more damage than random failures.
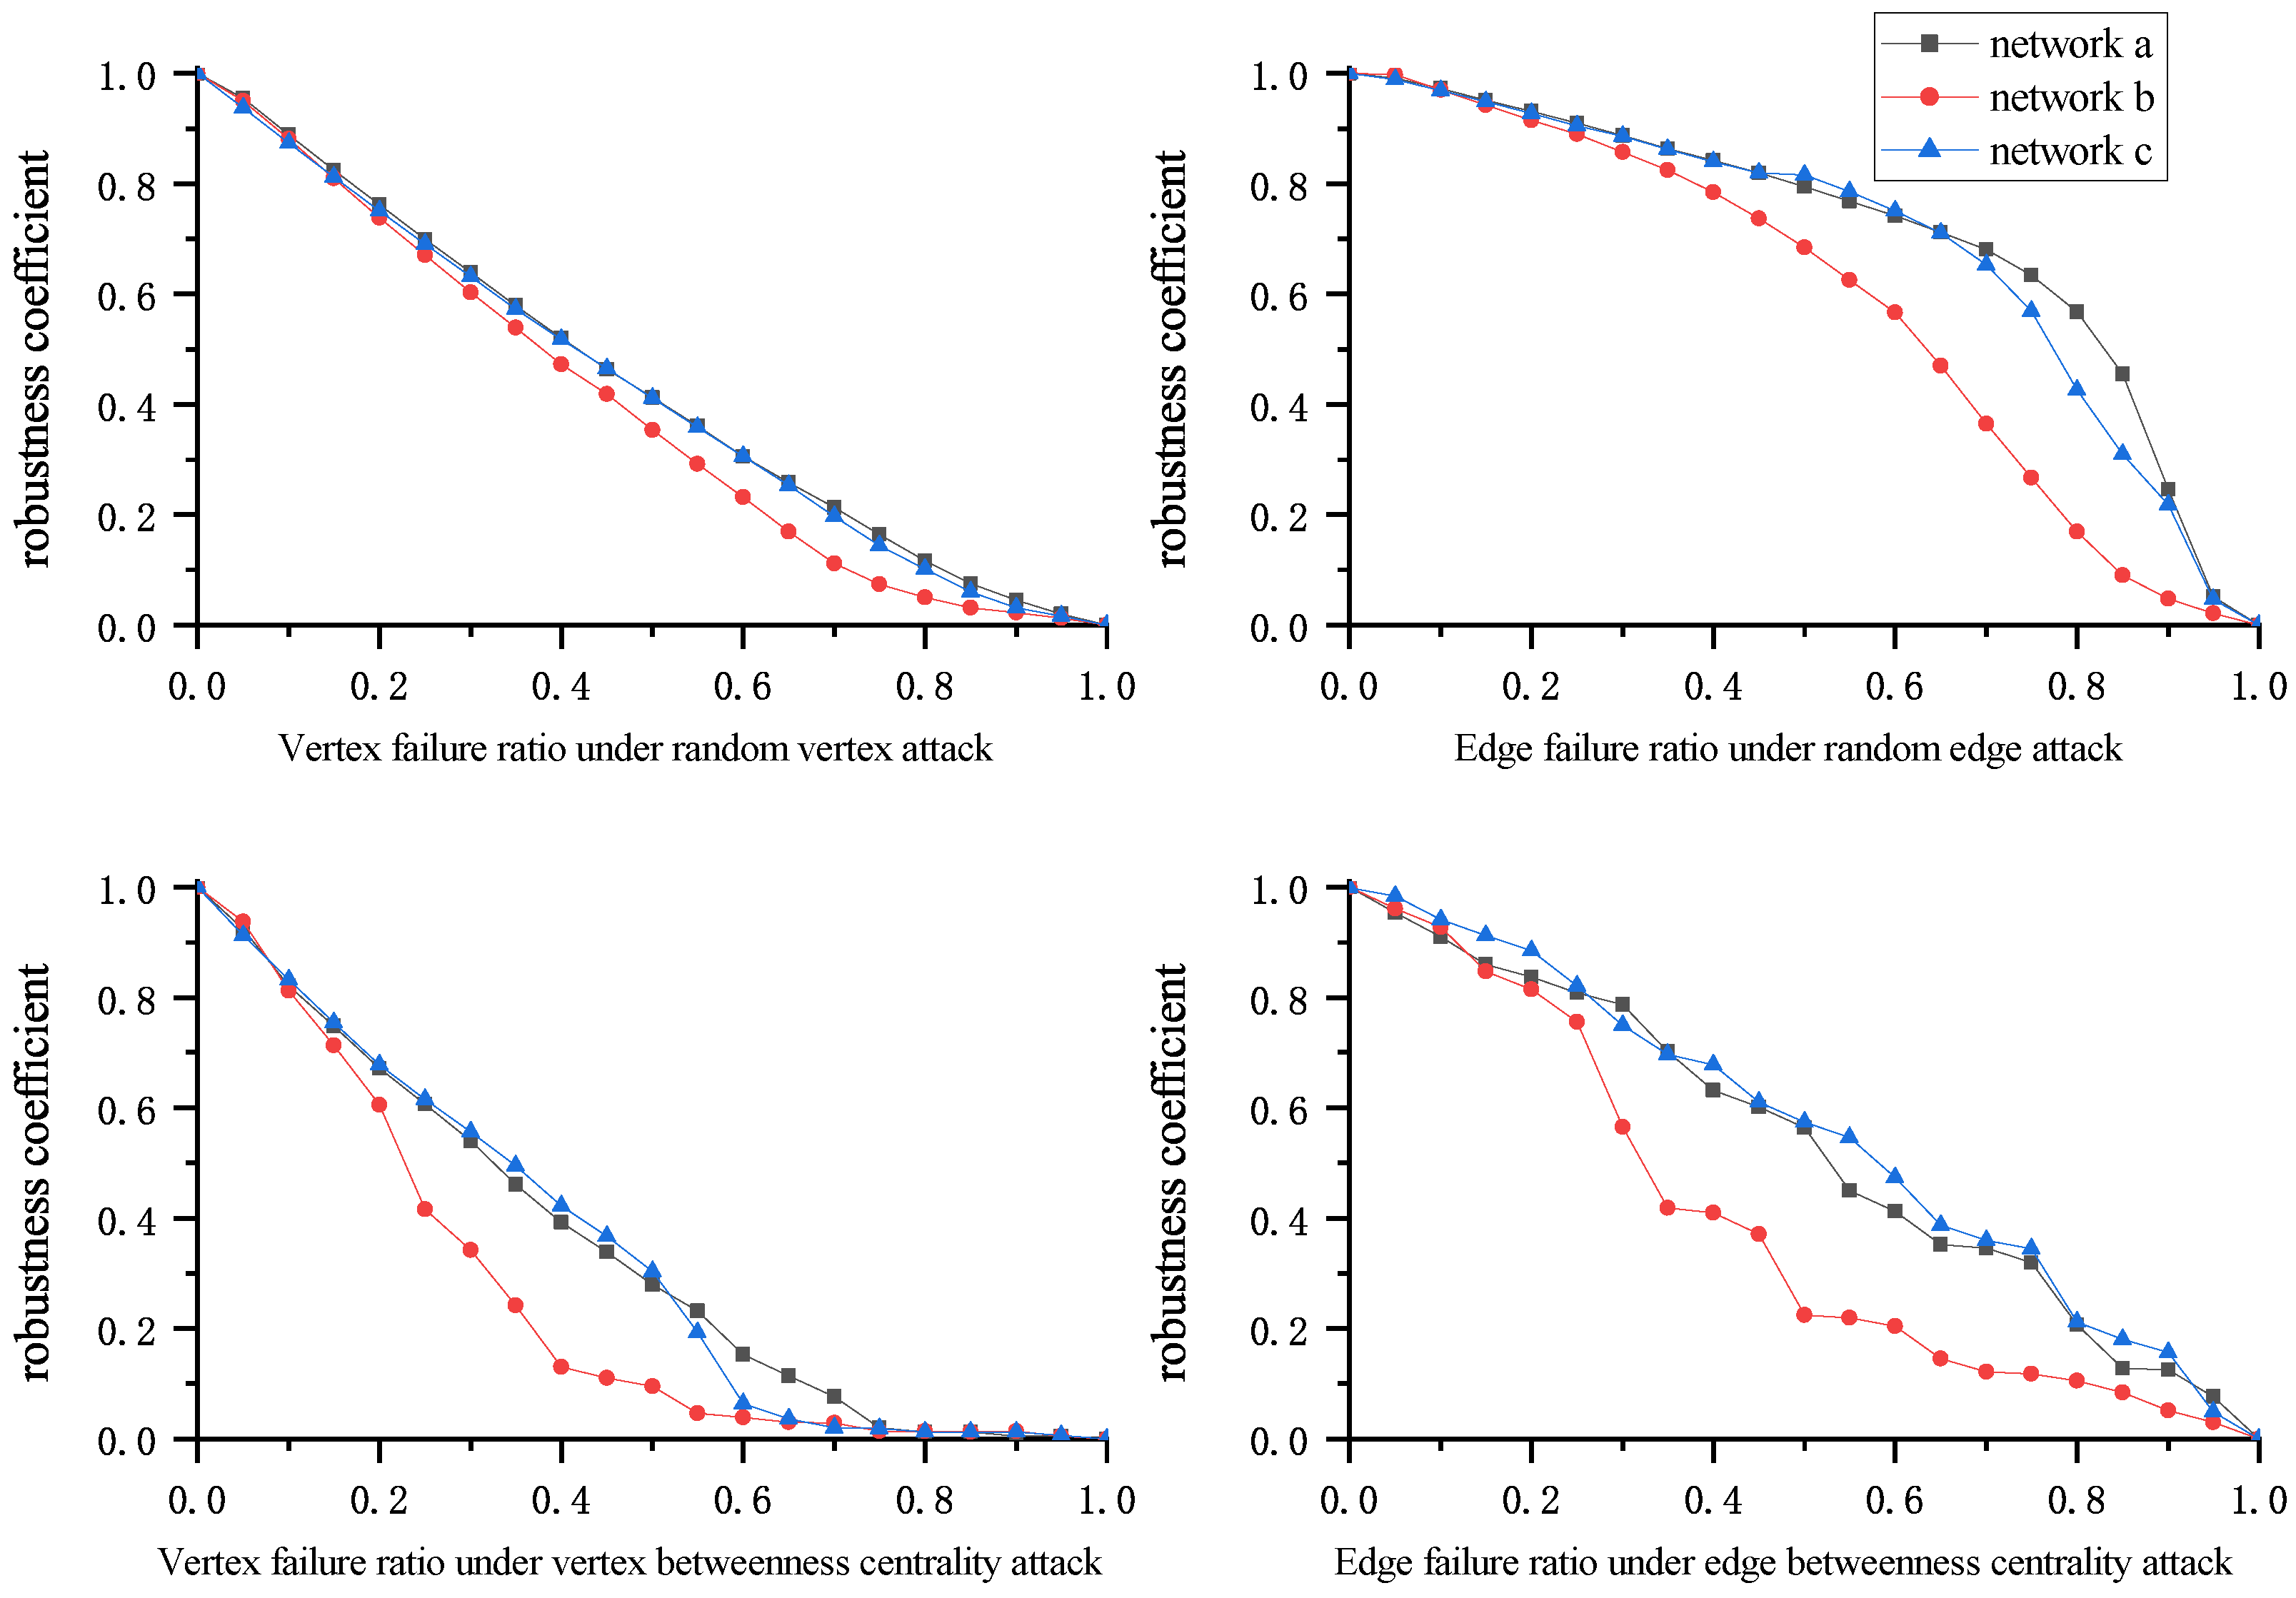
In Figure 5, the robustness coefficient intuitively expresses the overall network robustness under different attack strategies. Analysis of the robustness coefficients for the three networks shows that network robustness is greater under random attacks, especially random edge attacks. In the early and middle attack stages, little damage occurs to any network. Under random vertex attacks, the rate at which network robustness is degraded is higher than under random edge attacks, though the rate remains relatively gradual. However, network robustness decreases rapidly under deliberate attacks, rendering networks more vulnerable than under random attacks. Deliberate attacks exhibit greater global impact, are targeted more strategically, and disrupt networks faster than random attacks, conferring stronger attack capability. Furthermore, in both random and deliberate attacks, vertex attacks have greater destructive power than edge attacks; this is because the edges removed in edge attacks often have alternative paths for replacement, while vertex attacks eliminate both connected edges and alternative paths.
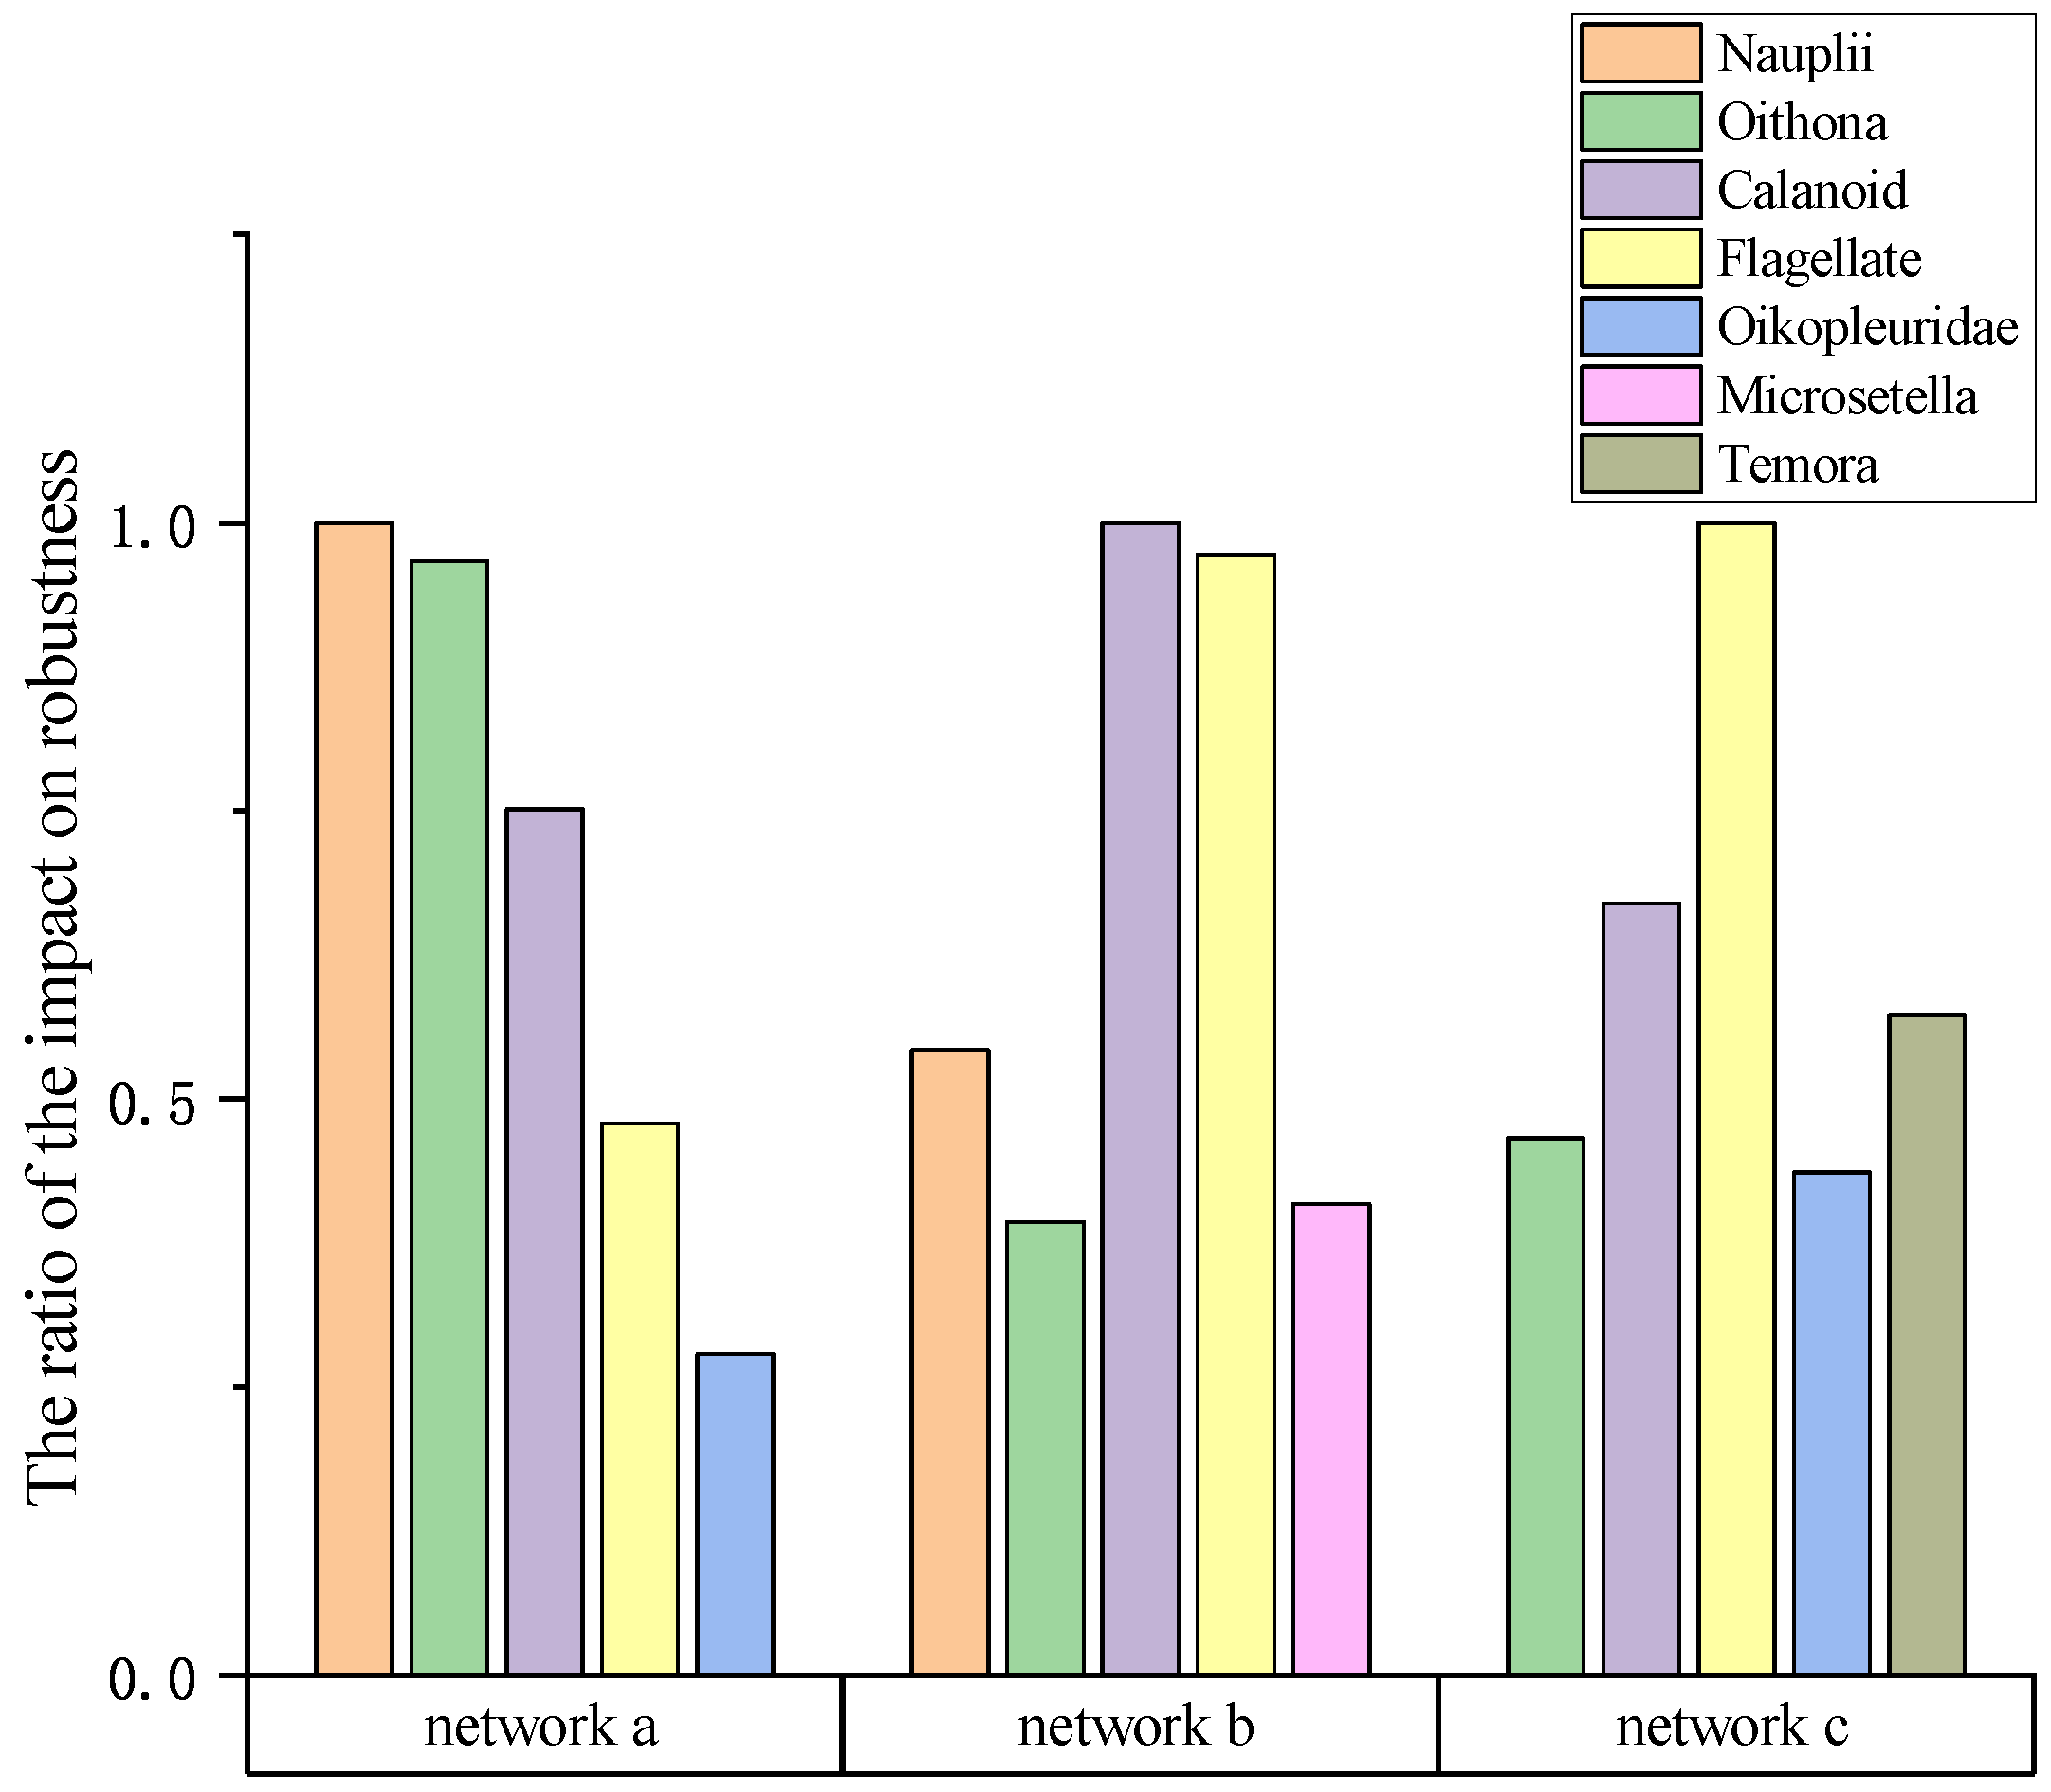
Finally, we specifically investigated the top five genera of planktonic organisms that exerted the most significant influence on robustness within each network, as visually represented in Figure 10. The outcomes of our analysis reveal noteworthy findings, as we observed crucial genera shared among the three networks that exhibited extensive interconnections. Additionally, we identified distinct variations between the networks, highlighting unique characteristics and dynamics. The findings of this study possess direct implications for advancing sustainable technological research, and can offer substantial assistance in this critical domain.
4. Discussion
This paper has applied complex network analysis to assess the robustness of marine plankton communities, providing insights relevant to sustainable environmental technology. Our findings reveal how different attack strategies impact network topology and performance. Several key points warrant further discussion.
4.1. Ecological Significance of the Results
The results preented in this paper demonstrate that plankton interaction networks exhibit varying robustness to disturbances. Identifying crucial hub genera and critical linkages can guide protection efforts for at-risk marine environments. However, connectivity alone does not determine robustness. Even highly interconnected networks such as community c proved vulnerable to targeted attacks on central vertices. This highlights the complex interplay of structure, dynamics, and perturbations in ecological network analysis.
4.2. Methodological Advantages
Network approaches offer distinct advantages over traditional techniques for studying community robustness. Representing communities as networks enables the modeling of component interdependencies. Dynamic simulations can assess responses to perturbations in a way that is impossible with static methods. Moreover, our proposed multi-indicator weighted evaluation provides a more nuanced appraisal of robustness than single metrics such as connectivity.
Comparing our network-based approach to existing plankton community robustness assessment methods reveals many advantages of our method. Specifically, our technique can be compared to the plankton population dynamics model developed by Cropp et al. [36]. The Cropp model uses a series of nonlinear equations to simulate fluctuations in plankton biomass under various environmental conditions. Compared to the Cropp model, our network approach has the following strengths:
- -
- It captures the intricate relationships between plankton types, rather than treating genera in isolation, helping to assess robustness at the ecosystem scale;
- -
- It can simulate community dynamics during response to perturbations through different attack strategies;
- -
- Its computational efficiency allows rapid investigation of multiple scenarios;
- -
- The proposed multi-metric evaluation enables more nuanced measurement of robustness;
- -
- Visual network representations provide intuitive understanding of topological vulnerabilities.
However, the Cropp model has more detailed biological characterizations of individual genera and their behaviors. Thus, the network technique offers higher-level robustness assessments that complement the individual-based modeling insights. In the future, an integrated framework combining both approaches may provide a more comprehensive perspective on plankton community resilience. While no single technique can provide all the answers, network analysis reveals community-scale phenomena that reductionist approaches cannot. Further synergistic application of systems and traditional methods can advance our understanding of these vital marine ecosystems.
In addition, we computed the standard deviation between the multi-metric weighted evaluation indicators we proposed and the single metrics, demonstrating that our multi-metric approach has better stability across the evaluation indicators compared to relying on any individual metric. A single metric may be susceptible to noise, and may fail to capture key aspects of ecosystem dynamics. In contrast, a composite indicator based on multiple metrics helps to smooth over variability in individual measurements and integrate diverse aspects of stability. The lower standard deviation that we obtained verifies that our multi-metric technique yields more consistent evaluations of plankton community robustness.
The calculated variation in the standard deviation for the evaluation indicators under the four attack strategies is shown Table 3. The standard deviation values in Table 3 show that the proposed multi-indicator weighting evaluation scheme, that is, the robustness coefficient, achieves more stable measurement than the other evaluation indicators under different attack strategies. The maximum standard deviation value is 0.33 and the minimum is 0.32, fluctuating by only about 3%, which is significantly less than the other evaluation indicators. In addition, the average standard deviation is the lowest among the different evaluation indicators.
Overall, based on the differences in the trend lines and standard deviations of the different indicators, the robustness coefficient proposed in this paper demonstrates better stability and reliability.
4.3. Limitations
While this study presents several valuable contributions, it has certain limitations that should be acknowledged.
First, while the plankton dataset encompasses a broad scope, it primarily considers the relationships between plankton, and does not include all relevant genera and species. In addition, it does not account for the influence of varying external biotic factors.
Second, the simulated attack experiments make a number of simplifying assumptions, and may not fully reflect real-world complexity.
In light of these limitations, the findings presented in this paper should be interpreted as indicative rather than definitive. Within this delimited scope, however, these findings make a valuable contribution that can inform future research. The complex systems approach holds significant potential advantages for elucidating ecosystem dynamics.
4.4. Future Research Directions
While the network modeling approach presented in this paper represents an important initial foray towards the application of complex systems techniques to elucidate plankton community stability, there remain ample opportunities to expand upon this foundation and augment the utility of these methods.
One potential area for future work is incorporating additional biological detail into the network construction process, for instance, by weighting edges based on the strength of trophic interactions or distinguishing between symbiotic and competitive relationships. This could reveal how network topology is related to underlying population dynamics.
More sophisticated simulation studies could be conducted as well, such as modeling cascading extinctions or evaluating different recovery and restoration interventions. Transitioning from descriptive robustness analyses to utilizing network models predictively is a critical next frontier.
By capitalizing on these future opportunities, network analysis of plankton communities can mature into an established methodology that provides critical support for evidence-based ocean management and sustainable environmental technologies. The present study provides a solid initial foundation to enable progress toward this goal.
5. Conclusions
This paper has demonstrated the application of complex network analysis to evaluate the robustness of marine plankton communities, providing a novel systems perspective relevant to sustainable environmental technology.
Our findings reveal that plankton interaction networks exhibit varying vulnerabilities to disturbances depending on topological structure. Random failures of vertices or links result in slower degradation than targeted attacks on central hubs. This highlights the need to identify and protect crucial species that sustain ecosystem connectivity. The proposed multi-indicator evaluation scheme enables more comprehensive robustness assessment than reliance on single metrics. By capturing multiple aspects of network performance, the proposed robustness coefficient offers a more nuanced and stable characterization. The presented network modeling approach enables plankton community dynamics to be studied under real-world disruption scenarios that are difficult to replicate experimentally. This approach contributes quantitative insights that can complement field studies, allowing for a more complete understanding.
While this work has limitations in terms of the dataset scope and model assumptions, it represents an important step in applying complex systems techniques to plankton ecology. Extensions could include incorporating broader biological data and environmental variables into network construction and analysis.
Overall, the present paper demonstrates the utility of network science for investigating plankton community robustness, and is relevant for conservation and sustainable resource management. Quantifying fragilities in this vital biome can help to guide wise interventions for better maintenance of marine ecosystem health.
Author Contributions
Conceptualization, D.Z.; Data curation, T.Z.; Formal analysis, T.C. and Q.H.; Investigation, D.H.; Methodology, D.Z. and T.Z.; Resources, T.C., Q.H. and D.H.; Software, T.Z.; Validation, T.C.; Writing—original draft, D.Z., T.C. and Q.H.; Writing—review and editing, D.Z., T.Z., T.C., Q.H. and D.H. All authors have read and agreed to the published version of the manuscript.
Funding
This research was funded by the National Key Research and Development Project of China (No. 2021YFC3101602) and the Young Scientists Fund of the National Natural Science Foundation of China (No. 42106190).
Institutional Review Board Statement
Not applicable.
Informed Consent Statement
Not applicable.
Data Availability Statement
Existing datasets are available in a publicly accessible repository. Publicly available datasets were analyzed in this study. Data were sourced from Australia’s Integrated Marine Observing System (IMOS). IMOS is enabled by the National Collaborative Research Infrastructure strategy (NCRIS) operated by a consortium of institutions as an unincorporated joint venture, with the University of Tasmania as Lead Agent. These data can be found at: https://portal.aodn.org.au/search (accessed on 26 July 2023).
Conflicts of Interest
The authors declare no conflict of interest.
References
- Paerl, H.W. Marine Plankton; Springer: Dordrecht, The Netherlands, 2012; pp. 127–153. [Google Scholar] [CrossRef]
- Brierley, A.S. Plankton. Curr. Biol. 2017, 27, R478–R483. [Google Scholar] [CrossRef]
- Araujo, G.S.; Pacheco, D.; Cotas, J.; da Silva, J.W.A.; Saboya, J.; Moreira, R.T.; Pereira, L. Plankton: Environmental and Economic Importance for a Sustainable Future; IntechOpen: London, UK, 2022. [Google Scholar]
- Falkowski, P. Ocean Science: The power of plankton. Nature 2012, 483, S17–S20. [Google Scholar] [CrossRef] [PubMed]
- Pierella Karlusich, J.J.; Ibarbalz, F.M.; Bowler, C. Phytoplankton in the Tara Ocean. Ann. Rev. Mar. Sci. 2020, 12, 233–265. [Google Scholar] [CrossRef] [PubMed] [Green Version]
- Gökçe, A.; Yazar, S.; Sekerci, Y. Stability of spatial patterns in a diffusive oxygen–plankton model with time lag effect. Math. Comput. Simul. 2022, 194, 109–123. [Google Scholar] [CrossRef]
- Vallina, S.M.; Cermeno, P.; Dutkiewicz, S.; Loreau, M.; Montoya, J.M. Phytoplankton functional diversity increases ecosystem productivity and stability. Ecol. Model. 2017, 361, 184–196. [Google Scholar] [CrossRef]
- Thakur, N.K.; Ojha, A.; Tiwari, P.K.; Upadhyay, R.K. An investigation of delay induced stability transition in nutrient-plankton systems. Chaos Solitons Fractals 2021, 142, 110474. [Google Scholar] [CrossRef]
- Morozov, A.; Arashkevich, E.; Nikishina, A.; Solovyev, K. Nutrient-rich plankton communities stabilized via predator—Prey interactions: Revisiting the role of vertical heterogeneity. Math. Med. Biol. 2011, 28, 185–215. [Google Scholar] [CrossRef]
- Albert, R.; Barabási, A.L. Statistical mechanics of complex networks. Rev. Mod. Phys. 2002, 74, 47. [Google Scholar] [CrossRef] [Green Version]
- Albert, R.; Jeong, H.; Barabási, A.L. Error and attack tolerance of complex networks. Nature 2000, 406, 378–382. [Google Scholar] [CrossRef] [Green Version]
- Ellens, W.; Kooij, R.E. Graph measures and network robustness. arXiv 2013, arXiv:1311.5064. [Google Scholar]
- Bascompte, J. Disentangling the web of life. Science 2009, 325, 416–419. [Google Scholar] [CrossRef] [Green Version]
- Dunne, J.; Williams, R.; Martinez, N. Network structure and biodiversity loss in food webs: Robustness increases with connectance. Ecol. Lett. 2002, 5, 558–567. [Google Scholar] [CrossRef] [Green Version]
- Faust, K.; Raes, J. Microbial interactions: From networks to models. Nat. Rev. Microbiol. 2012, 10, 538–550. [Google Scholar] [CrossRef] [PubMed]
- Tylianakis, J.; Laliberte, E.; Nielsen, A.; Bascompte, J. Conservation of species interaction networks. Biol. Conserv. 2010, 143, 2270–2279. [Google Scholar] [CrossRef]
- Whitacre, J.M. Biological robustness: Paradigms, mechanisms, and systems principles. Front. Genet. 2012, 3, 67. [Google Scholar] [CrossRef] [Green Version]
- Kitano, H. Biological robustness. Nat. Rev. Genet. 2004, 5, 826–837. [Google Scholar] [CrossRef]
- Parrend, P.; Collet, P. A Review on Complex System Engineering. J. Syst. Sci. Complex. 2020, 33, 1755–1784. [Google Scholar] [CrossRef]
- Wang, H.; Huang, J.; Xu, X.; Xiao, Y. Damage attack on complex networks. Phys. A 2014, 408, 134–148. [Google Scholar] [CrossRef]
- Shang, Y. Subgraph robustness of complex networks under attacks. IEEE Trans. Syst. Man. Cybern. Syst. 2017, 49, 821–832. [Google Scholar] [CrossRef]
- Zhou, M.; Liu, J. A memetic algorithm for enhancing the robustness of scale-free networks against malicious attacks. Phys. A 2014, 410, 131–143. [Google Scholar] [CrossRef]
- Béthoux, J.P.; Morin, P.; Ruiz-Pino, D.P. Temporal trends in nutrient ratios: Chemical evidence of Mediterranean ecosystem changes driven by human activity. Deep. Sea Res. Part II Top. Stud. Oceanogr. 2002, 49, 2007–2016. [Google Scholar] [CrossRef]
- Jiang, Z.; Huang, Y.; Xu, X.; Liao, Y.; Shou, L.; Liu, J.; Chen, Q.; Zeng, J. Advance in the toxic effects of petroleum water accommodated fraction on marine plankton. Acta Ecol. Sin. 2010, 30, 8–15. [Google Scholar] [CrossRef]
- Crucitti, P.; Latora, V.; Marchiori, M.; Rapisarda, A. Error and attack tolerance of evolving networks with local preferential attachment. Phys. A Stat. Mech. Its Appl. 2004, 340, 388–394. [Google Scholar] [CrossRef] [Green Version]
- Borgatti, S.P. Centrality and network flow. Soc. Netw. 2005, 27, 55–71. [Google Scholar] [CrossRef]
- Jackson, J.M.; Lenz, P.H. Predator-prey interactions in the plankton: Larval fish feeding on evasive copepods. Sci. Rep. 2016, 6, 33585. [Google Scholar] [CrossRef] [Green Version]
- Francis, T.B.; Wolkovich, E.M.; Scheuerell, M.D.; Katz, S.L.; Holmes, E.E.; Hampton, S.E. Shifting regimes and changing interactions in the Lake Washington, USA, plankton community from 1962–1994. PLoS ONE 2014, 9, e110363. [Google Scholar] [CrossRef]
- Lewis, D.; Bala, S. Plankton predation rates in turbulence: A study of the limitations imposed on a predator with a non-spherical field of sensory perception. J. Theor. Biol. 2006, 242, 44–61. [Google Scholar] [CrossRef]
- Frank, H.; Frisch, I. Analysis and design of survivable networks. IEEE Trans. Commun. Technol. 1970, 18, 501–519. [Google Scholar] [CrossRef]
- Boesch, F.; Frisch, I. On the Smallest Disconnecting Set in a Graph. IEEE Trans. Circuit Theory 1968, 15, 286–288. [Google Scholar] [CrossRef]
- Gazit, H. An optimal randomized parallel algorithm for finding connected components in a graph. SIAM J. Comput. 1991, 20, 1046–1067. [Google Scholar] [CrossRef]
- Zhang, J.l.; Fu, Y.j.; Cheng, L.; Yang, Y.y. Identifying multiple influential spreaders based on maximum connected component decomposition method. Phys. A 2021, 571, 125791. [Google Scholar] [CrossRef]
- Latora, V.; Marchiori, M. Efficient behavior of small-world networks. Phys. Rev. Lett. 2001, 87, 198701. [Google Scholar] [CrossRef] [PubMed] [Green Version]
- Tran, V.H.; Cheong, S.A.; Bui, N.D. Complex Network Analysis of the Robustness of the Hanoi, Vietnam Bus Network. J. Syst. Sci. Complex. 2019, 32, 1251–1263. [Google Scholar] [CrossRef]
- Cropp, R.; Norbury, J. Parameterizing plankton functional type models: Insights from a dynamical systems perspective. J. Plankton Res. 2009, 31, 939–963. [Google Scholar] [CrossRef] [Green Version]
Figure 1.
The approach to robustness analysis described in this paper consists of three essential components. First, the construction of a complex network relies on derived edge relationships. Second, attack strategies include two types of attacks, namely, random and deliberate. Finally, a robustness assessment scheme is derived from multi-indicator weighting.

Figure 2.
The correlation matrix of community a and its network a constructed based on the matrix; in the correlation matrix, the colors represent the strength of correlation, with * indicating . In the network, the colors represent the tightness of connections, with red vertices having tighter connections than blue vertices.

Figure 3.
The correlation matrix of community b and the network b constructed based on the matrix.

Figure 4.
The correlation matrix of community c and the network c constructed based on the matrix.

Figure 5.
Changes in the robustness coefficient under different attack strategies.

Figure 6.
Changes in indicators under random vertex attack.

Figure 7.
Changes in indicators under random edge attack.

Figure 8.
Changes in indicators under vertex betweenness centrality attack.

Figure 9.
Change in indicators under edge betweenness centrality attack.

Figure 10.
The top five genera of planktonic organisms with significant impacts on network robustness.
Figure 10.
The top five genera of planktonic organisms with significant impacts on network robustness.


Table 1.
Statistical data on each plankton community.
| Plankton Community ID | Number of the Genus | Average Biomass (mg/m3) |
|---|---|---|
| a | 62 | 29,872.03 |
| b | 62 | 12,055.91 |
| c | 63 | 76,150.55 |
Table 2.
Characteristics indicators of the network.
| Network ID | Number of Vertices | Number of Edges | Average Path Length | Average Degree | Network Diameter |
|---|---|---|---|---|---|
| a | 62 | 388 | 12.52 | 2.05 | 4 |
| b | 62 | 172 | 5.55 | 2.93 | 5 |
| c | 63 | 333 | 10.57 | 2.15 | 4 |
Table 3.
Comparison of the standard deviation of the evaluation indicators under different attack strategies.
Table 3.
Comparison of the standard deviation of the evaluation indicators under different attack strategies.
| Name | Average Vertex Connectivity | Maximum Connected Component | Network Efficiency | Robustness Coefficient (Ours) |
|---|---|---|---|---|
| Random vertex attack | 0.33 | 0.33 | 0.33 | 0.33 |
| Random edge attack | 0.34 | 0.30 | 0.35 | 0.32 |
| Vertex betweenness centrality attack | 0.33 | 0.36 | 0.34 | 0.33 |
| Edge betweenness centrality attack | 0.34 | 0.31 | 0.35 | 0.32 |
| Mean standard deviation | 0.335 | 0.325 | 0.343 | 0.325 |
Disclaimer/Publisher’s Note: The statements, opinions and data contained in all publications are solely those of the individual author(s) and contributor(s) and not of MDPI and/or the editor(s). MDPI and/or the editor(s) disclaim responsibility for any injury to people or property resulting from any ideas, methods, instructions or products referred to in the content. |
© 2023 by the authors. Licensee MDPI, Basel, Switzerland. This article is an open access article distributed under the terms and conditions of the Creative Commons Attribution (CC BY) license (https://creativecommons.org/licenses/by/4.0/).
Share and Cite
MDPI and ACS Style
Zhao, D.; Zhang, T.; Chen, T.; He, Q.; Huang, D. Multi-Indicator Weighted Robustness Analysis of Planktonic Community Systems under Different Destructive Factors. Appl. Sci. 2023, 13, 8742. https://doi.org/10.3390/app13158742
AMA Style
Zhao D, Zhang T, Chen T, He Q, Huang D. Multi-Indicator Weighted Robustness Analysis of Planktonic Community Systems under Different Destructive Factors. Applied Sciences. 2023; 13(15):8742. https://doi.org/10.3390/app13158742
Chicago/Turabian StyleZhao, Danfeng, Tao Zhang, Tianwen Chen, Qi He, and Dongmei Huang. 2023. "Multi-Indicator Weighted Robustness Analysis of Planktonic Community Systems under Different Destructive Factors" Applied Sciences 13, no. 15: 8742. https://doi.org/10.3390/app13158742
Note that from the first issue of 2016, this journal uses article numbers instead of page numbers. See further details here.