
Comparison of Sports Performance and Kinanthropometric Profiles of Elite Female Basketball and Volleyball Players over the Course of a Competitive Season


Abstract
:1. Introduction
2. Materials and Methods
2.1. Participants
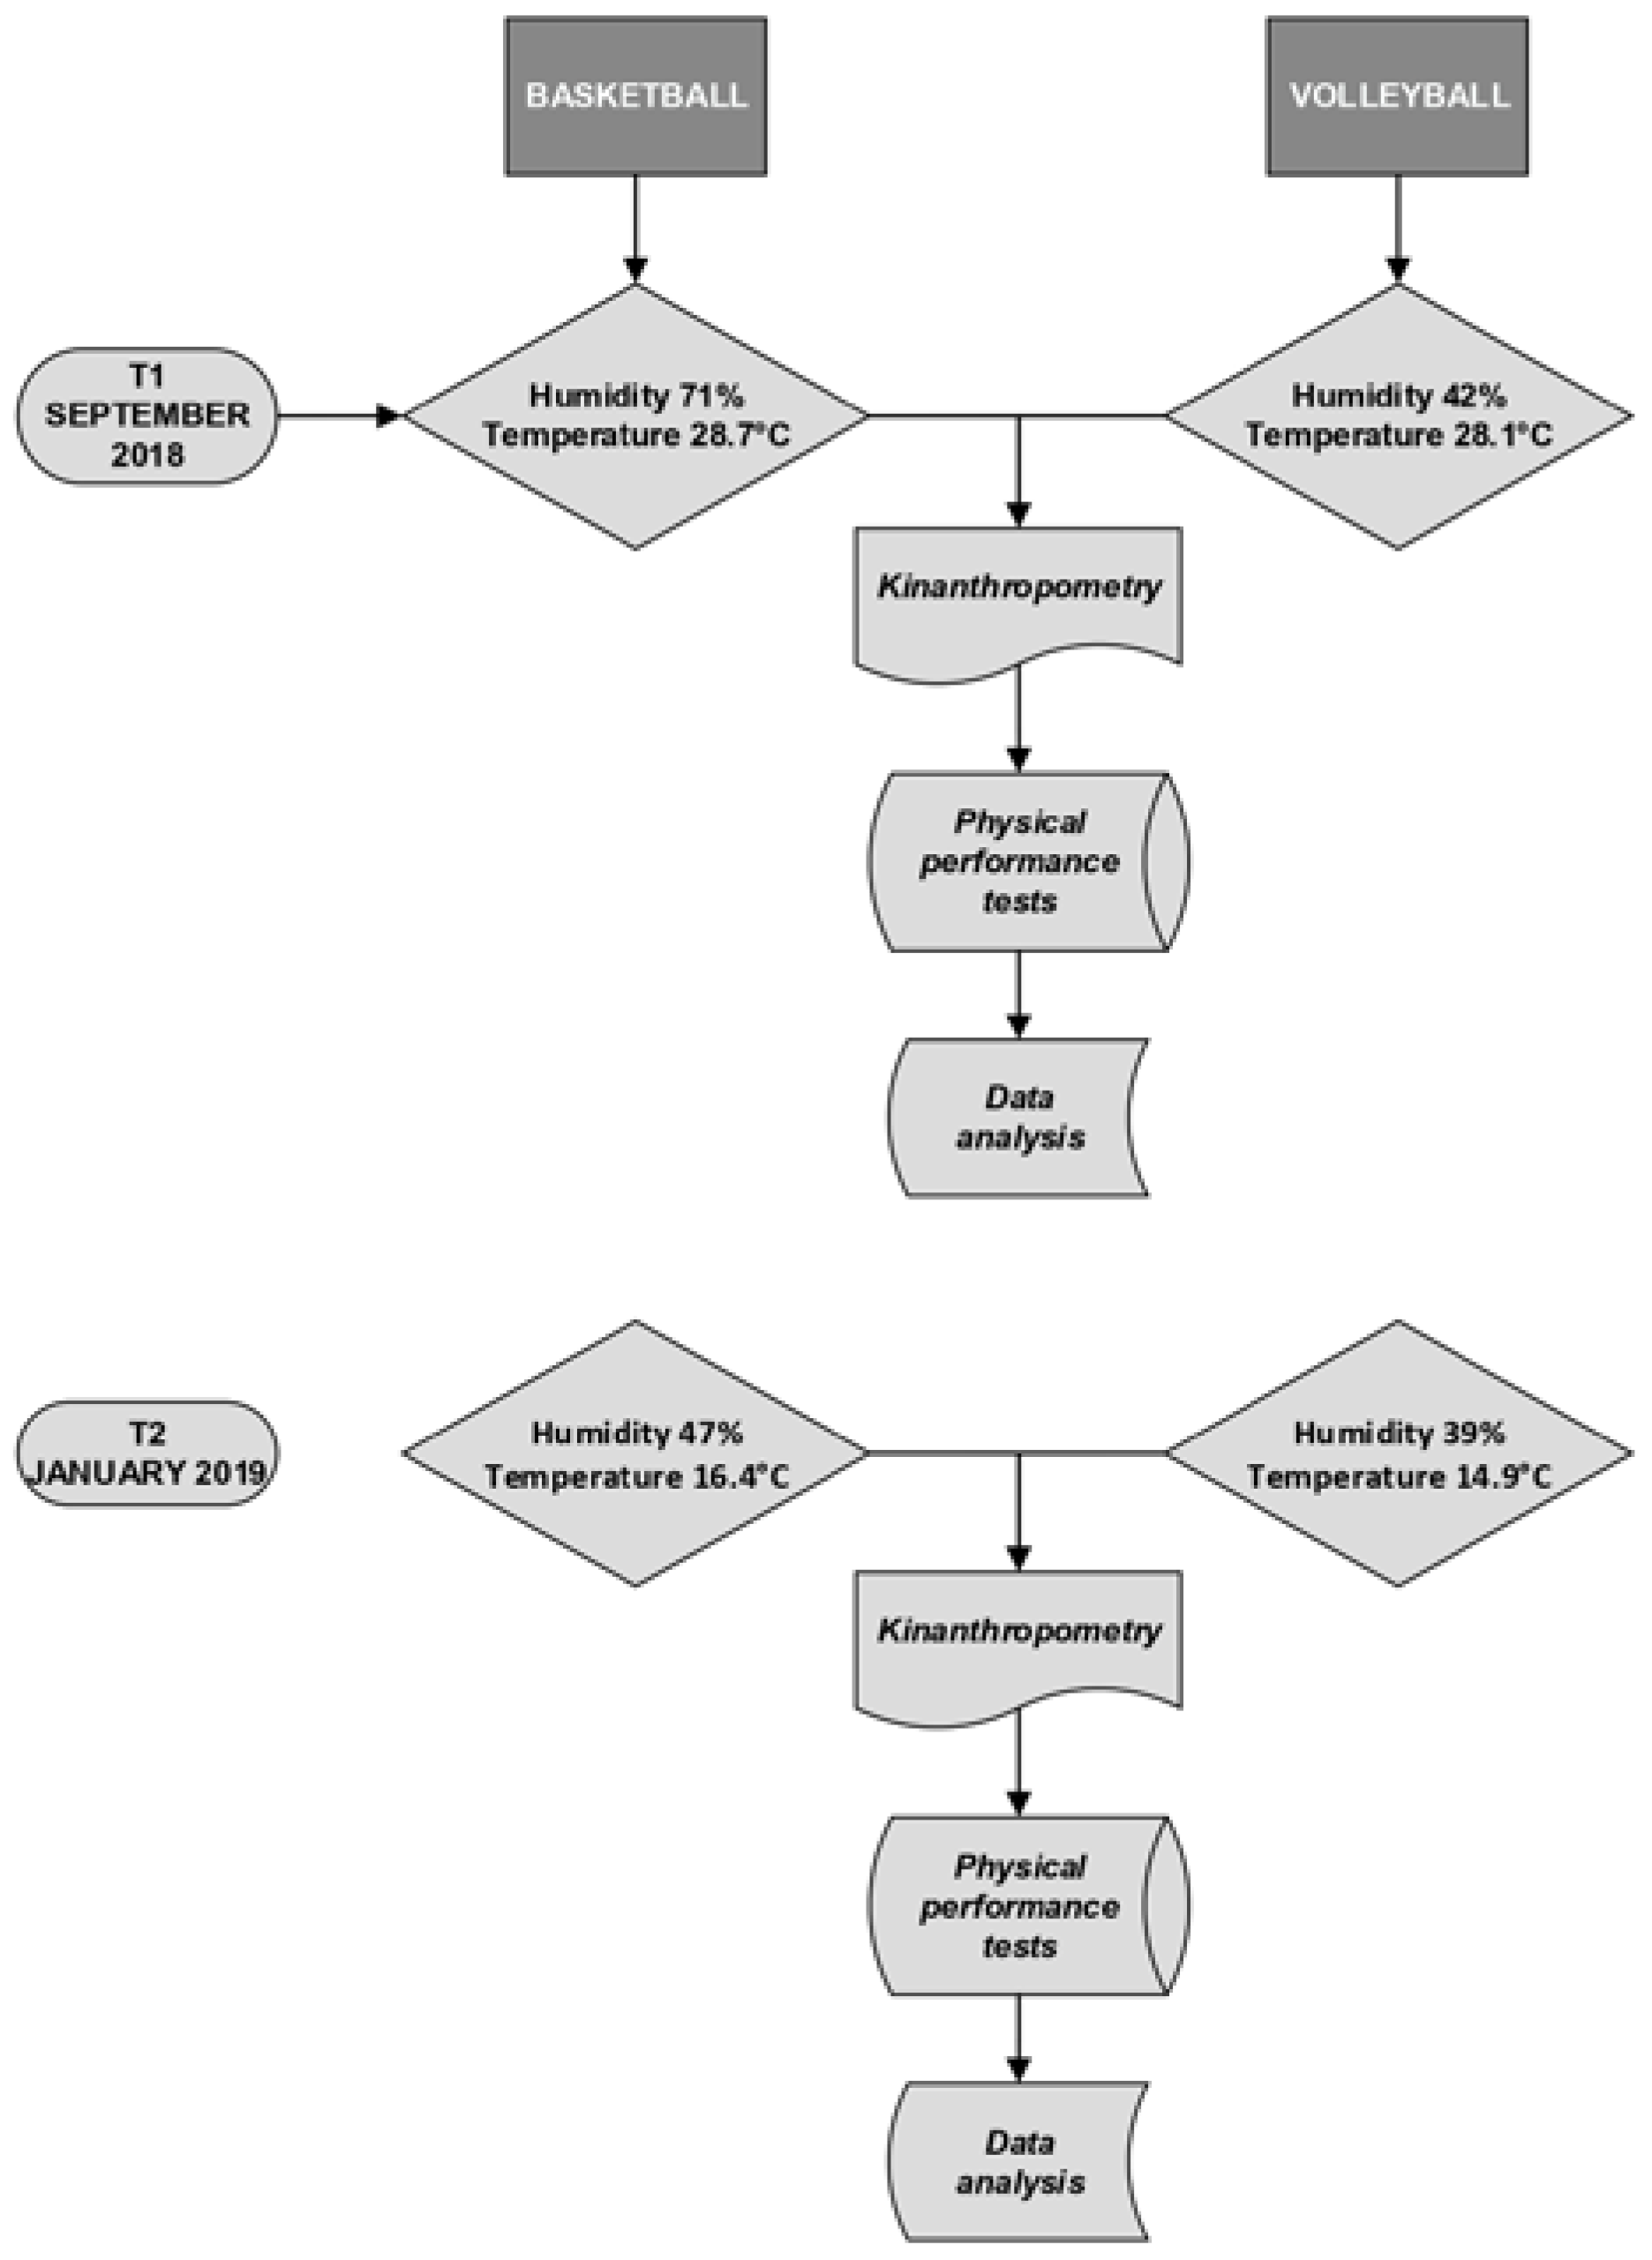
2.2. Experimental Design of the Problem
2.3. Experimental Protocol and Evaluation Plan
- a.
- Kinanthropometry
- (a)
- Body mass: a standardized method was used and was performed with a SECA scale (SECA®, Hamburg, Germany) with an ac-precision of 100 g.
- (b)
- Height was obtained using a Holtain measuring rod (Holtain® Ltd., Dyfed, UK) according to the standard procedure.
- (c)
- Skinfolds: were measured in triplicate using a Harpenden plicometer®. The sum of 8 skinfolds (mm) was calculated (biceps, triceps, subscapular, iliac creta, supraspinal, abdominal, front thigh, and calf).
- (d)
- Bone diameters and muscle perimeters: diameters (cm) (humerusbiepicondileus, femur biepicondileus, and biostyloid) and perimeters (cm) (relaxed arm, contracted arm, forearm, wrist, thorax, waist, hip, thigh, calf, ankle, and mid-thigh) were measured with a Lufkin® metal tape measure.
- b.
- Warm-up
- c.
- Physical performance tests
- d.
- Data analysis
- e.
- Statistical analysis
3. Results
Physical Performance Tests
4. Discussion
5. Conclusions
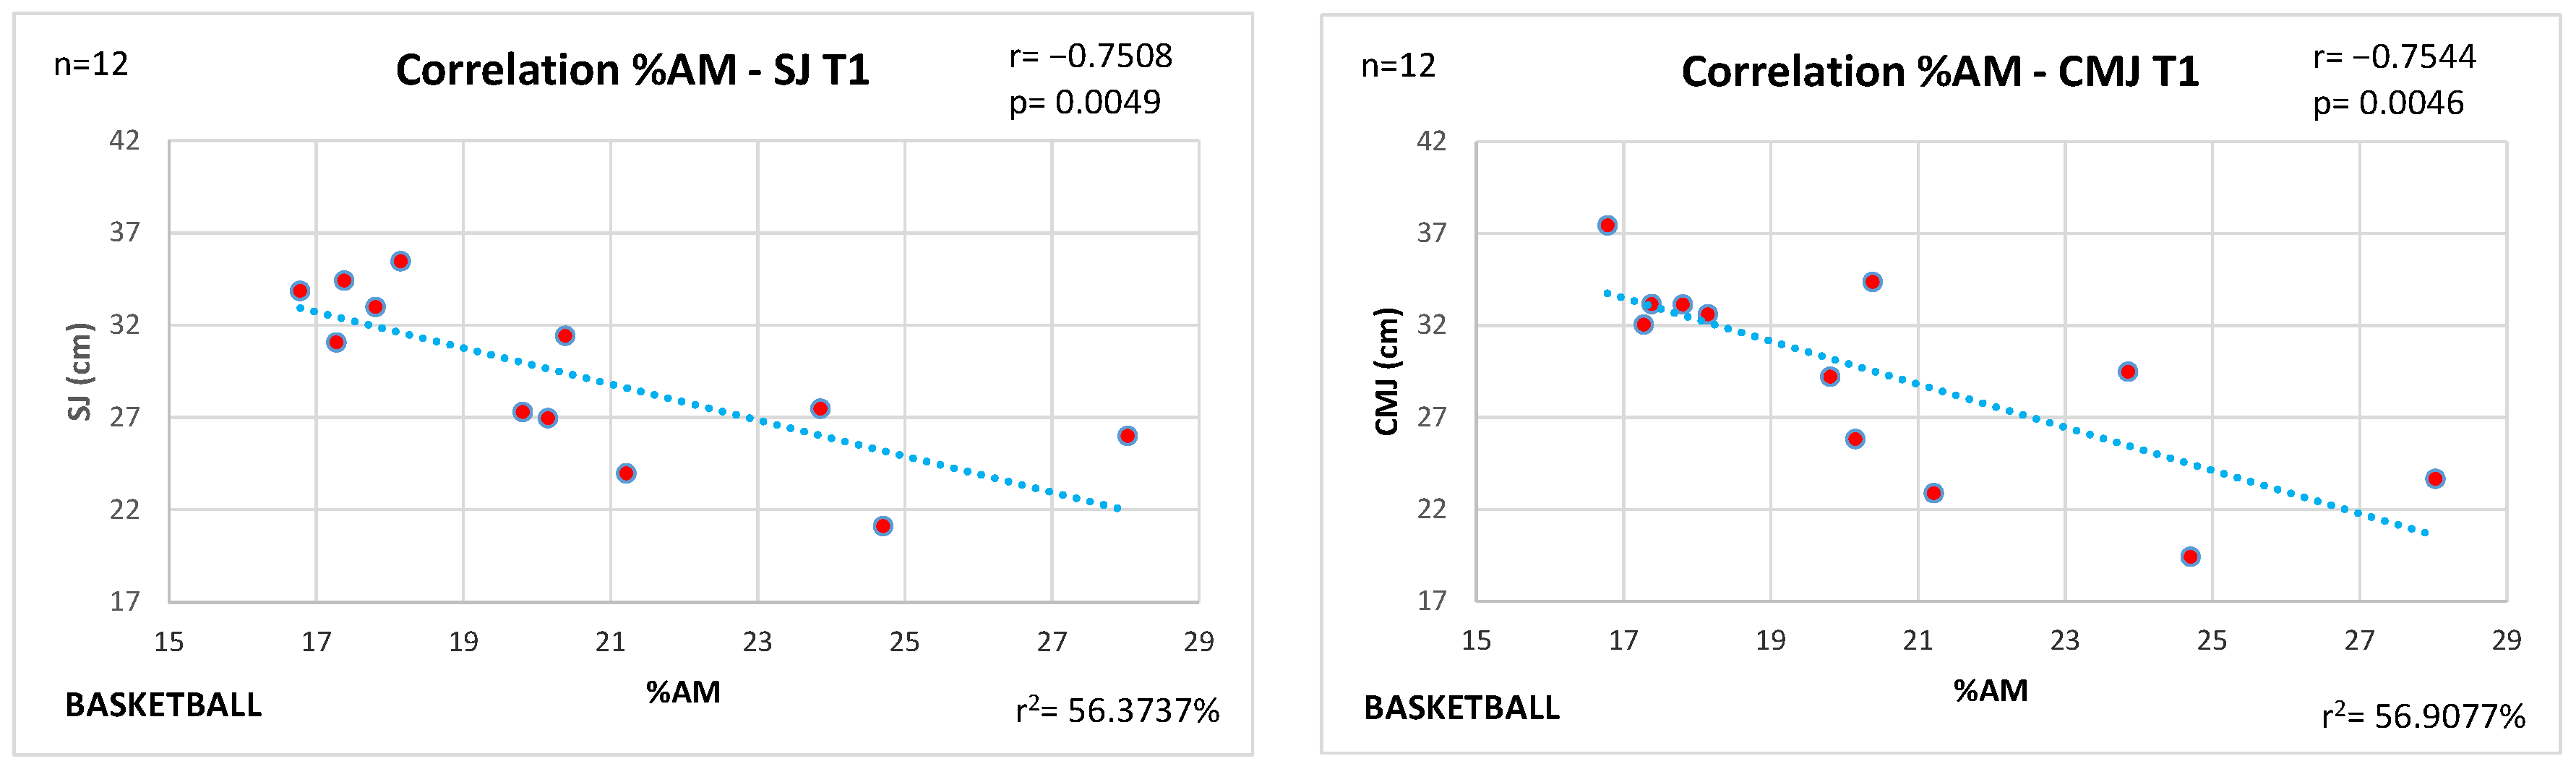
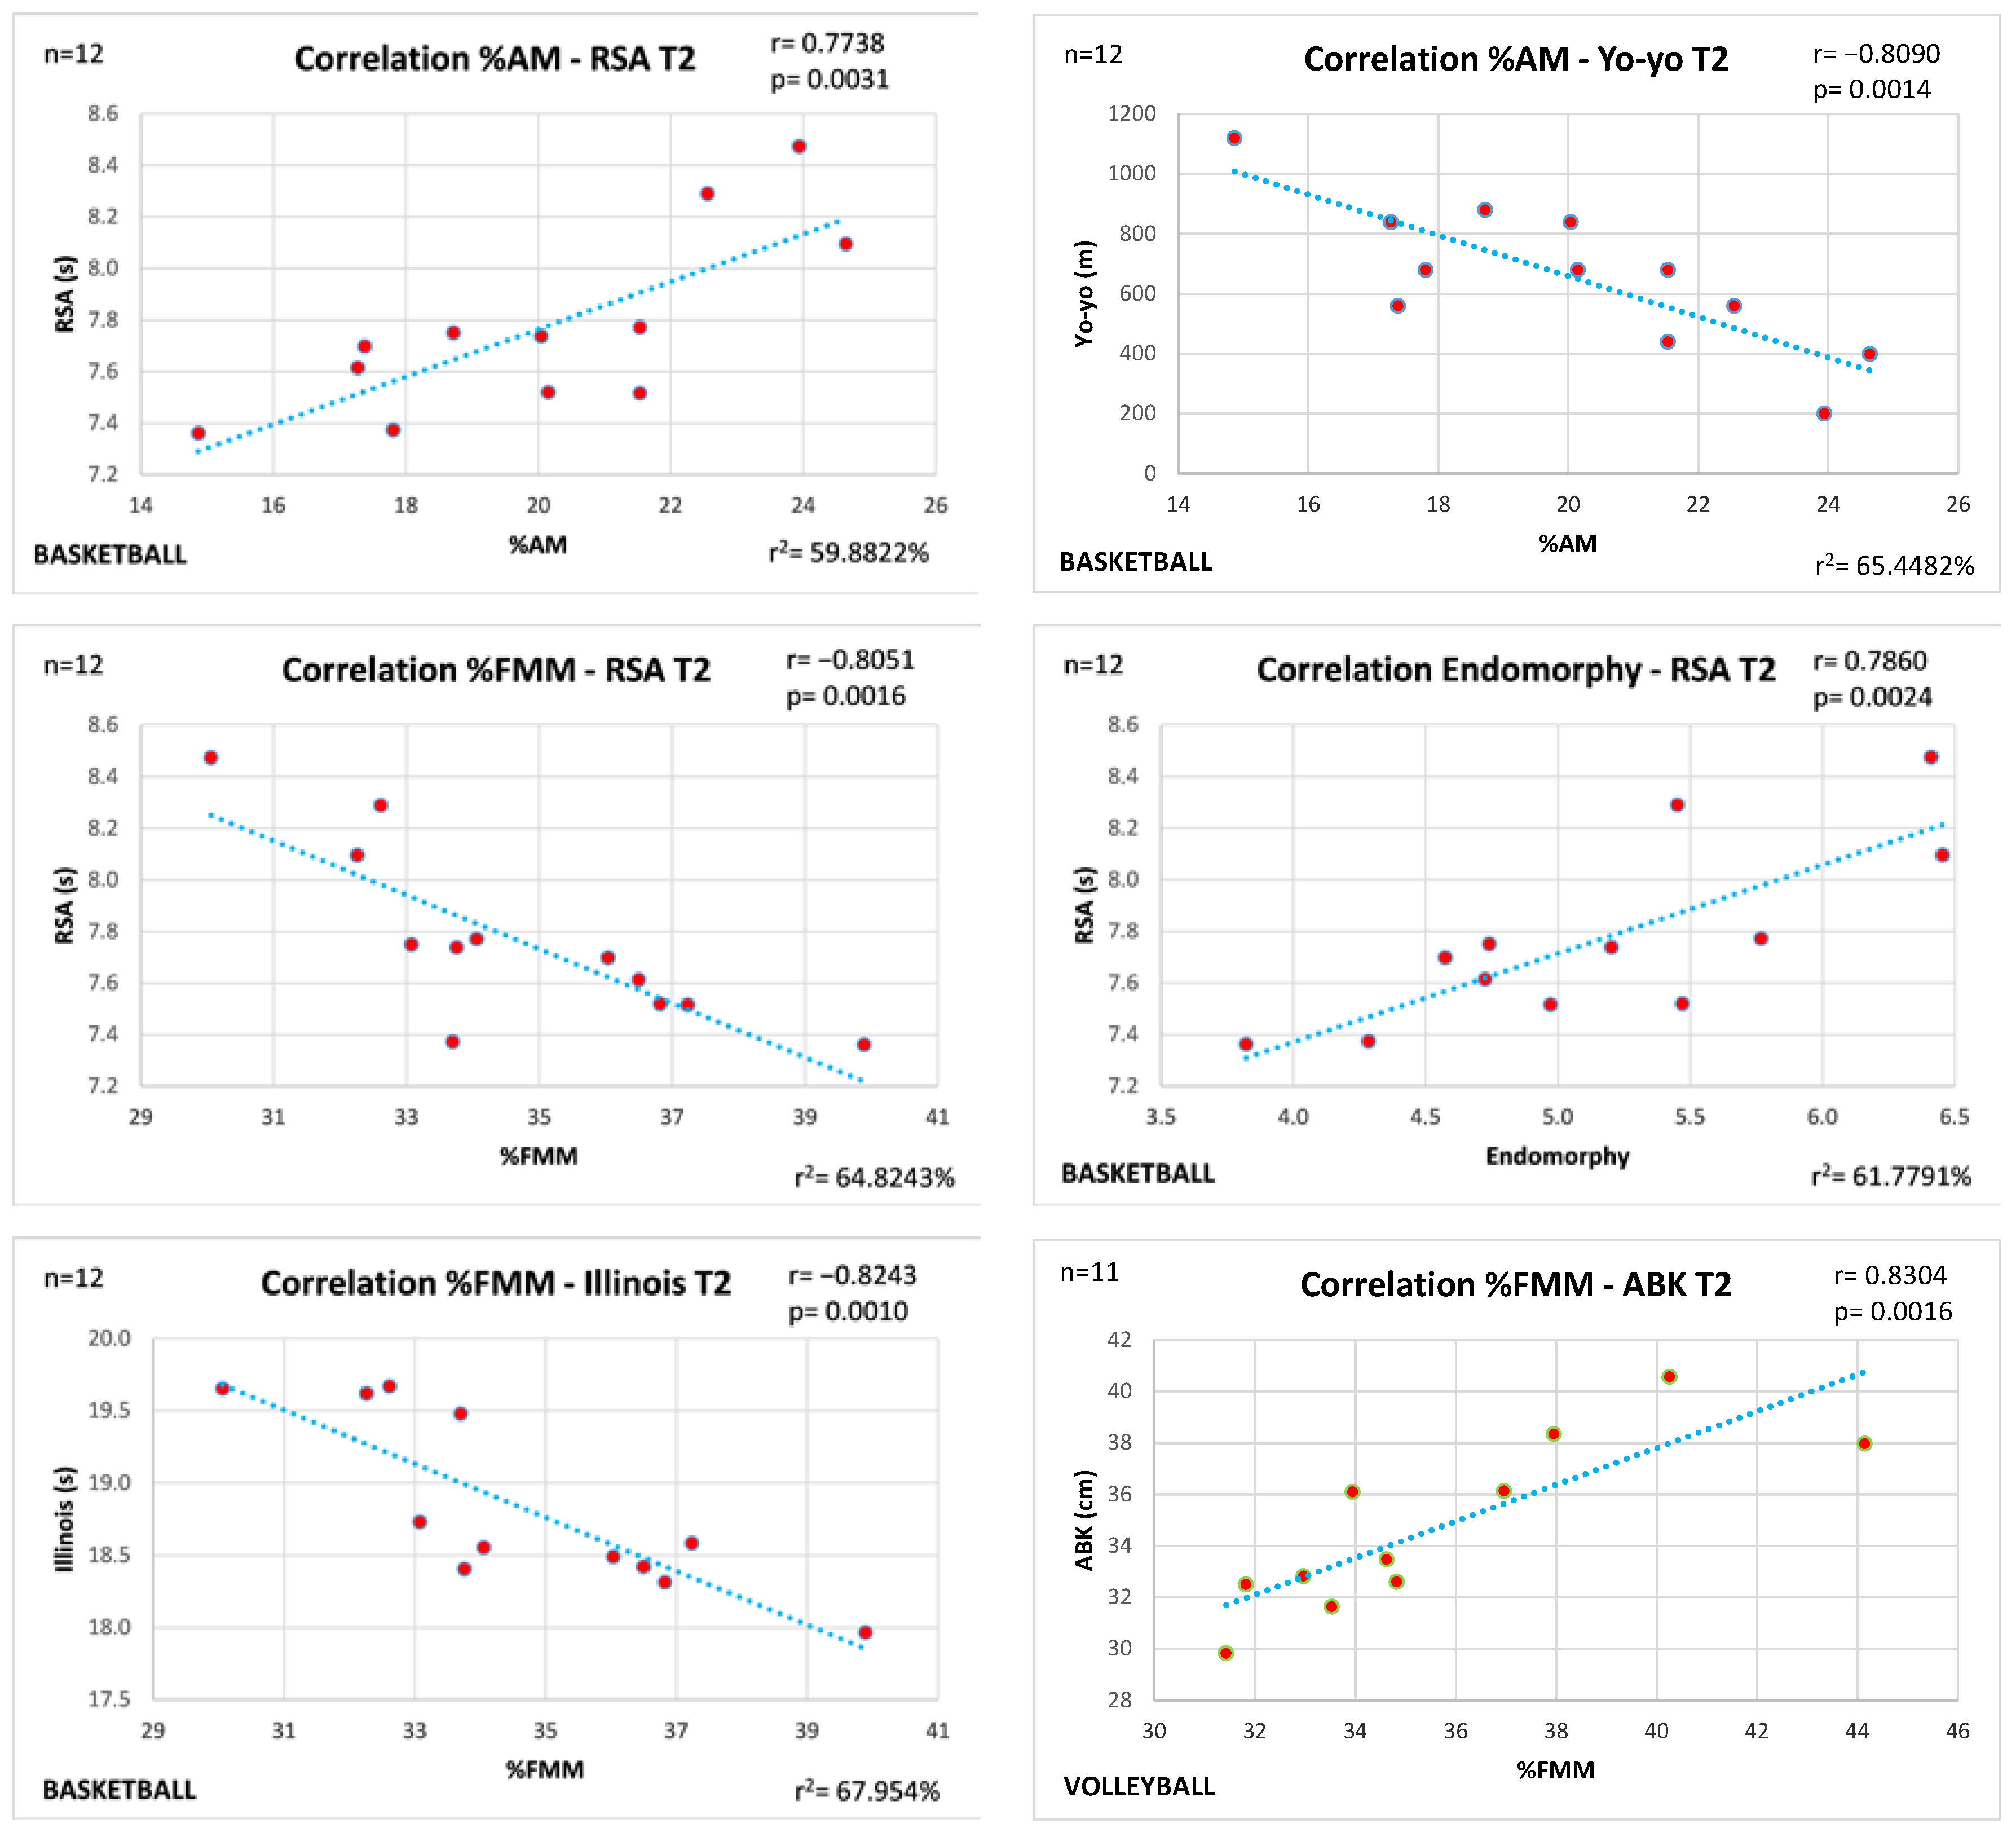
- The percentage of fat-free mass correlated with improvements in lower body strength applied in endurance exercises, with the ability to repeat sprints, and with the ability to perform some of the types of jumping involved in these sports disciplines.
- Lean body mass is an important predictor of strength for athletic performance.
- Excess fat mass is detrimental to strength, and especially to lower extremity performance and endurance.
- Tests directly related to the specific technical gesture and to the sport competition in question have been improved (jumps with previous eccentric phase and improved recovery from high-intensity intermittent efforts).
- Thus, it has been shown how, in those players with a higher % fat, the results in the tests are substantially lower, as can be seen in the tests involving aerobic power (yo-yo test) and lower body power.
- Dietary and nutritional management of athletes aimed at reducing fat mass and increasing fat-free mass can help improve strength development with consequent improvements in health and performance.
Author Contributions
Funding
Institutional Review Board Statement
Informed Consent Statement
Data Availability Statement
Conflicts of Interest
References
- Schons, P.; Da Rosa, R.G.; Fischer, G.; Berriel, G.P.; Fritsch, C.G.; Nakamura, F.Y.; Baroni, B.M.; Peyré-Tartaruga, L.A. The Relationship between Strength Asymmetries and Jumping Performance in Professional Volleyball Players. Sport. Biomech. 2019, 18, 515–526. [Google Scholar] [CrossRef]
- Mancha-Triguero, D.; García-Rubio, J.; Calleja-González, J.; Ibáñez, S.J. Physical Fitness in Basketball Players: A Systematic Review. J. Sports Med. Phys. Fitness 2019, 59, 1513–1525. [Google Scholar] [CrossRef]
- Silva, A.F.; Clemente, F.M.; Lima, R.; Nikolaidis, P.T.; Rosemann, T.; Knechtle, B. The Effect of Plyometric Training in Volleyball Players: A Systematic Review. Int. J. Environ. Res. Public Health 2019, 16, 2960. [Google Scholar] [CrossRef] [Green Version]
- Pereira, A.; Costa, A.M.; Santos, P.; Figueiredo, T.; João, P.V. Training Strategy of Explosive Strength in Young Female Volleyball Players. Medicina 2015, 51, 126–131. [Google Scholar] [CrossRef]
- Ciacci, S.; Bartolomei, S. The Effects of Two Different Explosive Strength Training Programs on Vertical Jump Performance in Basketball. J. Sports Med. Phys. Fitness 2018, 58, 1375–1382. [Google Scholar] [CrossRef]
- Calleja-González, J.; Mielgo-Ayuso, J.; Lekue, J.A.; Leibar, X.; Erauzkin, J.; Jukic, I.; Ostojic, S.M.; Ponce-González, J.G.; Fuentes-Azpiroz, M.; Terrados, N. Anthropometry and Performance of Top Youth International Male Basketball Players in Spanish National Academy. Nutr. Hosp. 2018, 35, 1331–1339. [Google Scholar] [CrossRef] [Green Version]
- Cherif, M.; Said, M.A.; Bannour, K.; Alhumaid, M.M.; Chaifa, M.B.; Khammassi, M.; Aouidet, A. Anthropometry, Body Composition, and Athletic Performance in Specific Field Tests in Paralympic Athletes with Different Disabilities. Heliyon 2022, 8. [Google Scholar] [CrossRef]
- Garcia-Gil, M.; Torres-Unda, J.; Esain, I.; Duñabeitia, I.; Gil, S.M.; Gil, J.; Irazusta, J. Anthropometric Parameters, Age, and Agility as Performance Predictors in Elite Female Basketball Players. J. Strength Cond. Res. 2018, 32, 1723–1730. [Google Scholar] [CrossRef] [PubMed]
- Zaccagni, L.; Lunghi, B.; Barbieri, D.; Rinaldo, N.; Missoni, S.; Šaric, T.; Šarac, J.; Babic, V.; Rakovac, M.; Bernardi, F.; et al. Performance Prediction Models Based on Anthropometric, Genetic and Psychological Traits of Croatian Sprinters. Biol. Sport 2019, 36, 17–23. [Google Scholar] [CrossRef] [PubMed]
- van der Zwaard, S.; de Ruiter, C.J.; Jaspers, R.T.; de Koning, J.J. Anthropometric Clusters of Competitive Cyclists and Their Sprint and Endurance Performance. Front. Physiol. 2019, 10. [Google Scholar] [CrossRef] [PubMed]
- Casade, K.; Kiel, J. Anthropometric Measurement–PubMed; StatPearls Publishing: Tampa, FL, USA, 2021. [Google Scholar]
- Huard Pelletier, V.; Glaude-Roy, J.; Daigle, A.P.; Brunelle, J.F.; Bissonnette, A.; Lemoyne, J. Associations between Testing and Game Performance in Ice Hockey: A Scoping Review. Sports 2021, 9, 117. [Google Scholar] [CrossRef]
- Lemoyne, J.; Brunelle, J.F.; Pelletier, V.H.; Glaude-roy, J.; Martini, G. Talent Identification in Elite Adolescent Ice Hockey Players: The Discriminant Capacity of Fitness Tests, Skating Performance and Psychological Characteristics. Sports 2022, 10, 58. [Google Scholar] [CrossRef] [PubMed]
- Chiarlitti, N.A.; Delisle-Houde, P.; Reid, R.E.R.; Kennedy, C.; Andersen, R.E. Importance of Body Composition in the National Hockey League Combine Physiological Assessments. J. Strength Cond. Res. 2018, 32, 3135–3142. [Google Scholar] [CrossRef] [PubMed]
- Perez, J.; Guilhem, G.; Brocherie, F. Reliability of the Force-Velocity-Power Variables during Ice Hockey Sprint Acceleration. Sport. Biomech. 2022, 21, 56–70. [Google Scholar] [CrossRef]
- Donskov, A.S.; Brooks, J.S.; Dickey, J.P. Reliability of the Single-Leg, Medial Countermovement Jump in Youth Ice Hockey Players. Sports 2021, 9, 64. [Google Scholar] [CrossRef] [PubMed]
- Aparicio-Ugarriza, R.; Mielgo-Ayuso, J.; Benito, P.J.; Pedrero-Chamizo, R.; Ara, I.; González-Gross, M. Physical Activity Assessment in the General Population; Instrumental Methods and New Technologies. Nutr. Hosp. 2015, 31, 219–226. [Google Scholar] [CrossRef] [PubMed]
- Urdampilleta, A.; Mielgo-Ayuso, J.; Valtueña, J.; Holway, F.; Cordova, A. Body Composition and Somatotype of Professional and U23 Hand Basque Pelota Players | Composición Corporal y Somatotipo de La Mano de Los Jugadores de Pelota Vasca. Nutr. Hosp. 2015, 32. [Google Scholar] [CrossRef]
- Rivas, L.G.; Mielgo-Ayuso, J.; Norte-Navarro, A.; Cejuela, R.; Cabañas, M.D.; Martínez-Sanz, J.M. Body Composition and Somatotype in University Triathletes. Nutr. Hosp. 2015, 32, 799–807. [Google Scholar] [CrossRef] [Green Version]
- Mielgo-Ayuso, J.; Collado, P.S.; Urdampilleta, A.; Martínez-Sanz, J.M.; Seco, J. Changes Induced by Diet and Nutritional Intake in the Lipid Profile of Female Professional Volleyball Players after 11 Weeks of Training. J. Int. Soc. Sports Nutr. 2013, 10, 55. [Google Scholar] [CrossRef] [Green Version]
- Toselli, S.; Mauro, M.; Grigoletto, A.; Cataldi, S.; Benedetti, L.; Nanni, G.; Di Miceli, R.; Aiello, P.; Gallamini, D.; Fischetti, F.; et al. Assessment of Body Composition and Physical Performance of Young Soccer Players: Differences According to the Competitive Level. Biology 2022, 11, 823. [Google Scholar] [CrossRef]
- García, F.; Vázquez-Guerrero, J.; Castellano, J.; Casals, M.; Schelling, X. Differences in Physical Demands between Game Quarters and Playing Positions on Professional Basketball Players during Official Competition. J. Sport. Sci. Med. 2020, 19, 256–263. [Google Scholar]
- Natali, S.; Ferioli, D.; La Torre, A.; Bonato, M. Physical and Technical Demands of Elite Beach Volleyball According to Playing Position and Gender. J. Sports Med. Phys. Fitness 2019, 59, 6–9. [Google Scholar] [CrossRef] [PubMed]
- Black, M.I.; Allen, S.J.; Forrester, S.E.; Folland, J.P. The Anthropometry of Economical Running. Med. Sci. Sports Exerc. 2020, 52, 762–770. [Google Scholar] [CrossRef]
- Davies, G.; Riemann, B.L.; Manske, R. Current Concepts of Plyometric Exercise. Int. J. Sports Phys. Ther. 2015, 10, 760–786. [Google Scholar] [PubMed]
- Wilk, M.; Zajac, A.; Tufano, J.J. The Influence of Movement Tempo During Resistance Training on Muscular Strength and Hypertrophy Responses: A Review. Sports Med. 2021, 51, 1629. [Google Scholar] [CrossRef]
- Schoenfeld, B.J.; Grgic, J.; Van Every, D.W.; Plotkin, D.L. Loading Recommendations for Muscle Strength, Hypertrophy, and Local Endurance: A Re-Examination of the Repetition Continuum. Sports 2021, 9, 32. [Google Scholar] [CrossRef]
- Kerksick, C.M.; Arent, S.; Schoenfeld, B.J.; Stout, J.R.; Campbell, B.; Wilborn, C.D.; Taylor, L.; Kalman, D.; Smith-Ryan, A.E.; Kreider, R.B.; et al. International Society of Sports Nutrition Position Stand: Nutrient Timing. J. Int. Soc. Sport. Nutr. 2017, 14. [Google Scholar] [CrossRef]
- Guimarães, E.; Baxter-Jones, A.; Maia, J.; Fonseca, P.; Santos, A.; Santos, E.; Tavares, F.; Janeira, M.A. The Roles of Growth, Maturation, Physical Fitness, and Technical Skills on Selection for a Portuguese under-14 Years Basketball Team. Sports 2019, 7, 61. [Google Scholar] [CrossRef] [Green Version]
- Manuel Clemente, F.; Conte, D.; Sanches, R.; Moleiro, C.F.; Gomes, M.; Lima, R. Anthropometry and Fitness Profile, and Their Relationships with Technical Performance and Perceived Effort during Small-Sided Basketball Games. Res. Sport. Med. 2019, 27, 452–466. [Google Scholar] [CrossRef]
- Buśko, K.; Lewandowska, J.; Lipińska, M.; Michałski, R.; Pastuszak, A. Somatotype-Variables Related to Muscle Torque and Power Output in Female Volleyball Players. Acta Bioeng. Biomech. 2013, 15, 119–126. [Google Scholar] [CrossRef]
- Mala, L.; Maly, T.; Zahalka, F.; Bunc, V.; Kaplan, A.; Jebavy, R.; Tuma, M. Body Composition of Elite Female Players in Five Different Sports Games. J. Hum. Kinet. 2015, 45, 207–215. [Google Scholar] [CrossRef] [PubMed] [Green Version]
- Martín-Matillas, M.; Valadés, D.; Hernández-Hernández, E.; Olea-Serrano, F.; Sjöström, M.; Delgado-FERNáNDEZ, M.; Ortega, F.B. Anthropometric, Body Composition and Somatotype Characteristics of Elite Female Volleyball Players from the Highest Spanish League. J. Sports Sci. 2014, 32, 137–148. [Google Scholar] [CrossRef] [PubMed]
- Giannopoulos, N.; Vagenas, G.; Noutsos, K.; Barzouka, K.; Bergeles, N. Somatotype, Level of Competition, and Performance in Attack in Elite Male Volleyball. J. Hum. Kinet. 2017, 58, 131–140. [Google Scholar] [CrossRef] [Green Version]
- Toselli, S.; Campa, F. Anthropometry and Functional Movement Patterns in Elite Male Volleyball Players of Different Competitive Levels. J. Strength Cond. Res. 2018, 32, 2601–2611. [Google Scholar] [CrossRef]
- Paulauskas, H.; Kreivyte, R.; Scanlan, A.T.; Moreira, A.; Siupsinskas, L.; Conte, D. Monitoring Workload in Elite Female Basketball Players during the In-Season Phase: Weekly Fluctuations and Effect of Playing Time. Int. J. Sports Physiol. Perform. 2019, 14, 941–948. [Google Scholar] [CrossRef]
- Debien, P.B.; Mancini, M.; Coimbra, D.R.; De Freitas, D.G.S.; Miranda, R.; Bara Filho, M.G. Monitoring Training Load, Recovery, and Performance of Brazilian Professional Volleyball Players during a Season. Int. J. Sports Physiol. Perform. 2018, 13, 1182–1189. [Google Scholar] [CrossRef]
- Abt, G.; Boreham, C.; Davison, G.; Jackson, R.; Nevill, A.; Wallace, E.; Williams, M. Power, Precision, and Sample Size Estimation in Sport and Exercise Science Research. J. Sports Sci. 2020, 38, 1933–1935. [Google Scholar] [CrossRef] [PubMed]
- World Medical Association Declaration of Helsinki: Ethical Principles for Medical Research Involving Human Subjects. Jama 2013, 310, 2191–2194. [CrossRef] [PubMed] [Green Version]
- Vilar, L.; Araújo, D.; Davids, K.; Button, C. The Role of Ecological Dynamics in Analysing Performance in Team Sports. Sport. Med. 2012, 42, 1–10. [Google Scholar] [CrossRef]
- Mielgo-Ayuso, J.; Zourdos, M.C.; Calleja-González, J.; Urdampilleta, A.; Ostojic, S.M. Dietary Intake Habits and Controlled Training on Body Composition and Strength in Elite Female Volleyball Players during the Season. Appl. Physiol. Nutr. Metab. 2015, 40, 827–834. [Google Scholar] [CrossRef]
- Seebacher, F.; Franklin, C.E. Determining Environmental Causes of Biological Effects: The Need for a Mechanistic Physiological Dimension in Conservation Biology. Philos. Trans. R. Soc. B Biol. Sci. 2012, 367, 1607–1614. [Google Scholar] [CrossRef] [Green Version]
- Fletcher, G.F.; Ades, P.A.; Kligfield, P.; Arena, R.; Balady, G.J.; Bittner, V.A.; Coke, L.A.; Fleg, J.L.; Forman, D.E.; Gerber, T.C.; et al. Exercise Standards for Testing and Training: A Scientific Statement from the American Heart Association. Circulation 2013, 128, 873–934. [Google Scholar] [CrossRef]
- Brini, S.; Boullosa, D.; Calleja-González, J.; van den Hoek, D.J.; Nobari, H.; Clemente, F.M. Impact of Combined versus Single-Mode Training Programs Based on Drop Jump and Specific Multidirectional Repeated Sprint on Bio-Motor Ability Adaptations: A Parallel Study Design in Professional Basketball Players. BMC Sports Sci. Med. Rehabil. 2022, 14, 1–15. [Google Scholar] [CrossRef]
- De Blas, X.; Padullés, J.M.; Del Amo, J.L.L.; Guerra-Balic, M. Creation and Validation of Chronojump-Boscosystem: A Free Tool to Measure Vertical Jumps. RICYDE Rev. Int. Ciencias Deport. 2012, 8. [Google Scholar] [CrossRef]
- De Blas, X.; González-Gómez, J.; Gómez, R. Validación de Chronopic 3. In Poster Presenting in American College of Sport Medicine (ACSM) 56th Annual Meeting; ACSM: Indianapolis, IN, USA, 2009; pp. 27–30. [Google Scholar]
- Petway, A.J.; Freitas, T.T.; Calleja-González, J.; Leal, D.M.; Alcaraz, P.E. Training Load and Match-Play Demands in Basketball Based on Competition Level: A Systematic Review. PLoS ONE 2020, 15, e0229212. [Google Scholar] [CrossRef] [Green Version]
- Rodríguez-Rosell, D.; Mora-Custodio, R.; Franco-Márquez, F.; Yáñez-García, J.M.; González-Badillo, J.J. Traditional vs. Sport-Specific Vertical Jump Tests: Reliability, Validity, and Relationship with the Legs Strength and Sprint Performance in Adult and Teen Soccer and Basketball Players. J. Strength Cond. Res. 2017, 31, 196–206. [Google Scholar] [CrossRef]
- Tenelsen, F.; Brueckner, D.; Muehlbauer, T.; Hagen, M. Validity and Reliability of an Electronic Contact Mat for Drop Jump Assessment in Physically Active Adults. Sports 2019, 7, 114. [Google Scholar] [CrossRef] [Green Version]
- Altmann, S.; Ringhof, S.; Neumann, R.; Woll, A.; Rumpf, M.C. Validity and Reliability of Speed Tests Used in Soccer: A Systematic Review. PLoS ONE 2019, 14. [Google Scholar] [CrossRef] [Green Version]
- Hojka, V.; Stastny, P.; Rehak, T.; Gołas, A.; Mostowik, A.; Zawart, M.; Musálek, M. A Systematic Review of the Main Factors That Determine Agility in Sport Using Structural Equation Modeling. J. Hum. Kinet. 2016, 52, 115–123. [Google Scholar] [CrossRef] [Green Version]
- Negra, Y.; Chaabene, H.; Hammami, M.; Amara, S.; Sammoud, S.; Mkaouer, B.; Hachana, Y. Agility in Young Athletes: Is It a Different Ability from Speed and Power? J. Strength Cond. Res. 2017, 31, 727–735. [Google Scholar] [CrossRef]
- Hachana, Y.; Chaabène, H.; Nabli, M.A.; Attia, A.; Moualhi, J.; Farhat, N.; Elloumi, M. Test-Retest Reliability, Criterion-Related Validity, and Minimal Detectable Change of the Illinois Agility Test in Male Team Sport Athletes. J. Strength Cond. Res. 2013, 27, 2752–2759. [Google Scholar] [CrossRef]
- García, G.C.; Secchi, J.D. Relación de Las Velocidades Finales Alcanzadas Entre El Course Navette de 20 Metros y El Test de VAM-EVAL. Una Propuesta Para Predecir La Velocidad Aeróbica Máxima. Apunt. Med. l’Esport 2013, 48, 27–34. [Google Scholar] [CrossRef]
- Ferguson, C.J. An Effect Size Primer: A Guide for Clinicians and Researchers. Prof. Psychol. Res. Pract. 2009, 40, 532–538. [Google Scholar] [CrossRef] [Green Version]
- Hopkins, W.G.; Marshall, S.W.; Batterham, A.M.; Hanin, J. Progressive Statistics for Studies in Sports Medicine and Exercise Science. Med. Sci. Sports Exerc. 2009, 41, 3–12. [Google Scholar] [CrossRef] [Green Version]
- Delextrat, A.; Trochym, E.; Calleja-González, J. Effect of a Typical In-Season Week on Strength Jump and Sprint Performances in National-Level Female Basketball Players. J. Sports Med. Phys. Fitness 2012, 52, 128–136. [Google Scholar]
- Stojanovic, M.D.; Ostojic, S.M.; Calleja-González, J.; Milosevic, Z.; Mikic, M. Correlation between Explosive Strength, Aerobicpower and Repeated Sprint Ability in Elite Basketball Players. J. Sports Med. Phys. Fitness 2012, 52, 375–381. [Google Scholar]
- Pleša, J.; Kozinc, Ž.; Šarabon, N. The Association Between Force-Velocity Relationship in Countermovement Jump and Sprint With Approach Jump, Linear Acceleration and Change of Direction Ability in Volleyball Players. Front. Physiol. 2021, 12. [Google Scholar] [CrossRef]
- Torres-Banduc, M.; Ramirez-Campillo, R.; Andrade, D.C.; Calleja-González, J.; Nikolaidis, P.T.; McMahon, J.J.; Comfort, P. Kinematic and Neuromuscular Measures of Intensity During Drop Jumps in Female Volleyball Players. Front. Psychol. 2021, 12. [Google Scholar] [CrossRef]
- Schober, P.; Schwarte, L.A. Correlation Coefficients: Appropriate Use and Interpretation. Anesth. Analg. 2018, 126, 1763–1768. [Google Scholar] [CrossRef]
- Nikolaidis, P.T.; Asadi, A.; Santos, E.J.A.M.; Calleja-González, J.; Padulo, J.; Chtourou, H.; Zemkova, E. Relationship of Body Mass Status with Running and Jumping Performances in Young Basketball Players. Muscles. Ligaments Tendons J. 2015, 5, 187–194. [Google Scholar] [CrossRef]
- Bland, J.M.; Altman, D.G. Statistics Notes: Correlation in Restricted Ranges of Data. BMJ 2011, 343, 577. [Google Scholar]
- Konjengbam, H.; Leona Devi, Y.; Meitei, S.Y. Correlation of Body Composition Parameters and Anthropometric Somatotypes with Prakriti Body Types among the Meitei Adults of Manipur, India. Ann. Hum. Biol. 2021, 48, 160–165. [Google Scholar] [CrossRef]
- Gottlieb, R.; Shalom, A.; Calleja-González, J. Physiology of Basketball - Field Tests. Review Article. J. Hum. Kinet. 2021, 77, 159–167. [Google Scholar] [CrossRef]
- Mielgo-Ayuso, J.; Calleja-González, J.; Clemente-Suárez, V.J.; Zourdos, M.C. Influence of Anthropometric Profile on Physical Performance in Elite Female Volleyballers in Relation to Playing Position | Influencia de La ComposiciÓn Corporal En El Rendimiento FÍsico de Jugadoras de Voleibol En FunciÓn de Su PosiciÓn de Juego. Nutr. Hosp. 2015, 31. [Google Scholar] [CrossRef]
- Barker, L.A.; Harry, J.R.; Mercer, J.A. Relationships between Countermovement Jump Ground Reaction Forces and Jump Height, Reactive Strength Index, and Jump Time. J. Strength Cond. Res. 2018, 32, 248. [Google Scholar] [CrossRef]
- Moore, B.A.; Bemben, D.A.; Lein, D.H.; Bemben, M.G.; Singh, H. Fat Mass Is Negatively Associated with Muscle Strength and Jump Test Performance. J. Frailty Aging 2020, 9, 214–218. [Google Scholar] [CrossRef]
- Ponce-González, J.G.; Olmedillas, H.; Calleja-González, J.; Guerra, B. Physical Fitness, Adiposity and Testosterone Concentrations Are Associated to Playing Position in Professional Basketballers. Nutr. Hosp. 2015, 31. [Google Scholar] [CrossRef]
- Balsalobre-Fernández, C.; Campo-Vecino, J.D.; Tejero-GonzáLez, C.M.; Alonso-Curiel, D. Relationship Between Peak Power, Maximum Strength, Vertical Jump and 30 Metres Sprint in High Performance 400 Metres Athletes. Apunts 2012, 7, 63–69. [Google Scholar]
- Te Wierike, S.C.M.; De Jong, M.C.; Tromp, E.J.Y.; Vuijk, P.J.; Lemmink, K.A.P.M.; Malina, R.M.; Elferink-Gemser, M.T.; Visscher, C. Development of Repeated Sprint Ability in Talented Youth Basketball Players. J. Strength Cond. Res. 2014, 28, 928–934. [Google Scholar] [CrossRef]
- Campa, F.; Semprini, G.; Júdice, P.B.; Messina, G.; Toselli, S. Anthropometry, Physical and Movement Features, and Repeated-Sprint Ability in Soccer Players. Int. J. Sports Med. 2019, 40, 100–109. [Google Scholar] [CrossRef]
- Cullen, B.D.; Cregg, C.J.; Kelly, D.T.; Hughes, S.M.; Daly, P.G.; Moyna, N.M. Fitness Profiling of Elite Level Adolescent Gaelic Football Players. J. Strength Cond. Res. 2013, 27, 2096–2103. [Google Scholar] [CrossRef]
- Knechtle, U.; Knechtle, B.; Knechtle, P.; Klipstein, A.; Rüst, C.A.; Rosemann, T.; Lepers, R. Running Speed during Training and Percent Body Fat Predict Race Time in Recreational Male Marathoners. Open Access J. Sport. Med. 2012, 51, 51. [Google Scholar] [CrossRef] [Green Version]
- Sekulic, D.; Pehar, M.; Krolo, A.; Spasic, M.; Uljevic, O.; Calleja-González, J.; Sattler, T. Evaluation of Basketball-Specific Agility: Applicability of Preplanned and Nonplanned Agility Performances for Differentiating Playing Positions and Playing Levels. J. Strength Cond. Res. 2017, 31, 2278–2288. [Google Scholar] [CrossRef]
- Young, W.; Rayner, R.; Talpey, S. It’s Time to Change Direction on Agility Research: A Call to Action. Sport. Med. Open 2021, 7, 12. [Google Scholar] [CrossRef]
- Molina-López, J.; Zarzuela, I.B.; Sáez-Padilla, J.; Tornero-Quiñones, I.; Planells, E. Mediation Effect of Age Category on the Relationship between Body Composition and the Physical Fitness Profile in Youth Handball Players. Int. J. Environ. Res. Public Health 2020, 17, 2350. [Google Scholar] [CrossRef] [Green Version]
- Dawes, J.; Roozen, M. Developing Agility and Quickness Second Edition, 2nd ed.; National Strength & Conditioning Association; Human Kinetics: Champaign, IL, USA, 2019. Available online: https://lccn.loc.gov/2018035096 (accessed on 22 June 2023).
- Johnston, R.D.; Black, G.M.; Harrison, P.W.; Murray, N.B.; Austin, D.J. Applied Sport Science of Australian Football: A Systematic Review. Sport. Med. 2018, 48, 1673–1694. [Google Scholar] [CrossRef]
- Taylor, L.W.; Wilborn, C.; Roberts, M.D.; White, A.; Dugan, K. Eight Weeks of Pre-and Postexercise Whey Protein Supplementation Increases Lean Body Mass and Improves Performance in Division III Collegiate Female Basketball Players. Appl. Physiol. Nutr. Metab. 2015, 41, 249–254. [Google Scholar] [CrossRef]
- Spiteri, T.; Newton, R.U.; Binetti, M.; Hart, N.H.; Sheppard, J.M.; Nimphius, S. Mechanical Determinants of Faster Change of Direction and Agility Performance in Female Basketball Athletes. J. Strength Cond. Res. 2015, 29, 2205–2214. [Google Scholar] [CrossRef]
- Nikolaidis, P.T.; Gkoudas, K.; Afonso, J.; Clementesuarez, V.J.; Knechtle, B.; Kasabalis, S.; Kasabalis, A.; Douda, H.; Tokmakidis, S.; Torres-Luque, G. Who Jumps the Highest? Anthropometric and Physiological Correlations of Vertical Jump in Youth Elite Female Volleyball Players. J. Sports Med. Phys. Fitness 2017, 57, 802–810. [Google Scholar] [CrossRef]
- Espasa-Labrador, J. Monitoring Internal Load in Women’s Basketball via Subjective and Device-Based Methods: A Systematic Review. Sensors 2023, 23, 4447. [Google Scholar] [CrossRef]


| Age (Years) | Body Mass (kg) | Height (cm) | Experience in the Discipline (Years) | Years Played at Elite Level | |
|---|---|---|---|---|---|
| T1 | V | ||||
| V | 24.138 ± 2.78 | 69.882 ± 9.28 | 177.091 ± 6.50 | 15 ± 2.8 | 4.18 ± 2.2 |
| B | 26.004 ± 5.87 | 77.808 ± 12.40 | 178.833 ± 6.85 | ||
| T2 | B | ||||
| V | 24.472 ± 2.77 | 70.073 ± 8.97 | idem | 14.65 ± 2.84 | 5 ± 1.13 |
| B | 26.311 ± 5.87 | 75.750 ± 11.45 | |||
| EFBP | ||||||||
|---|---|---|---|---|---|---|---|---|
| T1 (n = 12) | T2 (n = 12) | t | %Δ | p | η2p | Change Magnitude | Probabilistic Inference | |
| Body mass (kg) | 77.808 ± 12.40 | 75.75 ± 11.45 | 2.201 | −2.645 ± 3.2 | 0.6768 | 0.172 | Trivial | Probably beneficial |
| BMI (kg/m2) | 24.253 ± 3.02 | 23.605 ± 2.65 | −2.672 ± 3.3 | 0.157931 | 0.597 | Medium | Probably beneficial | |
| Body fat (%) | 20.46 ± 3.48 | 20.04 ± 2.95 | −2.053 ± 9.2 | 0.750297 | 0.1315 | Trivial | Possibly beneficial | |
| ∑8SF (mm) | 132.43 ± 35.62 | 126.61 ± 27.33 | −4.395 ± 13.5 | 0.657973 | 0.1832 | Trivial | Possibly beneficial | |
| Muscle mass (%) | 33.94 ± 3.17 | 34.67 ± 2.69 | 2.151 ± 3.9 | 0.550339 | −0.248 | Medium | Possibly beneficial | |
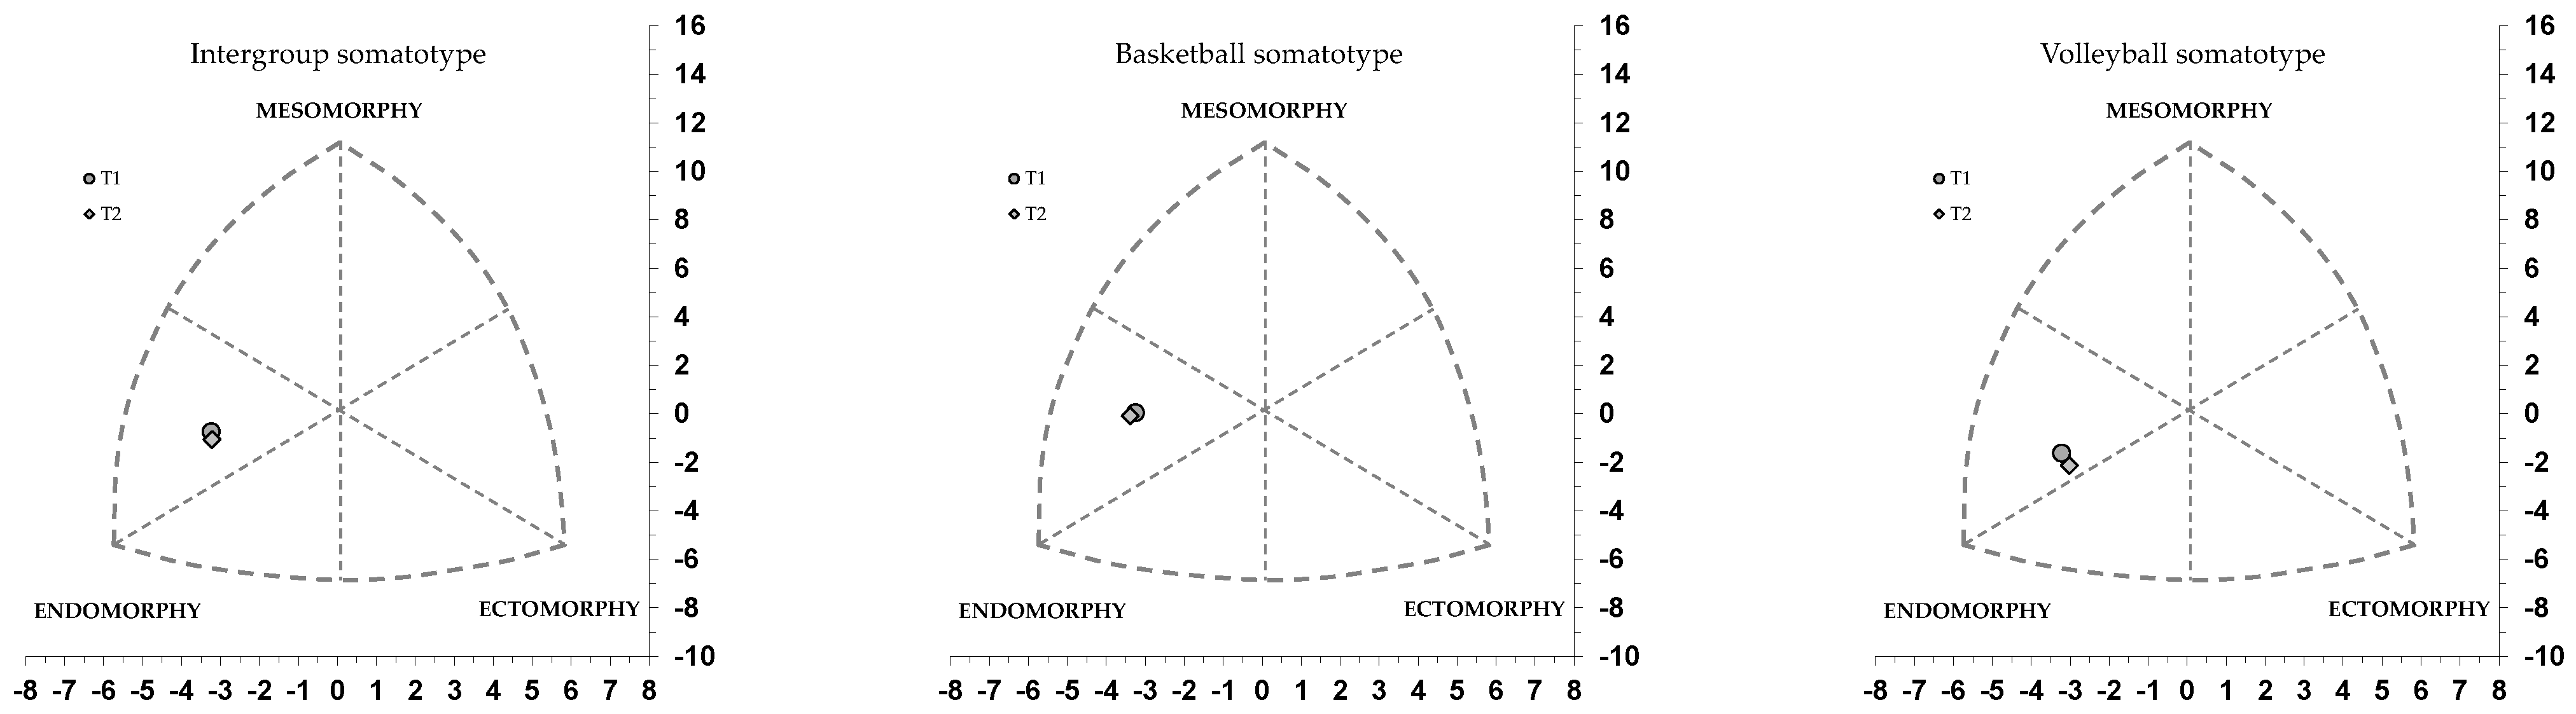
| Endomorphy | 5.29 ± 0.99 | 5.16 ± 0.80 | −2.457 ± 17.6 | 0.71217 | 0.1526 | Trivial | Probably beneficial | |
| Mesomorphy | 3.56 ± 1.50 | 3.56 ± 1.36 | 0.0 ± 57.9 | 0.991 | 0.979 | Large | Almost certain beneficial | |
| Ectomorphy | 1.91 ± 0.58 | 1.91 ± 0.58 | 0.0 ± 0.0 | 1 | 0.0 | Trivial | Trivial | |
| EFVP | ||||||||
| T1 (n = 11) | T2 (n = 11) | t | %Δ | p | η2p | Change Magnitude | Probabilistic Inference | |
| Body mass (kg) | 69.882 ± 9.28 | 70.07 ± 8.97 | 2.228 | 0.269 ± 2.5 | 0.000721 ** | −0.02093 | Trivial | Possibly trivial |
| BMI (kg/m2) | 22.315 ± 3.07 | 22.36 ± 2.79 | 0.202 ± 2.5 | 0.975031 | −0.0135 | Trivial | Possibly trivial | |
| Body fat (%) | 19.03 ± 3.19 | 19.55 ± 4.02 | 2.73 ± 16.4 | 0.741617 | −0.143 | Trivial | Probably harmful | |
| ∑8SF (mm) | 109.75 ± 25.89 | 113.98 ± 32.58 | 3.009 ± 23.5 | 0.801417 | −0.1087 | Trivial | Probably harmful | |
| Muscle mass (%) | 34.20 ± 3.75 | 35.68 ± 3.86 | 4.327 ± 13.4 | 0.373621 | −0.388 | Medium | Probably beneficial | |
| Endomorphy | 4.809 ± 0.8 | 5.08 ± 1.19 | 4.098 ± 10.3 | 0.681101 | −0.1779 | Trivial | Probably harmful | |
| Mesomorphy | 2.32 ± 1.25 | 2.66 ± 1.39 | 15.152 ± 11.2 | 0.532658 | −0.271 | Small | Possibly beneficial | |
| Ectomorphy | 1.86 ± 0.49 | 1.86 ± 0.49 | 0.0 ± 0.0 | 1 | 0.0 | Trivial | Trivial | |
| EFBP | ||||||||
|---|---|---|---|---|---|---|---|---|
| T1 (n = 12) | T2 (n = 12) | t | %Δ | p | η2p | Change Magnitude | Probabilistic Inference | |
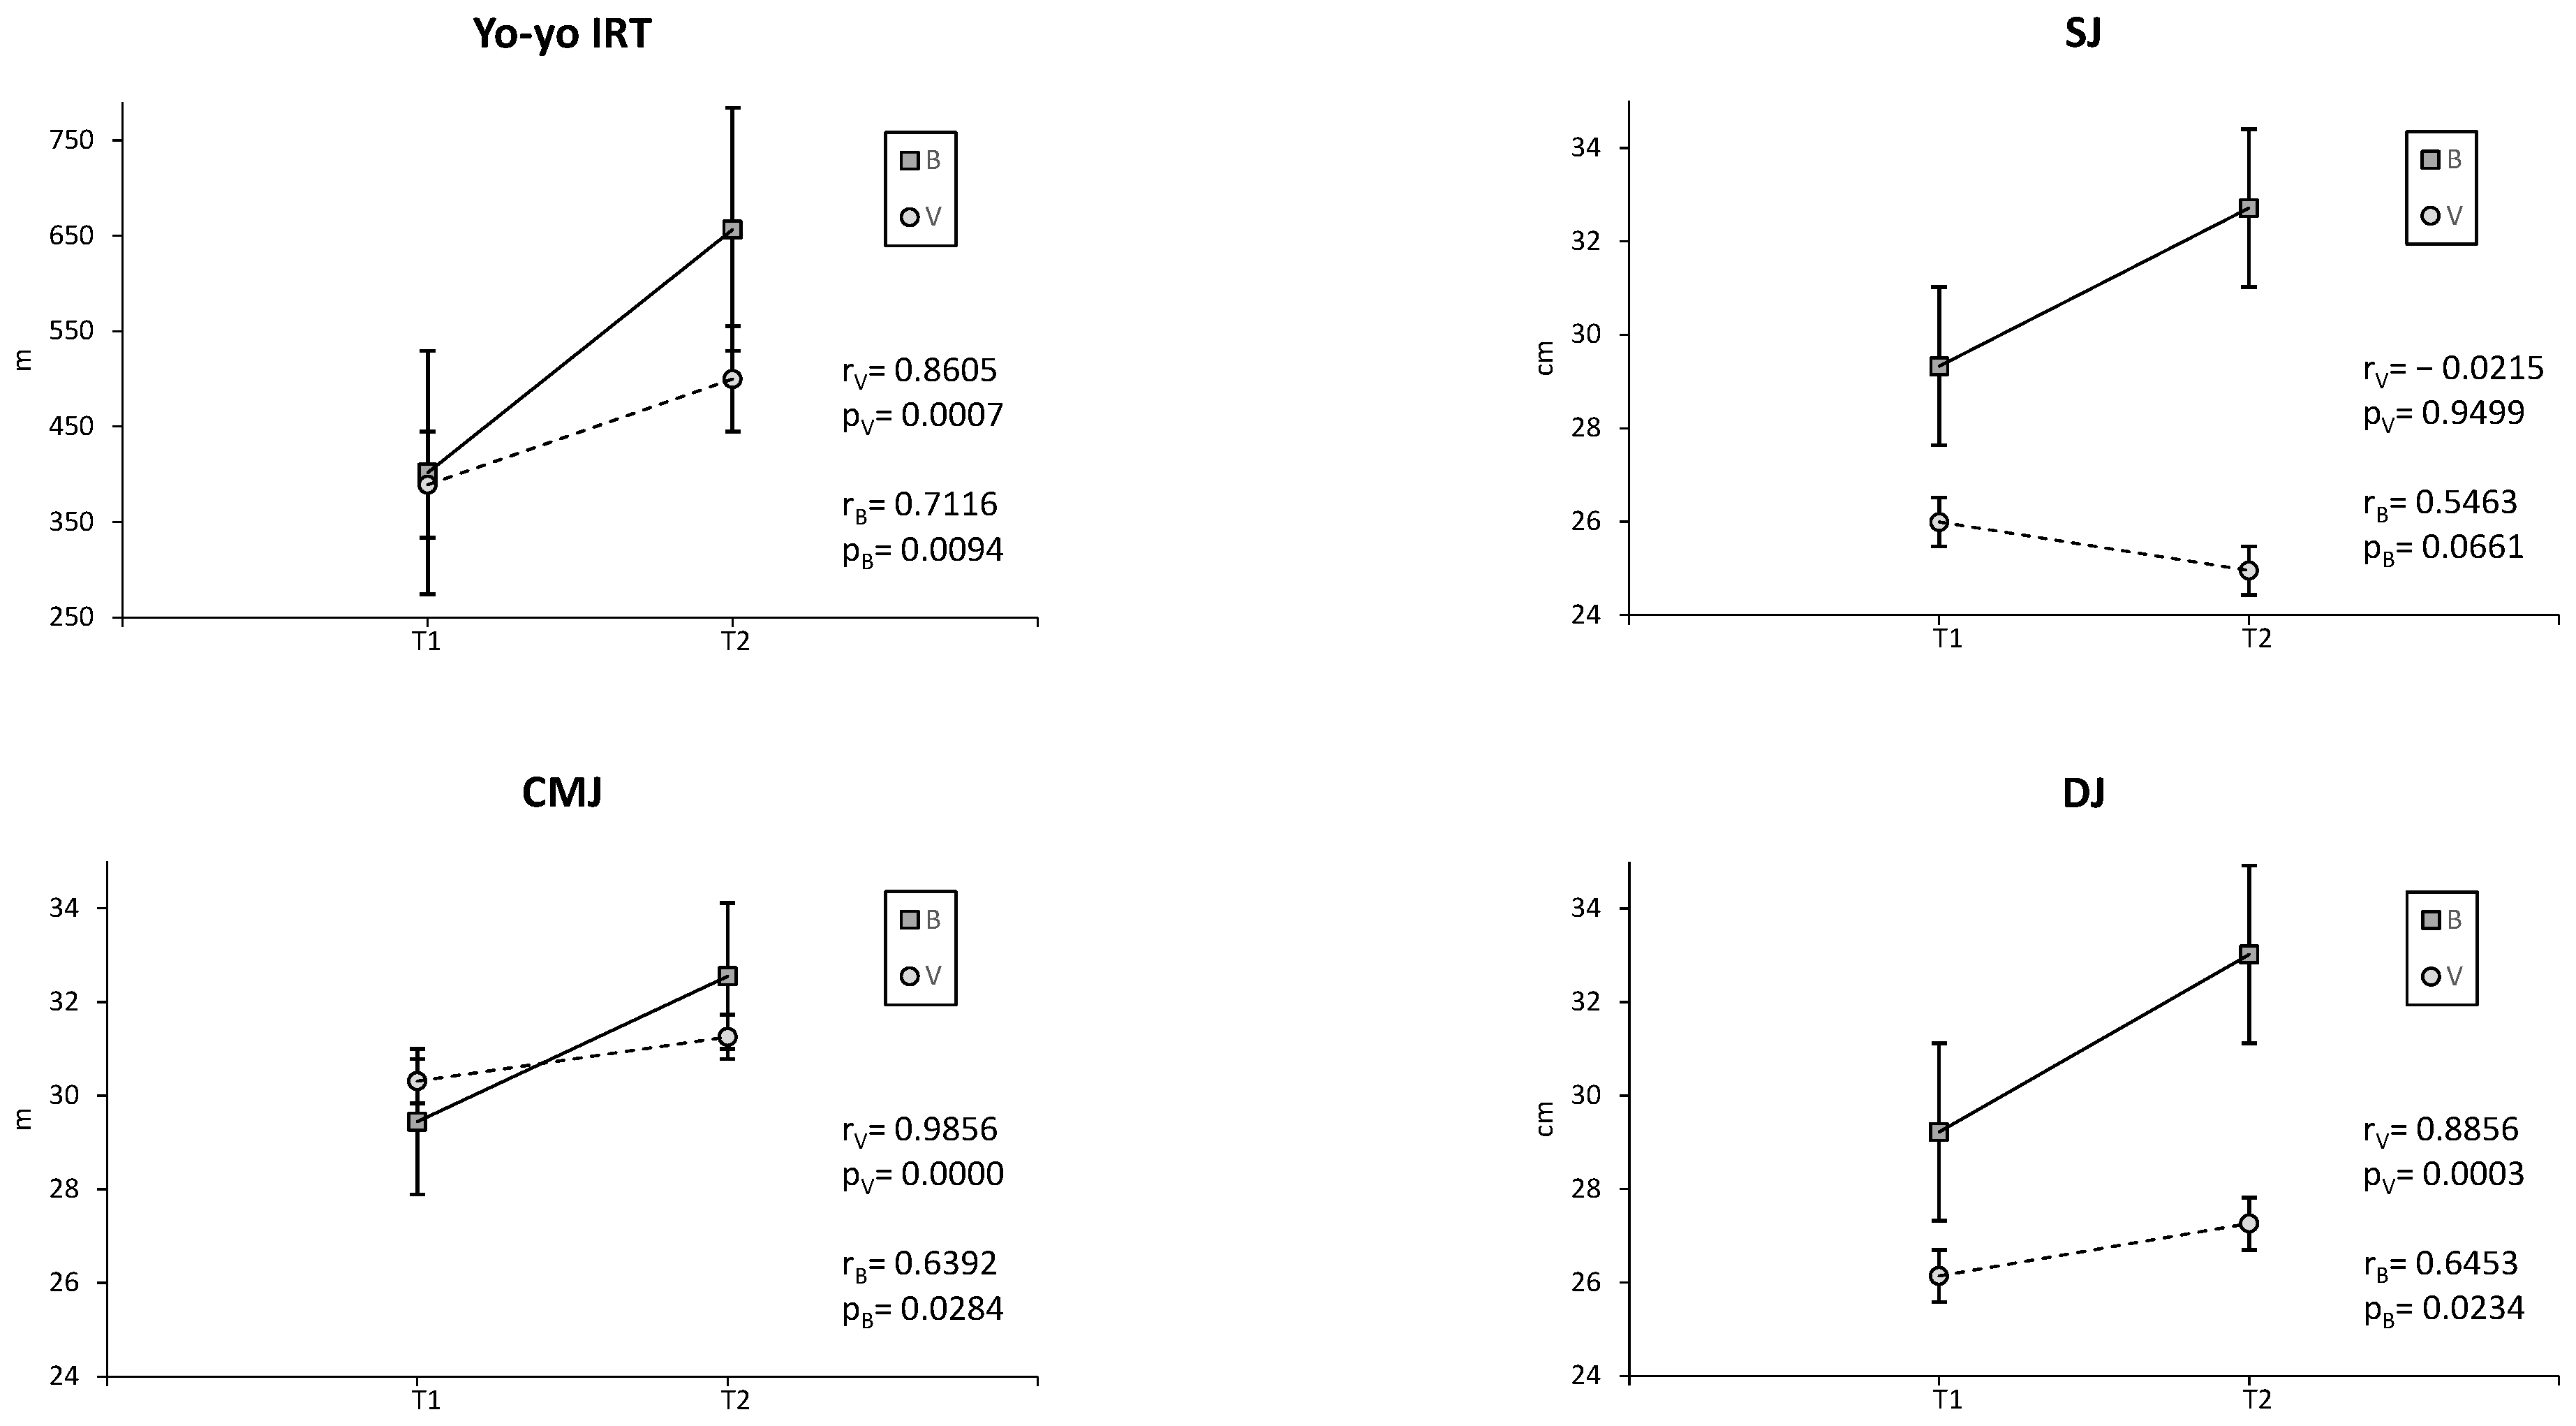
| SJ (cm) | 29.33 ± 4.52 | 32.71 ± 5.2 | 2.201 | 11.524 ± 16.6 | 0.029* | −0.2767 | Small | Almost certain beneficial |
| CMJ (cm) | 29.44 ± 5.41 | 32.55 ± 4.34 | 10.564 ± 16.5 | 0.136 | 0.1355 | Trivial | Almost certain beneficial | |
| ABK (cm) | 34.3 ± 3.83 | 33.59 ± 3.93 | −2.07 ± 7.9 | 0.699 | 0.1597 | Trivial | Possibly harmful | |
| DJ (cm) | 29.22 ± 4.75 | 33.02 ± 5.18 | 13.005 ± 16.6 | 0.638 | −0.764 | Medium | Almost certain beneficial | |
| Ball throw (m) | 7.3 ± 0.92 | 7.69 ± 0.92 | 5.342 ± 8.2 | 0.303 | −0.431 | Small | Probably beneficial | |
| 20 m (s) | 3.51 ± 0.23 | 3.45 ± 0.17 | −1.709 ± 5.9 | 0.466 | 0.3029 | Small | Possibly beneficial | |
| RSA (s) | 7.94 ± 0.43 | 7.77 ± 0.35 | −2.141 ± 3.7 | 0.282 | 0.4499 | Small | Possibly beneficial | |
| Illinois (s) | 18.52 ± 0.8 | 18.82 ± 0.61 | 1.62 ± 4.3 | 0.308 | −0.426 | Small | Possibly harmful | |
| Yo-yo (m) | 401.67 ± 387.67 | 656.67 ± 271.29 | 63.485 ± 115.6 | 0.678 | −0.784 | Medium | Almost certain beneficial | |
| EFVP | ||||||||
| T1 (n = 12) | T2 (n = 11) | t | %Δ | p | η2p | Change Magnitude | Probabilistic Inference | |
| SJ (cm) | 25.99 ± 3.19 | 24.95 ± 1.19 | 2.228 | −4.002 ± 11.3 | 0.335 | 0.436 | Small | Probably harmful |
| CMJ (cm) | 30.31 ± 3.53 | 31.25 ± 4.05 | 3.101 ± 2.2 | 0.0019 ** | −0.277 | Small | Probably beneficial | |
| ABK (cm) | 33.99 ± 4.98 | 34.73 ± 3.45 | 2.177 ± 3.1 | 0.0276 * | −0.2089 | Small | Possibly beneficial | |
| DJ (cm) | 26.14 ± 3.82 | 27.06 ± 40.5 | 3.52 ± 6.6 | 0.1031 | −0.261 | Small | Probably beneficial | |
| Ball throw (m) | 7.15 ± 0.92 | 7.20 ± 1.08 | 0.699 ± 11.0 | 0.8234 | −0.0563 | Trivial | Probably trivial | |
| 20 m (s) | 3.57 ± 0.19 | 3.5 ± 0.21 | −1.961 ± 6.2 | 0.3257 | 0.322 | Small | Possibly beneficial | |
| RSA (s) | 8.46 ± 0.77 | 8.51 ± 0.80 | 0.591 ± 6.3 | 0.7579 | −0.0678 | Trivial | Probably trivial | |
| Illinois (s) | 18.53 ± 0.88 | 18.87 ± 1.12 | 1.835 ± 3.8 | 0.1488 | −0.351 | Small | Possibly harmful | |
| Yo-yo (m) | 389.09 ± 207.95 | 500 ± 247.44 | 28.505 ± 42.6 | 0.0181 * | −0.5008 | Medium | Almost certain beneficial | |
Disclaimer/Publisher’s Note: The statements, opinions and data contained in all publications are solely those of the individual author(s) and contributor(s) and not of MDPI and/or the editor(s). MDPI and/or the editor(s) disclaim responsibility for any injury to people or property resulting from any ideas, methods, instructions or products referred to in the content. |
© 2023 by the authors. Licensee MDPI, Basel, Switzerland. This article is an open access article distributed under the terms and conditions of the Creative Commons Attribution (CC BY) license (https://creativecommons.org/licenses/by/4.0/).
Share and Cite
Miguel-Ortega, Á.; Calleja-González, J.; Mielgo-Ayuso, J. Comparison of Sports Performance and Kinanthropometric Profiles of Elite Female Basketball and Volleyball Players over the Course of a Competitive Season. Appl. Sci. 2023, 13, 8267. https://doi.org/10.3390/app13148267
Miguel-Ortega Á, Calleja-González J, Mielgo-Ayuso J. Comparison of Sports Performance and Kinanthropometric Profiles of Elite Female Basketball and Volleyball Players over the Course of a Competitive Season. Applied Sciences. 2023; 13(14):8267. https://doi.org/10.3390/app13148267
Chicago/Turabian StyleMiguel-Ortega, Álvaro, Julio Calleja-González, and Juan Mielgo-Ayuso. 2023. "Comparison of Sports Performance and Kinanthropometric Profiles of Elite Female Basketball and Volleyball Players over the Course of a Competitive Season" Applied Sciences 13, no. 14: 8267. https://doi.org/10.3390/app13148267