

Production Planning Forecasting System Based on M5P Algorithms and Master Data in Manufacturing Processes


1
Department of Smart Factory Convergence, Sungkyunkwan University, 2066 Seobu-ro Jangan-gu, Suwon 16419, Republic of Korea
2
ThiraUtech SCM Labs, Hakdong-ro 5-gil Gangnam-gu, Seoul 06044, Republic of Korea
3
Mechanical Engineering, Karlsruhe Institute of Technology, 76049 Karlsruhe, Baden-Württemberg, Germany
*
Author to whom correspondence should be addressed.
Appl. Sci. 2023, 13(13), 7829; https://doi.org/10.3390/app13137829
Submission received: 13 June 2023
/
Revised: 29 June 2023
/
Accepted: 30 June 2023
/
Published: 3 July 2023
(This article belongs to the Special Issue Design and Optimization of Manufacturing Systems)
Abstract
:With the increasing adoption of smart factories in manufacturing sites, a large amount of raw data is being generated from manufacturers’ sensors and Internet of Things devices. In the manufacturing environment, the collection of reliable data has become an important issue. When utilizing the collected data or establishing production plans based on user-defined data, the actual performance may differ from the established plan. This is particularly so when there are modifications in the physical production line, such as manual processes, newly developed processes, or the addition of new equipment. Hence, the reliability of the current data cannot be ensured. The complex characteristics of manufacturers hinder the prediction of future data based on existing data. To minimize this reliability problem, the M5P algorithm, is used to predict dynamic data using baseline information that can be predicted. It combines linear regression and decision-tree-supervised machine learning algorithms. The algorithm recommends the means to reflect the predicted data in the production plan and provides results that can be compared with the existing baseline information. By comparing the existing production plan with the planning results based on the changed master data, it provides data results that help production management determine the impact of work time and quantity and confirm production plans. This means that forecasting data directly affects production capacity and resources, as well as production times and schedules, to help ensure efficient production planning.
1. Introduction
Supply chain management (SCM) is being studied and rapidly applied to manufacturing floors, where artificial intelligence (AI) can provide visibility and transparency for rapid and responsive decision making. This research helps improve quality control, reduce defects, and increase customer satisfaction [1]. Many studies have been conducted to identify the contribution of AI to SCM through systematic reviews of manufacturing systems [2]. Production planning and scheduling are at the core of SCM. These are important problems in various industries and require efficient scheduling methods to improve productivity and reduce costs [3]. Researchers have been working on solving workshop scheduling problems using machine learning algorithms, and their contributions can be seen. These studies show that there is a need for research to improve the production planning process by applying new algorithms in various fields. This research aims to investigate how technology can be applied to production planning in the field of supply chain management.
Modern manufacturing systems are increasingly complex, dynamic, and connected. Recent advances in AI, particularly machine learning, have shown great potential to transform the manufacturing sector, as the myriad of uncertainties and interdependencies make factory operations highly non-linear and stochastic [4]. It is contended that that AI can be used to improve the quality of data, optimize processes, and make better decisions [5]. Since the Industrial Revolution, the mass production system has been discarded completely in favor of multi-product, low-volume production to satisfy the complex and diverse needs of customers. Moreover, the life-cycle of products has been shortened. The complexity of the manufacturing process from demand to production to shipment has increased exponentially with technological advances. Manufacturers have factories in multiple locations that provide products through multiple supply chains. In this increasingly complex manufacturing environment with multiple tradeoffs, production planning within a given capacity should be performed appropriately to satisfy various constraints and demands. In the current competitive and dynamic business environment, reliable data has become even more important with the advancement of Internet of Things (IoT) and cloud technology. Furthermore, predicting and utilizing data from numerous sources remains a key challenge in the current situation.
Production planning has a wide range of influences on SCM. The objective of SCM is to improve efficiency, quality, productivity, and customer satisfaction. It plays an important role in achieving these objectives [6]. Production planning optimizes the use of raw materials and resources, coordinates production volumes and schedules, and efficiently manages the production process. It can help identify and improve problems in areas such as inventory management, production line efficiency, and productivity. Thereby, it provides factors that can have a positive impact [7].
It learns baseline information data (which form the basis of production planning according to performance data) and makes predictions using machine learning, compares with and reflects on existing master data, establishes plans through the production planning system, and provides indicators to help manage production.
Section 1 presents the background and purpose of the study, as well as the methodology and organization of the study. Section 2 describes the importance of master data from the perspective of the manufacturing industry before outlining the contents of the study. Section 3 describes the algorithms applied from a technical point of view and discusses previous research. Section 4 describes the design of the process. Section 5 provides the experimental results and discussion. Section 6 summarizes the results, presents the limitations, and considers directions for future research.
2. Related Work
2.1. The Importance of Managing Manufacturer Master Data
With the development of technology and the application of the industrial IoT, a large amount of data is being generated in research and development processes in the manufacturing domain. These include manufacturing procedures, enterprise management, and product transactions [8]. Data directly related to production efficiency are managed closely and respond to change. Among the master data in production, the yield and tact time are the two key metrics used by manufacturers to measure the production efficiency. Low yields indicate that manufacturers are producing defective products. This can cause low customer satisfaction, lost revenue, and increased production costs. Accurately estimating and managing tact time also enables the forecasting and planning of production volumes and production schedules. This, in turn, enables production to be planned efficiently and maintains the production line running smoothly. This also implies a reduction in the process lead time and thereby, a faster production and more rapid dispatch of products to customers [9]. An improvement in the efficiency of the production process can be an important indicator of customer satisfaction. This is because it enables producers to respond better to the diverse needs of their customers.
In this respect, both the datasets contribute to increased productivity and improved quality. As variable baseline information is critical for manufacturers to improve the production efficiency, reduce costs, and enhance customer satisfaction, manufacturers can monitor these data and undertake action to improve the overall business performance [10].
2.2. How to Estimate Manufacturer Master Data
Forecasting the data values of the two master datasets (yield and tact time) can help manufacturers optimize their production processes and ensure that they manufacture the products they require to satisfy the demand in a timely manner [11]. Several methods can be used to forecast data. One of these is to use historical data (where past performance data can be used to identify factors that can affect the yield and tact time) and predict the future values of these factors. Another method to predict the baseline information is to use a simulation. Simulations can be used to model the manufacturing process in a virtual environment. Moreover, the model can be used to test different operating conditions and determine their effect on the measured data [12].
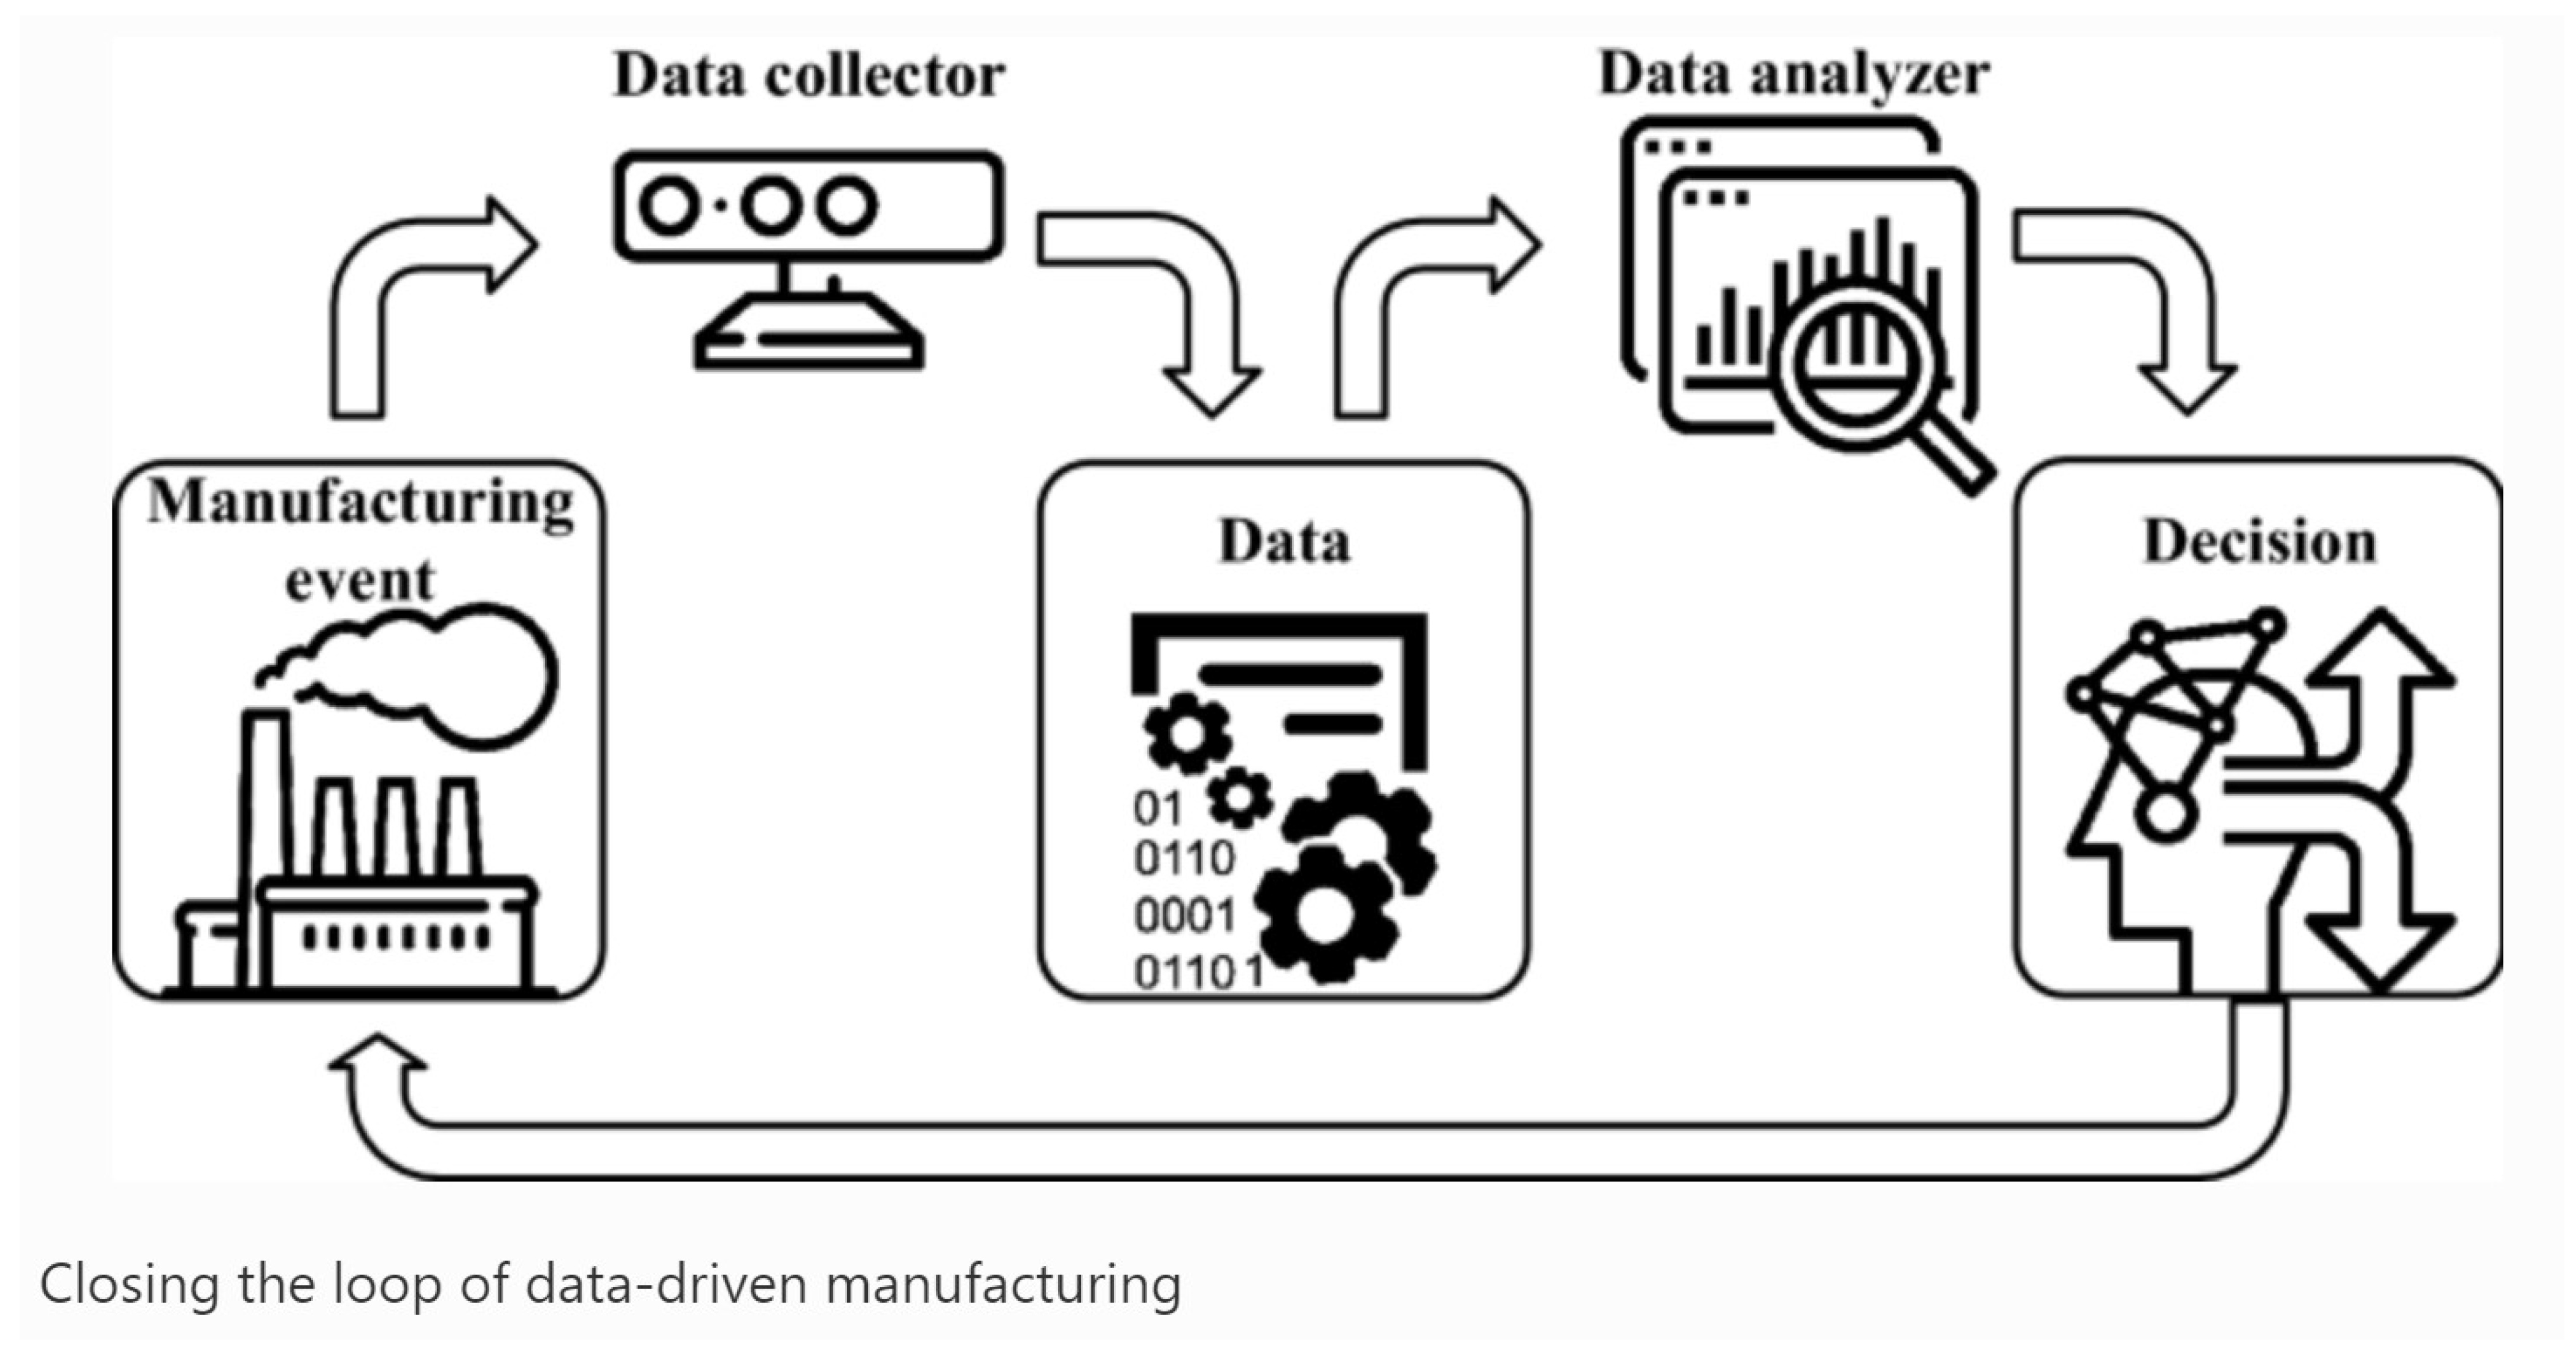
This is a simplified way of saying that master data that must to be predicted are analyzed and applied to the manufacturing floor. Figure 1 shows the conventional methods of processing data by analyzing these using a structured system implementation logic based on past performance data. The processed data are ultimately applied based on the user’s assessment, which is dependent on the user input.
2.3. Highly Advanced Methods to Manage Manufacturer Master Data
In a manufacturer’s smart factory, the IoT enables sensors and other devices to collect and transmit data to monitor and control baseline information in real time. With rapid advances in AI technology and hardware performance, machine learning has attained a level of sophistication that manufacturers can use to identify patterns in historical data and predict baseline information [14]. This indicates that preprocessed master data can be analyzed using machine-learning algorithms to predict and reflect the results in real time [15]. Real-time data are limited by the fact that it does not fully account for the interactions and uncertainties between different variables. This can be overcome by utilizing various machine-learning algorithms. It is challenging for existing job-planning techniques to obtain effective optimal solutions using an individual numerical analysis method for complex distributed resource-planning problems. The effectiveness of the proposed hybrid methodology is demonstrated through a comprehensive case study of manufacturers [16]. To address uncertainty, many methods to predict data are being researched actively. These include the use of fuzzy logic to model ambiguous input variables and environmental factors and the use of nonlinear programming techniques to identify optimal decision variables [17]. Research and demonstrations are being conducted at present to construct machine-learning models based on real-time data collected from various sensors for identifying normal and abnormal conditions [18].
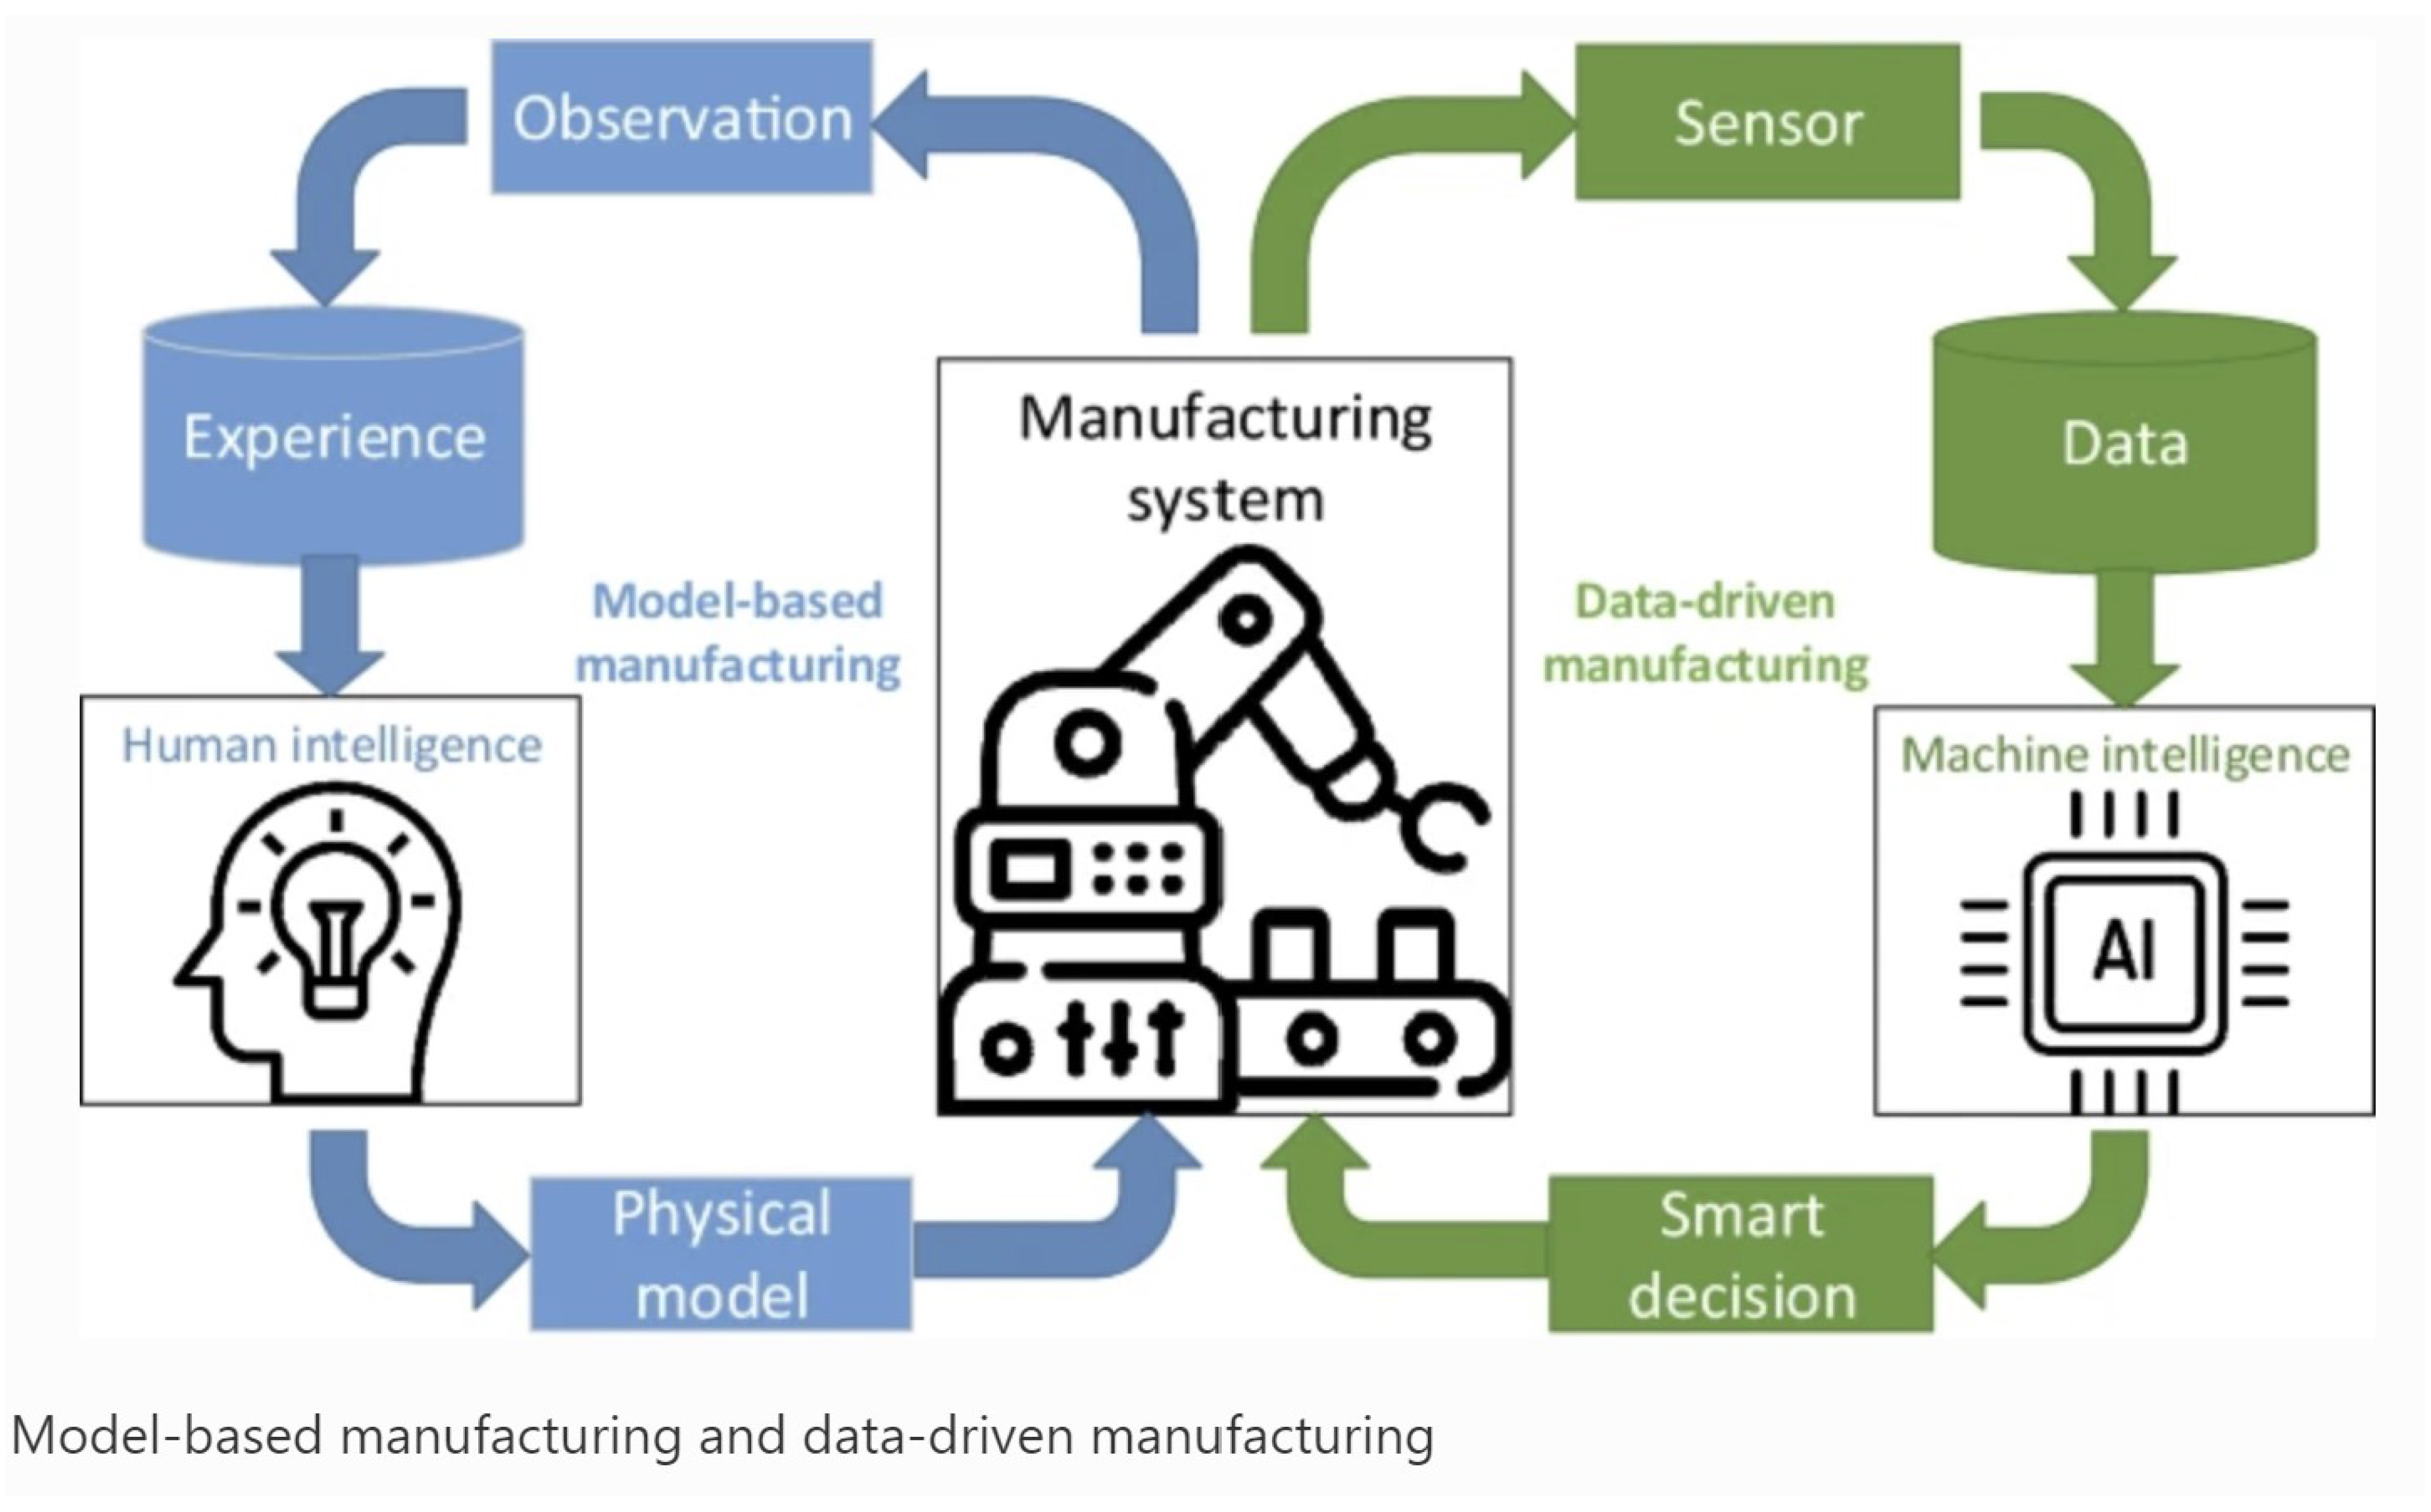
Taken together, these studies show that manufacturing master data management is evolving to focus on leveraging data, analytics, and automation. Adopting AI technology can optimize production processes, improve quality, manage reference information more efficiently and effectively, and improve the overall performance of the production process [19]. As shown in Figure 2, AI can help manufacturers collect and analyze data from sensors, machines, and other devices. This enables manufacturers to track the performance of their production processes and identify areas for improvement [20]. It can also be used to predict future data. It can help predict the future output, quality, and costs. This, in turn, can help manufacturers manage inventory levels and produce the products required to satisfy the demand. Overall, it can help manage the master’s data more efficiently and effectively.
3. M5P Algorithms and Master Data in Production Planning System
In this study, the process of estimating the master data used by manufacturers and applying it to production planning is discussed. It describes how the master data are collected, preprocessed into a data form suitable for the process, and then measured using an algorithm to be applied. The study also describes the behavior of the machine-learning algorithm M5P applied in this study and proposes a data application process. The purpose is to apply the predicted values to a production planning system and compare these with existing results to provide effective indicators for production planning.
3.1. Forecasting Variable Master Data
Research has revealed that most manufacturers have experienced consequences related to additional production resources, extended lead times, reduced product quality, and low performance owing to data management issues. This indicates that data errors are common in business processes [21]. Master data management plays a highly important role in production planning. In the production process, baseline information such as the production volume and production time comprise the core information required to establish production plans and operate efficiently. Among the master data, tact time and yield mostly have constant values. However, these display inconsistent and unstable characteristics in an altered manufacturing environment, such as manual processes, newly developed processes, or the addition of new facilities [22]. Rather than manage the master data as user-managed baseline information, machine-learning algorithms are used to make predictions based on process data such as performance, to establish production plans [23]. Accurate forecast data can optimize the production schedule guidance to obtain the optimization of the total production time. Therefore, ensuring the proper use of existing resources to meet the basic requirements of the production schedule has important theoretical significance for the actual production of the enterprise [24]. The target master data to be predicted are defined as follows.
- Tact Time: The time required to produce one product. In the production process, tact time is an important factor that determines the production speed of the production line. For efficient production, it is necessary to optimize the tact time of the production line and establish a production plan based on it. Keeping accurate and up-to-date information about tact time through master data management ensures that production plans are well-aligned with actual production.
- Yield: Indicates how many of the products produced during the production process meet the quality standards. Yield directly affects product quality and production performance, so it is an important factor to consider when planning production.
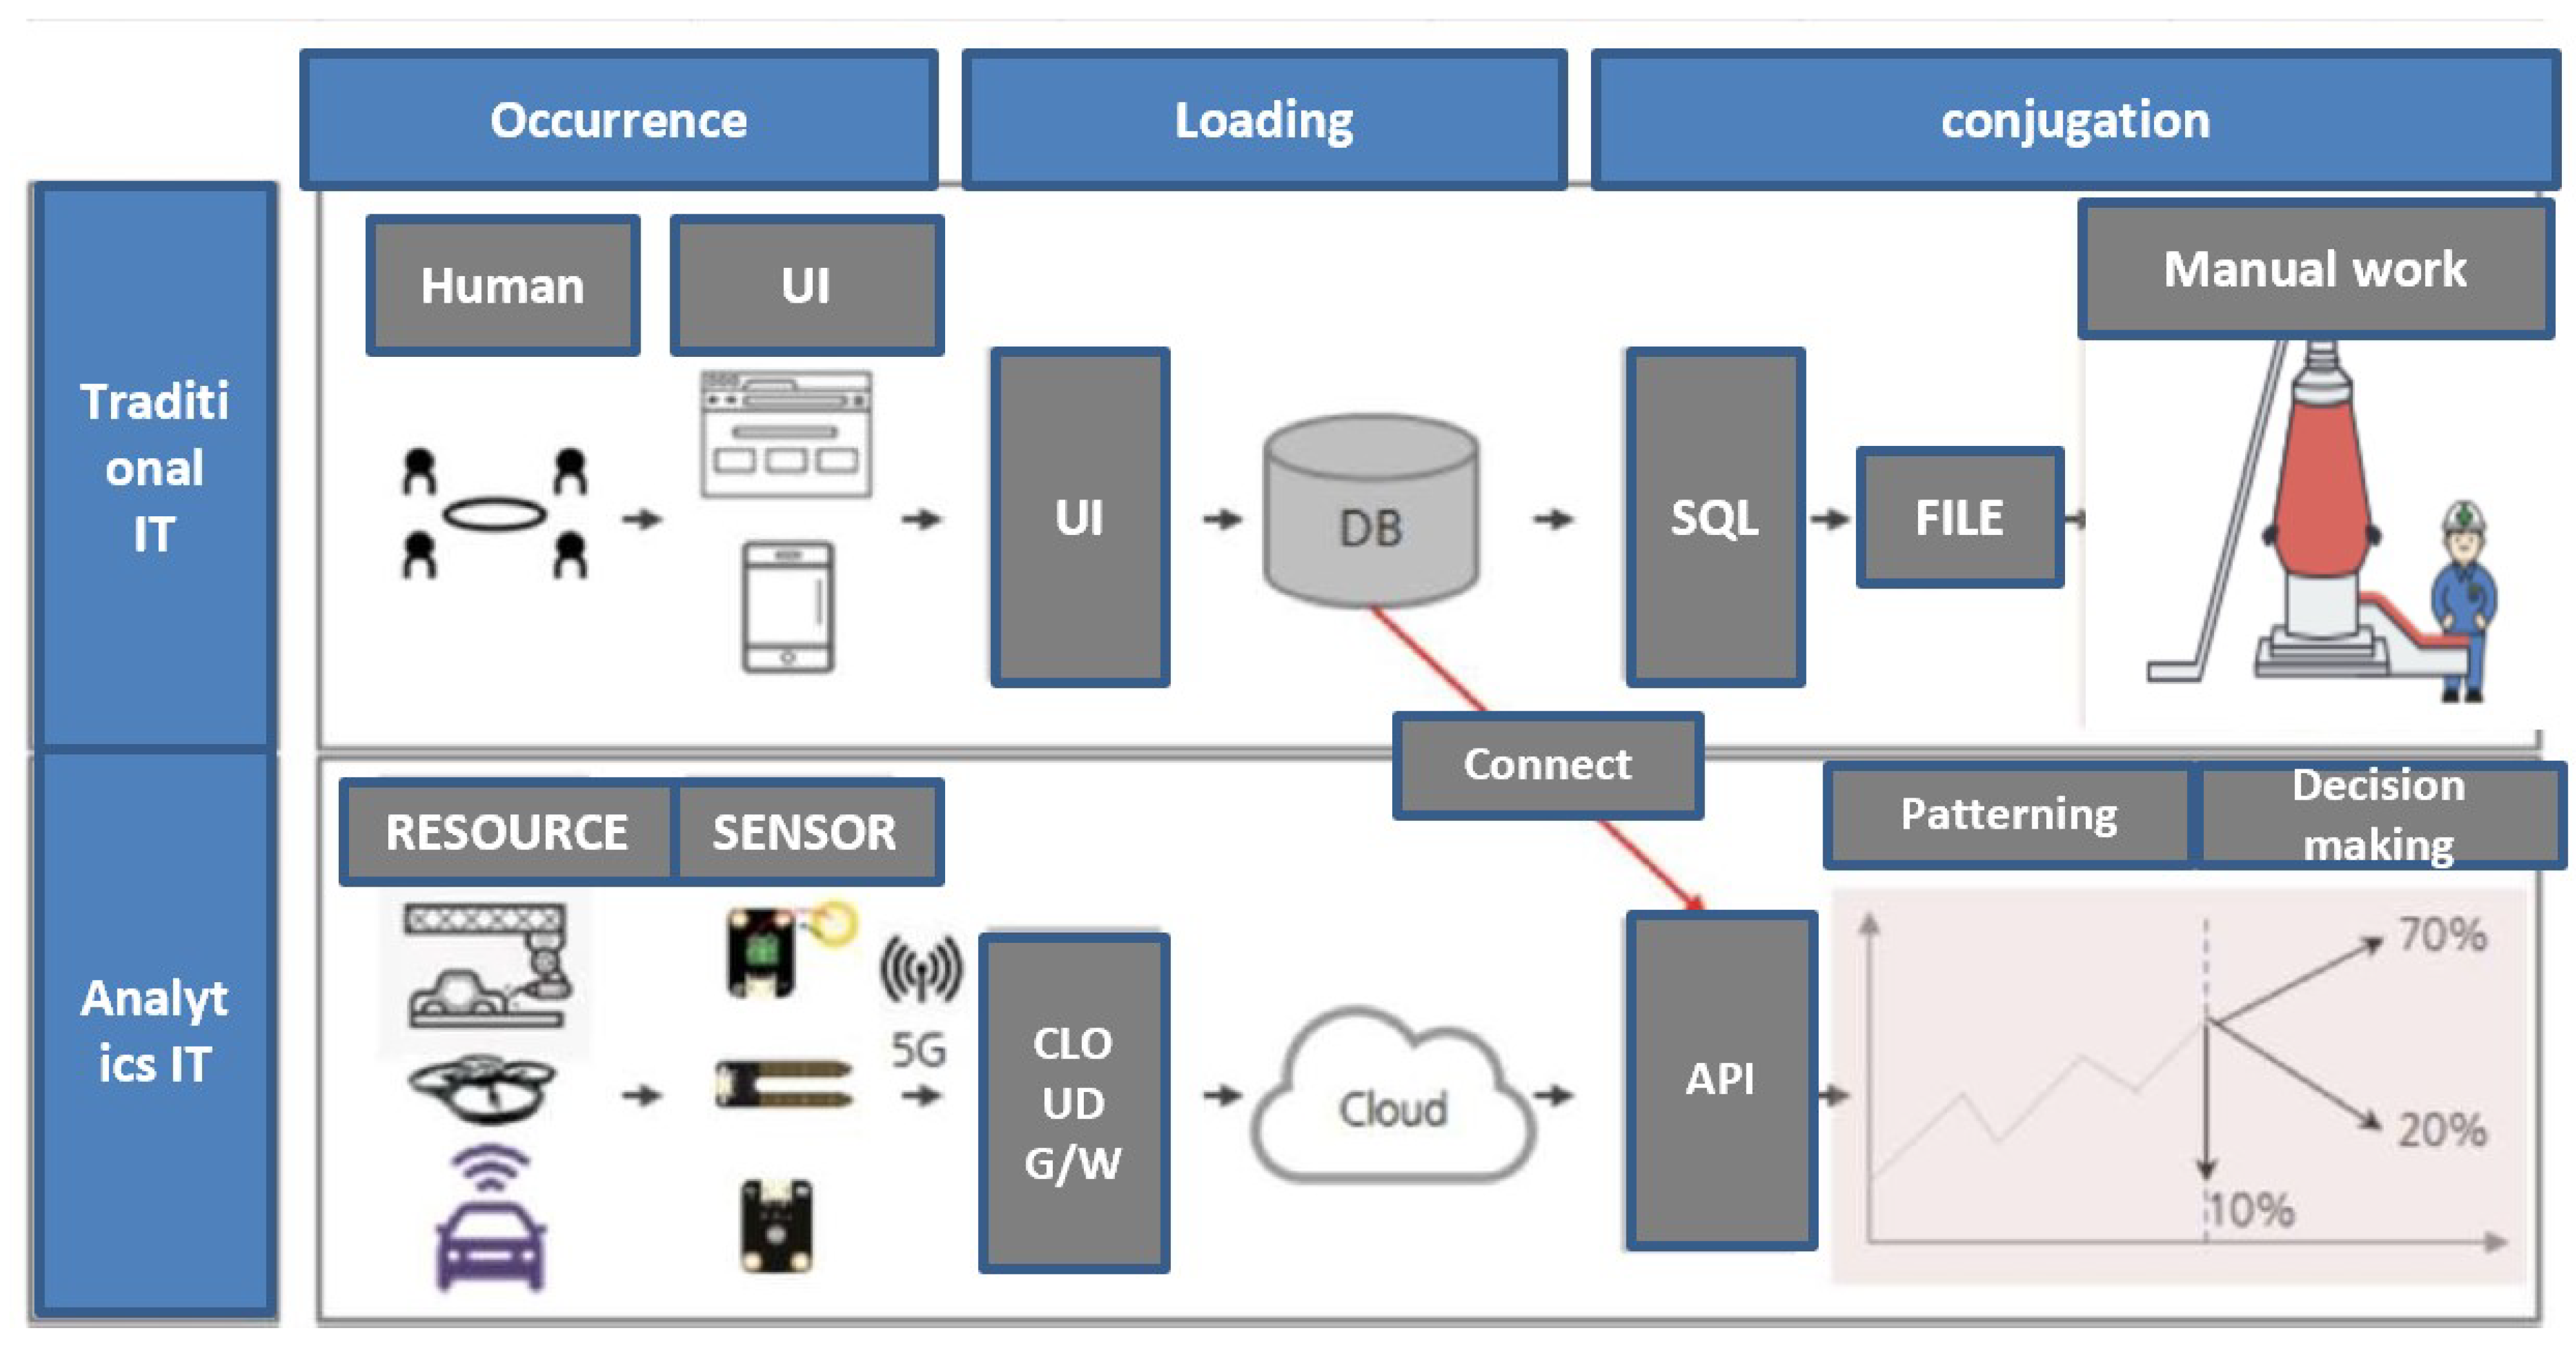
Figure 3 shows that the existing IT system is implemented such that users master data information through the UI, whereas the new IT system collects and analyzes data through sensors located in resources other than the users. It predicts the current data as well as the future data to be used for planning. Manufacturing processes require flexibility and the capability to reconfigure themselves to address critical challenges. To achieve this, it is important to obtain relevant information in real time to make strategic decisions, optimally utilize available resources, and remain competitive in the market. A method to achieve this is to use machine-learning to predict and provide effective data. Machine-learning algorithms are utilized to improve production planning and address scheduling challenges [25]. It is challenging for conventional job-planning techniques to obtain effective optimal solutions to complex distributed resource-planning problems using individual numerical analysis methods [26]. Thus, machine-learning algorithms have been used to develop methods to improve production planning. In this study, the M5P algorithm is used in the API to predict the values of the two types of master data. The objective is to establish a production plan and compare it with the existing master data plan, and thereby help users finalize the production plan.
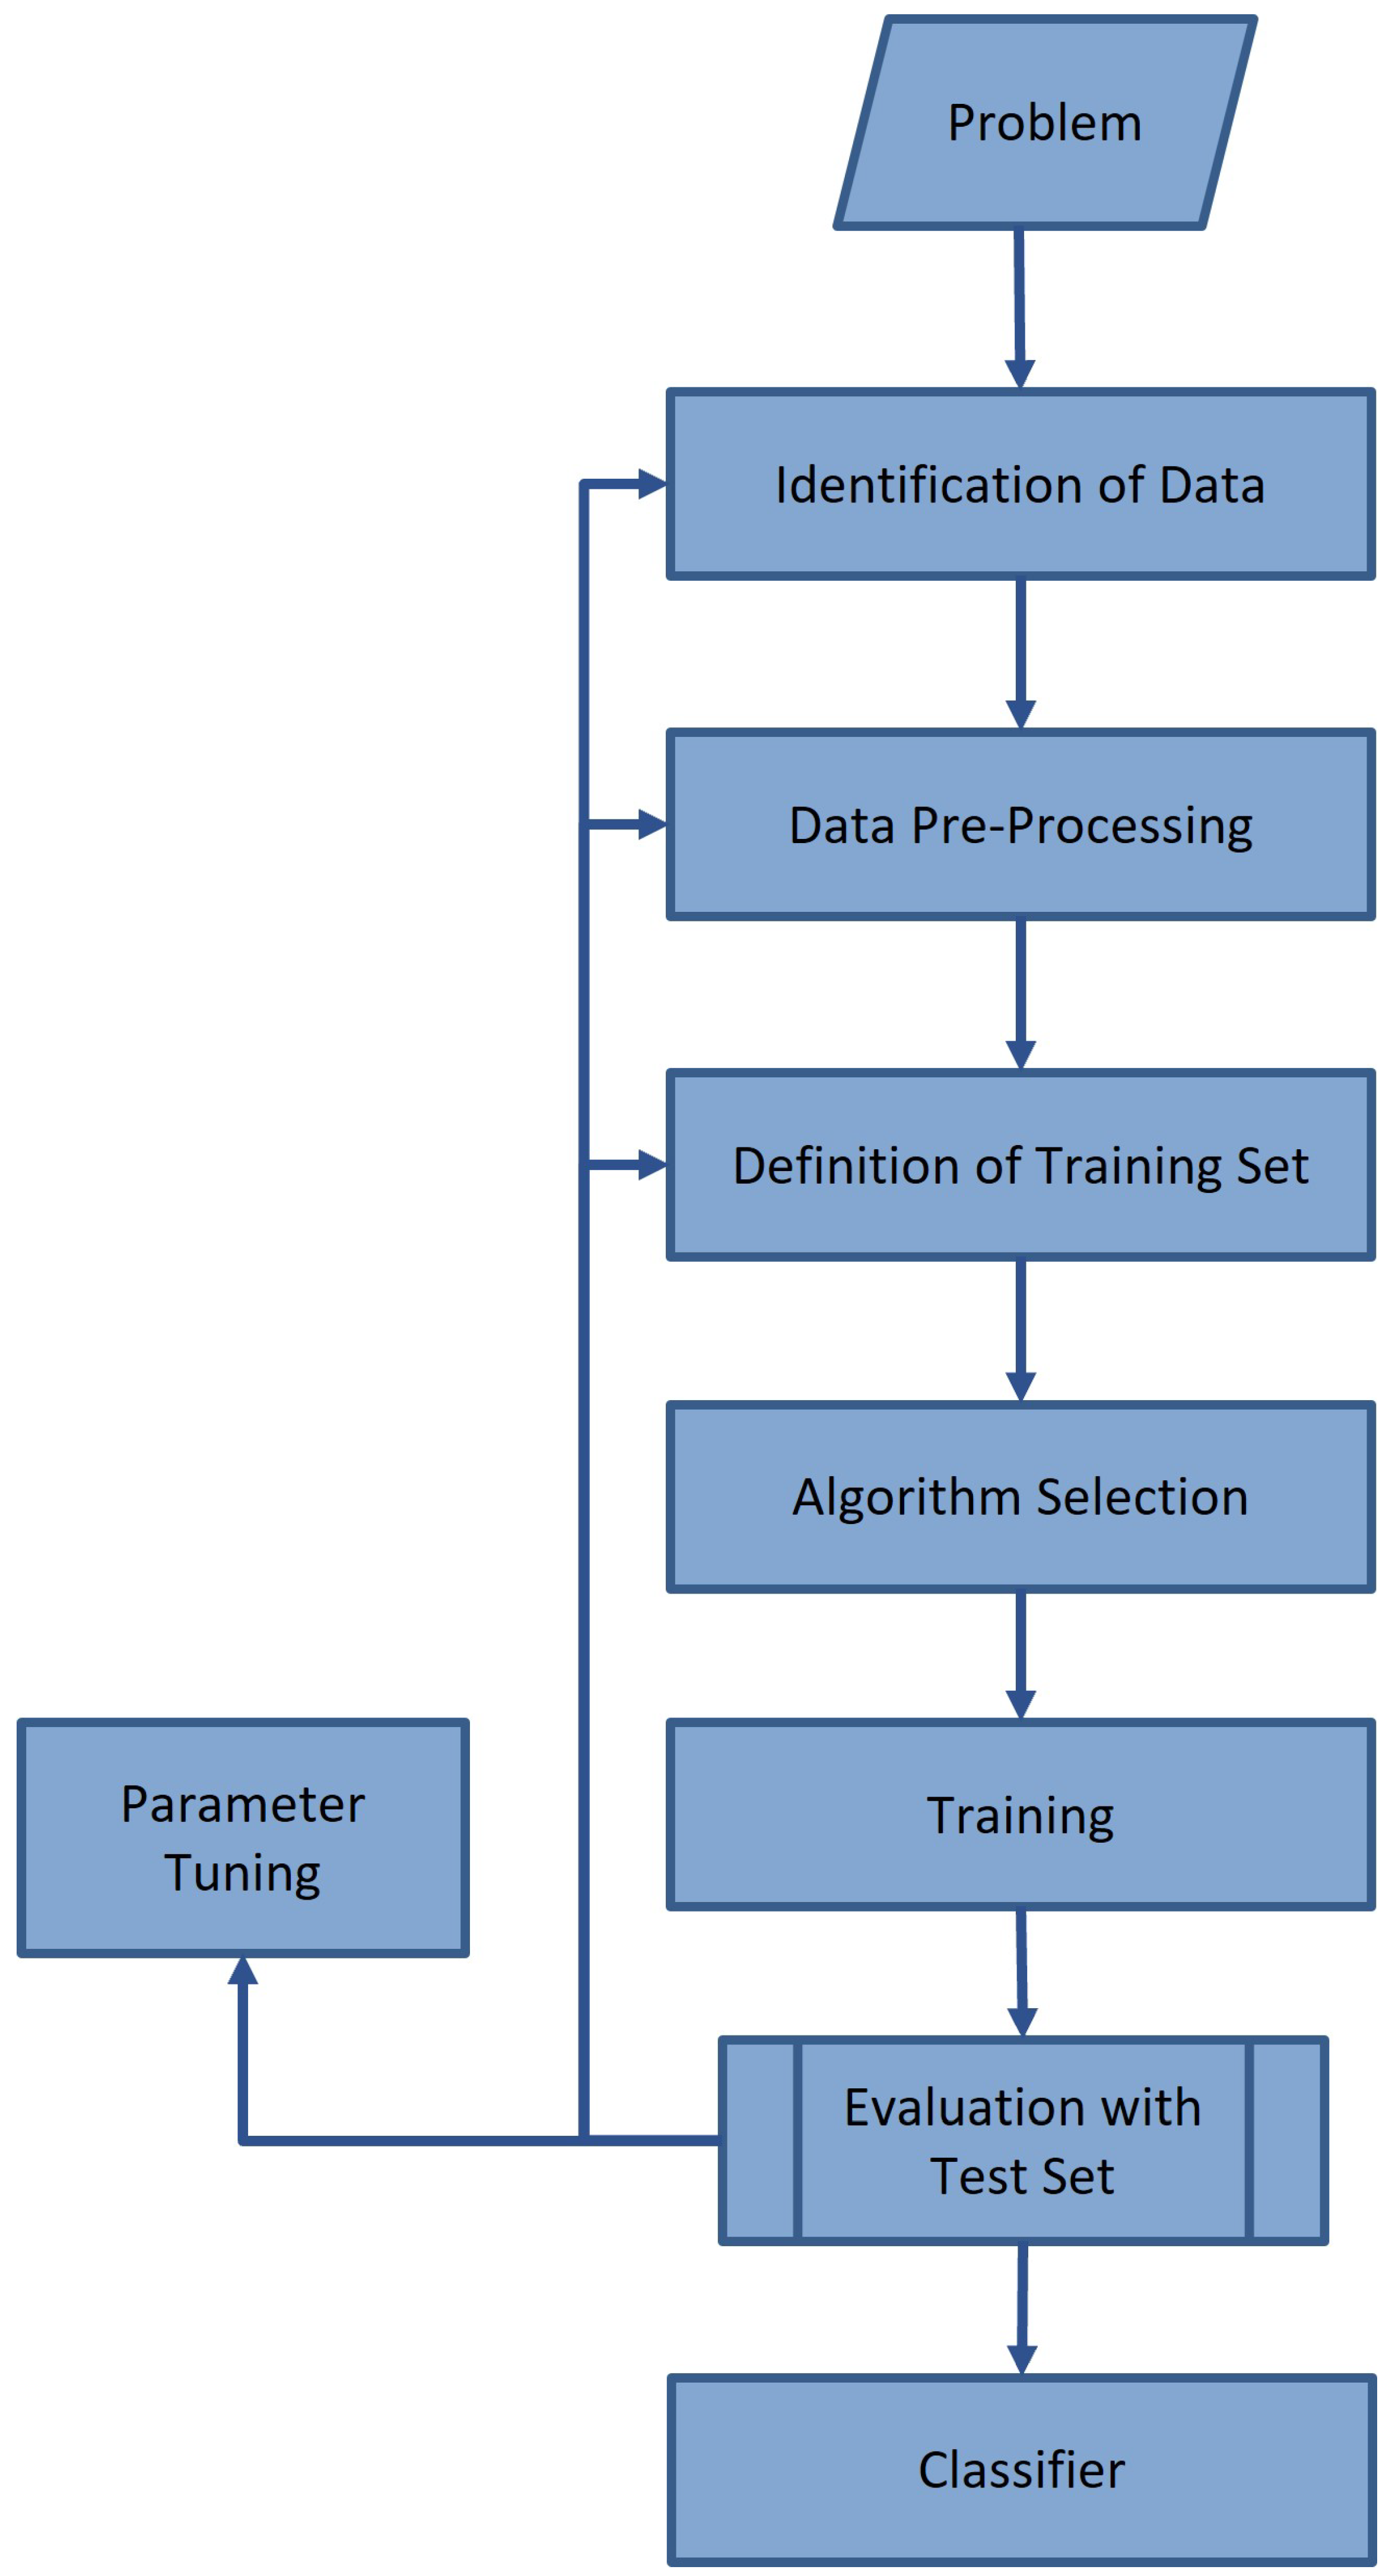
Artificial Intelligence (AI) is an emerging branch of data analysis, widely used when trying to obtain intrinsic relationships between data [27]. This is a new way of analyzing data to understand relationships. It utilizes machine learning algorithms as a prediction method. Machine learning algorithms can be broadly categorized into supervised learning, unsupervised learning, and reinforcement learning [19]. Supervised learning is a method that uses input data and data with correct answers (labels) to train a model. Using the training data, a predictive model is generated that could predict the correct output for a new input. The predictive model learns the relationship between a given input and output to generate a decision boundary [28]. A typical flowchart of a supervised learning algorithm in machine learning is shown in Figure 4. Based on this flowchart, here is how the study was conducted.
- Data collection: The input data required for training and the correct answers (labels) are collected. The data required for training for both yield and tact times are the master data consisting of existing baseline information. The correct answer data are calculated based on the performance.
- Data preprocessing: The collected data are processed into an analyzable form, and the necessary preprocessing tasks are performed. These methods include data cleaning, attribute scaling, and outlier handling. The statistical program R is used to organize the horizontal database data into vertical data. This is the means by which the features are represented as columns in a model, wherein each row represents a data point. When converted into vertical data, the features are placed in columns corresponding to the model input matrix. This makes it suitable for the model to process the data. The obtained yield and tact-time training data are organized into vertical data by type. In machine learning, the processing of vertical data has the advantage of standardizing the data structure. This facilitates their application to various models and libraries.
- Select/extract attributes: The attributes required for training are selected or extracted. In this step, one can analyze the characteristics of the data and select important features or extract new features. In this study, information such as ITEM and RESOURCE is extracted from the machine learning calculation because these are not directly related to the target data calculation. Moreover, the data to be included in the calculation can be selected.
- Select a model: The best model for the given problem is selected. The M5P algorithm provided by Weka (a Java machine learning library) is used in this study.
- Train the model: The selected model is trained using the training data. During the training phase, the model learns the relationship between the input data and correct answers (labels) for that data so that it can make predictions.
- Evaluate the model: The performance of the trained model is evaluated. This is accomplished by examining the model’s prediction results using test data and calculating the evaluation metrics. The main evaluation metrics are the accuracy, precision.
- Apply the model: The trained model is applied to new data to make predictions. The results of the predictions for new data are applied to accomplish the objective. In this study, the data predicted by machine learning are incorporated into the master data to generate a new production plan.
This study calculates two target master datasets by analyzing the performance information and predicting their values using a supervised learning algorithm, in conjunction with their corresponding target values.
3.2. M5P Algorithm
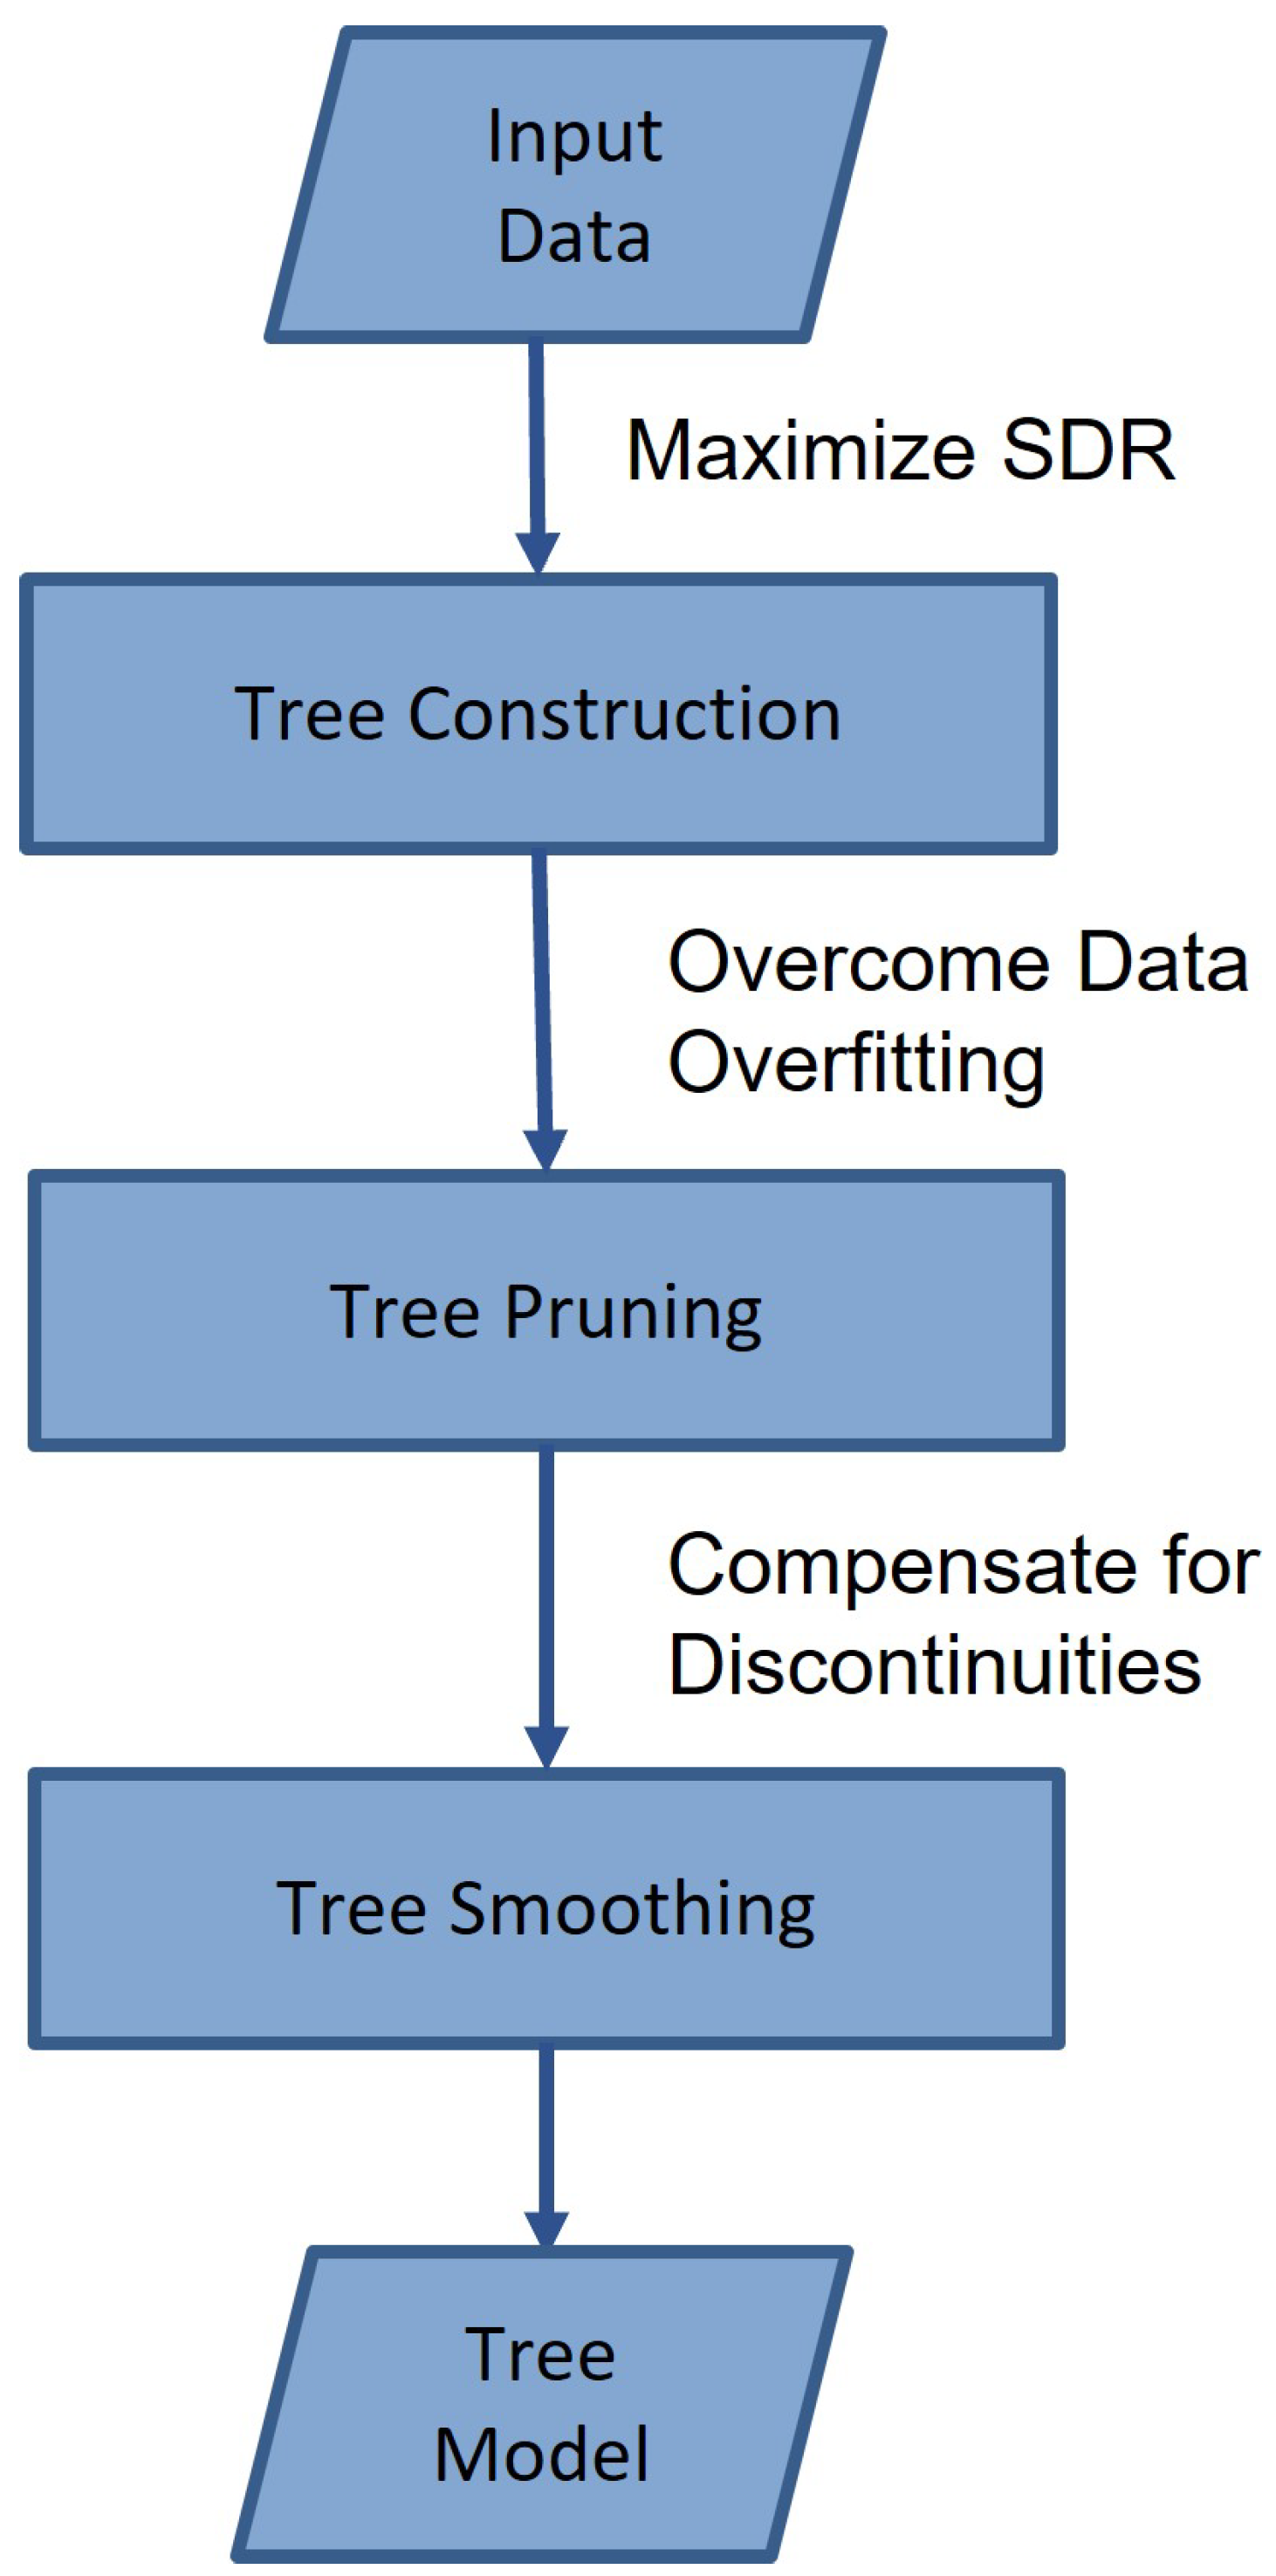
The M5P algorithm has the following features and benefits. It has advantages in handling categorical features (categorical variables). The algorithm includes a way to handle categorical variables internally, so they can be directly included in the predictive model without the need to preprocess the data. This simplifies the model development process and saves time. It also allows the user to automatically determine appropriate bifurcation points to account for different levels of categorical variables to achieve optimal predictive performance. The M5P algorithm typically has a faster execution speed than other complex regression algorithms. It is useful for small-sized datasets or in situations with time constraints. Applying the M5P algorithm also allows the relationship between data and rules to be described and analyzed, to predict the numerical characteristics of the target variable [30]. One of the main advantages of model trees is that these can efficiently handle a large number of datasets with many attributes and dimensions. These are also known to be robust when addressing missing data [31]. These two features are the main reasons that this algorithm was selected for this study. The capability to rapidly process large amounts of data with missing and volatile information, and achieve predictability is important in daily production planning. As shown in Figure 5, there are three major steps in developing an M5P tree: tree construction, tree pruning, and tree smoothing. The M5 tree construction process attempts.
- 1.
- Tree Construction: The M5P algorithm constructs a regression tree by recursively partitioning the training dataset based on the attribute values. The splitting process aims to find the attribute that provides the best split, often based on criteria such as information gain or variance reduction. The algorithm continues splitting until a stopping criterion is met, such as reaching a minimum number of instances per leaf or a maximum tree depth. The constructing process attempts to maximize a measure called the standard deviation reduction (SDR) [32].
- 2.
- Model Pruning: Pruning is an optional step that aims to simplify the tree and reduce overfitting. Pruning techniques, such as subtree replacement or subtree raising, can be applied to remove unnecessary branches or nodes from the tree without significantly affecting the performance. Pruning helps to generalize the model and improve its predictive capabilities on unseen data.
- 3.
- Tree Smoothing: The M5P algorithm trains a linear regression model on the leaf nodes during the process of constructing the model tree. The predicted value at each leaf node is calculated based on the conditions at that leaf node. However, the model tree may be too complex or tend to overfit the data. To address these issues, tree smoothing is used. Tree smoothing is a way to increase the smoothness of predictions, and it involves combining the predictions of a leaf node with the predictions of its parent node, with some adjustments. This reduces the volatility of the predictions and allows the complexity of the model tree to be controlled. By regression, the final value is smoothed by combining the current value with the predicted value from the linear regression as the following Equation (2).where is the predicted value shift to the higher level of the next node, N is the total number of training instances that shift to the next lower node, is the predicted value shifted from the lower node to the present node, A is the predicted value by the node at this node, and K is a constant value [33].
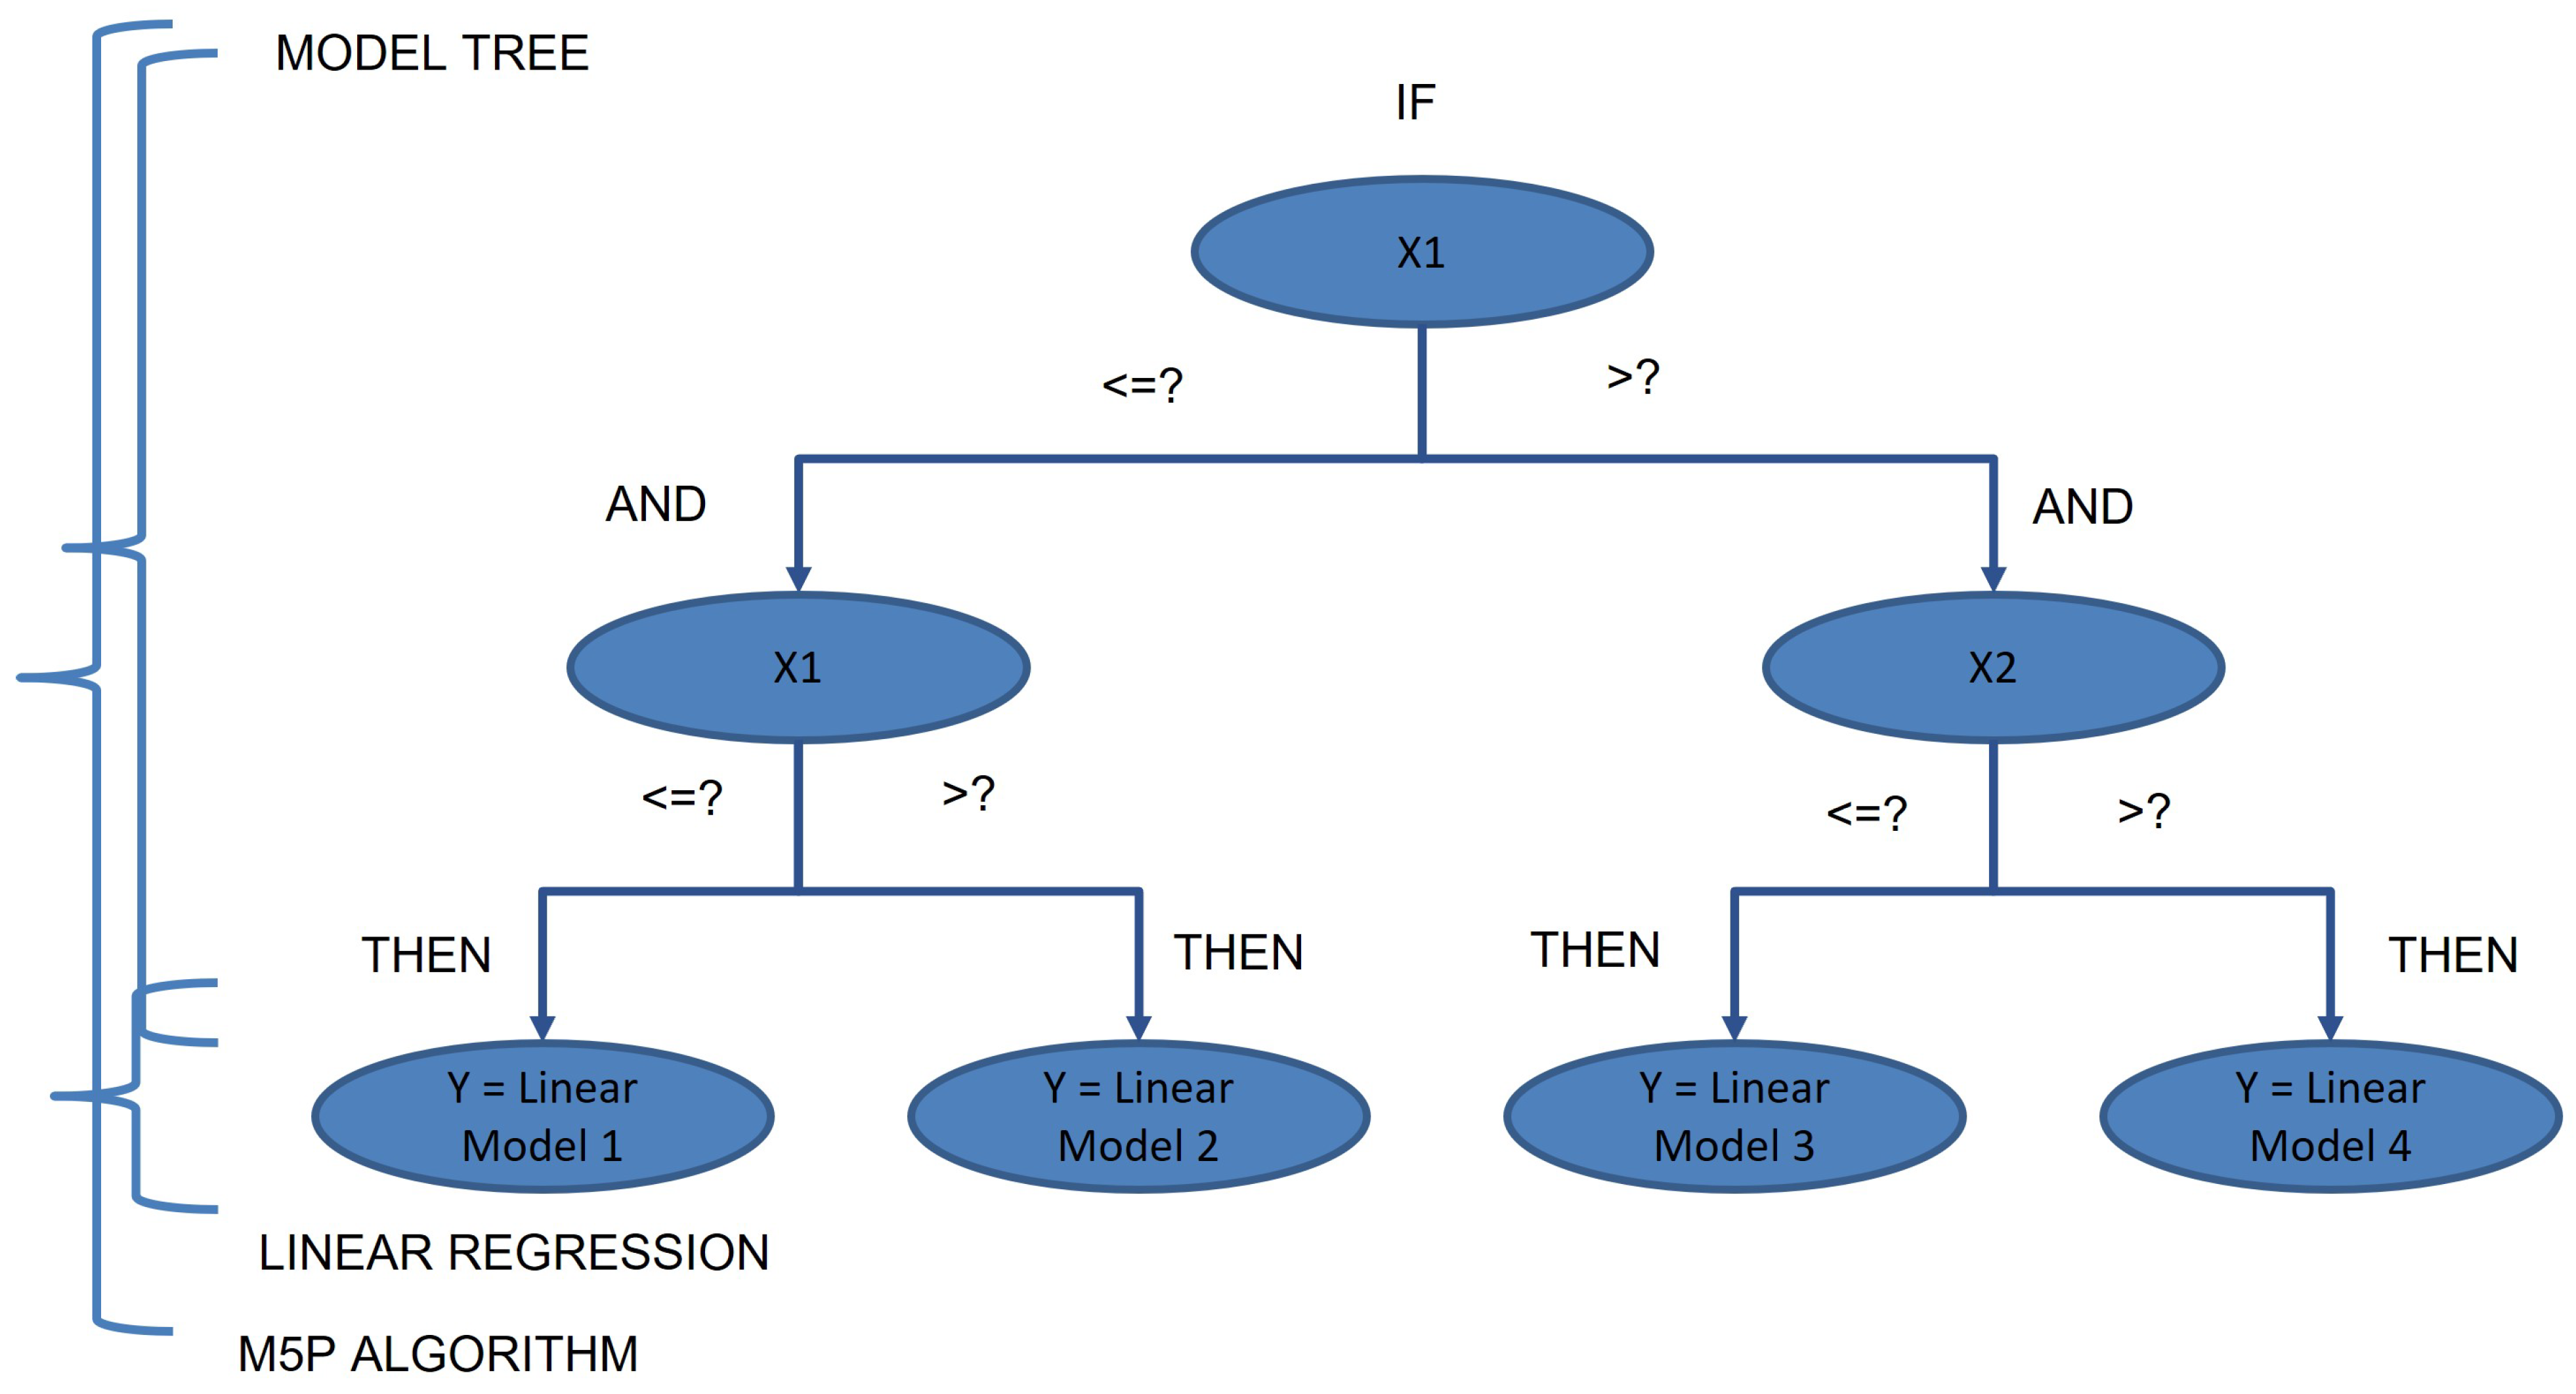
In Figure 6, the M5P algorithm can perform both regression and decision trees. Pruning allows nodes to include linear models instead of constant values. The M5P algorithm is an algorithm for solving regression problems which is used to predict a continuous output value from given data [34]. Create a decision tree to make a classification, and then create a linear model for the nodes. The tree is constructed based on the features of the data, and prediction is performed by dividing the data according to the conditions. The leaf contains a linear model, which can express the linear relationship between the features of the data and the target [35].
The “Unpruned” option is set to false, which means that pruning is enabled. In general, pruning allows the model to be more concise and provide more generalized results. Pruning is a technique for reducing the complexity of a model by removing unnecessary branches from a tree model.
Figure 5.
M5P Algorithm Training Process Flowchart.

Figure 6.
M5P tree algorithm.

3.2.1. Linear Regression
A linear regression algorithm is a regression analysis technique that models the linear correlation between a dependent variable (y) and at least one independent variable (x). It can be a simple linear regression based on an explanatory variable or a multiple linear regression based on more than one explanatory variable [36]. It is called simple linear regression when based on a single explanatory variable, and multiple linear regression when based on more than one explanatory variable. Linear regression uses a linear prediction function to model the regression equation, and the unknown parameters are estimated from the data. Equation (3) a formula is a way to model a linear relationship, and a method is a formula expressed in vector form. The formula for the linear regression algorithm, where y is the predicted value, x are the input variables, are the weights for each variable, and b is the bias [37]. This form of a linear equation models a linear relationship between the input variables, where the weights represent the importance of each variable. The linear model uses the data to adjust the weights and bias as it is trained. Typically, methods such as Ordinary Least Squares or Maximum Likelihood Estimation are used to estimate the parameters of the model. Linear models are less affected by the scale of the attributes, so data preprocessing is relatively simple.
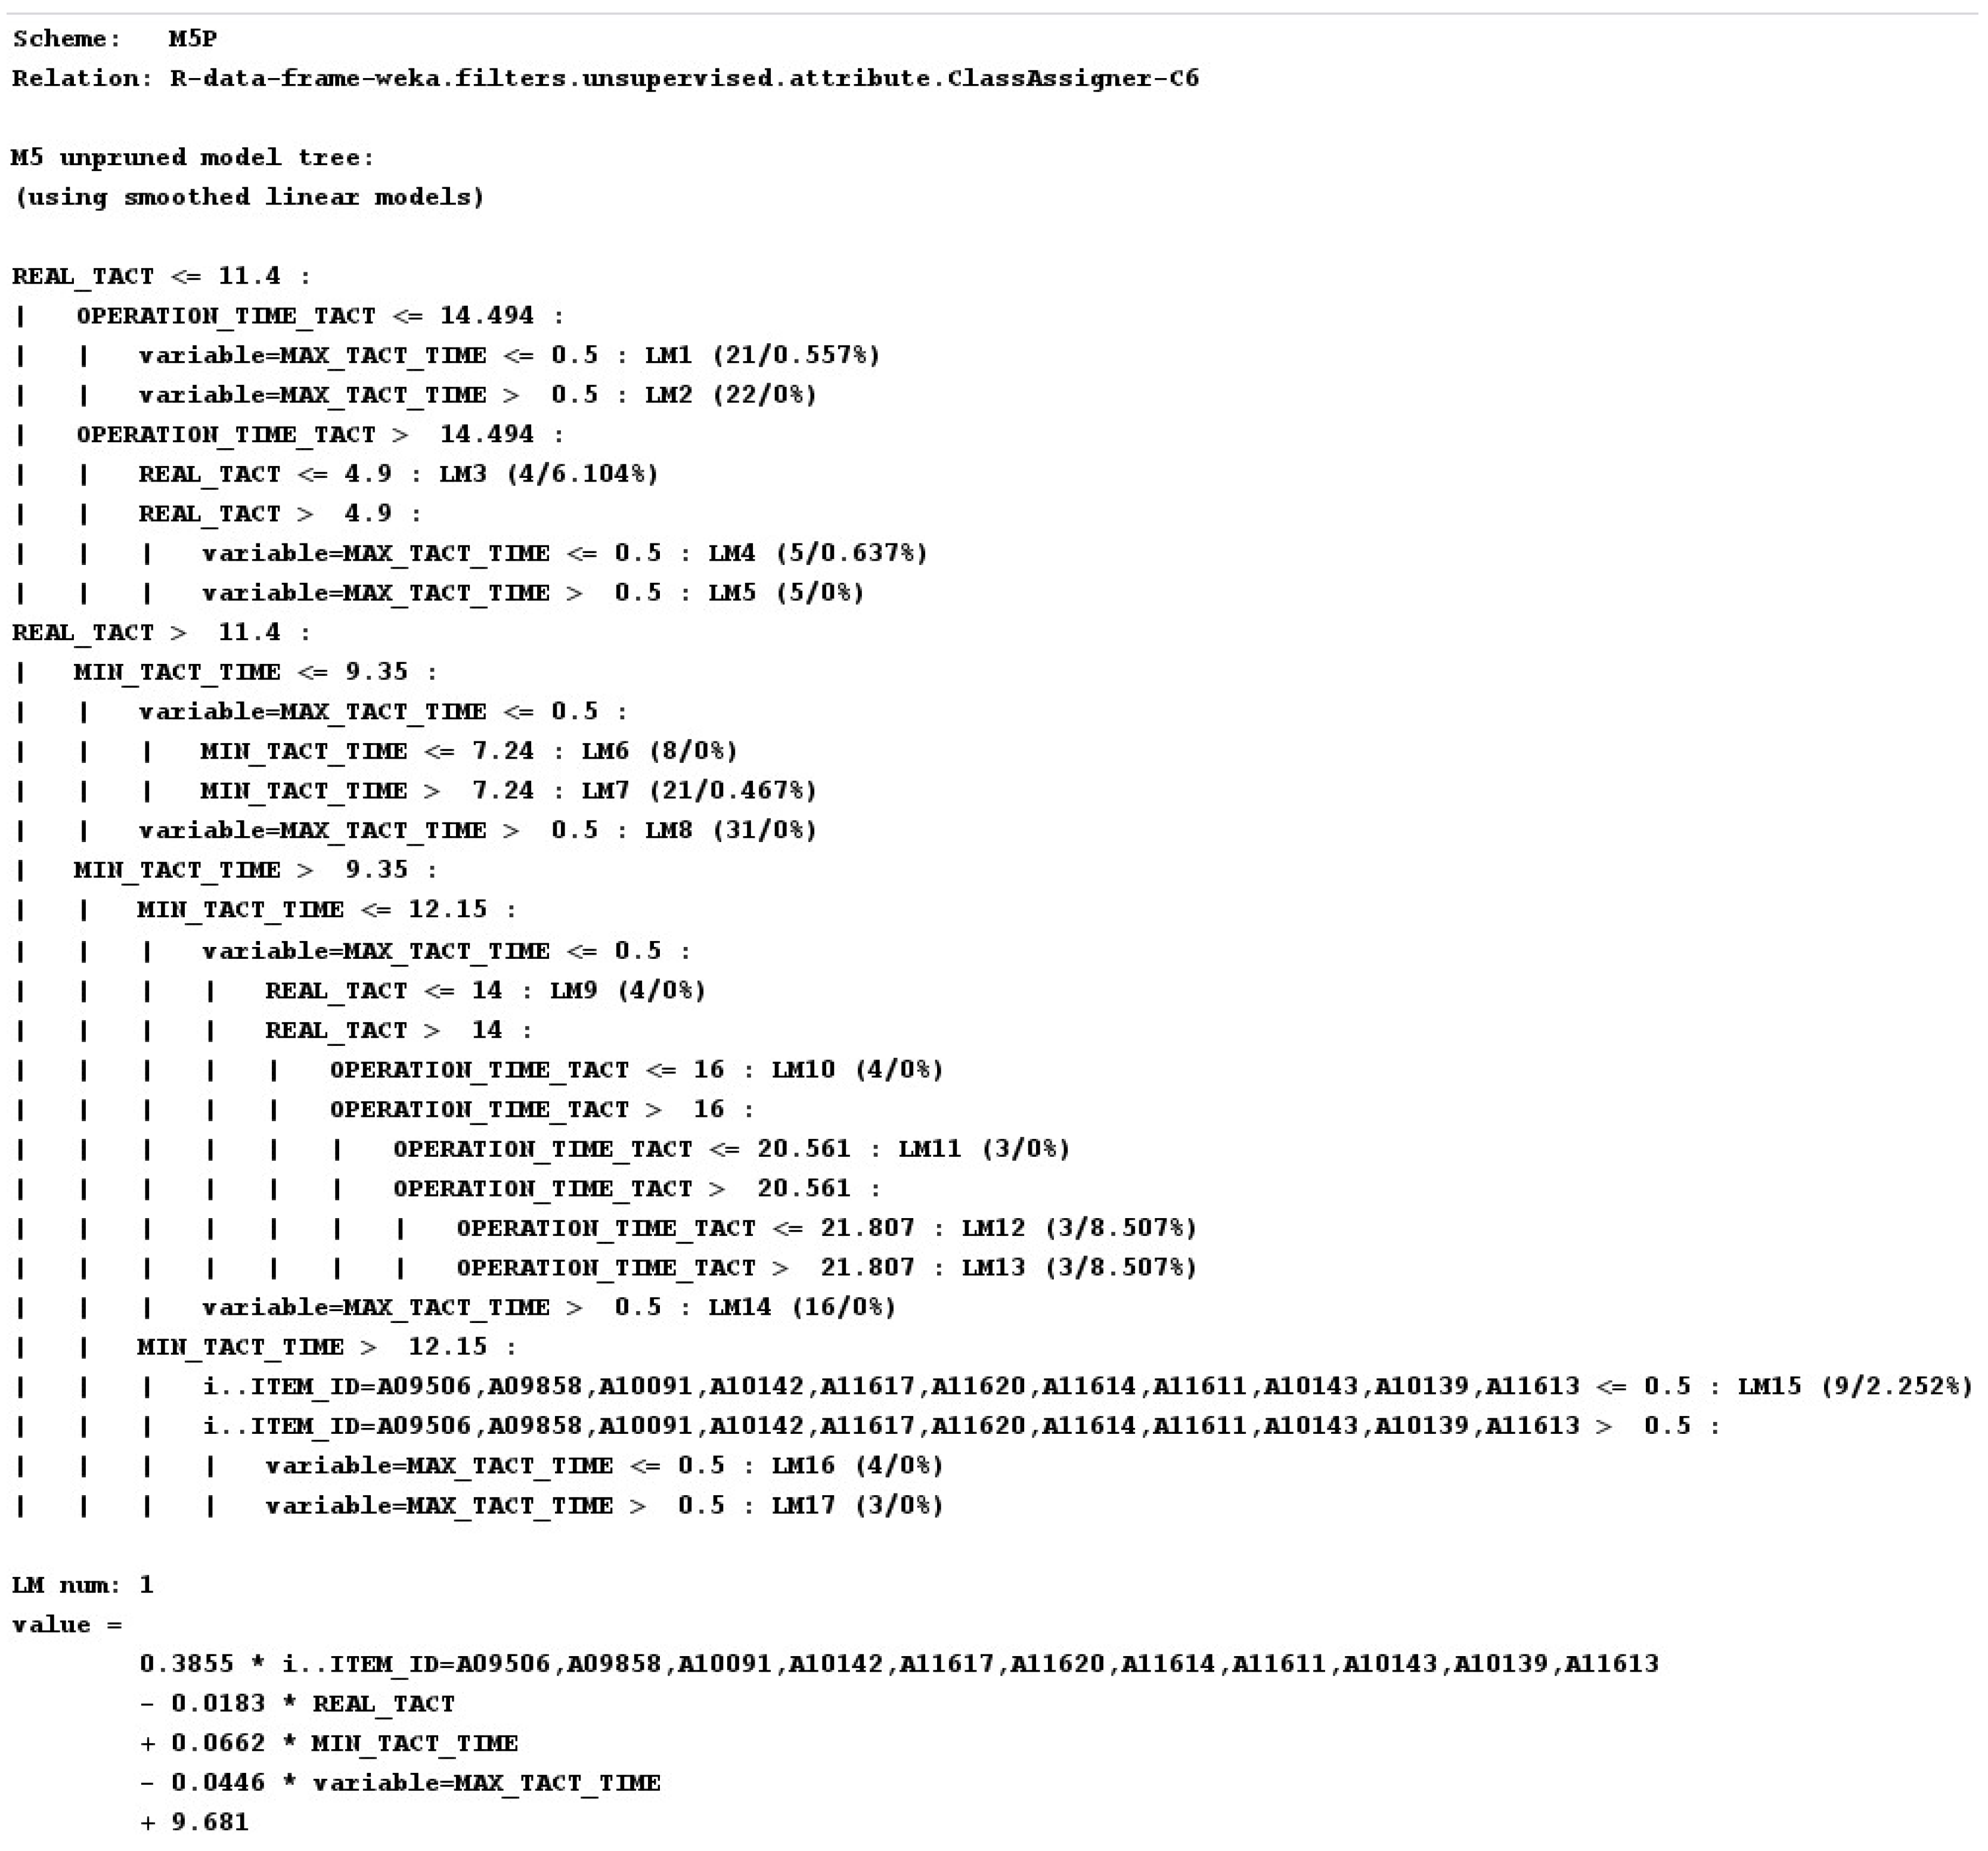
In this study, while generating a linear regression formula with tact time as the result of the M5P algorithm, the metadata included the RESOURCE ID and ITEM ID. Meanwhile, the feature was unspecified. Operation tact time, minimum tact time, etc. The target value was the real tact time. Based on these data, a linear regression formula was generated in the form of (3) to obtain the predicted value.
In this study, the results of the data applied to the production planning system were implemented through machine learning using a formula model (3) to predict the resulting data.
3.2.2. Decision Tree
When a decision tree is constructed, several branches may introduce variances in the training dataset owing to noise or outliers. This problem has been addressed as an overfitting in tree pruning, which uses statistical procedures to eliminate less accurate branches. It generally includes pre- and post-pruning [18]. Decision trees are among the most popular supervised learning algorithms used in machine learning. It learns decision rules based on the values of the attributes in the data and represents these in a tree structure [38]. The M5P algorithm is a type of decision-tree algorithm. It is a part of an algorithm called model trees, which works in a manner that is moderately different from that of decision trees. Unlike decision trees, the M5P algorithm trains and uses linear models at the leaf nodes. The hyperparameters of the M5P algorithm tree used by Weka are as follows:
- 1.
- Unpruned: This is a Boolean value that prevents pruning. The default value is false, indicating that pruning would be performed.
- 2.
- UseUnsmoothed: This is a Boolean value that prevents smoothing. The default value is false, which implies that smoothing is disabled.
- 3.
- MinimumNumberInstances: An integer value that specifies the minimum number of instances required on each node. The default value is 6. Setting it to a smaller value can increase the complexity of the model. In the M5P algorithm, “Minimum Number of Instances” is important hyperparameters used to control the complexity of the model [39]. These can be adjusted to improve the performance of the model.
- 4.
- BuildRegressionTree: This parameter is used when generating the regression tree and is set to a boolean value. The default value is true.
- 5.
- Max saveInstanceData: This parameter is a boolean value that determines whether to save the training data. The default value is false, and if set to true, training data are saved.
Decision Tree is used as a classifier for the M5P algorithm used in this study. The decision tree provides a structure for pruning unnecessary data and resolving overfitting based on the characteristics of metadata, such as ITEM ID and RESOURCE ID.
3.3. Production Plan System
Prior to the concept of SCM, companies connected various processes such as production, logistics, and accounting. Production, logistics, finance, accounting, and so on share information and resources through ERP systems [40]. However, as the supply chain complexity increases, a new system for managing the planning process becomes necessary. As a system to manage production planning, it was introduced with the characteristics of an advanced planning and scheduling (APS) hierarchy. The APS system is used to develop a production plan based on these two characteristics and existing data. The supply chain can function as a solution to multiple planning problems by optimizing goals and constraints through a model definition of the plan [41]. The master data (which contain basic information related to products, inventory, production facilities, supply chains, etc.) play a highly important role in production planning and management. This directly affects the accuracy and efficiency of production planning. Maintaining accurate and updated data and formulating production plans based on these improves the accuracy and flexibility of production schedules and enables effective inventory management and efficient supply chain operations.
In this study, a production plan was established using the APS system by reflecting the master data predicted by machine-learning results. A comparison of the established plan with the existing plan provided indicators that can be used as a reference for comparing results that affect the availability of facilities, such as the input quantity.
3.4. Process Implementation Tools
The data for this study were obtained in the CSV format and preprocessed using the statistical program R. The machine-learning models were generated using Weka.
3.4.1. Weka
In this study, Weka was used to apply the machine-learning algorithms. This is an open-source platform for machine learning and data mining. It is used to develop and test machine-learning algorithms. It can perform various machine-learning tasks such as data preprocessing, classification, regression, and clustering [42]. Weka is written in Java and provides libraries that implement various machine-learning algorithms. It can be used to analyze data and construct predictive models. The M5P algorithm described was implemented in the library. The library allows for the application of machine-learning algorithms.
3.4.2. R
R is the programming language used for data analysis and statistical modeling. It is open-source software that provides users with the flexibility to perform a variety of sophisticated analyses. The statistical program R provides several advantages in machine learning. It provides a wide range of statistical techniques and functions. R is highly active in the machine learning and data science communities. Moreover, there is a community of users who share knowledge, information, and support for problem solving [43].
Given these advantages, R was used to preprocess the collected horizontal data. Additionally, a new data attribute was generated. It enabled us to exclude unnecessary data and group these. It can be plugged into Weka to use most features of R for data preprocessing.
3.5. Advanced Production Planning Methods for Manufacturing Processes
Production planning is an important step in planning and coordinating the process by which an organization produces a product or service. To increase the predictive power of the master data, we experimented with new technologies and approaches to produce more accurate and efficient results.
This study utilized a data-driven predictive model to forecast production requirements. Yield and tact-time data were used to generate predictions using machine-learning-based algorithms. Data were collected and analyzed. Predictive models can be used to forecast data, which can then be used to plan production. Based on the data collected, an APS system was used to establish a production plan. Various scenarios can be simulated during production planning, and an optimal production plan can be derived.
4. Experimental Settings up
4.1. Design and Implement Production Planning Changes
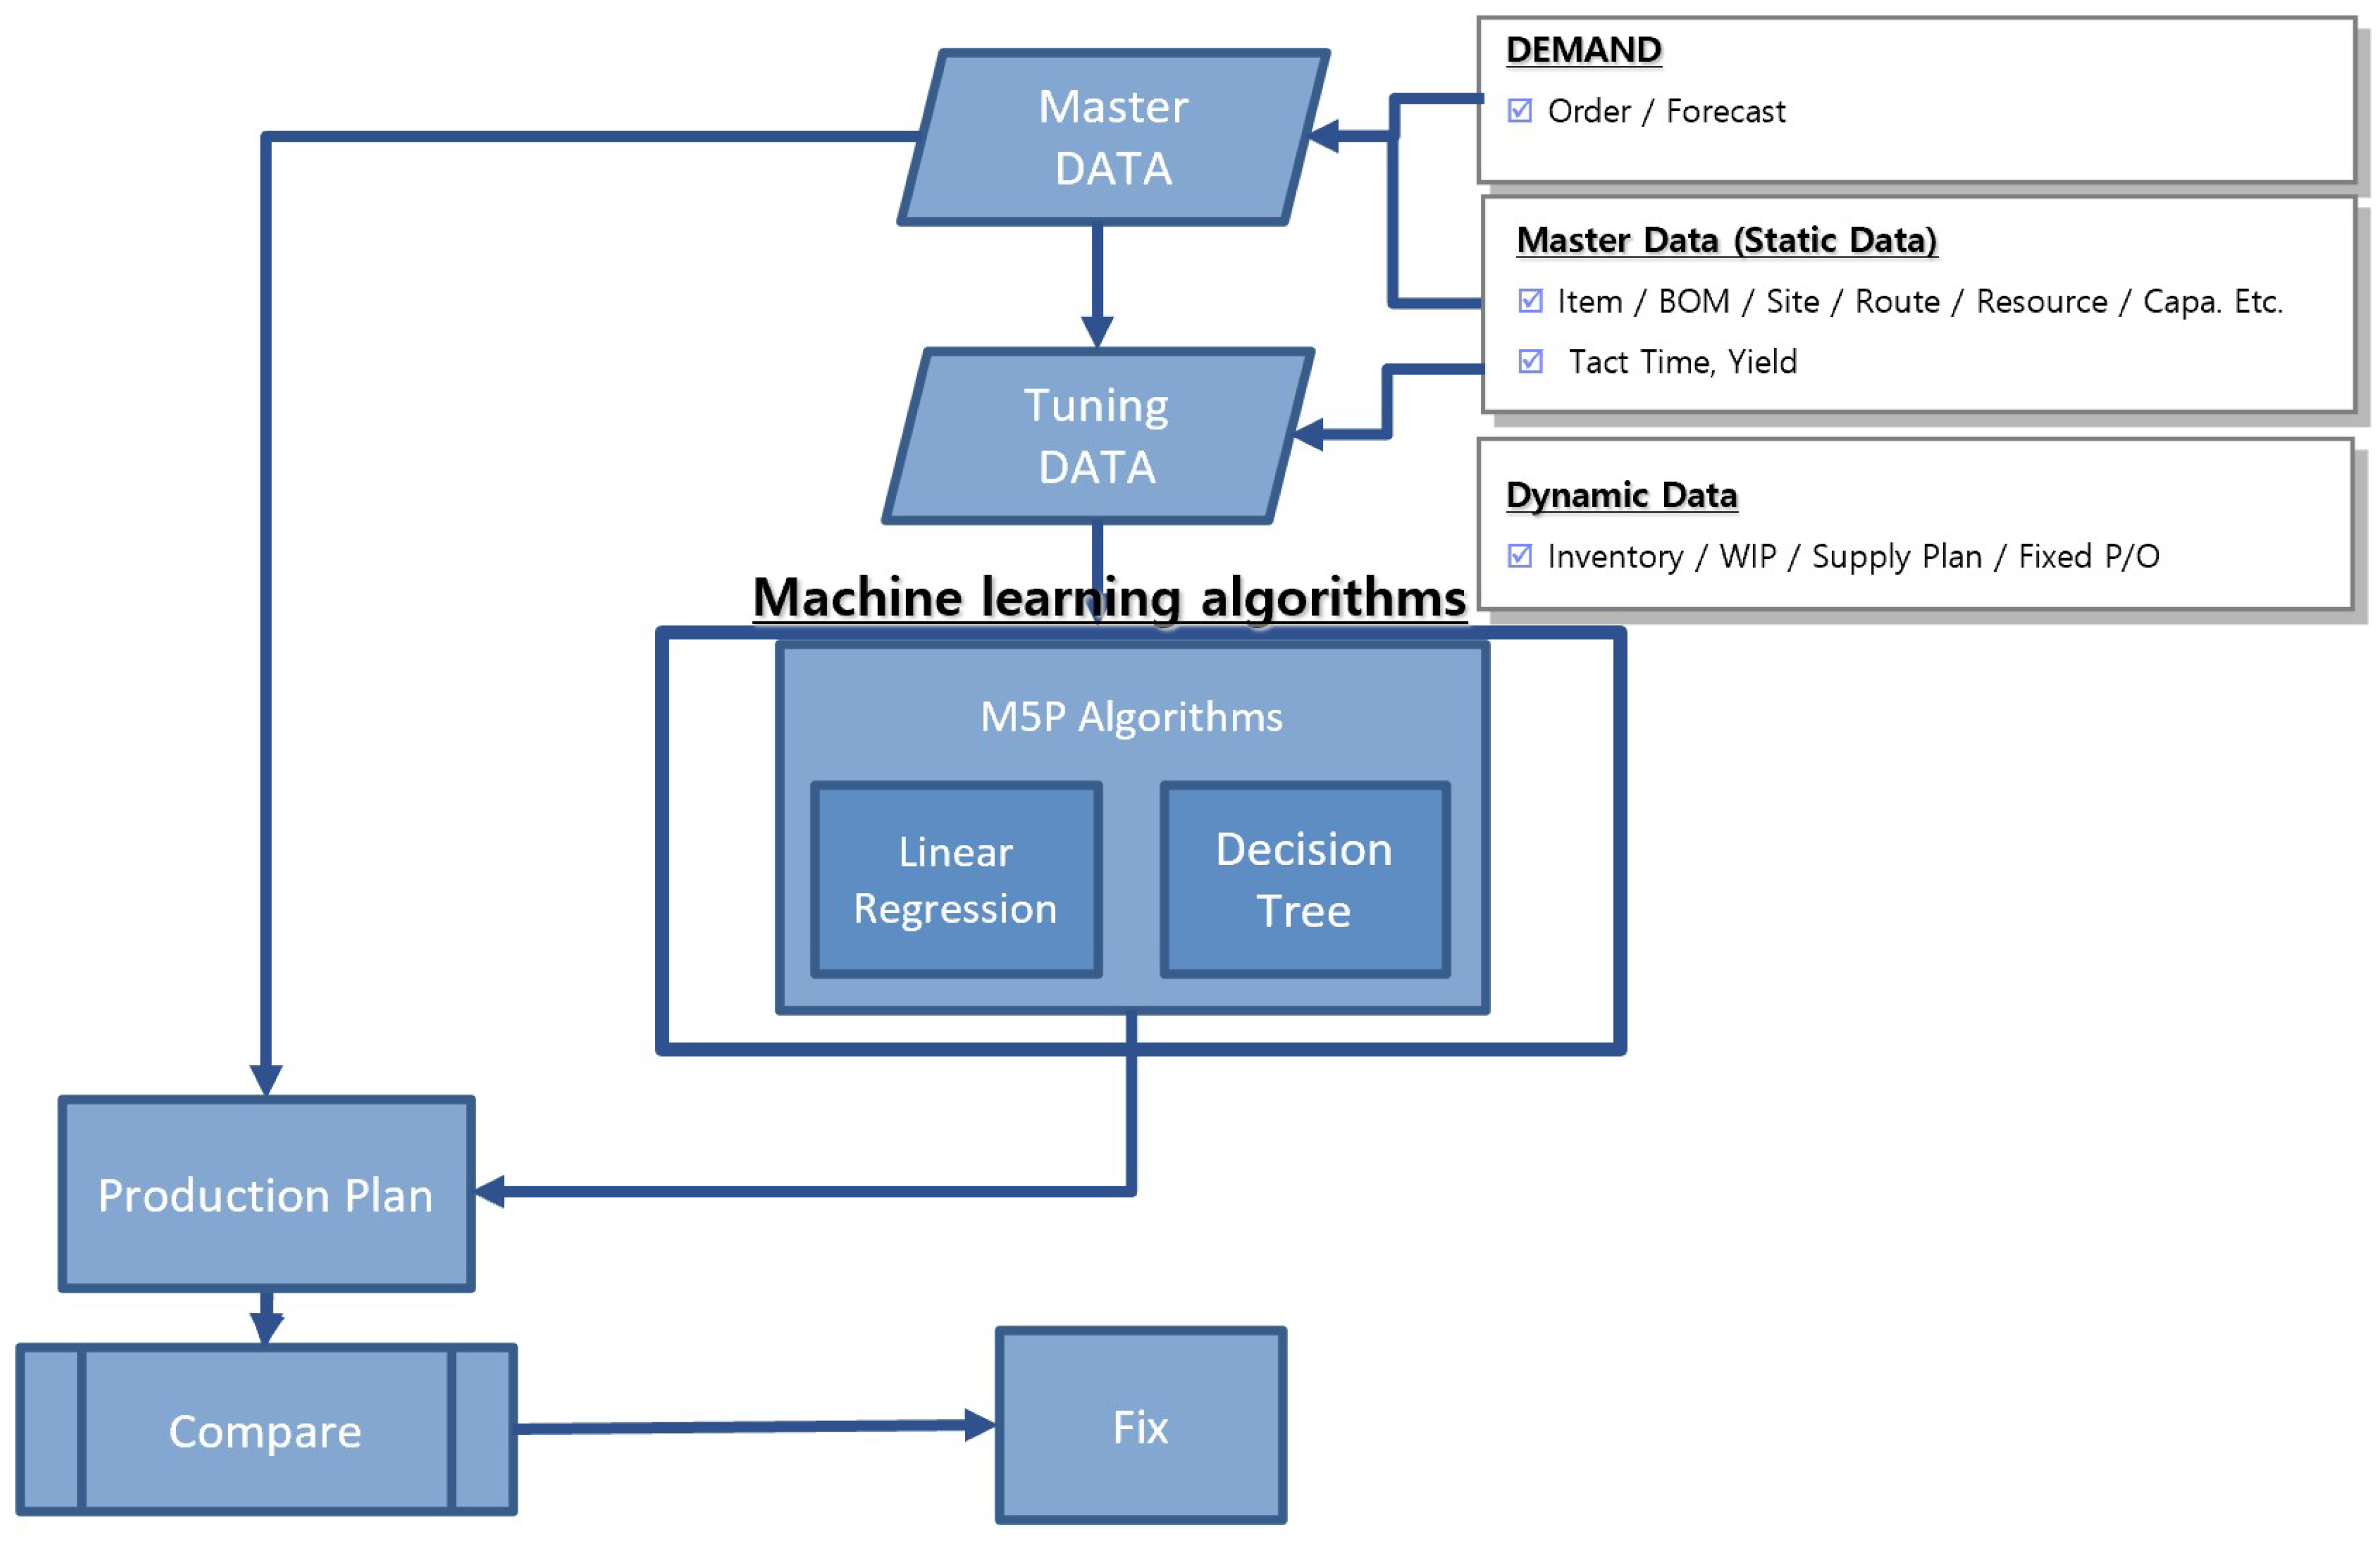
Production planning is the process of determining the resources and work schedules required to produce a product or service. In this study, production planning followed the flow shown in Figure 7. A production plan was established based on the data required for planning. This plan was based on the results of the existing interval planning method and the change dataset predicted by machine learning. This study proposed a process that provides an indicator for comparing two planning results and specifies a more reasonable plan. The master data, based on the flowchart in Figure 7 are obtained through PL/SQL and changed into a CSV file. Before applying the machine learning algorithm, the data were preprocessed using R. This involved classifying metadata, features, attributes, targets, etc., and separating the data into training and test sets. Planning through machine learning predictions was established by utilizing a production planning solution. Create a production plan that results in the database and compare the plans using PL/SQL.
4.2. Development Environment
The machine learning model implementation environment works on a laptop. The hardware environment for machine learning is shown in the table below (Table 1).
The environment in which the machine learning model was developed is shown in the table below (Table 2).
The programs implemented in Master Data Machine Learning Predictions were implemented in Weka.
4.3. Implementing a Machine Learning Model
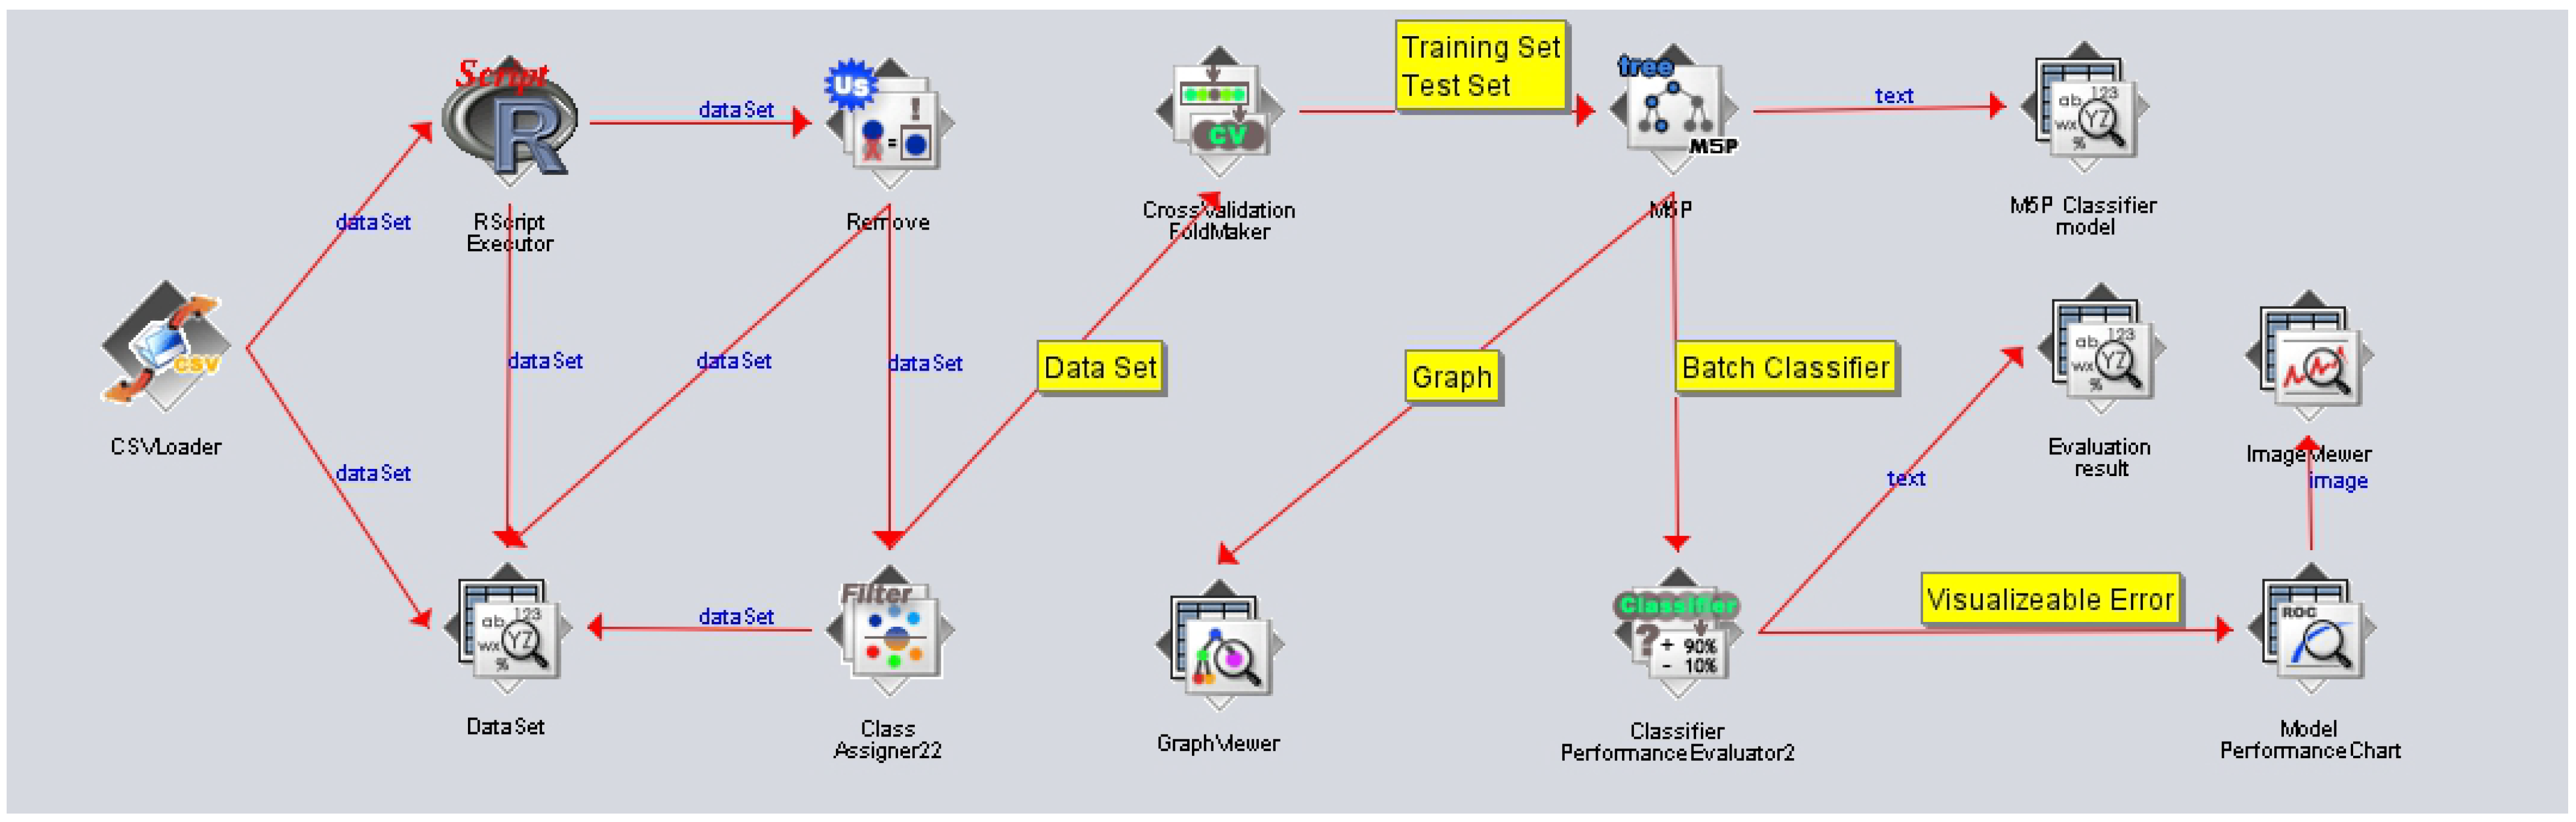
Figure 8 is a flow chart of a machine learning application implemented using Weka. In the flow chart, check the order of preprocessing, training data, test data, classification, applying machine learning algorithms, and applying classifiers.
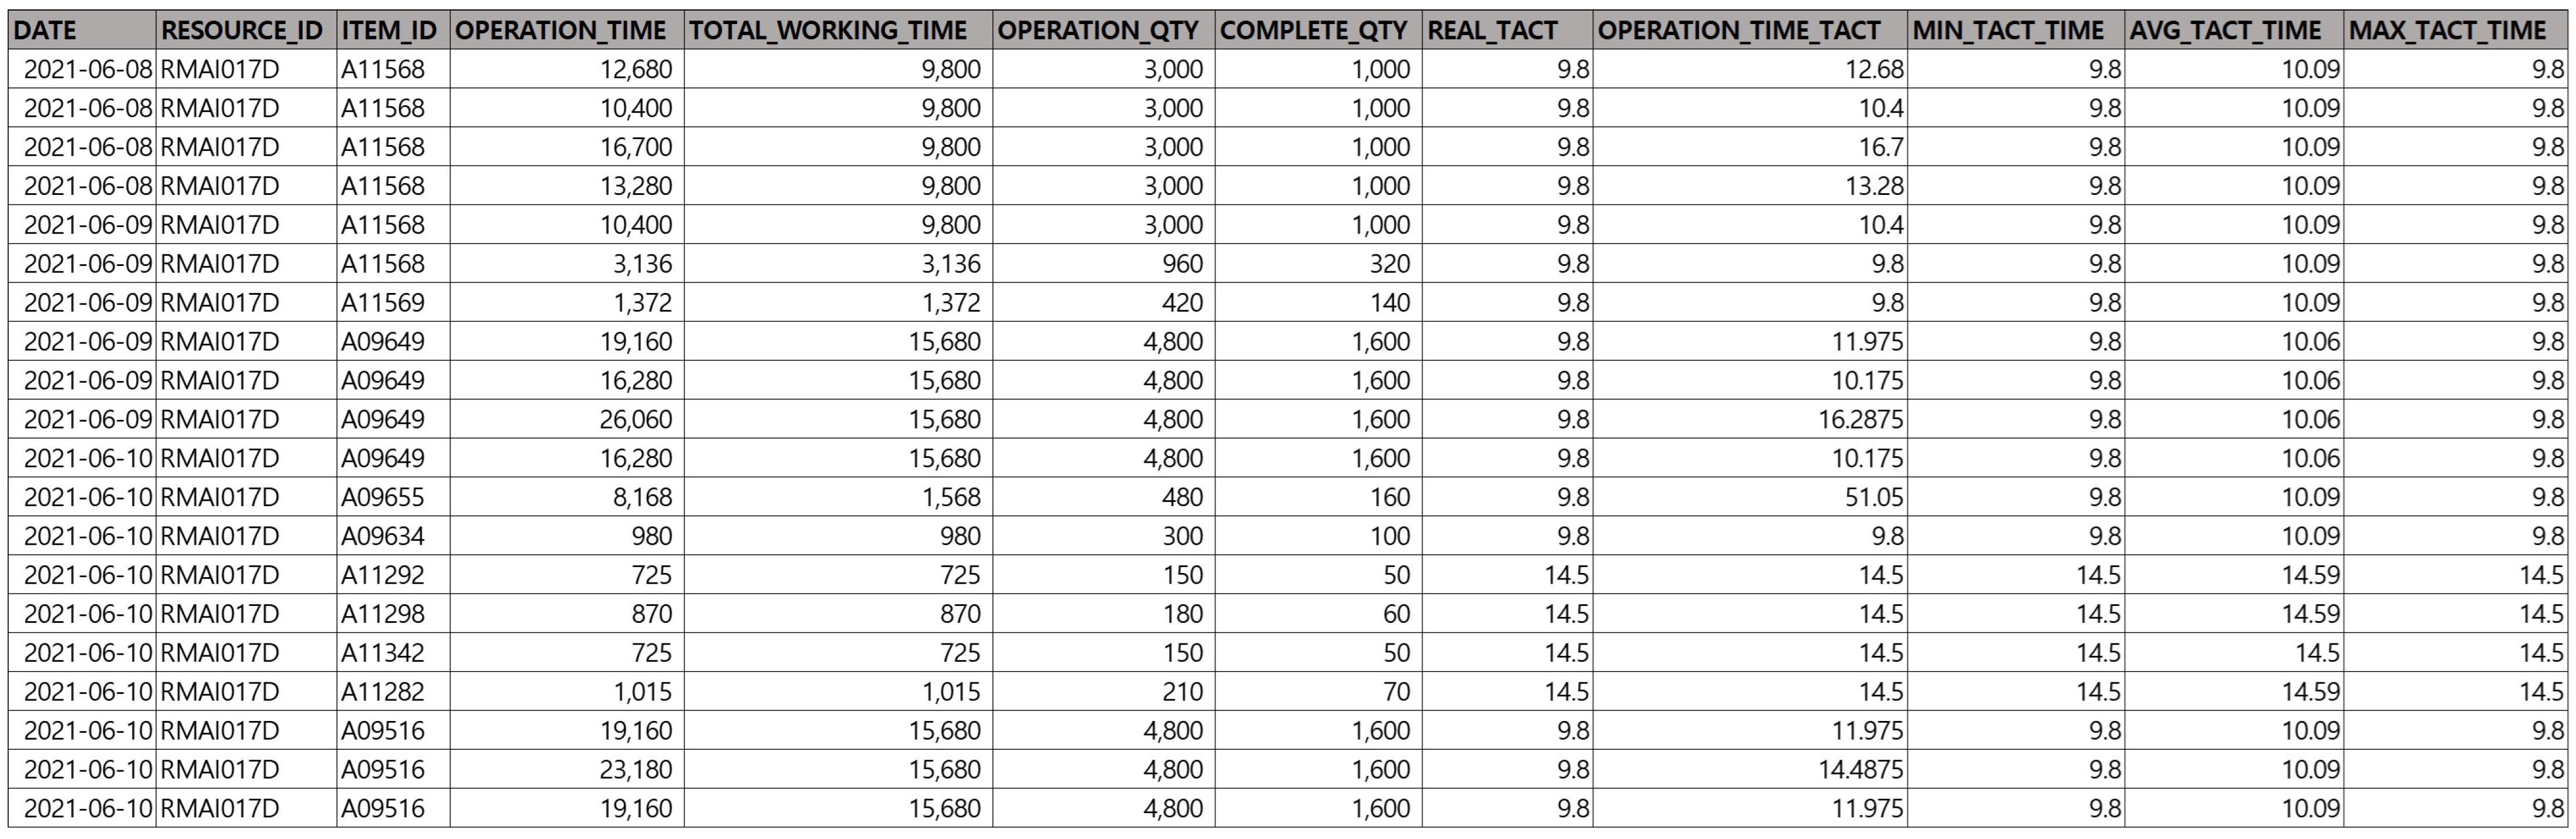
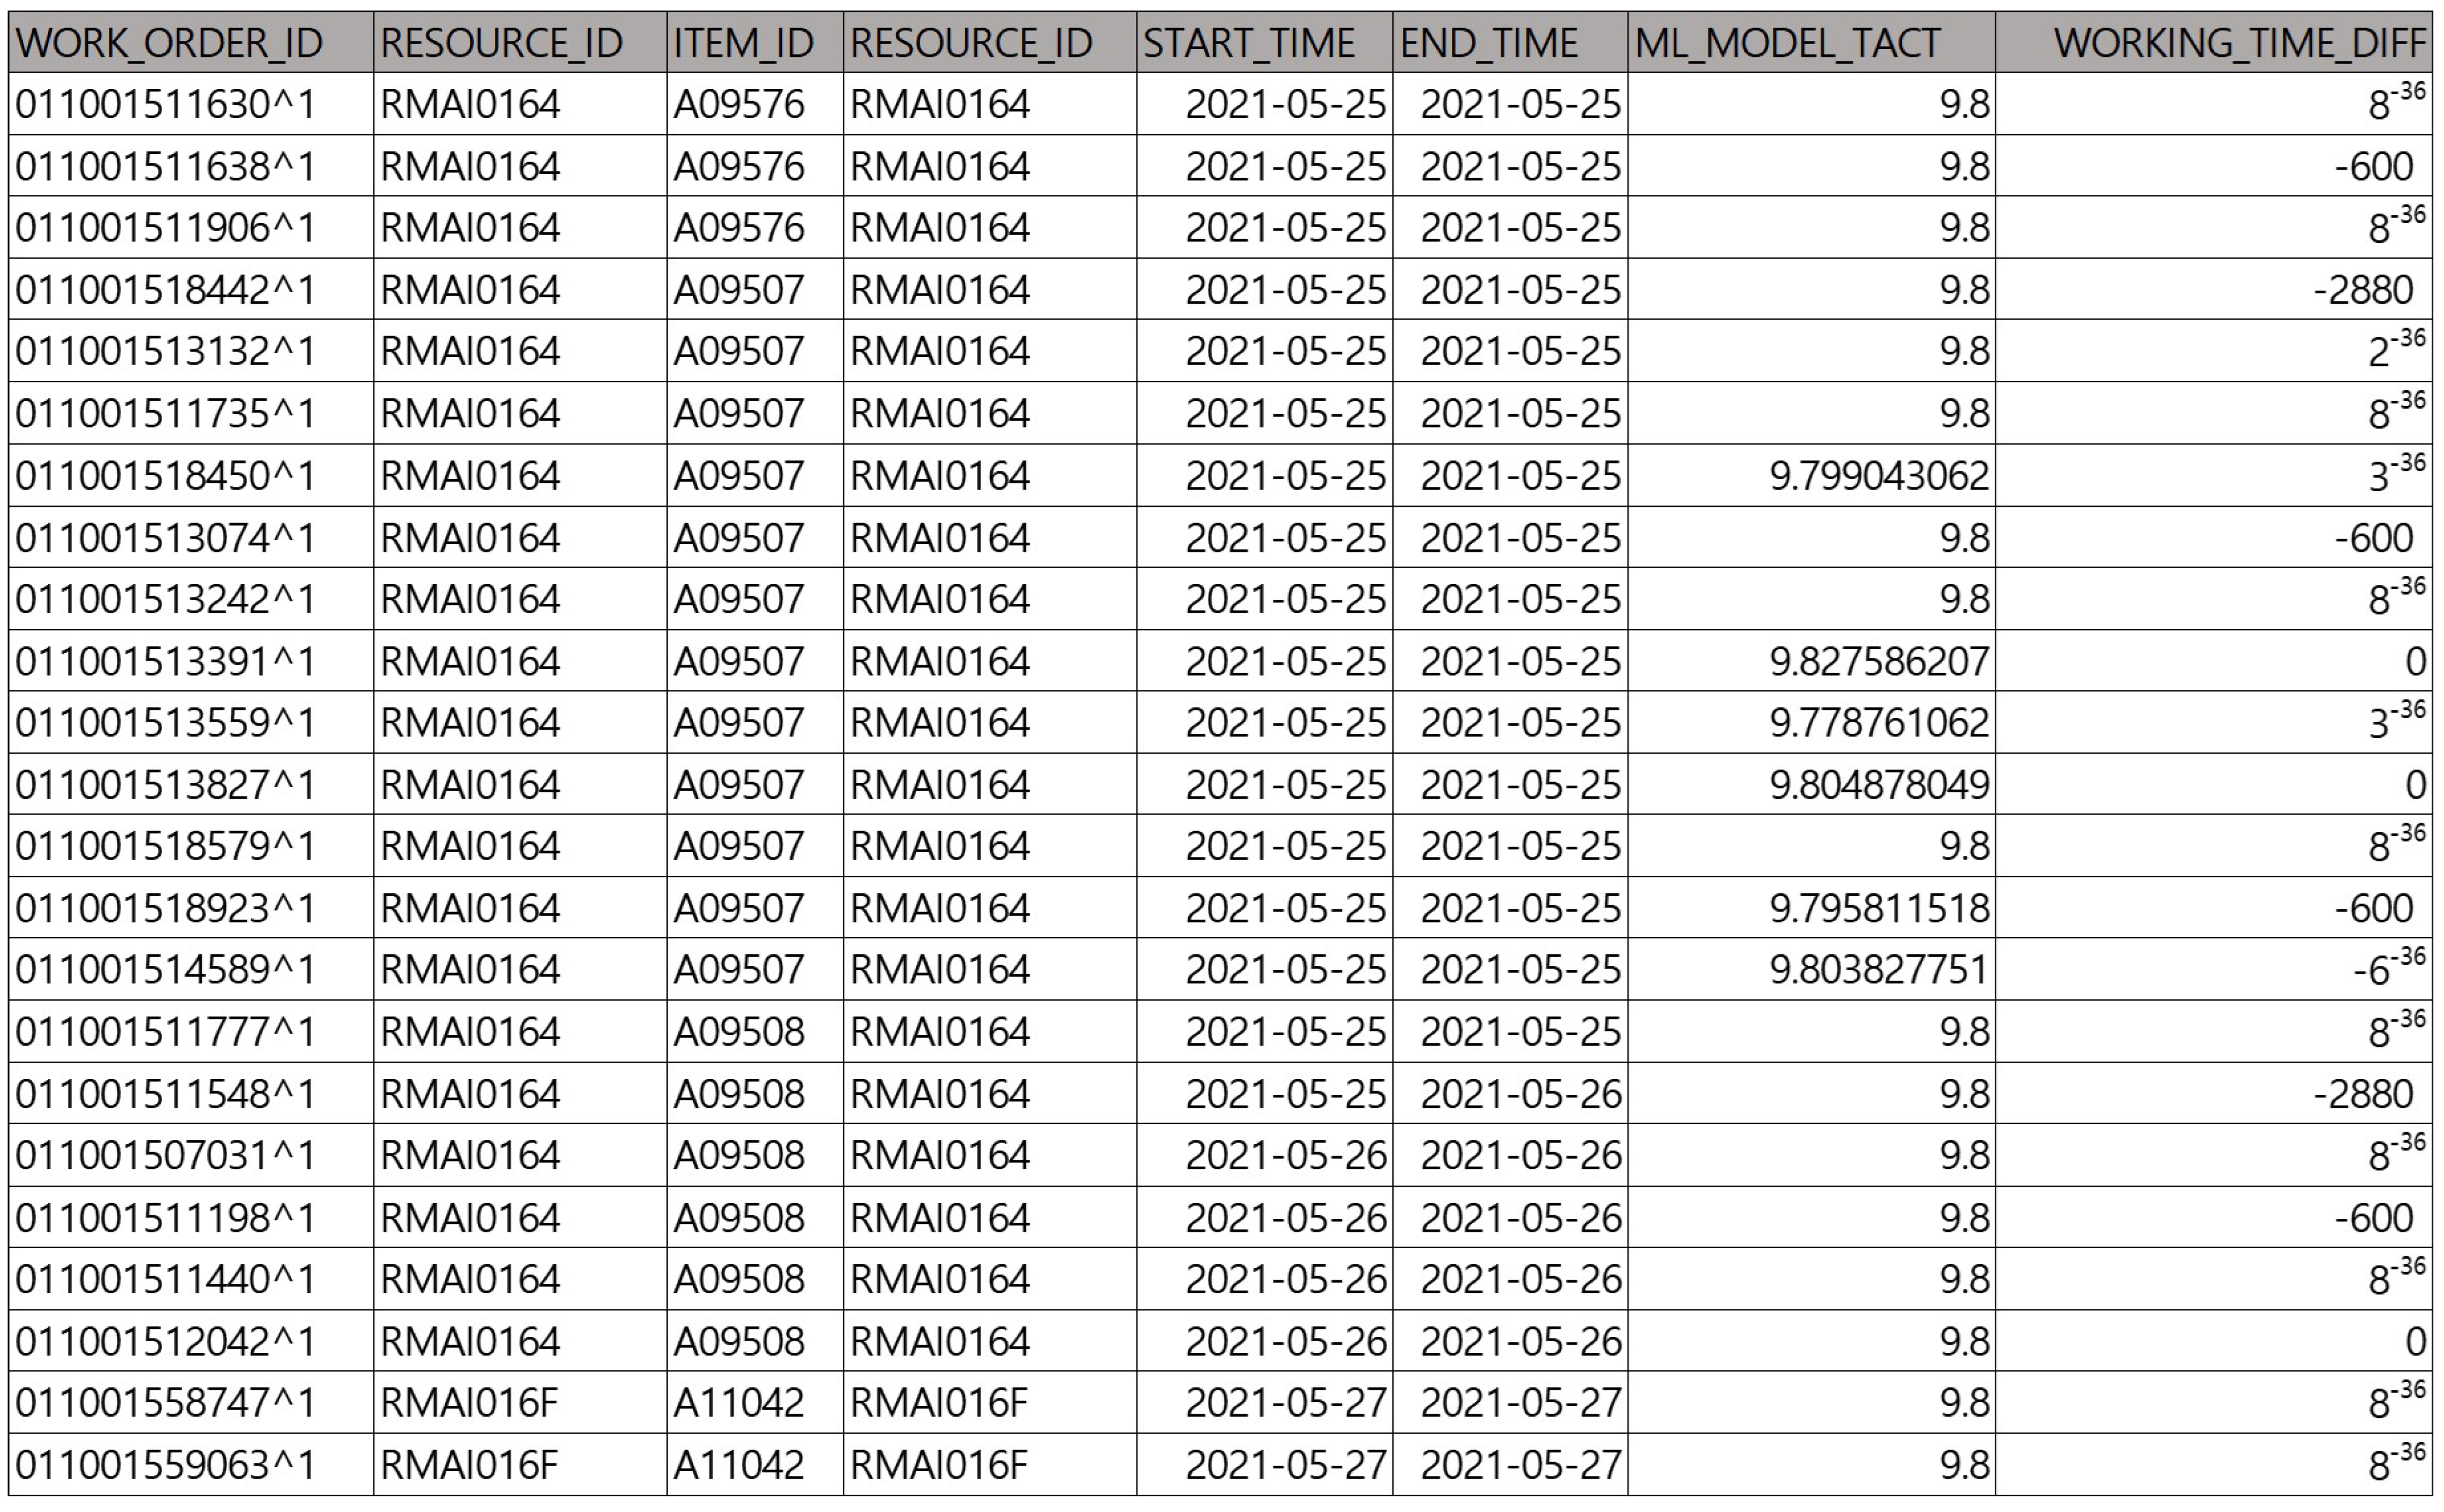
The input data consist of master data required for production planning. Among the many master data, yield and tact time data are specified in this study. We extract the corresponding data from the manufacturer’s database using PL/SQL. The input data were received as a CSV file and preprocessed using the R program. Raw data are horizontal data like Figure 9. The data are preprocessed to categorize each data and remove unnecessary data. The character data are categorized as metadata, and the variables that affect the prediction value are set as features. Based on the table data, the tact time series data are configured as a feature. We specify the prediction target variable and change it to a new dataset that is easier to apply to the machine learning algorithm. The pre-processed data were subjected to cross-validation fold maker. Cross-validation is used to evaluate the performance of a model by dividing a given dataset into multiple subsets, or folds. K-Fold Cross Validation was used, and the value of K was arbitrarily set to a constant. K means the number of folds to be divided. An experimental approach was needed to determine the value of K in our environment. The maximum K value is set to 10, and after experimenting with different values, we settled on 10 as the optimal value. After this process, the preprocessed data were divided into a test set and a training Set and used as input data. We set the training set ratio to 80% and the test data ratio to 20%.
In the WEKA environment, the M5P algorithm hyperparameters were tested based on the following four parameters. -N: Unpruned, -U: UseUnsmoothed, -R: BuildRegressionTree, -M: MinimumNumberInstances.
The performance of the model can be controlled and optimized by adjusting these hyperparameters. The optimal values of the hyperparameters were tested based on the performance metric relative absolute error (RAE). It can be interpreted as follows: the smaller RAE is, the closer is the prediction to the true value. Table 3 shows the results, and the hyperparameter settings of Unpruned, UseUnsmoothed, and MinimumNumberInstances 6 show the best predictive metrics. Testing the hyperparameter settings defined the parameter values for this experiment.
Figure 9.
Example of Tact time Data Preprocessed with PL/SQL.

When the data are trained with the M5P machine learning model, they are classified through a decision tree, and a linear regression formula is generated at the node.
The pseudocode for the M5P algorithm in the Weka Library is shown below (Algorithm 1).
The M5P algorithm is a decision-tree-based classifier. A decision tree is an algorithm that uses a tree structure to classify data. The M5P algorithm is a variation of a decision tree, which is a good model for regression problems. The M5P algorithm establishes criteria for partitioning the data and then performs another partition in each partitioned region to form a tree. This process means generating rules for classifying and predicting data. The result of the algorithm for deriving production plan results becomes the forecast input data to be applied to the production plan.
4.4. Configure Machine Learning Model Training Input Data
Data form the foundation for all machine-learning models. For a machine-learning model to learn, clean data samples should be fed continuously into the system during training. The desired task may not be achievable if the collected data are highly imbalanced or inadequate. To overcome this problem, performance-based data (excluding human-predicted data) were collected. The tact time and yield were calculated based on the production line, work start time, end time, input quantity, finished quantity, and so on for each standard production model as the input data.
In Figure 9, the yield and tact-time information data are preprocessed in PL/SQL and generated as a CSV file to be set as the default input data. The training dataset comprised over 10,000 cases. The data show that the average tact time, minimum tact time, maximum tact time, and actual performance-based tact time differed. The problem is to select the most appropriate value from the data to be applied to the plan. It is necessary to experiment with the data to generate predictions.
| Algorithm 1: M5P Algorithm. |
|
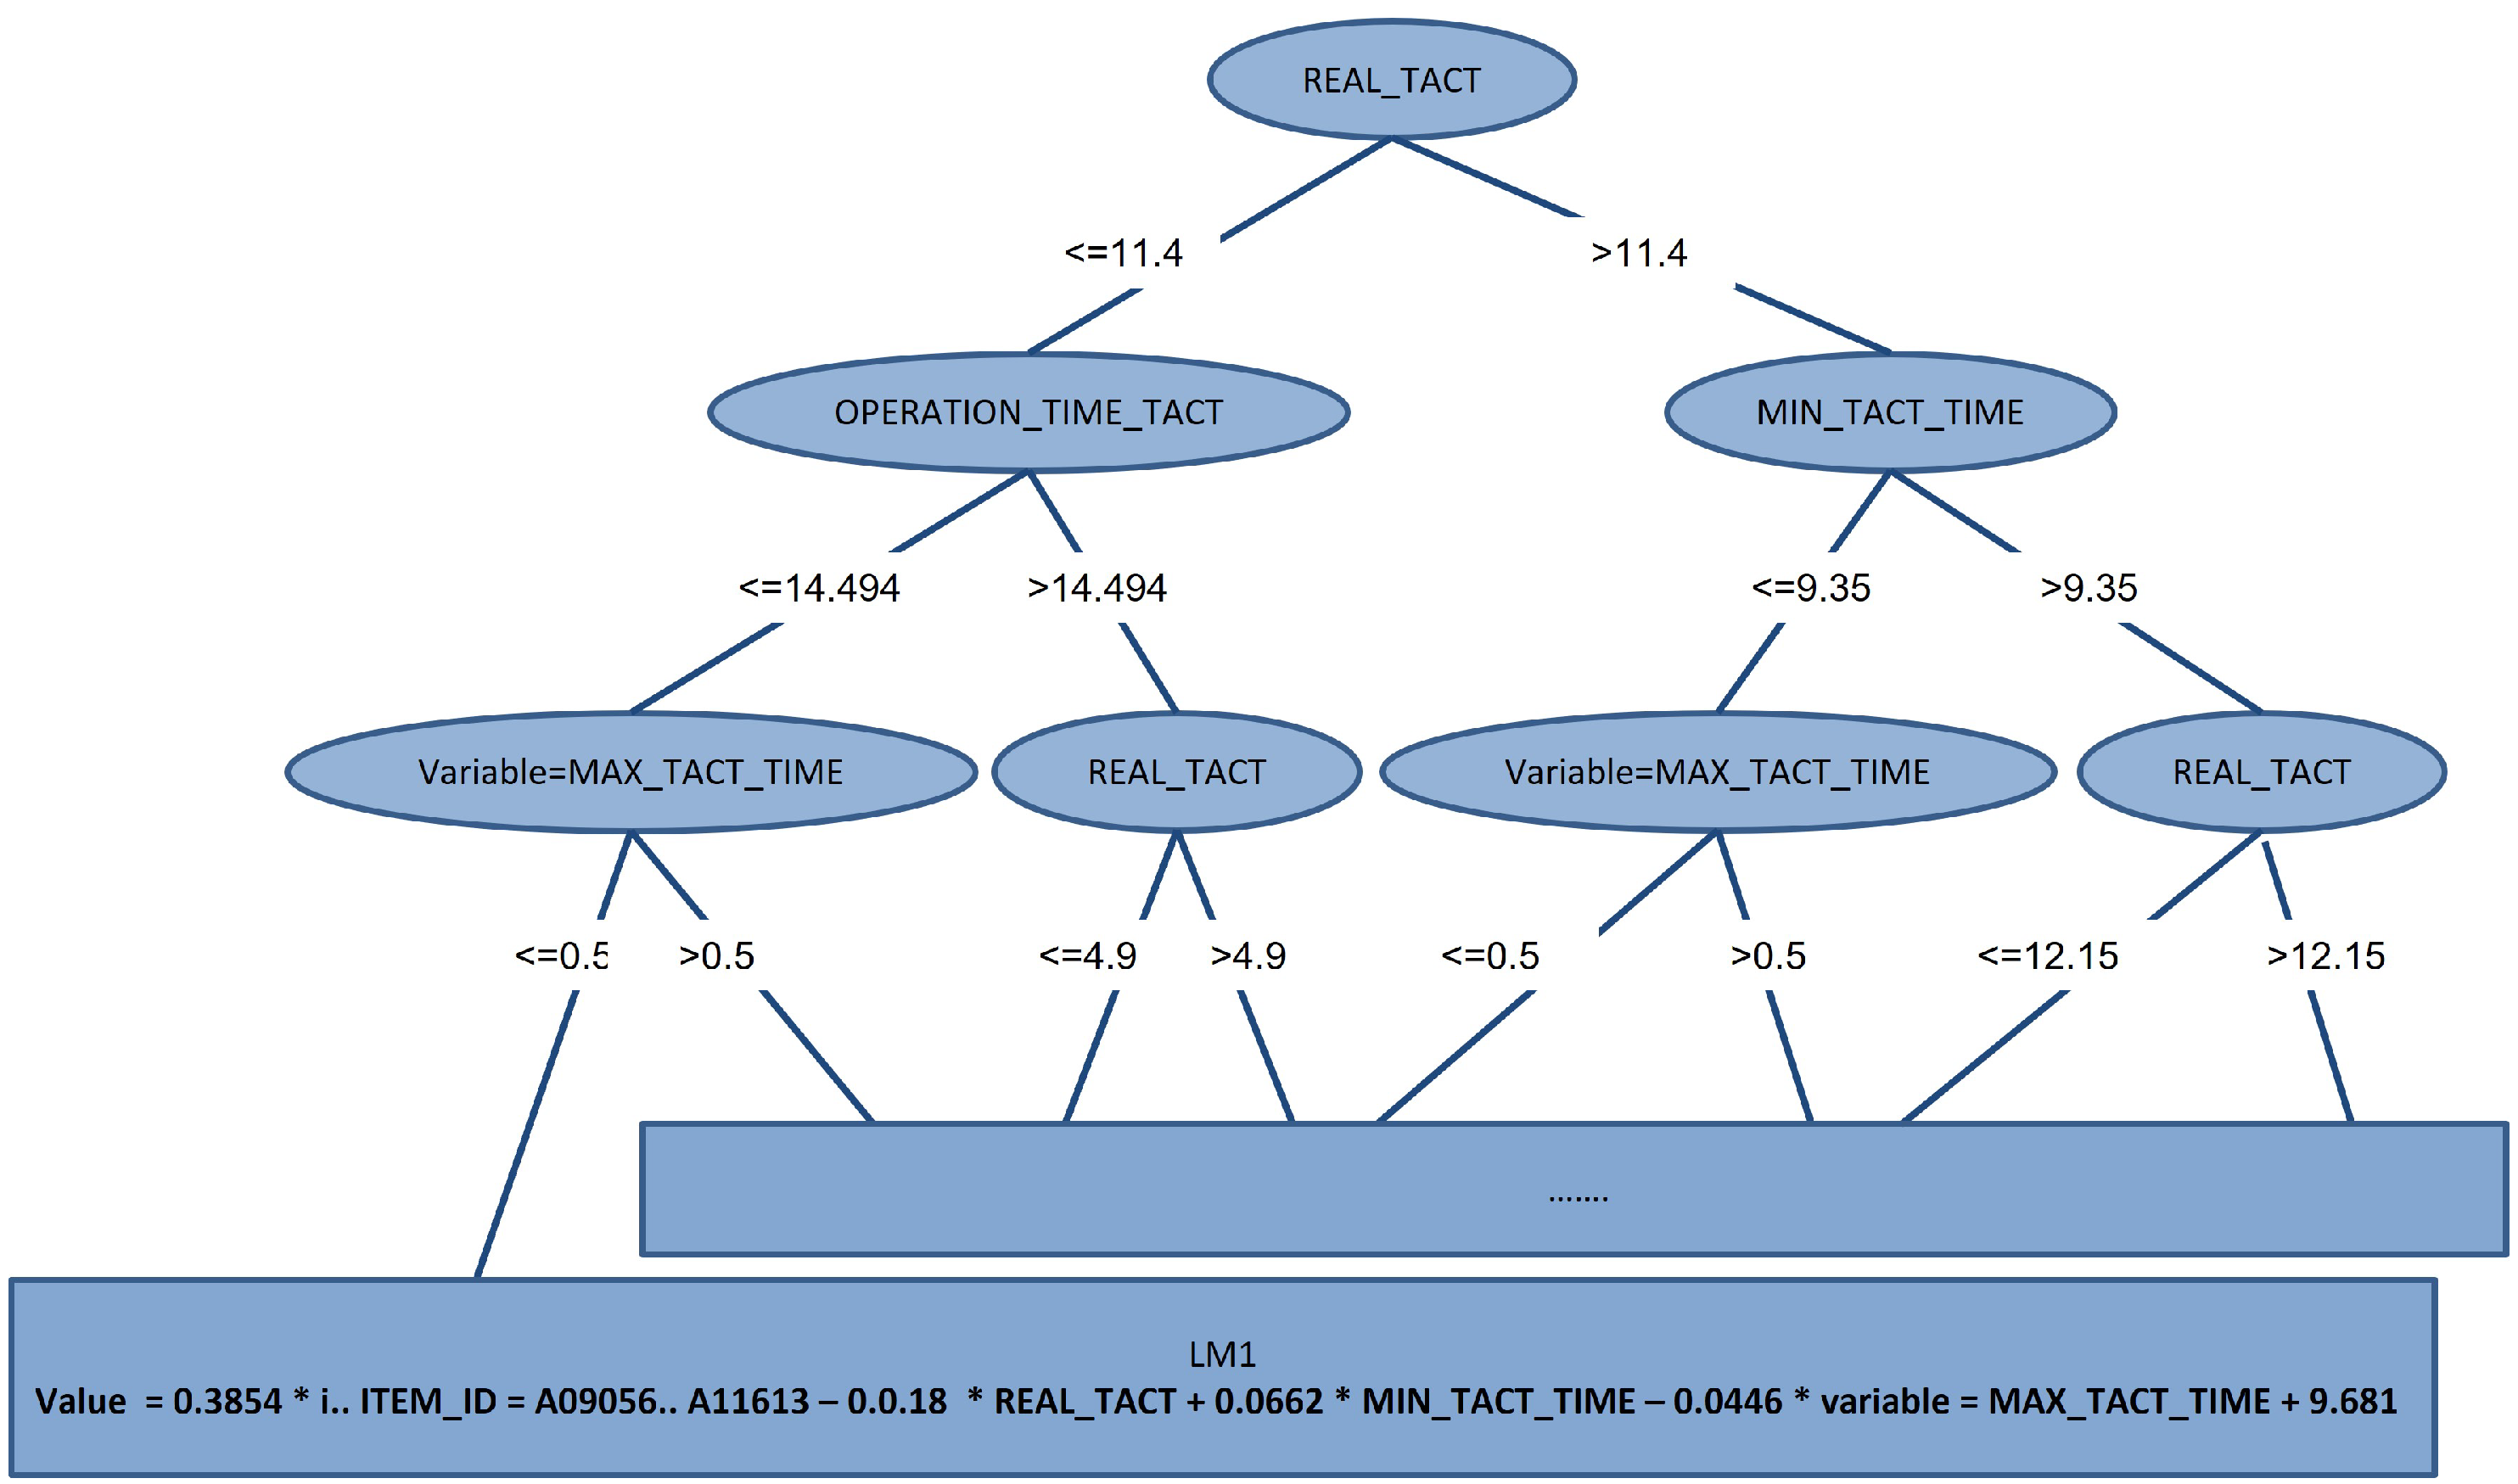
Two results were obtained after the machine-learning model was trained using the M5P algorithm. A decision tree divides input data into features, determines the best decision rule for each partition, and represents it as a tree-like structure. This enables data classification or prediction. Decision trees are intuitive and convenient-to-interpret models. Techniques such as pruning have been used to prevent overfitting. The result of a Decision Tree model is a structure like the one shown in Figure 10.
Each node in the Decision Tree sorts through the metadata and prunes unnecessary outliers to create the linear model at the last node.
4.5. Production Planning Process with M5P Algorithm
The pruned tree shows that the decision-tree algorithm was applied and that the nodes were organized in a linear model. A linear model is generated as many times as there are nodes in the decision tree and generates multiple formulas. In the above formula, the final value is the vertical set of data from the preprocessed input data in Figure 11.
Figure 10.
M5 unpruned model tree generated by the M5P algorithm using Weka.

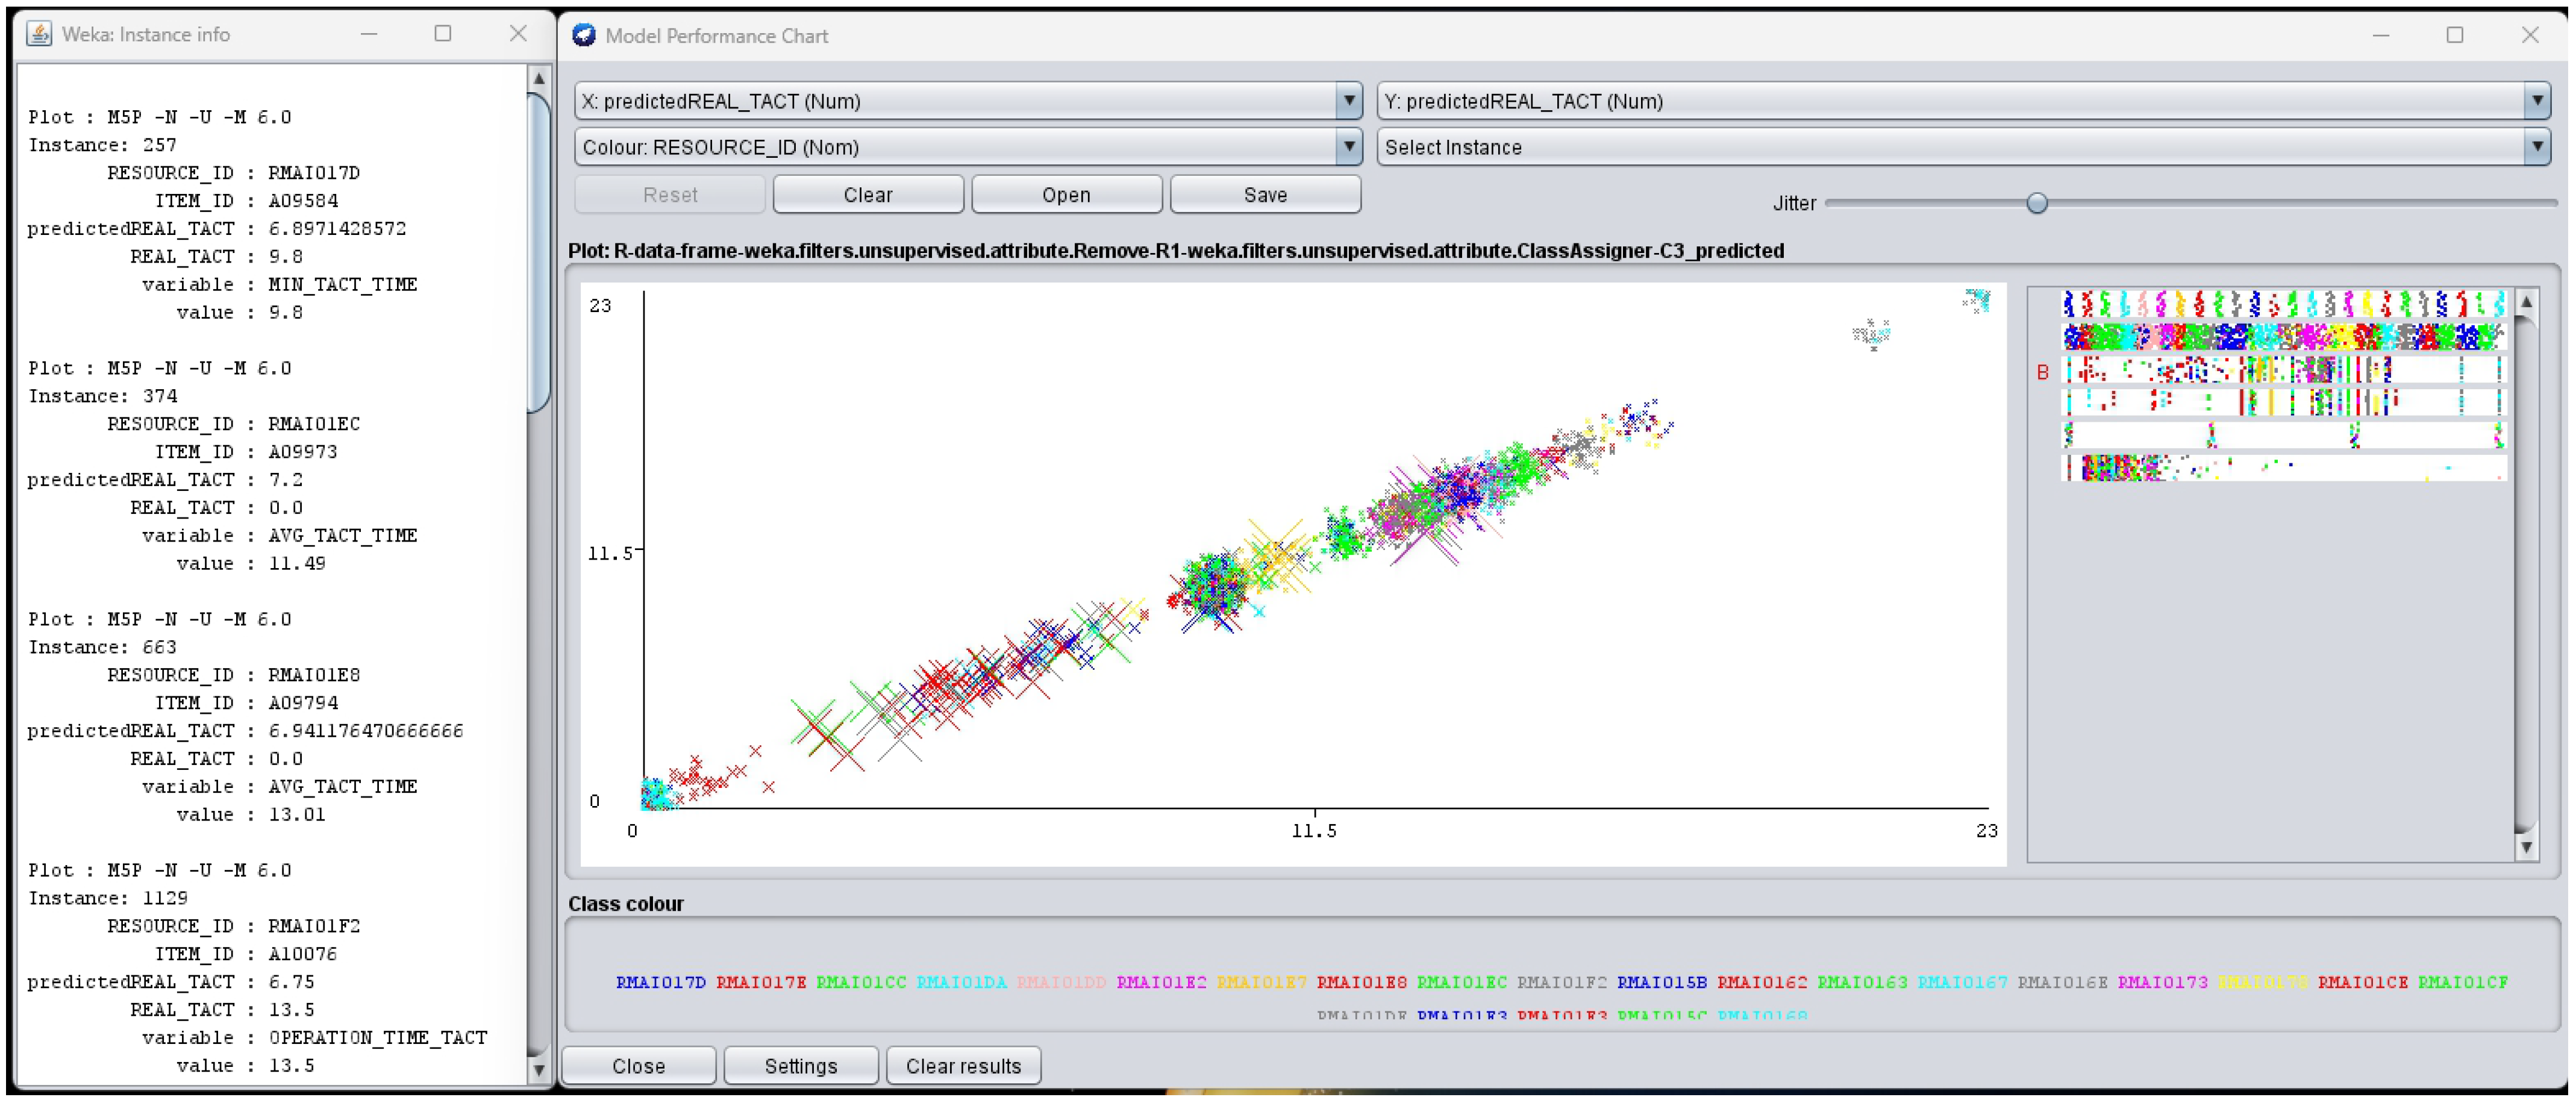
Through the GUI of the Weka Library, you can check the graphs and metrics of the M5P algorithm results for each equipment and model. Objects with the prefix “predicted” have a Y-value, indicating that they are the result of that machine learning. An example of one of the resulting values can be seen in the Figure 12. A model performance chart is used to evaluate the prediction accuracy and performance of the model by visualizing the relationship between predicted and actual values. The predicted value is called “predictedREAL TACT” and the actual value is called “REAL TACT”. The chart shows how well the predicted and actual values match. The difference between the predicted and actual values is visualized.
In this study, the target data for prediction were Real tact time and the Y value is Predicted real tact time as a result of the algorithm. All metadata are composed of different colors and can be classified in the graph, the composition data of the result value can be checked.
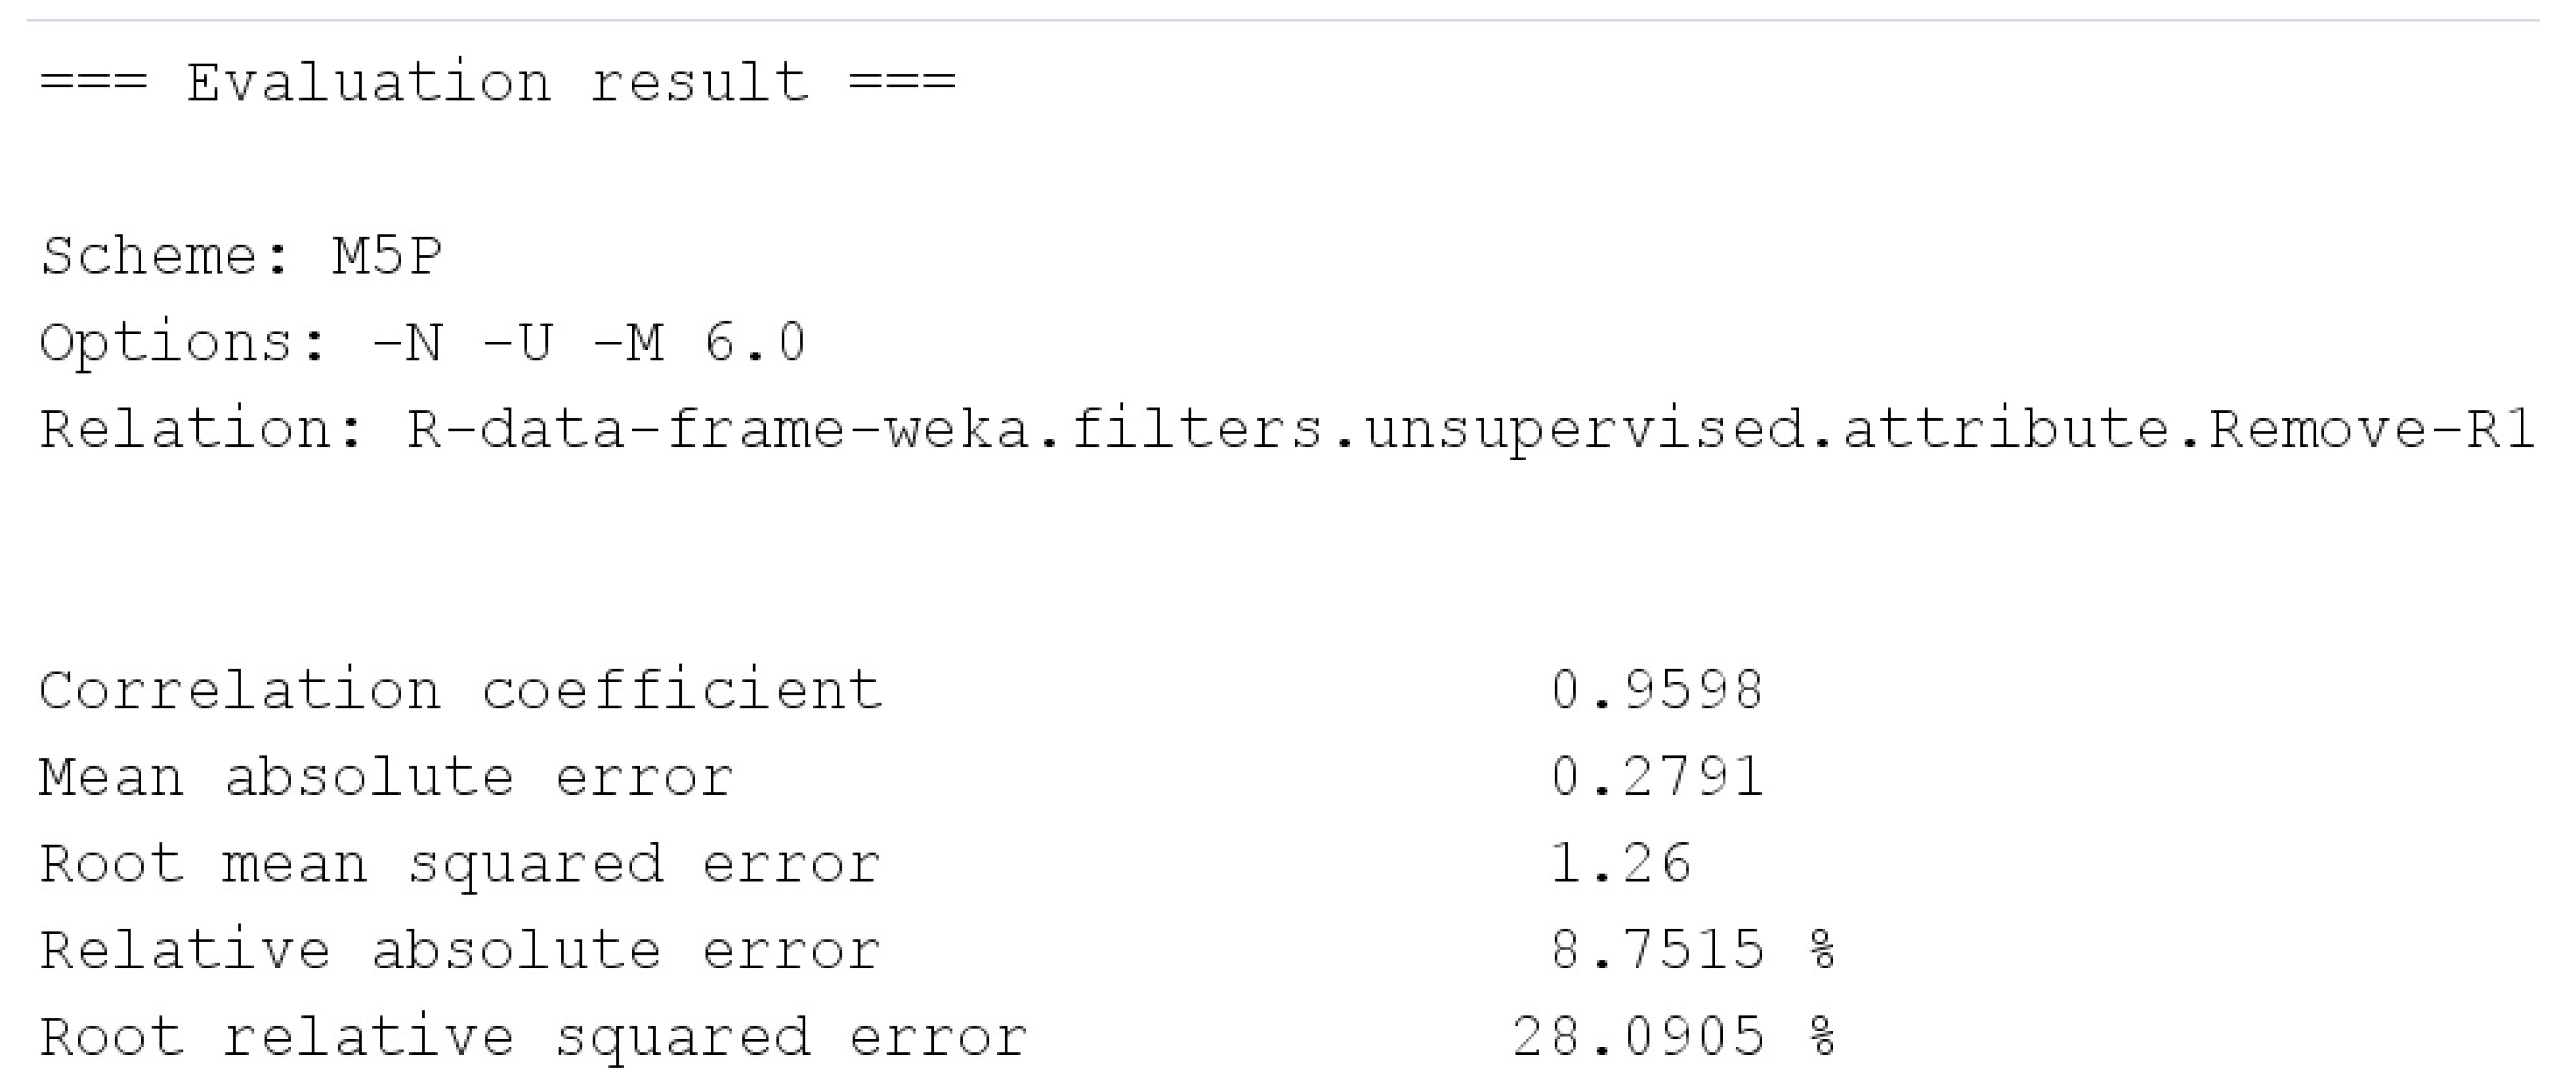
Various metrics have been used to evaluate the performance of machine-learning regression models, including the mean squared error (MSE), mean absolute error (MAE), and coefficient of determination (R-squared). MSE is a metric that squares the difference between the predicted value and the actual value, then calculates the average. The smaller the MSE, the smaller the model’s prediction error. MAE is a metric that calculates the average of the absolute differences between predicted and actual values. The smaller the MAE, the smaller the model’s prediction error. R-squared is a measure of how well a model explains the given data. It represents the percentage of the total variability in the given data that can be explained by the model. The coefficient of determination has a value from 0 to 1, with values closer to 1 indicating that the model explains the data well. These metrics are used to evaluate and compare the performance of the regression model in various aspects. In Figure 13, the evaluation metrics for the performance of the regression model can be seen. Shows the results of machine learning performance metrics with the optimal values of hyperparameter settings -N, -U, and -M 6.0 applied to the test.
Like tact time, yield can also be predicted using the M5P algorithm, and the resulting value, M5P Linear Regression, is reflected as new master data. Input the results of machine learning predictions into a database so that they can be used as supplementary indicators for existing planning results.
5. Results and Discussion
5.1. Experiment Results
This study aimed to (1) predict master data that can potentially fluctuate (rather than being constants) using machine-learning algorithms and (2) present the results of applying those predictions. The M5P machine-learning algorithm predicts the yield and tact time data that may fluctuate among the master data, and establishes a production plan that reflects these values. This provides auxiliary indicators for production management. Tact time and yield are absolute indicators of work time and quantity. These may not have exact values depending on the process characteristics.
Figure 14 shows that an error exists between the actual plan and the tact time predicted using the M5P algorithm.
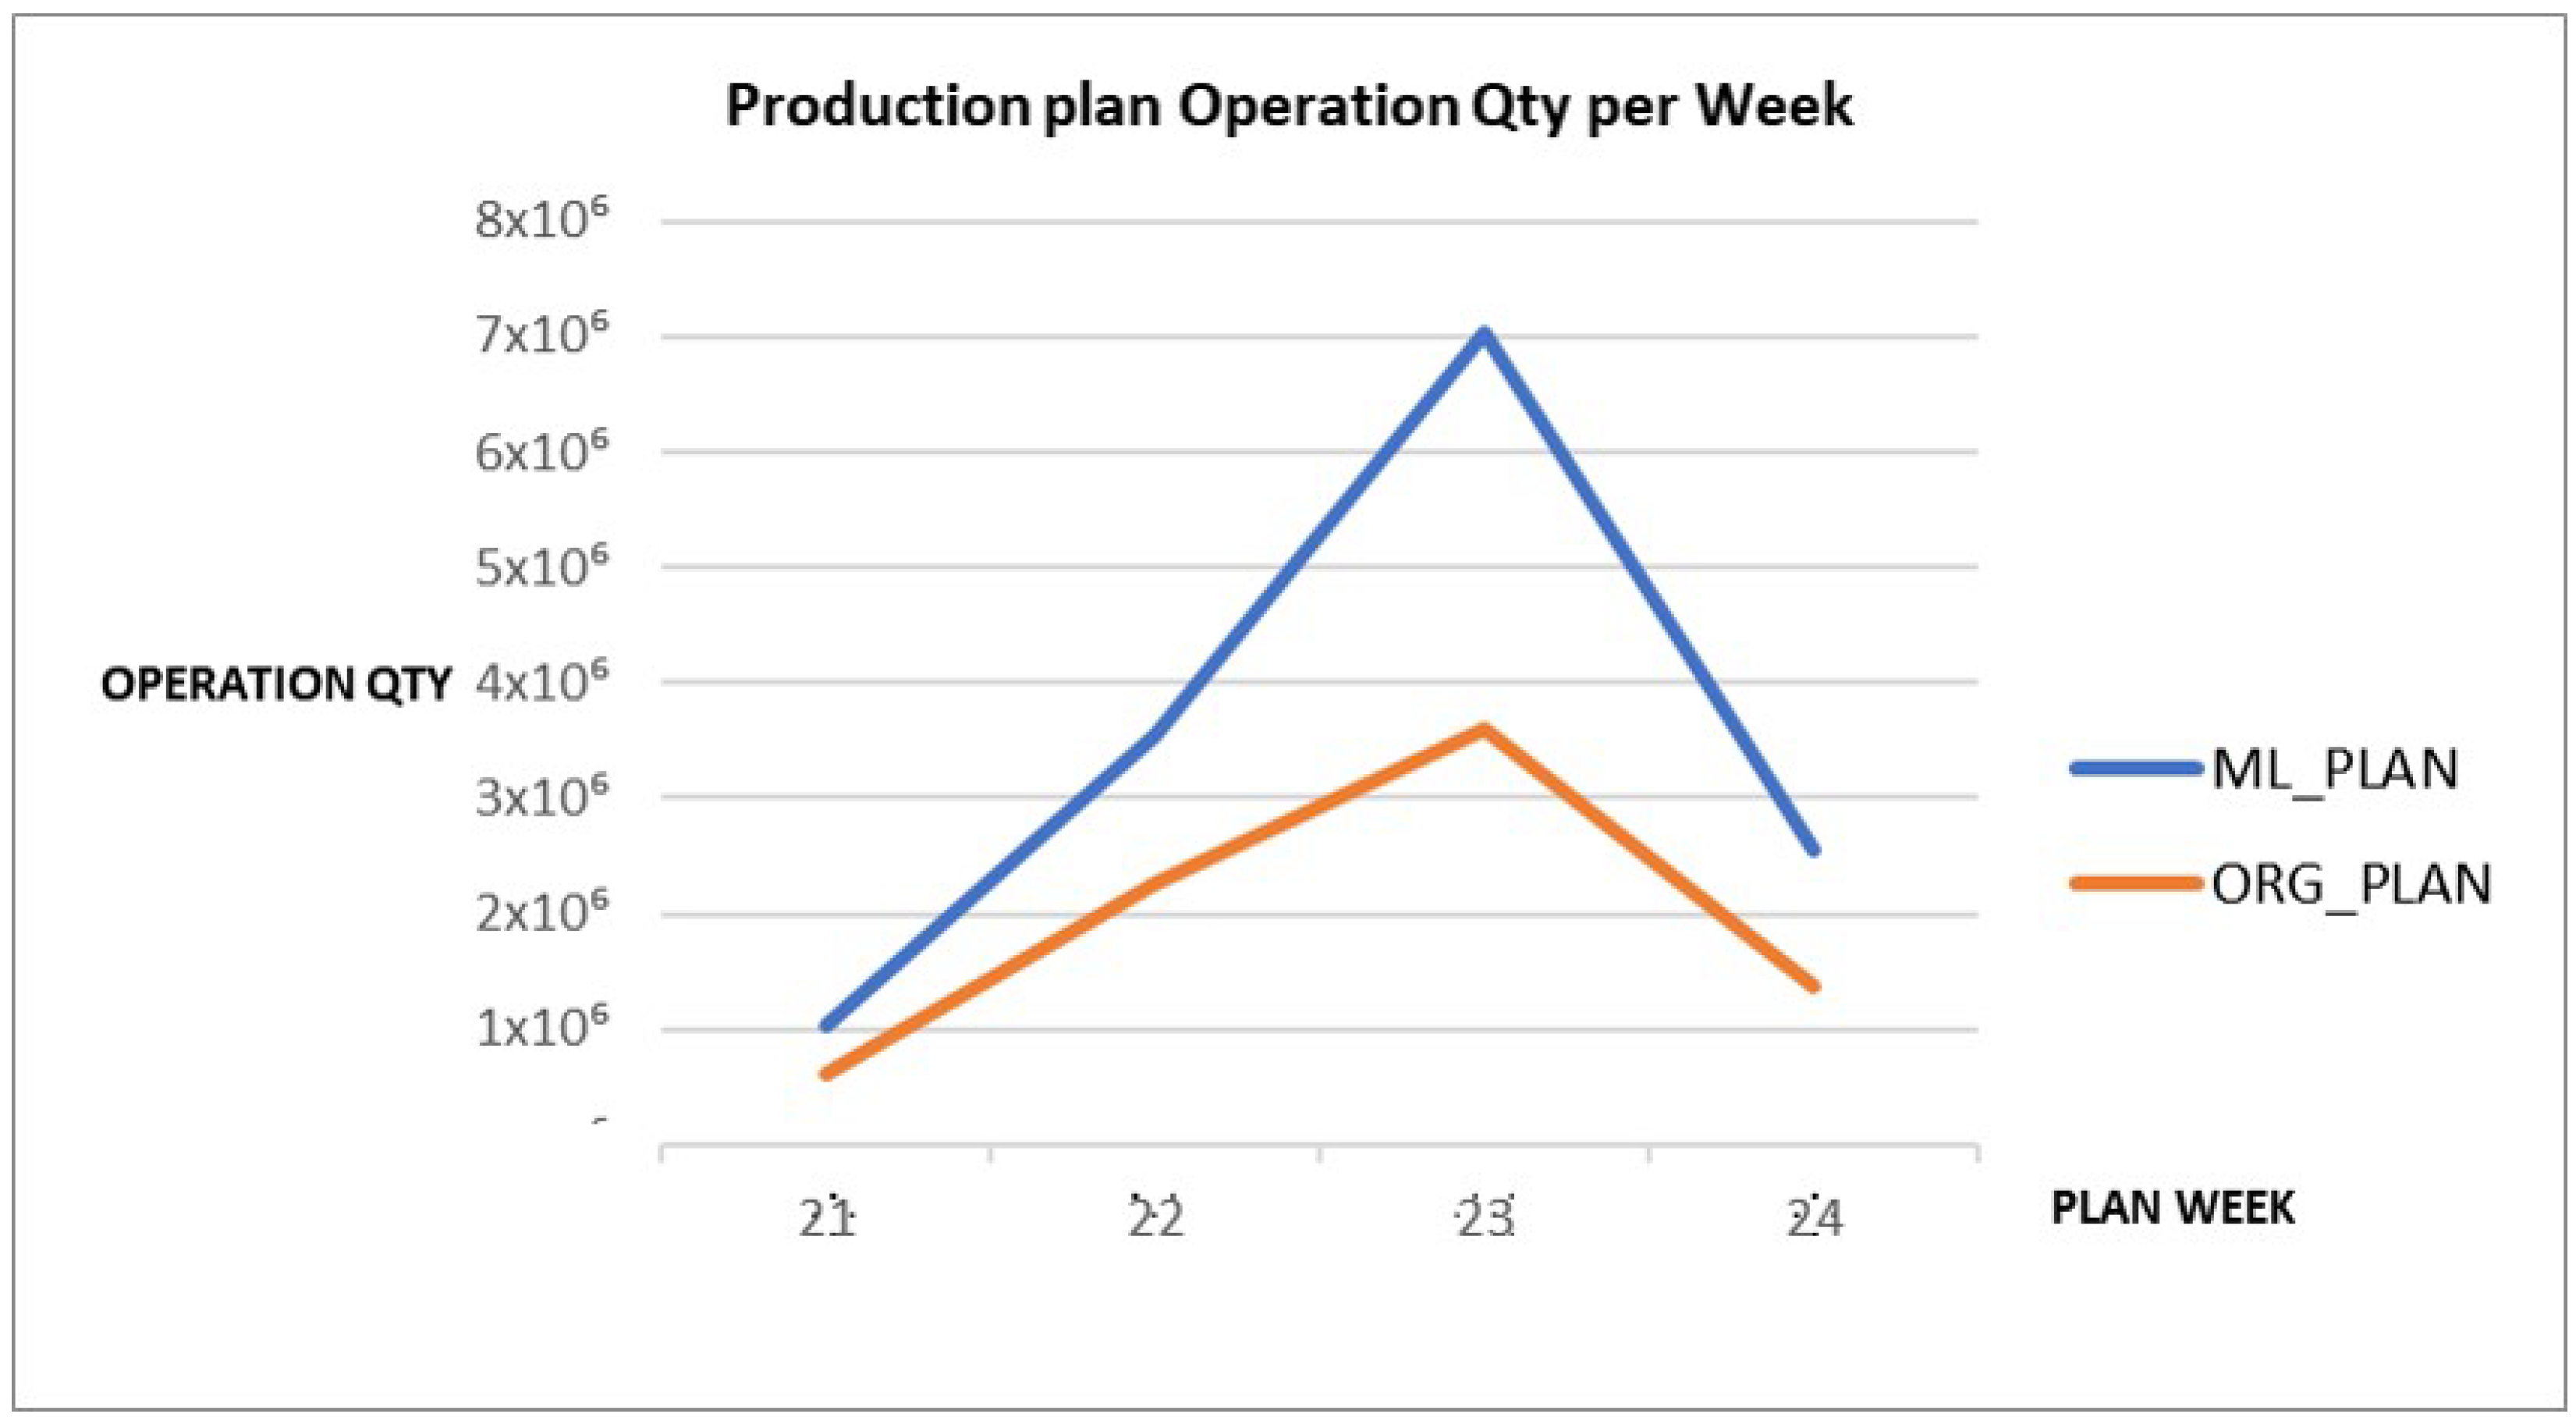
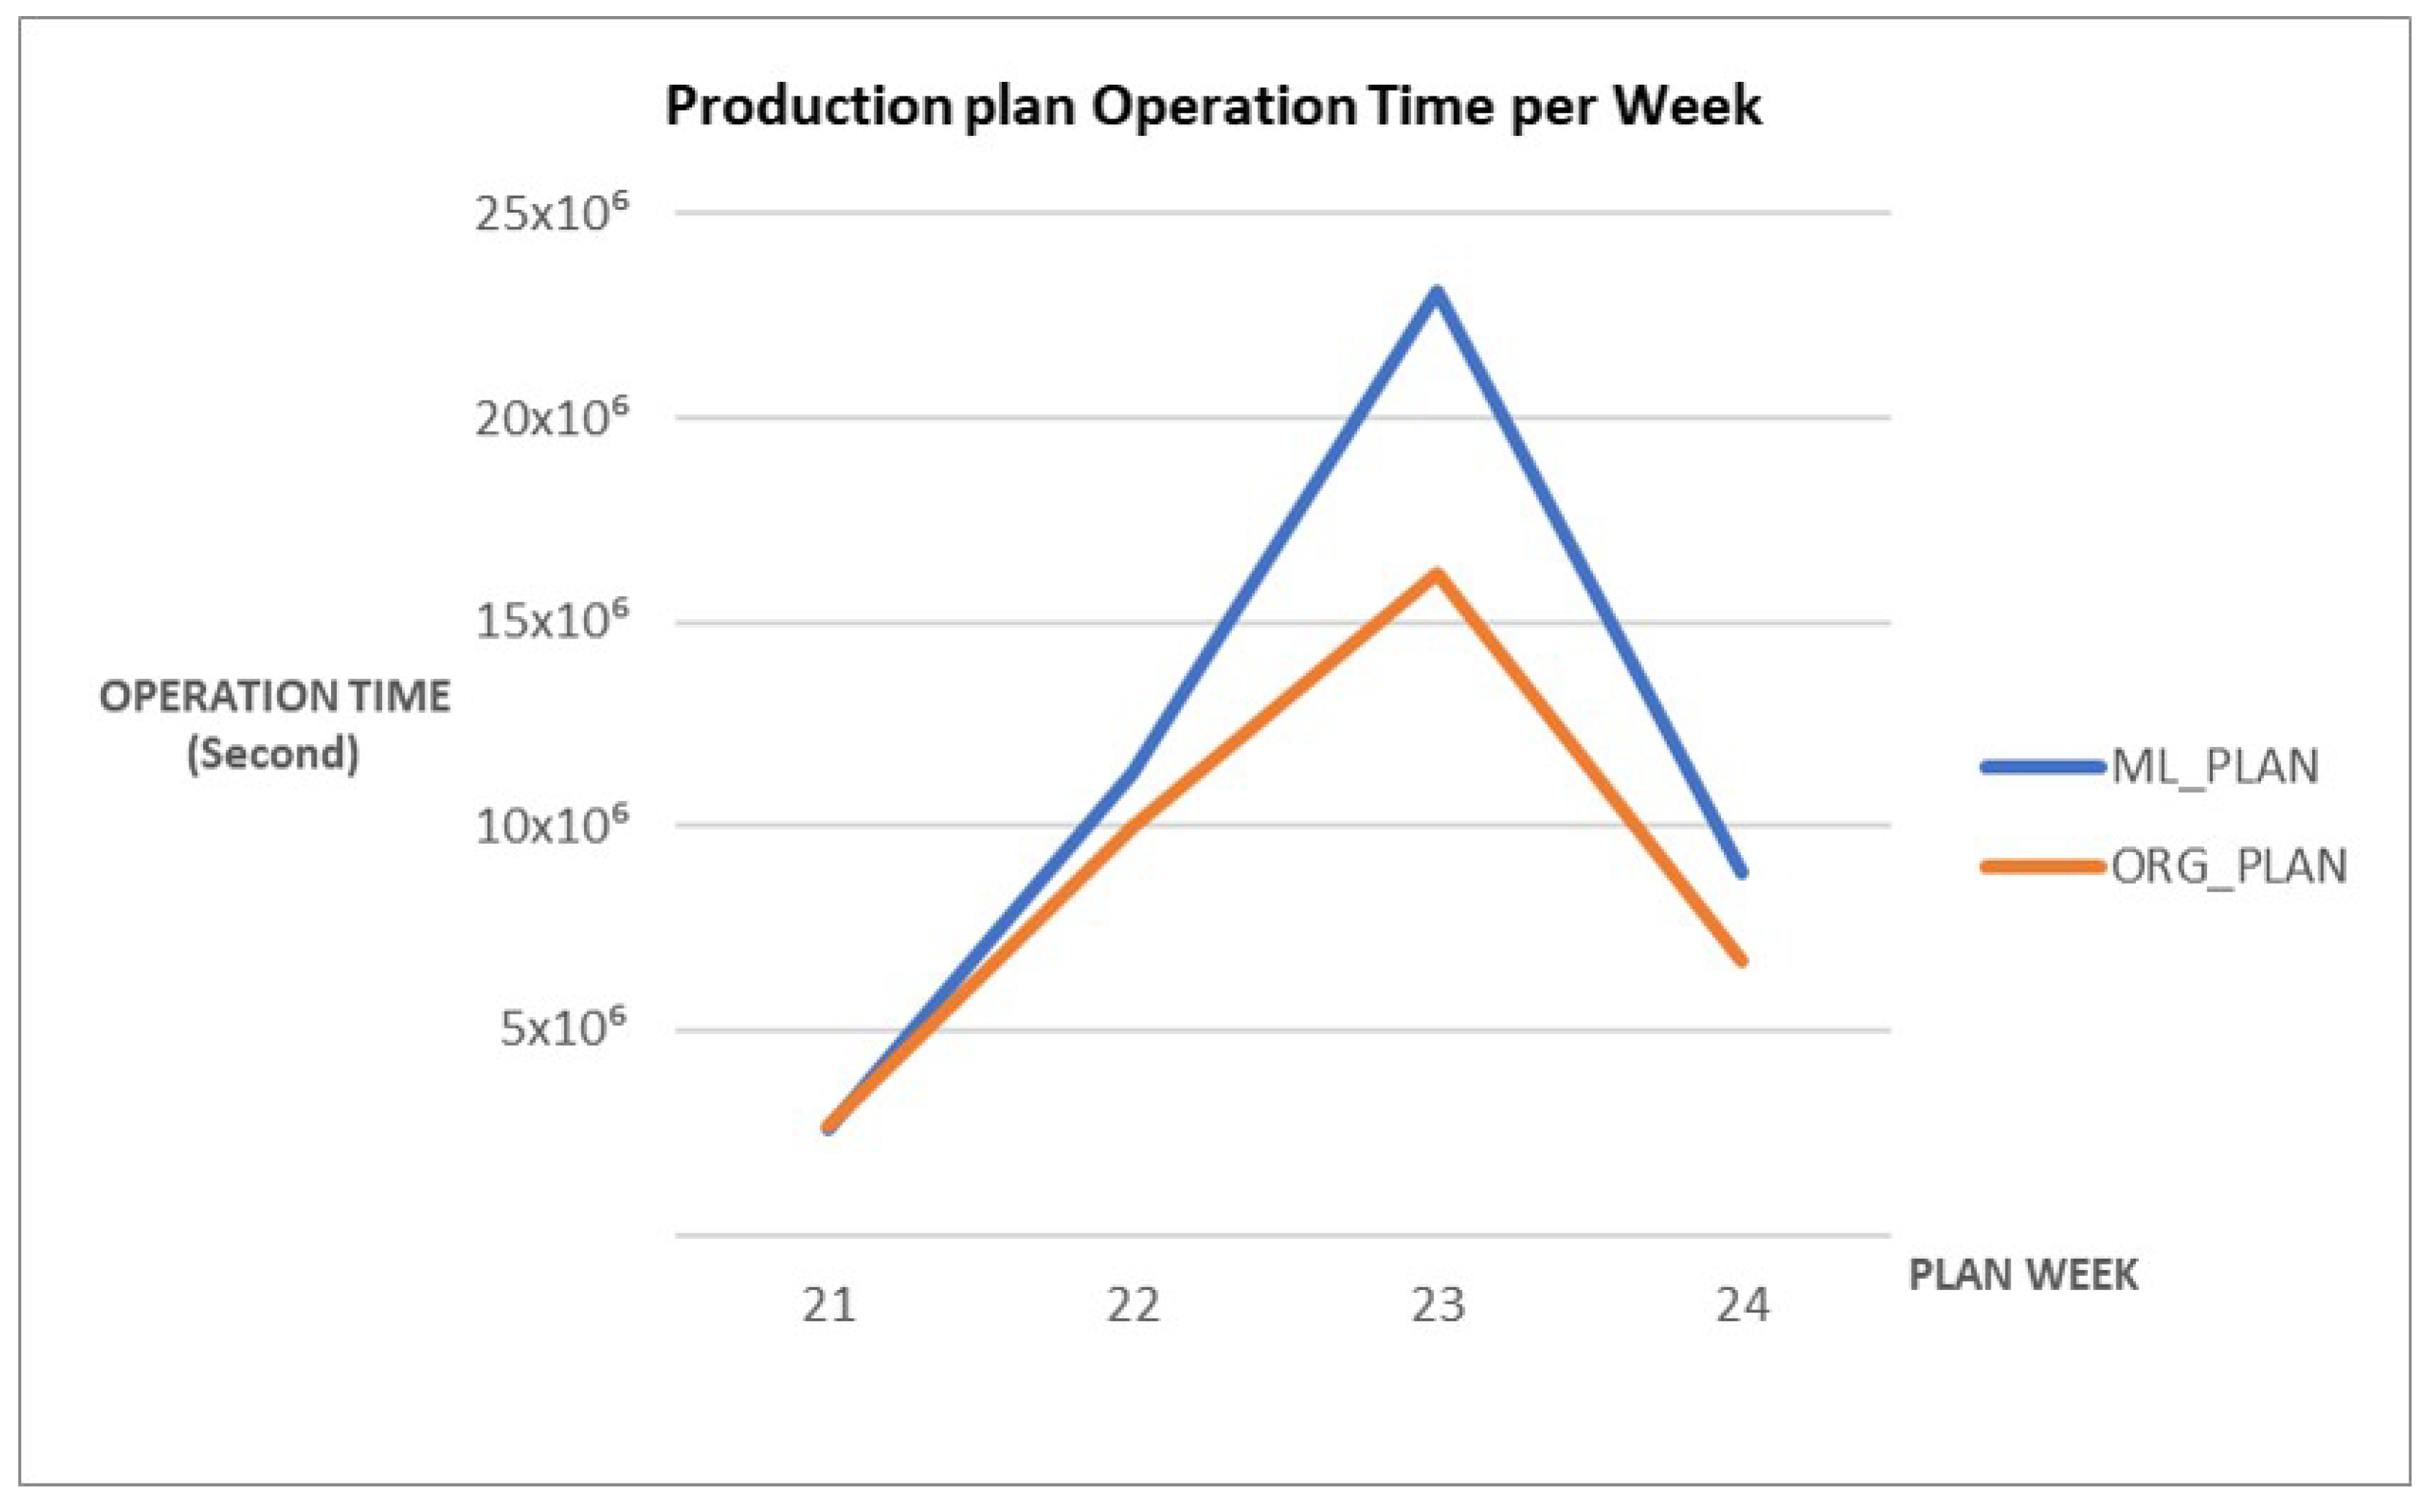
A production plan with a large error in the actual production entity can adversely affect many production-related indicators such as staffing and equipment utilization. An increase of the number of inputs requires additional raw materials, labor, and equipment. An increase in the number of inputs increases the inventory of produced products. This can increase the unit cost of production, decrease competitiveness, and reduce the flexibility of the production process. Therefore, it is important to consider these issues and plan production when inputs increase. Determining the appropriate input amount and balancing productivity gains with cost efficiency are critical issues. Figure 15 shows that the input quantity has increased significantly compared to the original plan due to the predicted yield, due to the increase in input quantity, changes in inventory management, and facility utilization rate, etc. This results in large differences when comparing detailed planning results. Similarly, Figure 16 shows that the working time per parking lot increased. When planning for a modified baseline production, the differences in yield and tact time can indicate a difference in the overall manufacturing plan. Fluctuations are important indicators that should be assessed during production management. Even a small difference in yield or tact time can have a significant impact on the line balance as the production volumes increase. It can also generate a series of supply chain issues such as inventory management and due dates. Therefore, a new plan should be formulated to reflect the erroneous results.
Figure 14.
M5P Algorithm in Learning reduces learning Tact time Compared to Original Data.

Increasing the input quantities and working hours are important issues in production management. If these fluctuations can be predicted and considered in an actual production plan, the accuracy of the schedule, efficiency of the production line, and management of resources can be better controlled. This would, in turn, enable production process optimization at an unprecedented level. Even when data is managed with existing baseline information, it would be feasible to predict the future and plan more flexibly if the baseline data can be predicted based on the existing performance, and to use it as a supplementary indicator.
5.2. Experiment Discussion
The M5P algorithm was applied in the experiment. It has the advantage of handling continuous variables, making it suitable for numerical data analysis. M5P has excellent model transparency by generating a model tree that can be easily interpreted and understood. On the other hand, the existing Decision Tree algorithm lacks the Hyperparameters available in traditional decision tree algorithms. M5P is primarily designed for continuous variables and may not handle categorical variables effectively. Also, without proper pruning or regularization techniques, M5P can be prone to overfitting, especially when the model tree becomes overly complex. If, as in this experiment, there are many features in the ITEM ID and RESOURCE ID, the size of the tree may increase, making the model less interpretable.
In addition, the limitation of this experiment is that the result of reflecting the two data in the production plan shows that the difference between operation time and operation quality has been affected, but it is unclear whether the efficiency of the production plan has improved, and only the change is known. In order for the results of this experiment to be meaningful, it is very important to involve the manufacturer’s production managers in order to understand the results, even if we provide quantitative metrics of workload and time. The result of the production plan is a trade-off between all factors. Fluctuations in these values affect the overall production line balance and capacity. To overcome and adapt to this problem, it is important to involve the manufacturer’s production management experts. To overcome the limitations of data forecasting in production planning, manufacturers can consider the following methods. Utilizing multiple data sources and applying machine learning and predictive models is the basis of this experiment. Establish a production plan based on the predicted data and simulate the production plan according to changes through scenario analysis so that you can make optimal decisions. It is also necessary to actively utilize the knowledge and experience of experts to overcome the limitations of data forecasting. While it is difficult to completely overcome the limitations of data forecasting, forecast accuracy can be improved by combining the above methods. Expert input can improve the reliability and relevance of forecast data by incorporating valuable domain-specific knowledge.
6. Conclusions
The focus is shifting from mass production to low-volume, high-variety production. Moreover, consumer needs are diversifying further. In addition, the recent COVID-19 pandemic has affected the supply chain and production planning, thereby requiring more complex demand and resource management. Therefore, it is necessary to conduct research on forecasting the fluctuating data to satisfy these changing conditions. Machine learning for predicting and reflecting the volatile baseline information during planning can be an indicator for effective manufacturing production planning. When the physical manufacturing environment changes, such as through manual processes, new development processes, new facilities, and new product development, the existing master data may become less reliable and need to be updated. Inaccurate data can result in sales losses and high production costs.
Based on the experiments in this study, we predicted two master data points using a machine-learning model. It was observed that when production is planned based on the predicted values, the work time and production volume could differ significantly from those in the plan formulated with the original master data. Experiments have revealed that the two datasets studied (yield and tact time) are important master datasets for production planning. Yield is a measure of the quantity of products manufactured to the desired quality standard in a production run. The tact time is a metric that indicates the frequency at which a product should be produced during the production process. The difference between operation quality and time is a factor that has an absolute impact on the utilization rate and output of the entire process, and through this experiment, it was confirmed that the predicted data show a difference in results and can be improved in terms of production management. If the difference can be applied as a reference for production management, it can be used to help predict and manage the master data.
The previously selected master data information predicts only two-attribute data and does not reflect time-series trends. This limits the scope of the data and prediction results. To overcome these limitations, research is needed to utilize the raw data that is generated at manufacturing sites but not being utilized. In the development of current technology, a lot of raw data is generated from sensors at manufacturing sites. Of course, this data is useful in many areas, but there is also a significant amount of data that is lost. There are studies that have applied machine-learning algorithms to monitor sensor data in order to improve acidity, reduce costs, and enhance safety [38].
As further research, we plan to test other algorithms, compare results, and apply AI models that improve performance or results. It is expected that by aggregating multiple data and managing a lot of master data using AI models, users will be able to utilize more pure data with less intervention. By learning from multiple data sources and analyzing time-series, it will be able to predict future data for the entire planning horizon, rather than just a cutoff point, and generate data that more accurately reflects trends. It is hoped that this deeper research will result in manufacturing process systems that can proactively respond to the ever-increasing complexity of the supply chain.
Author Contributions
Conceptualization, H.S. and J.J.; Methodology, H.S.; Software, H.S.; Formal analysis, H.S.; Investigation, H.S.; Resources, I.G. and J.J.; Data curation, H.S. and Y.K.; Writing—original draft, H.S.; Writing—review and editing, H.S., Y.K. and J.J.; Visualization, H.S. and J.R.; Supervision, J.J.; Project administration, J.J. All authors have read and agreed to the published version of the manuscript.
Funding
This research was supported by the SungKyunKwan University and the BK21 FOUR (Graduate School Innovation) funded by the Ministry of Education (MOE, Korea) and National Research Foundation of Korea (NRF).
Institutional Review Board Statement
Not applicable.
Informed Consent Statement
Not applicable.
Data Availability Statement
Not applicable.
Acknowledgments
This research was supported by the SungKyunKwan University and the BK21 FOUR (Graduate School Innovation) funded by the Ministry of Education (MOE, Korea) and National Research Foundation of Korea (NRF) This research was supported by the MSIT (Ministry of Science and ICT), Korea, under the ITRC (Information Technology Research Center) support program (IITP-2023-2018-0-01417) supervised by the IITP (Institute for Information Communications Technology Planning Evaluation).
Conflicts of Interest
The authors declare that they have no conflict of interest.
References
- Sharma, R.; Shishodia, A.; Gunasekaran, A.; Min, H.; Munim, Z.H. The role of artificial intelligence in supply chain management: Mapping the territory. Int. J. Prod. Res. 2022, 60, 7527–7550. [Google Scholar] [CrossRef]
- Toorajipour, R.; Sohrabpour, V.; Nazarpour, A.; Oghazi, P.; Fischl, M. Artificial intelligence in supply chain management: A systematic literature review. J. Bus. Res. 2021, 122, 502–517. [Google Scholar] [CrossRef]
- Janes, G.; Perinic, M.; Jurkovic, Z. Applying improved genetic algorithm for solving job shop scheduling problems. Tech. Gaz. 2017, 24, 1243–1247. [Google Scholar]
- Thomas, E.H.; Galambos, N. What satisfies students? Mining student-opinion data with regression and decision tree analysis. Res. High. Educ. 2004, 45, 251–269. [Google Scholar] [CrossRef]
- Arinez, J.F.; Chang, Q.; Gao, R.X.; Xu, C.; Zhang, J. Artificial intelligence in advanced manufacturing: Current status and future outlook. J. Manuf. Sci. Eng. 2020, 142, 110804. [Google Scholar] [CrossRef]
- Helo, P.; Hao, Y. Artificial intelligence in operations management and supply chain management: An exploratory case study. Prod. Plan. Control 2022, 33, 1573–1590. [Google Scholar] [CrossRef]
- Oluyisola, O.E.; Bhalla, S.; Sgarbossa, F.; Strandhagen, J.O. Designing and developing smart production planning and control systems in the industry 4.0 era: A methodology and case study. J. Intell. Manuf. 2022, 33, 311–332. [Google Scholar] [CrossRef]
- Ren, L.; Zhang, Z.; Zhao, C.; Zhang, G. Cloud-based master data platform for smart manufacturing process. In Proceedings of the Cloud Computing, Smart Grid and Innovative Frontiers in Telecommunications: 9th EAI International Conference, CloudComp 2019, and 4th EAI International Conference, SmartGIFT 2019, Beijing, China, 4–5 December 2019; 21–22 December 2019. Springer: Berlin/Heidelberg, Germany, 2020; pp. 163–170. [Google Scholar]
- Suri, R. Quick Response Manufacturing: A Companywide Approach to Reducing Lead Times; CRC Press: Boca Raton, FL, USA, 2020. [Google Scholar]
- Javaid, M.; Haleem, A.; Singh, R.P.; Suman, R. Significance of Quality 4.0 towards comprehensive enhancement in manufacturing sector. Sens. Int. 2021, 2, 100109. [Google Scholar] [CrossRef]
- Terwiesch, C.; Bohn, R.; Chea, K. International product transfer and production ramp-up: A case study from the data storage industry. R&D Manag. 2001, 31, 435–451. [Google Scholar]
- Zhao, X.; Nie, X. Status Forecasting Based on the Baseline Information Using Logistic Regression. Entropy 2022, 24, 1481. [Google Scholar] [CrossRef]
- Xu, K.; Li, Y.; Liu, C.; Liu, X.; Hao, X.; Gao, J.; Maropoulos, P.G. Advanced data collection and analysis in data-driven manufacturing process. Chin. J. Mech. Eng. 2020, 33, 43. [Google Scholar] [CrossRef]
- Linardatos, P.; Papastefanopoulos, V.; Kotsiantis, S. Explainable ai: A review of machine learning interpretability methods. Entropy 2020, 23, 18. [Google Scholar] [CrossRef]
- Mikalef, P.; Gupta, M. Artificial intelligence capability: Conceptualization, measurement calibration, and empirical study on its impact on organizational creativity and firm performance. Inf. Manag. 2021, 58, 103434. [Google Scholar] [CrossRef]
- Wang, C.N.; Yang, F.C.; Vo, N.T.; Nguyen, V.T.T. Enhancing Lithium-Ion Battery Manufacturing Efficiency: A Comparative Analysis Using DEA Malmquist and Epsilon-Based Measures. Batteries 2023, 9, 317. [Google Scholar] [CrossRef]
- Peng, F.; Wang, Y.; Xuan, H.; Nguyen, T.V. Efficient road traffic anti-collision warning system based on fuzzy nonlinear programming. Int. J. Syst. Assur. Eng. Manag. 2022, 13, 456–461. [Google Scholar] [CrossRef]
- Patange, A.; Jegadeeshwaran, R.; Dhobale, N. Milling cutter condition monitoring using machine learning approach. IOP Conf. Ser. Mater. Sci. Eng. 2019, 624, 012030. [Google Scholar] [CrossRef]
- Kumar, S.; Gopi, T.; Harikeerthana, N.; Gupta, M.K.; Gaur, V.; Krolczyk, G.M.; Wu, C. Machine learning techniques in additive manufacturing: A state of the art review on design, processes and production control. J. Intell. Manuf. 2023, 34, 21–55. [Google Scholar] [CrossRef]
- Tao, F.; Qi, Q.; Liu, A.; Kusiak, A. Data-driven smart manufacturing. J. Manuf. Syst. 2018, 48, 157–169. [Google Scholar] [CrossRef]
- Haug, A.; Stentoft Arlbjørn, J. Barriers to master data quality. J. Enterp. Inf. Manag. 2011, 24, 288–303. [Google Scholar] [CrossRef]
- Law, C.C.; Chen, C.C.; Wu, B.J. Managing the full ERP life-cycle: Considerations of maintenance and support requirements and IT governance practice as integral elements of the formula for successful ERP adoption. Comput. Ind. 2010, 61, 297–308. [Google Scholar] [CrossRef]
- Osterrieder, P.; Budde, L.; Friedli, T. The smart factory as a key construct of industry 4.0: A systematic literature review. Int. J. Prod. Econ. 2020, 221, 107476. [Google Scholar] [CrossRef]
- Guo, K.; Yang, M.; Zhu, H. Application research of improved genetic algorithm based on machine learning in production scheduling. Neural Comput. Appl. 2020, 32, 1857–1868. [Google Scholar] [CrossRef]
- Janeš, G.; Ištoković, D.; Jurković, Z.; Perinić, M. Application of Modified Steady-State Genetic Algorithm for Batch Sizing and Scheduling Problem with Limited Buffers. Appl. Sci. 2022, 12, 11512. [Google Scholar] [CrossRef]
- Chen, M.; Sharma, A.; Bhola, J.; Nguyen, T.V.; Truong, C.V. Multi-agent task planning and resource apportionment in a smart grid. Int. J. Syst. Assur. Eng. Manag. 2022, 13, 444–455. [Google Scholar] [CrossRef]
- González Rodríguez, G.; Gonzalez-Cava, J.M.; Méndez Pérez, J.A. An intelligent decision support system for production planning based on machine learning. J. Intell. Manuf. 2020, 31, 1257–1273. [Google Scholar] [CrossRef]
- Lakshmanan, V.; Robinson, S.; Munn, M. Machine Learning Design Patterns; O’Reilly Media: Sebastopol, CA, USA, 2020. [Google Scholar]
- Ayodele, T.O. Types of machine learning algorithms. New Adv. Mach. Learn. 2010, 3, 19–48. [Google Scholar]
- Kulkarni, E.G.; Kulkarni, R.B. Weka powerful tool in data mining. Int. J. Comput. Appl. 2016, 975, 8887. [Google Scholar]
- Behnood, A.; Behnood, V.; Gharehveran, M.M.; Alyamac, K.E. Prediction of the compressive strength of normal and high-performance concretes using M5P model tree algorithm. Constr. Build. Mater. 2017, 142, 199–207. [Google Scholar] [CrossRef]
- Patange, A.D.; Jegadeeshwaran, R. A machine learning approach for vibration-based multipoint tool insert health prediction on vertical machining centre (VMC). Measurement 2021, 173, 108649. [Google Scholar] [CrossRef]
- Pham, B.T.; Ly, H.B.; Al-Ansari, N.; Ho, L.S. A comparison of Gaussian process and M5P for prediction of soil permeability coefficient. Sci. Program. 2021, 2021, 3625289. [Google Scholar] [CrossRef]
- Lin, L.; Wang, Q.; Sadek, A.W. A combined M5P tree and hazard-based duration model for predicting urban freeway traffic accident durations. Accid. Anal. Prev. 2016, 91, 114–126. [Google Scholar] [CrossRef]
- Landwehr, N.; Hall, M.; Frank, E. Logistic model trees. Mach. Learn. 2005, 59, 161–205. [Google Scholar] [CrossRef] [Green Version]
- Montgomery, D.C.; Peck, E.A.; Vining, G.G. Introduction to Linear Regression Analysis; John Wiley & Sons: Hoboken, NJ, USA, 2021. [Google Scholar]
- Weisberg, S. Applied Linear Regression; John Wiley & Sons: Hoboken, NJ, USA, 2005; Volume 528. [Google Scholar]
- Patange, A.; Jegadeeshwaran, R.; Bajaj, N.; Khairnar, A.; Gavade, N. Application of machine learning for tool condition monitoring in turning. Sound Vib. 2022, 56, 127–145. [Google Scholar] [CrossRef]
- Patange, A.D.; Pardeshi, S.S.; Jegadeeshwaran, R.; Zarkar, A.; Verma, K. Augmentation of Decision Tree Model Through Hyper-Parameters Tuning for Monitoring of Cutting Tool Faults Based on Vibration Signatures. J. Vib. Eng. Technol. 2022, 1–19. [Google Scholar] [CrossRef]
- Bueno, A.; Godinho Filho, M.; Frank, A.G. Smart production planning and control in the Industry 4.0 context: A systematic literature review. Comput. Ind. Eng. 2020, 149, 106774. [Google Scholar] [CrossRef]
- Nam, S.; Shen, H.; Ryu, C.; Shin, J.G. SCP-Matrix based shipyard APS design: Application to long-term production plan. Int. J. Nav. Archit. Ocean. Eng. 2018, 10, 741–761. [Google Scholar] [CrossRef]
- Hall, M.; Frank, E.; Holmes, G.; Pfahringer, B.; Reutemann, P.; Witten, I.H. The WEKA data mining software: An update. ACM Sigkdd Explor. Newsl. 2009, 11, 10–18. [Google Scholar] [CrossRef]
- Lantz, B. Machine Learning with R: Expert Techniques for Predictive Modeling; Packt Publishing Ltd.: Birmingham, UK, 2019. [Google Scholar]
Figure 1.
Traditional Method for Advanced Data Collection and Analysis in Data-Driven Manufacturing Processes [13].
Figure 1.
Traditional Method for Advanced Data Collection and Analysis in Data-Driven Manufacturing Processes [13].

Figure 2.
Advanced Data Collection and Analysis in Data-Driven Manufacturing Processes [13].
Figure 2.
Advanced Data Collection and Analysis in Data-Driven Manufacturing Processes [13].

Figure 3.
Traditional IT compared to Analytics IT.

Figure 4.
Machine Learning Supervise Process [29].
Figure 4.
Machine Learning Supervise Process [29].

Figure 7.
Machine Learning Reflection Comparison Production Planning Process.

Figure 8.
Machine-learning Model Flow by Weka.

Figure 11.
Linear model created with the M5P algorithm using Weka.

Figure 12.
M5P algorithm Results predicted by Machine learning.

Figure 13.
M5P Algorithm Machine Learning Results.

Figure 15.
Compare the Quantities of the Existing Plan and The Machine Learning predictive Model Plan.
Figure 15.
Compare the Quantities of the Existing Plan and The Machine Learning predictive Model Plan.

Figure 16.
Compare the Operation times of Traditional Planning and Machine Learning Predictive Model Planning.
Figure 16.
Compare the Operation times of Traditional Planning and Machine Learning Predictive Model Planning.


Table 1.
Hardware Environment.
| Hardware | Performance |
|---|---|
| CPU | 13th Gen Intel(R) Core(TM) i7-1360P 2.20 GHz |
| RAM | 16 GB |
| GPU | Intel® Iris® Xe Graphics |
Table 2.
Development Environment.
| Type | |
|---|---|
| OS | Windows 11 Home 22H2 |
| DBMS | Oracle 21c XE |
| Development Languages | Java 1.8 |
| Development Tools | R 4.3.0, Weka 3.8.6 |
Table 3.
RAE metrics by Hyperparameter.
| RAE (%) | -M 4.0 | -M 5.0 | -M 6.0 | -M 7.0 | -M 8.0 | |
|---|---|---|---|---|---|---|
| NONE | 10.042 | 10.0494 | 10.1141 | 10.5581 | 10.7338 | |
| -R | NONE | 16.855 | 16.7616 | 16.764 | 16.7879 | 16.7879 |
| -N | 16.3638 | 16.3637 | 16.3632 | 16.3665 | 16.3676 | |
| -U | 10.8224 | 10.7141 | 10.733 | 10.9508 | 10.9508 | |
| -N | NONE | 9.5442 | 9.5456 | 9.5935 | 9.8459 | 9.9783 |
| -U | 8.8193 | 8.7659 | 8.7515 | 9.0278 | 9.1206 | |
| -U | NONE | 9.2306 | 9.2141 | 9.2728 | 9.9319 | 10.1855 |
Disclaimer/Publisher’s Note: The statements, opinions and data contained in all publications are solely those of the individual author(s) and contributor(s) and not of MDPI and/or the editor(s). MDPI and/or the editor(s) disclaim responsibility for any injury to people or property resulting from any ideas, methods, instructions or products referred to in the content. |
© 2023 by the authors. Licensee MDPI, Basel, Switzerland. This article is an open access article distributed under the terms and conditions of the Creative Commons Attribution (CC BY) license (https://creativecommons.org/licenses/by/4.0/).
Share and Cite
MDPI and ACS Style
Song, H.; Gi, I.; Ryu, J.; Kwon, Y.; Jeong, J. Production Planning Forecasting System Based on M5P Algorithms and Master Data in Manufacturing Processes. Appl. Sci. 2023, 13, 7829. https://doi.org/10.3390/app13137829
AMA Style
Song H, Gi I, Ryu J, Kwon Y, Jeong J. Production Planning Forecasting System Based on M5P Algorithms and Master Data in Manufacturing Processes. Applied Sciences. 2023; 13(13):7829. https://doi.org/10.3390/app13137829
Chicago/Turabian StyleSong, Hasup, Injong Gi, Jihyuk Ryu, Yonghwan Kwon, and Jongpil Jeong. 2023. "Production Planning Forecasting System Based on M5P Algorithms and Master Data in Manufacturing Processes" Applied Sciences 13, no. 13: 7829. https://doi.org/10.3390/app13137829
Note that from the first issue of 2016, this journal uses article numbers instead of page numbers. See further details here.