1. Introduction
Heart rate and HRV are important vital signs. Clinical studies have confirmed that heart rate is closely related to the occurrence and prognosis of cardiovascular diseases (such as coronary heart disease, myocardial ischemia, hypertension, and heart failure). Another study pointed out that heart rate variability can be used as an assessment tool for autonomic nerve activity [
1,
2,
3].
With the development of technology, the pressure on people now comes from life, work, and social communication, and differs due to different encounters. When people need to adapt to various changes in a short time or expect changes in something, even slight changes in life, the long-term occurrence may still cause pressure. The pressure stimulates the brain in the hypothalamus and enables the body to appear unstable through the autonomic nervous system and endocrine system, resulting in symptoms in heart and cardiac vessels, intestines and stomach, as well as other organs, which is dysautonomia. Trimmel M. et al. [
4] proposed heart rate variability (HRV) as a possible measurement of this pressure. Through analyses, they proved that HRV was not only an index parameter related to perceived pressure and cardiovascular diseases but also an important tool index for managing the autonomic nervous system of surgical patients, severe patients, and COVID-19 patients [
4]. Therefore, these parameters may be analyzed to provide doctors with some information as assistance on patient treatments.
Photoplethysmography (PPG) is a non-invasive detection method that detects blood volume changes in living tissue by recording video through a network camera, using an active appearance model to determine facial landmarks and head [
5,
6]. Extracting biometric information from face video images, pre-processing the images by low-pass (LP) filtering and detrending processing, and then generating independent components and comparing them, using FFT to calculate and select the component with a significant maximum in the expected frequency range, is the method used to determine the heart rate [
7,
8]. Amjed S. Al Fahoum used data mining techniques to combine the most critical features of the PPG signal with other demographic information to tell the difference between healthy human subjects and cardiovascular disease (CVD) patients [
9].
Measuring physiological activity remotely can provide substantial advantages for medical applications, and recent foreign studies have proposed different methods for detecting heart rate (HR) using facial recordings. These methods are based on the analysis of subtle color changes in the face caused by cardiovascular activity, which are invisible to the human eye and can be captured by cameras and are tested by analyzing and comparing algorithms using the public database MAHNOB-HCI performance for remote detection of HR [
10,
11]. The rPPG BSS-ICA based was analyzed be robustness of subject motion in [
12].
Using a standard RGB camera to record facial video, extract the signal of the key area of the face and the background, and use the method of joint blind source separation (JBSS) [
13,
14] to remove the common light component in the signal of the key area of the face and the background, and obtain the new face ROI signal, using ICA to extract the pulse signal from ROI signal, using the green channel signal to identify the pulse signal, using the FFT to calculate HR, this method removes illumination changes in order to enhance pulse information extraction and it also solves the problem of disordered output components after ICA, effectively reducing the impact of low-intensity ambient illumination and illumination changes [
7,
15]. Recently, a mathematical model for rPPG measurement which was based on the optical and physiological considerations and the assumption of a single light source with a constant spectrum has been proposed [
16]. The analysis in [
16] shows that combining the models, e.g., plane-orthogonal-to-skin (POS) and chrominance-bass (CHROM) rPPG with different assumptions enables the construction of various algorithms to extract the pulse signal from a video.
The above-mentioned rPPG methods and ICA-based BSS method takes a long time to converge, POS and CHROM need complex model operations, and focus on the analysis of signal-to-noise ratio without discussing the response time and accuracy of heart rate and HRV measurement. Avoiding the above-mentioned disadvantages, this paper provided a non-constant estimation method of HR and HRV with low-cost, fast response time, and better physiological parameters, using RSME and MAPE based on rPPG and ROI. A hybrid ICA and PSO algorithm is employed to speed up the convergence. Therefore, signal processing methods, i.e., waveform processing, BPF, detrended fluctuation analysis (DFA), and FFT, are used to eliminate noise signal. Finally, the single green light is obtained for estimating the values of HR and HRV.
The rest of this paper is organized as follows. In the subsequent sections,
Section 2 illustrates methodology and system description. Experimental results are obtained and described in
Section 3.
Section 4 discusses the findings of this study. Finally, conclusion is given in the last section.
2. Methodologies and System Description
In this paper, methodologies are described as follows.
2.1. Particle Swarm Optimization, PSO
PSO is a stochastic random optimization process which is inspired by the behaviors of social animals, such as a swarm of fish or a flock of birds. It is one of the most powerful evolutionary developments which is capable to optimize a non-linear equation with the least number of solution parameters. The basic concept of PSO relies on the fact of social sharing information. For each solution variable a swarm of particles are taken. The movement of each particle is controlled by its current position and velocity. At each step each particle remembers its local best position and global best position. For each variable, the optimum position of the particle is denoted as the global best, while local best denoted the last updated optimum position of the corresponding particle.
The optimality of a particle is checked according to the problem statement [
17]. For a given particle
Pij at the
kth iteration position, the velocity updating formulae are given below.
Here, i and j varies from 1 to NP and 1 to NG, respectively. Where NP is number of particles in the swarm and NG is the number of variables in the problem.
Here, = velocity of the ith particle of jth variable at iteration k + 1, = position of the ith particle of the jth variable at iteration k + 1, w = inertia weight factor, C1 and C2 are acceleration constant, and R1 and R2 are random values.
2.2. Independent Components Analysis, ICA
The concept of ICA was introduced in the early 1980s by J. Herault, C. Jutten [
18] in order to solve the BSS problem. As can be seen in Equation (3), the observations are considered as linear combinations of independent sources
where
x,
s, and
A are the observation vector, the vector of independent sources, and the mixing matrix, respectively. The main goal is to find the separator matrix
W, from observation vector
x to form the estimated sources vector, which is yield as follows
where
is the vector of estimated sources.
W is obtained by the PSO method with fast convergence in this paper.
2.3. Signal Preprocessing
Using the dlib facial recognition algorithm to detect facial features, the system confirms the presence of the subject’s face in the captured image. The webcam’s captured image is displayed, and the system uses feature points to outline the XY axis, creating a region of interest (ROI). The system then performs a segmentation of the detected area to reduce noise interference when analyzing the image. After capturing the ROI, the system will separate the RGB color channels and extract the green channel.
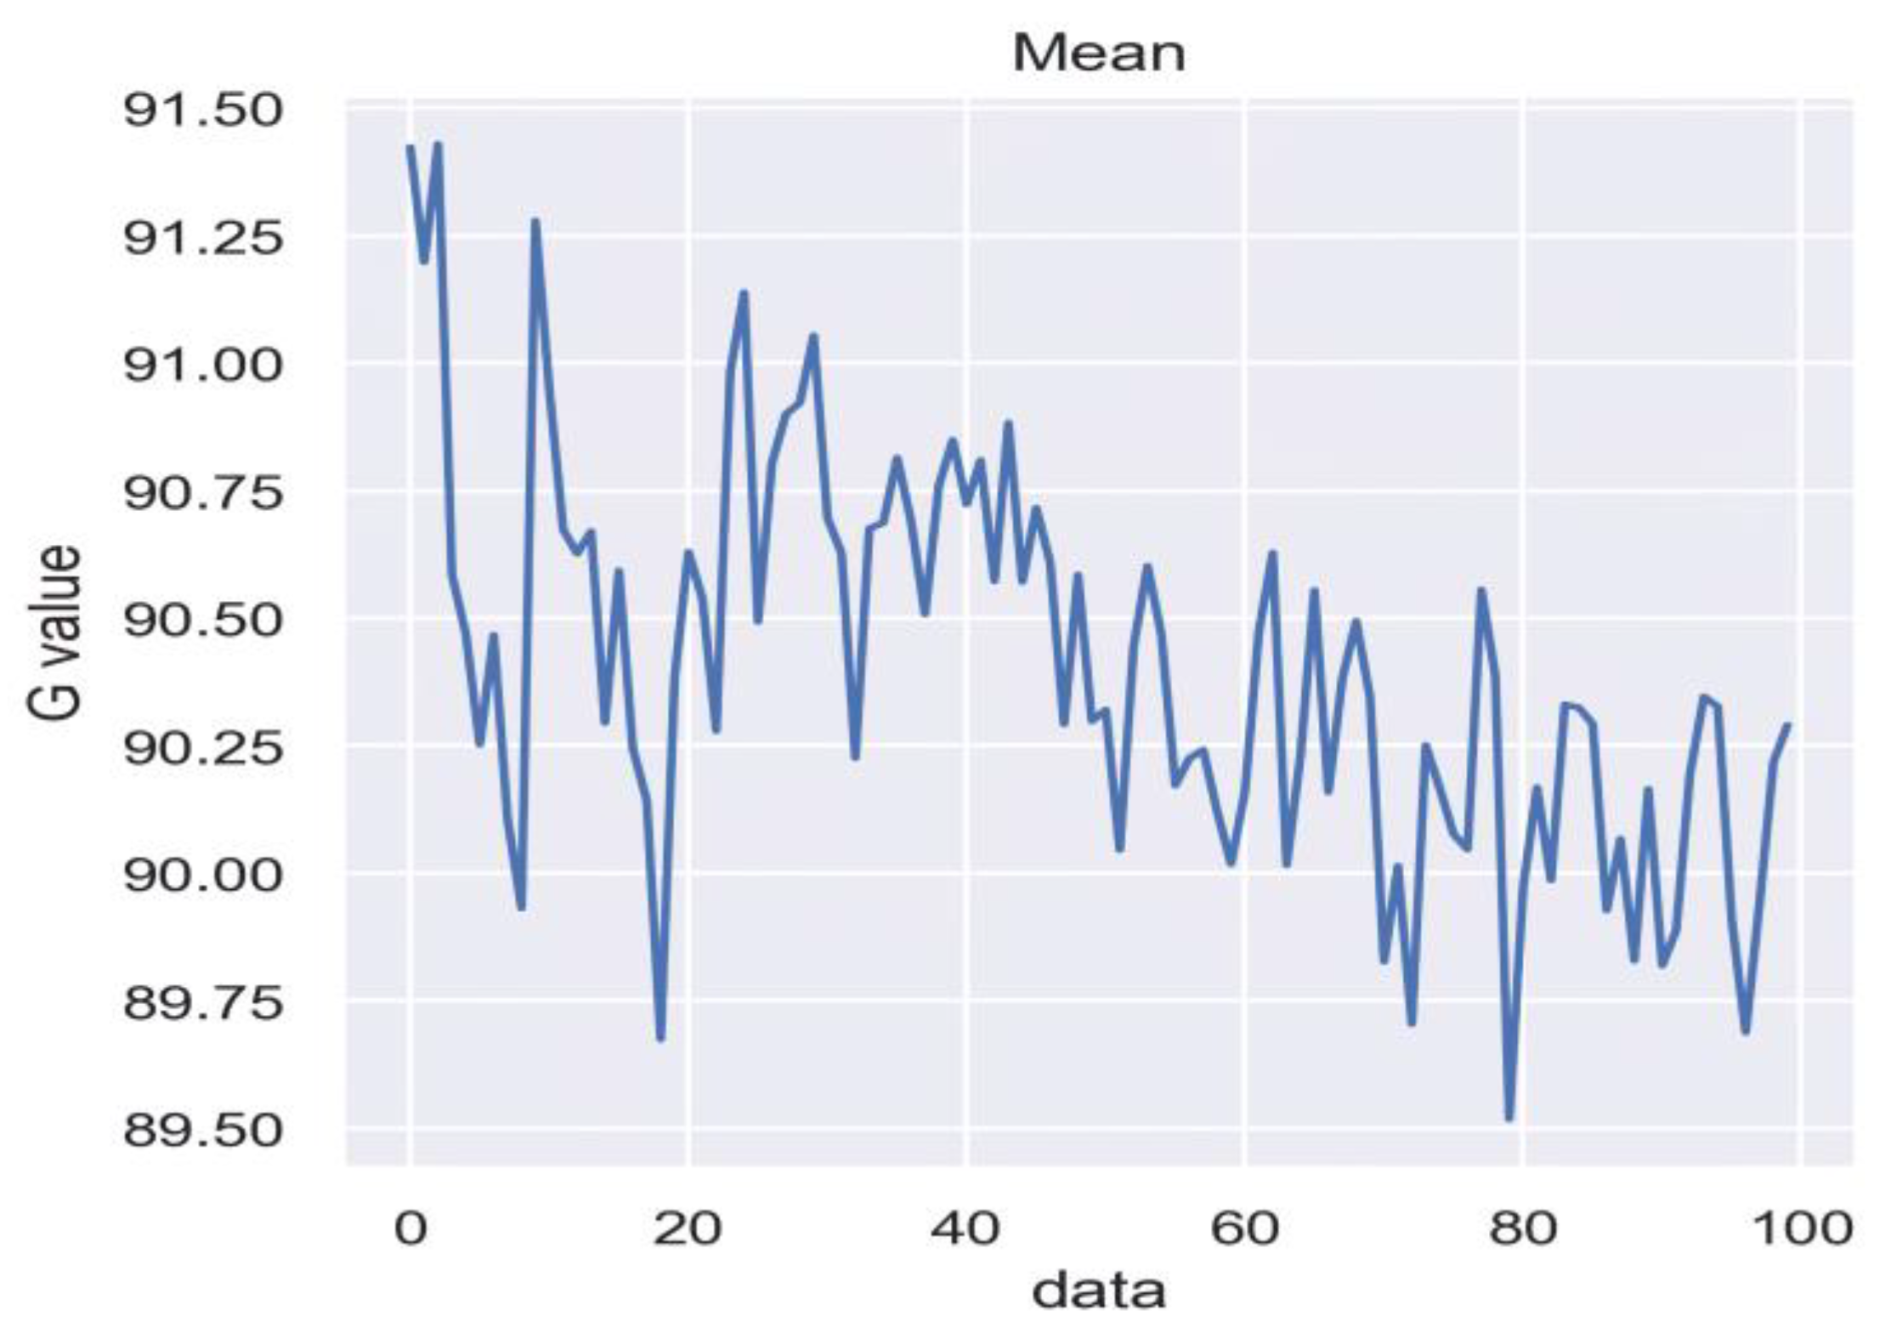
The system will measure for about 10 s and obtain an average by capturing the green channel image through the system. It will accumulate a signal sequence for each captured image, as shown in
Figure 1.
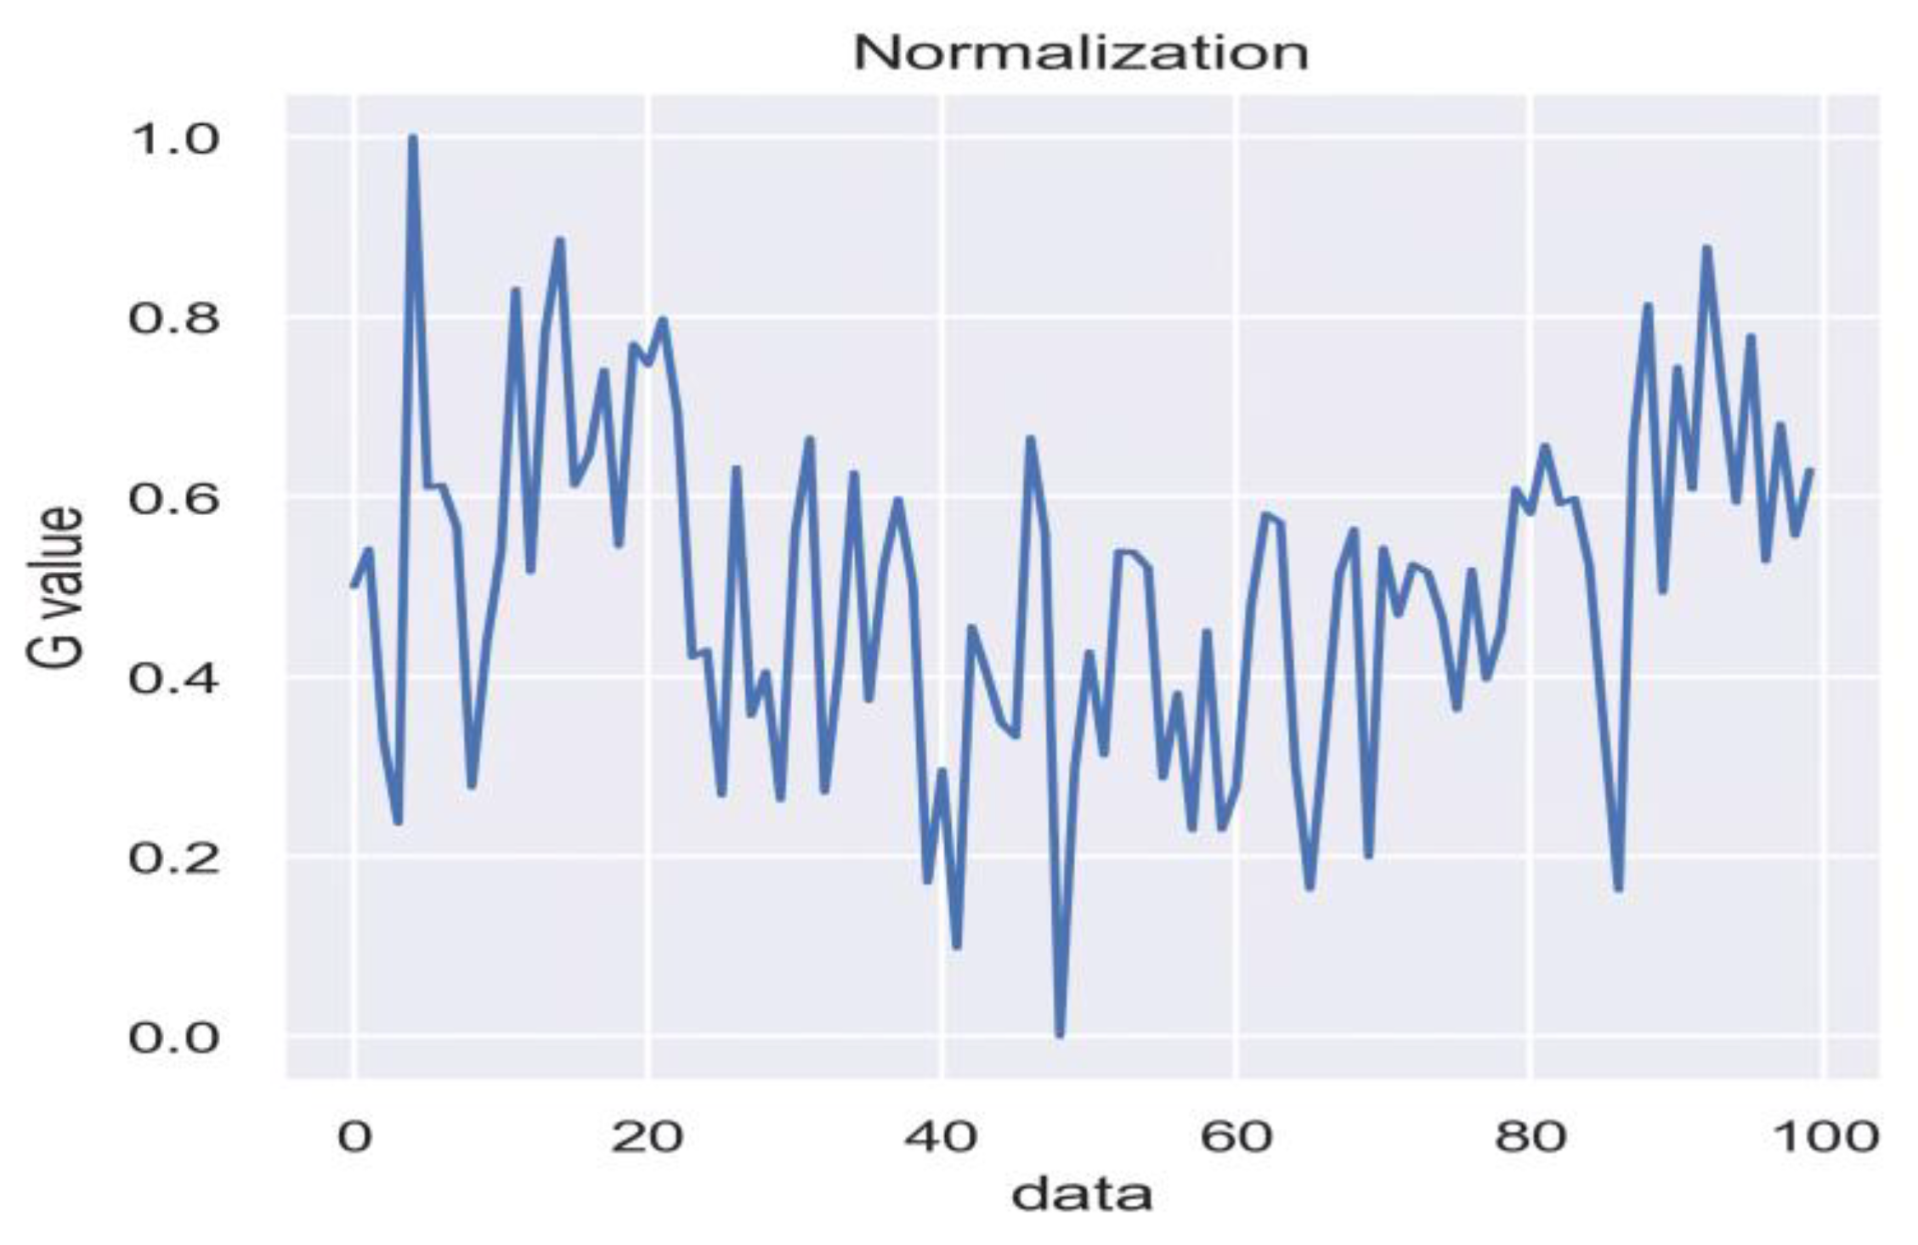
As shown in
Figure 2, normalizing the signal sequence can reduce the offset affected by head movement. Then, the signal is adjusted to level 0 by performing detrend analysis of the signal fluctuation, as shown in
Figure 3.
2.3.1. Waveform Processing
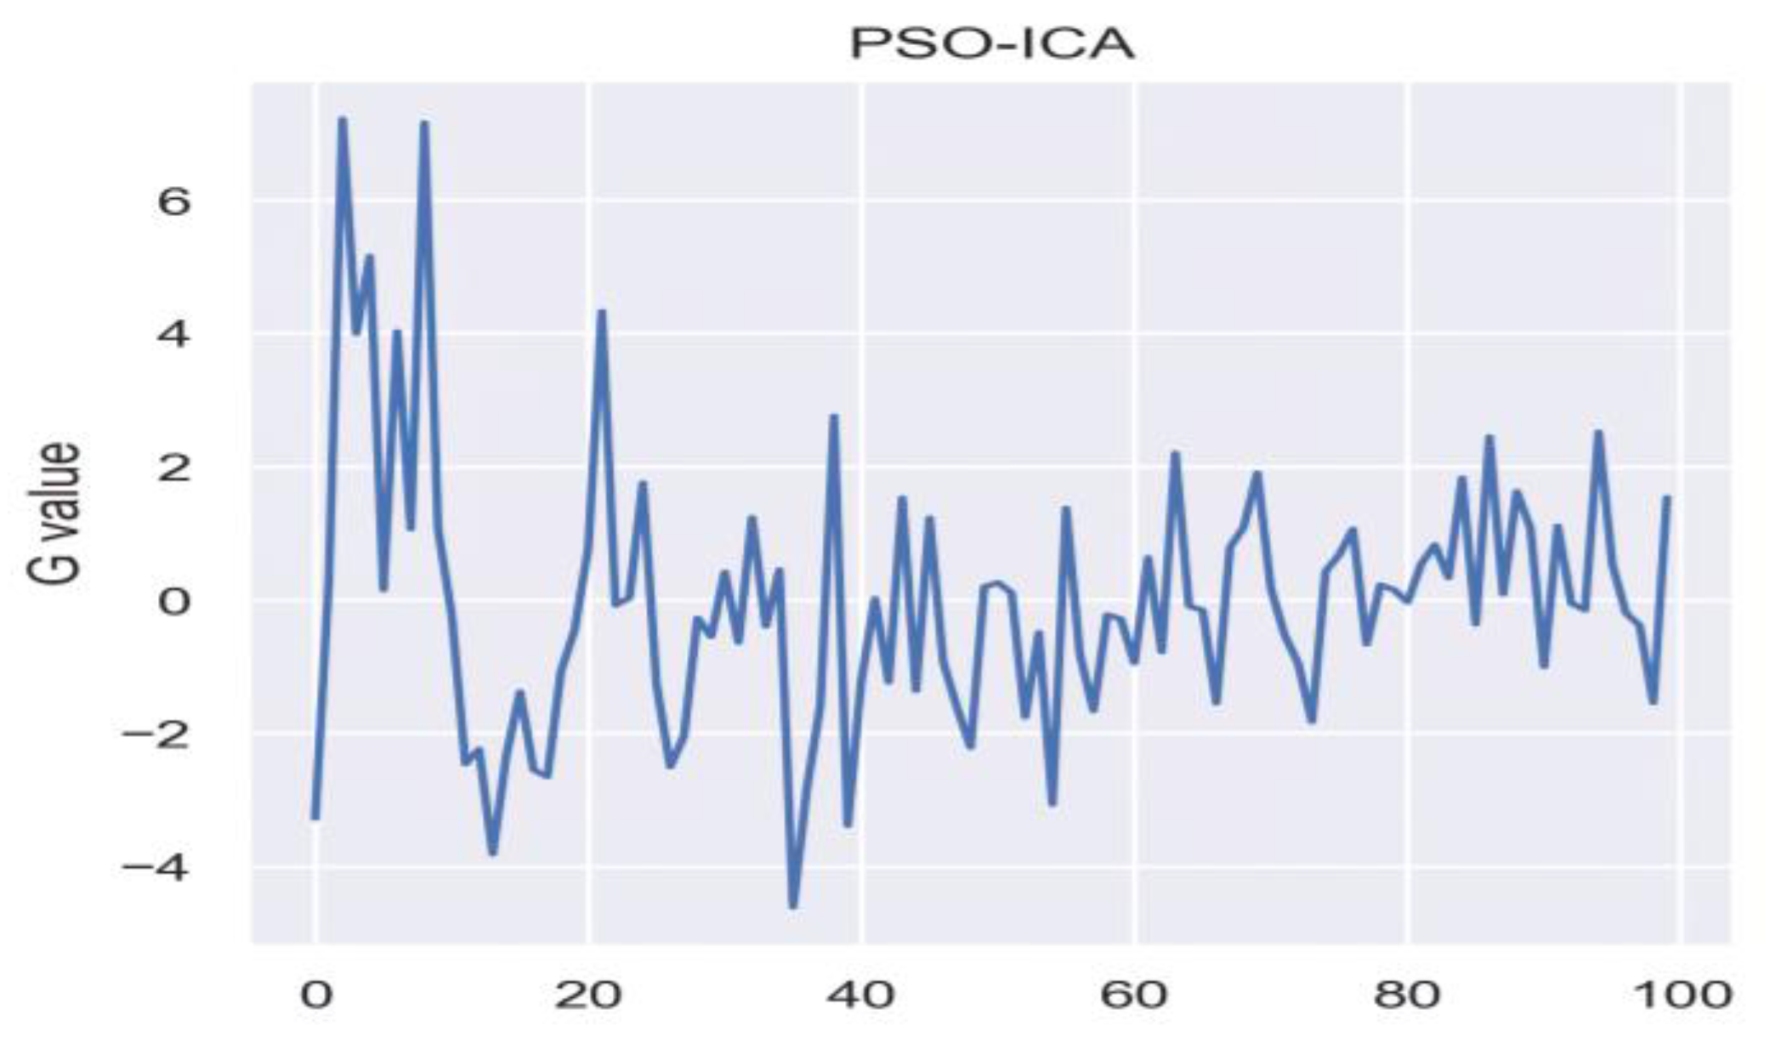
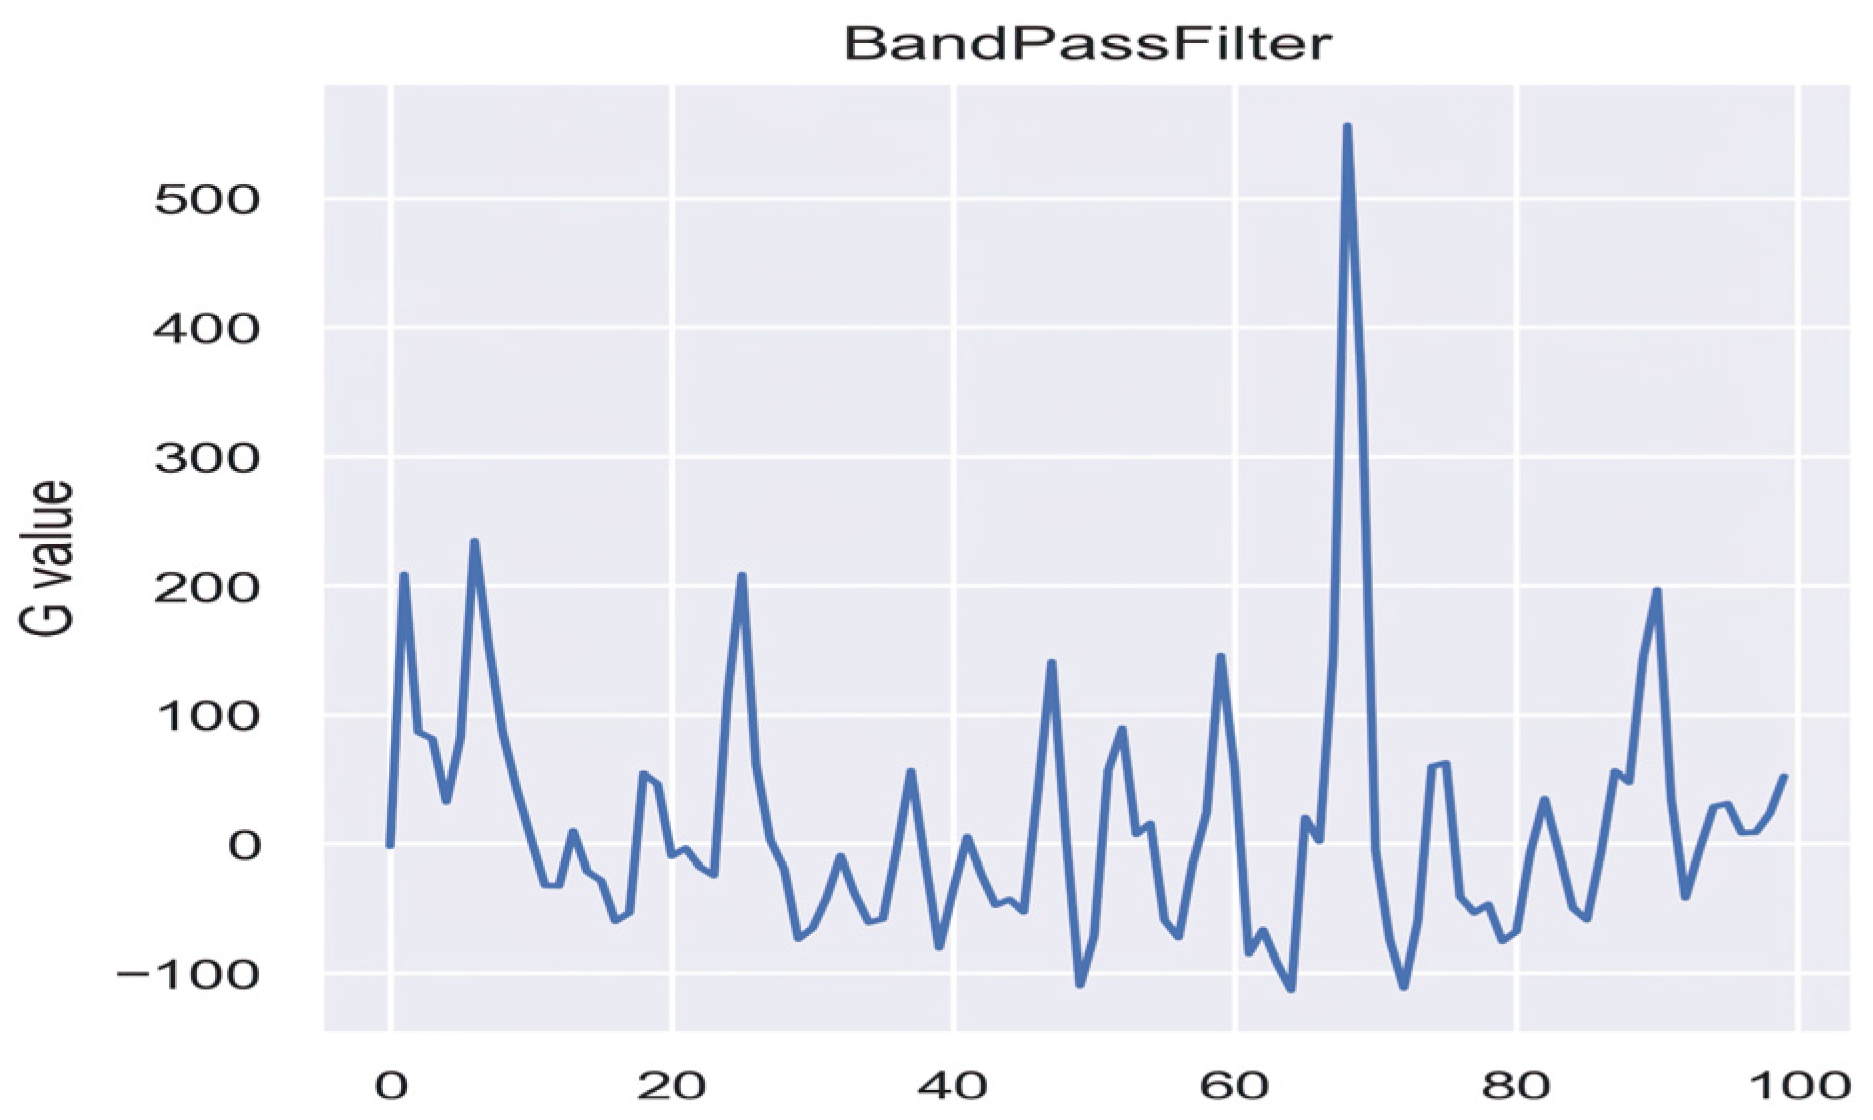
The measurement of RPPG is often affected by ambient light. PSO-ICA is used here to eliminate interference caused by light, as shown in
Figure 4. Then, the noise is filtered out and the signal is amplified by a band-pass filter with a range of 0.4~10 Hz, as shown in
Figure 5. Finally, peak-to-peak detection is performed, and the time difference between peaks is calculated using the frame rate to determine the data processing time.
2.3.2. Frequency Domain Transformation
As shown in
Figure 6, the bandpass filtered waveform is transformed into the frequency domain using FFT, and the heart rate is calculated using a formula. The HF and LF frequency bands are filtered out using the bandpass filter, and then transformed into the frequency domain using power spectral density, as shown in
Figure 7. HRV parameters are calculated using a formula.
Calculating Heart Rate and HRV Parameters
The measured values need to be converted into values that we can understand through some formulas and algorithms. The following time-domain parameters are defined as Standard deviation of Normal to Normal intervals (
SDNN) (5) and root mean square of successive differences (
RMSSD) (6).
In which
RR is the duration between two consecutive R-peaks of heartbeats,
N is the number of
RR intervals,
RRi is the duration of the
RR interval, and
is the mean duration of all
RR intervals.
The definition of frequency domain parameters includes the trapezoidal formula
f(
x) (7), as shown in
Figure 8, to calculate the area under the power spectral density spectrum in the frequency domain range. The abbreviations of the frequency domain parameters are defined as follows, Heart Rate (
HR) (8), Very Low Frequency (
VLF) represents power within the extremely low frequency range (9), Low Frequency (
LF) represents power within the low frequency range (10), and High Frequency (
HF) represents power within the high frequency range (11).
This study uses normalized
HF,
LF, and
LF/HF ratio for validation, which are defined as follows, normalized low frequency power (
nLFP) (12), normalized high frequency power (
nHFP) (13), and the ratio of low to high frequency power (14).
2.3.3. Bandpass Filter
The main purpose of the Bandpass filter is to eliminate waveform noise and reduce feature space. The heart changes its frequency almost every heartbeat, which is reflected as a carrier frequency variation. This paper uses the Bandpass filter to isolate the carrier frequency of the heartbeat. According to reference [
19], Kohler proposed that the typical frequency component range of the QRS complex is approximately 0.4 Hz to 10 Hz. Therefore, in this study, the filter is set at 0.4~10 Hz, and two frequency bands of HRV are defined, (1) the LF band is from 0.045 to 0.15 Hz and (2) the HF band is from 0.15 to 0.4 Hz.
2.3.4. Power Spectral Density, PSD
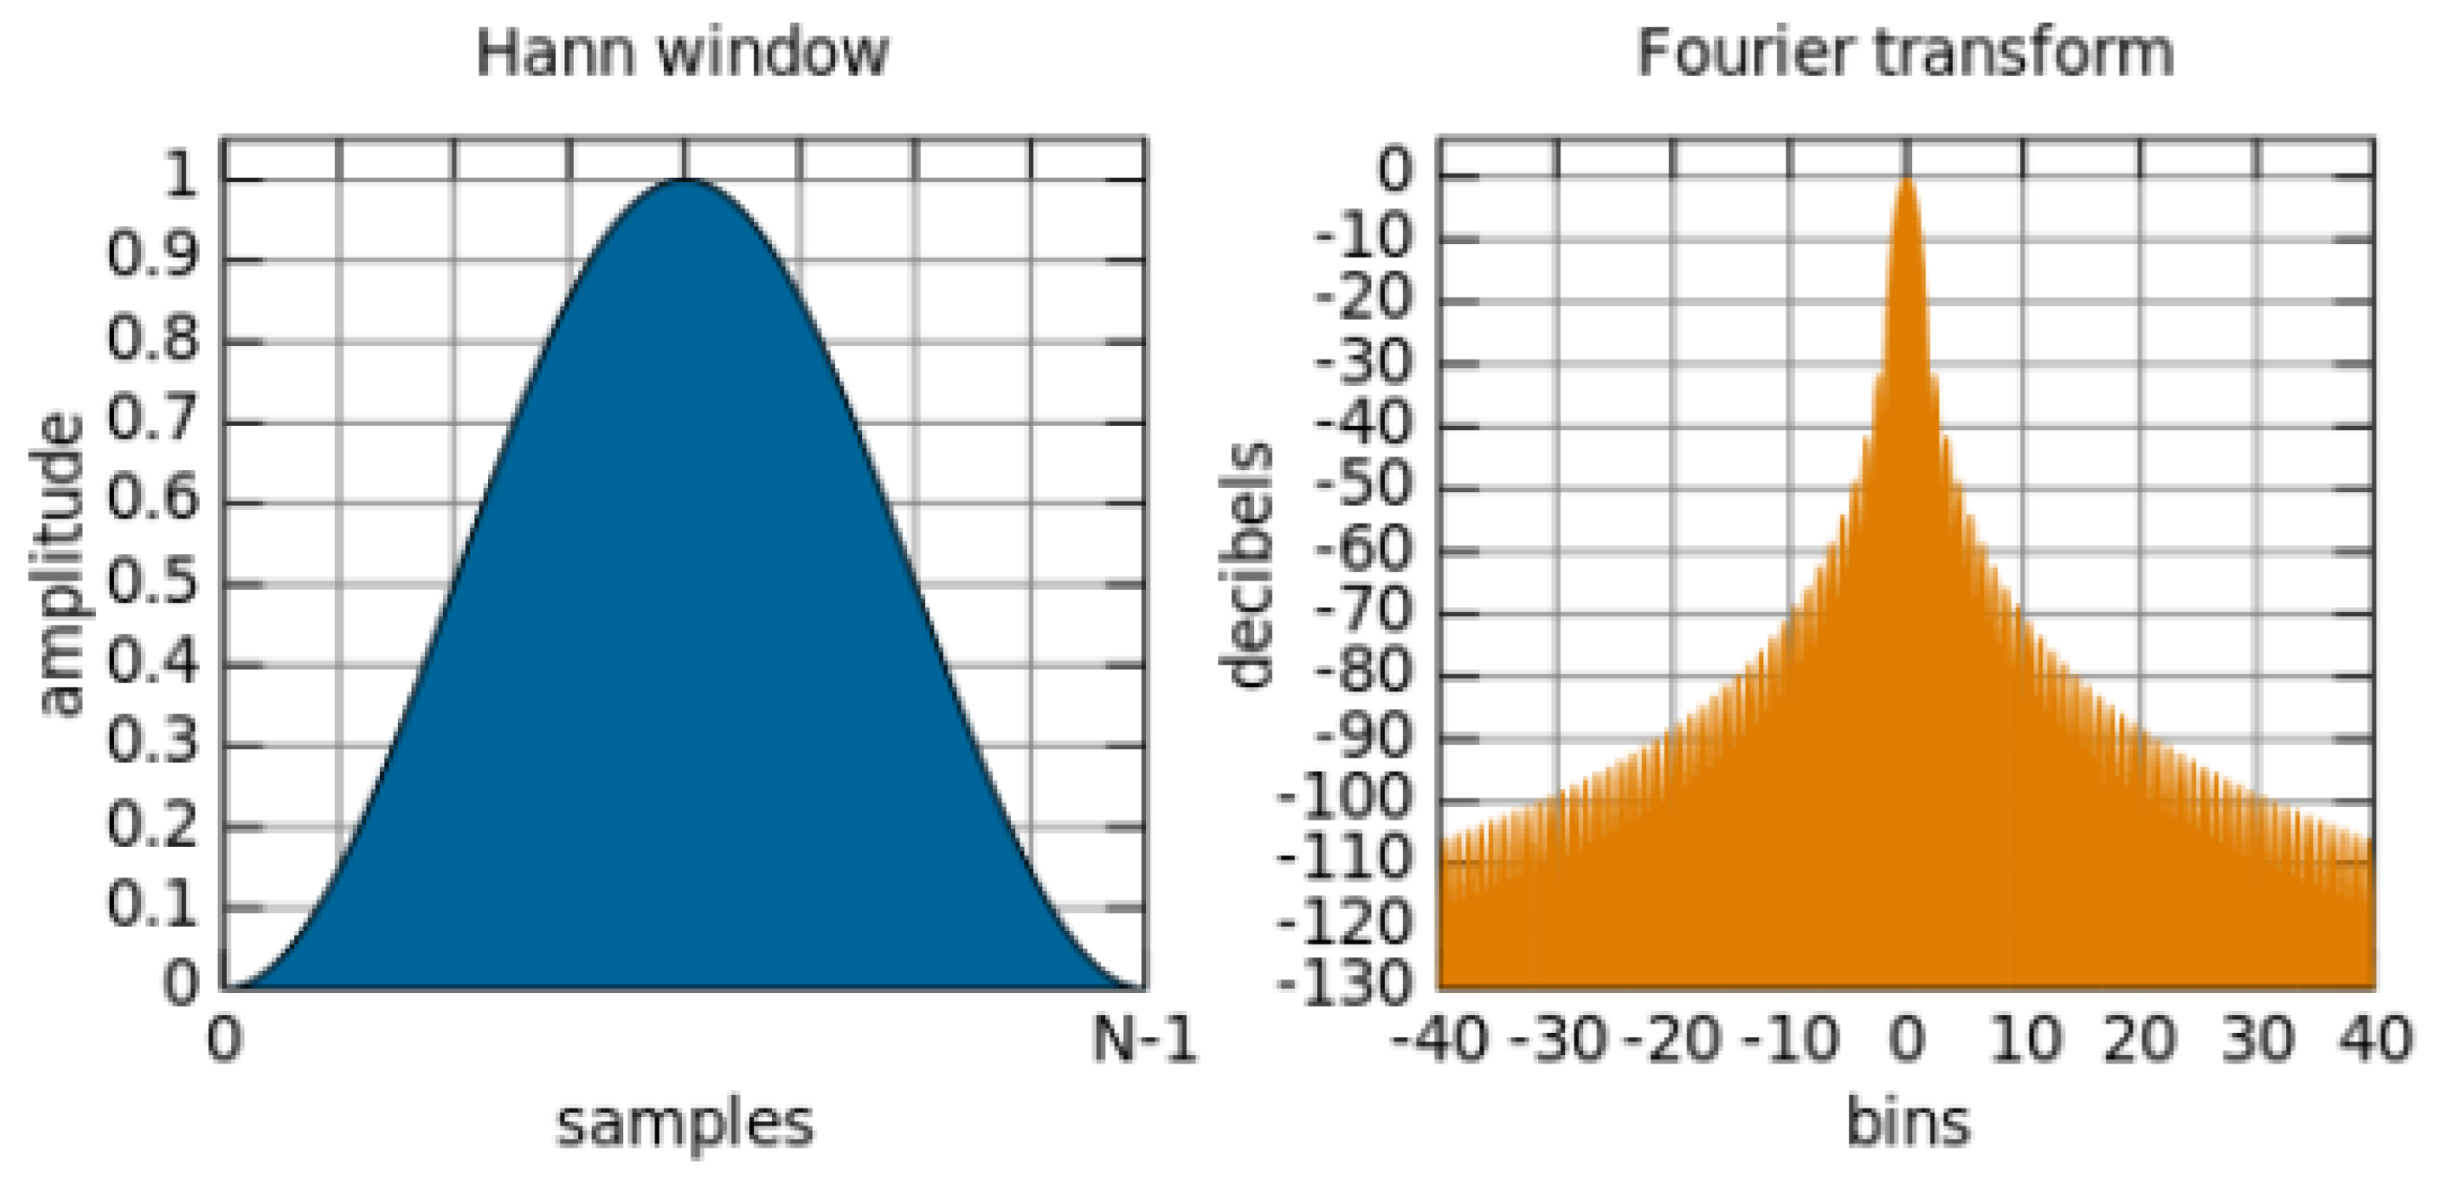
In this paper, FFT was used with the Hanning window method to achieve visualization, as shown in
Figure 9. The Hanning window function is defined as W(
t) (Equation (16)), and it was used to better reduce spectral energy leakage. The signal was transformed using a sampling rate of 10 Hz, and PSD integration was used to divide the signal into three frequency bands, Very Low Frequency (VLF: 0–0.2 Hz), Low Frequency (LF: 0.20–0.75 Hz), and High Frequency (HF: 0.75–3.0 Hz). Each band has a spectrum estimated by the Hanning window, and the area was calculated using the trapezoidal rule. Finally, the LF/HF ratio was calculated to evaluate the balance between sympathetic and parasympathetic nervous systems.
2.4. System Architecture
The system structure is as shown in
Figure 10. First, through the charge-coupled component image sensor on the webcam, when the light was projected onto the sensor surface, a charge signal was generated and then converted into a voltage signal to produce and output an image according to the timing. Second, the analog voltage signal was converted into a digital signal through the analog-to-digital converter (ADC) and transferred to the PC through the USB. Afterwards, image recognition and digital signal processing were used for data calculation and analysis to obtain the user’s physiological signal and calculate the physiological parameters for the heart rate and HRV. The purpose of this study was to provide the system to physicians as a diagnostic tool to improve efficiency and reduce the rate of misdiagnosis.
System:
- ■
Operation System: WindoWs 10 Professional (×64);
- ■
- ■
Memory: 16 GB DDR3 1333 MHz;
- ■
Developer Interface: TensorfloW-Keras (Spyder4.2.0);
- ■
Program: Python3.6;
- ■
WebCam: E-books E-PCC072 (1080 p/30 fps);
- ■
Dynamic Resolution: 1920 × 1080.
2.5. Spyder Compile Software
The system was developed using the Spyder compiler software in an environment based on the Python language. Based on an interactive development environment for algorithm development, data analysis, and numerical computation, Spyder is an integrated development environment (IDE) that uses an open-source code for cross-platform scientific computing based on the Python language. It provides functions such as advanced code editing, interactive testing and debugging, computational science, data processing, and predictive analysis, and it supports multiple programming languages and operating systems.
2.6. Experimental Procedure
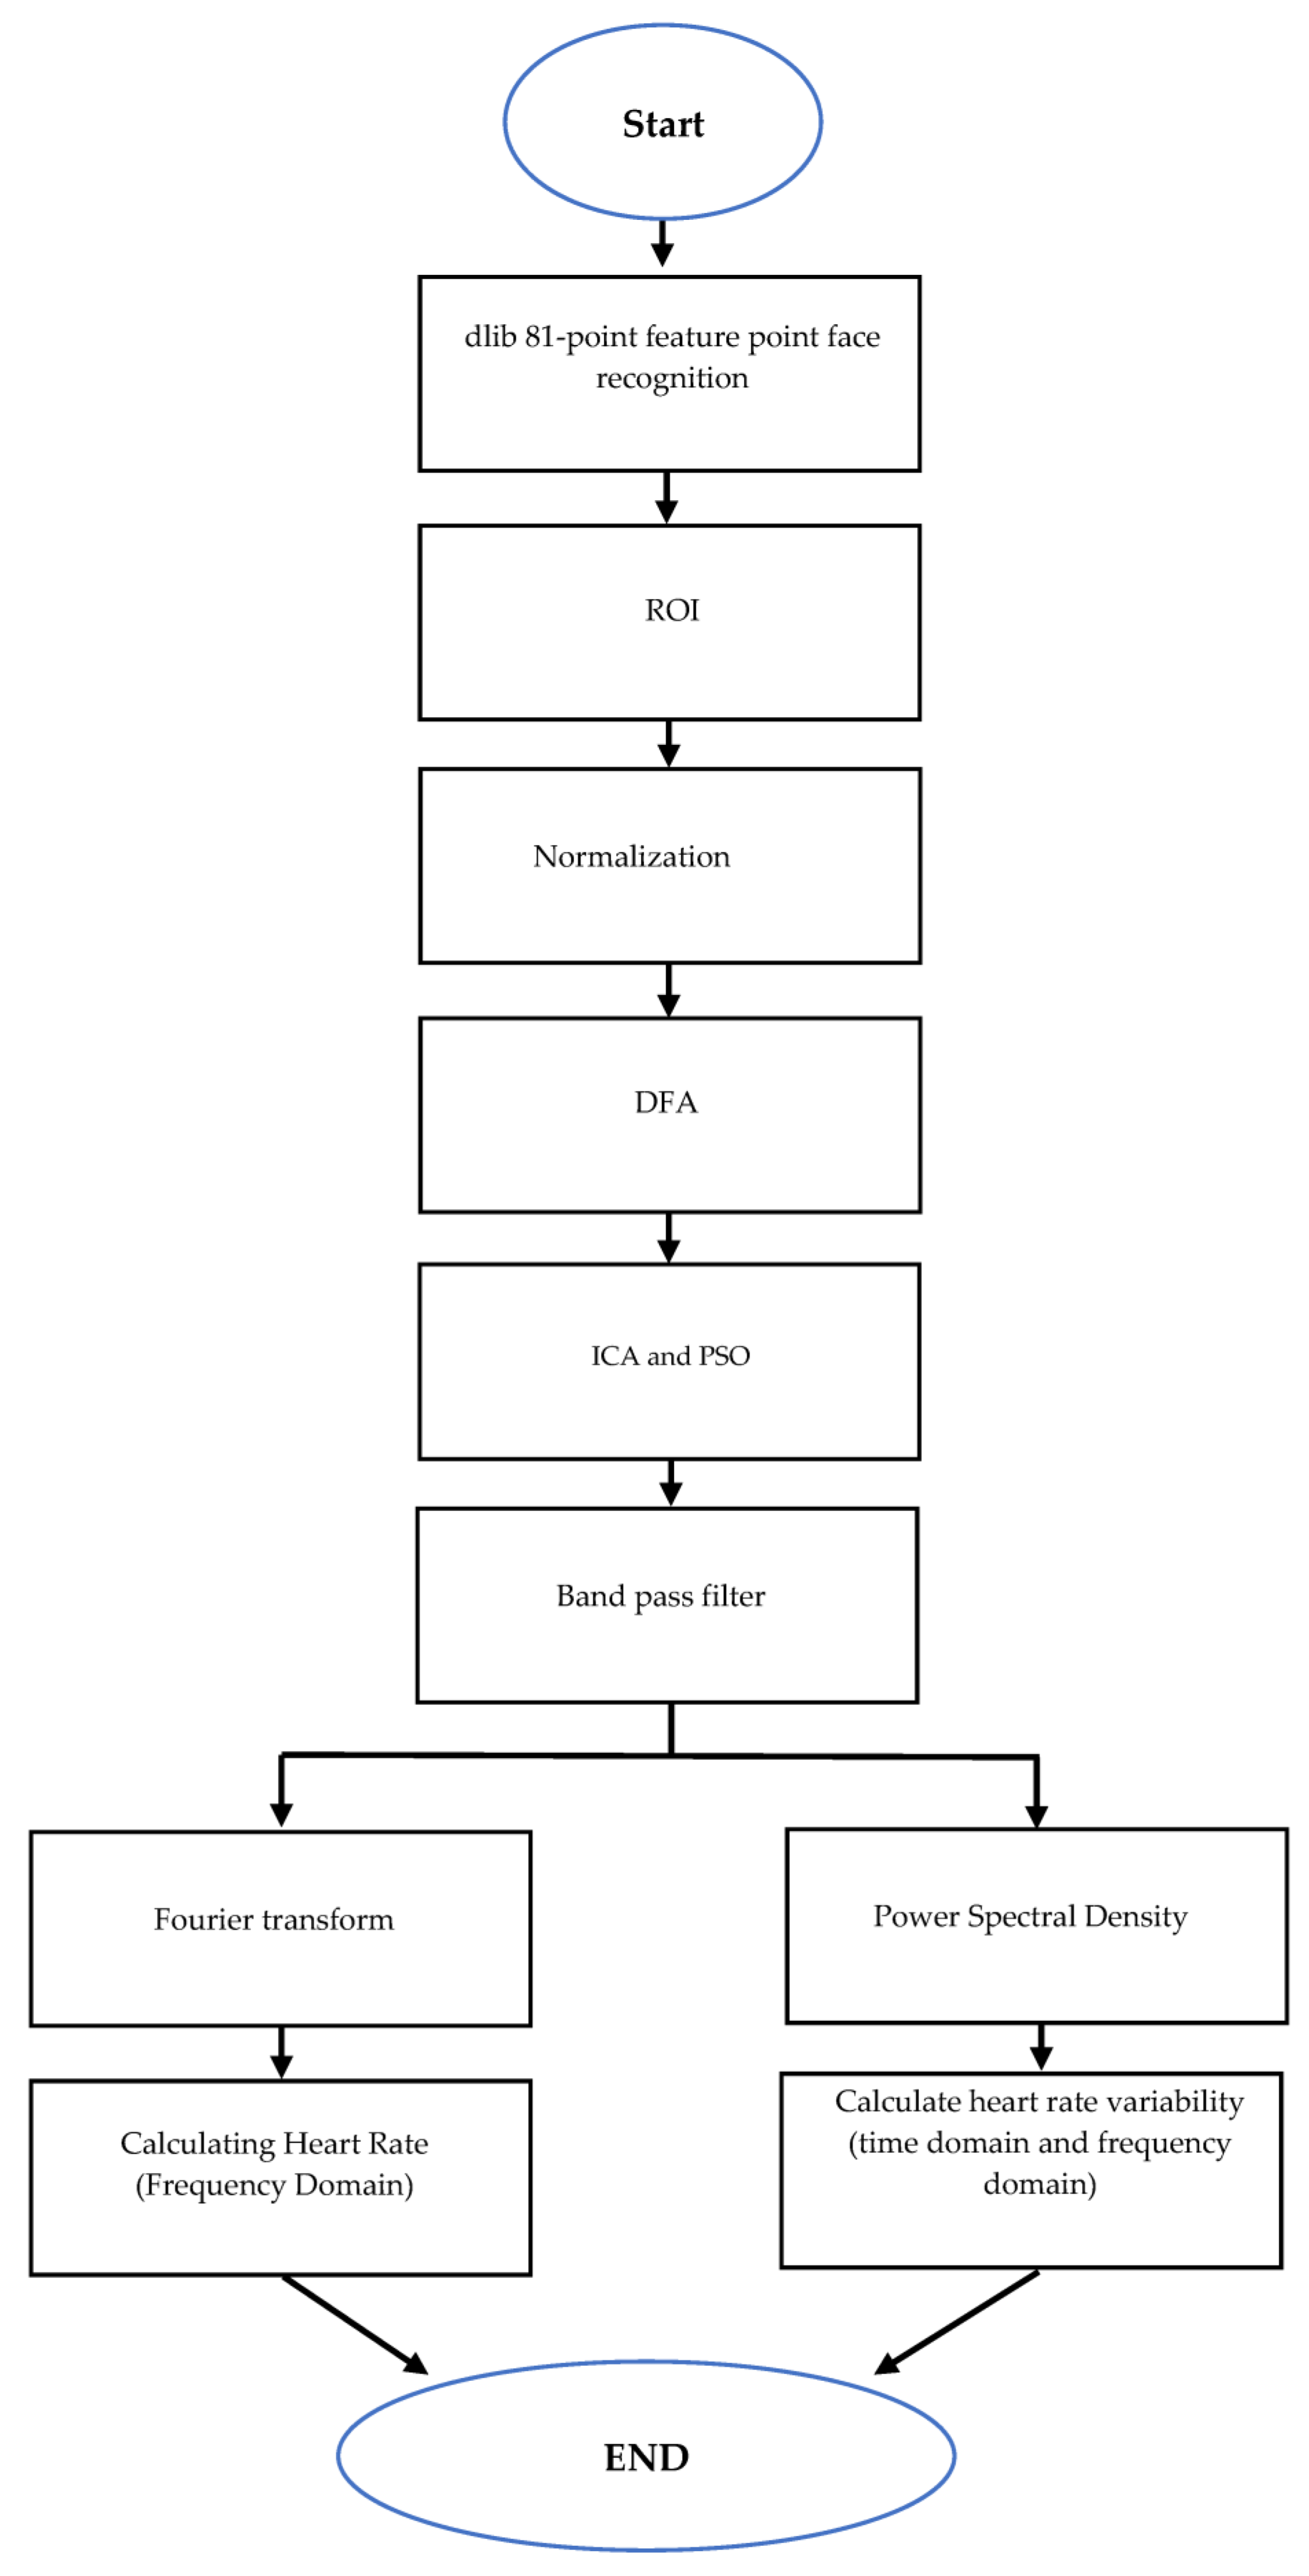
The flowchart of the experimental steps is depicted in
Figure 11. The system was divided into pre-signal processing, waveform processing, frequency conversion, and calculation of physiological parameters.
- (1)
This study obtained images through a webcam, used dilb’s 81-point face recognition algorithm to set up a region of interest to reduce the impact of the subject’s head shaking, separated the images from the region of interest into three RGB channels and extracted the green channel, and averaged the extracted green channels for each image to form a sequence.
- (2)
This study conducted a detrended fluctuation analysis (DFA) of the signal and normally adjusted the signal level, removed the waveform artifacts through ICA combined with particle cluster optimization, and, finally, used a band-pass filter to sort the bandwidths for heart rate and HRV.
- (3)
The waveform filtered by the band-pass filter was transformed through the FFT algorithm to convert the time sequence of the heartbeat signals into a frequency domain to find and output the highest peak of the waveform. The heart rate variabilities of very low frequency, low frequency, and high frequency were presented according to their power spectral density (PSD).
- (4)
Finally, the physiological signals measured were converted into understandable values through formula calculations.
3. Results
3.1. Participants
This study tested 20 males and females ranging in age from 20 to 30 years old. Seven conditions, namely, 50 cm and 100 cm in distance; the area of interest covering the forehead and the forehead plus cheeks; an illumination level below 200 lumens; an illumination level of 350 to 550 lumens; and an illumination level over 600 lumens at 50 cm from the area of interest covering the forehead plus cheeks, were divided to provide test data for this study. This chapter presents the accuracy evaluation indicators, the study results, and the data analysis of the seven conditions, and discusses the experimental results and analyzes the discrepancies.
3.2. Experimental Protocol
The experimental purpose of the study is an auxiliary diagnostic tool, so the final judgment result can only be obtained based on the analysis of the pathology report and the professional experience of the physician, so this study uses
RMSE and mean absolute error percentage (
MAPE) is the accuracy evaluation index, and the calculation method is shown in Formulas (17)–(19). Therefore, the accuracy of the system can be obtained by observing the above two indexes in this study.
where
yi is the actual value of the
i-th sample,
is the measured value of the
i-th sample, and 𝑛 is the total number of test samples.
In order to analyze the accuracy of the system and the effect of ambient light on the system, this study measured the heart rate and HRV of the 20 subjects measured by the statistical system and the instrument against the calculated error. The performance of the system at the following two measurement distances was as shown in
Table 1.
The error of each parameter was recorded at a distance of 100 cm, as shown in
Table 1. According to the above results, it could be seen that the measurement at 50 cm was more accurate than that at a distance of 100 cm. Therefore, the following measurements on the forehead and the forehead plus cheeks were measured from 50 cm.
3.3. Capture Area
Since this research experiment uses the extracted face area to analyze the heart rate and HRV parameters, the forehead and forehead plus cheek tests are used, respectively, and the following measurements and statistics are made with five men.
As shown in
Table 2, by comparing the RMSE and the mean absolute error percentage of the forehead and forehead plus cheeks, it is found that the error of the forehead is higher than the error of the forehead and cheeks. The forehead and cheeks, which can respond physiologically, can also reduce the interference of picking up hair.
3.4. Illumination
The experimental method of this research is the principle of light reflection, so the intensity of light will indirectly affect the experimental value. The following statistics are mainly used to test the performance of the system under various lighting conditions, where the illuminance is below 200 lumens, 350~550 lumens, and above 600 lumens; the forehead and cheek measurements were taken at a measurement distance of 50 cm for analysis. The heart rate measured below represents the performance of this research on various light levels, and the data are expanded, as shown in Appendices 13 to 15, and its error statistics are shown in
Table 3.
As the experimental method used in this study was based on the principle of light reflection, the intensity of the light would indirectly affect the value of the experiment. The following statistics were mainly used to test the performance of the system under various illumination conditions, including below 200 lumens, 350 to 550 lumens, and above 600 lumens, respectively. The forehead and the forehead plus cheeks were measured at a distance of 50 cm for analysis. The following measured heart rates represent the performance of the system under different illumination conditions, and the error statistics are shown in the table.
As shown in
Table 3, it can be seen that the measurement is better in an environment with an illuminance of 350–550 lumens. In other environments with more extreme light, it is realized by turning off the lights and supplementing the light of the table lamp. It may be a deliberately created environment, so the error presented is relatively large.
From the above, it can be seen that the light intensity is 350~550 lumens, the measurement distance is 50 cm, and the measurement of the forehead and cheek is the best environment for this research. The accuracy of various physiological parameters is RMSE of heart rate 1.968 bpm and MAPE 2%, SDNN’s RMSE is 1.85 ms, MAPE is 4.87%, HF’s RMSE is 1.77%, MAPE is 3.95%, LF’s RMSE is 1.77%, and MAPE is 2.425%. As a result, an illumination condition of 350 to 550 lumens was suitable for measurement. The other extreme light conditions were implemented by turning off the lights and supplementing them with reading lamps. It was possible that because the environment was deliberately created, the errors were relatively large. From the above, an illumination level of 350 to 550 lumens and a measuring distance of 50 cm was optimal for this study to capture the forehead and cheeks for measurement, and the accuracy of each physiological parameter was the RMSE of the heart rate.
5. Discussion
This study improved many methods of the algorithm flow, as shown in the comparison table of performance algorithm flow, which compared the algorithm flow for the extracted physiological signal of this study with that of Mannapperuma et al. [
5] and Zhang et al. [
7]. This paper adjusted the wavefront levels through a detrended fluctuation analysis, which could improve the accuracy of the heart rate and HRV. Additionally, the proposed PSO-ICA could substantially reduce the computing time of the system and improve the problem of ICA iterating locally optimal solutions in the case of poor initial values. In the meantime, expanding the ROI from capturing the forehead to the forehead plus cheeks confirmed that the measurement accuracy could be improved by capturing the forehead plus cheeks. The results showed a heart rate error of 2%, indicating a decline of 4.038% from the error of the previous forehead measurement.
Nowadays, physiological parameters are mainly measured with contact light volume descriptors using electrocardiograms, ultrasonic sensors, or piezoelectric sensors. In recent years, the research literature has explored the performance and error of non-contact measurements and the comparison with the above techniques. As shown in
Table 4, compared with the study results of other scholars, the mean absolute percentage error of the heart rate measurements proposed in this study was validated by a medical device licensed by the Ministry of Health and Welfare in Taiwan at 2%, less than the error values of the methods proposed by other scholars. In addition, the time required for taking a measurement using the method put forward by this study was shorter than those proposed by other scholars.
- Remark 1
This paper only takes the staff and students of a university in the south as the experimental data objects.
- Remark 2
The experimental distance in this paper is 50 cm~100 cm, if it exceeds the range, it will affect the experimental value.
- Remark 3
Since the light in this research will affect the experimental results, the research is only carried out in a bright place under the illumination of 350~550 lux.
- Remark 4
During the measurement process of this paper, try to keep still and breathe spontaneously, and do not shake excessively, turn the face or shift the detection angle, which will cause misjudgment.
Currently on the market, the signal of the contact optical volumetric descriptor is combined with the electrocardiogram, ultrasonic sensor, or piezoelectric sensor to measure physiological parameters. In recent years, research literature discusses non-contact measurement. The measurement performance and error, as well as the comparison with the above-mentioned related technologies, as shown in
Table 5. The research results of this paper are compared with that of other scholars. The heart rate measurement proposed in this paper is verified by the medically licensed instrument of the Taiwan Department of Health. The MAPE is 2.2%. The error value of the method proposed by other scholars is smaller, and the time required for its measurement is shorter than the method proposed by other scholars.


 ,
, 


