

Three-Dimensional Distributions of the Direct Effect of anExtended and Intense Dust Aerosol Episode (16–18 June 2016) over the Mediterranean Basin on Regional Shortwave Radiation, Atmospheric Thermal Structure, and Dynamics

 , , , and
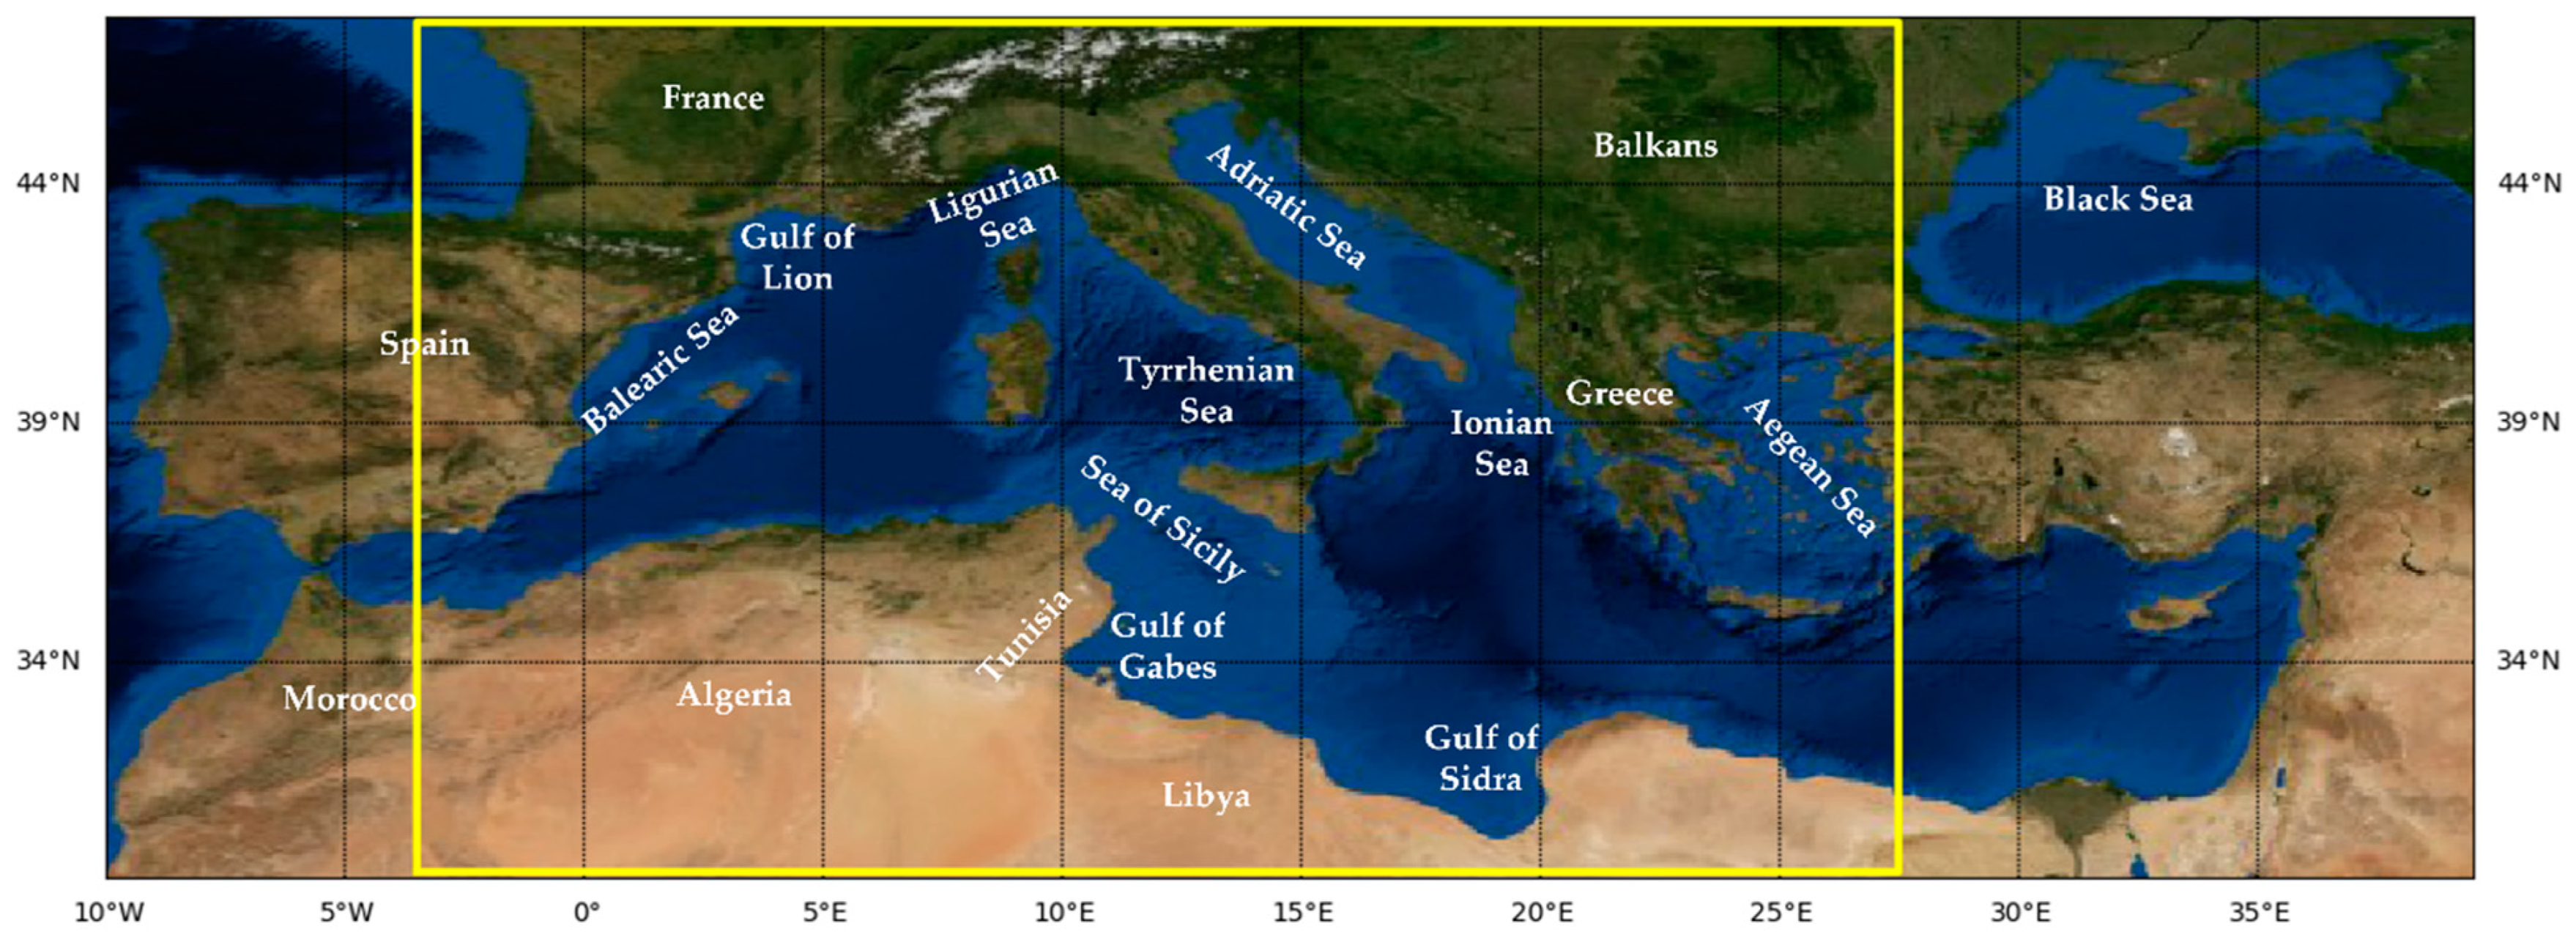
Abstract
:1. Introduction
2. Materials and Methods
2.1. The Determination of the Dust Episode Case
2.2. BSRN, CERES, and AERONET Data
2.3. MERRA-2 Data
2.4. ISCCP-H Data
2.5. The FORTH RTM
3. Results and Discussion
3.1. Aerosols, Clouds, and Solar Fluxes during the Evolution of DAEC
3.2. Geographical Distribution of DDREs
3.3. Vertical Profiles of DA Effects on SW Radiation, Thermal Structure, and Atmospheric Dynamics
3.4. The effect of DA on Buoyancy
3.5. Regional Mean DDREs
4. Summary and Conclusions
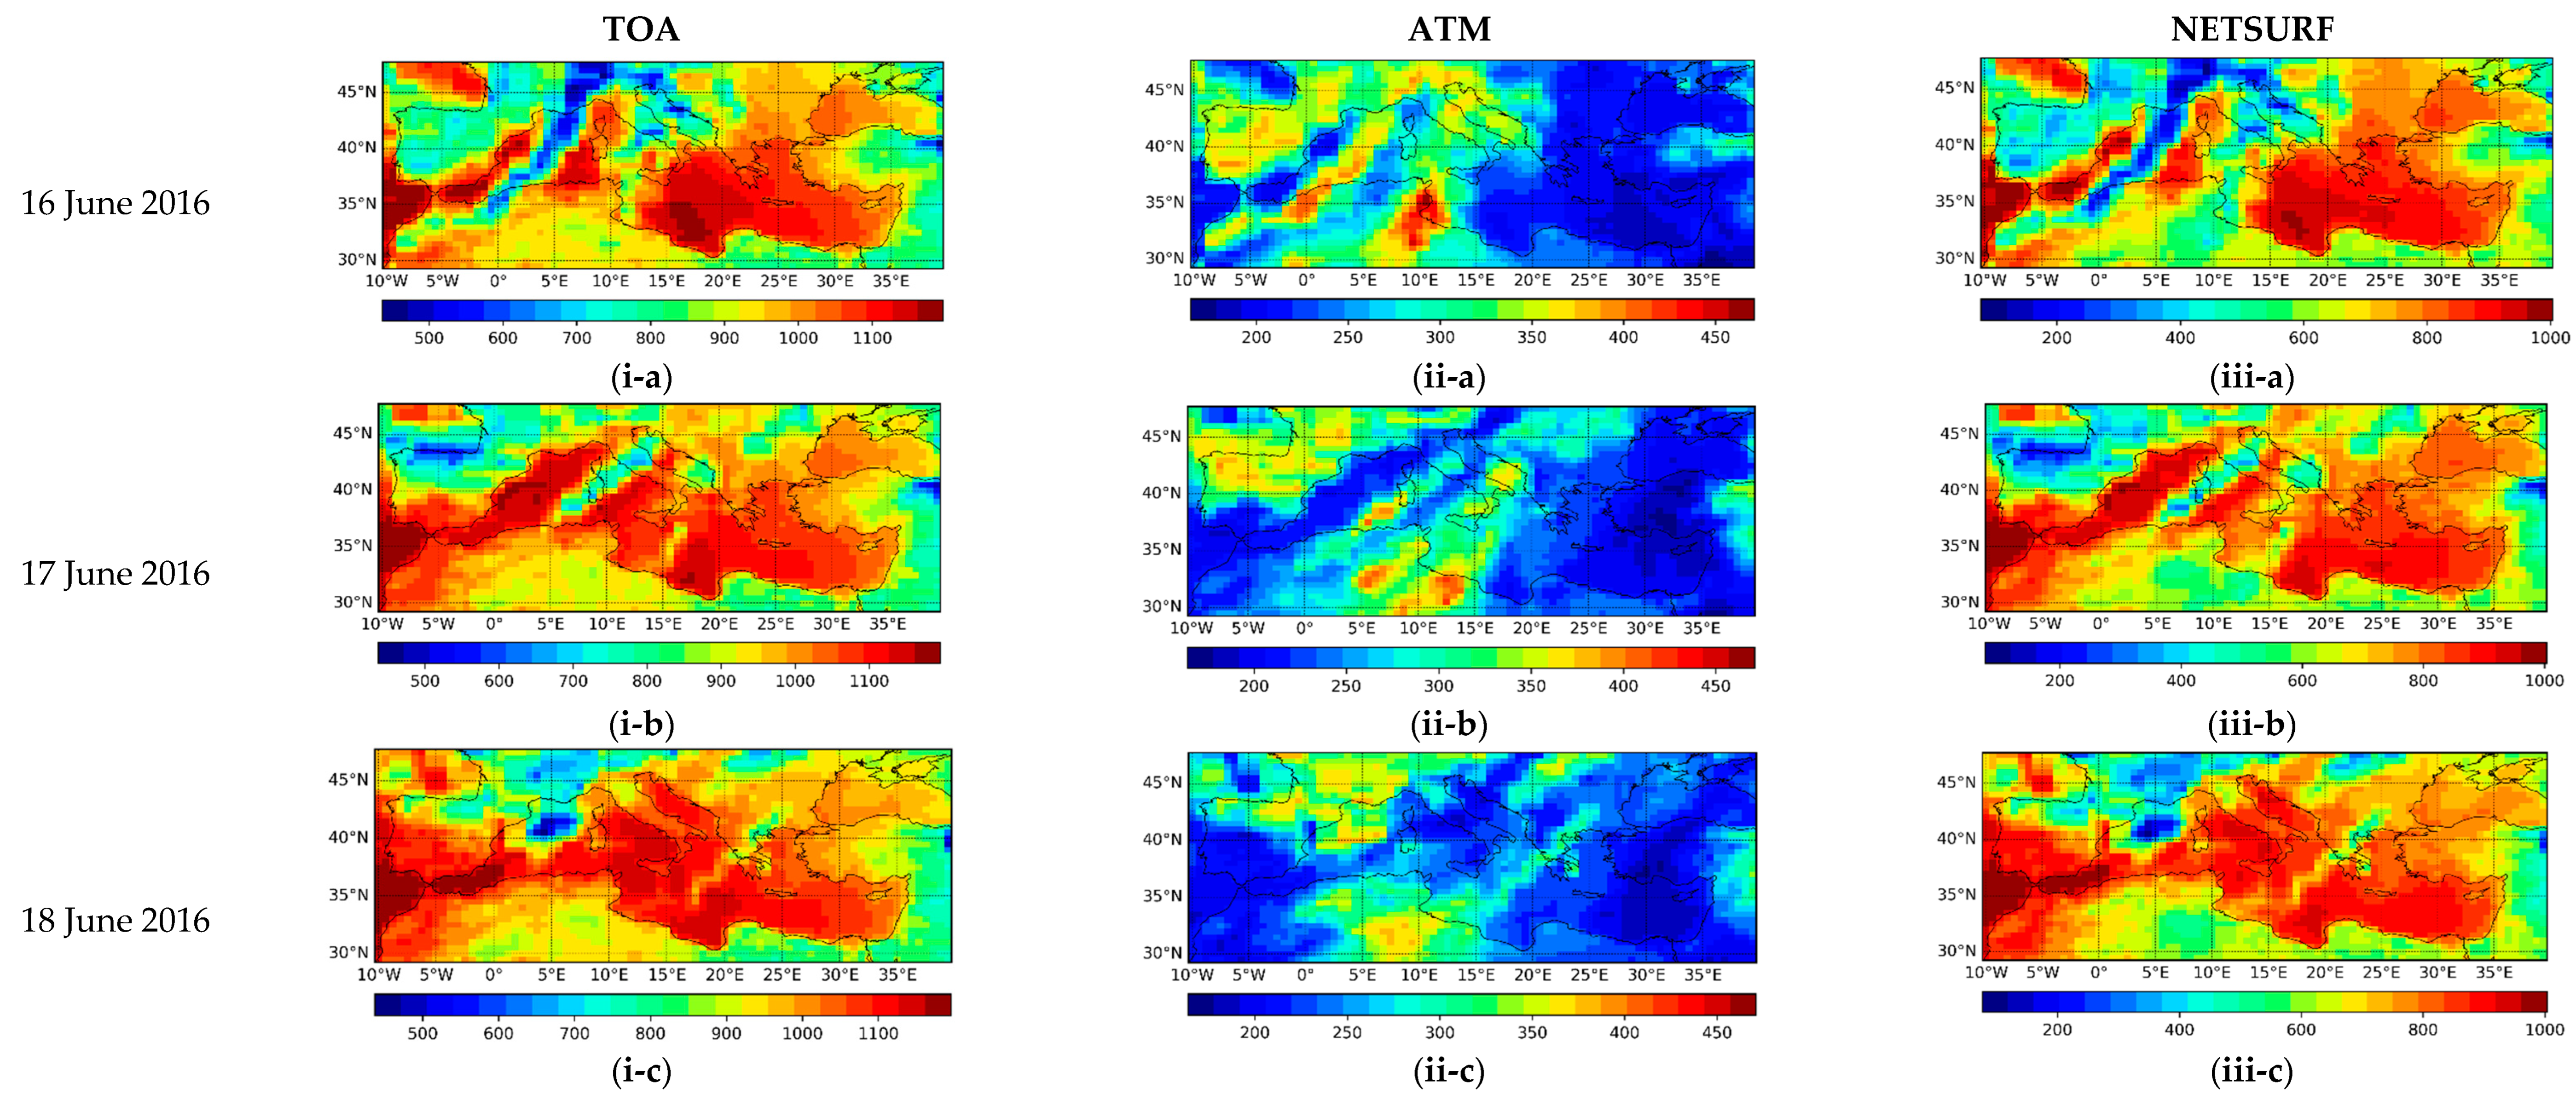
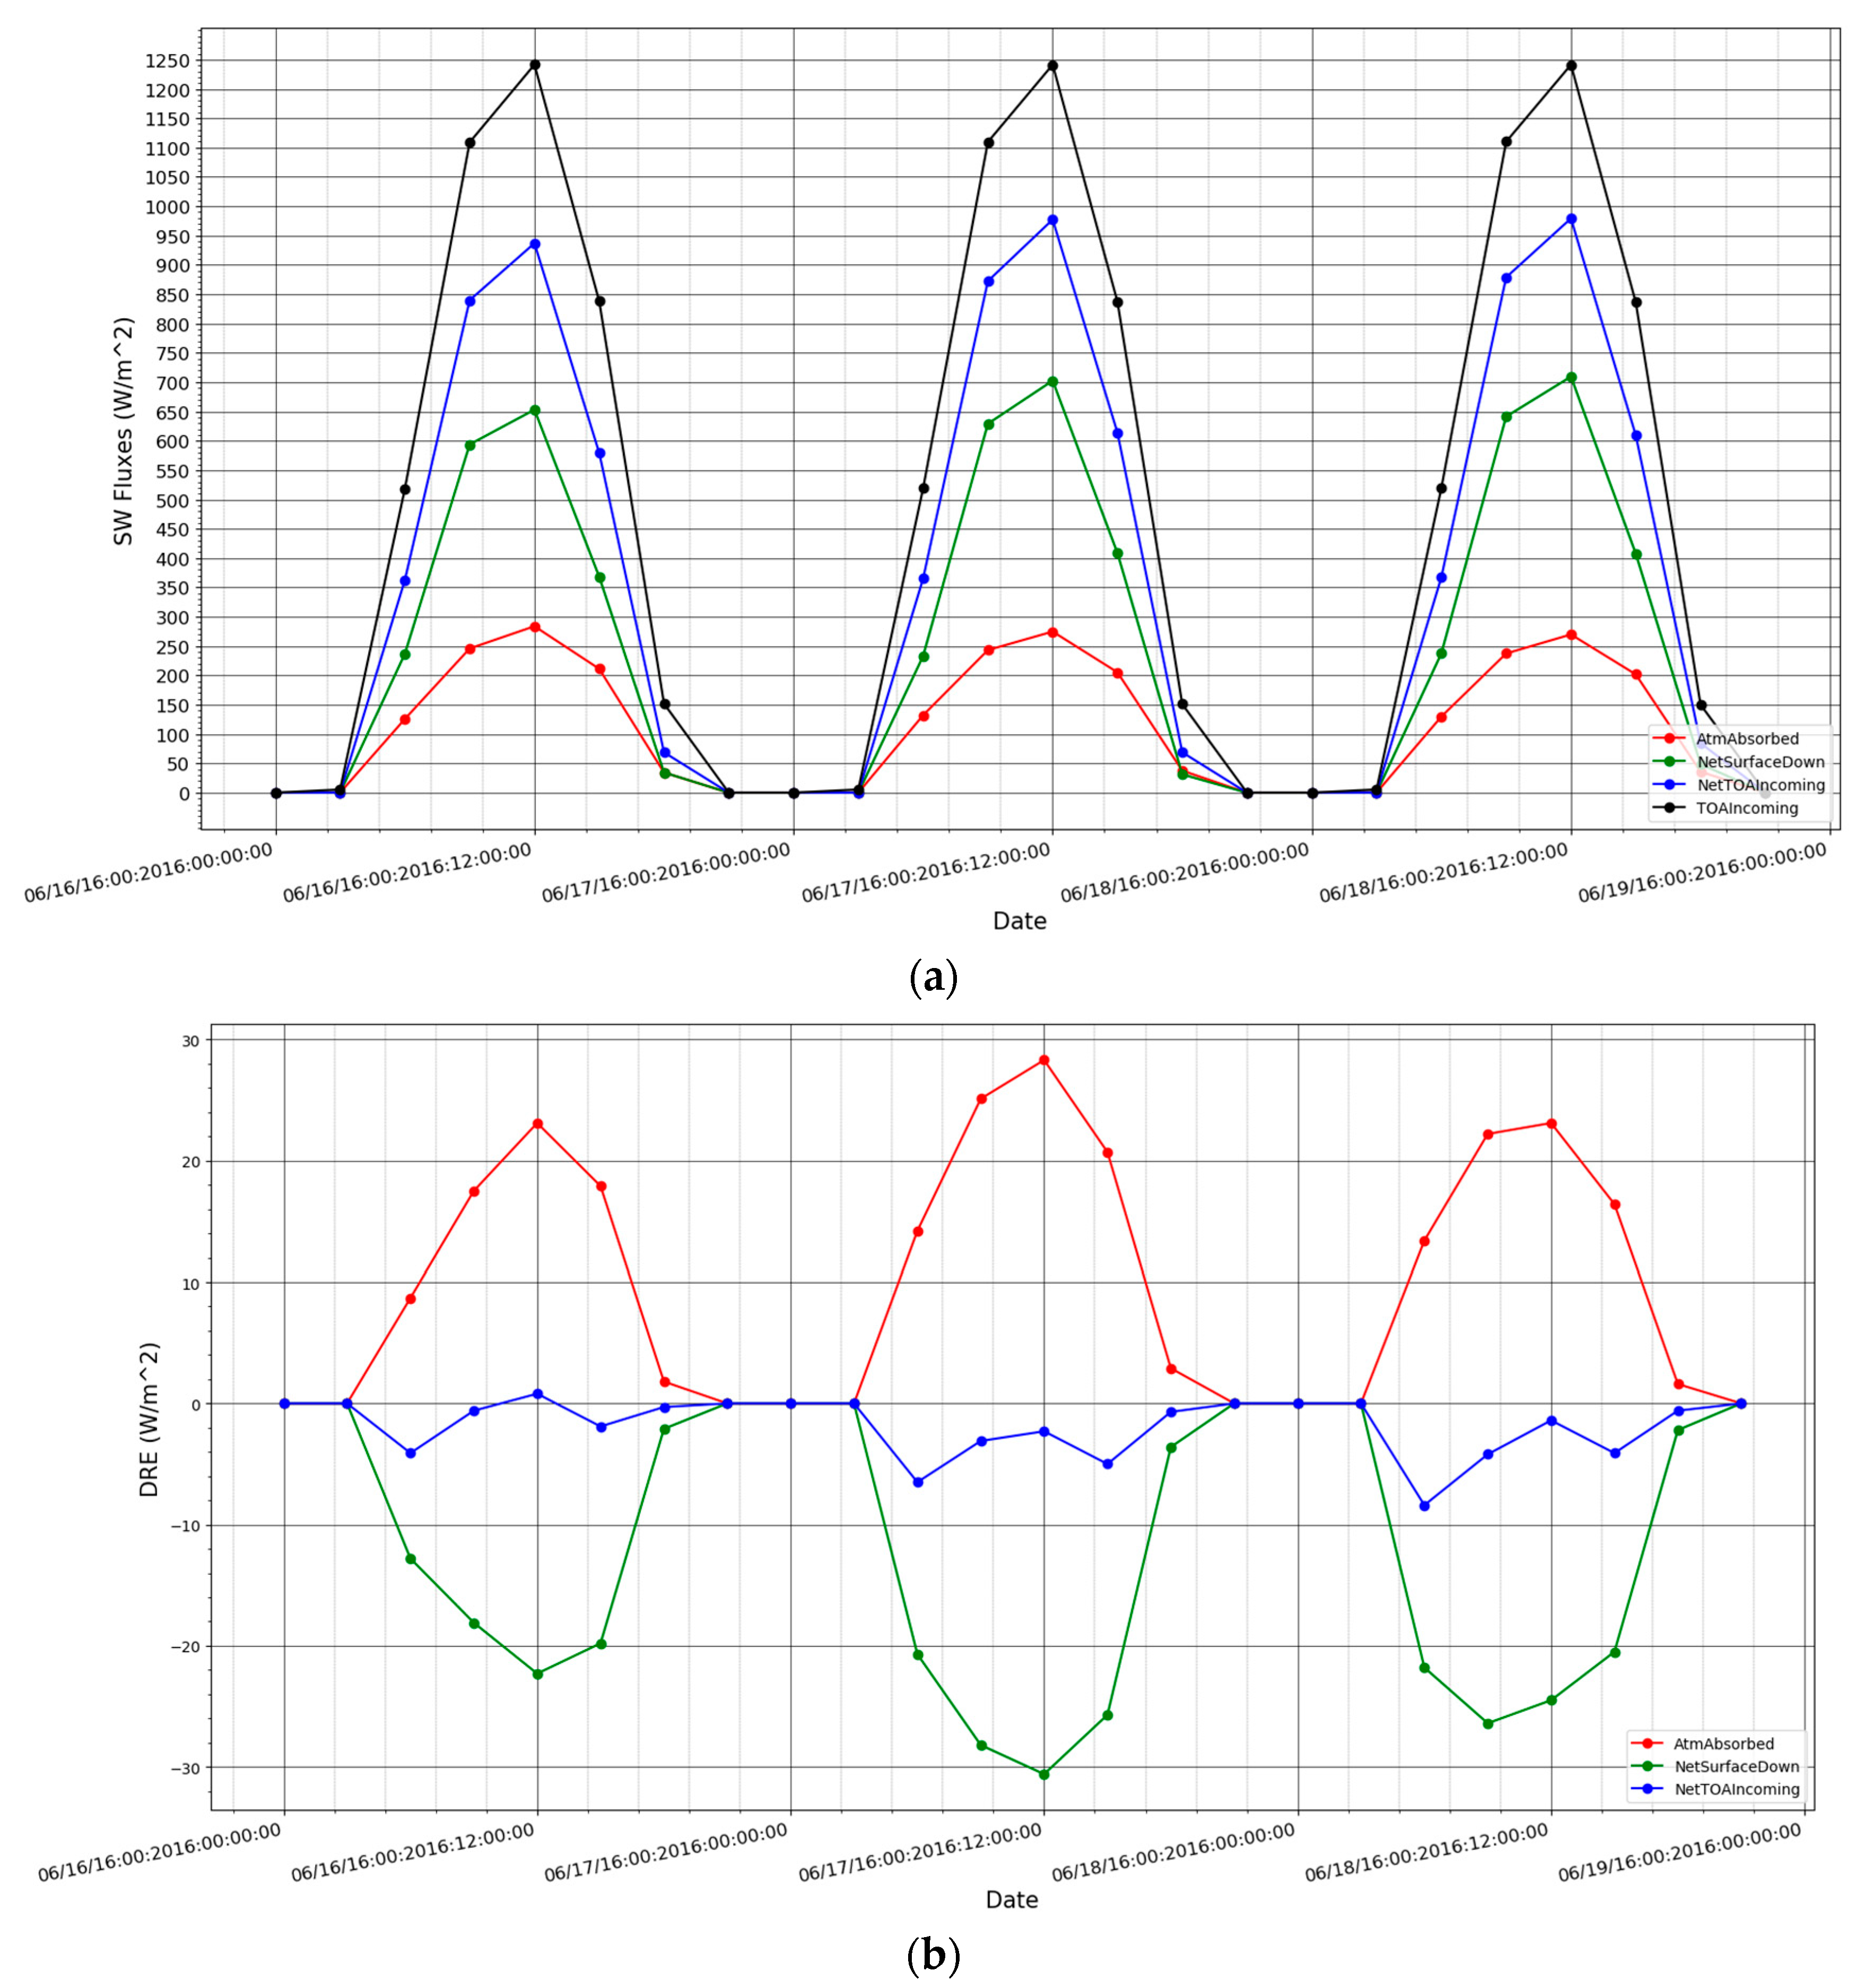
- The RTM-estimated SW fluxes are reliable, giving confidence in the obtained DDREs. Specifically, during the 3 days of the examined DAEC (from 16 to 18 June 2016), the model fluxes at the TOA and at the Earth’s surface compared well against CERES and BSRN data, respectively, achieving a reasonable closure of the SW radiation budget. The 3-hourly matched pairs yield overall correlation coefficients equal to 0.98 and 0.88, and relative biases equal to 0.8 and 3.5%, against CERES and BSRN, respectively. Based on this uncertainty of the RTM solar fluxes, the modeled DDREs have an uncertainty smaller than 7%.
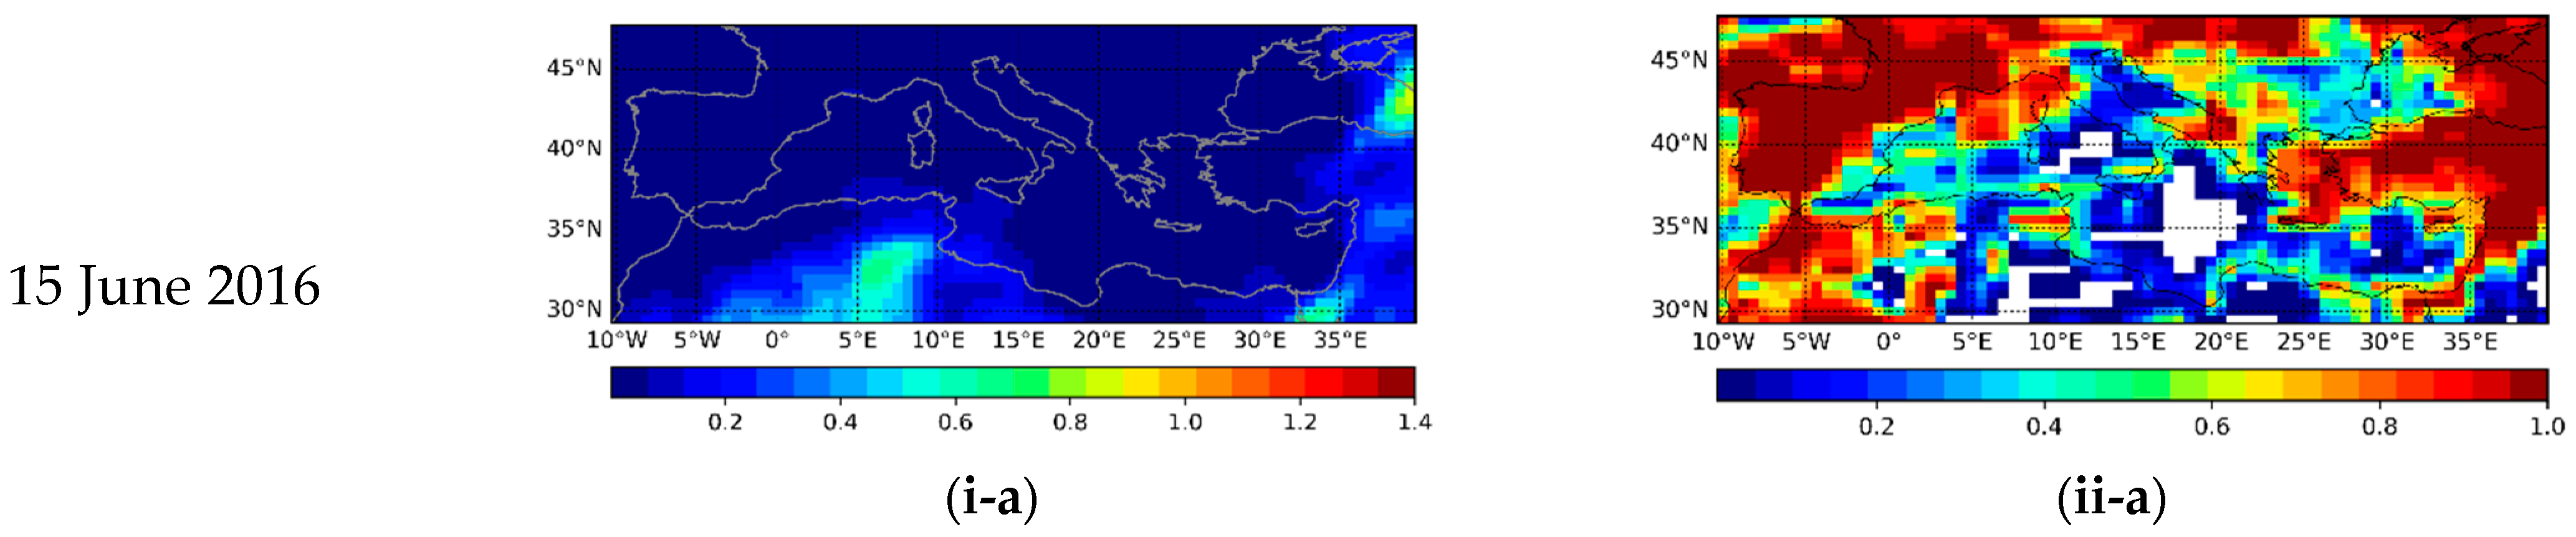
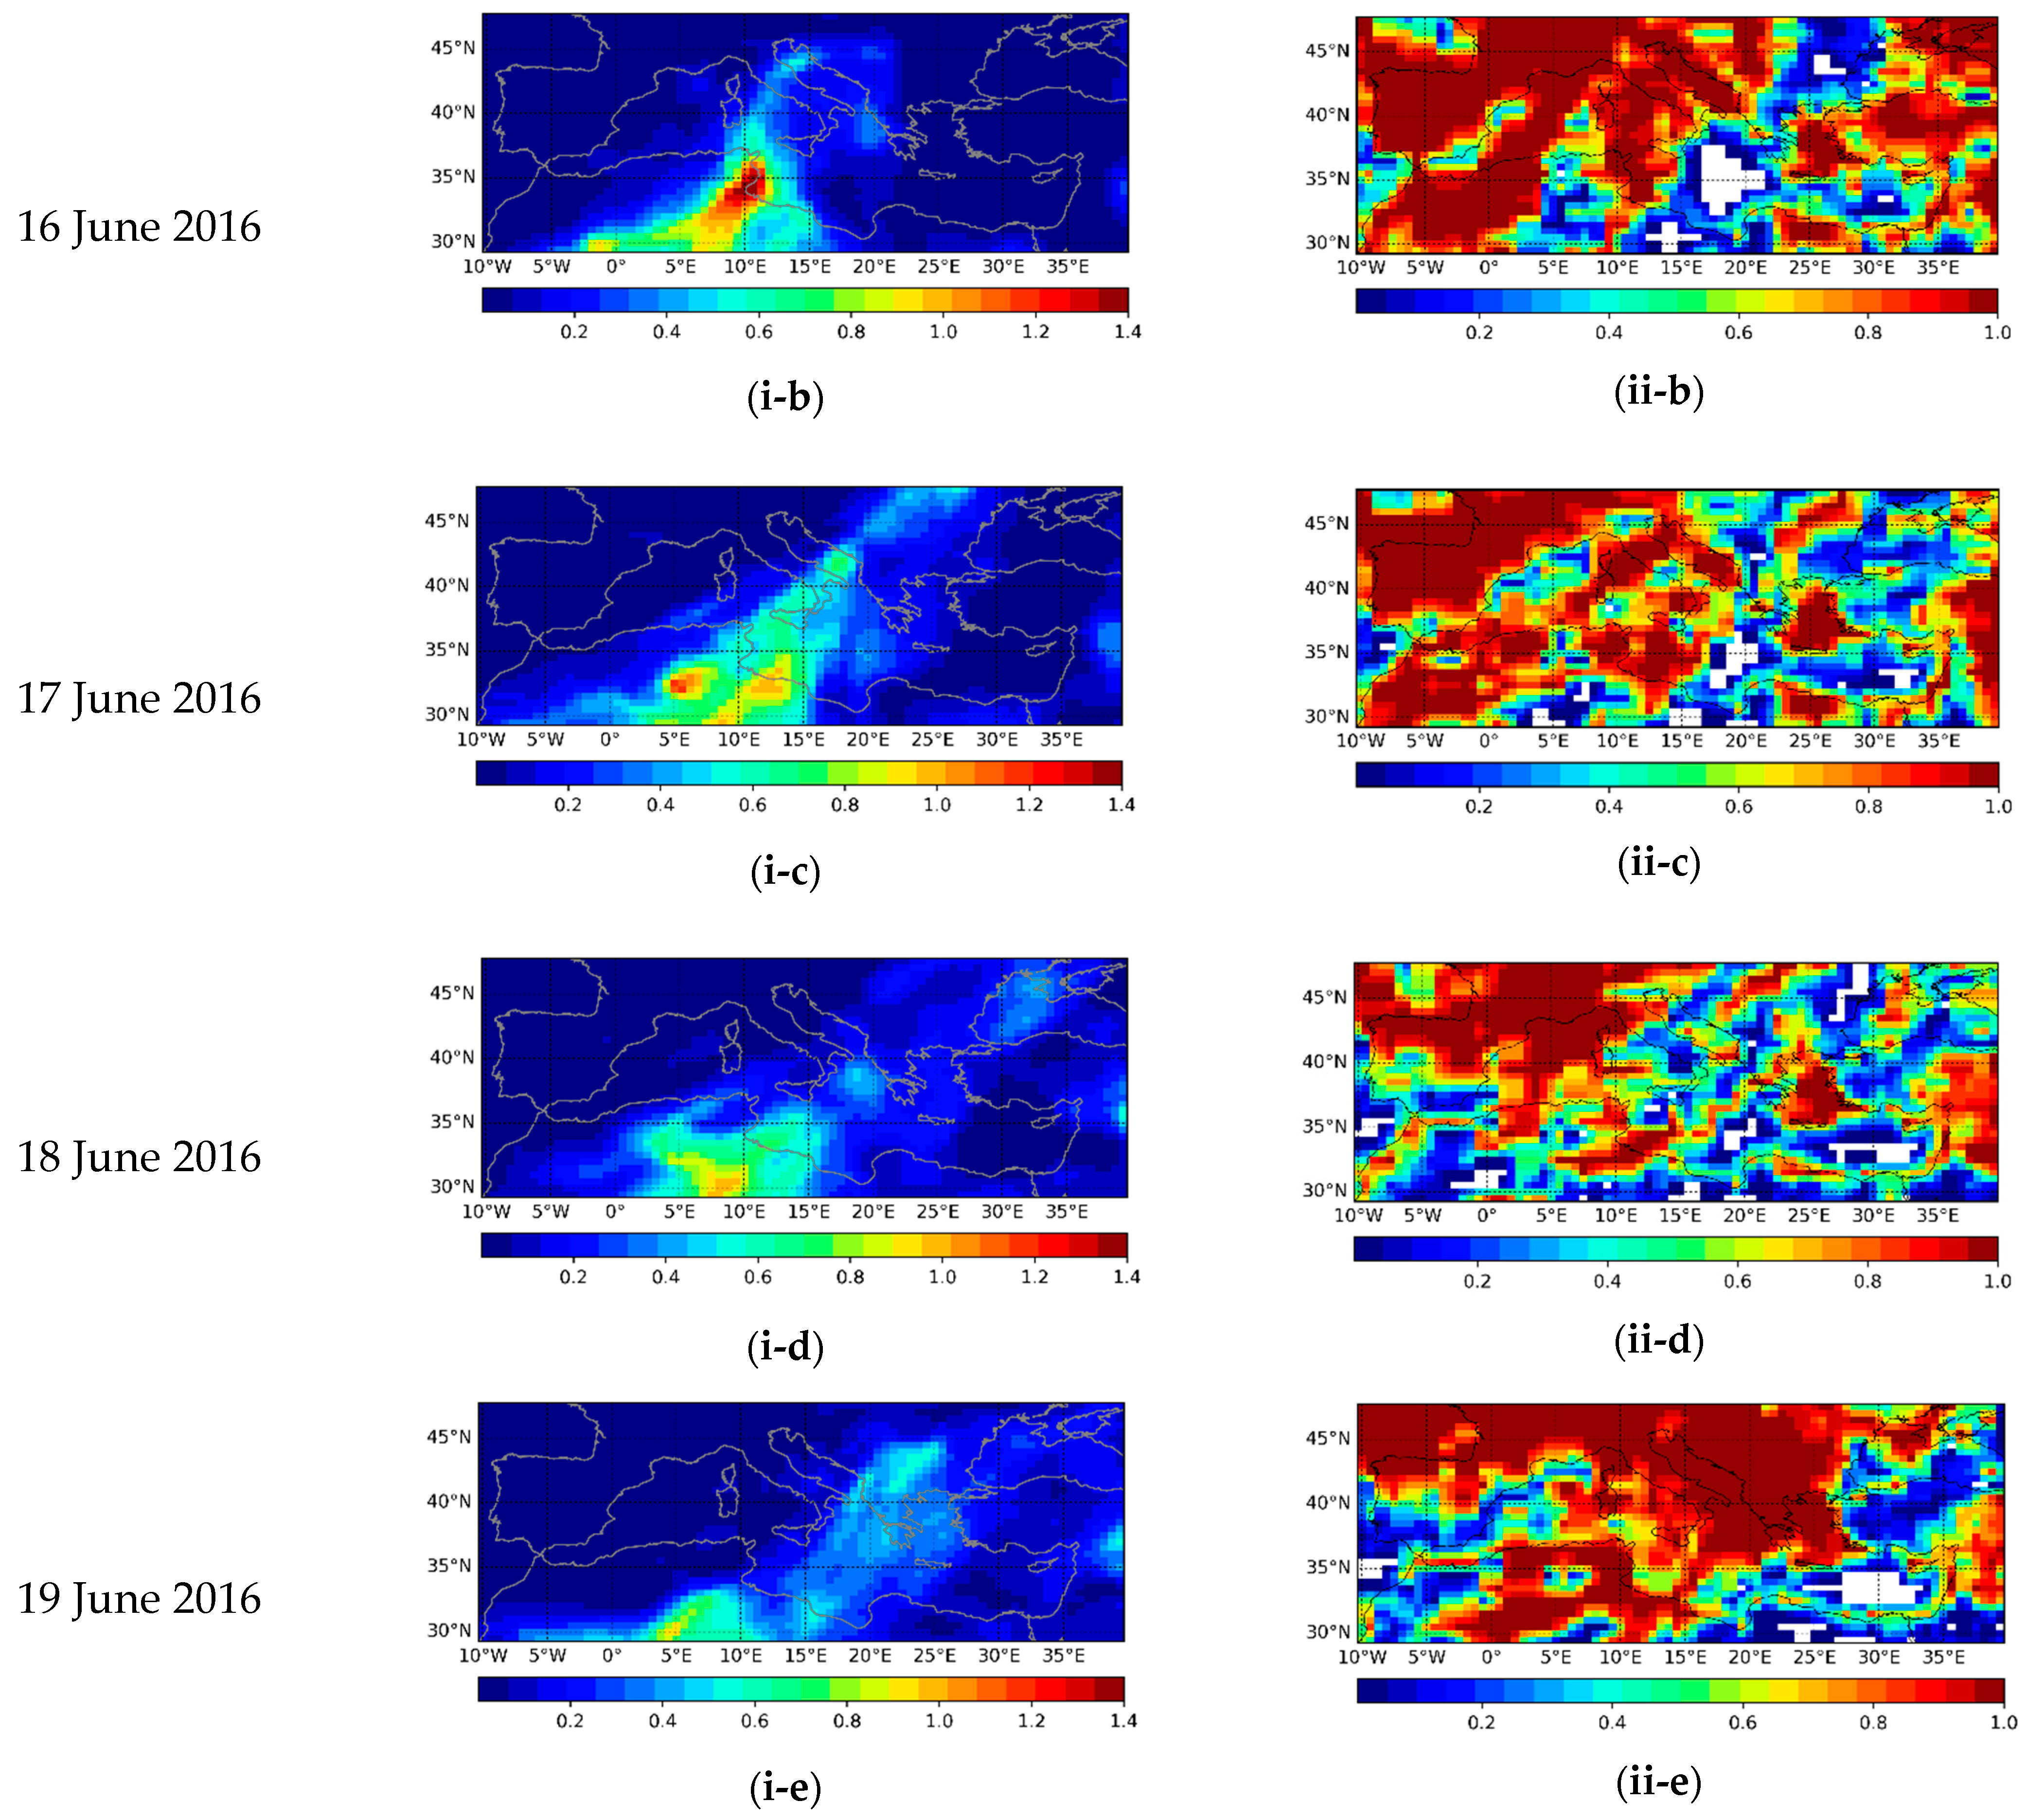
- The model input MERRA-2 dust optical properties, in particular the optical depth, agrees reasonably well against reference data from AERONET stations located in areas affected by the transported African dust. MERRA-2 successfully reproduces the intra-daily variation in the dust aerosol loads, representing the spread of the dust outbreak over the central and eastern MB and its gradual eastward shift during the 3-day period (16–18 June 2016) of the examined DAEC.
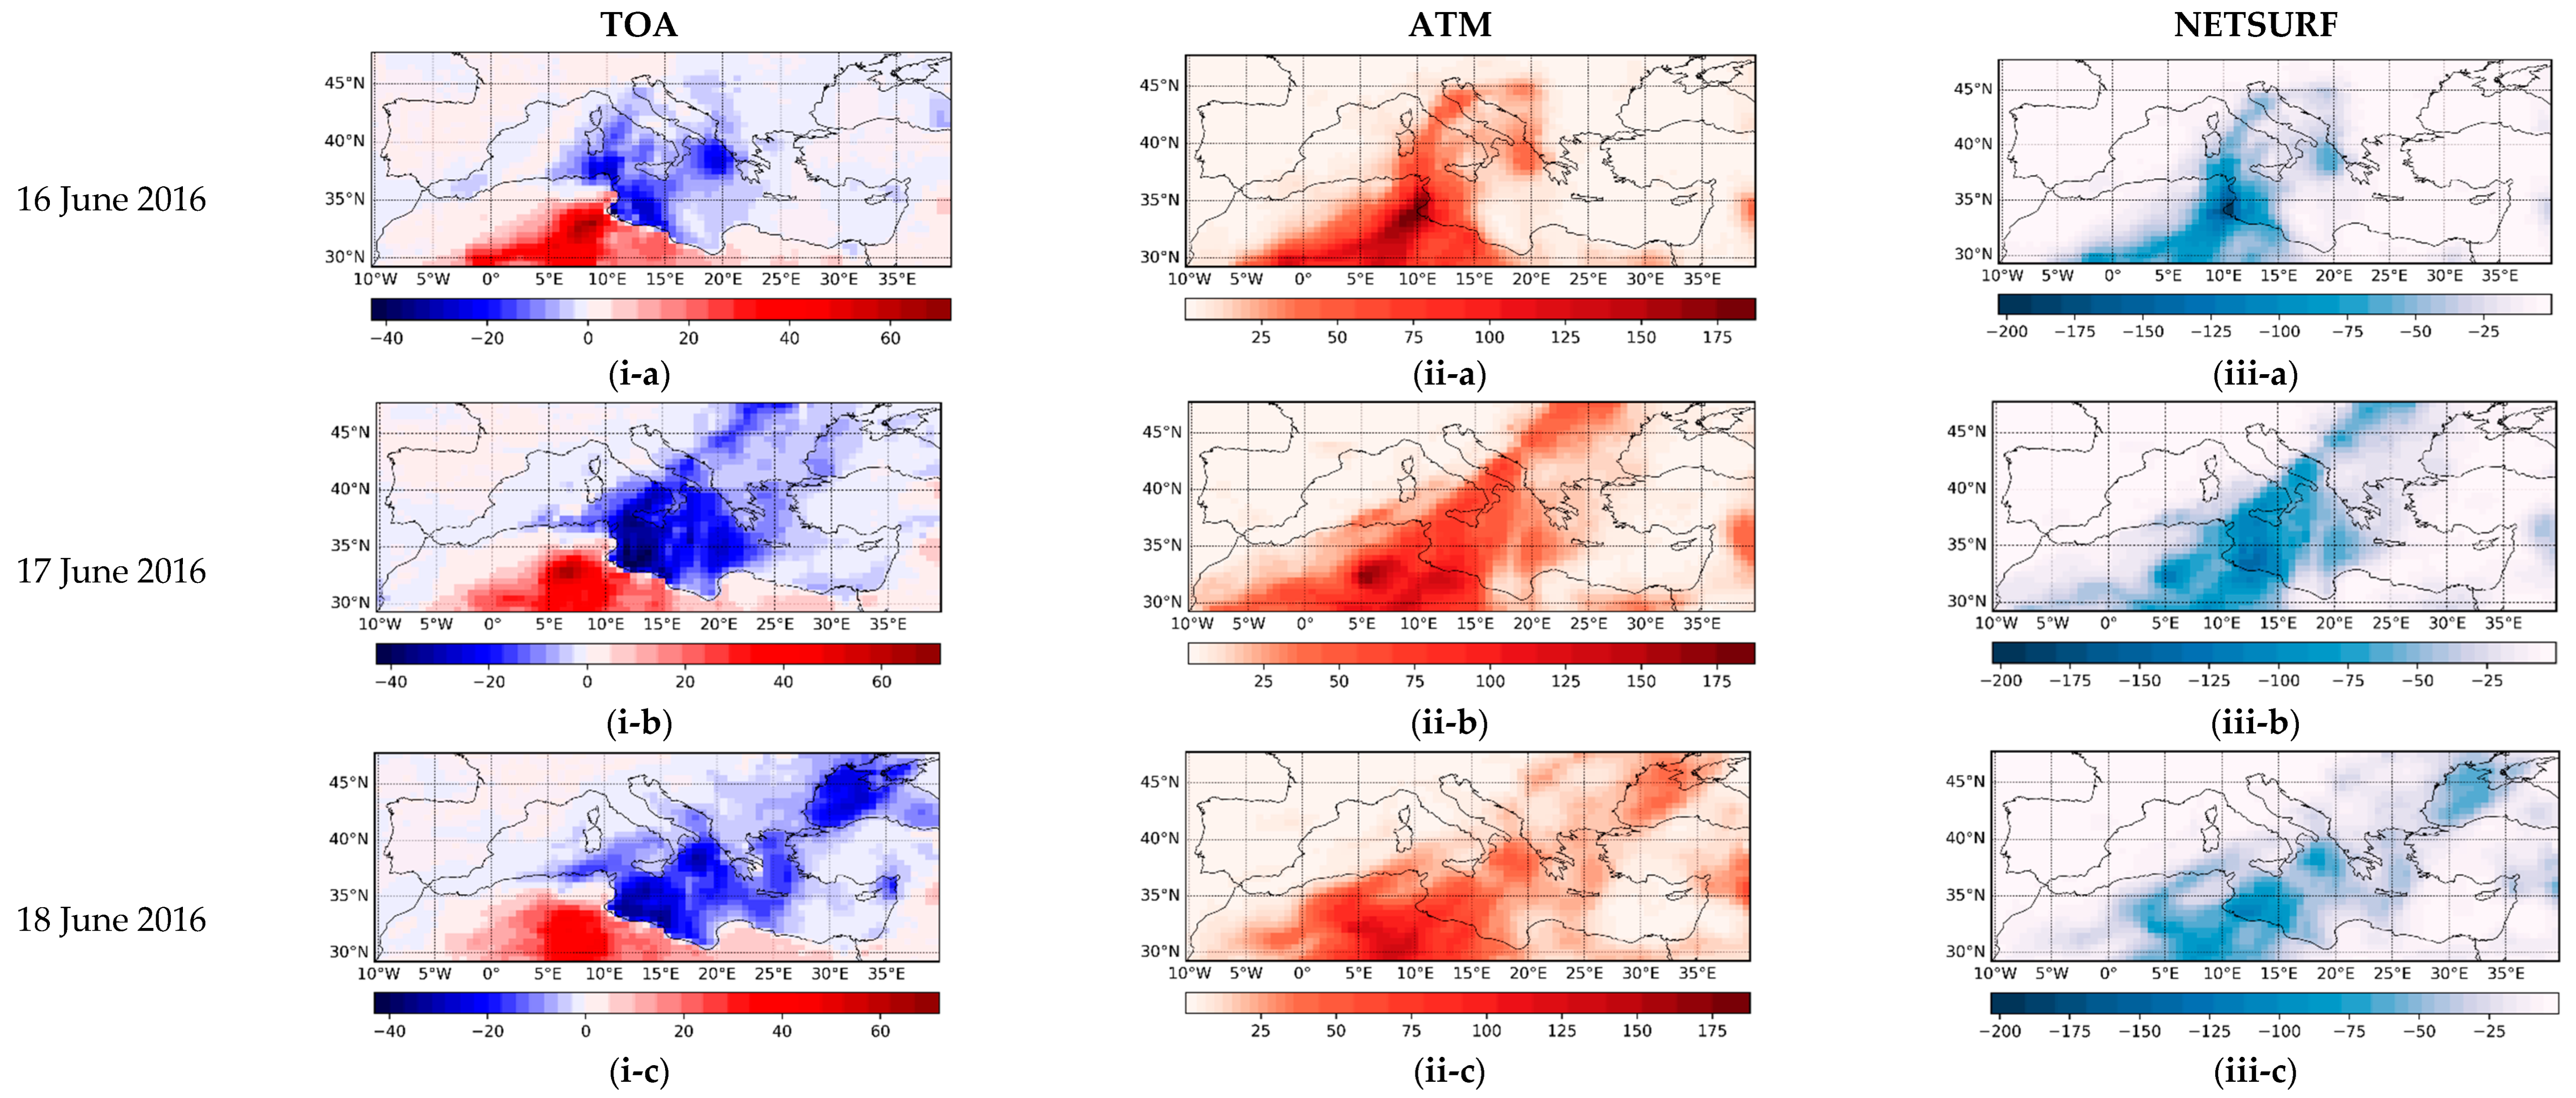
- Dust aerosols cause a significant solar atmospheric radiative heating over areas undergoing the African dust export, extending from northern Africa to as far as the northern Balkans and the Black Sea. The SW atmospheric DDRE is maximum (values up to 187 W/m2 at 12:00 UTC or 72 W/m2 on a daily mean basis) over locations with the maximum dust loadings. Respectively, over these heavily dust loaded areas, DAs also induce a significant surface radiative cooling, with maximum values equal to 200 W/m2 at 12:00 UTC and 62 W/m2 on a daily mean basis. As a result of the atmospheric warming and surface cooling, a considerable planetary cooling is found over the areas of dust transport, as strong as −40 W/m2 at 12:00 UTC, which turns to an appreciable planetary warming (up to 70 W/m2) over highly reflecting African desert areas overloaded by dust.
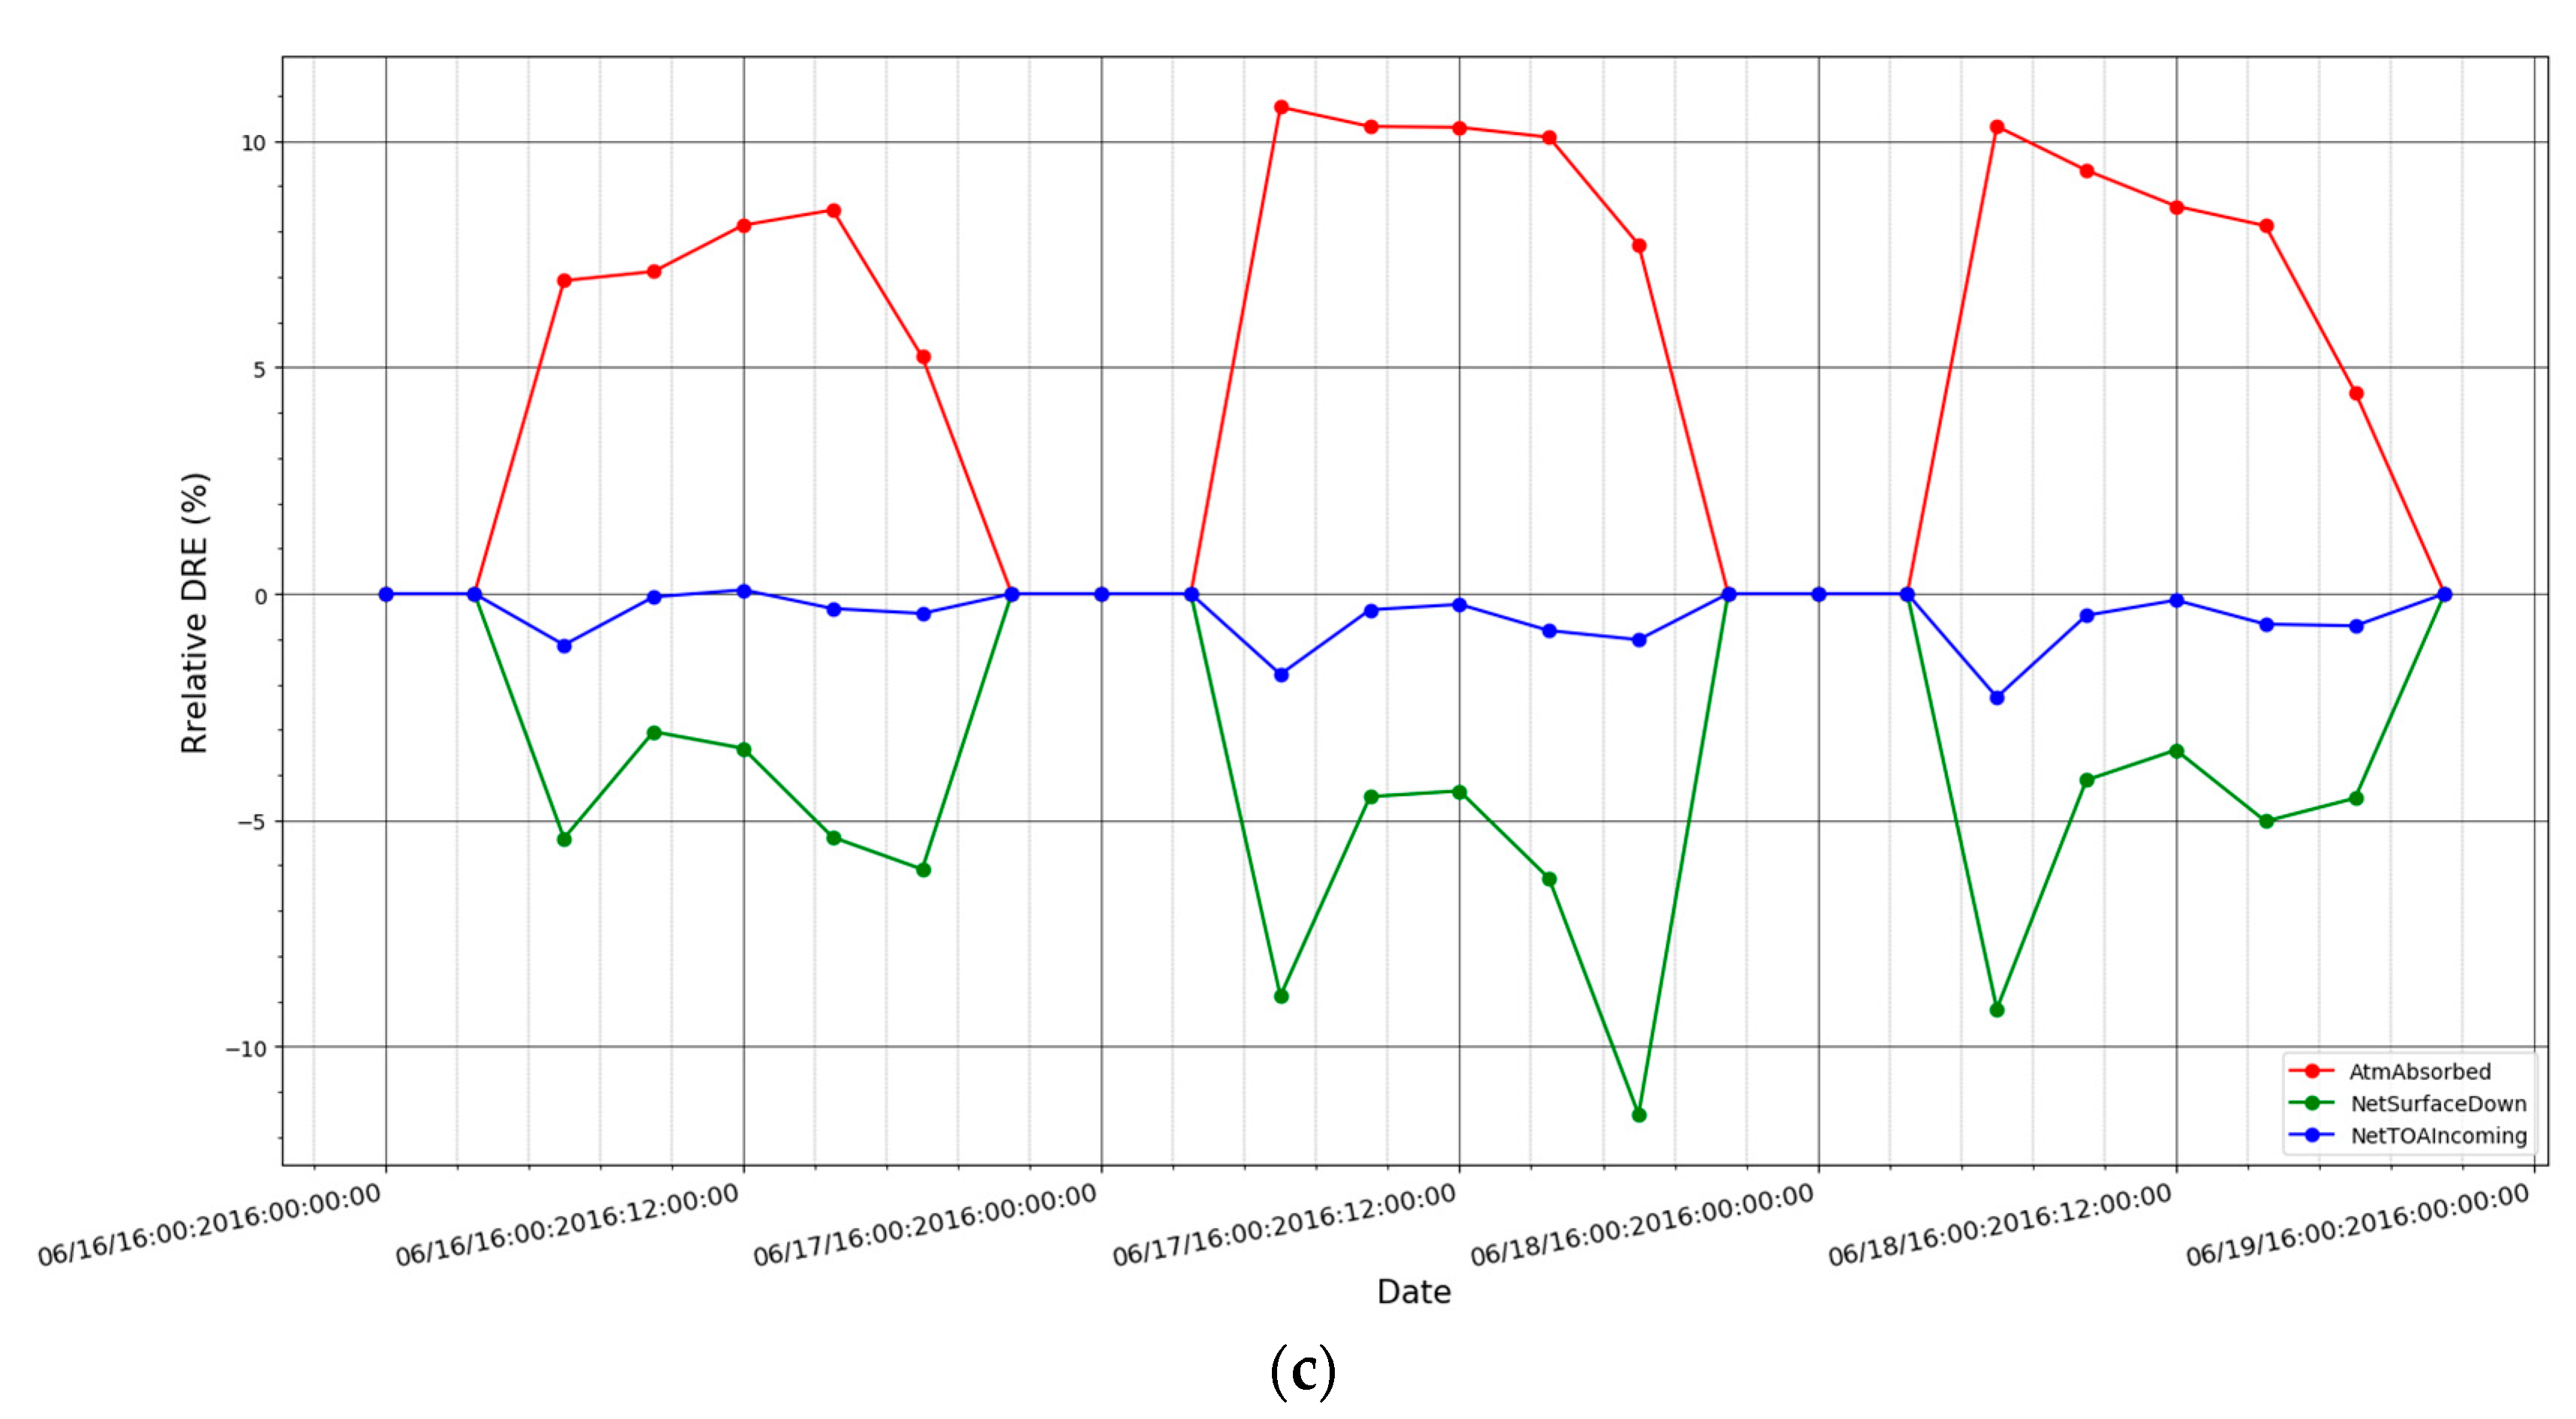
- The above-mentioned SW DDREs significantly perturb the regional solar radiation budget, in particular over the Mediterranean areas undergoing the dust export, by up to 45% in the atmosphere and 35% at the surface, thus constituting an important factor for processes such as the modification of temperature or humidity, and for dynamical effects, such as the creation of horizontal and vertical temperature gradients, leading to changes in air motions and local circulations.
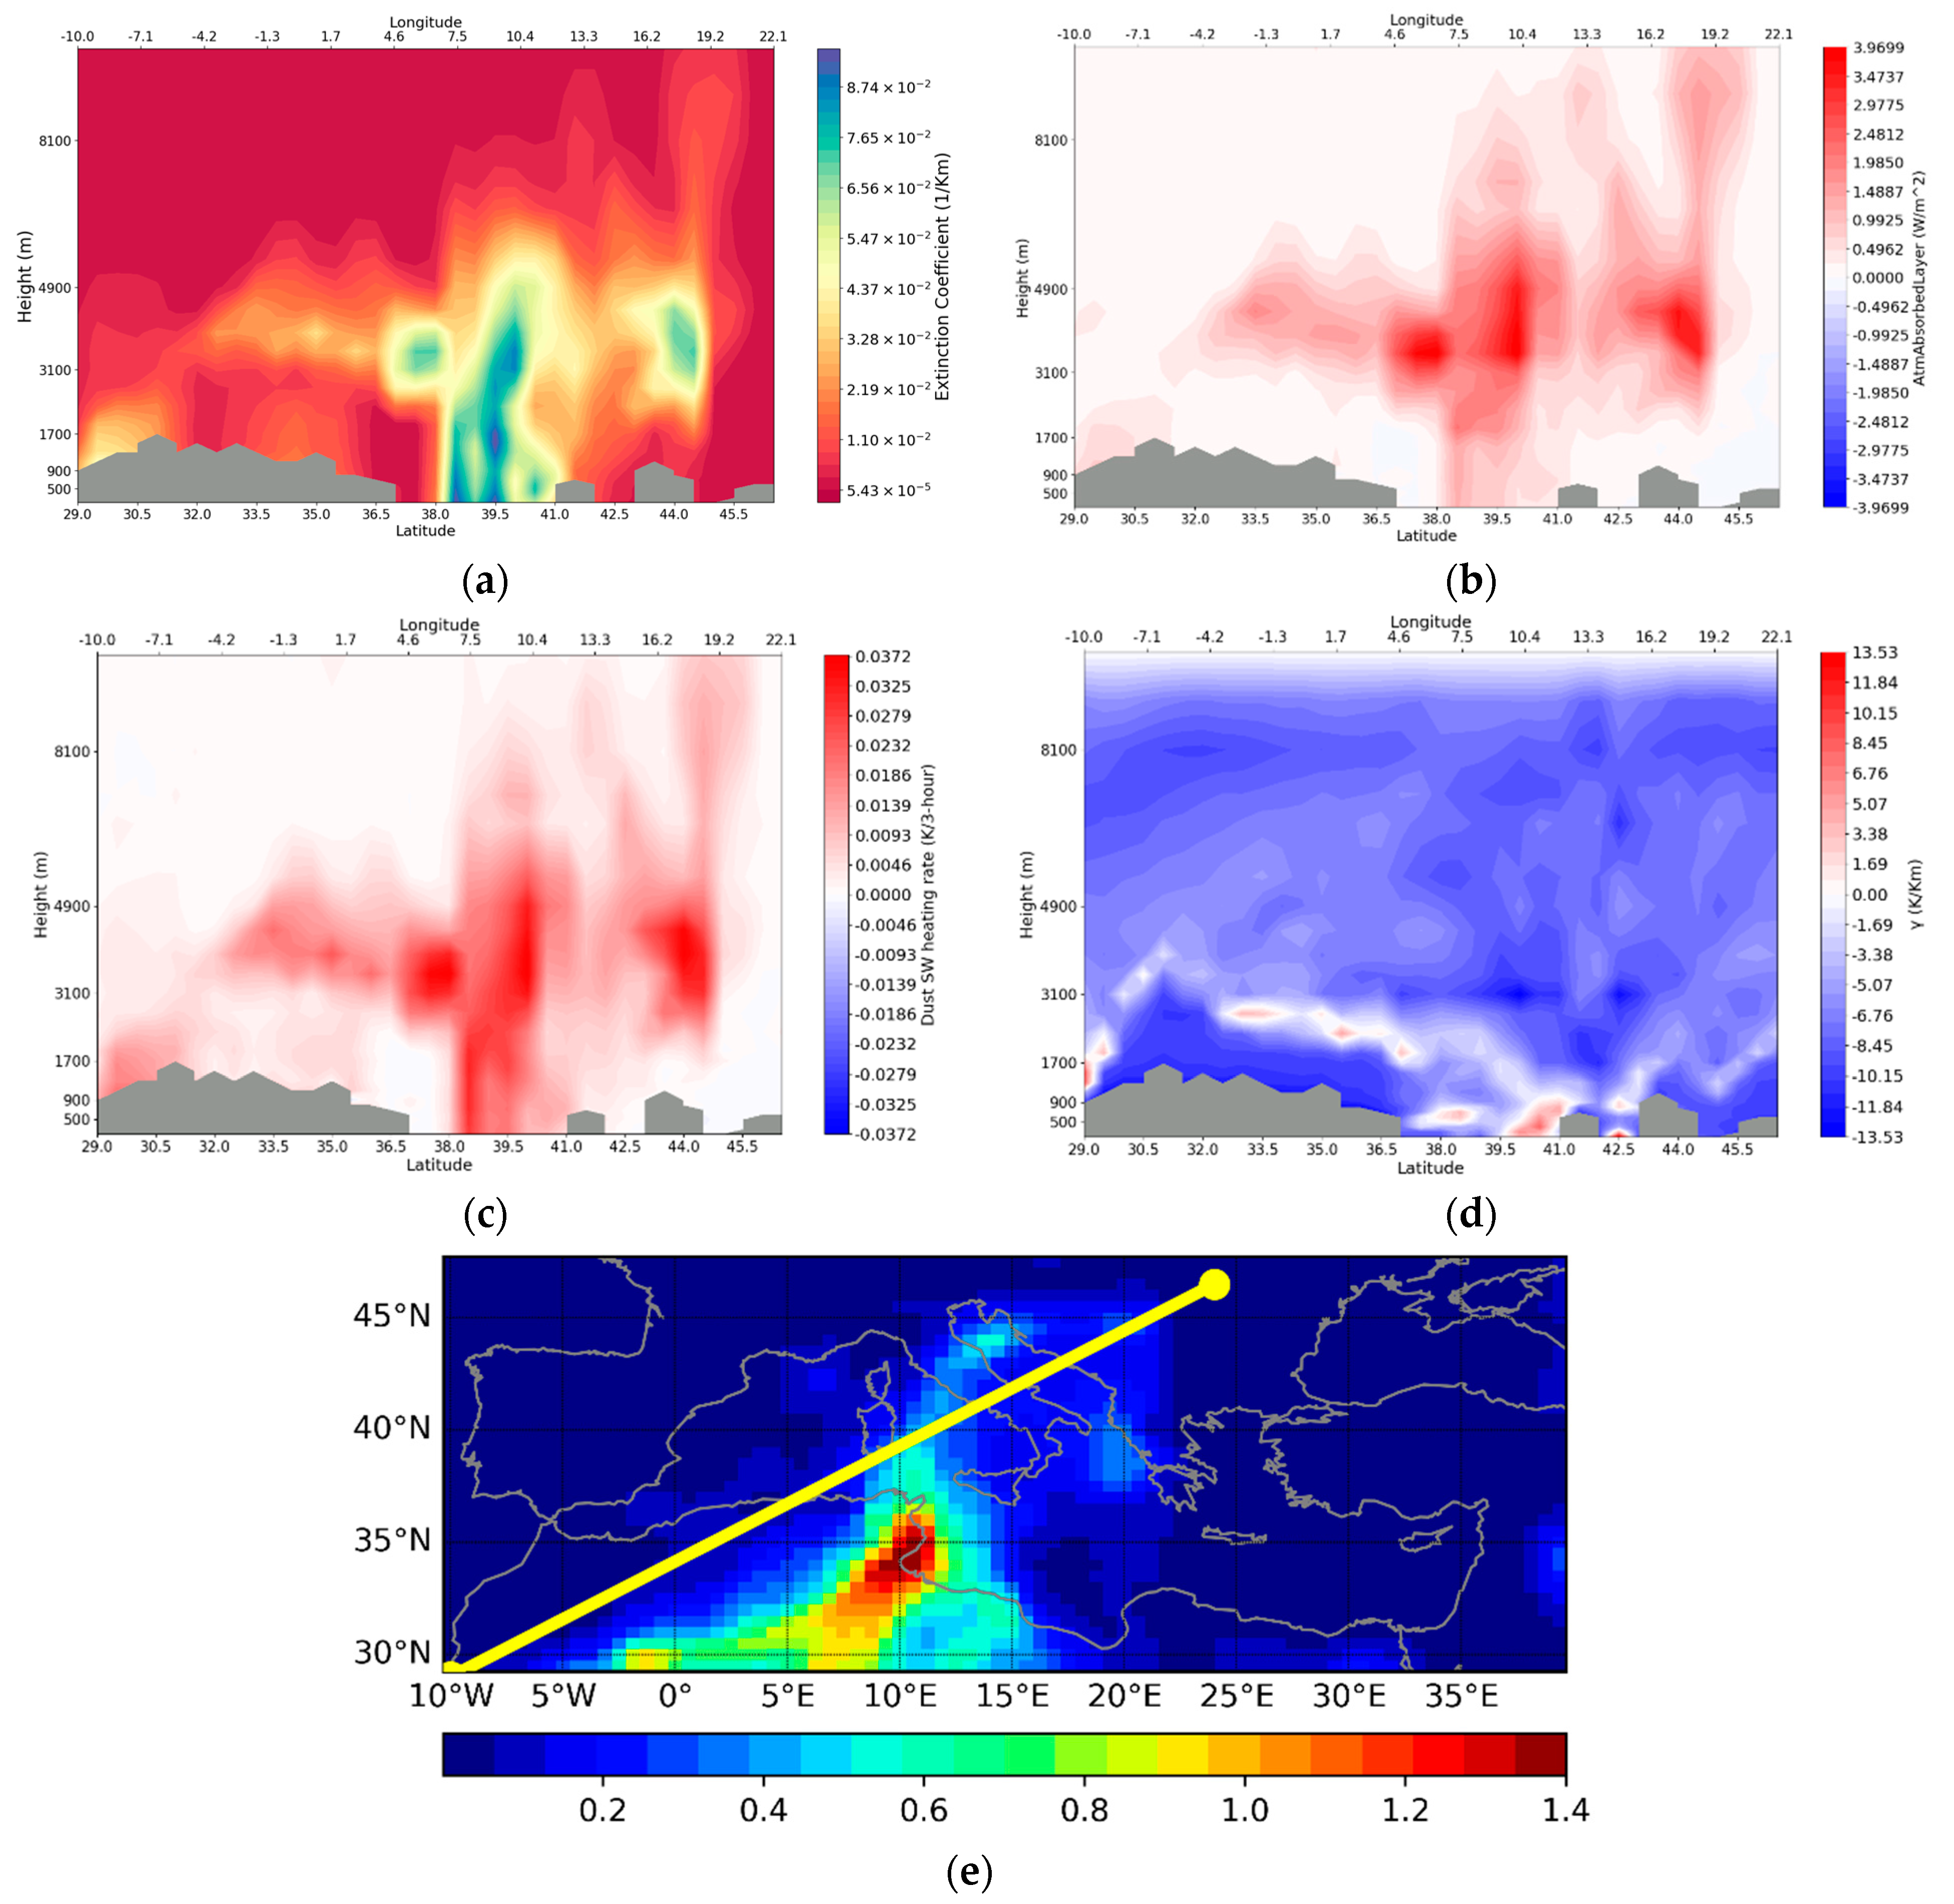
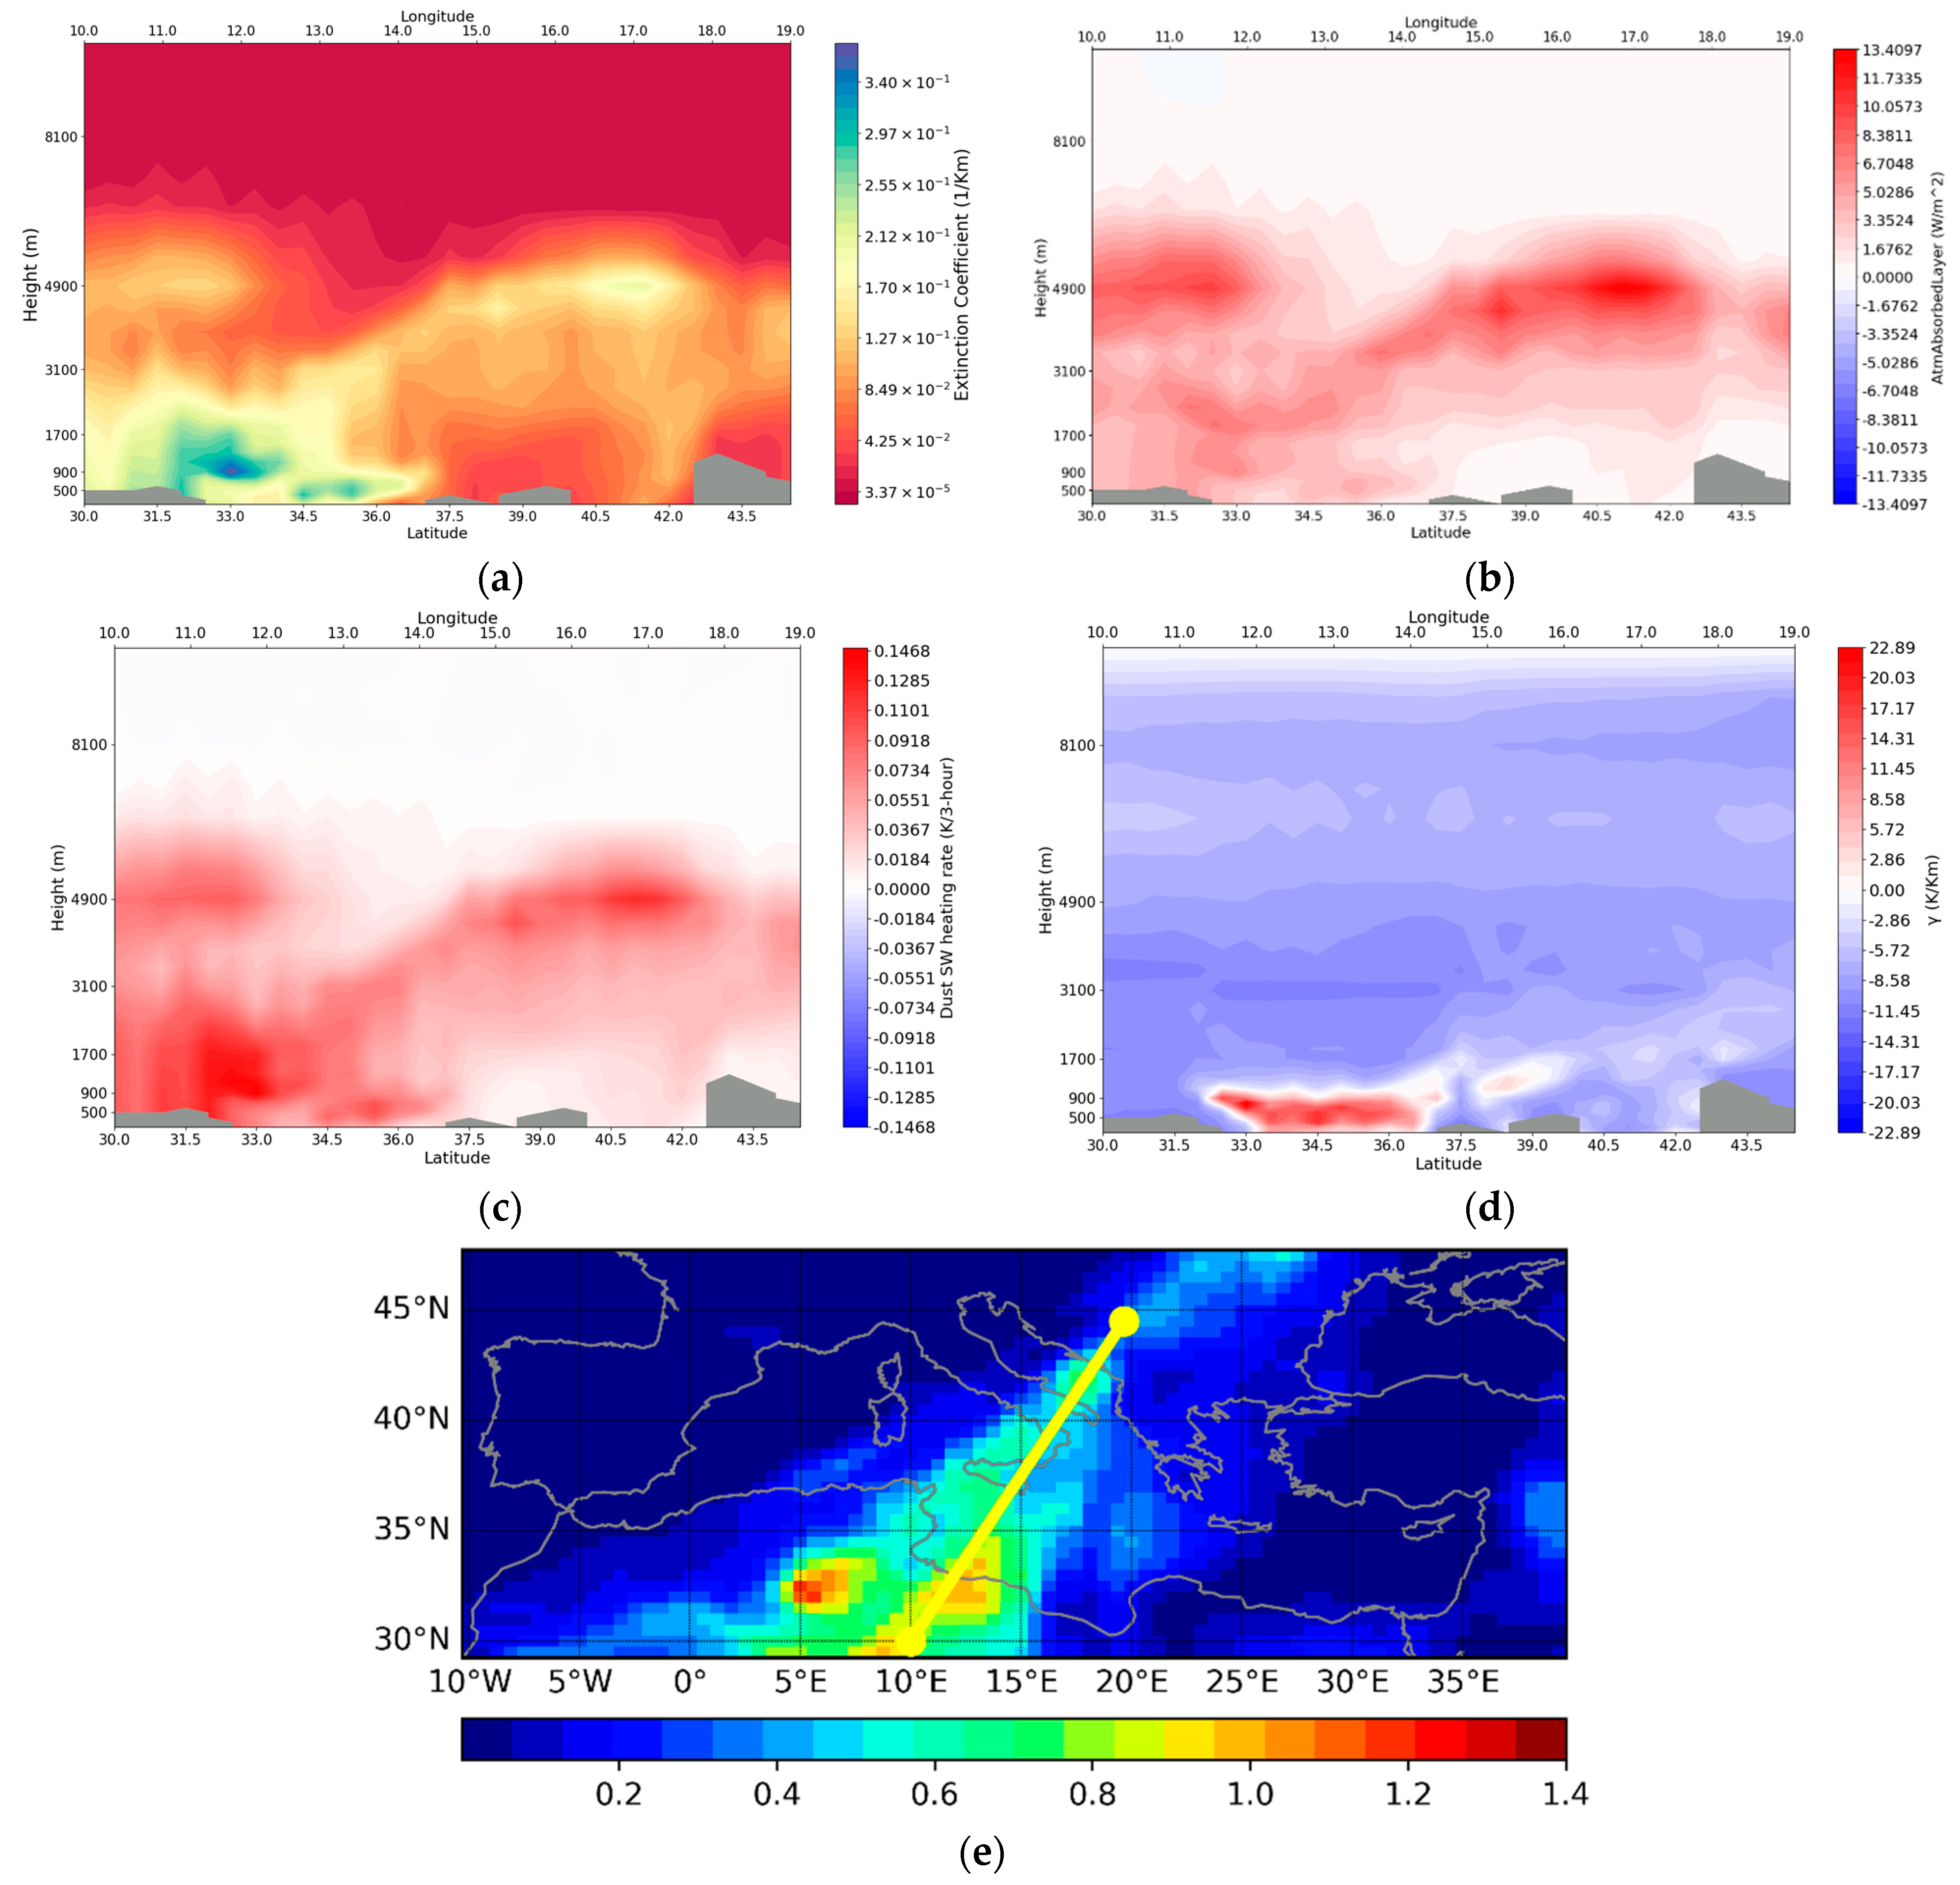
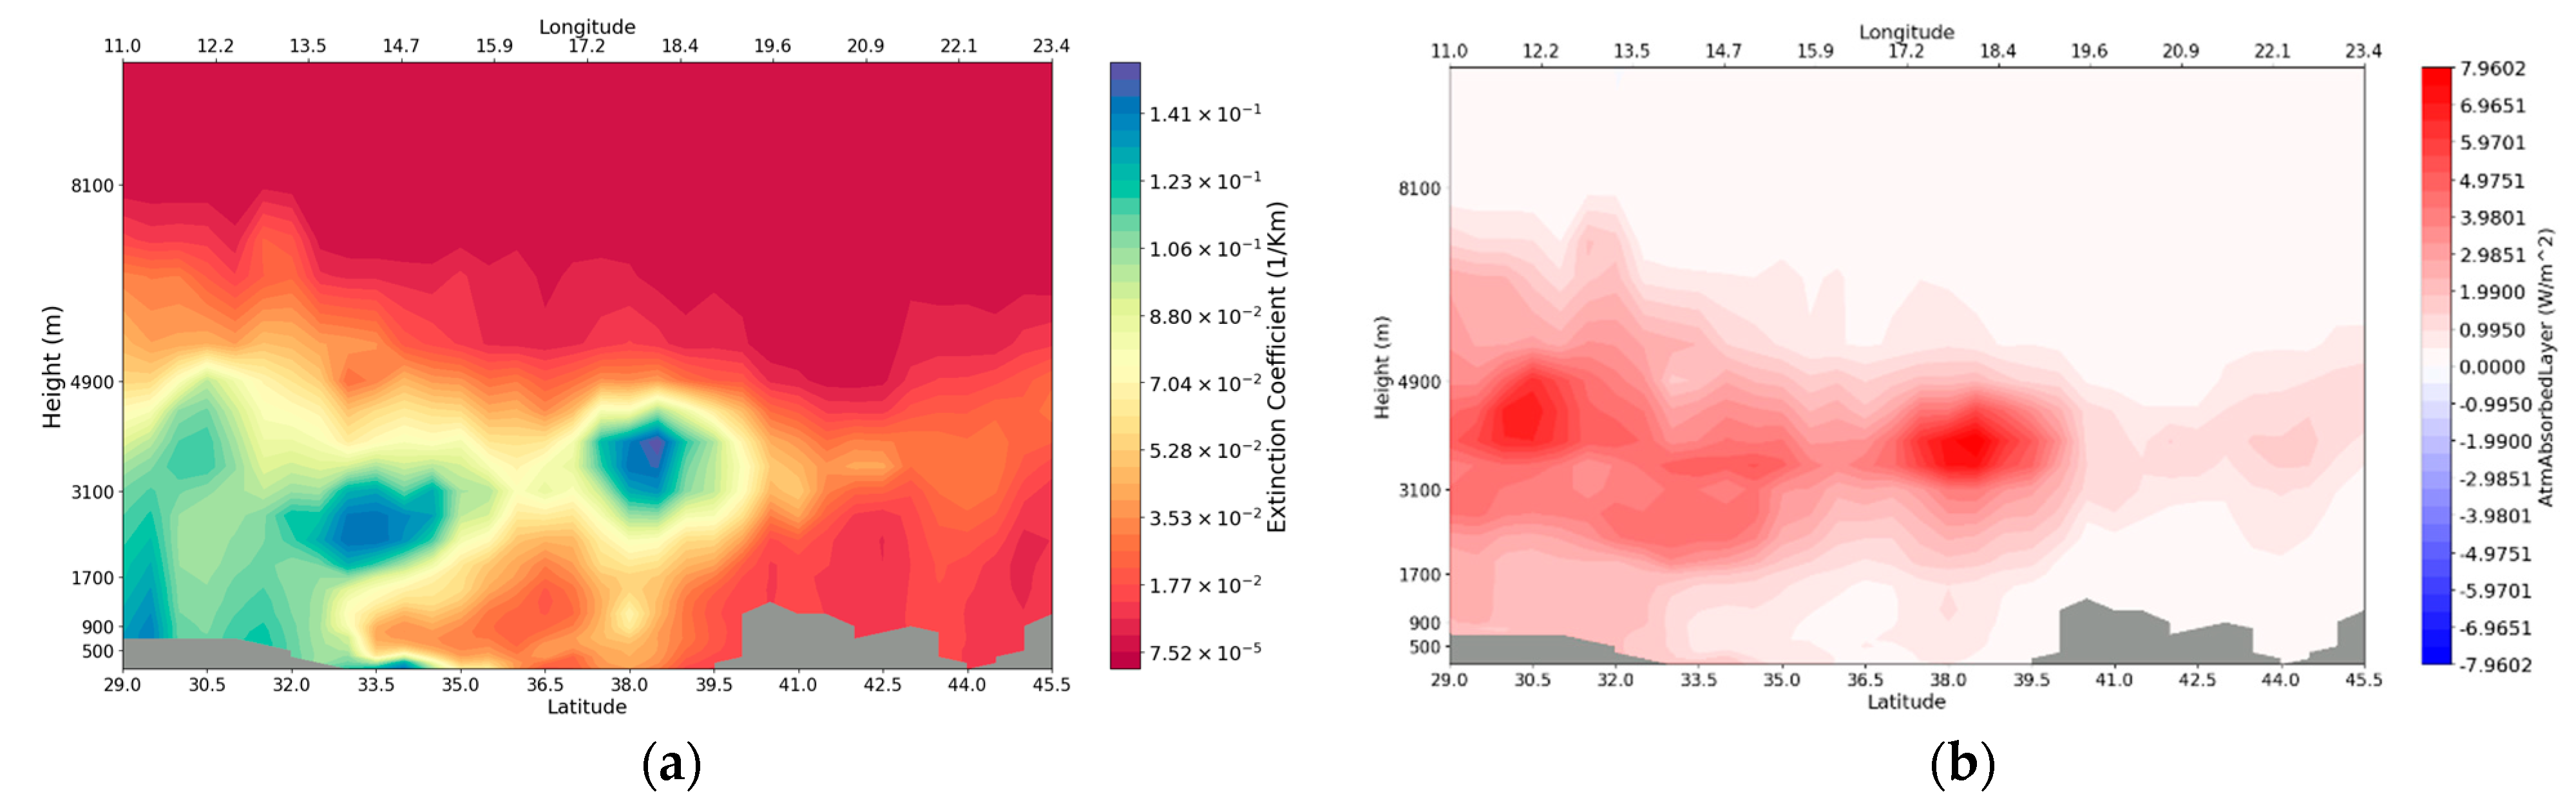
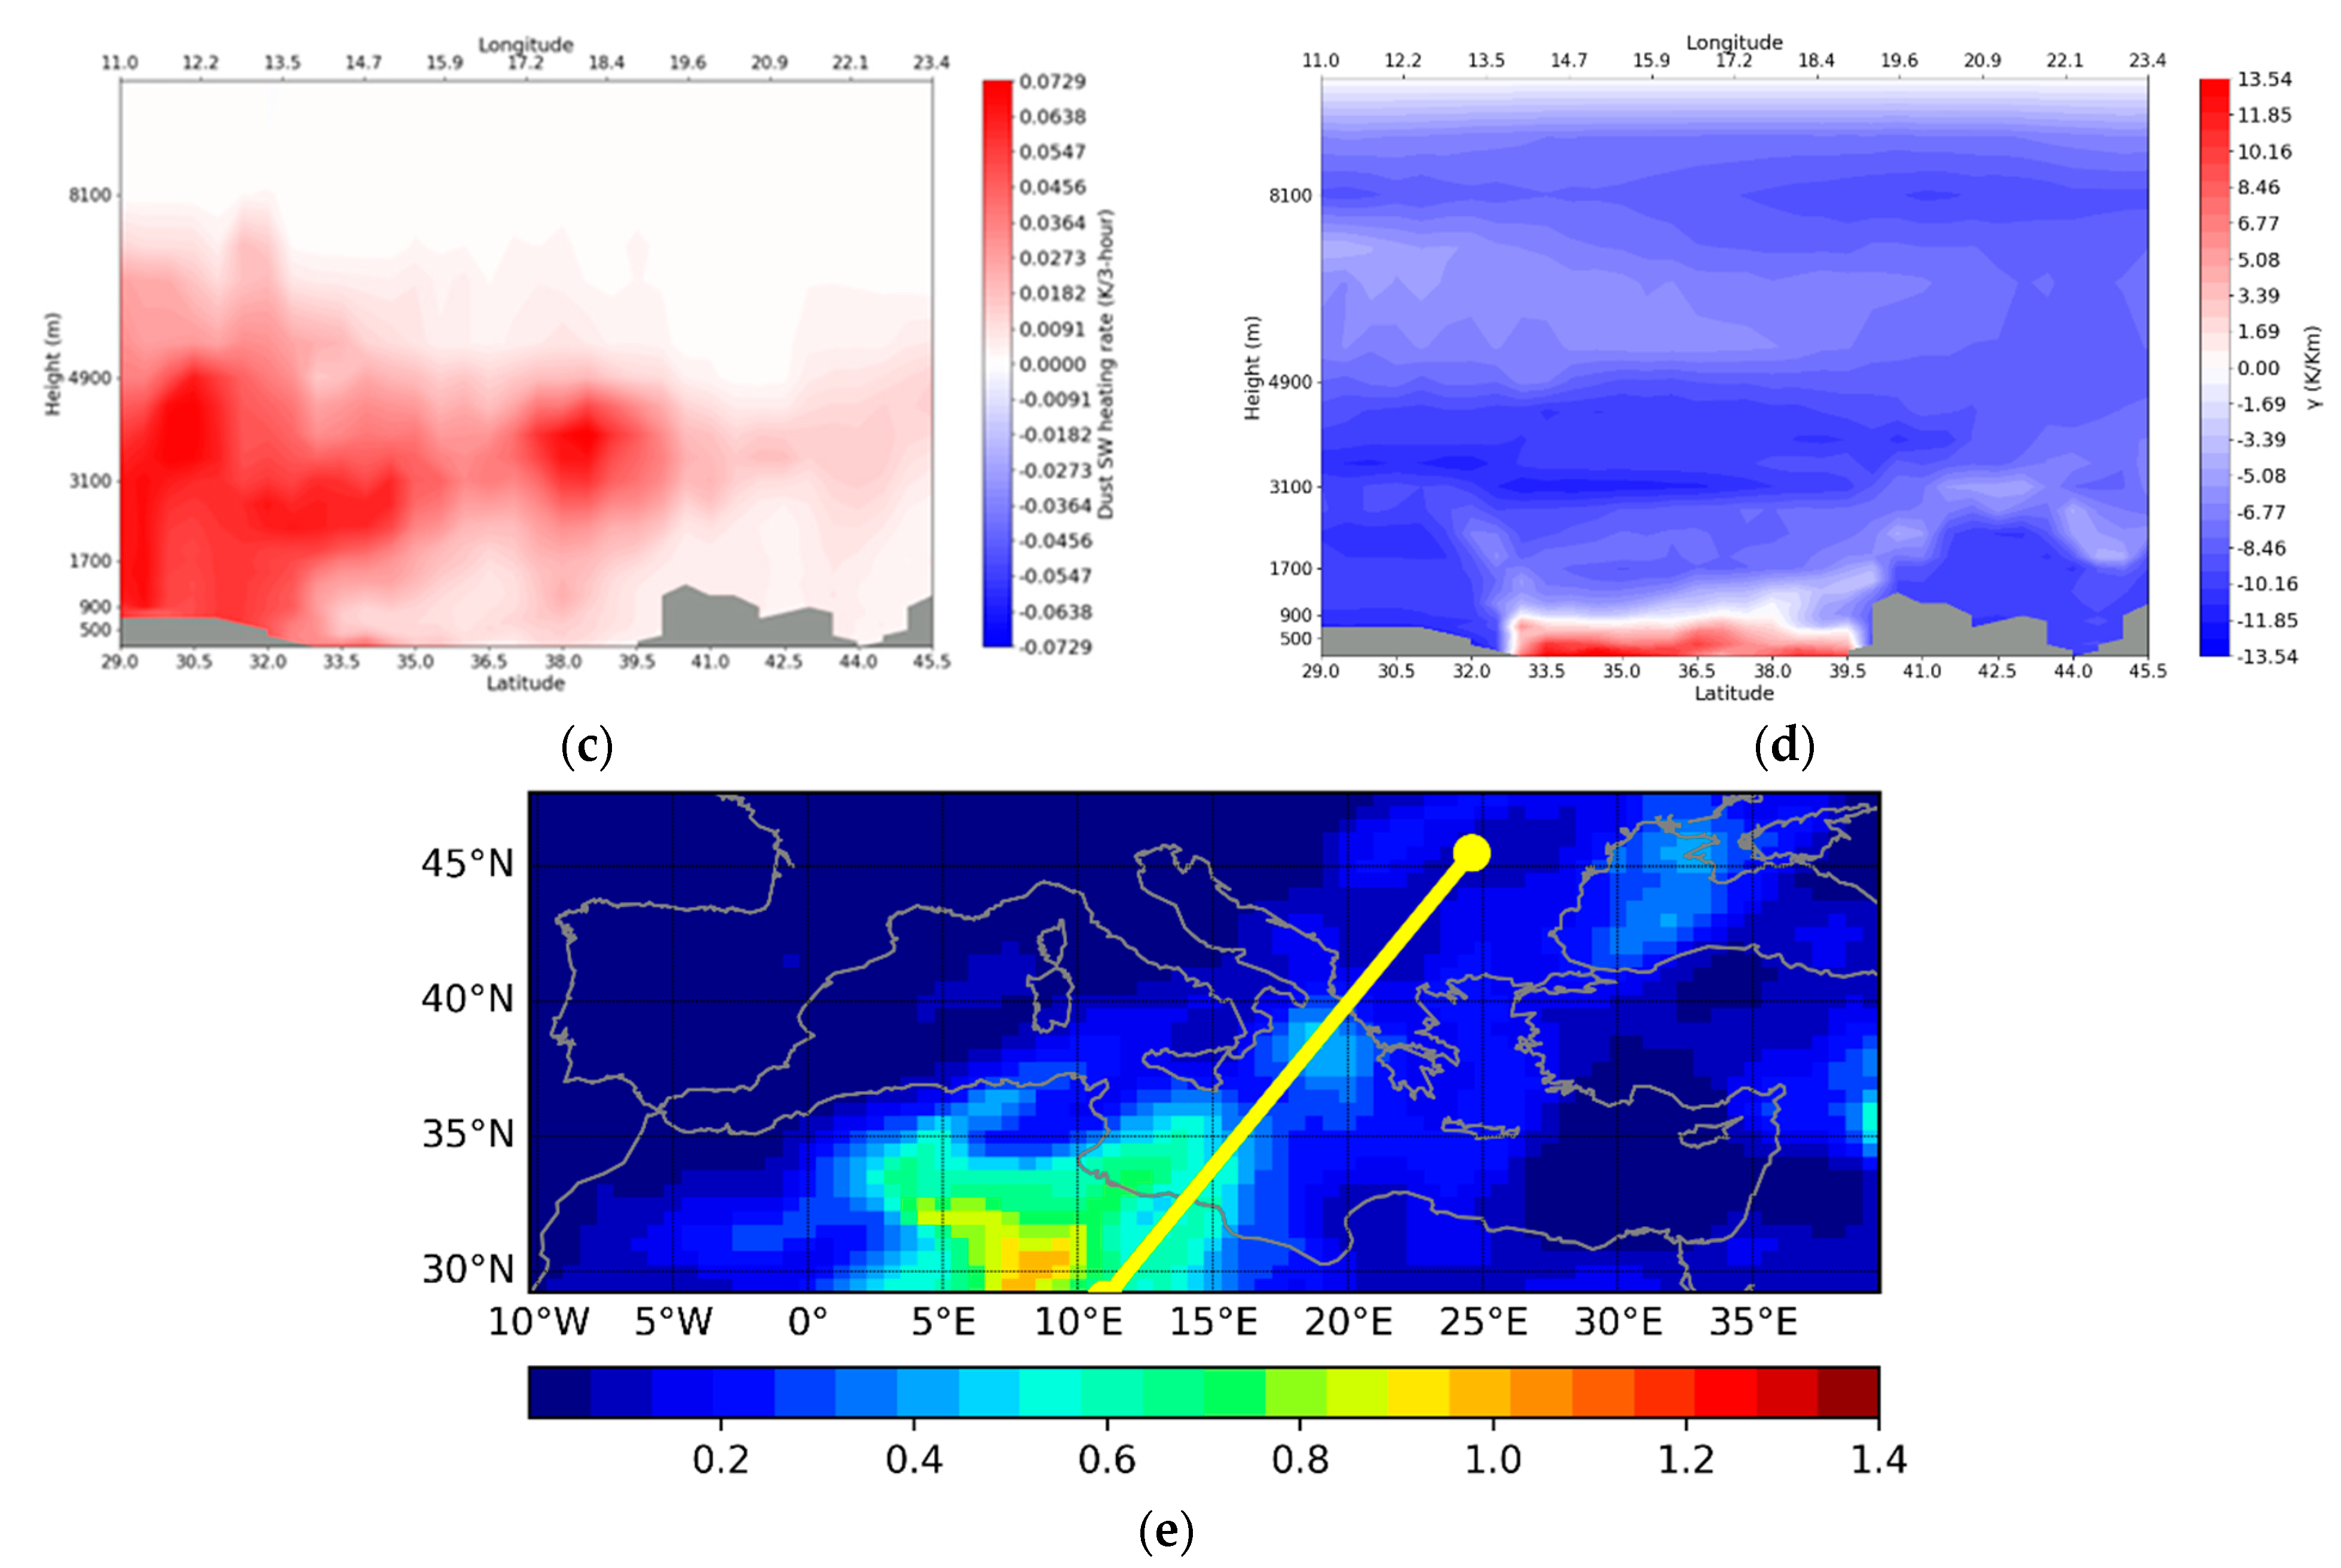
- The vertical resolution of the obtained RTM results gives insight into the existence of strong differences in SW atmospheric DDREs with height. Thus, along the pathways of the dust export, and within the layers having the highest dust loadings found up to 5–6 km in height, the largest DDREs, up to about 13 W/m2, are observed in the second day of the DAEC, namely on 17 June 2016, near 5 km. Apart from the significant vertical differences in magnitude, the model results reveal even a change in the sign of atmospheric DDREs, resulting in limited atmospheric cooling.
- The atmospheric solar radiative dust DREs cause a significant heating effect, producing heating rates up to 0.14 K/3 h on 17 June 2016, 12:00 UTC, being maximum within layers with the highest dust loadings, namely at heights between 3 and 5 km, but also with significant values down to the surface. Such important heating rates within air masses that carry dust loadings create significant horizontal and vertical temperature gradients, which can alter the distribution of isobars and induce horizontal pressure gradients with consequent effects on the dynamics of the regional atmosphere.
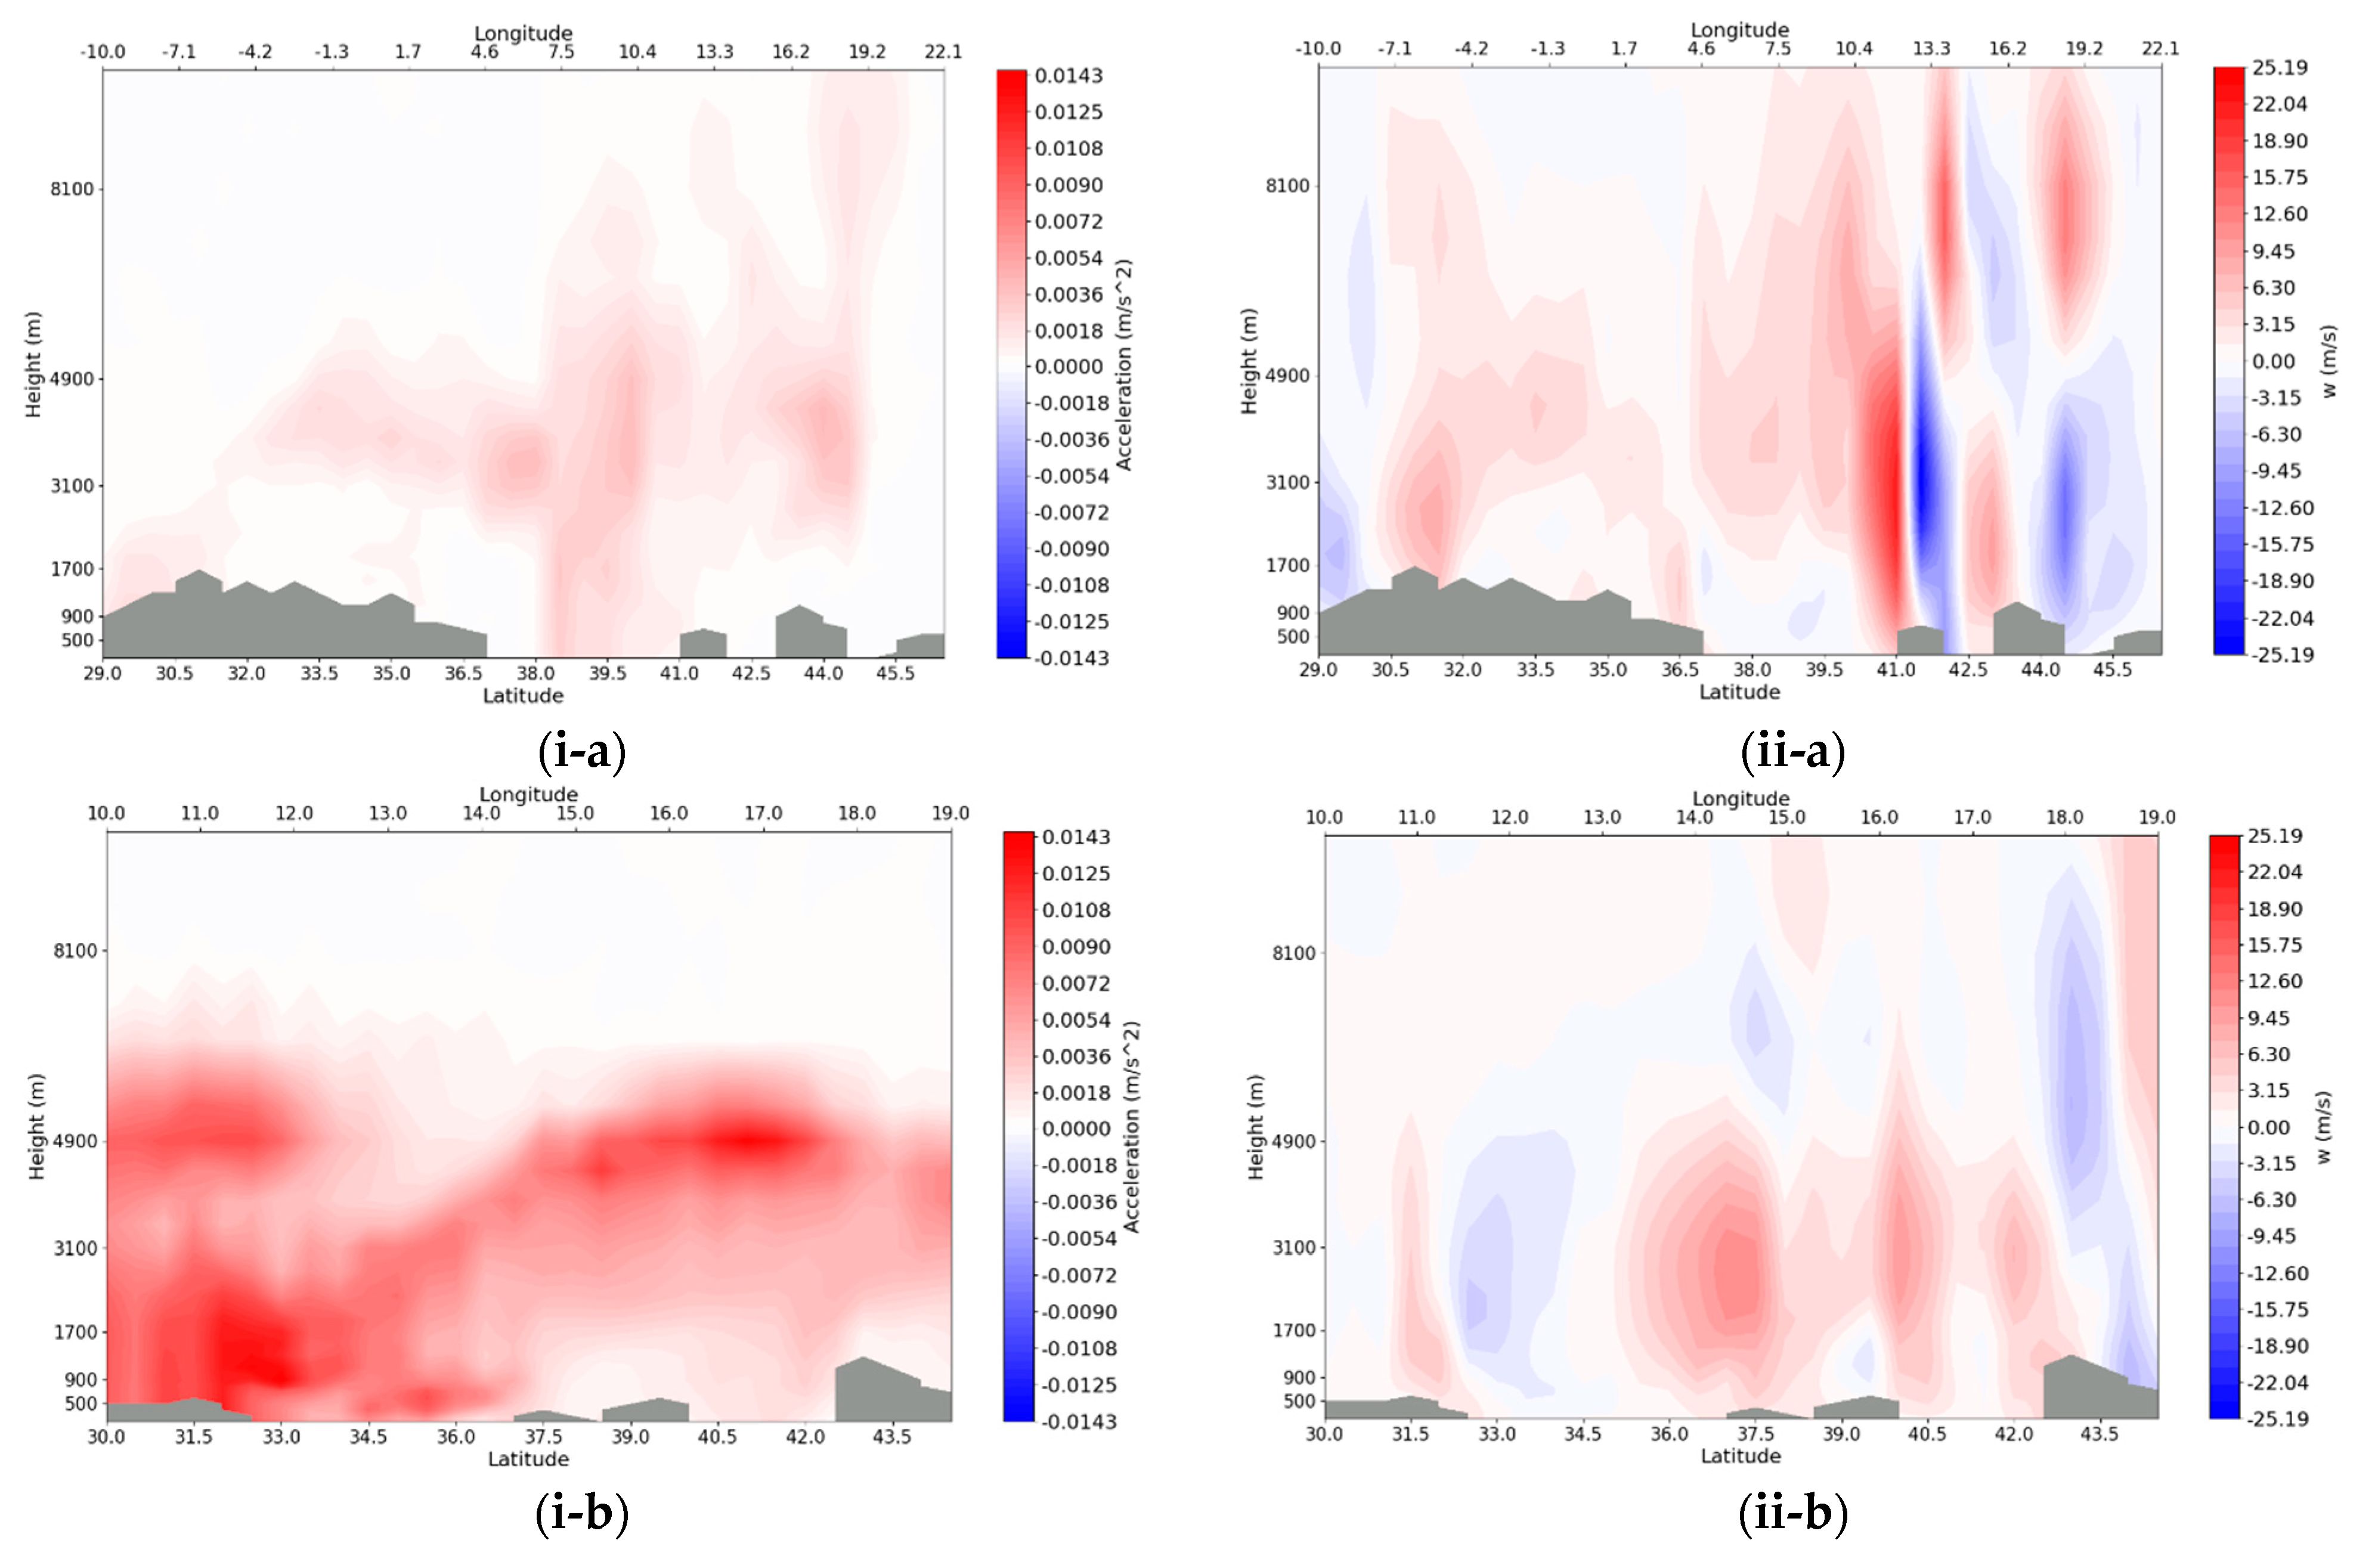
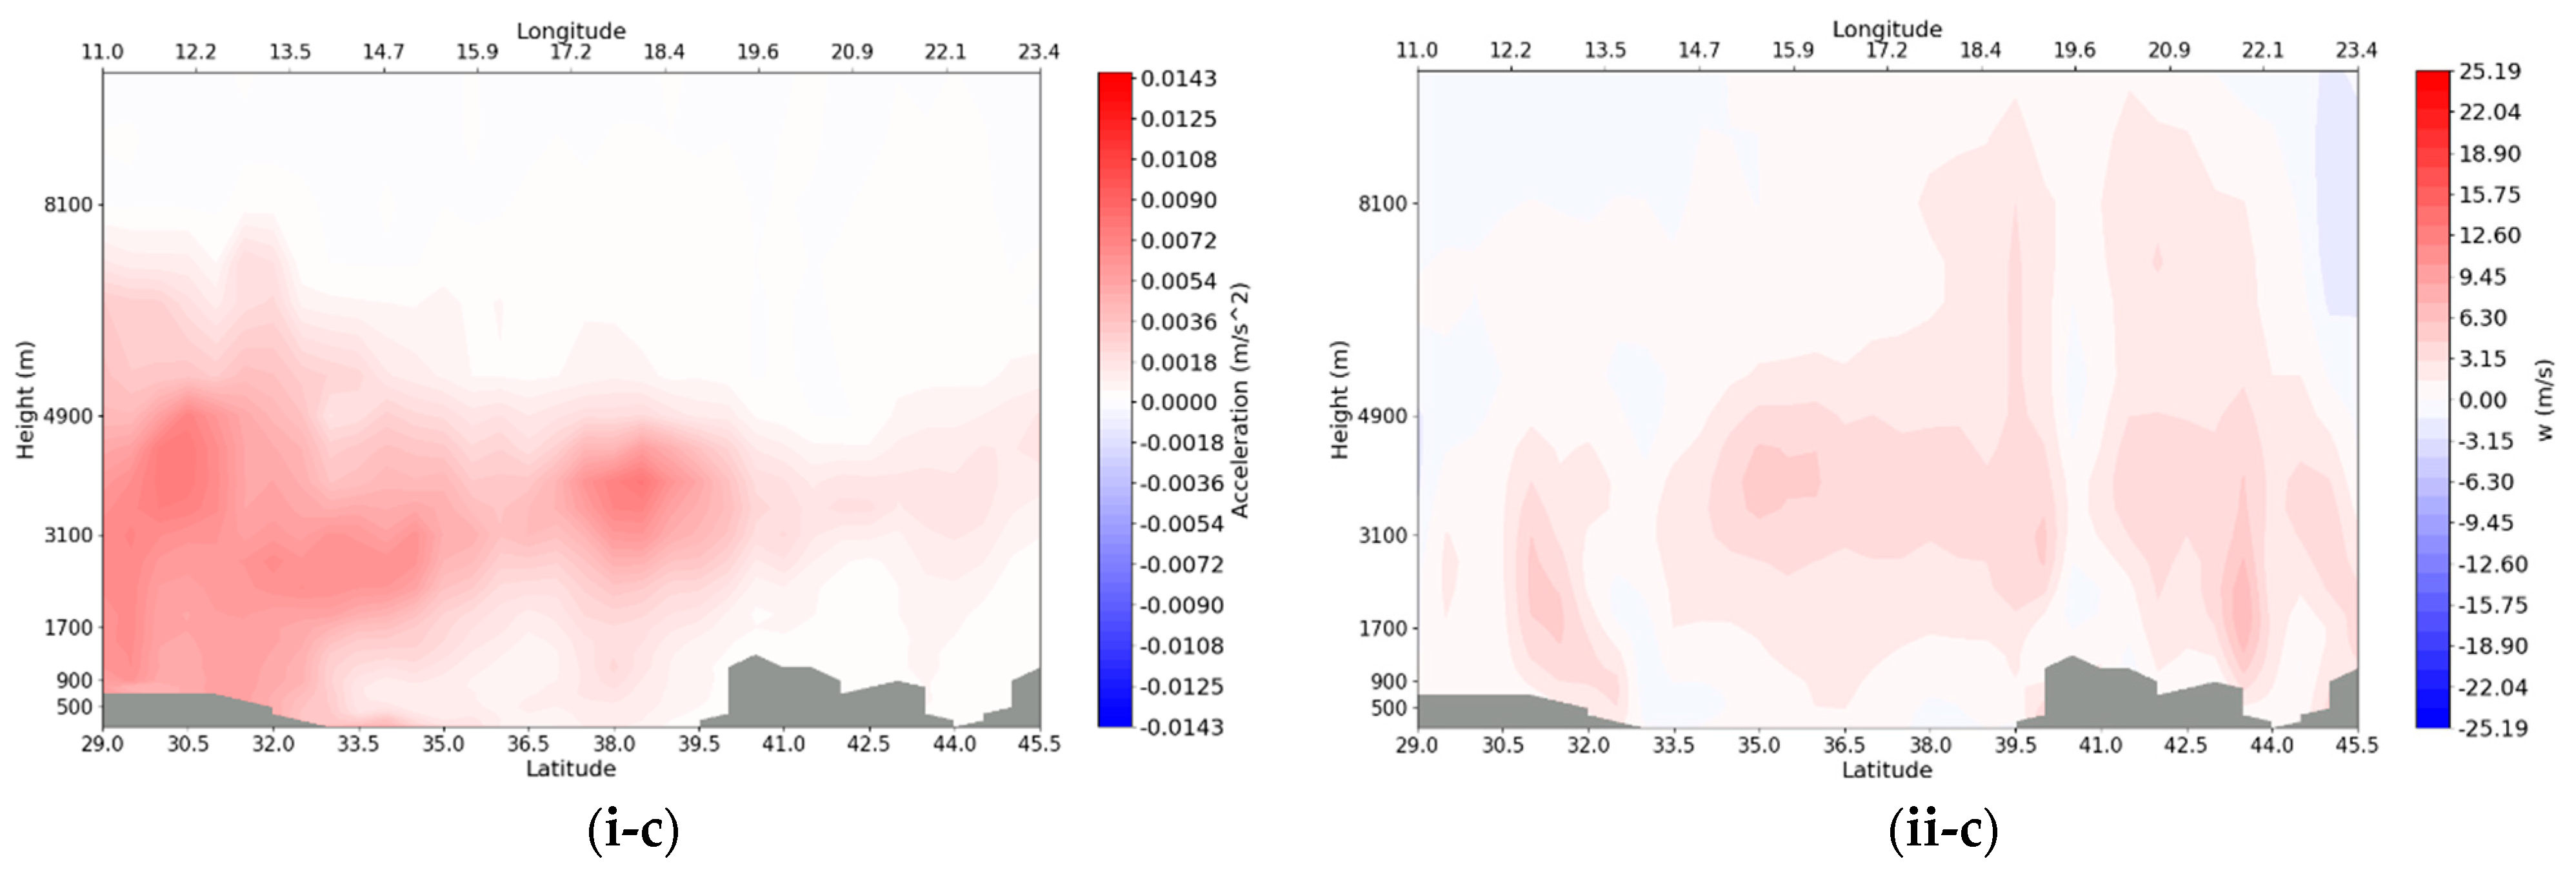
- The atmospheric heating induced by the absorption of solar radiation by DAs produces a buoyancy, with a maximum in the second day of the DAEC, which either favors or suppresses the vertical air motions, depending on the prevailing conditions. The vertical acceleration caused by dust aerosols was as large as 0.014 m/s2 on 17 June 2016 at 12:00 UTC within the elevated dust layer, near 5–6 km. This dust-induced buoyancy produces significant modifications to the vertical air velocity. For example, according to the model results, should an acceleration equal to 0.014 m/s2 persist for 10 min, the change in air velocity would be as large as 8.6 m/s, being of the same order of magnitude and comparable to the prevailing vertical velocities. Such modifications of vertical air motions due to dust can be related to the observed (e.g., [50]) effects on cloud formation, especially the high-level ones.
Supplementary Materials
Author Contributions
Funding
Institutional Review Board Statement
Informed Consent Statement
Data Availability Statement
Acknowledgments
Conflicts of Interest
References
- Cakmur, R.; Miller, R.; Perlwitz, J.; Geogdzhayev, I.; Ginoux, P.; Koch, D.; Kohfeld, K.; Tegen, I.; Zender, C. Constraining the Magnitude of the Global Dust Cycle by Minimizing the Difference between a Model and Observations. J. Geophys. Res. Atmos. 2006, 111, D06207. [Google Scholar] [CrossRef]
- Yin, Y.; Wurzler, S.; Levin, Z.; Reisin, T.G. Interactions of Mineral Dust Particles and Clouds: Effects on Precipitation and Cloud Optical Properties. J. Geophys. Res. Atmos. 2002, 107, AAC-19. [Google Scholar] [CrossRef]
- Sokolik, I.N.; Winker, D.; Bergametti, G.; Gillette, D.; Carmichael, G.; Kaufman, Y.; Gomes, L.; Schuetz, L.; Penner, J. Introduction to Special Section: Outstanding Problems in Quantifying the Radiative Impacts of Mineral Dust. J. Geophys. Res. Atmos. 2001, 106, 18015–18027. [Google Scholar] [CrossRef]
- Heinold, B.; Tegen, I.; Schepanski, K.; Hellmuth, O. Dust Radiative Feedback on Saharan Boundary Layer Dynamics and Dust Mobilization. Geophys. Res. Lett. 2008, 35, L20817. [Google Scholar] [CrossRef]
- Korras-Carraca, M.-B.; Gkikas, A.; Matsoukas, C.; Hatzianastassiou, N. Global Clear-Sky Aerosol Speciated Direct Radiative Effects over 40 Years (1980–2019). Atmosphere 2021, 12, 1254. [Google Scholar] [CrossRef]
- Di Sarra, A.; Di Biagio, C.; Meloni, D.; Monteleone, F.; Pace, G.; Pugnaghi, S.; Sferlazzo, D. Shortwave and Longwave Radiative Effects of the Intense Saharan Dust Event of 25–26 March 2010 at Lampedusa (Mediterranean Sea). J. Geophys. Res. Atmos. 2011, 116, D23209. [Google Scholar] [CrossRef]
- Nabat, P.; Somot, S.; Mallet, M.; Michou, M.; Sevault, F.; Driouech, F.; Meloni, D.; Di Sarra, A.; Di Biagio, C.; Formenti, P. Dust Aerosol Radiative Effects during Summer 2012 Simulated with a Coupled Regional Aerosol–Atmosphere–Ocean Model over the Mediterranean. Atmos. Chem. Phys. 2015, 15, 3303–3326. [Google Scholar] [CrossRef]
- Gkikas, A.; Obiso, V.; Perez Garcia-Pando, C.; Jorba, O.; Hatzianastassiou, N.; Vendrell, L.; Basart, S.; Solomos, S.; Gassó, S.; Baldasano, J.M. Direct Radiative Effects during Intense Mediterranean Desert Dust Outbreaks. Atmos. Chem. Phys. 2018, 18, 8757–8787. [Google Scholar] [CrossRef]
- Mallet, M.; Pont, V.; Liousse, C.; Gomes, L.; Pelon, J.; Osborne, S.; Haywood, J.; Roger, J.-C.; Dubuisson, P.; Mariscal, A. Aerosol Direct Radiative Forcing over Djougou (Northern Benin) during the African Monsoon Multidisciplinary Analysis Dry Season Experiment (Special Observation Period-0). J. Geophys. Res. Atmos. 2008, 113, D00C01. [Google Scholar] [CrossRef]
- Roger, J.-C.; Mallet, M.; Dubuisson, P.; Cachier, H.; Vermote, E.; Dubovik, O.; Despiau, S. A Synergetic Approach for Estimating the Local Direct Aerosol Forcing: Application to an Urban Zone during the Expérience Sur Site Pour Contraindre Les Modèles de Pollution et de Transport d’Emission (ESCOMPTE) Experiment. J. Geophys. Res. Atmos. 2006, 111, D13208. [Google Scholar] [CrossRef]
- Sicard, M.; Mallet, M.; García-Vizcaíno, D.; Comerón, A.; Rocadenbosch, F.; Dubuisson, P.; Muñoz-Porcar, C. Intense Dust and Extremely Fresh Biomass Burning Outbreak in Barcelona, Spain: Characterization of Their Optical Properties and Estimation of Their Direct Radiative Forcing. Environ. Res. Lett. 2012, 7, 034016. [Google Scholar] [CrossRef]
- Ryder, C.; Highwood, E.; Lai, T.; Sodemann, H.; Marsham, J.H. Impact of Atmospheric Transport on the Evolution of Microphysical and Optical Properties of Saharan Dust. Geophys. Res. Lett. 2013, 40, 2433–2438. [Google Scholar] [CrossRef]
- Sicard, M.; Bertolín, S.; Mallet, M.; Dubuisson, P.; Comerón, A. Estimation of Mineral Dust Long-Wave Radiative Forcing: Sensitivity Study to Particle Properties and Application to Real Cases in the Region of Barcelona. Atmos. Chem. Phys. 2014, 14, 9213–9231. [Google Scholar] [CrossRef]
- Ansmann, A.; Tesche, M.; Seifert, P.; Althausen, D.; Engelmann, R.; Fruntke, J.; Wandinger, U.; Mattis, I.; Müller, D. Evolution of the Ice Phase in Tropical Altocumulus: SAMUM Lidar Observations over Cape Verde. J. Geophys. Res. Atmos. 2009, 114, D17208. [Google Scholar] [CrossRef]
- Niedermeier, D.; Hartmann, S.; Shaw, R.; Covert, D.; Mentel, T.; Schneider, J.; Poulain, L.; Reitz, P.; Spindler, C.; Clauss, T. Heterogeneous Freezing of Droplets with Immersed Mineral Dust Particles–Measurements and Parameterization. Atmos. Chem. Phys. 2010, 10, 3601–3614. [Google Scholar] [CrossRef]
- Seinfeld, J.H.; Bretherton, C.; Carslaw, K.S.; Coe, H.; DeMott, P.J.; Dunlea, E.J.; Feingold, G.; Ghan, S.; Guenther, A.B.; Kahn, R. Improving Our Fundamental Understanding of the Role of Aerosol—Cloud Interactions in the Climate System. Proc. Natl. Acad. Sci. USA 2016, 113, 5781–5790. [Google Scholar] [CrossRef]
- Schepanski, K. Transport of Mineral Dust and Its Impact on Climate. Geosciences 2018, 8, 151. [Google Scholar] [CrossRef]
- Li, W.; Shao, L. Transmission Electron Microscopy Study of Aerosol Particles from the Brown Hazes in Northern China. J. Geophys. Res. Atmos. 2009, 114, D09302. [Google Scholar] [CrossRef]
- Matsuki, A.; Schwarzenboeck, A.; Venzac, H.; Laj, P.; Crumeyrolle, S.; Gomes, L. Cloud Processing of Mineral Dust: Direct Comparison of Cloud Residual and Clear Sky Particles during AMMA Aircraft Campaign in Summer 2006. Atmos. Chem. Phys. 2010, 10, 1057–1069. [Google Scholar] [CrossRef]
- Nenes, A.; Murray, B.; Bougiatioti, A. Mineral Dust and Its Microphysical Interactions with Clouds. In Mineral Dust; Springer: Berlin/Heidelberg, Germany, 2014; pp. 287–325. [Google Scholar]
- Marinou, E.; Voudouri, K.A.; Tsikoudi, I.; Drakaki, E.; Tsekeri, A.; Rosoldi, M.; Ene, D.; Baars, H.; O’Connor, E.; Amiridis, V. Geometrical and Microphysical Properties of Clouds Formed in the Presence of Dust above the Eastern Mediterranean. Remote Sens. 2021, 13, 5001. [Google Scholar] [CrossRef]
- Twomey, S. The Influence of Pollution on the Shortwave Albedo of Clouds. J. Atmos. Sci. 1977, 34, 1149–1152. [Google Scholar] [CrossRef]
- Rosenfeld, D.; Rudich, Y.; Lahav, R. Desert Dust Suppressing Precipitation: A Possible Desertification Feedback Loop. Proc. Natl. Acad. Sci. USA 2001, 98, 5975–5980. [Google Scholar] [CrossRef] [PubMed]
- Cheng, W.; Carrio, G.; Cotton, W.; Saleeby, S. Influence of Atmospheric Aerosols on the Development of Precipitating Trade Wind Cumuli in a Large Eddy Simulation. J. Geophys. Res 2009, 114, D08201. [Google Scholar] [CrossRef]
- Levin, Z.; Cotton, W.R. Aerosol Pollution Impact on Precipitation: A Scientific Review; Springer Science & Business Media: Berlin/Heidelberg, Germany, 2008. [Google Scholar]
- Andreae, M.O.; Rosenfeld, D.; Artaxo, P.; Costa, A.; Frank, G.; Longo, K.; Silva-Dias, M.A.F.d. Smoking Rain Clouds over the Amazon. Science 2004, 303, 1337–1342. [Google Scholar] [CrossRef]
- Huang, C.-C.; Chen, S.-H.; Lin, Y.-C.; Earl, K.; Matsui, T.; Lee, H.-H.; Tsai, I.-C.; Chen, J.-P.; Cheng, C.-T. Impacts of Dust–Radiation versus Dust–Cloud Interactions on the Development of a Modeled Mesoscale Convective System over North Africa. Mon. Weather Rev. 2019, 147, 3301–3326. [Google Scholar] [CrossRef]
- Jia, G.; Shevliakova, E.; Artaxo, P.; De-Docoudré, N.; Houghton, R.; House, J.; Kitajima, K.; Lennard, C.; Popp, A.; Sirin, A.; et al. Land–Climate interactions. In Special Report on Climate Change and Land: An Ipcc Special Report on Climate Change, Desertification, Land Degradation, Sustainable Land Management, Food Security, and Greenhouse Gas Fluxes in Terrestrial Ecosystems; IPCC: Geneva, Switzerland, 2019; pp. 133–206. [Google Scholar]
- Bullard, J.E.; Baddock, M.; Bradwell, T.; Crusius, J.; Darlington, E.; Gaiero, D.; Gassó, S.; Gisladottir, G.; Hodgkins, R.; McCulloch, R. High-latitude Dust in the Earth System. Rev. Geophys. 2016, 54, 447–485. [Google Scholar] [CrossRef]
- Prospero, J.M.; Bullard, J.E.; Hodgkins, R. High-Latitude Dust over the North Atlantic: Inputs from Icelandic Proglacial Dust Storms. Science 2012, 335, 1078–1082. [Google Scholar] [CrossRef]
- Engelstaedter, S.; Tegen, I.; Washington, R. North African Dust Emissions and Transport. Earth-Sci. Rev. 2006, 79, 73–100. [Google Scholar] [CrossRef]
- Ginoux, P.; Prospero, J.M.; Gill, T.E.; Hsu, N.C.; Zhao, M. Global-scale Attribution of Anthropogenic and Natural Dust Sources and Their Emission Rates Based on MODIS Deep Blue Aerosol Products. Rev. Geophys. 2012, 50, RG3005. [Google Scholar] [CrossRef]
- Gavrouzou, M.; Hatzianastassiou, N.; Gkikas, A.; Korras-Carraca, M.-B.; Mihalopoulos, N. A Global Climatology of Dust Aerosols Based on Satellite Data: Spatial, Seasonal and Inter-Annual Patterns over the Period 2005–2019. Remote Sens. 2021, 13, 359. [Google Scholar] [CrossRef]
- Yoon, J.-E.; Lim, J.-H.; Shim, J.-M.; Kwon, J.-I.; Kim, I.-N. Spring 2018 Asian Dust Events: Sources, Transportation, and Potential Biogeochemical Implications. Atmosphere 2019, 10, 276. [Google Scholar] [CrossRef]
- Evan, A.T.; Mukhopadhyay, S. Optical Depth of Atlantic Dust as NetCDF Files. Supplement to: Evan, AT; Mukhopadhyay, S (2010): African dust over the Northern Tropical Atlantic: 1955–2008. J. Appl. Meteorol. Climatol. 2010, 49, 2213–2229. [Google Scholar] [CrossRef]
- Velasco-Merino, C.; Mateos, D.; Toledano, C.; Prospero, J.M.; Molinie, J.; Euphrasie-Clotilde, L.; González, R.; Cachorro, V.E.; Calle, A.; de Frutos, A.M. Impact of Long-Range Transport over the Atlantic Ocean on Saharan Dust Optical and Microphysical Properties Based on AERONET Data. Atmos. Chem. Phys. 2018, 18, 9411–9424. [Google Scholar] [CrossRef]
- Wang, K.; Liu, C. Transport of the Saharan Dust Air Plumes over the Tropical North Atlantic from FORMOSAT–3/COSMIC Observation. Atmos. Pollut. Res. 2014, 5, 539–553. [Google Scholar] [CrossRef]
- Aklesso, M.; Kumar, K.R.; Bu, L.; Boiyo, R. Analysis of Spatial-Temporal Heterogeneity in Remotely Sensed Aerosol Properties Observed during 2005–2015 over Three Countries along the Gulf of Guinea Coast in Southern West Africa. Atmos. Environ. 2018, 182, 313–324. [Google Scholar] [CrossRef]
- Gavrouzou, M.; Hatzianastassiou, N.; Gkikas, A.; Lolis, C.J.; Mihalopoulos, N. A Climatological Assessment of Intense Desert Dust Episodes over the Broader Mediterranean Basin Based on Satellite Data. Remote Sens. 2021, 13, 2895. [Google Scholar] [CrossRef]
- Gkikas, A.; Basart, S.; Hatzianastassiou, N.; Marinou, E.; Amiridis, V.; Kazadzis, S.; Pey, J.; Querol, X.; Jorba, O.; Gassó, S. Mediterranean Intense Desert Dust Outbreaks and Their Vertical Structure Based on Remote Sensing Data. Atmos. Chem. Phys. 2016, 16, 8609–8642. [Google Scholar] [CrossRef]
- Papadimas, C.; Hatzianastassiou, N.; Mihalopoulos, N.; Querol, X.; Vardavas, I. Spatial and Temporal Variability in Aerosol Properties over the Mediterranean Basin Based on 6-year (2000–2006) MODIS Data. J. Geophys. Res. Atmos. 2008, 113, D11205. [Google Scholar] [CrossRef]
- Schepanski, K.; Mallet, M.; Heinold, B.; Ulrich, M. North African Dust Transport toward the Western Mediterranean Basin: Atmospheric Controls on Dust Source Activation and Transport Pathways during June–July 2013. Atmos. Chem. Phys. 2016, 16, 14147–14168. [Google Scholar] [CrossRef]
- Solomos, S.; Kalivitis, N.; Mihalopoulos, N.; Amiridis, V.; Kouvarakis, G.; Gkikas, A.; Binietoglou, I.; Tsekeri, A.; Kazadzis, S.; Kottas, M. From Tropospheric Folding to Khamsin and Foehn Winds: How Atmospheric Dynamics Advanced a Record-Breaking Dust Episode in Crete. Atmosphere 2018, 9, 240. [Google Scholar] [CrossRef]
- Gkikas, A.; Houssos, E.; Lolis, C.; Bartzokas, A.; Mihalopoulos, N.; Hatzianastassiou, N. Atmospheric Circulation Evolution Related to Desert-dust Episodes over the Mediterranean. Q. J. R. Meteorol. Soc. 2015, 141, 1634–1645. [Google Scholar] [CrossRef]
- Gkikas, A.; Giannaros, T.; Kotroni, V.; Lagouvardos, K. Assessing the Radiative Impacts of an Extreme Desert Dust Outbreak and the Potential Improvements on Short-Term Weather Forecasts: The Case of February 2015. Atmos. Res. 2019, 226, 152–170. [Google Scholar] [CrossRef]
- Meloni, D.; Di Sarra, A.; Di Iorio, T.; Fiocco, G. Influence of the Vertical Profile of Saharan Dust on the Visible Direct Radiative Forcing. J. Quant. Spectrosc. Radiat. Transf. 2005, 93, 397–413. [Google Scholar] [CrossRef]
- Bangert, M.; Nenes, A.; Vogel, B.; Vogel, H.; Barahona, D.; Karydis, V.; Kumar, P.; Kottmeier, C.; Blahak, U. Saharan Dust Event Impacts on Cloud Formation and Radiation over Western Europe. Atmos. Chem. Phys. 2012, 12, 4045–4063. [Google Scholar] [CrossRef]
- Gong, X.; Wex, H.; Müller, T.; Wiedensohler, A.; Höhler, K.; Kandler, K.; Ma, N.; Dietel, B.; Schiebel, T.; Möhler, O. Characterization of Aerosol Properties at Cyprus, Focusing on Cloud Condensation Nuclei and Ice-Nucleating Particles. Atmos. Chem. Phys. 2019, 19, 10883–10900. [Google Scholar] [CrossRef]
- Tsarpalis, K.; Katsafados, P.; Papadopoulos, A.; Mihalopoulos, N. Assessing Desert Dust Indirect Effects on Cloud Microphysics through a Cloud Nucleation Scheme: A Case Study over the Western Mediterranean. Remote Sens. 2020, 12, 3473. [Google Scholar] [CrossRef]
- Gavrouzou, M.; Hatzianastassiou, N.; Lolis, C.J.; Korras-Carraca, M.-B.; Mihalopoulos, N. Modification of Temperature Lapse Rates and Cloud Properties during a Spatiotemporally Extended Dust Aerosol Episode (16–18 June 2016) over the Mediterranean Basin Based on Satellite and Reanalysis Data. Remote Sens. 2022, 14, 679. [Google Scholar] [CrossRef]
- Hatzianastassiou, N.; Matsoukas, C.; Drakakis, E.; Stackhouse, P., Jr.; Koepke, P.; Fotiadi, A.; Pavlakis, K.; Vardavas, I. The Direct Effect of Aerosols on Solar Radiation Based on Satellite Observations, Reanalysis Datasets, and Spectral Aerosol Optical Properties from Global Aerosol Data Set (GADS). Atmos. Chem. Phys. 2007, 7, 2585–2599. [Google Scholar] [CrossRef]
- Vardavas, I.; Carver, J.H. Solar and Terrestrial Parameterizations for Radiative-Convective Models. Planet. Space Sci. 1984, 32, 1307–1325. [Google Scholar] [CrossRef]
- Benas, N.; Hatzianastassiou, N.; Matsoukas, C.; Fotiadi, A.; Mihalopoulos, N.; Vardavas, I. Aerosol Shortwave Direct Radiative Effect and Forcing Based on MODIS Level 2 Data in the Eastern Mediterranean (Crete). Atmos. Chem. Phys. 2011, 11, 12647–12662. [Google Scholar] [CrossRef]
- Granados-Muñoz, M.J.; Sicard, M.; Román, R.; Benavent-Oltra, J.A.; Barragán, R.; Brogniez, G.; Denjean, C.; Mallet, M.; Formenti, P.; Torres, B. Impact of Mineral Dust on Shortwave and Longwave Radiation: Evaluation of Different Vertically Resolved Parameterizations in 1-D Radiative Transfer Computations. Atmos. Chem. Phys. 2019, 19, 523–542. [Google Scholar] [CrossRef]
- Papadimas, C.; Hatzianastassiou, N.; Matsoukas, C.; Kanakidou, M.; Mihalopoulos, N.; Vardavas, I. The Direct Effect of Aerosols on Solar Radiation over the Broader Mediterranean Basin. Atmos. Chem. Phys. 2012, 12, 7165–7185. [Google Scholar] [CrossRef]
- Kosmopoulos, P.G.; Kazadzis, S.; Taylor, M.; Athanasopoulou, E.; Speyer, O.; Raptis, P.I.; Marinou, E.; Proestakis, E.; Solomos, S.; Gerasopoulos, E. Dust Impact on Surface Solar Irradiance Assessed with Model Simulations, Satellite Observations and Ground-Based Measurements. Atmos. Meas. Tech. 2017, 10, 2435–2453. [Google Scholar] [CrossRef]
- Randles, C.A.; Kinne, S.; Myhre, G.; Schulz, M.; Stier, P.; Fischer, J.; Doppler, L.; Highwood, E.; Ryder, C.; Harris, B. Intercomparison of Shortwave Radiative Transfer Schemes in Global Aerosol Modeling: Results from the AeroCom Radiative Transfer Experiment. Atmos. Chem. Phys. 2013, 13, 2347–2379. [Google Scholar] [CrossRef]
- Holben, B.N.; Eck, T.F.; al Slutsker, I.; Tanré, D.; Buis, J.; Setzer, A.; Vermote, E.; Reagan, J.A.; Kaufman, Y.; Nakajima, T. AERONET—A Federated Instrument Network and Data Archive for Aerosol Characterization. Remote Sens. Environ. 1998, 66, 1–16. [Google Scholar] [CrossRef]
- Wild, M.; Folini, D.; Schär, C.; Loeb, N.; Dutton, E.; König-Langlo, G. Basic Measurements of Radiation from the Baseline Surface Radiation Network (BSRN) in the Years 1992 to 2012, Reference List of 6378 Datasets; PANGAEA: Bremen, Germany. [CrossRef]
- Kotarba, A.Z. Evaluation of ISCCP Cloud Amount with MODIS Observations. Atmos. Res. 2015, 153, 310–317. [Google Scholar] [CrossRef]
- Jones, P.W. First-and Second-Order Conservative Remapping Schemes for Grids in Spherical Coordinates. Mon. Weather Rev. 1999, 127, 2204–2210. [Google Scholar] [CrossRef]
- Gelaro, R.; McCarty, W.; Suárez, M.J.; Todling, R.; Molod, A.; Takacs, L.; Randles, C.A.; Darmenov, A.; Bosilovich, M.G.; Reichle, R. The Modern-Era Retrospective Analysis for Research and Applications, Version 2 (MERRA-2). J. Clim. 2017, 30, 5419–5454. [Google Scholar] [CrossRef]
- Buchard, V.; Randles, C.; Da Silva, A.; Darmenov, A.; Colarco, P.; Govindaraju, R.; Ferrare, R.; Hair, J.; Beyersdorf, A.; Ziemba, L. The MERRA-2 Aerosol Reanalysis, 1980 Onward. Part II: Evaluation and Case Studies. J. Clim. 2017, 30, 6851–6872. [Google Scholar] [CrossRef]
- Shi, H.; Xiao, Z.; Zhan, X.; Ma, H.; Tian, X. Evaluation of MODIS and Two Reanalysis Aerosol Optical Depth Products over AERONET Sites. Atmos. Res. 2019, 220, 75–80. [Google Scholar] [CrossRef]
- Hatzianastassiou, N.; Fotiadi, A.; Matsoukas, C.; Pavlakis, K.; Drakakis, E.; Hatzidimitriou, D.; Vardavas, I. Long-Term Global Distribution of Earth’s Shortwave Radiation Budget at the Top of Atmosphere. Atmos. Chem. Phys. 2004, 4, 1217–1235. [Google Scholar] [CrossRef]
- Korras-Carraca, M.; Pappas, V.; Hatzianastassiou, N.; Vardavas, I.; Matsoukas, C. Global Vertically Resolved Aerosol Direct Radiation Effect from Three Years of CALIOP Data Using the FORTH Radiation Transfer Model. Atmos. Res. 2019, 224, 138–156. [Google Scholar] [CrossRef]
- Matsoukas, C.; Hatzianastassiou, N.; Fotiadi, A.; Pavlakis, K.; Vardavas, I. The Effect of Arctic Sea-Ice Extent on the Absorbed (Net) Solar Flux at the Surface, Based on ISCCP-D2 Cloud Data for 1983–2007. Atmos. Chem. Phys. 2010, 10, 777–787. [Google Scholar] [CrossRef]
- Pyrina, M.; Hatzianastassiou, N.; Matsoukas, C.; Fotiadi, A.; Papadimas, C.; Pavlakis, K.; Vardavas, I. Cloud Effects on the Solar and Thermal Radiation Budgets of the Mediterranean Basin. Atmos. Res. 2015, 152, 14–28. [Google Scholar] [CrossRef]
- Hatzianastassiou, N.; Papadimas, C.; Matsoukas, C.; Pavlakis, K.; Fotiadi, A.; Wild, M.; Vardavas, I. Recent Regional Surface Solar Radiation Dimming and Brightening Patterns: Inter-hemispherical Asymmetry and a Dimming in the Southern Hemisphere. Atmos. Sci. Lett. 2012, 13, 43–48. [Google Scholar] [CrossRef]
- Hatzianastassiou, N.; Ioannidis, E.; Korras-Carraca, M.-B.; Gavrouzou, M.; Papadimas, C.D.; Matsoukas, C.; Benas, N.; Fotiadi, A.; Wild, M.; Vardavas, I. Global Dimming and Brightening Features during the First Decade of the 21st Century. Atmosphere 2020, 11, 308. [Google Scholar] [CrossRef]
- Gueymard, C.A. The Sun’s Total and Spectral Irradiance for Solar Energy Applications and Solar Radiation Models. Sol. Energy 2004, 76, 423–453. [Google Scholar] [CrossRef]
- Joseph, J.H.; Wiscombe, W.; Weinman, J. The Delta-Eddington Approximation for Radiative Flux Transfer. J. Atmos. Sci. 1976, 33, 2452–2459. [Google Scholar] [CrossRef]
- Tzallas, V.; Hatzianastassiou, N.; Benas, N.; Meirink, J.F.; Matsoukas, C.; Stackhouse, P.; Vardavas, I. Evaluation of CLARA-A2 and ISCCP-H Cloud Cover Climate Data Records over Europe with ECA & D Ground-Based Measurements. Remote Sens. 2019, 11, 212. [Google Scholar] [CrossRef]
- Masmoudi, M.; Alfaro, S.C.; El Metwally, M. A Comparison of the Physical Properties of Desert Dust Retrieved from the Sunphotometer Observation of Major Events in the Sahara, Sahel, and Arabian Peninsula. Atmos. Res. 2015, 158, 24–35. [Google Scholar] [CrossRef]
- Chen, T.; Rossow, W.B.; Zhang, Y. Radiative Effects of Cloud-Type Variations. J. Clim. 2000, 13, 264–286. [Google Scholar] [CrossRef]
- Chand, D.; Wood, R.; Anderson, T.; Satheesh, S.; Charlson, R. Satellite-Derived Direct Radiative Effect of Aerosols Dependent on Cloud Cover. Nat. Geosci. 2009, 2, 181–184. [Google Scholar] [CrossRef]
- Ramaswamy, V.; Freidenreich, S. A High-spectral Resolution Study of the Near-infrared Solar Flux Disposition in Clear and Overcast Atmospheres. J. Geophys. Res. Atmos. 1998, 103, 23255–23273. [Google Scholar] [CrossRef]
- Nabat, P.; Solmon, F.; Mallet, M.; Kok, J.; Somot, S. Dust Emission Size Distribution Impact on Aerosol Budget and Radiative Forcing over the Mediterranean Region: A Regional Climate Model Approach. Atmos. Chem. Phys. 2012, 12, 10545–10567. [Google Scholar] [CrossRef]
- Kacenelenbogen, M.S.; Vaughan, M.A.; Redemann, J.; Young, S.A.; Liu, Z.; Hu, Y.; Omar, A.H.; LeBlanc, S.; Shinozuka, Y.; Livingston, J. Estimations of Global Shortwave Direct Aerosol Radiative Effects above Opaque Water Clouds Using a Combination of A-Train Satellite Sensors. Atmos. Chem. Phys. 2019, 19, 4933–4962. [Google Scholar] [CrossRef]
- Oikawa, E.; Nakajima, T.; Winker, D. An Evaluation of the Shortwave Direct Aerosol Radiative Forcing Using CALIOP and MODIS Observations. J. Geophys. Res. Atmos. 2018, 123, 1211–1233. [Google Scholar] [CrossRef]
- Mishra, A.K.; Koren, I.; Rudich, Y. Effect of Aerosol Vertical Distribution on Aerosol-Radiation Interaction: A Theoretical Prospect. Heliyon 2015, 1, e00036. [Google Scholar] [CrossRef]
- Meng, L.; Zhao, T.; He, Q.; Yang, X.; Mamtimin, A.; Wang, M.; Pan, H.; Huo, W.; Yang, F.; Zhou, C. Dust Radiative Effect Characteristics during a Typical Springtime Dust Storm with Persistent Floating Dust in the Tarim Basin, Northwest China. Remote Sens. 2022, 14, 1167. [Google Scholar] [CrossRef]
- Choobari, O.A.; Zawar-Reza, P.; Sturman, A. Feedback between Windblown Dust and Planetary Boundary-Layer Characteristics: Sensitivity to Boundary and Surface Layer Parameterizations. Atmos. Environ. 2012, 61, 294–304. [Google Scholar] [CrossRef]
- Yang, S.; Wang, Z.; Huang, X.; Wang, W.; Sheng, L.; Zhou, Y. Meteorological Feedback and Eco-Environmental Impact of Asian Dust: A Simulation Study. Atmos. Environ. 2021, 253, 118350. [Google Scholar] [CrossRef]


Disclaimer/Publisher’s Note: The statements, opinions and data contained in all publications are solely those of the individual author(s) and contributor(s) and not of MDPI and/or the editor(s). MDPI and/or the editor(s) disclaim responsibility for any injury to people or property resulting from any ideas, methods, instructions or products referred to in the content. |
© 2023 by the authors. Licensee MDPI, Basel, Switzerland. This article is an open access article distributed under the terms and conditions of the Creative Commons Attribution (CC BY) license (https://creativecommons.org/licenses/by/4.0/).
Share and Cite
Gavrouzou, M.; Hatzianastassiou, N.; Korras-Carraca, M.-B.; Stamatis, M.; Lolis, C.; Matsoukas, C.; Michalopoulos, N.; Vardavas, I. Three-Dimensional Distributions of the Direct Effect of anExtended and Intense Dust Aerosol Episode (16–18 June 2016) over the Mediterranean Basin on Regional Shortwave Radiation, Atmospheric Thermal Structure, and Dynamics. Appl. Sci. 2023, 13, 6878. https://doi.org/10.3390/app13126878
Gavrouzou M, Hatzianastassiou N, Korras-Carraca M-B, Stamatis M, Lolis C, Matsoukas C, Michalopoulos N, Vardavas I. Three-Dimensional Distributions of the Direct Effect of anExtended and Intense Dust Aerosol Episode (16–18 June 2016) over the Mediterranean Basin on Regional Shortwave Radiation, Atmospheric Thermal Structure, and Dynamics. Applied Sciences. 2023; 13(12):6878. https://doi.org/10.3390/app13126878
Chicago/Turabian StyleGavrouzou, Maria, Nikos Hatzianastassiou, Marios-Bruno Korras-Carraca, Michalis Stamatis, Christos Lolis, Christos Matsoukas, Nikos Michalopoulos, and Ilias Vardavas. 2023. "Three-Dimensional Distributions of the Direct Effect of anExtended and Intense Dust Aerosol Episode (16–18 June 2016) over the Mediterranean Basin on Regional Shortwave Radiation, Atmospheric Thermal Structure, and Dynamics" Applied Sciences 13, no. 12: 6878. https://doi.org/10.3390/app13126878