Evaluating and Ranking SCPMS Enablers Using ISM and SWARA


Department of Industrial Engineering, College of Engineering, King Khalid University, Abha 61421, Saudi Arabia
Appl. Sci. 2023, 13(9), 5791; https://doi.org/10.3390/app13095791
Submission received: 4 March 2023
/
Revised: 4 April 2023
/
Accepted: 8 April 2023
/
Published: 8 May 2023
Abstract
:The supply chain performance measurement system (SCPMS) is considered an integral and important part of supply chain management (SCM) for an effective and efficient supply chain (SC). The healthier and more flexible SCPMS is based on the enablers from which the SC metrics are taken. The identification of such enablers must be aligned with the strategic objectives of the organization and mapped to the SC measurement objectives. Hence, this study identifies a set of enablers and ranks them. Interpretive structural modeling (ISM)-based methodology is used in the current study to model the SCPMS implementation enablers. MICMAC analysis is further employed to categorize and comprehend the importance of each SCPMS enabler. ISM offers relationship modeling of SCPMS enablers, whereas MICMAC helps with classifying them into four categories. The Delphi method is then used to validate the ISM model. The SCPMS variable is also used in prioritization using stepwise weight assessment ratio analysis (SWARA). Practicing managers may benefit when developing and installing the SCPMS to satisfy the requirements of supply chain 4.0 for Industry 4.0 (I4.0). They will also be able to recognize and allocate resources while implementing SCPMS. The prioritization using SWARA provides an important ranking according to its importance. The SCPMS enablers of ‘top management support’, ‘SC 4.0 performance measurement awareness’, and ‘managerial readiness’ are found to be significant.
1. Introduction
A performance measure (PM) is a summing up of a process or activity in measurable and comparable terms of efficiency or effectiveness. It also leads to an increase in SC competitiveness and sustainability improvement [1]. Generally, performance measures are enabled through customized measurable metrics that can assess the process or activity for its performance measurement. In sustainable supply chain management, performance assessment is viewed as a crucial component of competitive strategy to boost organizational efficiency and profitability (SCM) [2]. Recently, organizational performance metrics and performance measurement-based research domains have attracted researchers and practitioners [3]. The supply chain is changing because of the Internet of things (IoT), cyber-physical systems (CPSs), cloud computing, big data analytics, radiofrequency identification (RFID), and other Wi-Fi-enabled technologies. 4.0 [4]. The various data-capturing and analysis processes in various domains of logistics 4.0 and warehouse 4.0 in real time help visibility, transparency, and leagility. The efficient component of product tracking and tracing helps in improving information and communication effectiveness during production, storage, sales, transportation, etc. [5]. Considering the constant revolutionary developments in the supply chain, intelligent supply chain performance measurement is the need of I4.0 [6]. The Fourth Industrial Revolution, often known as the digitization of industries, includes CPSs and IoT [7]. Although there are numerous advantages to the digital industrial revolution, many firms find it challenging to implement [8]. Cloud-based supply chain management (C-SCM) helps with supply chain responsiveness (SCR) by responding to market requirements in a timely and effective manner [9].
SCPM is crucial for determining success, satisfying client needs, and having a clear grasp of the process. It may help further with waste detection, process improvement, and process bottleneck investigation, accomplishing progress, progress monitoring, shared communication, and prompt decision making [10]. Performance evaluation is important for coming up with strategies, getting the word out about them, and making diagnostic control systems by measuring the effect [11].
A study investigating relationships among 14 key variables of SCPMS using ISM and MICMAC was carried out [12]. Similar to this, research was conducted utilizing ISM and MICMAC to examine the interactions among the 14 primary barriers of SC [13]. A study identifying and ranking eight performance measures of automotive SC was undertaken [14]. An investigation of the dependent and independent obstacles of SC in the Indian automobile industry was conducted using ISM and fuzzy MICMAC, wherein they found a ‘lack of awareness about PMS’ to be a significant barrier [15]. Past studies were focused on the key enablers and barriers before supply chain 4.0, which necessitated the present study considering Wi-Fi-enabled technologies and digital industrial transformation. The primary research questions of the current study are based on the aforementioned: (i) What are the key enablers that make intelligent SCPMS possible? (ii) What kind of relationship exists among such enablers? (iii) How can these enablers be classified into various categories consisting of dependent, independent, autonomous, and linkage? When implementing intelligent SCPMS, there are important enablers that influence it and important barriers that present resistance [16]. ISM- and MICMAC-based studies are more commonly used for relationship modeling of enablers, barriers, and critical success factors (CSFs) [17,18,19]. On the basis of the foregoing assumptions, the current study will aid in the development of an intelligent SCPMS that can manage difficulties linked to supply chain 4.0 in its measurement and control. The enablers are ranked in order of importance using stepwise weight assessment ratio analysis (SWARA). Furthermore, the SWARA approach is simple and allows experts to collaborate with ease. The key benefit of using this approach to decision making is that it allows taking into consideration defined priorities. Hence, there is no need for the evaluation to rank criteria [20]. Industry 4.0 variables for sustainable SCM in the Indian manufacturing industry were ranked using SWARA [21]. Fuzzy SWARA along with AHP and BWM has been applied in comparative analysis and ranking of lean supply chain enablers [22].
The remaining sections are organized as follows: a literature review is presented in Section 2. The research methodology of ISM, MICMAC, Delphi, and SWARA is discussed in Section 3. Section 4 reveals the various results using various combinatorial approaches. Results that were attained through the methodical application of techniques are presented in Section 5. Section 6 documents the conclusion.
2. Literature Review
Several studies have identified and investigated the relationship among critical success factors, variables, enablers, and barriers to SCPMS implementation. To visualize and comprehend the significance of SCM performance monitoring and related metrics, several scholars created a framework connected to SCPMS [2]. A framework for agricultural SCPM was developed using an IoT-based data-driven approach [1]. A theoretical framework of SCPM was developed by considering time, profitability, order book analysis, and managerial analysis, before being validated using a case problem [23]. A theoretical framework based on a qualitative approach using key performance indicators (KPIs) was designed for retail SC performance [24].
SCPMS has been the subject of several review-based studies in the past. Review-based research has sought to categorize the literature according to the methodologies (hierarchical-based, SCOR, BSC, and process-based), techniques (DEA, AHP, and simulation), case studies, and empirical studies. One such study reviewed 83 research articles from Scopus and ISI databases on SCPMS from 1998 to 2015 in light of approaches, techniques, and criteria [25]. A total of 127 research articles were reviewed for various approaches and techniques of SCPM from 1998 to 2018, and the authors suggested the use of simulation techniques over other techniques for SCPM in volatility [26]. To learn more, review-based research was conducted considering various research methodologies, approaches, problem areas, and requirements considering the new SC era [27].
Various empirical base studies on SCPMS have been carried out. Various SCPM practices were assessed in India [28]. The performance measuring system (PMS) architecture was used to analyze 132 sets of feedback to assess the effectiveness of the red chili supply chain [29]. A research based on 390 respondents consisting of top business people examined the Saudi Arabian corporate sector’s supply chain responsiveness, flexibility, and adaptation [30]. A strategic study was carried out on 136 Indian manufacturing sectors to design the SCPMS [31]. Exploratory studies were also carried out in SCM [32] and the GSCM area [33]. Various case studies have been undertaken to study SCPM implementation in several sectors. The balanced scorecard (BSC) is a performance measurement approach that can transform strategy into measurable indicators to implement in the industry [34]. The modified BSC was employed in a combination of analytical hierarchical processes (AHPs) for the PMS of GSC [35].
SCPM was also used in multicriteria decision making (MCDM) in other studies. An investigation using a hybrid fuzzy MCDM approach was conducted to gauge how well the food supply chain (FSC) functions [36,37,38]. Evaluation of the environmental performance of the service supply chain was conducted using gray-based hybrid MCDM methodologies from the ELECTRE and VIKOR approaches [39]. The financial performance was assessed using a set of financial ratios and a plithogenic multi-criteria decision making (MCDM) model based on the neutrosophic analytic hierarchy process (AHP), the Vlse Kriterijumska Optimizacija Kompromisno Resenje (VIKOR) method, and the technique in order of preference by similarity to ideal solution (TOPSIS) method [40].
The SCPMS has been designed using perspective-based, process-based, and hierarchical approaches. The balanced scorecard is the most common perspective that researchers have designed and implemented. The perspectives of finance, customer, internal business process, innovation, improvement, and employees’ learning and growth have been used to help managers evaluate SCM performance in a balanced way from all angles of business [41]. A process-based performance measurement system measuring the performance of activities was developed to identify the performance measures and metrics [42]. Process-based measurement provides timely information for real-time integration to improve cross-organizational processes. A complex hierarchy with different levels of aggregation may be employed to measure the SCPM using various approaches [43]. A review of the literature was carried out according to the various criteria of perspective-based, process-based, and hierarchical-based approaches [10]. A further comparison of existing performance measurement systems was also carried out.
Various approaches to leanness, agility, innovation, and responsiveness are vital in SC performance measurement. Research looking into how controlling quality, agility, and innovation affect SC performance concluded that they had a favorable impact [44]. A study revealed the enablers of SC agility and described how it affects organization performance using feedback from 266 electronics companies in China [45]. SC is badly affected by volatile and unpredictable market demand that demands proactive actions for leagility [46]. Various studies involving SC activities, processes, and approaches are listed in Table 1.
3. Research Methodology
SCPMS plays a vital role in accomplishing many strategic objectives of the organization; hence, a systematic methodology must be followed to ensure its success. All enablers must be investigated for their crucial roles and reciprocal relationships with other enablers since SCPMS enablers are crucial to SCPMS deployment. A mixed approach-based methodology is used as it fulfills all the research objectives. Through an extensive analysis of the literature, this article identifies the SCPMS enablers. The identified SCPMS enablers are studied and shortlisted further using the expert group opinion. Additionally, all SCPMS enablers are categorized by MICMAC, verified by the Delphi approach, and modeled for their relationships utilizing ISM relationship modeling tools. Thus, a combination of research approaches has been employed. Three distinct periods, which are each documented in depth, each employed a different study methodology.
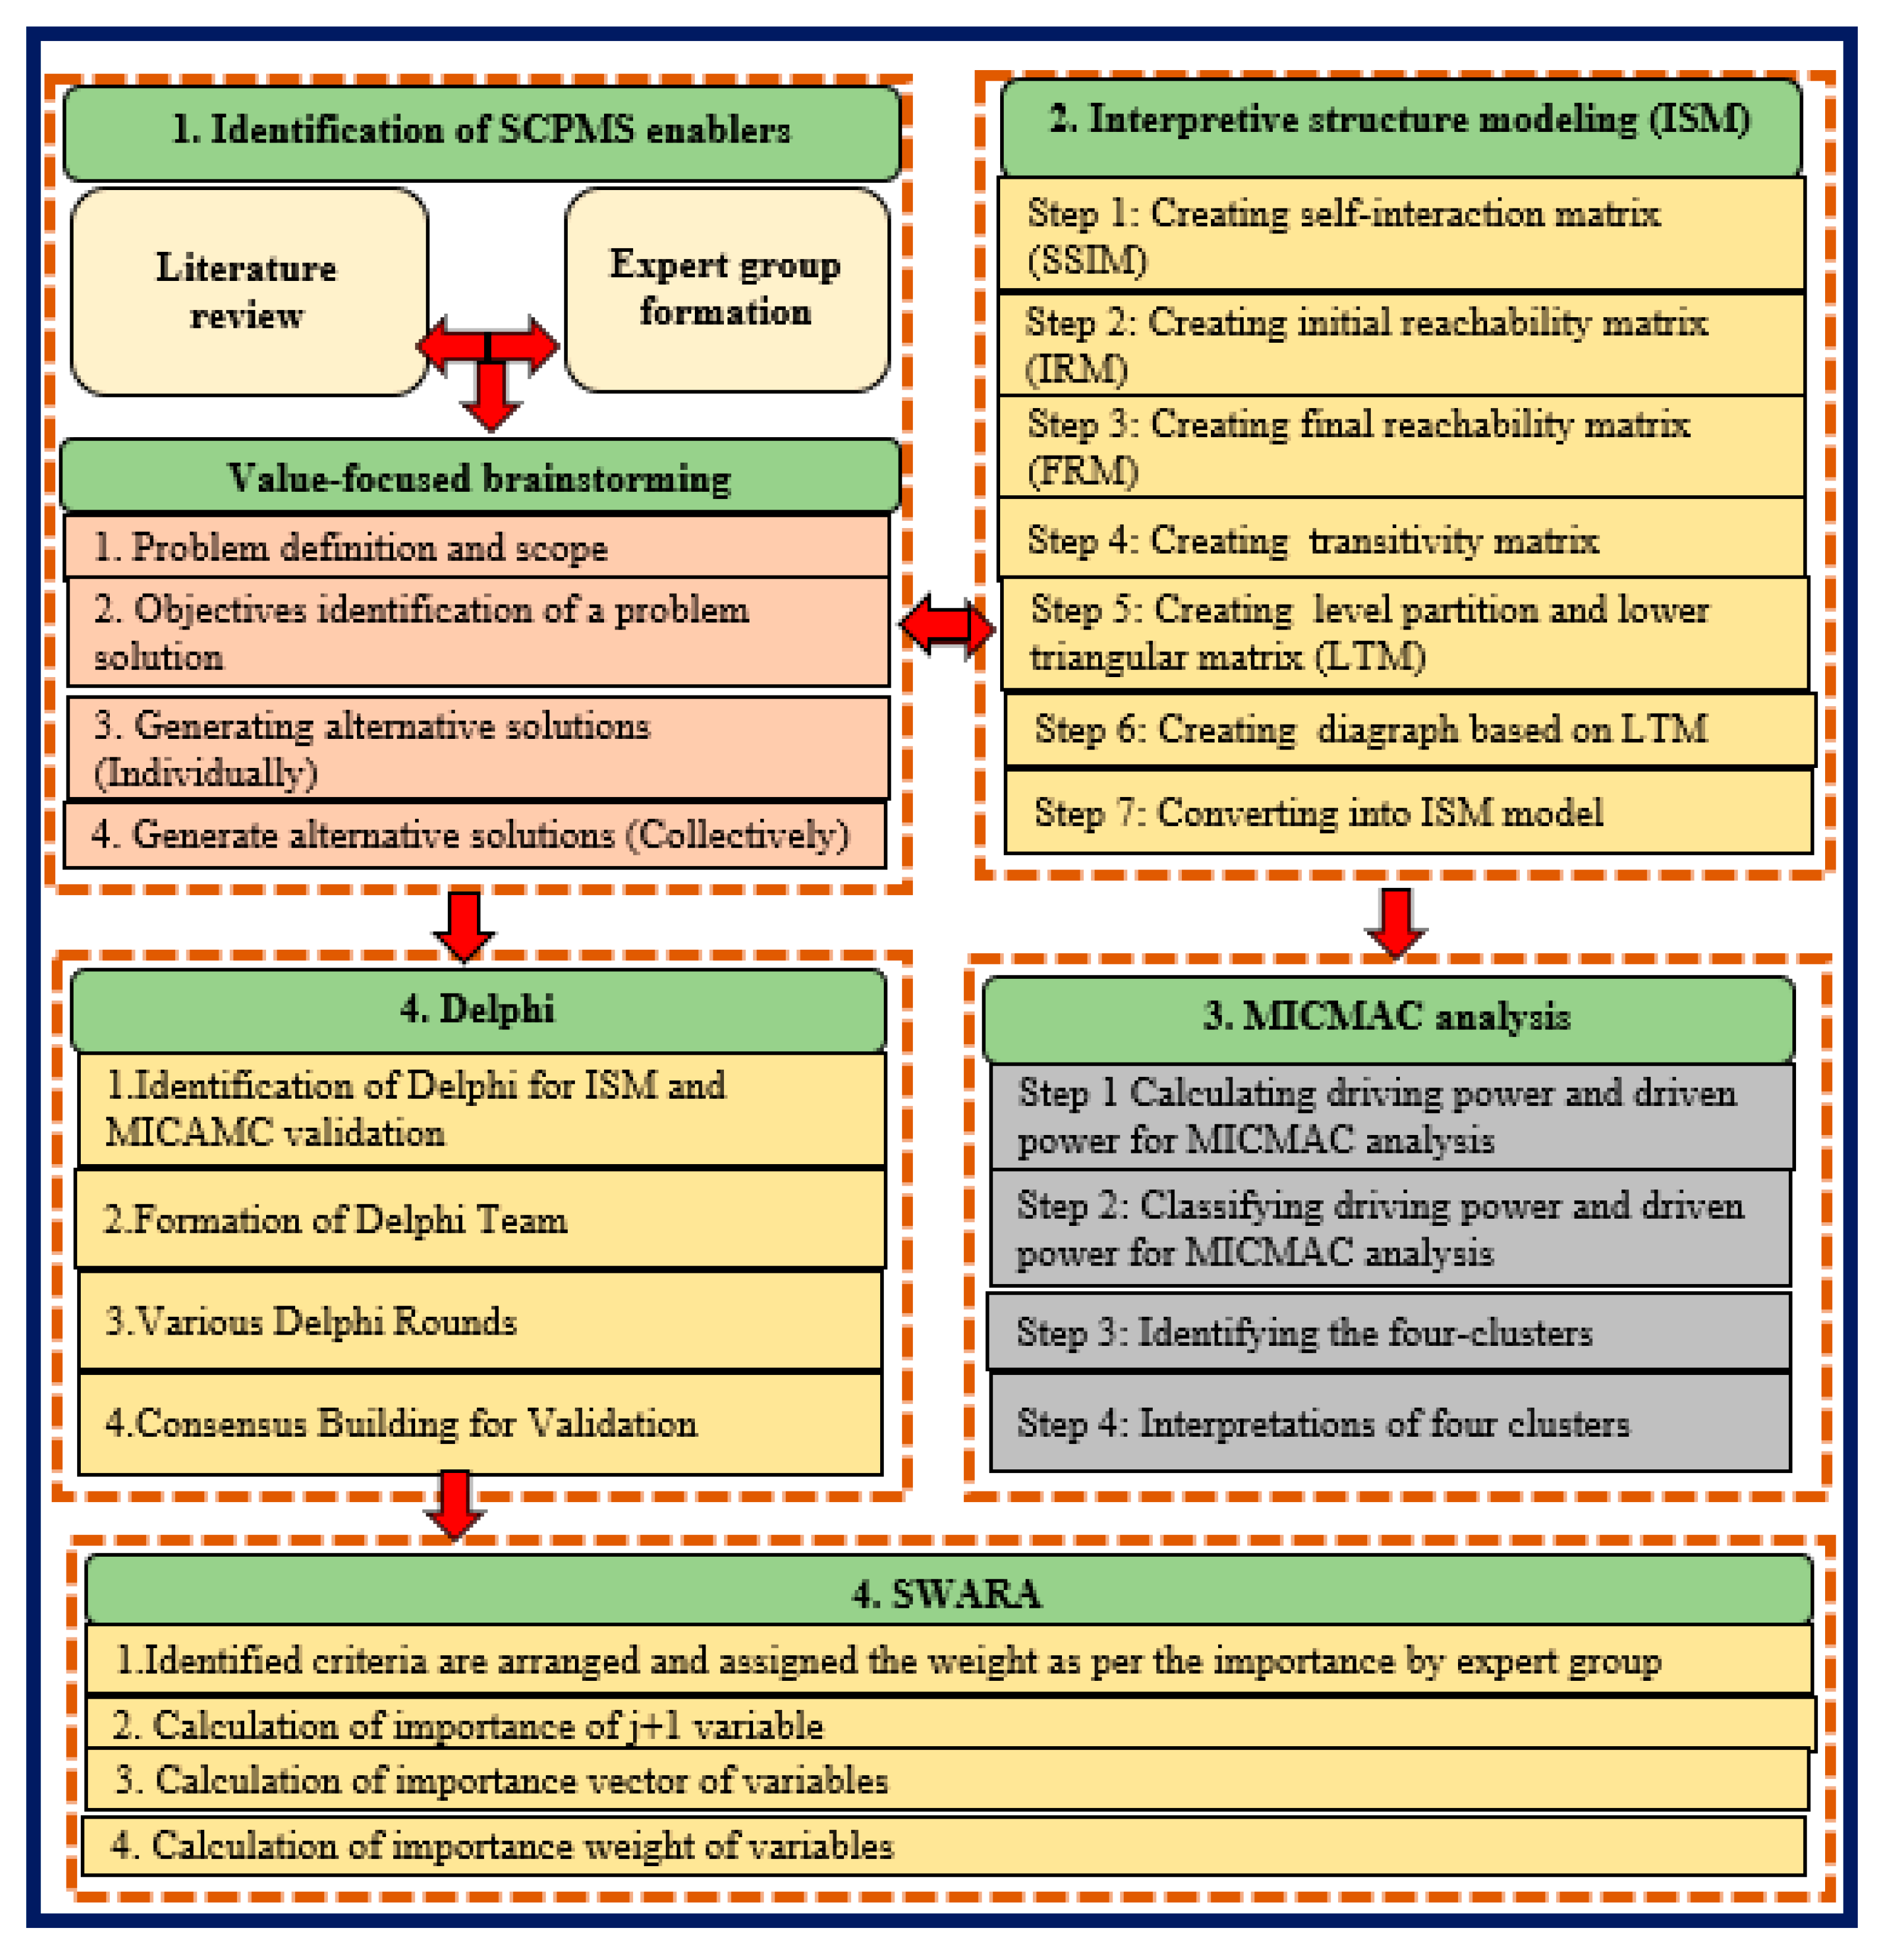
Phase 1 discusses identifying the SCPMS enablers. To find the SCPMS enablers, a thorough examination of the literature was conducted. The most relevant SCPMS enablers can be chosen from the databases of scientific research using a thorough literature analysis and the use of precise keywords. Utilizing further phases of segregation, shortlisting, and grouping, it is possible to further filter the literature on SCPMS enablers gathered through such a procedure. The significance and degree of applicability of the identified SCPMS enablers to the case problem determines their inclusion or exclusion. Using feedback from an expert group and either traditional brainstorming or value-focused brainstorming techniques, the key SCPMS enablers can be selected. When faced with difficult choices, value-focused brainstorming may be used to generate better possibilities for solutions [54,55]. There are four steps in the value-focused brainstorming procedure, as depicted in Figure 1.
Phase 2 focuses on ISM and MICMAC-based modeling. Contextual relationship modeling may be created employing the ISM methodology. A variety of matrices, including the reachability, conical, digraph, and ISM mode matrices, as well as the self-structural self-interaction (SSIM) matrix, can be created by following well-organized techniques. The numerous stages shown in Figure 1 are carried out. Calculating the driven and driving powers can lead to MICMAC analysis using the systematic steps defined in Figure 1. The contractual connection is taken into account while developing SSIM to examine the interaction between the two SCPMS enablers (k and q).To represent relationships, ‘V’ is used when SCPMS enabler k is directed toward SCPMS enabler q, ‘A’ is used in a reverse way, ‘X’ is employed when SCPMS enabler k and SCPMS enabler q assist one another, and ‘O’ is utilized when SCPMS enabler k and SCPMS enabler q do not influence each other. SSIM is produced by applying the ISM methodological steps to a contextual connection among SCPMS enablers. The SCPMS enablers identified by the expert group have a contextual link with the SSIM. The initial reachability matrix (IRM) is converted into a binary matrix of SSIM to have 1 and 0. The rules can be used to swap out various symbols such as ‘V’, ‘A’, ‘X’, and ‘O’. If the SSIM’s (k, q) entry is ‘V’, the reachability matrix’s (k, q) becomes 1, and the (q, k) becomes 0. If the SSIM’s (k, q) entry is ‘A’, the reachability matrix’s (k, q) becomes 0, and the (q, k) becomes 1. If the SSIM’s (k, q) entry is ‘X’, the reachability matrix’s (k, q) entry becomes 1, and the (q, k) becomes 1. If the SSIM’s (k, q) entry is ‘O’, the reachability matrix’s (k, q) entry becomes 0, and the (q, k) entry becomes 0.
SSIM should be used to create a reachability matrix so that the current transitivity can be preserved. By using binary numbers, the SSIM matrix can be changed into a reachability matrix. The rule of SCPMS enablers can be used to investigate transitivity; if k > q and q > n, then k > n, wherein ‘>’ gives priority or influence. The final reachability matrix (FRM) may be used to extract the reachability element and antecedent element for each SCPMS enabler. It consists of both primary SCPMS enablers and additional supporting SCPMS enablers. The SCPMS enablers that have an impact on the antecedent components include both their elements and others. By employing the intersection, the different components of the iterative process can be found. The highest level is assigned, and the SCPMS enabler is dropped from the iterative process when the intersection satisfies these requirements. With this method, the categorization is determined from the highest level to the lowest level. The structural model may be created using the FRM. The above-mentioned method of removing transitivity can then be used to realize a digraph. To obtain the digraph that can serve as the representative for the relationship modeling, the lower triangular matrix (LTM) may be employed. The produced digraph offers a directed graph that clarifies the function of each SCPMS enabler.
Each SCPMS enabler is shown graphically via MICMAC analysis. This provides a great chance to determine how important each SCPMS enabler is on a comparative basis. The SCPMS enablers could be divided into four groups with the aid of MICMAC analysis. The categories were affected by the impact and dependence power of the SCPMS enabler. Therefore, four categories—autonomous, dependent, linkage, and independent—were created. The categories produced by the MICMAC analysis can alternatively be referred to as clusters I through IV.
Phase 3 seeks to validate the results of the ISM and MICMAC. The Delphi technique is a well-known method for determining a shared opinion among subject matter experts to provide a solution to a research topic. It is a technique for getting a group opinion from people on subjects where there is little to no conclusive opinion and where the opinion of an expert matters [56]. Since the Delphi approach and the nominal group technique (NGT) are similar, the technique entails the panel sharing their experience. Depending on the size and intricacy of the challenge, panels can be expanded beyond the standard size of four.
In Phase 4, utilizing SWARA, the detected SCPM variables can be ordered by importance. The procedural steps of SWARA are described in Figure 1.
4. Results
The outcomes of each step are determined and recorded in this section.
4.1. Phase 1
Phase 1 was useful in identifying SCPMS enablers. The various enablers of SCPMs were collected using various keywords such as ‘supply chain performance system enablers’, ‘supply chain performance system criteria’, ‘supply chain performance’, and ‘supply chain 4.0 drivers’ from various databases of ScienceDirect, Web of Science, and Scopus. To meet the requirements of supply chain 4.0, additional filters were applied to the identified research papers of SCPMS enablers. Thus, the 14 most important SCPMS enablers were found, and, based on their significance, degree of application to the case issue, and impact on other SCPMSs, the SCPMS enablers were chosen. A decision-making group with 30 experts, involving three SC executives each from the food industry, tin can manufacturer, paper industry, electrical switchgear manufacturing industry, and automobile industry, along with 15 faculty members from marketing, business management, human resources management, financial management, operations management, and information technology, was invited. In their respective fields, each expert had more than 5 years of professional experience. Working professionals from the management and engineering fields had at minimum a graduate degree, while academic experts had PhDs in their areas of expertise. A brief group discussion was called to discuss the present study’s objectives. After a quick group meeting, all the experts freely agreed to take part. All participants agreed to take part in the study. The formation of such an expert group was in line with earlier research having problem similarity and a solution approach [57,58]. The expert group was given access to the relevant literature on SCPMS enablers. The study’s goals and potential research approaches were also covered in the briefing. For discovering SCPMS enablers, many techniques such as ‘identifying by literature study’, ‘assessment by experts’, or ‘brainstorming’ were suggested. It was further decided to involve the identified expert group in applying the value-focused brainstorming technique to narrow down the SCPMS enablers [59].
When selecting the SCPMS enablers, the brainstorming method plays a crucial role [57]. Therefore, value-focused brainstorming was utilized in the current study to decide how to apply SCPMS enablers. Over 15 days, two value-focused brainstorming sessions were held. The first session served as an introduction to the mock round, which was performed following the ‘dos’ and ‘do nots’ for fostering creativity and avoiding criticism. After the second session, the 16 SCPMS enablers were reduced to 14, depending on their applicability.
The 14 SCPMS enablers are discussed in the current study to determine their relevance. Three SCPMS enablers— ‘overcoming mistrust’, ‘funds for PMS implementation’, and ‘proactive management’—were found to be redundant and, hence, dropped. As a result, 14 SCPMS enablers were identified by the current study after consultation with the expert group. Table 2 outlines the 14 SCPMS enablers found in the SCPMS-based literature.
4.2. Phase 2
The ISM and MICMAC processes were well defined in the previous section and are available in the literature. The ISM and MICMAC steps are systematically followed to derive a series of matrices. The fundamental matrix (i.e., SSIM) is formed using expert feedback. The contextual relationship among the variables plays a significant role in ISM and MICMAC. The SSIM is often created utilizing input from a group of experts. In terms of standard rules, the contextual link between SCPMS enablers is expressed. The different standard rules used in expressing contextual relationships are discussed in the research methodology. One such relationship may be interpreted; for example, E1 ‘leagility’, was compared with E7 ‘C 4.0 performance measurement awareness’ to derive the contextual relationship. It was found that EI is influenced by E7; hence, the contextual relationship shows ‘A’ which indicates that E1 is influenced by E7. Similarly, all the contextual relationships were transformed using ‘V’, ‘A’,’ X’, and ‘O’ to form the SSIM according to Table 3.
It is possible to convert SSIM into an initial reachability matrix (IRM). By substituting binary digits for the conventional code and following the guidelines outlined in the previous section, IRM may be produced. The transformed matrix using 0 and 1 is displayed in Table 4.
Following the transitivity principles, the IRM was transformed into the final reachability matrix (FRM), which is displayed in Table 5. Additionally, it illustrates the driving and reliant forces produced by adding the total of the SCPM enablers both vertically and horizontally. The reachability set and antecedent set are described in Table 6. Additionally, the intersection is completed to reach the level.
According to the data, the SCPM enabler ‘customization for sustainability (E7)’ was discovered to occur at level I. Additionally, it occupied the top spot in the ISM. Similarly, repeated iteration would result in different levels. Table 6 displays the outcomes of the initial iteration.
Various iterations were followed, finally arriving at iterations II–VIII. Table 7 covers all the iterations formed in such a way. An LTM may be consulted using the systematic order. Such a matrix can help in building the structural model.
All SCPM enablers were rearranged in the LTM. The method derived the matrix shown in Table 8. The LTM is displayed based on the level divisions. The table also displays driving power (DP).
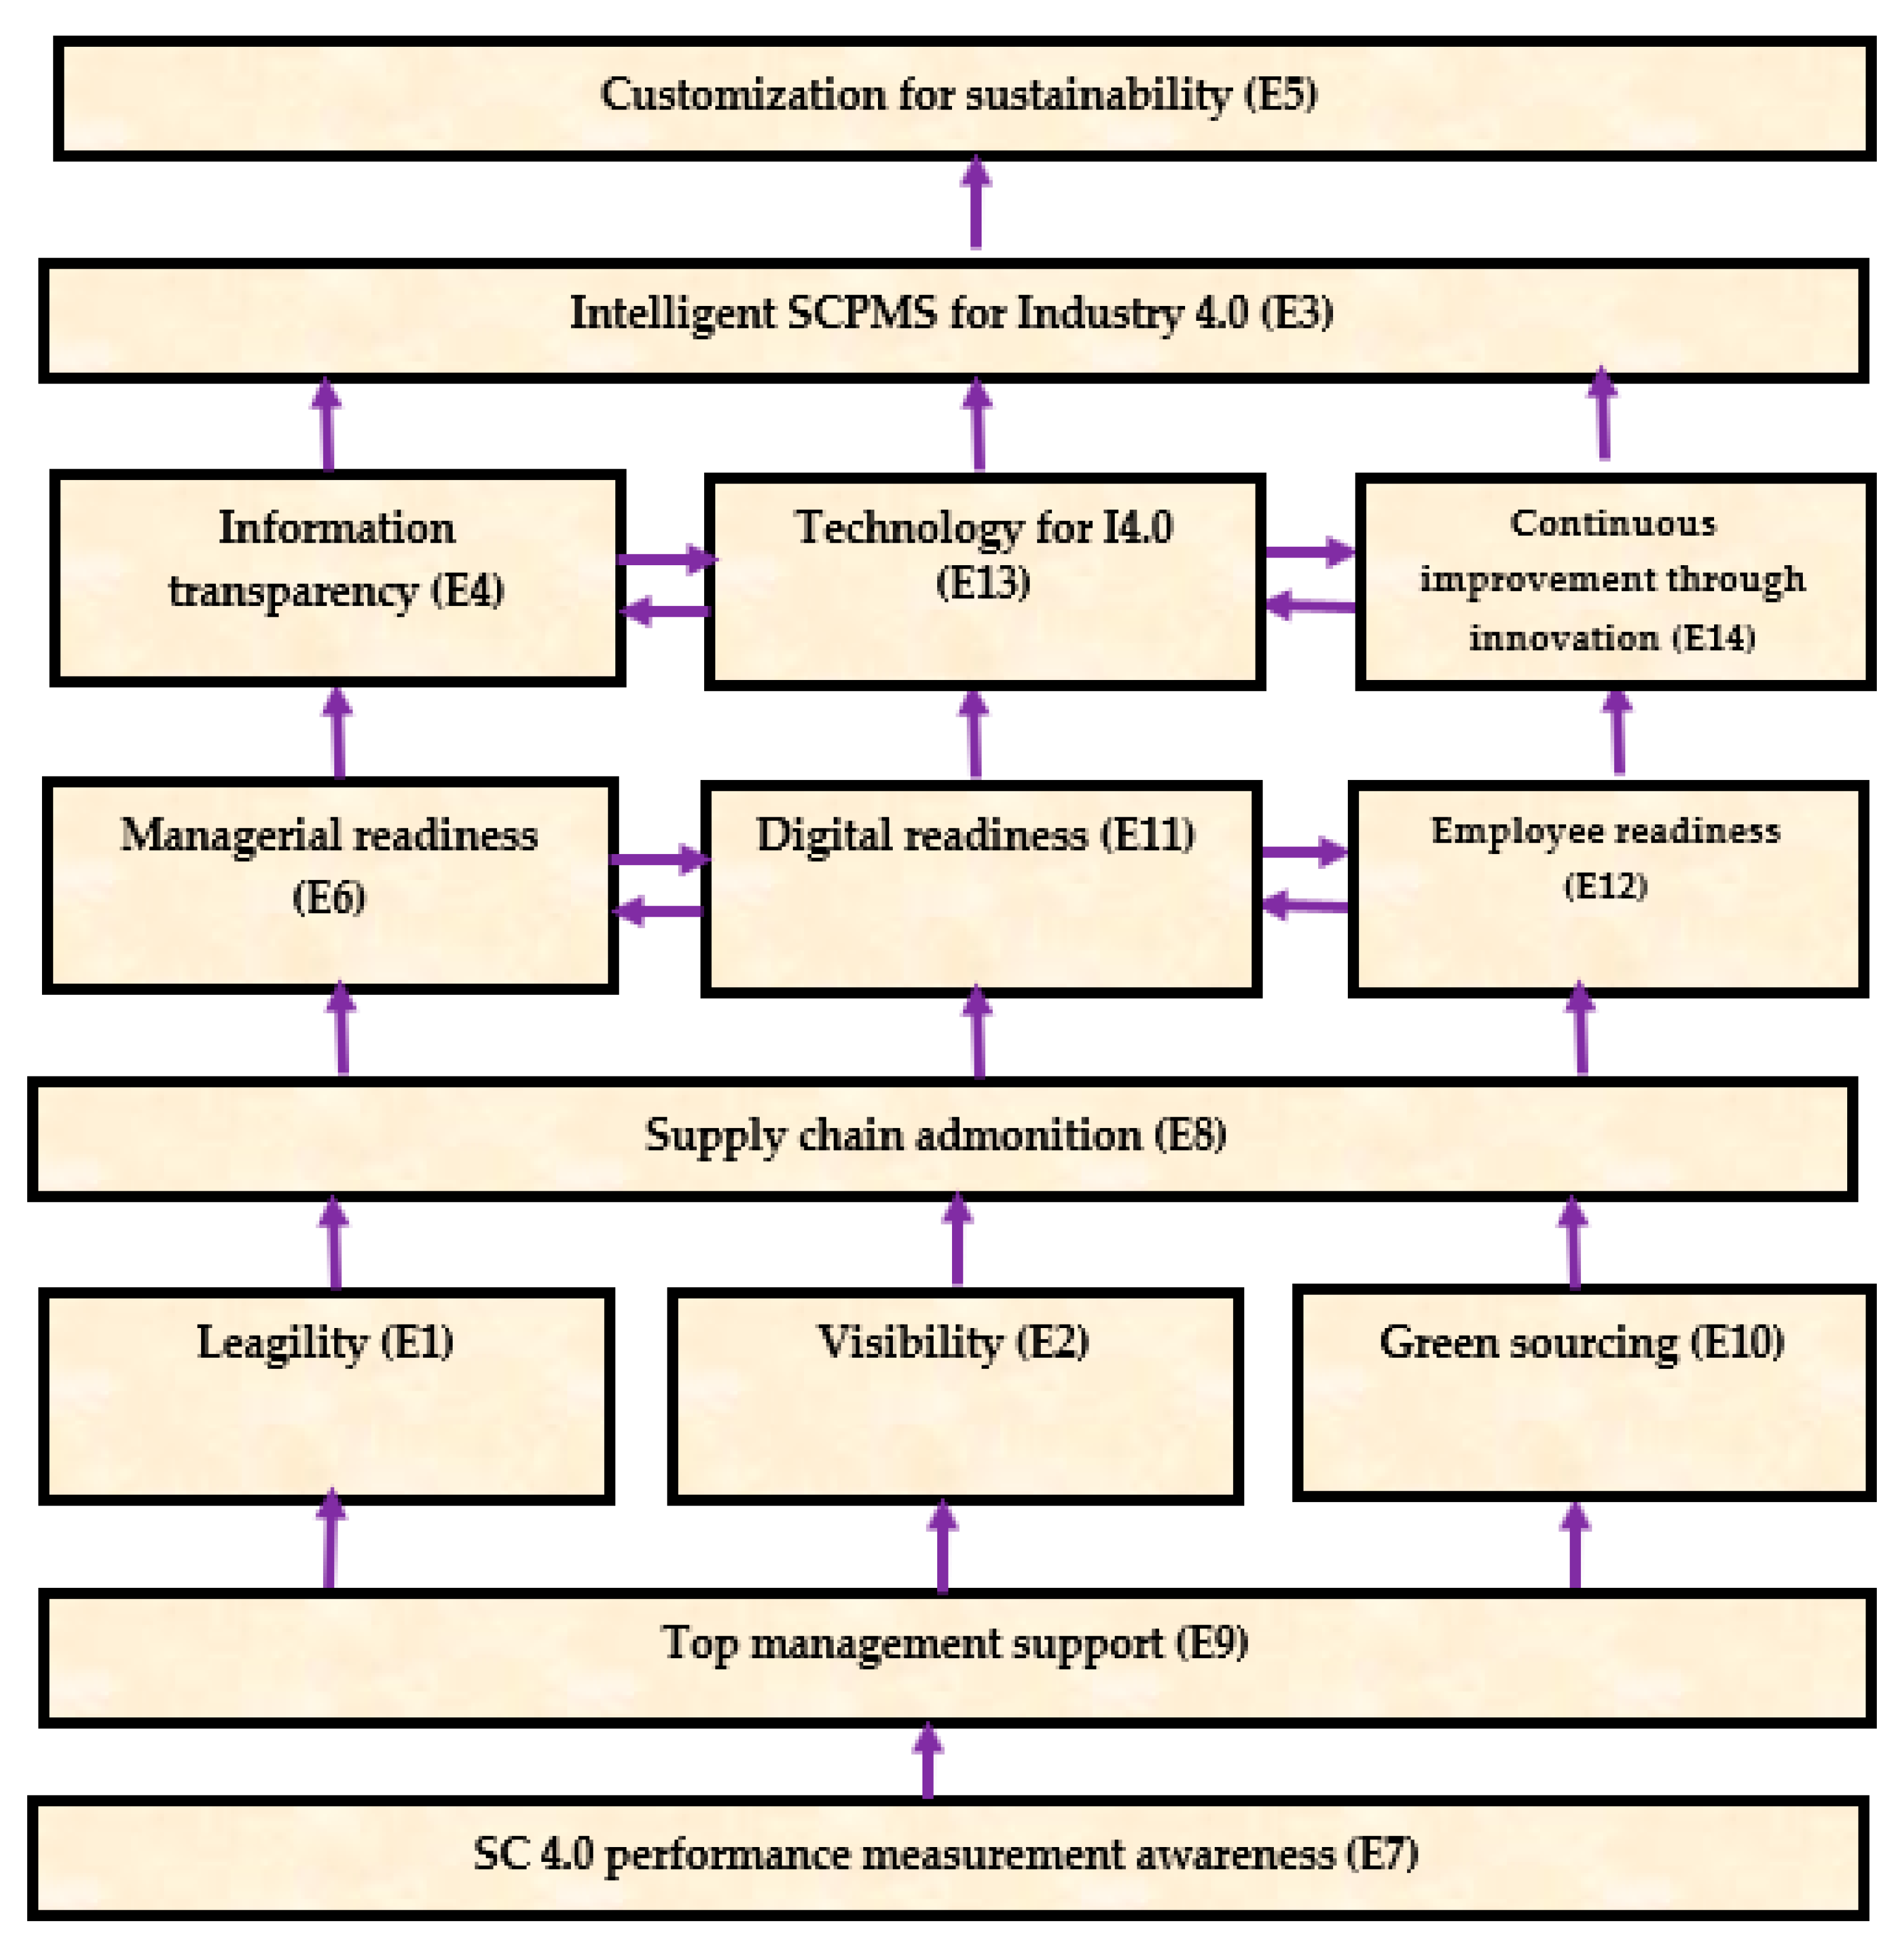
All the SCPM enablers were rearranged following the systematic order according to the various level partitions to form the ISM model. Thus, all 14 SCPMS enablers were connected as per their contextual relationship. Figure 2 depicts the ISM model after it was created.
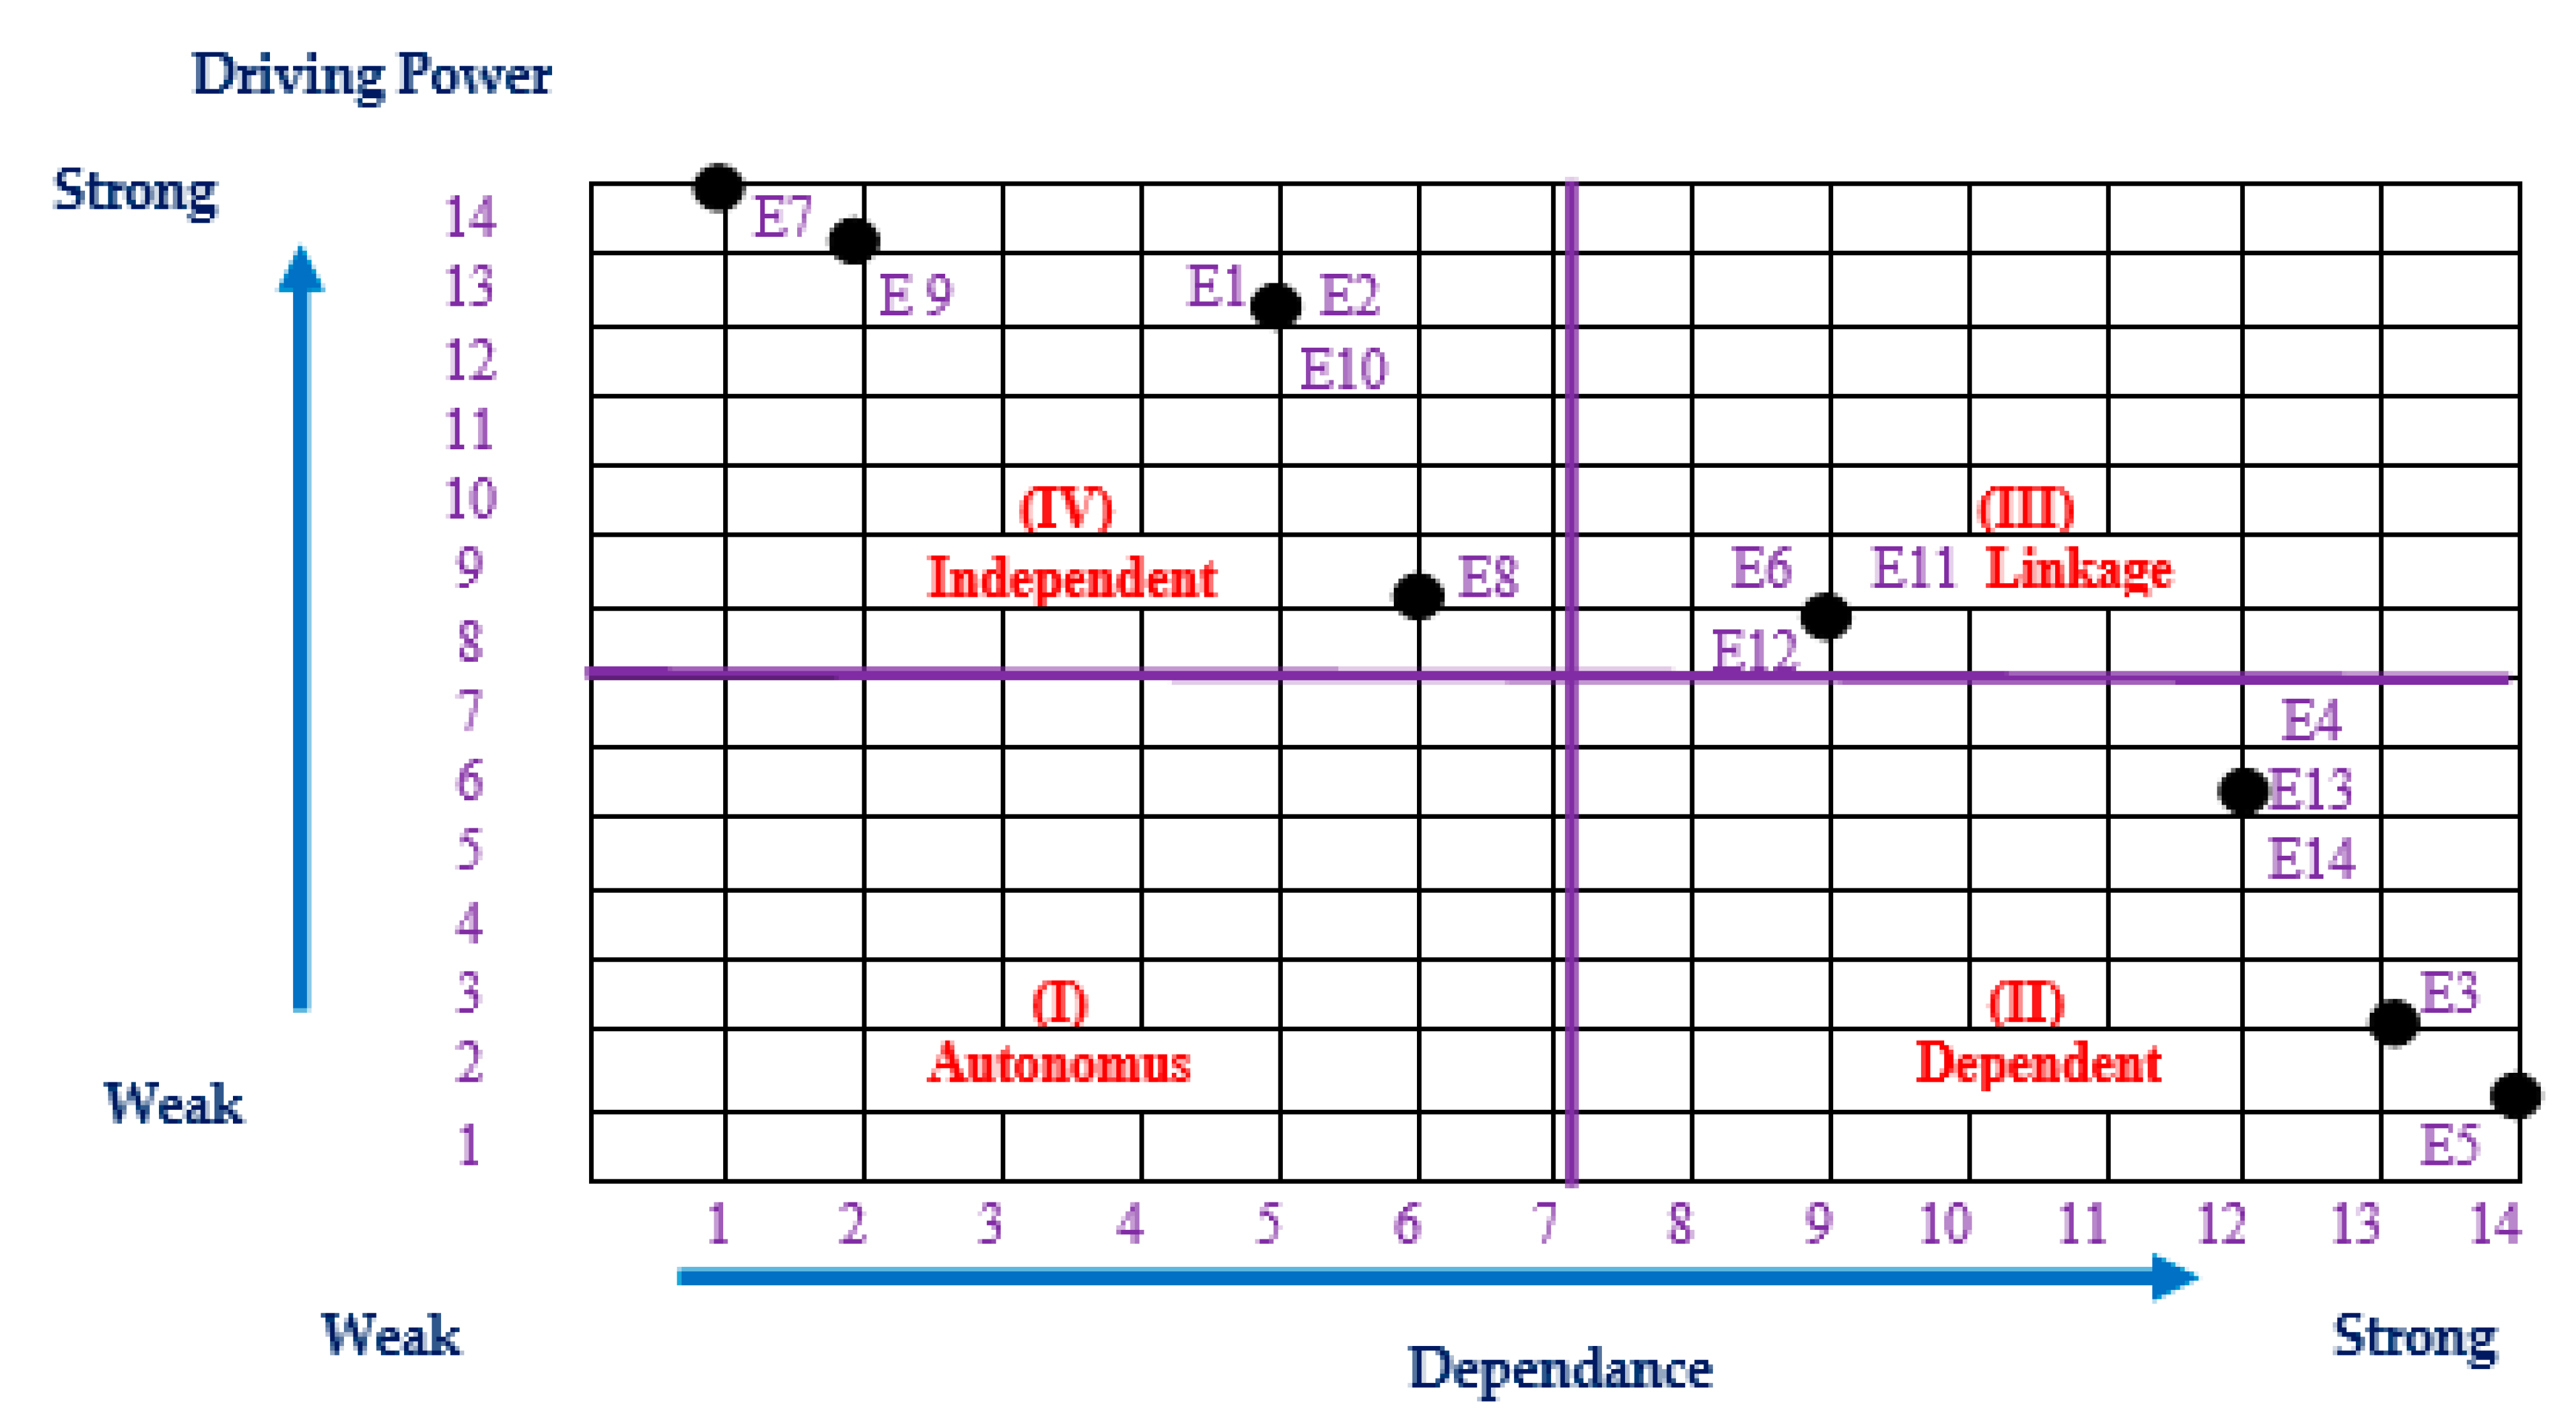
The MICMAC diagram may be created using the driving power and reliance of each of the 14 SCPM enablers. Each SCPM enabler is categorized into four groups depending on its driving power and dependence. Groups I to IV are termed MICMAC clusters. Thus, all SCPM enablers are classified into appropriate groups as shown in Figure 3. For example, ‘waste minimization (E3)’ takes the position of a dependent enabler, whereas ‘SC 4.0 performance measurement awareness (E7)’ is an independent enabler. Similarly, ‘managerial readiness (E6)’ falls in the linkage enabler group.
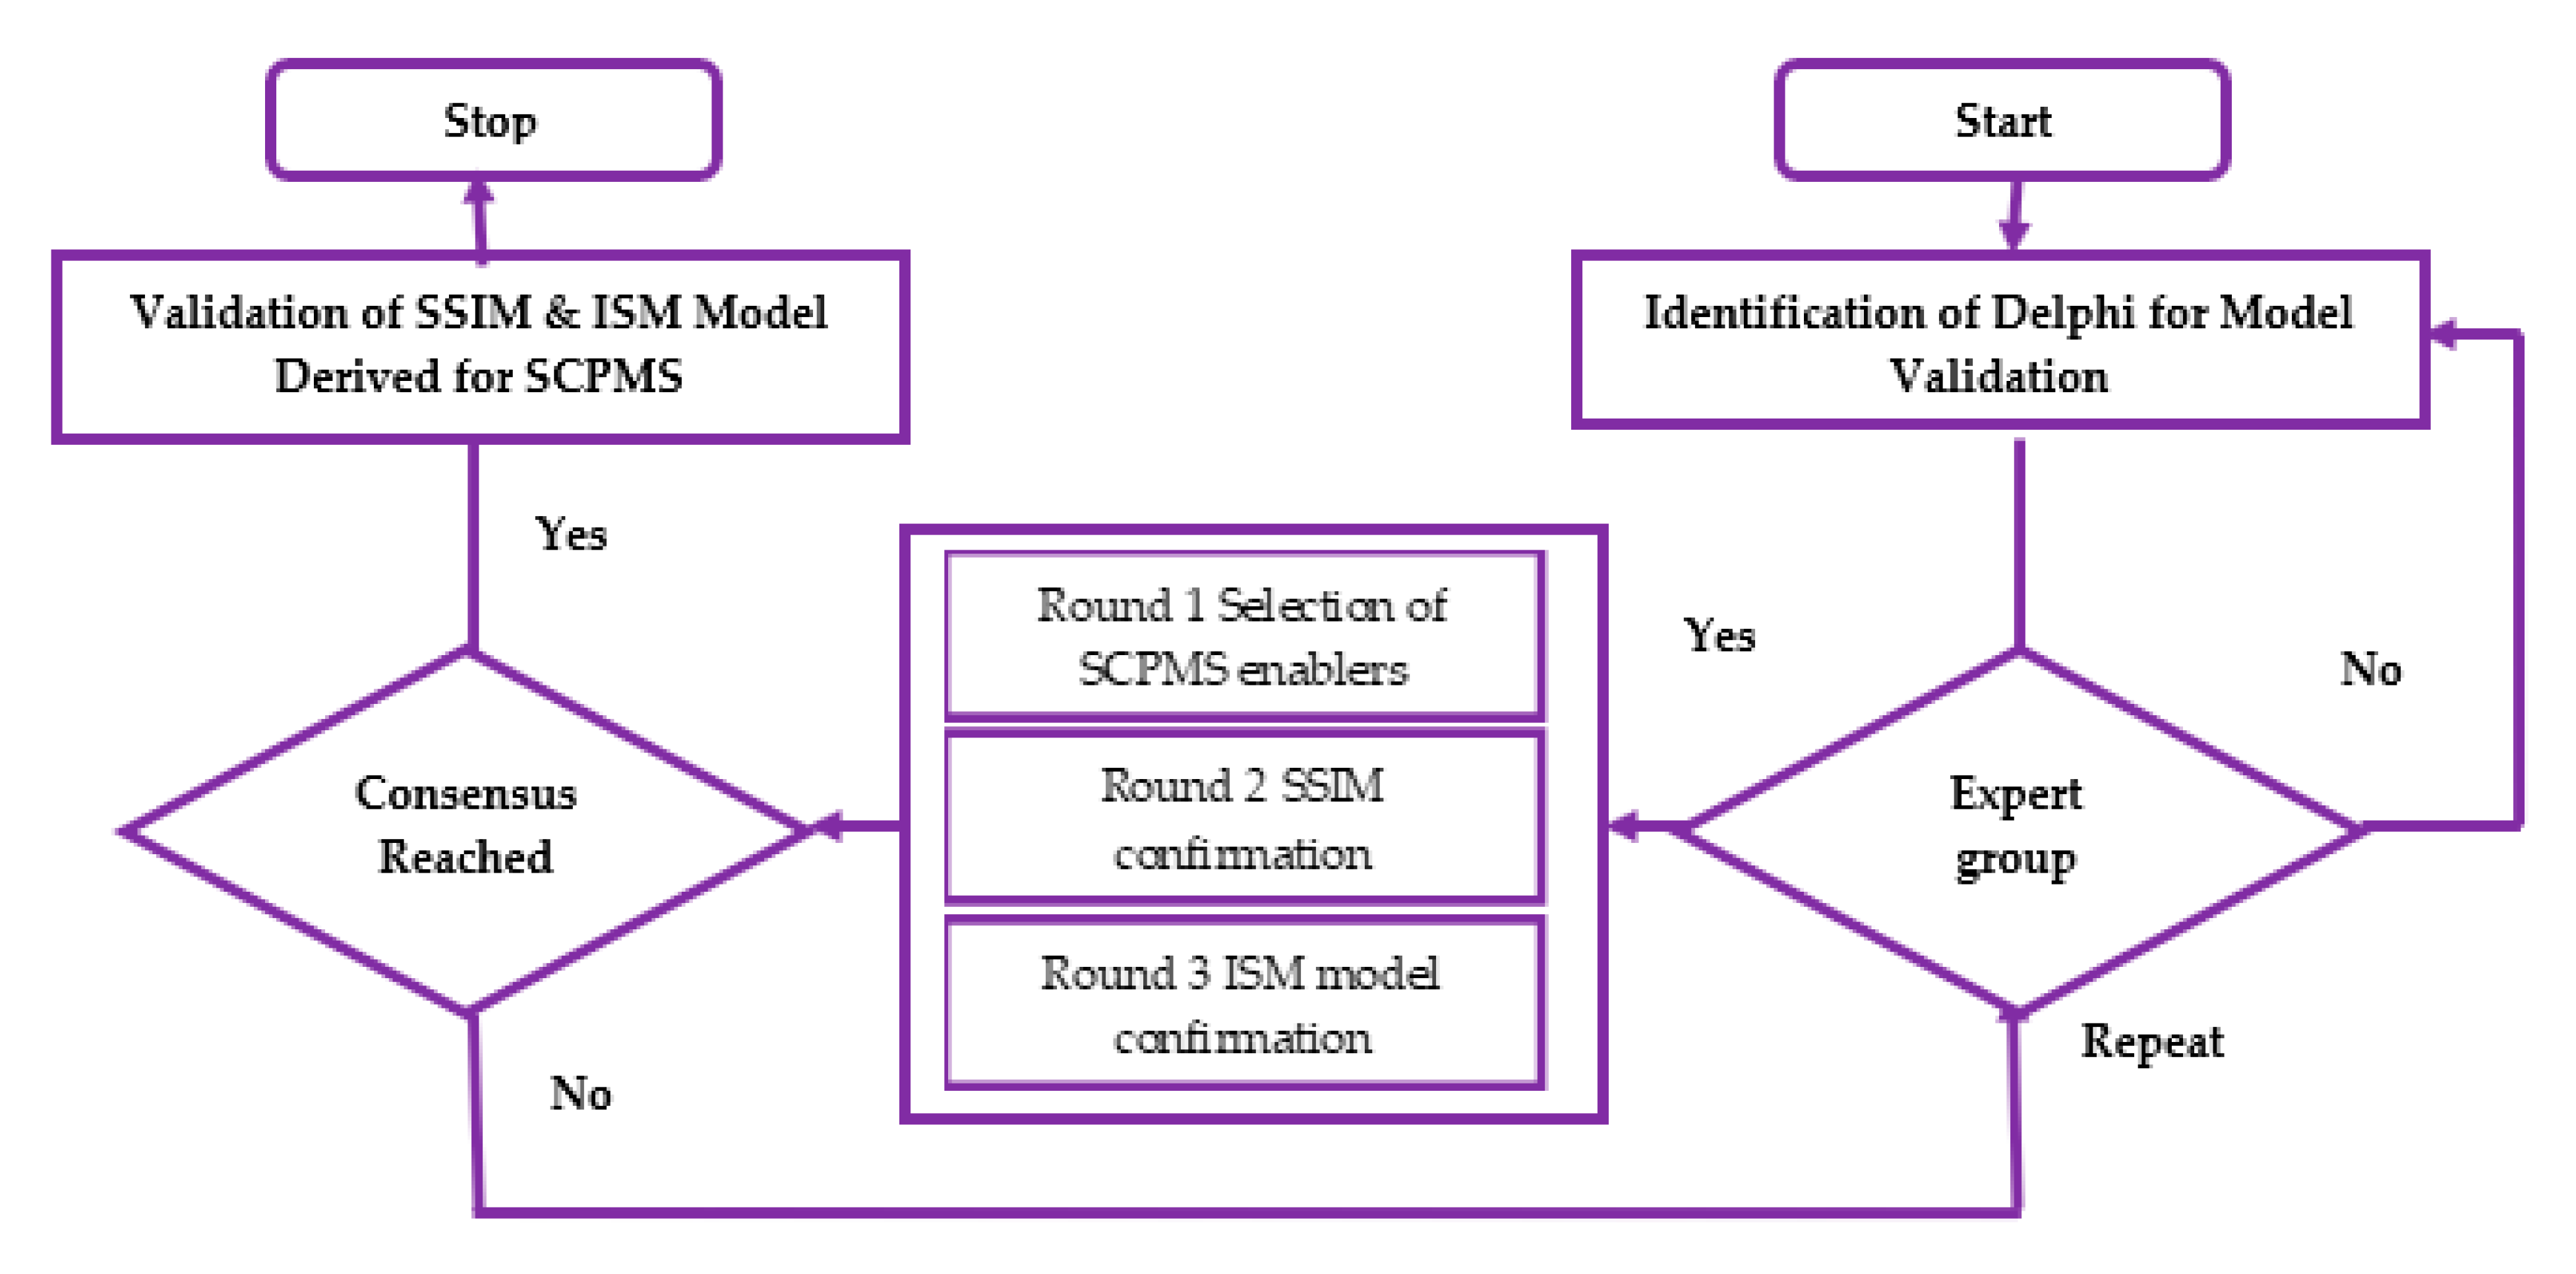
The accuracy of the developed ISM model needed to be verified; hence, the current study used systematic validation. As discussed in the research methodology, the expert group opinion was translated into FRM and sent to Delphi for validation. The Delphi method shown in Figure 4 was used. In addition to the expert group, three Delphi members (industry specialists in SCM) were contacted. The Delphi members had a graduate degree in engineering with SCM; moreover, they had more than 5 years of experience. They accepted the invitations and agreed to participate anonymously. Three rounds of the Delphi technique were carried out. During the first round of Delphi, members were approached to confirm the SCPM enablers. In the second round, Delphi members validated the contextual relationship matrix. Lastly, during the third round, Delphi members validated the ISM and MICMAC results.
The SCPMS variables were again subjected to opinions from the same group of DMs engaged in ISM contextual relationships. Table 9 provides the percentage opinion and calculates a ranking of SCPM enablers.
The Sj values derived from the DM opinions are tabulated in Table 10. On the basis of the Sj, the Kj values could be calculated. The Kj of the SCPMS enabler E9 was considered as 1; then, further considering the term of 1 + Sj, the values of the remaining SCPMS enablers were calculated. The calculated values are shown in Table 11.
Considering the importance of SCPMS enabler E9 as 1, the importance of the remaining SCPMS enablers was calculated. Considering, qj = 1 and K2 = 1.10, the values of q2 = 1/1.1 = 0.91 and similarly q3 = 0.91/1.03 = 0.88 were calculated. All values of qj are given in Table 11. The weight could further be calculated as , W1 = 1/10.32 = 0.10. Table 11 shows the values of qj and Wj for all SCPMS enablers.
5. Discussion
The competition among the industries can be witnessed through the SC. A more robust SC indicates that the firm acquires more competitive advantages. The SC benefits are found through an increase in market share, demand growth, customer delivery targets achieved without delay, increased customer satisfaction, sales growth, increase in effective demand management, reliable and effective logics compliance, etc. The SCPMS helps in accomplishing many more benefits once it is correctly deployed in the company. Some traditional SCPMSs based on various approaches such as MCDM, SCORE, BSC, and fuzzy logic need to be revisited to enhance their effectiveness and make them compatible with upcoming supply chain 4.0 to meet the I4.0 target.
In I4.0, radical changes have been witnessed among various sections of SC 4.0. The scope of each player in the SC has been increased. Transparency, agility, and flexibility have changed the approach to the production management system. Production processes are shifting toward automatic control systems depending on Wi-Fi-related technologies. In such a situation, the traditional SCPMS will not be able to gauge the SC 4.0 effectively and efficiently. Hence, there is a need for intelligent SC 4.0 to cope with the radical changes in technology and production systems. To meet the first research objective of identifying the SCPM enablers, the present research deployed a systematic literature review to reveal the SCPMS enablers. Later, the most appropriate enablers were identified using feedback from the expert group. The identified enablers were ‘leagility’, ‘visibility’, ‘intelligent SCPMS for Industry 4.0′, ‘information transparency’, ‘customization for sustainability, managerial readiness, SC 4.0 performance measurement awareness, supply chain admonition’, ‘top management support green sourcing’, ‘digital readiness’, ‘employee readiness’, ‘technology for I4.0′, and ‘continuous improvement through innovation’.
The second objective was to reveal the relationship of SCPMS enablers through the ISM model. The ISM-based relationship revealed that ‘SC 4.0 performance measurement awareness (E7)’ and ‘top management support (E9)’ are the basic requirements for SCPMS to evolve. Hence, top management must conduct SC 4.0 performance-related programs for their employees. The top enablers were ‘intelligent SCPMS for Industry 4.0 (E3)’ and ‘customization for sustainability (E5)’. Thus, the second objective was accomplished using ISM and MICMAC methodology. A systematic standard procedure for deriving the ISM model was followed through expert group opinion. The Delphi method was used to validate the resulting ISM. The present research reveals the contextual relationship for each enabler to be understood well by practicing SCM managers.
The third objective was to reveal the classification of SCPMS enablers. This objective was accomplished by applying MICMAC analysis. Based on the contextual relationships, each SCPMS enabler was evaluated, and its driving power and dependence were established for their classification. The results of MICMAC analysis revealed three classifications of independent, dependent, and linkage enablers. The independent enablers found were ‘leagility (E1)’, ‘visibility (E2)’, ‘SC 4.0 performance measurement awareness (E7′), ‘supply chain admonition (E8)’,’green sourcing (E10)’, and ‘top management support (E9)’; the dependent enablers found were intelligent SCPMS for Industry 4.0 (E3), ‘information transparency (E4)’, ‘customization for sustainability (E5)’, ‘technology for I4.0,(E13)’, and ‘continuous improvement through innovation (E14)’; the linkage enablers revealed were ‘managerial readiness (E6)’,’digital readiness (E11)’, and ‘employee readiness (E12)’. Thus, SCPMS enablers can be evaluated before their implementation, while enacting SCPMS can be beneficial to industries. Practicing managers can apply ISM and visualize the influence of each SCPMS enabler over the other. SCPMS enablers may affect each other or may be influenced by another guiding SCPMS enabler, thus control depending on SCPMS enablers needs attention. Controlling SCPMS enablers is only possible by understanding their influence. As a result, resource allocation and optimization can become a simple process. The digraph revealed that ‘management readiness’, ‘digital readiness’, and ‘employee readiness’ play a significant role in SCPMS. The results are consistent with earlier studies asserting the importance of each in supply chain 4.0 for I4.0 [6].
In the case of intelligent SCPMS, the process integration capability is enhanced through integrating information flow, financial flow, and physical flow of goods to enhance the firm performance. Such intelligent SCPMS can enhance revenue, customer relationship, and operational excellence by understanding firm size and consumer demand predictability [69,70]. The IoT, cloud computing, and big data analytics provide speed, agility, and flexibility in intelligent SCPMS for dynamic decision making [6].
SCPMS enablers were further divided into four clusters of dependent, independent, autonomous, and linked categories using MICMAC analysis. It was possible to look at each SCPMS enabler using MICMAC analysis. On reviewing the MICMAC analysis of the SCPMS enablers, it was found that there is no enabler classified in the autonomous group.
The results of this investigation showed the stability of the SCPMS enablers. There was no SCPMS enabler in the autonomous group. Offering preventative measures before the implementation of an SCPMS can further assist practicing managers. Analyzing the independent SCPMS enablers, managers may take proactive control actions through knowledge creation, infrastructure planning, and technology development to accommodate new Wi-Fi-enabled technologies such as IoT, RFID, cloud computing, and resource allocation, which may be planned.
According to the SWARA results, ‘top management support (E9)’, ‘SC 4.0 performance measurement awareness (E7)’, ‘managerial readiness (E6)’, ‘employee readiness (E12)’, ‘technology for I4.0 (E13)’, ‘digital readiness (E11)’, and ‘continuous improvement through innovation (E14)’ had a higher weight and constituted the top half of the ranking. On the other hand, ‘intelligent SCPMS for industry 4.0 (E3)’, ‘information transparency (E4)’, ‘customization for sustainability (E5)’, ‘green sourcing (E10)’, ‘visibility (E12)’, ‘leagility (E1)’, and ‘supply chain admonition (E8)’ had a comparatively lower weight.
6. Research Limitations and Future Research Directions
This research considered 14 SCPMS enablers for evaluation and ranking using the ISM, MICMAC, and SWARA approaches. The ISM and MICMAC approaches attract increased computational effort with the increase in enablers. This process may become tedious and time-consuming when deriving the actual relationships and their respective levels in a diagraph. ISM and MICMAC are based on expert judgments; hence, the chances of judgmental bias being present in the decision-making process are high. To remove the judgmental bias, a fuzzy-based approach such as fuzzy MICMAC or Fuzzy SWARA can be used. Future research may also consider additional SCPMS enablers based on Logistics 4.0, Quality 4.0, Procurement 4.0, and SCM 4.0 toward I4.0. Future research may compare the various SCPMSs regarding their capability to deal with the SCM 4.0 requirements in the era of a cyber-physical system.
7. Conclusions
The paper investigated SCPMS enablers using ISM and MICMAC. This application enabled quantifying the relationship among the SCPMS enablers. The application of MICMAC provided a classification of such enablers into four groups. The combinatorial approach of these methodologies can help the SC in evaluating and investigating enablers before SCPMS implementations. The modeling of enabler relationships can provide driving power and dependence, thus helping managers plan the course of action in controlling such enablers. This will also ease the process of formulating strategic action and further decision making. The SWARA method is robust for prioritizing SCPMS enablers.
SC 4.0 is the present need of the day; hence, all manufacturing industries will be planning for ISM 4.0 and a benefit from this ISM analysis. The ISM model may be used to study many SCs involved in future research for retaining, processing, and manufacturing perishable goods, cold chains, and environmentally dependent SC for real-time action and measurement. A similar model can also be developed for customized SCs to promote readiness for I4.0. The study of ISM can be extended to empirical studies aided by structural equation modeling (SEM) to provide more clarity on the relationships. SEM can quantify the relationship to provide more clarity to practicing managers. The present ISM-based methodology is applicable in the manufacturing setup. With suitable changes, the present SCPMS can be adopted in the manufacturing setup irrespective of the firm’s size. The SCPMS should be intelligent enough to take care of the data collection, data filtering, data analytics, and feedback in terms of corrective action so that SCM is attained.
Funding
This research was funded by the Deanship of Scientific Research, King Khalid University, Kingdom of Saudi Arabia (grant number RGP.1/382/43).
Institutional Review Board Statement
The study was conducted according to the guidelines of the Declaration of Helsinki and approved by the Ethics Committee of Industrial Engineering Department, College of Engineering, King Khalid University (approval code IED/KKU/01/2023 and date of approval 15 January 2023).
Informed Consent Statement
Informed consent was obtained from all subjects involved in the study.
Data Availability Statement
Not applicable.
Acknowledgments
The author would like to express his gratitude to the Deanship of Scientific Research, King Khalid University, Kingdom of Saudi Arabia, for funding this work, as well as to family, friends, and colleagues for their constant inspiration and encouragement.
Conflicts of Interest
The author declares no conflict of interest.
References
- Yadav, S.; Garg, D.; Luthra, S. Development of IoT Based Data-Driven Agriculture Supply Chain Performance Measurement Framework. J. Enterp. Inf. Manag. 2021, 34, 292–327. [Google Scholar] [CrossRef]
- Gunasekaran, A.; Patel, C.; McGaughey, R.E. A Framework for Supply Chain Performance Measurement. Int. J. Prod. Econ. 2004, 87, 333–347. [Google Scholar] [CrossRef]
- Kurien, G.P.; Qureshi, M.N. Study of Performance Measurement Practices in Supply Chain Management. Int. J. Bus. Manag. Soc. Sci. 2011, 2, 19–34. [Google Scholar]
- Zhang, C.; Chen, Y. A Review of Research Relevant to the Emerging Industry Trends: Industry 4.0, IoT, Blockchain, and Business Analytics. J. Ind. Integr. Manag. 2020, 5, 165–180. [Google Scholar] [CrossRef]
- Da Xu, L.; Viriyasitavat, W. Application of Blockchain in Collaborative Internet-of-Things Services. IEEE Trans. Comput. Soc. Syst. 2019, 6, 1295–1305. [Google Scholar] [CrossRef]
- Xie, Y.; Yin, Y.; Xue, W.; Shi, H.; Chong, D. Intelligent Supply Chain Performance Measurement in Industry 4.0. Syst. Res. Behav. Sci. 2020, 37, 711–718. [Google Scholar] [CrossRef]
- Kagermann, H.; Wahlster, W. Ten Years of Industrie 4.0. Sci 2022, 4, 26. [Google Scholar] [CrossRef]
- Ghobakhloo, M.; Fathi, M. Corporate Survival in Industry 4.0 Era: The Enabling Role of Lean-Digitized Manufacturing. J. Manuf. Technol. Manag. 2019, 31, 1–30. [Google Scholar] [CrossRef]
- Giannakis, M.; Spanaki, K.; Dubey, R. A Cloud-Based Supply Chain Management System: Effects on Supply Chain Responsiveness. J. Enterp. Inf. Manag. 2019, 32, 585–607. [Google Scholar] [CrossRef]
- Gunasekaran, A.; Kobu, B. Performance Measures and Metrics in Logistics and Supply Chain Management: A Review of Recent Literature (1995–2004) for Research and Applications. Int. J. Prod. Res. 2007, 45, 2819–2840. [Google Scholar] [CrossRef]
- Wouters, M. A Developmental Approach to Performance Measures—Results from a Longitudinal Case Study. Eur. Manag. J. 2009, 27, 64–78. [Google Scholar] [CrossRef]
- Charan, P.; Shankar, R.; Baisya, R.K. Analysis of Interactions among the Variables of Supply Chain Performance Measurement System Implementation. Bus. Process Manag. J. 2008, 14, 512–529. [Google Scholar] [CrossRef]
- Katiyar, R.; Barua, M.K.; Meena, P.L. Analysing the Interactions Among the Barriers of Supply Chain Performance Measurement: An ISM with Fuzzy MICMAC Approach. Glob. Bus. Rev. 2018, 19, 48–68. [Google Scholar] [CrossRef]
- Azevedo, S.; Carvalho, H.; Cruz-Machado, V. Using Interpretive Structural Modelling to Identify and Rank Performance Measures. Balt. J. Manag. 2013, 8, 208–230. [Google Scholar] [CrossRef]
- Charan, P.; Shankar, R.; Baisya, R.K. Modelling the Barriers of Supply Chain Performance Measurement System Implementation in the Indian Automobile Supply Chain. Int. J. Logist. Syst. Manag. 2009, 5, 614. [Google Scholar] [CrossRef]
- Qureshi, M.R.N.M. Evaluating and Prioritizing the Enablers of Supply Chain Performance Management System (SCPMS) for Sustainability. Sustainability 2022, 14, 11296. [Google Scholar] [CrossRef]
- Qureshi, K.M.; Mewada, B.G.; Alghamdi, S.Y.; Almakayeel, N.; Mansour, M.; Qureshi, M.R.N. Exploring the Lean Implementation Barriers in Small and Medium-Sized Enterprises Using Interpretive Structure Modeling and Interpretive Ranking Process. Appl. Syst. Innov. 2022, 5, 84. [Google Scholar] [CrossRef]
- Qureshi, K.M.; Mewada, B.G.; Alghamdi, S.Y.; Almakayeel, N.; Qureshi, M.R.N.; Mansour, M. Accomplishing Sustainability in Manufacturing System for Small and Medium-Sized Enterprises (SMEs) through Lean Implementation. Sustainability 2022, 14, 9732. [Google Scholar] [CrossRef]
- Qureshi, M.N.; Kumar, D.; Kumar, P. An Integrated Model to Identify and Classify the Key Criteria and Their Role in the Assessment of 3PL Services Providers. Asia Pac. J. Mark. Logist. 2008, 20, 227–249. [Google Scholar] [CrossRef]
- Kouchaksaraei, R.H.; Zolfani, S.H.; Golabchi, M. Glasshouse locating based on SWARA-COPRAS approach. Int. J. Strateg. Prop. Manag. 2015, 19, 111–122. [Google Scholar] [CrossRef]
- Gopal, P.; Kadari, P.; Thakkar, J.J.; Mawandiya, B.K. Key Performance Factors for Integration of Industry 4.0 and Sustainable Supply Chains: A Perspective of Indian Manufacturing Industry. J. Sci. Technol. Policy Manag. 2022, ahead-of-print. [Google Scholar] [CrossRef]
- Sharma, H.; Sohani, N.; Yadav, A. Comparative Analysis of Ranking the Lean Supply Chain Enablers: An AHP, BWM and Fuzzy SWARA Based Approach. Int. J. Qual. Reliab. Manag. 2022, 39, 2252–2271. [Google Scholar] [CrossRef]
- Sillanpää, I. Empirical Study of Measuring Supply Chain Performance. Benchmarking Int. J. 2015, 22, 290–308. [Google Scholar] [CrossRef]
- Anand, N.; Grover, N. Measuring Retail Supply Chain Performance. Benchmarking Int. J. 2015, 22, 135–166. [Google Scholar] [CrossRef]
- Balfaqih, H.; Nopiah, Z.M.; Saibani, N.; Al-Nory, M.T. Review of Supply Chain Performance Measurement Systems: 1998–2015. Comput. Ind. 2016, 82, 135–150. [Google Scholar] [CrossRef]
- Ka, J.M.; Ab, N.R.; Lb, K. A Review on Supply Chain Performance Measurement Systems. Procedia Manuf. 2019, 30, 40–47. [Google Scholar] [CrossRef]
- Arzu Akyuz, G.; Erman Erkan, T. Supply Chain Performance Measurement: A Literature Review. Int. J. Prod. Res. 2010, 48, 5137–5155. [Google Scholar] [CrossRef]
- Kurien, G.; Qureshi, M.N.; Selvam, J.J.D. Supply Chain Performance Measurement Practices of Indian Industries. Int. J. Supply Chain. Manag. Vol. 2020, 9, 142. [Google Scholar]
- Susanawati; Akhmadi, H.; Fauzan, M.; Rozaki, Z. Supply Chain Efficiency of Red Chili Based on the Performance Measurement System in Yogyakarta, Indonesia. Open Agric. 2021, 6, 202–211. [Google Scholar] [CrossRef]
- Althaqafi, T. Determinants Influencing the Supply Chain Performance in Saudi Arabia. Uncertain Supply Chain Manag. 2021, 9, 187–194. [Google Scholar] [CrossRef]
- Jha, A.; Sharma, R.R.K.; Kumar, V.; Verma, P. Designing Supply Chain Performance System: A Strategic Study on Indian Manufacturing Sector. Supply Chain Manag. Int. J. 2022, 27, 66–88. [Google Scholar] [CrossRef]
- Bulsara, H.P.; Qureshi, M.N.; Patel, H. Supply Chain Performance Measurement—An Exploratory Study. Int. J. Logist. Syst. Manag. 2014, 18, 231. [Google Scholar] [CrossRef]
- Bulsara, H.P.; Qureshi, M.N.; Patel, H. Green Supply Chain Performance Measurement: An Exploratory Study. Int. J. Logist. Syst. Manag. 2016, 23, 476. [Google Scholar] [CrossRef]
- Nazari-Ghanbarloo, V. A Dynamic Performance Measurement System for Supply Chain Management. Int. J. Product. Perform. Manag. 2022, 71, 576–597. [Google Scholar] [CrossRef]
- Kurien, G.P.; Qureshi, M. Performance Measurement Systems for Green Supply Chains Using Modified Balanced Score Card and Analytical Hierarchical Process. Sci. Res. Essays 2012, 7, 3149–3161. [Google Scholar] [CrossRef]
- Sufiyan, M.; Haleem, A.; Khan, S.; Khan, M.I. Evaluating Food Supply Chain Performance Using Hybrid Fuzzy MCDM Technique. Sustain. Prod. Consum. 2019, 20, 40–57. [Google Scholar] [CrossRef]
- Qureshi, M.R.N.M.; Almuflih, A.S.; Sharma, J.; Tyagi, M.; Singh, S.; Almakayeel, N. Assessment of the Climate-Smart Agriculture Interventions towards the Avenues of Sustainable Production–Consumption. Sustainability 2022, 14, 8410. [Google Scholar] [CrossRef]
- Almuflih, A.S.; Sharma, J.; Tyagi, M.; Bhardwaj, A.; Qureshi, M.R.N.M.; Khan, N. Leveraging the Dynamics of Food Supply Chains towards Avenues of Sustainability. Sustainability 2022, 14, 6958. [Google Scholar] [CrossRef]
- Chithambaranathan, P.; Subramanian, N.; Gunasekaran, A.; Palaniappan, P.K. Service Supply Chain Environmental Performance Evaluation Using Grey Based Hybrid MCDM Approach. Int. J. Prod. Econ. 2015, 166, 163–176. [Google Scholar] [CrossRef]
- Abdel-Basset, M.; Ding, W.; Mohamed, R.; Metawa, N. An Integrated Plithogenic MCDM Approach for Financial Performance Evaluation of Manufacturing Industries. Risk Manag. 2020, 22, 192–218. [Google Scholar] [CrossRef]
- Bhagwat, R.; Sharma, M.K. Performance Measurement of Supply Chain Management: A Balanced Scorecard Approach. Comput. Ind. Eng. 2007, 53, 43–62. [Google Scholar] [CrossRef]
- Chan, F.T.S.; Qi, H.J. Feasibility of Performance Measurement System for Supply Chain: A Process-based Approach and Measures. Integr. Manuf. Syst. 2003, 14, 179–190. [Google Scholar] [CrossRef]
- Najmi, A.; Makui, A. Providing Hierarchical Approach for Measuring Supply Chain Performance Using AHP and DEMATEL Methodologies. Int. J. Ind. Eng. Comput. 2010, 1, 199–212. [Google Scholar] [CrossRef]
- Abdallah, A.B.; Alfar, N.A.; Alhyari, S. The Effect of Supply Chain Quality Management on Supply Chain Performance: The Indirect Roles of Supply Chain Agility and Innovation. Int. J. Phys. Distrib. Logist. Manag. 2021, 51, 785–812. [Google Scholar] [CrossRef]
- Tse, Y.K.; Zhang, M.; Akhtar, P.; MacBryde, J. Embracing Supply Chain Agility: An Investigation in the Electronics Industry. Supply Chain Manag. Int. J. 2016, 21, 140–156. [Google Scholar] [CrossRef]
- Venkata Ramana, D.; Narayana Rao, K.; Suresh Kumar, J. Evaluation of Performance Metrics of Leagile Supply Chain through Fuzzy MCDM. Decis. Sci. Lett. 2013, 2, 211–222. [Google Scholar] [CrossRef]
- Gunasekaran, A.; Patel, C.; Tirtiroglu, E. Performance Measures and Metrics in a Supply Chain Environment. Int. J. Oper. Prod. Manag. 2001, 21, 71–87. [Google Scholar] [CrossRef]
- Kurien, G.P.; Qureshi, M.N. Analysis and Measurement of Supply Chain Flexibility. Int. J. Logist. Syst. Manag. 2015, 21, 70. [Google Scholar] [CrossRef]
- Betts, T.; Tadisina, S.K. Supply Chain Agility, Collaboration, and Performance: How Do They Relate? In Proceedings of the POMS 20th Annual Conference, Orlando, FL, USA, 1–4 May 2009; pp. 1–22. [Google Scholar]
- Inman, R.A.; Green, K.W. Environmental Uncertainty and Supply Chain Performance: The Effect of Agility. J. Manuf. Technol. Manag. 2022, 33, 239–258. [Google Scholar] [CrossRef]
- Baah, C.; Opoku Agyeman, D.; Acquah, I.S.K.; Agyabeng-Mensah, Y.; Afum, E.; Issau, K.; Ofori, D.; Faibil, D. Effect of Information Sharing in Supply Chains: Understanding the Roles of Supply Chain Visibility, Agility, Collaboration on Supply Chain Performance. Benchmarking Int. J. 2022, 29, 434–455. [Google Scholar] [CrossRef]
- Altay, N.; Gunasekaran, A.; Dubey, R.; Childe, S.J. Agility and Resilience as Antecedents of Supply Chain Performance under Moderating Effects of Organizational Culture within the Humanitarian Setting: A Dynamic Capability View. Prod. Plan. Control 2018, 29, 1158–1174. [Google Scholar] [CrossRef]
- Matawale, C.R.; Datta, S.; Mahapatra, S.S. Evaluation of Leanness, Agility and Leagility for Supply Chain of Automotive Industries. Int. J. Agil. Syst. Manag. 2015, 8, 85. [Google Scholar] [CrossRef]
- Keeney, R.L. Value-Focused Brainstorming. Decis. Anal. 2012, 9, 303–313. [Google Scholar] [CrossRef]
- Qureshi, K.M.; Mewada, B.G.; Buniya, M.K.; Qureshi, M.R.N.M. Analyzing Critical Success Factors of Lean 4.0 Implementation in Small and Medium Enterprises for Sustainable Manufacturing Supply Chain for Industry 4.0 Using PLS-SEM. Sustainability 2023, 15, 5528. [Google Scholar] [CrossRef]
- Thangaratinam, S.; Redman, C.W. The Delphi Technique. Obstet. Gynaecol. 2005, 7, 120–125. [Google Scholar] [CrossRef]
- Haleem, A.; Sushil; Qadri, M.A.; Kumar, S. Analysis of Critical Success Factors of World-Class Manufacturing Practices: An Application of Interpretative Structural Modelling and Interpretative Ranking Process. Prod. Plan. Control 2012, 23, 722–734. [Google Scholar] [CrossRef]
- Tripathy, S.; Sahu, S.; Ray, P.K. Interpretive Structural Modelling for Critical Success Factors of R&D Performance in Indian Manufacturing Firms. J. Model. Manag. 2013, 8, 212–240. [Google Scholar] [CrossRef]
- Nikander, J. Suitability of PapiNet-Standard for Straw Biomass Logistics. J. Ind. Inf. Integr. 2017, 6, 11–21. [Google Scholar] [CrossRef]
- Machado, C.G.; Winroth, M.; Carlsson, D.; Almström, P.; Centerholt, V.; Hallin, M. Industry 4.0 Readiness in Manufacturing Companies: Challenges and Enablers towards Increased Digitalization. Procedia CIRP 2019, 81, 1113–1118. [Google Scholar] [CrossRef]
- Hud, N.F.; Adam, S.; Yus Kelana, B.W. Accessing employees’ readiness to adopt Industry Revolution 4.0 (IR 4.0). Int. J. Innov. Ind. Revolut. 2020, 2, 15–28. [Google Scholar] [CrossRef]
- Govindan, K.; Kannan, D.; Jørgensen, T.B.; Nielsen, T.S. Supply Chain 4.0 Performance Measurement: A Systematic Literature Review, Framework Development, and Empirical Evidence. Transp. Res. Part E Logist. Transp. Rev. 2022, 164, 102725. [Google Scholar] [CrossRef]
- Donaldson, A.; Walker, P. Information Governance—A View from the NHS. Int. J. Med. Inform. 2004, 73, 281–284. [Google Scholar] [CrossRef] [PubMed]
- Ali, K.; Johl, S.K.; Muneer, A.; Alwadain, A.; Ali, R.F. Soft and Hard Total Quality Management Practices Promote Industry 4.0 Readiness: A SEM-Neural Network Approach. Sustainability 2022, 14, 11917. [Google Scholar] [CrossRef]
- Li, L.; Wang, B.; Wang, A. An Emergency Resource Allocation Model for Maritime Chemical Spill Accidents. J. Manag. Anal. 2014, 1, 146–155. [Google Scholar] [CrossRef]
- Lee, J.; Joo, H.-Y. The Impact of Top Management’s Support on the Collaboration of Green Supply Chain Participants and Environmental Performance. Sustainability 2020, 12, 9090. [Google Scholar] [CrossRef]
- Chen, H.; Yao, M.; Chong, D. Research on Institutional Innovation of China’s Green Insurance Investment. J. Ind. Integr. Manag. 2019, 4, 1950003. [Google Scholar] [CrossRef]
- Lassnig, M.; Müller, J.M.; Klieber, K.; Zeisler, A.; Schirl, M. A Digital Readiness Check for the Evaluation of Supply Chain Aspects and Company Size for Industry 4.0. J. Manuf. Technol. Manag. 2021, 33, 1–18. [Google Scholar] [CrossRef]
- Rai, A.; Patnayakuni, R.; Seth, N. Firm Performance Impacts of Digitally Enabled Supply Chain Integration Capabilities. MIS Q. 2006, 30, 225. [Google Scholar] [CrossRef]
- Qureshi, K.M.; Mewada, B.G.; Kaur, S.; Qureshi, M.R.N.M. Assessing Lean 4.0 for Industry 4.0 Readiness Using PLS-SEM towards Sustainable Manufacturing Supply Chain. Sustainability 2023, 15, 3950. [Google Scholar] [CrossRef]
Figure 1.
The research methodology.

Figure 2.
ISM for SCPMS enablers.

Figure 3.
Driving power and dependence diagram using MICMAC.

Figure 4.
Validation process.


Table 1.
Metrics and measures for SCPM.
| Supply Chain Activities/Processes/Approaches | References |
|---|---|
| Plan | Order lead time, total order cycle time, or order to delivery cycle time [2] |
| Source | Sourcing of purchasing items, subcontracting components [2,47], and supplier evaluation |
| Make/assemble | Manufacturing components [28], capacity utilization, effectiveness of scheduling techniques, and range of products and services [2] |
| Delivery | Measures for evaluating delivery performance and total cost of distribution [2] |
| Customer | Flexibility, response time for client queries, post-transaction customer service metrics, supply chain, and logistics cost [2] |
| Supply chain approaches | Flexibility [48], agility [44,49,50,51], agility and resilience [52], leanness, agility, and leagility [46,53], and responsiveness [9] |
Table 2.
Supply chain enablers and references.
| Enablers | Supply Chain Enablers | Descriptions | References |
|---|---|---|---|
| E1 | Leagility | Leagility is a combination of two SC approaches agility (reacting to rapid response and service) and leanness (optimizing total cost by reducing waste). | [6,48] |
| E2 | Visibility | Visibility is the ability to track every step of all SC activities and processes. | [6,59] |
| E3 | Employee readiness | Employee readiness is the preparedness of the employee with relevant knowledge and skill in adopting new technologies of I4.0. | [60,61,62] |
| E4 | Information transparency | Information transparency supports data transformation, cleaning, analysis, and sharing for SC transparency. | [6,48,63] |
| E5 | Customization for sustainability | Fulfillment of customers’ needs in terms of service and products can meet production and profitability for overall success. | [6,48] |
| E6 | Managerial readiness | Managerial conviction and actions for I4.0-related production process digitization, strategic priority, and acceptability. | [62,64] |
| E7 | SC 4.0 performance measurement awareness | The SC metric is compatible to measure the Wi-Fi-enabled new technology. | [6,62] |
| E8 | Supply chain admonition | SC admonition makes SC partners cautious about operation or technology failures or bottlenecks to reduce the risk and cost. | [6,48,65] |
| E9 | Top management support | Top management support initiates proactive action in managing SC performance through intelligent SCPM. | [60,66] |
| E10 | Green sourcing | Green sourcing enables making or buying decisions considering environmental impact. | [6,48,65,67] |
| E11 | Digital readiness | SC is equipped with digital readiness to accommodate new Wi-Fi-enabled technologies to meet SC 4.0 scope for I4.0. | [60,68] |
| E12 | SC 4.0 performance measurement awareness | SC 4.0-based performance measurement awareness is vital for the organization to accommodate the measurement of Wi-Fi-enabled technologies for I4.0. | [48,62] |
| E13 | Intelligent SCPMS for Industry 4.0 | Intelligent SCPMS provides compatibility with digital readiness with Wi-Fi-enabled technology. | [6,62] |
| E14 | Continuous improvement through innovation | Continuous improvement in SC 4.0 through innovations by updating technology and workmen skills to increase the effectiveness of SC 4.0. | [6,48,65] |
Table 3.
Self-structural self-interaction matrix (SSIM) of SCPMS enablers.
| Enablers | SCPMS Enablers | 14 | 13 | 12 | 11 | 10 | 9 | 8 | 7 | 6 | 5 | 4 | 3 | 2 |
|---|---|---|---|---|---|---|---|---|---|---|---|---|---|---|
| 1 | Leagility | V | V | O | V | X | A | V | A | O | V | V | V | X |
| 2 | Visibility | V | V | V | V | X | A | O | A | V | O | V | V | |
| 3 | Intelligent SCPMS for Industry 4.0 | A | A | A | A | A | A | O | A | A | V | A | ||
| 4 | Information transparency | V | X | A | A | O | A | A | A | A | V | |||
| 5 | Customization for sustainability | O | A | A | A | A | A | A | A | O | ||||
| 6 | Managerial readiness | V | V | A | X | A | A | A | A | |||||
| 7 | SC 4.0 performance measurement awareness | V | V | V | O | V | V | V | ||||||
| 8 | Supply chain admonition | V | O | V | V | A | A | |||||||
| 9 | Top management support | V | V | O | V | V | ||||||||
| 10 | Green sourcing | O | V | V | V | |||||||||
| 11 | Digital readiness | V | V | X | ||||||||||
| 12 | Employee readiness | V | V | |||||||||||
| 13 | Technology for I4.0 | A | ||||||||||||
| 14 | Continuous improvement through innovation |
Table 4.
Initial reachability matrix of SCPMS enablers.
| Enablers | SCPM Enabler | 1 | 2 | 3 | 4 | 5 | 6 | 7 | 8 | 9 | 10 | 11 | 12 | 13 | 14 |
|---|---|---|---|---|---|---|---|---|---|---|---|---|---|---|---|
| E1 | Leagility | 1 | 1 | 1 | 1 | 1 | 0 | 0 | 1 | 0 | 1 | 1 | 0 | 1 | 1 |
| E2 | Visibility | 1 | 1 | 1 | 1 | 0 | 1 | 0 | 0 | 0 | 1 | 1 | 1 | 1 | 1 |
| E3 | Intelligent SCPMS for Industry 4.0 | 0 | 0 | 1 | 0 | 1 | 0 | 0 | 0 | 0 | 0 | 0 | 0 | 0 | 0 |
| E4 | Information transparency | 0 | 0 | 1 | 1 | 1 | 0 | 0 | 0 | 0 | 0 | 0 | 0 | 1 | 1 |
| E5 | Customization for sustainability | 0 | 0 | 0 | 0 | 1 | 0 | 0 | 0 | 0 | 0 | 0 | 0 | 0 | 0 |
| E6 | Managerial readiness | 0 | 0 | 1 | 1 | 0 | 1 | 0 | 0 | 0 | 0 | 1 | 0 | 1 | 1 |
| E7 | SC 4.0 performance measurement awareness | 1 | 1 | 1 | 1 | 1 | 1 | 1 | 1 | 1 | 1 | 0 | 1 | 1 | 1 |
| E8 | Supply chain admonition | 0 | 0 | 0 | 1 | 1 | 1 | 0 | 1 | 0 | 0 | 1 | 1 | 0 | 1 |
| E9 | Top management support | 1 | 1 | 1 | 1 | 1 | 1 | 0 | 1 | 1 | 1 | 1 | 0 | 1 | 1 |
| E10 | Green sourcing | 1 | 1 | 1 | 0 | 1 | 1 | 0 | 1 | 0 | 1 | 1 | 1 | 1 | 0 |
| E11 | Digital readiness | 0 | 0 | 1 | 1 | 1 | 1 | 0 | 0 | 0 | 0 | 1 | 1 | 1 | 1 |
| E12 | Employee readiness | 0 | 0 | 1 | 1 | 1 | 1 | 0 | 0 | 0 | 0 | 1 | 1 | 1 | 1 |
| E13 | Technology for I4.0 | 0 | 0 | 1 | 1 | 1 | 0 | 0 | 0 | 0 | 0 | 0 | 0 | 1 | 0 |
| E14 | Continuous improvement through innovation | 0 | 0 | 1 | 0 | 0 | 0 | 0 | 0 | 0 | 0 | 0 | 0 | 1 | 1 |
Table 5.
Final reachability matrix.
| Enablers | SCPMS Enablers | 1 | 2 | 3 | 4 | 5 | 6 | 7 | 8 | 9 | 10 | 11 | 12 | 13 | 14 | Total Driving Power |
|---|---|---|---|---|---|---|---|---|---|---|---|---|---|---|---|---|
| E1 | Leagility | 1 | 1 | 1 | 1 | 1 | 1 * | 0 | 1 | 0 | 1 | 1 | 1 * | 1 | 1 | 12 |
| E2 | Visibility | 1 | 1 | 1 | 1 | 1 * | 1 | 0 | 1 * | 0 | 1 | 1 | 1 | 1 | 1 | 12 |
| E3 | Intelligent SCPMS for Industry 4.0 | 0 | 0 | 1 | 0 | 1 | 0 | 0 | 0 | 0 | 0 | 0 | 0 | 0 | 0 | 2 |
| E4 | Information transparency | 0 | 0 | 1 | 1 | 1 | 0 | 0 | 0 | 0 | 0 | 0 | 0 | 1 | 1 | 5 |
| E5 | Customization for sustainability | 0 | 0 | 0 | 0 | 1 | 0 | 0 | 0 | 0 | 0 | 0 | 0 | 0 | 0 | 1 |
| E6 | Managerial readiness | 0 | 0 | 1 | 1 | 1 * | 1 | 0 | 0 | 0 | 0 | 1 | 1 * | 1 | 1 | 8 |
| E7 | SC 4.0 performance measurement awareness | 1 | 1 | 1 | 1 | 1 | 1 | 1 | 1 | 1 | 1 | 1 * | 1 | 1 | 1 | 14 |
| E8 | Supply chain admonition | 0 | 0 | 1 * | 1 | 1 | 1 | 0 | 1 | 0 | 0 | 1 | 1 | 1 * | 1 | 9 |
| E9 | Top management support | 1 | 1 | 1 | 1 | 1 | 1 | 0 | 1 | 1 | 1 | 1 | 1* | 1 | 1 | 13 |
| E10 | Green sourcing | 1 | 1 | 1 | 1 * | 1 | 1 | 0 | 1 | 0 | 1 | 1 | 1 | 1 | 1 * | 12 |
| E11 | Digital readiness | 0 | 0 | 1 | 1 | 1 | 1 | 0 | 0 | 0 | 0 | 1 | 1 | 1 | 1 | 8 |
| E12 | Employee readiness | 0 | 0 | 1 | 1 | 1 | 1 | 0 | 0 | 0 | 0 | 1 | 1 | 1 | 1 | 8 |
| E13 | Technology for I4.0 | 0 | 0 | 1 | 1 | 1 | 0 | 0 | 0 | 0 | 0 | 0 | 0 | 1 | 1 * | 5 |
| E14 | Continuous improvement through innovation | 0 | 0 | 1 | 1 * | 1 * | 0 | 0 | 0 | 0 | 0 | 0 | 0 | 1 | 1 | 5 |
| Total (dependence) | 5 | 5 | 13 | 12 | 14 | 9 | 1 | 6 | 2 | 5 | 9 | 9 | 12 | 12 | ||
* CSF has transitivity.
Table 6.
SCPMS enablers first iteration level I.
| Enablers | Reachability Set | Antecedent Set | Intersection Set | Level |
|---|---|---|---|---|
| E1 | 1, 2, 3, 4, 5, 6, 8, 10, 11, 12, 13, 14 | 1, 2, 7, 9, 10 | 1, 2, 10 | - |
| E2 | 1, 2, 3, 4, 5, 6, 8, 10, 11, 12, 13, 14 | 1, 2, 7, 9, 10 | 1, 2, 10 | - |
| E3 | 3, 5 | 1, 2, 3, 4, 6, 7, 8, 9, 10, 11, 12, 13, 14 | 3 | - |
| E4 | 3, 4, 5, 13, 14 | 1, 2, 4, 6, 7, 8, 9, 10, 11, 12, 13, 14 | 4, 13, 14 | - |
| E 5 | 5 | 1, 2, 3, 4, 5, 7, 6, 8, 9, 10, 11, 12, 13, 14 | 5 | I |
| E6 | 3, 4, 5, 6, 11, 12, 13, 14 | 1, 2, 6, 7, 8, 9, 10, 11, 12 | 6, 11, 12 | - |
| E7 | 1, 2, 3, 4, 5, 6, 7, 8, 9, 10, 11, 12, 13, 14 | 7 | 7 | - |
| E8 | 3, 4, 5, 6, 8, 11, 12, 13, 14 | 1, 2, 7, 8, 9, 10 | 8, | - |
| E9 | 1, 2, 3, 4, 5, 6, 8, 9, 10, 11, 12, 13, 14 | 7, 9 | 9 | - |
| E10 | 1, 2, 3, 4, 5, 6, 8, 10, 11, 12, 13, 14 | 1, 2, 7, 9, 10 | 1, 2, 10 | - |
| E11 | 3, 4, 5, 6, 11, 12, 13, 14 | 1, 2, 6, 7, 8, 9, 10, 11, 12 | 6, 11, 12 | - |
| E12 | 3, 4, 5, 6, 11, 12, 13, 14 | 1, 2, 6, 7, 8, 9, 10, 11, 12 | 6, 11, 12 | - |
| E13 | 3, 4, 5, 13, 14 | 1, 2, 4, 6, 7, 8, 9, 10, 11, 12, 13, 14 | 4, 13, 14 | - |
| E14 | 3, 4, 5, 13, 14 | 1, 2, 4, 6, 7, 8, 9, 10, 11, 12, 13, 14 | 4, 13, 14 | - |
Table 7.
All iteration results (II–VIII) of SCPMS enablers.
| Enablers | Reachability Set | Antecedent Set | Intersection Set | Level |
|---|---|---|---|---|
| E1 | 1, 2, 10 | 1, 2, 7, 9, 10 | 1, 2, 10 | VI |
| E2 | 1, 2, 10 | 1, 2, 7, 9, 10 | 1, 2, 10 | VI |
| E3 | 3 | 1, 2, 3, 4, 6, 7, 8, 9, 10, 11, 12, 13, 14 | 3 | II |
| E4 | 4, 13, 14 | 1, 2, 4, 6, 7, 8, 9, 10, 11, 12, 13, 14 | 4, 13, 14 | III |
| E 5 | 5 | 1, 2, 3, 4, 5, 6, 7, 8, 9, 10, 11, 12, 13, 14 | 5 | I |
| E6 | 6, 11, 12 | 1, 2, 6, 7, 8, 9, 10, 11, 12, 13, 14 | 6, 11, 12 | IV |
| E7 | 7 | 7 | 7 | VIII |
| E8 | 8 | 1, 2, 7, 8, 9, 10 | 8, | V |
| E9 | 9 | 7, 9 | 9 | VII |
| E10 | 1, 2, 10 | 1, 2, 7, 9, 10 | 1, 2, 10 | VI |
| E11 | 6, 11, 12 | 1, 2, 6, 7, 8, 9, 10, 11, 12 | 6, 11, 12 | IV |
| E12 | 6, 11, 12 | 1, 2, 6, 7, 8, 9, 10, 11, 12 | 6, 11, 12 | IV |
| E13 | 4, 13, 14 | 1, 2, 4, 6, 7, 8, 9, 10, 11, 12, 13, 14 | 4, 13, 14 | III |
| E14 | 4, 13, 14 | 1, 2, 4, 6, 7, 8, 9, 10, 11, 12, 13, 14 | 4, 13, 14 | III |
Table 8.
Lower triangular matrix.
| Enablers | SCPMS Enablers | E5 | E3 | E4 | E13 | E14 | E6 | E11 | E12 | E8 | E1 | E2 | E10 | E9 | E7 | DP |
|---|---|---|---|---|---|---|---|---|---|---|---|---|---|---|---|---|
| E5 | Customization for sustainability | 1 | 0 | 0 | 0 | 0 | 0 | 0 | 0 | 0 | 0 | 0 | 0 | 0 | 0 | 1 |
| E3 | Intelligent SCPMS for Industry 4.0 | 1 | 1 | 0 | 0 | 0 | 0 | 0 | 0 | 0 | 0 | 0 | 0 | 0 | 0 | 2 |
| E4 | Information transparency | 1 | 1 | 1 | 1 | 1 | 0 | 0 | 0 | 0 | 0 | 0 | 0 | 0 | 0 | 3 |
| E13 | Technology for I4.0 | 1 | 1 | 1 | 1 | 1 | 0 | 0 | 0 | 0 | 0 | 0 | 0 | 0 | 0 | 3 |
| E14 | Continuous improvement through innovation | 1 | 1 | 1 | 1 | 1 | 0 | 0 | 0 | 0 | 0 | 0 | 0 | 0 | 0 | 3 |
| E6 | Managerial readiness | 1 | 1 | 1 | 1 | 1 | 1 | 1 | 1 | 0 | 0 | 0 | 0 | 0 | 0 | 4 |
| E11 | Digital readiness | 1 | 1 | 1 | 1 | 1 | 1 | 1 | 1 | 0 | 0 | 0 | 0 | 0 | 0 | 4 |
| E12 | Employee readiness | 1 | 1 | 1 | 1 | 1 | 1 | 1 | 1 | 0 | 0 | 0 | 0 | 0 | 0 | 4 |
| E8 | Supply chain admonition | 1 | 1 | 1 | 1 | 1 | 1 | 1 | 1 | 1 | 0 | 0 | 0 | 0 | 0 | 5 |
| E1 | Leagility | 1 | 1 | 1 | 1 | 1 | 1 | 1 | 1 | 1 | 1 | 1 | 1 | 0 | 0 | 6 |
| E2 | Visibility | 1 | 1 | 1 | 1 | 1 | 1 | 1 | 1 | 1 | 1 | 1 | 1 | 0 | 0 | 6 |
| E10 | Green sourcing | 1 | 1 | 1 | 1 | 1 | 1 | 1 | 1 | 1 | 1 | 1 | 1 | 0 | 0 | 6 |
| E9 | Top management support | 1 | 1 | 1 | 1 | 1 | 1 | 1 | 1 | 1 | 1 | 1 | 1 | 1 | 0 | 7 |
| E7 | SC 4.0 performance measurement awareness | 1 | 1 | 1 | 1 | 1 | 1 | 1 | 1 | 1 | 1 | 1 | 1 | 1 | 1 | 8 |
Table 9.
Percentage opinion for ranking SCPM variables.
| Variables | Description | Opinion Number | Opinion Percentage | Rank |
|---|---|---|---|---|
| E1 | Leagility | 8 | 0.27 | 13 |
| E2 | Visibility | 9 | 0.30 | 12 |
| E3 | Intelligent SCPMS for Industry 4.0 | 14 | 0.47 | 8 |
| E4 | Information transparency | 13 | 0.43 | 9 |
| E 5 | Customization for sustainability | 11 | 0.37 | 10 |
| E6 | Managerial readiness | 21 | 0.70 | 3 |
| E7 | SC 4.0 performance measurement awareness | 22 | 0.73 | 2 |
| E8 | Supply chain admonition | 5 | 0.17 | 14 |
| E9 | Top management support | 25 | 0.83 | 1 |
| E10 | Green sourcing | 10 | 0.33 | 11 |
| E11 | Digital readiness | 18 | 0.60 | 6 |
| E12 | Employee readiness | 20 | 0.67 | 4 |
| E13 | Technology for I4.0 | 19 | 0.63 | 5 |
| E14 | Continuous improvement through innovation | 15 | 0.50 | 7 |
Table 10.
SCPMS enablers with Sj and Kj.
| SCPMS Enablers | E9 | E7 | E6 | E12 | E13 | E11 | E14 | E3 | E4 | E5 | E10 | E2 | E1 | E8 |
|---|---|---|---|---|---|---|---|---|---|---|---|---|---|---|
| Opinion percentage | 0.83 | 0.73 | 0.70 | 0.67 | 0.63 | 0.60 | 0.50 | 0.47 | 0.43 | 0.37 | 0.33 | 0.30 | 0.27 | 0.17 |
| Sj | 0.10 | 0.03 | 0.03 | 0.03 | 0.03 | 0.10 | 0.03 | 0.03 | 0.07 | 0.03 | 0.03 | 0.03 | 0.10 | |
| Kj | 1 | 1.10 | 1.03 | 1.03 | 1.03 | 1.03 | 1.10 | 1.03 | 1.03 | 1.07 | 1.03 | 1.03 | 1.03 | 1.10 |
Table 11.
SCPMS enablers with qj and Wj.
| SCPMS Enablers | E9 | E7 | E6 | E12 | E13 | E11 | E14 | E3 | E4 | E5 | E10 | E2 | E1 | E8 |
|---|---|---|---|---|---|---|---|---|---|---|---|---|---|---|
| qj | 1.00 | 0.91 | 0.88 | 0.85 | 0.82 | 0.80 | 0.72 | 0.70 | 0.68 | 0.64 | 0.62 | 0.60 | 0.58 | 0.52 |
| Wj | 0.10 | 0.09 | 0.09 | 0.08 | 0.08 | 0.08 | 0.07 | 0.07 | 0.07 | 0.06 | 0.06 | 0.06 | 0.06 | 0.05 |
Disclaimer/Publisher’s Note: The statements, opinions and data contained in all publications are solely those of the individual author(s) and contributor(s) and not of MDPI and/or the editor(s). MDPI and/or the editor(s) disclaim responsibility for any injury to people or property resulting from any ideas, methods, instructions or products referred to in the content. |
© 2023 by the author. Licensee MDPI, Basel, Switzerland. This article is an open access article distributed under the terms and conditions of the Creative Commons Attribution (CC BY) license (https://creativecommons.org/licenses/by/4.0/).
Share and Cite
MDPI and ACS Style
Almakayeel, N. Evaluating and Ranking SCPMS Enablers Using ISM and SWARA. Appl. Sci. 2023, 13, 5791. https://doi.org/10.3390/app13095791
AMA Style
Almakayeel N. Evaluating and Ranking SCPMS Enablers Using ISM and SWARA. Applied Sciences. 2023; 13(9):5791. https://doi.org/10.3390/app13095791
Chicago/Turabian StyleAlmakayeel, Naif. 2023. "Evaluating and Ranking SCPMS Enablers Using ISM and SWARA" Applied Sciences 13, no. 9: 5791. https://doi.org/10.3390/app13095791
Note that from the first issue of 2016, this journal uses article numbers instead of page numbers. See further details here.