Article

Effect of Varied Nitrogen Sources and Type of Cultivation on the Yield and Physicochemical Parameters of Flowering Chinese Cabbage (Brassica campestris L. ssp. chinensis var. utilis Tsen et Lee)

by
Wenping Liu
1,
Małgorzata Muzolf-Panek
2 and
Tomasz Kleiber
1,*
1
Laboratory of Plant Nutrition, Department of Plant Physiology, Faculty of Agronomy, Horticulture and Bioengineering, Poznan University of Life Sciences, Zgorzelecka 4, 60-198 Poznan, Poland
2
Department of Food Quality and Safety Management, Poznan University of Life Sciences, 60-624 Poznan, Poland
*
Author to whom correspondence should be addressed.
Appl. Sci. 2023, 13(9), 5691; https://doi.org/10.3390/app13095691
Submission received: 25 March 2023 / Revised: 22 April 2023 / Accepted: 3 May 2023 / Published: 5 May 2023
(This article belongs to the Special Issue Chemical and Functional Properties of Food and Natural Products)

Abstract

:
The aim of our study was to determine the effect of various nitrogen sources (NH4NO3 (N, 34%), Ca(NO3)2 (N, 15.5%; Ca, 18%), Mg(NO3)2 (N, 11%; Mg, 12%), NaNO3 (N, 15%; Na, 25%) and urea (N, 46%)) and increasing the intensity of N nutrition with these fertilisers (50, 70, and 90 mg N·dm−3) on the yield and quality of flowering Chinese cabbage (Brassica campestris L. ssp. chinensis var. utilis Tsen et Lee). The plants were grown in two different soilless systems, namely pot cultivation (substrate system—mixture of peat and sand) and hydroponic cultivation. The quality of plants was expressed as macro- and microelement contents, pigment contents, antioxidant activity and phenolic content. It was observed that the yield of flowering Chinese cabbage was about 43–70% higher in the hydroponic system than in the substrate. The N source and N nutrition affected the yield volume. The highest mean yield was observed in pot cultivation after fertilisation with Mg(NO3)2 and in hydroponics with Ca(NO3)2. We found a rather high tolerance of flowering cabbage to sodium and an excessive content of ammonium in the nutrient solution. The nitrogen source and N doses modified plant contents of macro- and microelements (N, P, K, Ca, Mg, Na, Fe, Mn, Zn and Cu) and other quality parameters of plants. In pot cultivation, the highest element contents as well as the highest antioxidant activity were obtained after fertilisation with Mg(NO3)2 at N-70 and N-90. The highest pigment contents (chlorophylls and carotenoids) were obtained in the samples treated with urea at the N-90 dose. Those samples were also characterised by a high Mn content. Generally, the pigment content in the pot system positively correlated with the Mn content in leaves, the microelement which is involved in the process of photosynthesis, but it did not correlate with colour coordinates. In the hydroponic system, the highest pigment contents were observed in the samples treated with Mg(NO3)2 at the N-70 dose. Generally, in hydroponics, chlorophyll levels positively correlated with Ca levels in the aboveground parts of the plants. Additionally, the content of Chl b inversely correlated with L* and b* values. In hydroponic systems, the highest DPPH (2,2-diphenyl-1-picrylhydrazyl) activity was observed after treatment with NH4NO3 at the N-70 and N-90 doses and it did not correlate with phenolic content but rather with pigment content. In conclusion, both the intensity of N nutrition and the fertiliser applied can significantly modify the yield of plants and their quality parameters. For pot cultivation, the most effective fertiliser was Mg(NO3)2 at the N-70/N-90 doses, while for hydroponic cultivation, it is difficult to indicate the most effective fertiliser as the responses varied depending on the method of fertilisation.

1. Introduction

Flowering Chinese cabbage, commonly known as caixin in Mandarin Chinese or choy sum in the Cantonese dialect, originated from China [1]. The vegetable is still little known by Europeans. The leaves and flowering stem are the most valuable parts of flowering Chinese cabbage. The plant is a rich source of glucosinolates, polyphenols, vitamin C, amino acids and other chemical compounds [2].
Based on previous studies [3,4], factors such as season (planting date), cultivation technology and nitrogen nutrition are important and significantly modify the yield of flowering Chinese cabbage. It was also reported that foliar spraying affected plant responses, such as macro and microelement contents, pigment and phenolic levels as well as antioxidant properties.
It was previously reported that the optimal level of nitrogen nutrition is in the range of up to 90 mg·dm−3 (mod. 180 kg per ha), while increased nutrition does not usually significantly improve the yield [4]. However, others indicated the N dose level from 440 to 490 kg per ha (i.e., 220–245 mg·dm−3 in a 20 cm layer) as the optimal nutrition, which is a balance between the biological value for plants and the economic costs of cultivation [5]. Although scientists compared the influence of several different fertilisers on the growth of flowering Chinese cabbage, including the effects of controlled release of urea nitrogen [6], ammonium nitrogen [7] and the Trichoderma biofertiliser [8], there is still a lack of literature data on the quality of flowering Chinese cabbage grown with different N sources in the same experimental conditions.
Nitrogen in various forms is used in plant production. One of the most popular is ammonium nitrate (NH4NO3, 34% N). At an optimal concentration, ammonium nitrate promotes the growth and improves the nutritional quality of flowering Chinese cabbage in both pot cultivation and hydroponics [3,4]. Application of 100 kg N per ha−1 of ammonium nitrate increased the sugar content in sugarcane (Saccharum spp.) by 7–25% [9]. Zhu et al. [10] pointed out that appropriate N—NH4/N—NO3 ratios increased N absorption and assimilation and thus promoted the growth of flowering Chinese cabbage. Urea (46% N) is the most concentrated solid nitrogen fertiliser. In soil, it changes to ammonium carbonate, which may temporarily cause a harmful local high pH. An experiment conducted by Xie et al. [5] found that the urea fertiliser tended to increase the yield of flowering Chinese cabbage in the first stage of growth, but then, with a further increase in urea, the growth was inhibited. Thus, the optimal dose of urea for flowering Chinese cabbage was estimated to be 440–490 kg per ha−1. When the application of urea exceeded the optimal dose, high levels of nitrate accumulation occurred [11,12]. As sources of N, calcium (15.5% N), magnesium (10.5% N) and sodium (16% N, 26% Na) nitrates were also used as fertilisers. These metal ions (Ca2+, Mg2+ and Na+) play crucial roles in photosynthesis, glucose transport, nucleic acid synthesis and protein synthesis in plants, as well as in other processes that affect the quality of plants. They are necessary for stimulating plant growth [13,14,15] and affect amino acid content [16], pigment content and colour of plants [15]. Brassica plants, such as cabbages, are often considered to be calcicoles, i.e., plants which accumulate free calcium ions (Ca2+) [17]. According to the authors’ knowledge, there are no data on the effects of various nitrate sources on the yield and quality of flowering Chinese cabbage grown in the same experimental conditions.
Thus, the aim of our study was to investigate the influence of N sources and N doses on the growth and qualitative characteristics of flowering Chinese cabbage. The following scientific hypothesis was formulated: N sources and N nutrition levels modify the yield and quality of flowering Chinese cabbage. The effect depends on the system of cultivation. The experiments were conducted with five different N sources: NH4NO3, Ca(NO3)2, Mg(NO3)2, Na(NO3)2, as well as urea for pot cultivation (CH4N2O), each at three different N levels: N-50, N-70, N-90. The plants were cultivated in soilless systems, namely substrate (in a pot) and hydroponic systems, during the spring season. The quality was evaluated based on several parameters: fresh weight, mineral element content, chlorophyll and carotenoid contents, phenolic content and antioxidant activity.

2. Materials and Methods

Purple flowering Chinese cabbage (Brassica campestris L. ssp. chinensis var. utilis Tsen et Lee) (Hubei Wuhan Hongshan Caitai Cultivation Centre, Wuhan, Hubei) was cultivated in pots with a substrate (a mixture of loamy sand and peat) and in a hydroponic system with recirculation of the nutrient solution. The plants were grown in an unheated greenhouse (272 m2 sector) of the “Marcelin” Experimental Station at Poznan University of Life Sciences (Poznan, Poland) from April to May 2019.
The experiments were performed with a completely randomised design. In the hydroponic system, the experiment was carried out with eight replicates, while in pot cultivation, it was carried out with 10 replicates (one replicate was a single plant). The greenhouse was equipped with a climate control system. In both experiments, the plants were exposed to three levels of nitrogen, namely 50, 70 and 90 mg N per dm−3, coded as N-50, N-70 and N-90, respectively. The following sources of nitrogen were used: NH4NO3 (N, 34%), Ca(NO3)2 (N, 15.5%; Ca, 18%), Mg (NO3)2 (N, 11%; Mg, 12%), NaNO3 (N, 15%; Na, 25%), and also urea (CH4N2O; N, 46%) for pot cultivation.
Seedlings were prepared 2.5 weeks before the experiment. Seeds were sown individually on rockwool fingers saturated with a standard nutrient solution to produce a homogeneous plant material. The seedlings (at the phase of 3–4 leaves) were transplanted into pots filled up with a mixed substrate (in case of pot cultivation), while in the hydroponic system, they were transplanted onto rockwool blocks (Grodan, 100 × 100 × 65 mm) hydrated with a nutrient solution. After 10 days, the plants were transplanted into a growing hydroponic system. In both experiments, the plants were watered according to the actual requirements.
The pot experiment was performed with limed peat moss. The dolomite dosage was set based on the neutralisation curve. The levels of nutrients available in the peat matrix after deacidification were as follows (in mg·dm−3): N—NH4, 35; N—NO3, traces; P, 20; K, 18; Ca, 1500; Mg, 164; S—SO4, 25; Fe, 19.8; Zn, 1.8; Mn, 2.7; Cu, 0.4; B, 0.5; Na, 18; Cl, 29. Electrolytic conductivity (EC) of the peat was 0.49 mS·cm−1; pH (H2O), 6.00. Other nutrients were applied 14 days after liming.
The pot experiment was conducted on the plants grown in 5 dm3 yellow plastic pots in a medium that was a mixture of mineral soil (loamy sand; d = 1.60 g·cm−3; total porosity, 39%) and peat (v/v/1/1). The plants were grown in the abovementioned substrate with the following chemical composition (mg·dm−3): P—150, K—200, Ca—1500, Mg—200, Fe—75, Mn—25, Zn—20, Cu—10; pH, 6.0–6.5. The only source of nitrogen in the various combinations was one of the aforementioned fertilisers. The contents of Ca, Mg and Na varied depending on the fertiliser used. When Ca(NO3)2 was used as a nitrogen source, Ca contents were 1500, 1560, 1620 mg·dm−3 for the N-50, N-70, N-90 doses, respectively. After fertilisation with Mg(NO3)2, Mg contents were 255, 276, 297 mg·dm−3 for the N-50, N-70, N-90 doses, respectively. Finally, when NaNO3 was applied as a nitrogen source, Na levels were 113, 147 and 180 mg·dm−3 for the N-50, N-70, N-90 doses, respectively.
In the hydroponic system, the standard nutrient solution for fertigation had the following chemical composition (mg·dm−3): K—150, P—PO4—50, K—200, Ca—120, Mg—60, Fe—1.20, Mn—0.5, Zn—0.19, Cu—0.01, B—0.011, and the EC value of 2.20 mS·cm−1. One of the aforementioned fertilisers was the only source of nitrogen for a combination. The contents of Ca, Mg and Na varied depending on the nitrogen source. For Ca(NO3)2, the contents of Ca were (in mg·dm−3) 58, 81, 105; for Mg(NO3)2, the contents of Mg were 55, 76, 98; and for NaNO3, the contents of Na were 83, 117 and 150 for the N-50, N-70 and N-90 doses, respectively.

2.1. Harvest and Storage of Flowering Chinese Cabbage

On 28 May, the aboveground parts of the plants were harvested and weighed. Then, fresh plant material from each combination was lyophilised at −59 °C (FreeZone, LANCONCO, Kansas City, MO, USA), ground and stored in a freezer (−18 °C) for analyses: colour, chlorophyll and carotenoid contents, total polyphenol content (TPC), total flavonoid content and antioxidant activity measurements.

2.2. Analysis of Macro- and Microelements in the Plants

For the analysis of macro- and microelements, the fresh plants were dried at 45–50 °C and then ground. The plant material was also dried at 105 °C for 60 min before mineralisation. To determine the contents of macroelements (N, P, K, Ca, Mg) and sodium (Na), 1 g of the plant material was added to 20 cm3 of concentrated sulfuric acid (96% analytically pure) with hydrogen peroxide (30% analytically pure) and then mineralised [18]; then, 2.5 g of the plant material was digested in 30 cm3 of a 3:1 mixture of concentrated nitric (ultrapure) and perchloric acids (analytically pure) to assess the contents of metallic microelements Fe, Mn, Zn and Cu. After digestion of the plant material, the following was determined: total nitrogen content using the distillation method according to Kjeldahl in a Parnas Wagner apparatus; P content by the colorimetric method with ammonium molybdate; and K, Ca, Mg, Fe, Mn, Zn and Cu contents using flame atomic absorption (on AAS, Carl Zeiss Jena apparatus; Thornwood, NY, USA). The accuracy of the laboratory procedure was tested using the LGC7162 reference material (LGC Standards, Teddington, Middlesex, UK), with an average nutrient recovery of 96% (N, P, K, Ca, Mg, Fe, Mn and Zn).

2.3. Colour Measurements

Colour measurements of flowering Chinese cabbage were conducted on a CM-5 spectrophotometer (Konica Minolta). The geometry of the observer was a 10° angle, and the measurement mode excluded the specular component (SCE). The light source was D65. Before analysis, the samples were freeze-dried and the colour coordinates of the powdered samples were measured using the CIE L*a*b* system, where L* is lightness, a*—red/green and b*—yellow/blue. The surface of the measured sample was 30 mm in diameter. Three replications were performed for each sample. Other chromatic attributes were also calculated, namely chroma (C*) and hue angle (h*).

2.4. Colour Pigment Content Measurements (Chlorophylls and Carotenoids)

The contents of chlorophyll a (Chl a), chlorophyll b (Chl b), total chlorophylls (Chl a + CHl b) and carotenoids (x + c) were measured as colour pigments of flowering Chinese cabbage. All the measurements were performed in triplicates. The sample preparation was performed according to a previously described procedure [3,4] which was based on an original analytical protocol [19]. First, 0.125 g of the powdered sample was mixed with 5 mL of methanol. After 5 min, the sample was filtrated and 80 μL of the eluate was diluted 50 times with pure methanol. The absorbance readings were performed on a Cary 1E UV–vis spectrophotometer (Varian, Belrose, Australia) using the scan mode with the following settings: wavelength range—from 410 nm to 700 nm, spectral bandwidth—2 nm. Pure methanol was used for preparing the baseline. The contents of Chl a, Chl b and x + c were calculated using an equation from Lichtenthaler et al. [19].

2.5. TPC and TFC Measurements

Determinations of the total phenolic content (TPC) and total flavonoid content (TFC) were conducted on a Cary 1E UV–vis spectrophotometer. The procedure was a modified method described previously in [20]. The samples for the measurements were prepared by mixing the freeze-dried plant material with distilled water in the ratio of 1:40 (m/v). After 30 min, the samples were filtrated and 20 μL of the extract were added to 100 μL of FCR. After 3 min of incubation in the dark, 300 μL of 20% (w/v) sodium carbonate and distilled water up to 2 mL were added. The samples were mixed again and incubated at ambient temperature for 2 h in the dark. The absorbance readings were taken at 765 nm against a blank sample prepared by using distilled water instead of the extract. The results were expressed as mg of gallic acid equivalents (GAE) per g of sample. Three replications were performed for each sample.
The extraction solution used for the TFC determination was the same as for the TPC procedure. In brief, the extract was mixed with AlCl3 (2% in methanol) in the ratio of 1:10 (v/v). After 15 min of incubation in the dark at ambient temperature, the absorbance readings were performed at the wavelength of 410 nm. Pure methanol was used for instrument zero calibration.

2.6. Antioxidant Activity Measurements

The Trolox equivalent antioxidant capacity (TEAC) assay was based on the original method reported by Re et al. [21]. The ABTS•+ cation radicals were generated chemically by mixing 7 mM ABTS (2,2′-azinobis (3-ethylbenzothiazoline-6-sulfonic acid)) in distilled water with 2.45 mM potassium persulfate (K2S2O8) in distilled water and leaving it to stand for 12–16 h in the dark [22]. Then, the ABTS•+ solution was dissolved with PBS buffer (pH 7.4) to obtain 0.7–0.8 absorbance readings. Next, the powdered freeze-dried flowering Chinese cabbage was mixed with pure methanol in the ratio of 1:20 (m/v) for 30 min and then filtrated. The extract was added to ABTS•+ in PBS (1:100 v/v) and left to incubate for 6 min in the dark at ambient temperature. The absorbance was read at 734 nm. All the results were expressed as TEAC values in mmol/g of dried sample.
The DPPH assay was carried out according to the original protocol by Sanchez-Moreno et al. [23]. The extract (prepared as above) was added to 0.1 mM DPPH in methanol (in the ratio of 1:100 v/v), mixed and incubated for 30 min in the dark at room temperature. Next, the absorbance readings were carried out at 515 nm against pure methanol as the blank sample. All the measurements were performed using a Cary 1E UV–vis spectrophotometer. The DPPH radical scavenging activity of the sample was expressed in mmol of Trolox equivalent (TE) per g of dried flowering Chinese cabbage.
The ferric-reducing antioxidant power (FRAP) method was based on the original methodology by Benzie and Strain [24]. The TPTZ (Fe3+-tripyridyl-triazine) working solution was prepared fresh on the day of analysis by mixing 10 mmol TPTZ in 40 mmol HCl, 20 mmol FeCl3·6H2O and acetate buffer (pH, 3.6) in the ratio of 1:1:10 (v/v/v). The extract (prepared as above) was added to the TPTZ working solution (1:20 v/v) and mixed. After incubation for 15 min, the absorbance was read at 593 nm. The zero instrument was set using acetate buffer as the blank sample. All the samples were prepared in triplicate.

2.7. Statistical Analysis

The data were analysed using the Statistica 13.3 software (StatSoft Inc., Tulsa, OK, USA). An ANOVA analysis (F-test) was performed to show significant effects of the factors on the parameters tested. The plants were grown in 10 replications in the substrate and eight replications in hydroponics. All the other tests were run in triplicate. The multiple comparison was based on Duncan’s test (α = 0.05) to show homogenous groups. Multivariate analysis such as cluster analysis was performed to find separate clusters in the dataset. To this end, Euclidean distance was used as a metric between the centroids and Ward’s method as the clustering rule. The number of clusters was defined automatically using V-fold cross-validation. The aim of the method is to construct clusters by minimising the variability within clusters and maximising the variability between clusters. Pearson’s correlation between the studied parameters was also measured.

3. Results and Discussion

3.1. Yield

For pot cultivation, the yields of the plants increased with the increasing N nutrition and reached the maximum value at N-90 (Table 1). When various fertilisers were applied to cultivate flowering Chinese cabbage, there was a significant difference in the yields at the same N level. The mean highest yields of plants were found after the application of Mg(NO3)2, the lowest—when Ca(NO3)2 was used. Interestingly, in the case of the NaNO3 application, although the simultaneously applied sodium doses were high (up to 180 mg dm−3), they did not cause a reduction in plant yields compared to the other combinations.
For hydroponic cultivation, no significant increase in plant yield was found between the application of N-70 and N-90 (for the mean values). There were no statistical differences between the tested fertilisers when analysing the mean crop yield. As in the case of pot cultivation, no statistically significant yield reduction was found for the highest application rate of NaNO3. Only in the case of calcium nitrate did N-90 show a significant increase in plant yield in relation to N-70. Compared to pot cultivation, the yields of flowering Chinese cabbage in hydroponics exhibited higher values, and the highest yields (174.2 g·plant−1) were obtained at N-70 with NH4NO3.

3.2. Nutrient Content

Increasing the nitrogen supply resulted in a significant increase in the N level in the aboveground parts of the potted plants—an effect that was not seen in hydroponics (Table 2 and Supplementary Materials Table S1).
In pot cultivation, the mean N content was comparable for all the nitrogen fertilisers, except for the application of urea. On the other hand, in hydroponic cultivation when NaNO3 was used, N contents were higher than after the application of NH4NO3 and Mg(NO3)2. Regardless of the type of fertiliser, as the N level increased, no significant changes in P levels were observed, although the N source slightly affected the P level. With the change in the intensity of N nutrition, the content of K changed. In both pot cultivation and hydroponics, when NH4NO3 and Mg(NO3)2 were applied, K levels were generally higher than for the other N carriers. In the case of pot cultivation, increasing N nutrition modified the calcium status of the plants (mean), whereas that effect was not present in the case of hydroponics. The highest content of Ca was found after the application of Mg(NO3)2 in pot cultivation and of Ca(NO3)2 in hydroponics. The application of Mg(NO3)2 improved the content of Mg in the aboveground parts of the plants for both cultivation systems.
The N source had a significant effect on microelement contents with the exception of Mn level in pot cultivation (Table 3). In pot cultivation, the lowest content of Fe was found in the case of the Ca(NO3)2 application, in hydroponics—after using Mg(NO3)2 as a fertiliser. The application of Mg(NO3)2 improved the plants’ Cu nutrient status compared with NH4NO3 and Ca(NO3)2 (pots). The effect of increasing N doses was observed in pot cultivation for Fe, Mn and Na and in hydroponics for Fe, Zn, Cu and Na (Table 3 and Supplementary Materials Table S1). Increasing the N supply with NaNO3 increased the content of Na in leaves. The mean contents of Fe and Zn were the highest at N-50 and N-70. Generally, in hydroponics, decreasing tendencies for Mn, Zn and Cu contents were reported at the highest intensity of N nutrition with Ca(NO3)2. The highest N dose (N-90) with urea, similarly to Ca(NO3)2 and Mg(NO3)2, resulted in the highest Mn level in the leaves of flowering Chinese cabbage cultivated in pots.

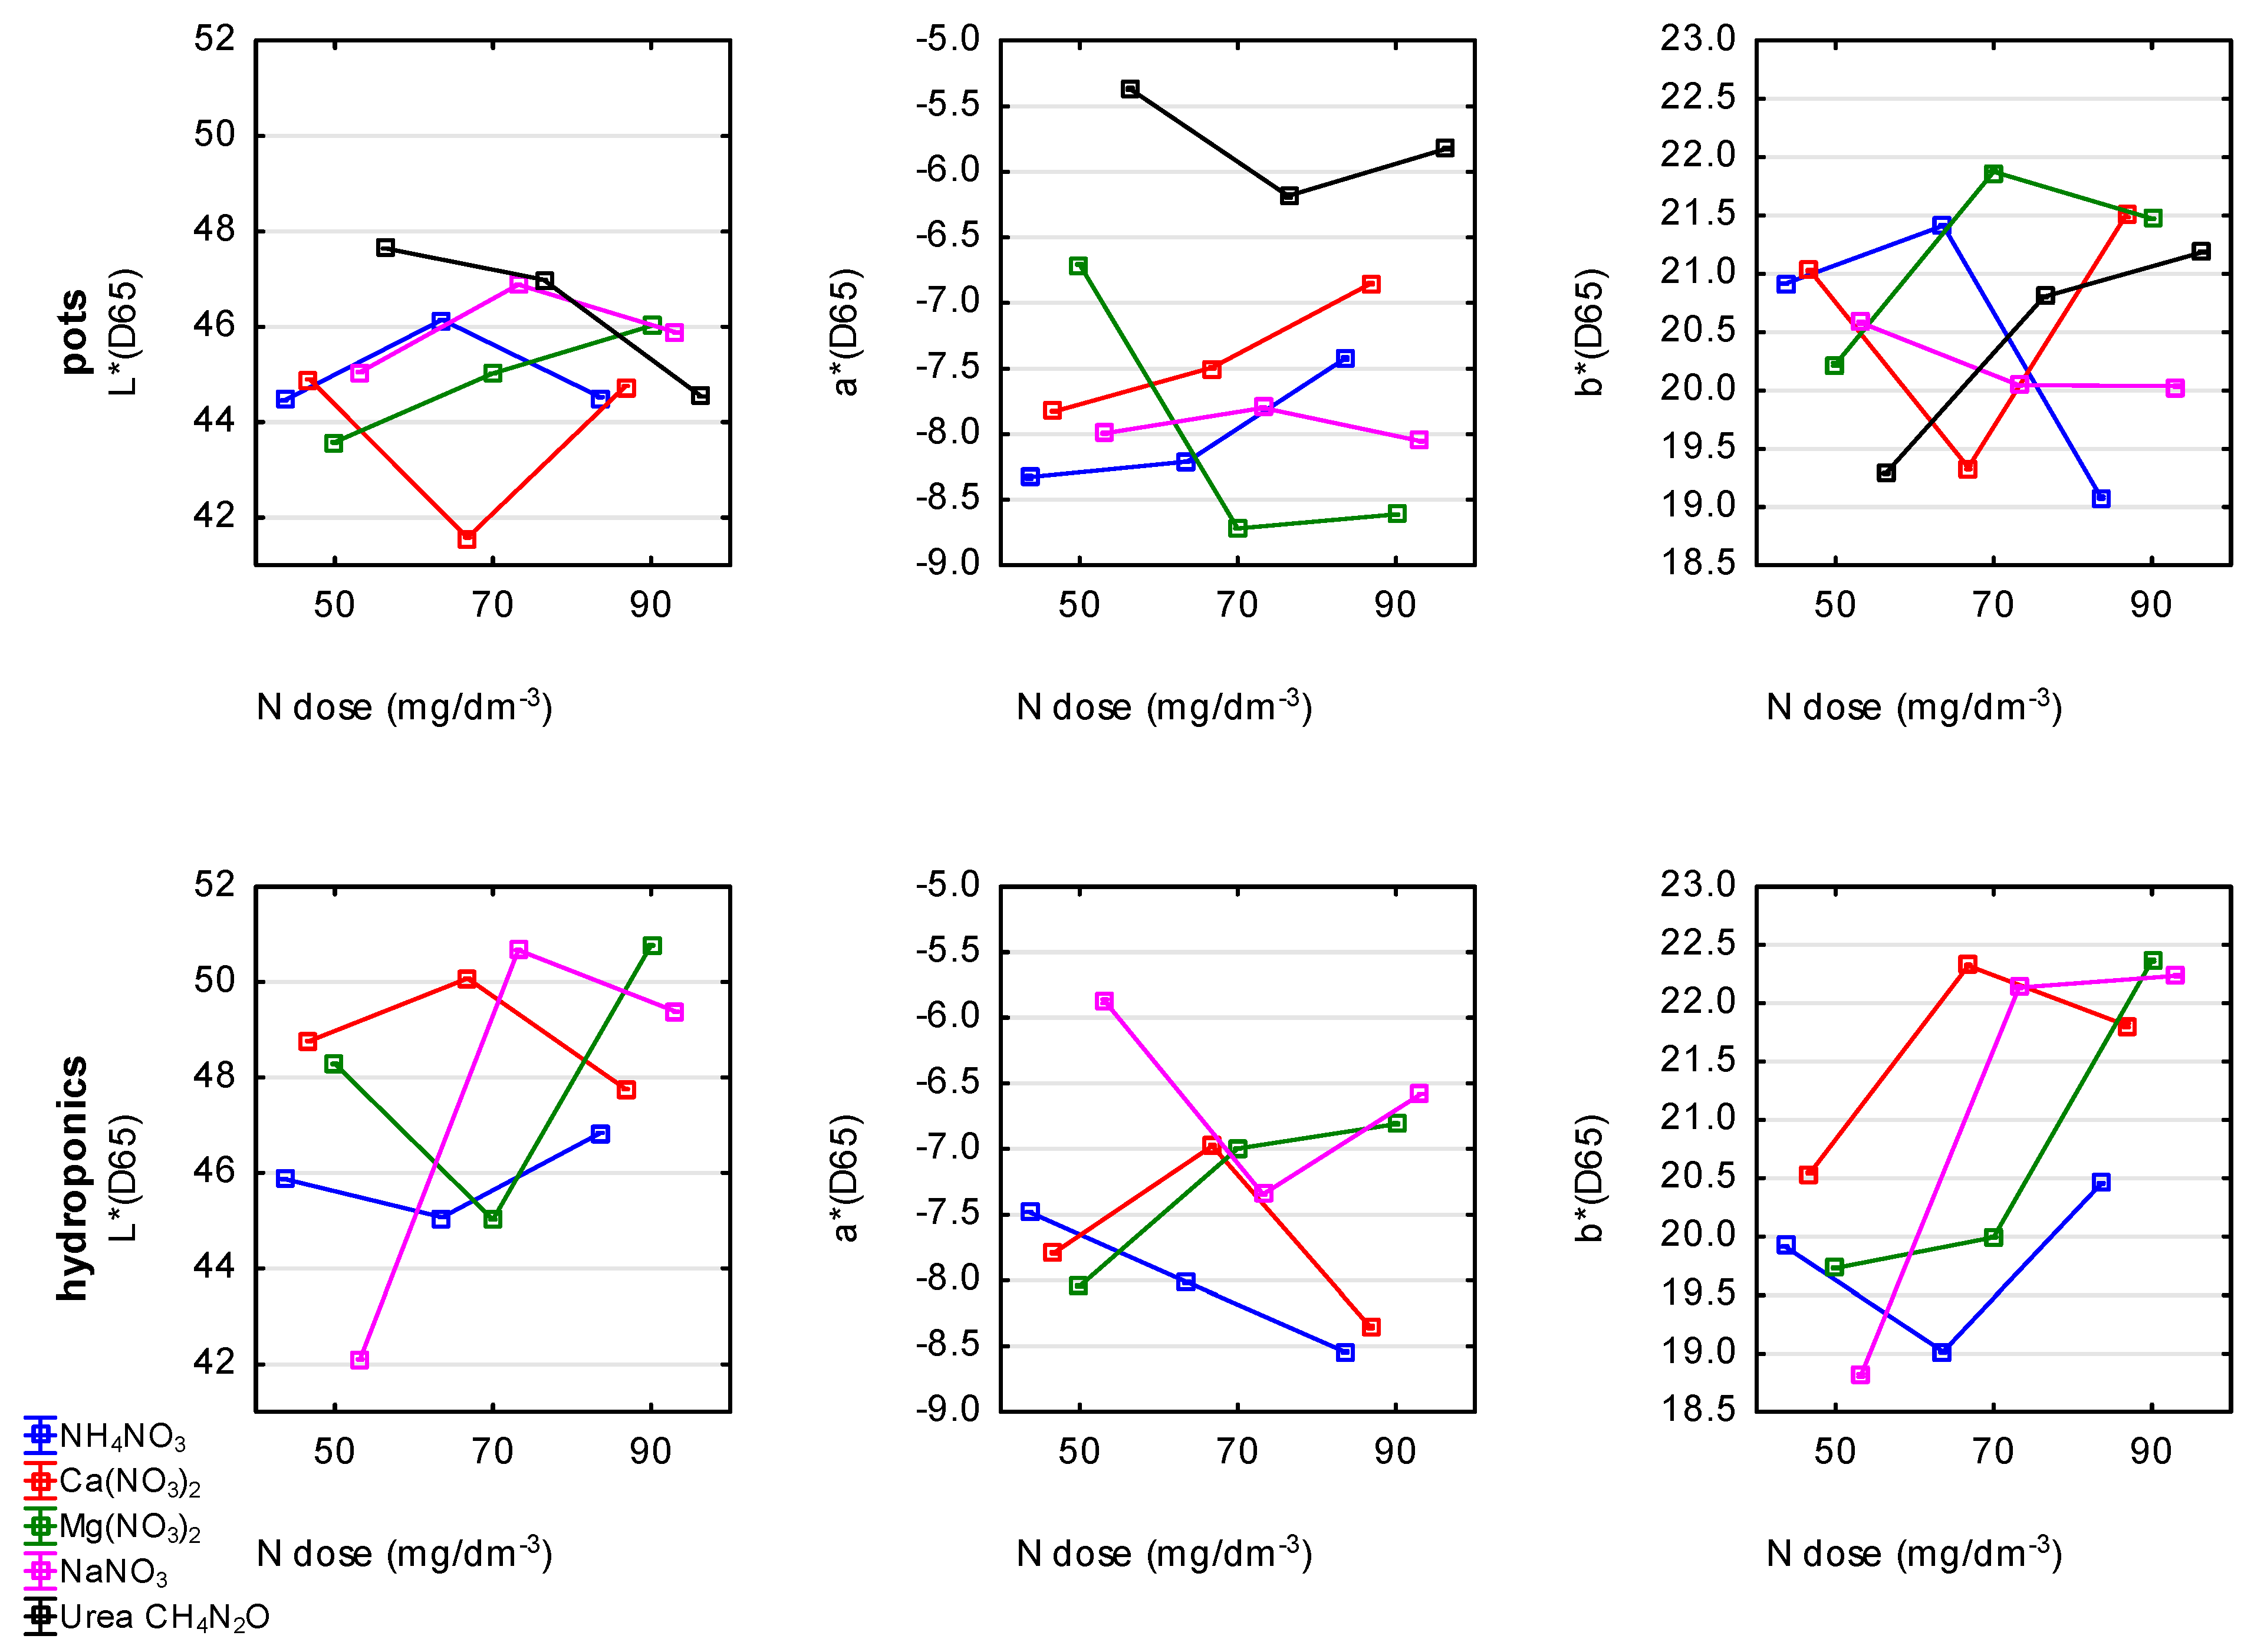
3.3. Colour Measurement

The results of the instrumental colour measurements expressed as the L* (lightness), a* (red/green) and b* (yellow/blue) coordinates are shown in Figure 1 and Table S2 (Supplementary Materials). Both effects, of the N source and the N level, were statistically significant in the pot and hydroponic cultivation systems (Table S1, Supplementary Materials). The results of pot cultivation indicated that the highest L* values were obtained for the urea fertilisation (mean L* value of 46.4 for all the N doses), whereas the lowest were obtained for Ca(NO3)2 (mean L* value of 43.8). Lightness (L*) of the flowering Chinese cabbage samples treated with Mg(NO3)2 increased with increasing N levels, while the L* value of the samples treated with urea decreased. With regard to the a* value, treatment of the plants with urea resulted in the highest a* values (mean a* value of −5.79). Fertilisation with increasing N levels of NH4NO3 and Ca(NO3)2 resulted in an increase in the a* values. The lowest a* value (−8.72) was determined for the flowering Chinese cabbage treated with Mg(NO3)2 at N-70. The values of the b* colour coordinate were the highest for the sample treated with Mg(NO3)2. However, there was no evident trend in the b* value changes with the increasing N dose of Mg(NO3)2. In contrast, the b* values of the samples treated with urea increased from 19.3 to 21.2 with increasing N doses, whereas the b* value decreased with increasing N doses of NaNO3. Both the chroma (C) and hue angle (h) values were the lowest in the samples fertilised with urea (Table S2).
In hydroponic cultivation, the highest L* value (50.77) was determined in the flowering Chinese cabbage treated with Mg(NO3)2 at N-90. However, regardless of the N dose, the mean L* value was the highest after Ca(NO3)2 treatment (48.88). With an increase in the N level, the a* values increased for the samples treated with Mg(NO3)2 and decreased for the samples treated with NH4NO3. The highest a* value was reported after treatment with NaNO3 (mean a* value of −6.6). With regard to the b* colour coordinate, the values increased with an increase in the N dose using Mg(NO3)2 up to the highest level of 22.37. However, taking into account only the effect of the N source, the highest b* value was noted for Ca(NO3)2 (mean value of 21.56). As for the hue angle (h) and chroma (C) coordinates, there were fluctuations in the values depending on the N level and N source (Table S2).

3.4. Chlorophyll and Carotenoid Contents

The effects of N nutrition intensity and fertiliser form (nitrogen source) on the contents of chlorophylls (Chl a, Chl b) and carotenoids (x + c) are shown in Table 4. In pot cultivation, the effect of the nutrition source was evident only for carotenoids (x + c), Chl a/Chl b and (Chl a + Chl b)/(x + c). The effect of the N level was statistically significant for Chl a, Chl b, carotenoids, Chl a + Chl b. The results of ANOVA are shown in Table S1 (Supplementary Materials). In pot cultivation, the highest Chl a, Chl b and x + c values (8.48, 2.39 and 2.01 mg/g, respectively) were observed in the flowering Chinese cabbage treated with urea at N-90. The values of Chl a + Chl b and (Chl a + Chl b)/carotenoids reached the maximum level after the treatment with NH4NO3, while the highest Chl a/Chl b value was found in the flowering Chinese cabbage treated with Mg(NO3)2, irrespective of dose.
In hydroponic cultivation, both the effects, of the N source (nutrition) and the intensity of N nutrition, were statistically significant (Table S1, Supplementary Materials). Generally, the chlorophyll and carotenoid contents of flowering Chinese cabbage grown in hydroponics were lower compared to the values from pot cultivation. The highest Chl a and x + c contents were found in the samples fertilised with Mg(NO3)2 at the N-70 dose, but the highest Chl b level was reported for the plants treated with NH4NO3. The lowest carotenoid content was observed after Ca(NO3)2 fertilisation (0.87 mg/g). However, with increasing levels of N derived from Ca(NO3)2, the carotenoid content increased.
The Chl a content in flowering Chinese cabbage gradually increased with the enhancement of N nutrition by treatment with NH4NO3, while increasing the N dose via fertilisation with NaNO3 reduced the Chl a content. The Chl b content in flowering Chinese cabbage decreased in the treatments with NaNO3 as the N levels rose.

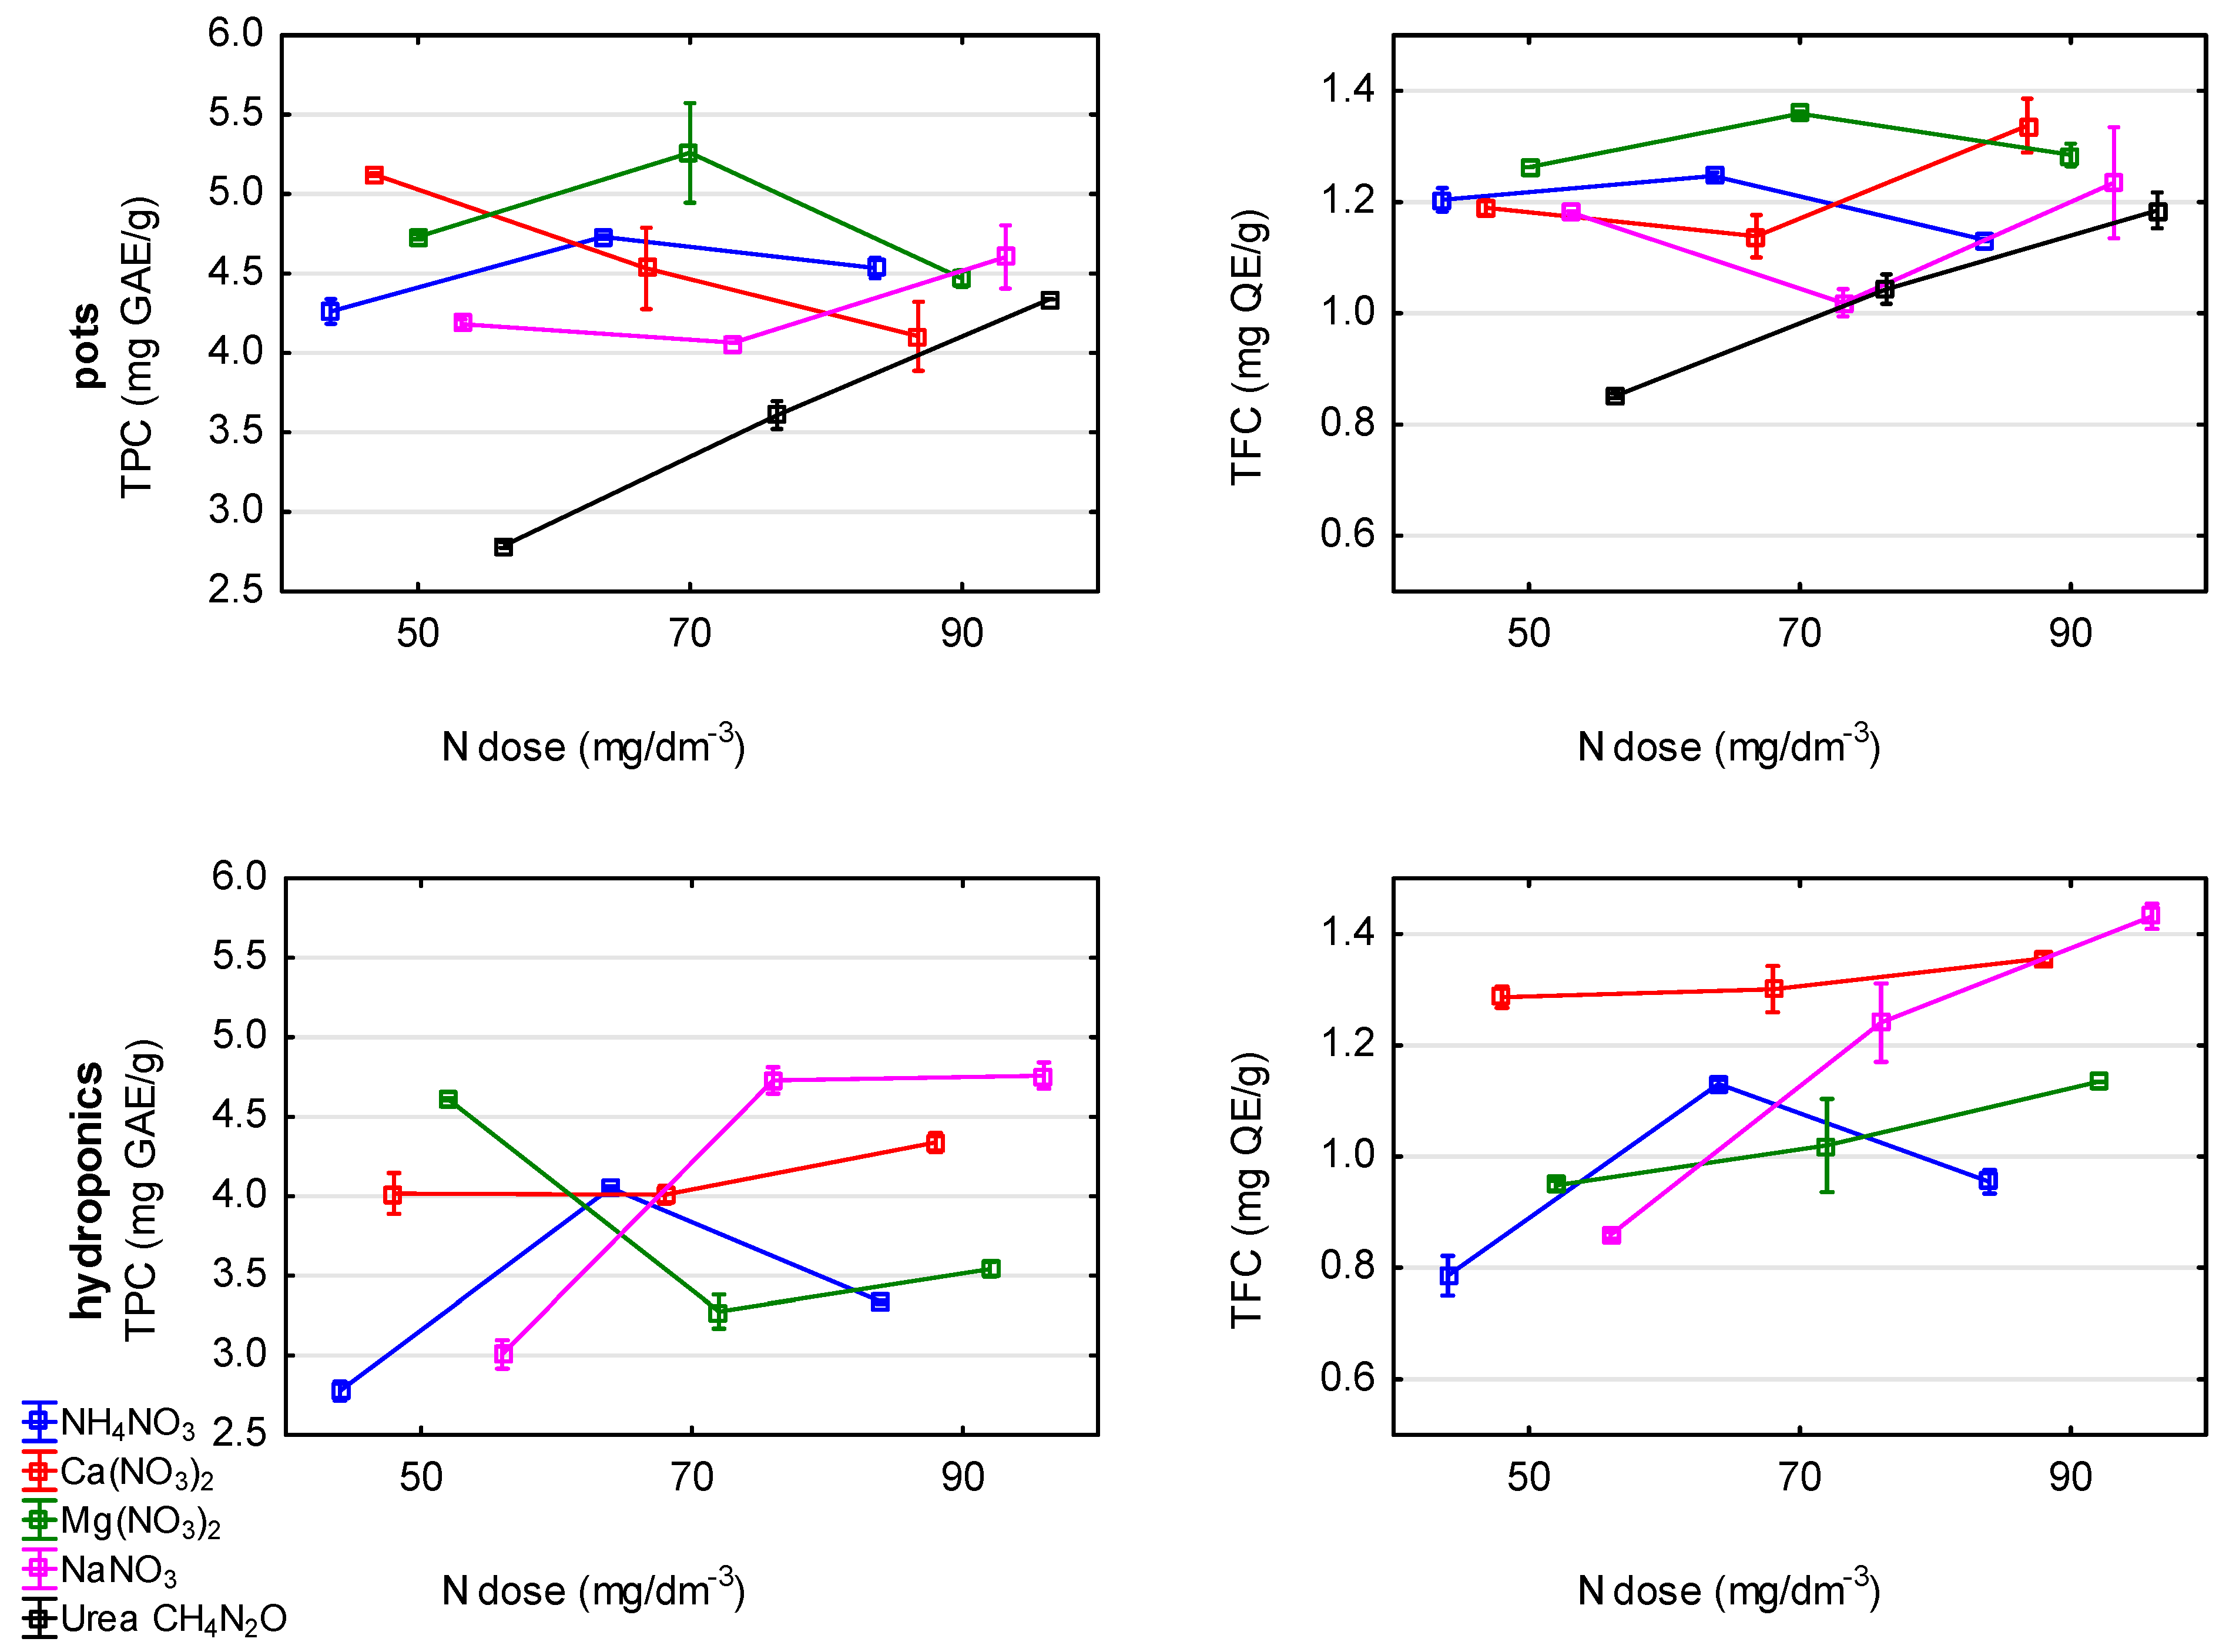
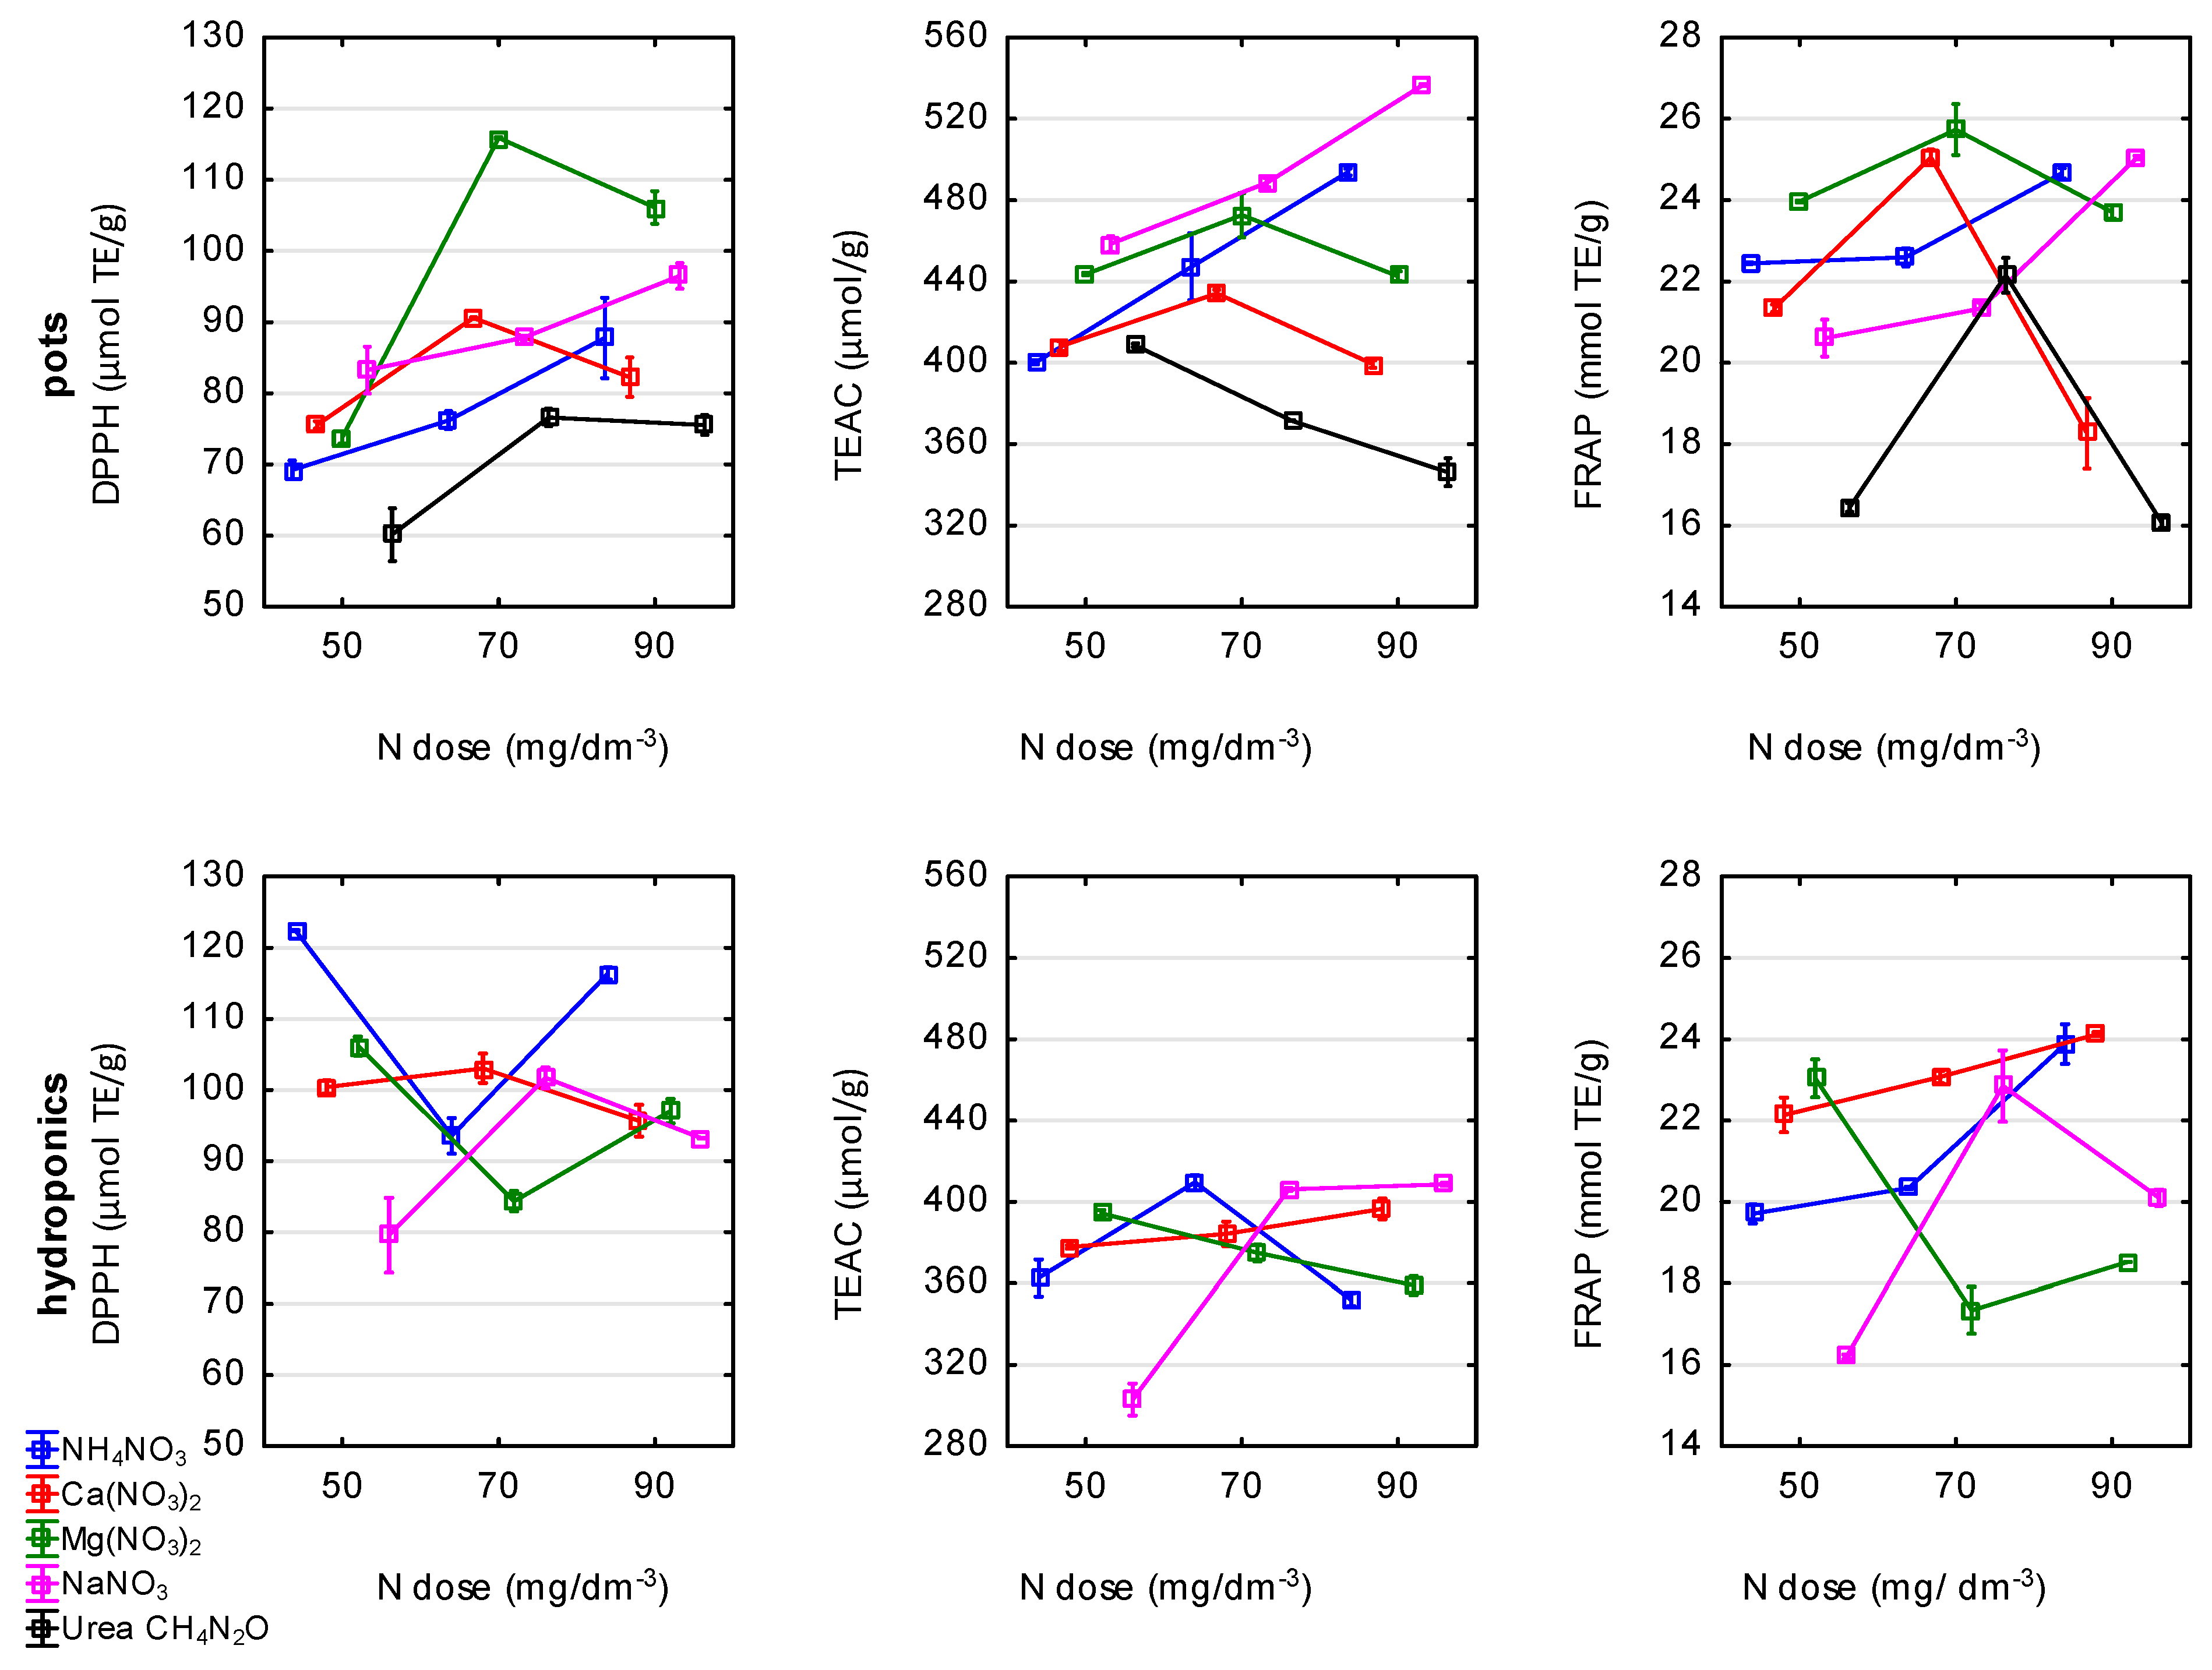
3.5. Phenolic Content and the Antioxidant Activity

The effects of N levels and N sources (fertilisers) on the antioxidant capacity, total phenolic content, and total flavonoid content of flowering Chinese cabbage are shown in Figure 2 and Table S3 (Supplementary Materials).
Both effects (N level and N source) were statistically significant for all parameters in the pot and hydroponic cultivation systems (Table S1, Supplementary Materials).
In hydroponics, the DPPH scavenging activity of the samples was higher, while the TEAC, FRAP, TPC and TFC values were lower in comparison to the samples from pot cultivation (Figure 3). In pot cultivation, irrespective of the N dose, the DPPH, FRAP, TPC and TFC values were the highest in the samples treated with Mg(NO3)2, whereas the TEAC values were the highest in the sample treated with NaNO3. The maximum DPPH scavenging activity was 115.8 µmol/g in the sample after the Mg(NO3)2 treatment at N-70 and the TEAC was 536.69 µmol/g in the plant after the NaNO3 treatment at N-90.
Different conclusions can be drawn from the results obtained in hydroponic cultivation as the maximum values of the DPPH and TEAC scavenging activity were 122.41 µmol/g DW and 409.51 µmol/g of DW, respectively, both after the NH4NO3 treatment. The highest FRAP was noted for Ca(NO3)2 at N-90 (24.12 mmol TE/g).
The maximum individual value of the TFC value was observed in hydroponics for the samples fertilised with NaNO3 (1.43 mg/g).

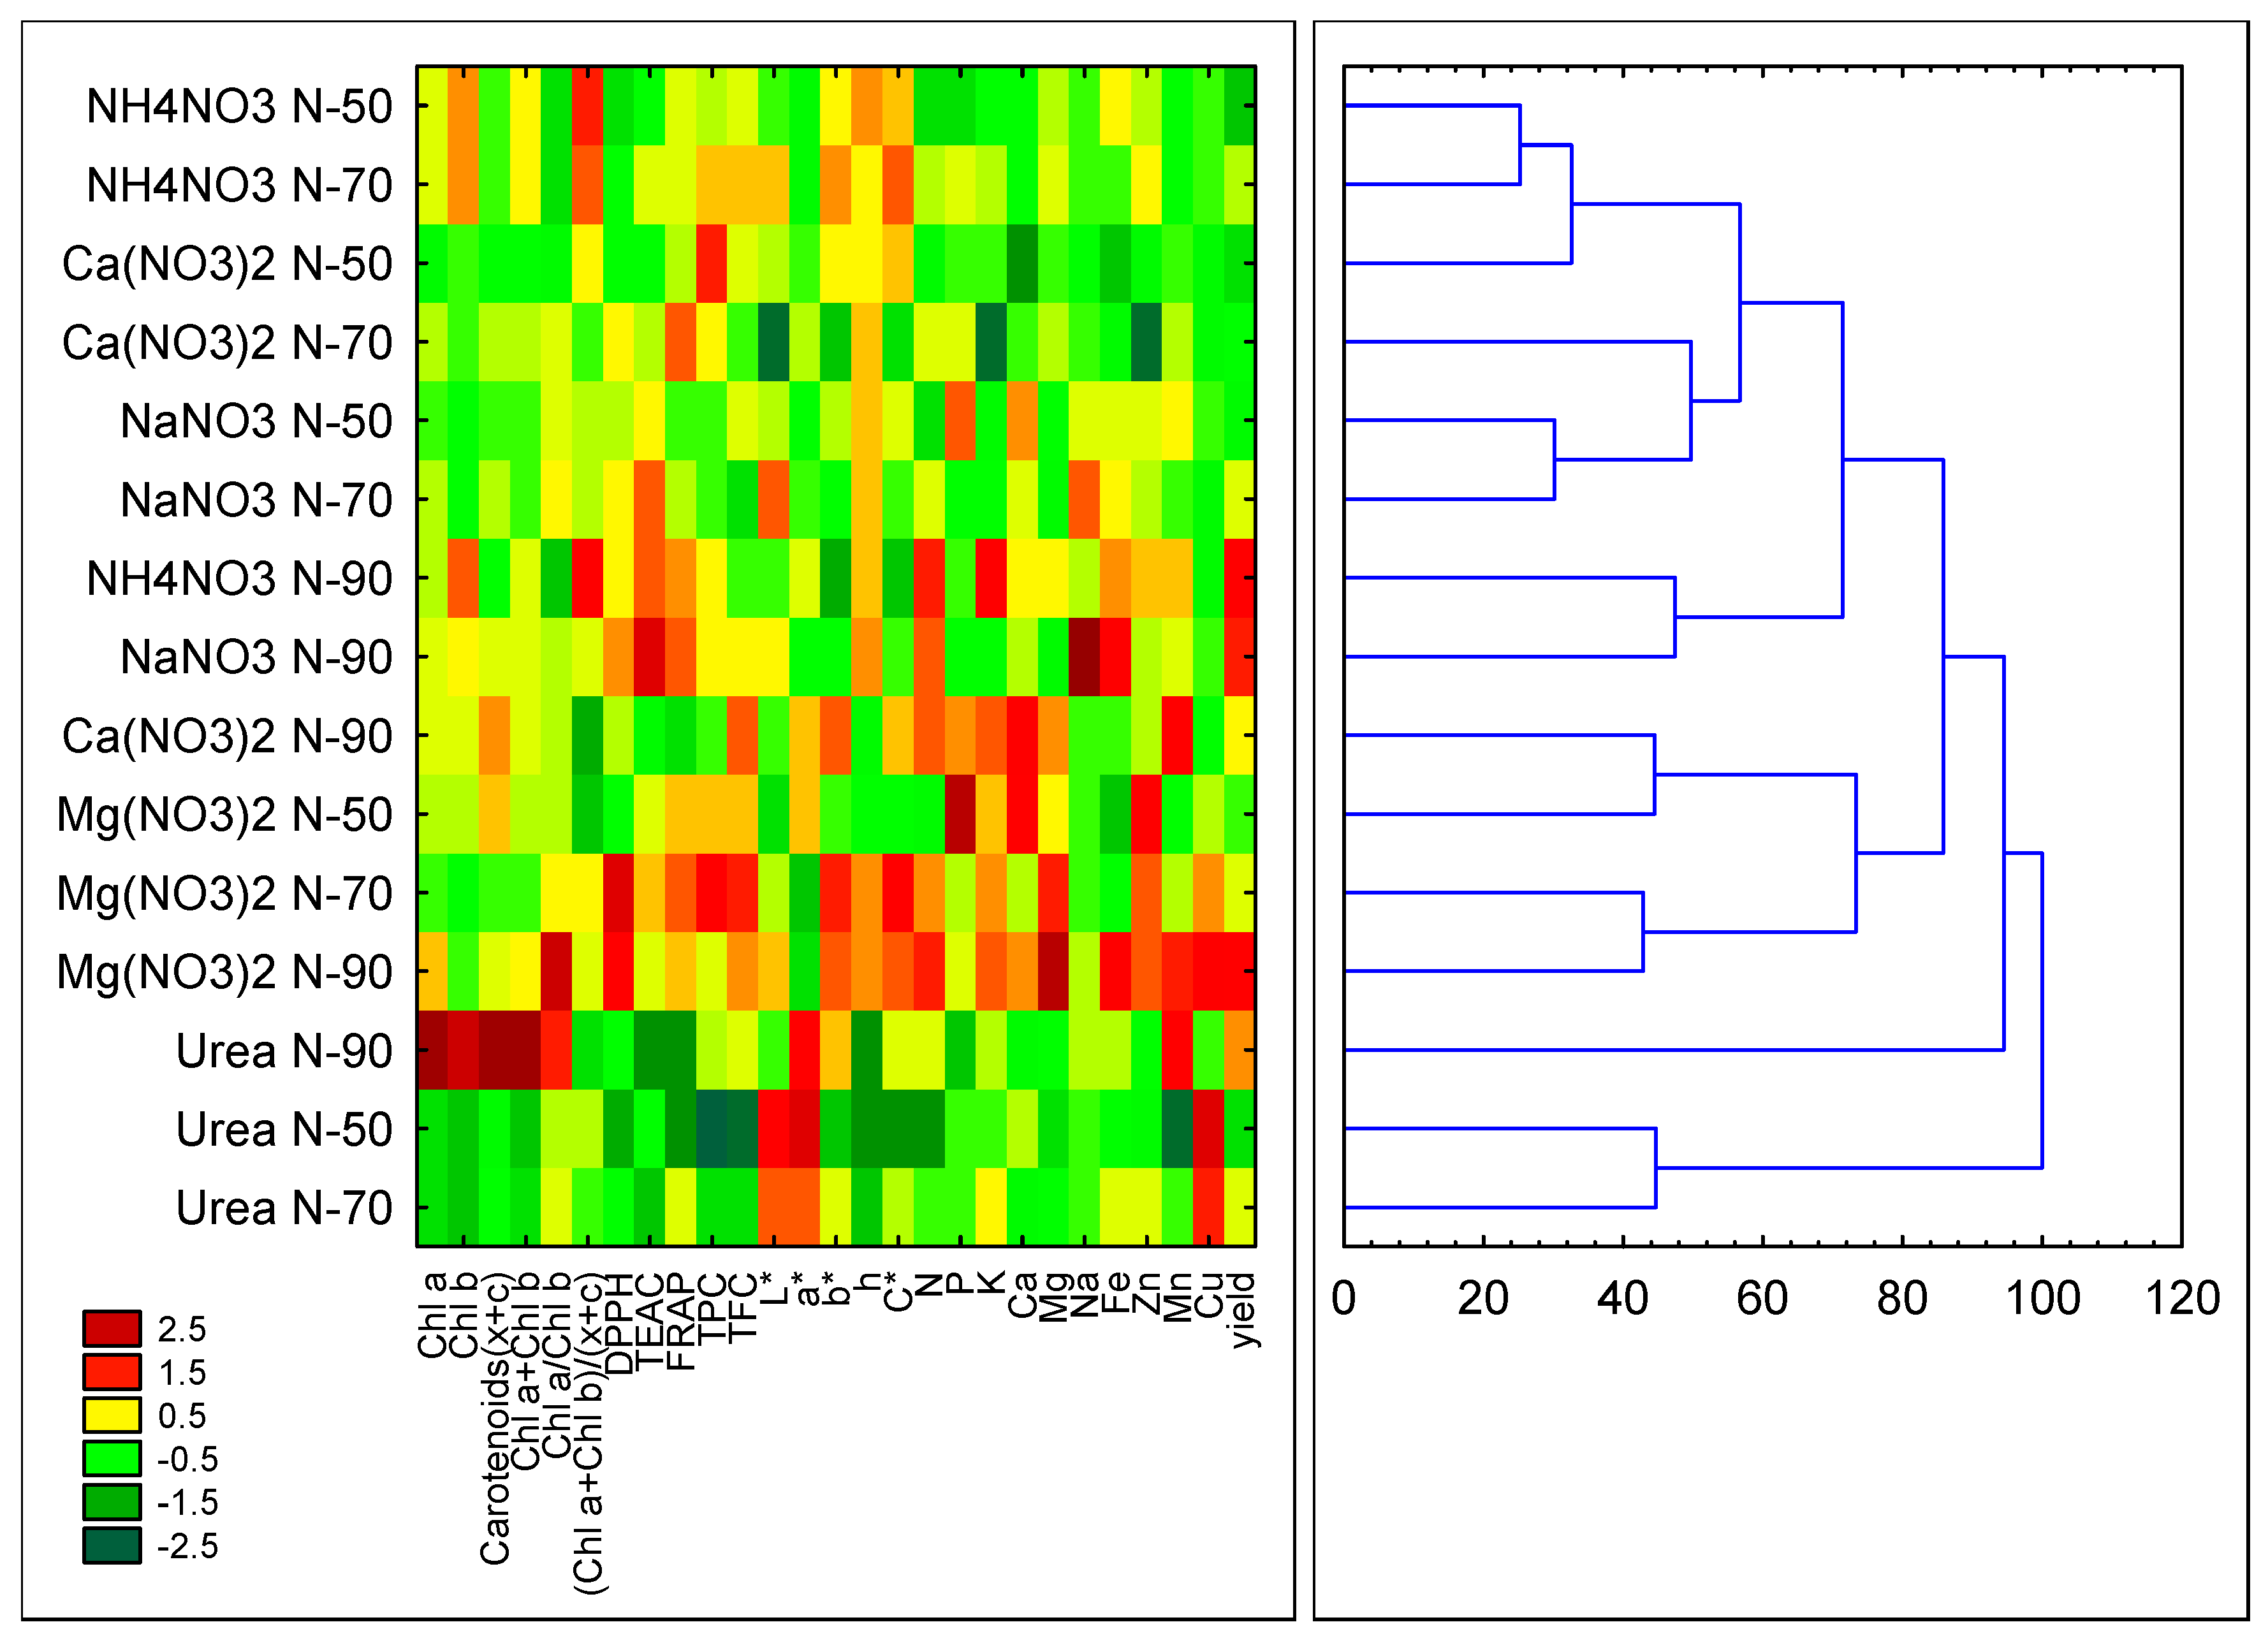
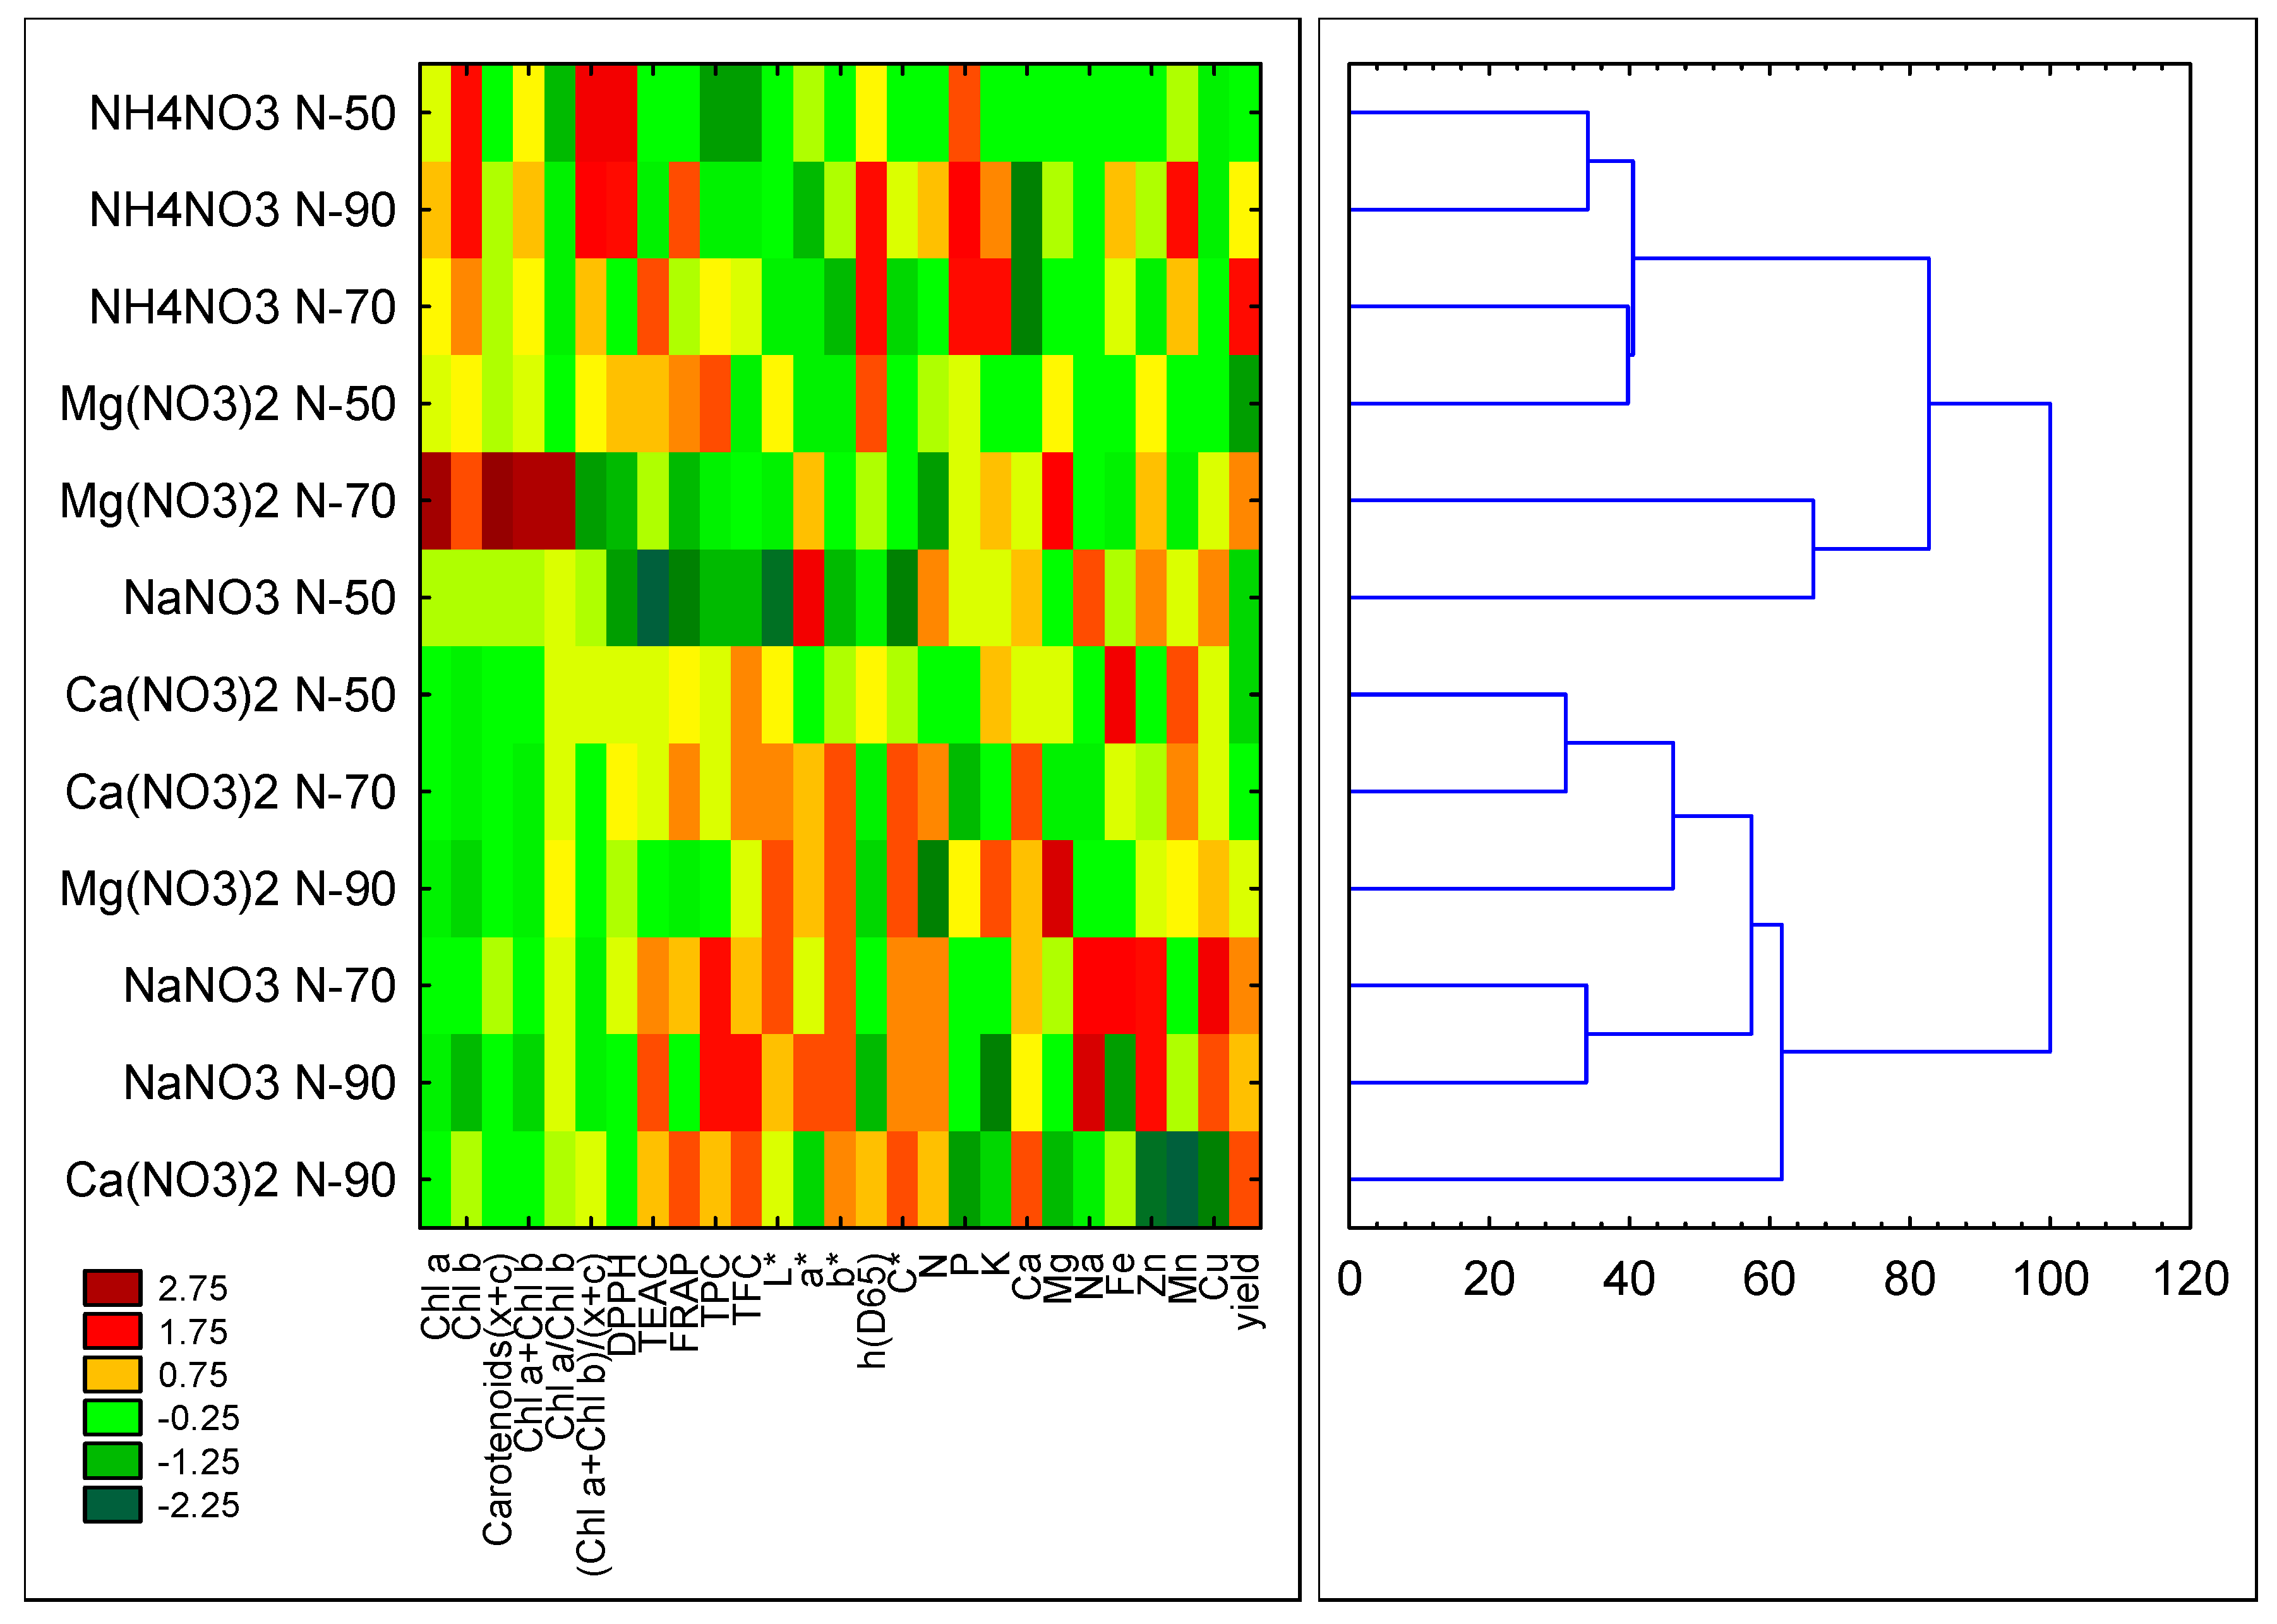
3.6. Cluster Analysis

The effects of both the source of nitrogen and the nitrogen level were generally significant for the quality parameters of flowering Chinese cabbage. However, there is no clear answer as to which form of nitrogen supply offered the best results as the maximum values of quality parameters were observed for different nitrogen sources. Thus, a multivariate analysis in the form of cluster analysis was performed in order to better understand the dataset. The results are shown in Figure 4 and Figure 5. Before clustering, all data were standardised within the cultivation system group.
Based on the results from the cluster analysis, it can be concluded that the dataset could be divided into six distinct groups in the pot system (dendrogram in Figure 4) and three distinct groups in the hydroponic system (dendrograms in Figure 5) at a 70% distance using all the parameters tested as shown in the heatmaps in Figure 4 and Figure 5. Distinct groups are shown in Table 5.
In the pot system, the first cluster consisted of the plants treated with urea at N-90 with high pigment contents (chlorophylls and carotenoids) and a high a* colour coordinate value. The second cluster consisted of the samples fertilised with magnesium nitrate at the N-70 and N-90 doses, showing high DPPH activity and b*, h and C colour parameters as well as N, Zn and Cu contents. The third cluster consisted of the plants fertilised with calcium nitrate at N-90 and magnesium nitrate at N-50, showing a high Ca content and high or moderate P and K contents. The samples treated with urea at N-90 showing high pigment contents (chlorophylls and carotenoids) and a high a* colour coordinate value were in the fourth cluster. The fifth cluster consisted of the samples with the N-90 dose of ammonium and sodium nitrates. Those plants had high DPPH and TEAC activity and high N content and yield. The samples fertilised with the N-50 and N-70 doses of ammonium, sodium and calcium nitrates, all with low levels of all the parameters tested, were in the sixth cluster.
In the hydroponic system, the first cluster was magnesium nitrate at N-50 and ammonium nitrate (all doses) with high or moderate pigment and P contents. The second cluster was calcium nitrate (all doses), sodium nitrate at the N-70 and N-90 doses and magnesium nitrate at N-90. Those plants had moderate or high TEAC and FRAP activities and phenolic content as well as moderate colour parameter values and N content. Finally, the third cluster was N-70 magnesium nitrate and N-50 sodium nitrate with low antioxidant activity and phenolic content.

4. Discussion

The effect of nitrogen sources had also previously been studied on Chinese Cabbage [25]. Ammonium nitrate, ammonium sulphate, calcium nitrate, ENTEC 26 and urea were tested by pre-seeding (150 kg N per ha) or split application (100 + 50 kg N per ha). The highest total yield of Chinese cabbage was found when urea was applied, which is in contrast to the results showed in this study. It was previously reported that the increase in the intensity of N nutrition significantly affected the yield of broccoli [26]. Although others have indicated that the N rate does not significantly improve the cabbage yield, it was observed that cabbage fertilised with the lowest N rate (196 kg·ha−1) had the lowest yield value [27]. The correlation analysis of our results indicated that the yield of flowering Chinese cabbage was significantly correlated with the N content in the plants from pots (r = 0.87, p < 0.05). Such a correlation was not observed in hydroponics.
The increase in yield may be due to improved functioning of biochemical processes, including photosynthesis [28]. In previous studies, a strong relationship between increasing N content in plant tissues of leaves, leaf chlorophyll concentration and photosynthesis was found [29,30]. However, in our study, the correlations between the yield and chlorophylls, as well as between the yield and the N content were statistically insignificant.
As previously reported, the highest yields of flowering Chinese cabbage were achieved with N-90 ammonium nitrate [3,4]. Similar results were observed in the present study for the pot cultivation system. However, the plants grown hydroponically had the highest yield at the N-70 dose of ammonium nitrate. Plant species are usually quite sensitive to excessive ammonium concentrations in the root zone when cultivated hydroponically in rockwool. The recommended doses of ammonium for hydroponic crops are lower (<14 mg N—NH4·dm3) than those used in our study for N-90 of NH4NO3 (45 mg N—NH4·dm3). In spite of that, there was no visual effect of NH4+ toxicity on the plants in the case of the highest dose of that fertiliser. This demonstrates the relatively high tolerance of this species to ammonium when grown hydroponically. The excessive ammonium concentration (high proportion of ammonium to nitrate, i.e., 75 to 25) reduced the biomass of flowering Chinese cabbage. At the ratio of 25% of ammonium to nitrate, the best balance between the plants’ biomass and nutrient uptake was observed [31]. In our study, although the yield was lower at the N-90 dose than at the N-70 dose of NH4NO3, the plant biomass was satisfactory. It had been previously observed that high N nutrition (above the N-90 dose) had no positive effect or even reduced the yield of flowering Chinese cabbage [4]. In field cultivation, the efficiency of applied nitrogen fertilisation is about 40–50%. According to Xie et al. [5], the optimal N dose for purple Chinese cabbage was 440–490 kg/ha (i.e., 220–245 mg·dm−3). In the case of soilless cultivation, as in this study, the yields achieved were satisfactory, in terms of both quantity and quality, with the application of almost three times lower doses. This could indicate the importance of hydroponic cultivation of plants for environmental protection as fertilisation can be significantly reduced in this system.
Most plant species are quite sensitive to excessive sodium concentrations in the root zone [32,33]. What is particularly interesting is that the application of NaNO3 as an N source, regardless of the type of cultivation, did not significantly reduce plant yields in comparison to other N fertilisers. Along with this fertiliser, relatively high doses of sodium were introduced, which could indicate a rather high tolerance of flowering Chinese cabbage to sodium, which is the novelty of our study.
In this study, the nutrient content in the aboveground parts of flowering Chinese cabbage varied depending on the influence of different N sources. Moreover, the nitrogen content determined for the hydroponically grown plants was higher than that of the pot-grown plants. A possible reason for this was sorption of the nutrient in the substrate. Krężel and Kołota [25] reported that the type of nitrogen fertiliser and the technique of application had little or no effect on the levels of P, K, Mg and Ca in Chinese cabbage cultivation. Others [34] found that leaf N concentration increased with the N rate, but was not affected by the N source or harvest date. In this study, differences in the N content were evident with an increasing N level and varying N sources as well, especially in the hydroponic system. N significantly impacts the amount of RuBisCO and photosynthesis [35,36]. Since Calvin cycle proteins and thylakoids provide the majority of nitrogen in leaves, there is a relationship between the N content and leaf photosynthesis [36]. The amount of CO2 fixed per unit of leaf N is defined as the ratio of net photosynthesis to the leaf N content, which varies as a function of the leaf N content [37,38].
Considering other nutrients, Obreza and Vavrina [34] reported that concentrations of P, Ca and Mg in mature Chinese cabbage wrapper leaves increased with an increasing N rate, while the leaf K concentration decreased. In our study, the effect of nitrogen on nutrients was quite different as a decrease in P and an increase in K, Ca and Mg were observed for substrate cultivation, while for hydroponic cultivation, the contents of P, K and Mg decreased with an increase in the level of N derived from NaNO3 and Ca(NO3)2. In hydroponics, the correlation coefficients between the levels of N and K in plants and between N and Mg were statistically significant. They were as follows: r (N vs. K) = −0.624 (p = 0.03) and r (N vs. Mg) = −0.838 (p = 0.001). For the pot-cultivated samples, a statistically significant correlation was observed only between N and Mg (r = 0.553, p = 0.032). According to Mulder’s chart [39], N has an negative effect on the K and Cu uptake and a positive effect on Mg. This is partly consistent with our results (for the relationship between N and K in pots and the relationship between N and Mg in hydroponics).
In previous studies [4], antagonism between N and Cu was observed for substrate cultivation, which was not the case in this study. In hydroponics, a positive impact of the N dose on Fe, Zn and Cu has been reported [4]. This study observed a significant effect of N on the Fe level in pots (r = 0.551, p = 0.033) as well as a significant effect of N on Mn (r = 0.693, p = 0.004). Smoleń and Sady [40] stated that the application of NH4NO3 led to a significant increase in the content of Fe in red cabbage. Ai et al. [41] found that Cu and Mn concentrations in the aboveground tissues of Bothriochloa ischaemum increased significantly with N addition. The determined trends of changes in the Fe, Mn and Cu contents may vary with N nutrition intensity [42] as observed in this study.
Generally, the highest macronutrient content in plants grown in the pot cultivation system was determined under treatment with magnesium nitrate, especially at N-70 and N-90 (Figure 4). Simultaneously, when magnesium nitrate was used as a supply of nitrogen, the Mg dose also increased (balancing was performed for N). The beneficial impact of magnesium nutrition on plant production has also been shown in numerous other plant species [15,43]. Mg is a crucial macroelement for the growth and development of plants. It plays an important role in various metabolic functions, such as photosynthesis and enzyme activation. The application of Mg fertilisers can have a positive impact on the levels of other macro- and microelements in plants, including N, P, K, Fe, Mn, Zn and Cu (according to Mulder’s chart). In the study by Geng et al. [44], it was shown that Mg fertilisation increased the levels of N and P in plant seeds, which is consistent with our results. The authors found that Mg nutrition improves the Mg status of plants by significantly affecting the seed yield, seed quality, seed vigour (germination) and increasing the nitrogen and phosphorus uptake in oilseed rape plants. In our study, fertilisation with magnesium nitrate resulted in a positive effect of Mg on the N, K, Mg, Na, Fe, Mn and Cu contents and a negative effect on the P and Ca contents in the substrate system. However, statistically significant correlations were revealed only between Mg and N (r = 0.553, p = 0.032), Mg and K (r = 0.541, p = 0.37) and Mg and Zn (r = 0.515, p = 0.05) in the pot system. In the case of hydroponics, Mg had a negative effect on N (significant correlation) and a positive one on P, K, Ca, Mg, Mn and Cu in Chinese cabbage. In general, it can be assumed that the effect of nitrogen nutrition on the content of nutrients in plants can vary, and the relationships may be different for different plant species [45,46,47].
When calcium nitrate was used as a source of nitrogen, the rate of Ca (balancing for N) increased at the same time. According to Mulder’s chart, Ca has a negative effect on the uptake of P, K, Mg, Fe, Mn, Zn and Cu. In our study, the effects were different depending on the cultivation system, namely an increase in the Mg, Fe and Mn contents for the plants grown in pots and a decrease in the P, K, Mg, Fe, Mn, Zn and Cu contents for the plants grown hydroponically.
Kim et al. [12] indicated an increase in the content of such nutrients as P, K, Mg, Ca, and S in the leaves of pepper under increasing concentrations of urea. Such an effect was not found in our study in pot cultivation. Obreza and Vavrina [34] observed that Ca and Mg concentrations were the lowest after the application of urea as the only N source. In our study, the reducing effect of urea on the N, P, Ca, Mg and Na contents of Chinese cabbage was confirmed in comparison to the other N forms when plants were grown in pots. The pigment contents (chlorophylls and carotenoids) could be related to the nitrogen doses, but the final response could vary depending on the season and type of cultivation of flowering Chinese cabbage [4]. In our study, in the pot cultivation system, the highest chlorophylls and carotenoids levels were obtained in the samples treated with urea at the N-90 dose, in the hydroponic system—in the samples treated with magnesium nitrate at the N-70 dose. However, in pot cultivation, the pigment content was not correlated with the colour parameters (L*a*b*), whereas in the hydroponic system, Chl b correlated with L* (r = −0.65, p = 0.02) and b* (r = −0.72, p = 0.01). Generally, the pigment content in the pot system positively correlated with the content of Mn in the leaves, the microelement which is involved in the process of photosynthesis [48]. Wang et al. [49] reported that the application of different N levels could affect pigment contents in crops, including Chl a and Chl b. It is well-documented in the literature that Chl a and Chl b are crucial pigments involved in the photosynthesis process in plants, and the optimal pigment contents can lead to better growth and yield [50,51,52]. In a study by Hassama et al. [53] who tested different nitrogen forms in nutrient solutions (monoammonium phosphate, potassium nitrate, calcium nitrate, ammonium sulphate, ammonium nitrate, urea and monosodium glutamate), it was reported that ammonium nitrate (151.277 mg/L) can increase Chl a and Chl b while urea (113.502 mg/L) can increase carotenoids and xanthophylls. Furthermore, Vinale et al. [54] found that the application of N concentration (ranging from 0 up to 12.6 mg/L) and N sources (Ca(NO3)2, KNO3, CH4N2O) differentially affected the concentrations of photosynthetic pigments and biomolecules in Mexican marigold (Tagetes erecta L.) in a hydroponic system. Chl a, b and total chlorophylls increased by 98.8, 11.9 and 56.6%, respectively, with the N dose of 8.4 mg/L [54].
The highest antioxidant activity and phenolic content were obtained in the samples from the pot system treated with magnesium nitrate at high N doses (N-70 and N-90) as well as with ammonium and sodium nitrates at the N-90 dose. The results correlated with the level of nitrogen and the yield of the plant, which is similar to our previous findings [4]. In the hydroponic system, the highest DPPH activity was observed after the treatment with sodium nitrate at the N-70 and N-90 doses. Olarewaju et al. [55] concluded that the combined use of organic manure and a urea fertiliser led to enhanced antioxidant activity in three vegetables (Solanum macrocarpon L., Amaranthus viridis L. and Telfairia occidentalis f. Hooke). Urea application can also improve the growth, chlorophyll contents and antioxidant activity of ramie (Boehmeria nivea L.). Others [56] reported that the contents of hydrophilic antioxidant compounds (vitamin C and total phenols) as well as the antioxidant activity (DPPH and FRAP) in tomato (Solanum lycopersicum var. Sheva) increased as the dose of urea was decreased. This is in contrast to our results, in which the TPC and TFC values increased with an increasing urea N dose. However, at the same time, this is in agreement with our results on antioxidant activity, in which the TEAC radical scavenging activity of the samples in pot cultivation decreased significantly as the N level increased from N-50 to N-70.
The levels of antioxidant compounds were affected by different nitrogen forms. Jalloh et al. [57] compared four types of fertilisers, i.e., urea, Ca(NO3)2, (NH4)2SO4 (ammonium sulfate) and an organic fertiliser, in terms of the oxidative status of rice plants in response to the oxidative stress caused by Cd. The results showed higher antioxidant levels in the plant treated with urea and ammonium sulphate compared to Ca(NO3)2 and the organic fertiliser.
Regarding the total phenolic compounds, Olarewaju et al. [55] pointed out that the total polyphenol (510.70–521.50 mg GAE/g) and total flavonoid (609.51–742.50 mg rutin equivalent/g) contents were reduced when the dose of urea (CH4N2O) increased. On the contrary, in our experiment, when the urea (CH4N2O) level increased from N-50 to N-90, the levels of TPC and TFC increased. Qadir et al. [58] stated that an increased NH4NO3 supply reduced the contents of phenolic compounds from 154 to 22 mg per 100 g−1 FW in lettuce (Lactuca sativa L.) from a hydroponic system. In our experiment, the N-70 dose of NH4NO3 resulted in a higher level of the TPC than the N-50 dose of NH4NO3. Increasing the N level to the N-90 dose, no significant increase in the TPC was observed.

5. Conclusions

The purpose of this study was to determine the effects of different N sources and increased N supply on the yield and certain biochemical properties of flowering Chinese cabbage grown in two different cultivation systems (substrate and hydroponics). The factors studied had significant and multidirectional effects on the yield, growth and quality of plants. In general, the plants grown in hydroponic systems were characterised by higher yields than the plants grown in pots. Increasing levels of N nutrition significantly increased the average yield of the plants grown in pots, while in hydroponics, the average yields at N-70 were comparable to these at N-90. The nitrogen source modified plant nutrition in terms of N, P, K, Ca, Mg, Na, Fe, Mn, Zn and Cu. For the pot cultivation system, the highest pigment contents (chlorophylls and carotenoids) were obtained in the samples treated with urea at the N-90 dose which correlated with the Mn level in the plants. However, in pot cultivation, the pigment content did not correlate with the colour parameters (L*a*b*). In the hydroponic system, the highest pigment contents were in the samples treated with magnesium nitrate at the N-70 dose. Moreover, Chl b correlated with L* and b*. The highest antioxidant activity and phenolic content were obtained in the samples from the pot system treated with magnesium nitrate at high N doses (N-70 and N-90), as well as with ammonium and sodium nitrates at the N-90 dose. In the hydroponic systems, the highest DPPH (2,2-diphenyl-1-picrylhydrazyl) activity was observed after treatment with sodium nitrate at the N-70 and N-90 doses. In our experiment, with the exception of the TEAC (Trolox equivalent antioxidant capacity) activity in the urea treatment, the DPPH and TEAC scavenging of the samples in pot cultivation increased significantly as the N level increased from N-50 to N-70. The obtained results confirmed the research hypothesis.
In conclusion, both the intensity of N nutrition and the fertiliser applied can significantly modify the yield of plants and their quality parameters. For pot cultivation, the most effective fertiliser was Mg(NO3)2 at the N-70/N-90 doses, while for hydroponic cultivation, it is difficult to indicate the most effective fertiliser as the responses varied depending on fertilisation.

Supplementary Materials

The following supporting information can be downloaded at: https://www.mdpi.com/article/10.3390/app13095691/s1, Table S1. Two-way ANOVA of yielding and the chemical composition of flowering Chinese cabbage grown under various N nutrition sources and intensity. Table S2. Colour coordinates of flowering Chinese cabbage cultivated under various N nutrition sources. Table S3. Antioxidant activity (DPPH, TEAC (ABTS), FRAP) and phenolic content (TPC—total phenolic content and TFC—total flavonoid content) of flowering Chinese cabbage cultivated under various N nutrition sources.

Author Contributions

Conceptualisation, T.K. and W.L.; methodology, T.K. and M.M.-P.; investigation, W.L.; formal analysis, M.M.-P., T.K. and W.L.; visualisation, M.M.-P., T.K. and W.L.; writing—original draft preparation, T.K., M.M.-P. and W.L.; writing—review and editing, M.M.-P. and T.K.; supervision, T.K. and M.M.-P.; project administration, T.K.; funding acquisition, T.K. All authors have read and agreed to the published version of the manuscript.

Funding

The study was financed by programme “Maintaining research potential” financed by the Ministry of Science and Higher Education. The publication was co-funded under programme “Regional Initiative Excellence” of the Ministry of Science and Higher Education in the years 2019–2023 (No. 005/RID/2018/19), with financing in the amount of PLN 1,200,000.

Institutional Review Board Statement

Not applicable.

Informed Consent Statement

Not applicable.

Data Availability Statement

All data generated or analysed during this study are available from the corresponding author upon reasonable request.

Conflicts of Interest

The authors declare no conflict of interest. The founding sponsors had no role in the design of the study; in the collection, analyses, or interpretation of data; and in the writing of the manuscript or the decision to publish the research results.

References

  1. Li, G.; Zhang, H.; Huang, H.; Qiao, Y.; Zheng, Y. Research Progress on Flowering Chinese Cabbage Breeding in Guangdong Province. China Veg. 2011, 20, 9–14. [Google Scholar]
  2. Yuan, Y.; Xianyu, Z.; Guangguang, L.; Yansong, Z.; Ding, J.; Hailong, R.; Jianjun, L.; Hua, Z. Comprehensive Evaluation and Comparison of Nutritional Values of Amino Acids of Chinese Flowering Cabbage and Related Subspecies Vegetables. Food Ferment. Ind. 2019, 45, 102–107. [Google Scholar] [CrossRef]
  3. Liu, W.; Muzolf-Panek, M.; Kleiber, T. The Effect of Various Foliar Treatments and Nitrogen Nutrition Levels on the Yield and Physicochemical Parameters of Flowering Chinese Cabbage. Agronomy 2022, 12, 737. [Google Scholar] [CrossRef]
  4. Liu, W.; Muzolf-Panek, M.; Kleiber, T. Effect of Nitrogen Nutrition and Planting Date on the Yield and Physicochemical Parameters of Flowering Chinese Cabbage. Agronomy 2022, 12, 2869. [Google Scholar] [CrossRef]
  5. Xie, J.; Nie, J.; Liao, Y.; Huang, S.; Tang, J. Effects of Different Nitrogen Fertilizer Rates on Yield and Quality of Brassica compestris L. Var. Purpurea Bailey. Hunan Agric. Sci. 2011, 239, 70–76. [Google Scholar]
  6. Peng, X.; Liu, H.; Sun, G. The Effects of Different Controlled-Release Nitrogen Fertilizers on Yield and Quality of Flowering Chinese Cabbage. China Veg. 2006, 8, 16–18. [Google Scholar]
  7. Li, G.; He, Y.; Xu, Y. Study on the Factors of Influencing the Yield and Quality of Purple- Caitai. Hubei Agric. Sci. 2009, 48, 348–351. [Google Scholar]
  8. Ji, S.; Liu, Z.; Liu, B.; Wang, Y.; Wang, J. The Effect of Trichoderma Biofertilizer on the Quality of Flowering Chinese Cabbage and the Soil Environment. Sci. Hortic. 2020, 262, 109069. [Google Scholar] [CrossRef]
  9. Boschiero, B.N.; Mariano, E.; Torres-Dorante, L.O.; Sattolo, T.M.S.; Otto, R.; Garcia, P.L.; Dias, C.T.S.; Trivelin, P.C.O. Nitrogen Fertilizer Effects on Sugarcane Growth, Nutritional Status, and Productivity in Tropical Acid Soils. Nutr. Cycl. Agroecosyst. 2020, 117, 367–382. [Google Scholar] [CrossRef]
  10. Zhu, Y.; Qi, B.; Hao, Y.; Liu, H.; Sun, G.; Chen, R.; Song, S. Appropriate NH4+/NO3 Ratio Triggers Plant Growth and Nutrient Uptake of Flowering Chinese Cabbage by Optimizing the pH Value of Nutrient Solution. Front. Plant Sci. 2021, 12, 656144. [Google Scholar] [CrossRef]
  11. Elrys, A.S.; Abdo, A.I.E.; Desoky, E.S.M. Potato Tubers Contamination with Nitrate under the Influence of Nitrogen Fertilizers and Spray with Molybdenum and Salicylic Acid. Environ. Sci. Pollut. Res. 2018, 25, 7076–7089. [Google Scholar] [CrossRef]
  12. Kim, H.N.; Seok, Y.J.; Park, G.M.; Vyavahare, G.; Park, J.H. Monitoring of Plant-Induced Electrical Signal of Pepper Plants (Capsicum annuum L.) According to Urea Fertilizer Application. Sci. Rep. 2023, 13, 291. [Google Scholar] [CrossRef]
  13. Hariadi, Y.; Shabala, S. Screening broad beans (Vicia faba) for magnesium deficiency. II. Photosynthetic performance and leaf bioelectrical responses. Funct. Plant Biol. 2004, 31, 539–549. [Google Scholar] [CrossRef] [PubMed]
  14. Hauer-Jákli, M.; Tränkner, M. Critical Leaf Magnesium Thresholds and the Impact of Magnesium on Plant Growth and Photo-Oxidative Defense: A Systematic Review and Meta-Analysis from 70 Years of Research. Front. Plant Sci. 2019, 10, 766. [Google Scholar] [CrossRef]
  15. Liu, X.; Hu, C.; Liu, X.; Riaz, M.; Liu, Y.; Dong, Z.; Tan, Q.; Sun, X.; Wu, S.; Tan, Z. Effect of Magnesium Application on the Fruit Coloration and Sugar Accumulation of Navel Orange (Citrus sinensis Osb.). Sci. Hortic. 2022, 304, 111282. [Google Scholar] [CrossRef]
  16. Jayawardana, B.C.; Warnasooriya, V.B.; Thotawattage, G.H.; Dharmasena, V.A.K.I.; Liyanage, R. Black and Green Tea (Camellia sinensis L.) Extracts as Natural Antioxidants in Uncured Pork Sausages. J. Food Process. Preserv. 2019, 43, e13870. [Google Scholar] [CrossRef]
  17. White, P.J.; Broadley, M.R. Calcium in Plants. Ann. Bot. 2003, 92, 487–511. [Google Scholar] [CrossRef]
  18. IUNG. Analytical Methods in Agricultural Chemistry Stations; IUNG: Puławy, Poland, 1972; pp. 25–83. [Google Scholar]
  19. Lichtenthaler, H.K.; Buschmann, C.; Knapp, M. How to Correctly Determine the Different Chlorophyll Fluorescence Parameters and the Chlorophyll Fluorescence Decrease Ratio RFd of Leaves with the PAM Fluorometer. Photosynthetica 2005, 43, 379–393. [Google Scholar] [CrossRef]
  20. Singleton, V.L.; Rossi, J.A. Colorimetry of Total Phenolics with Phosphomolybdic-Phosphotungstic Acid Reagents. Am. J. Enol. Vitic. 1965, 16, 144–158. [Google Scholar] [CrossRef]
  21. Re, R.; Pellegrini, N.; Proteggente, A.; Pannala, A.; Yang, M.; Rice-Evans, C. Antioxidant Activity Applying an Improved ABTS Radical Cation Decolorization Assay. Free Radic. Biol. Med. 1999, 26, 1231–1237. [Google Scholar] [CrossRef]
  22. Ozgen, M.; Reese, R.N.; Tulio, A.Z.; Scheerens, J.C.; Miller, A.R. Modified 2,2-Azino-Bis-3-Ethylbenzothiazoline-6-Sulfonic Acid (ABTS) Method to Measure Antioxidant Capacity of Selected Small Fruits and Comparison to Ferric Reducing Antioxidant Power (FRAP) and 2,2′-Diphenyl-1-Picrylhydrazyl (DPPH) Methods. J. Agric. Food Chem. 2006, 54, 1151–1157. [Google Scholar] [CrossRef]
  23. Sánchez-Moreno, C.; Larrauri, J.A.; Saura-Calixto, F. A Procedure to Measure the Antiradical Efficiency of Polyphenols. J. Sci. Food Agric. 1998, 76, 270–276. [Google Scholar] [CrossRef]
  24. Benzie, I.F.F.; Strain, J.J. The Ferric Reducing Ability of Plasma (FRAP) as a Measure of “Antioxidant Power”: The FRAP Assay. Anal. Biochem. 1996, 76, 70–76. [Google Scholar] [CrossRef]
  25. Krężel, J.; Kołota, E. Response of Chinese Cabbage Grown in the Spring Season to Differentiated Forms of Nitrogen Fertilisation. Folia Hortic. 2011, 23, 55–59. [Google Scholar] [CrossRef]
  26. Yildirim, E.; Cil, B.; Ekinci, M.; Turan, M.; Dursun, A.; Gunes, A.; Kul, R.; Kitir, N. Effects of Intercropping System and Nitrogen Fertilization on Land Equivalent Ratio, Yield and Mineral Content of Broccoli. Acta Sci. Pol. Hortorum Cultus 2020, 19, 101–109. [Google Scholar] [CrossRef]
  27. Coolong, T.; Cassity-Duffey, K.; da Silva, A.L.B.R. Influence of Nitrogen Rate, Fertilizer Type, and Application Method on Cabbage Yield and Nutrient Concentrations. Horttechnology 2022, 32, 134–139. [Google Scholar] [CrossRef]
  28. Bassi, D.; Menossi, M.; Mattiello, L. Nitrogen Supply Influences Photosynthesis Establishment along the Sugarcane Leaf. Sci. Rep. 2018, 8, 2327. [Google Scholar] [CrossRef] [PubMed]
  29. Hikosaka, K.; Osone, Y. A Paradox of Leaf-Trait Convergence: Why Is Leaf Nitrogen Concentration Higher in Species with Higher Photosynthetic Capacity? J. Plant Res. 2009, 122, 245–251. [Google Scholar] [CrossRef]
  30. Chen, L.S.; Cheng, L. Carbon Assimilation and Carbohydrate Metabolism of “Concord” Grape (Vitis Labrusca L.) Leaves in Response to Nitrogen Supply. J. Am. Soc. Hortic. Sci. 2003, 128, 754–760. [Google Scholar] [CrossRef]
  31. Song, S.; Yi, L.; Zhu, Y.; Liu, H.; Sun, G.; Chen, R. Effects of Ammonium and Nitrate Ratios on Plant Growth, Nitrate Concentration and Nutrient Uptake in Flowering Chinese Cabbage. Bangladesh J. Bot. 2017, 46, 1259–1267. [Google Scholar]
  32. Tester, M.; Davenport, R. Na+ Tolerance and Na+ Transport in Higher Plants. Ann. Bot. 2003, 91, 503–527. [Google Scholar] [CrossRef]
  33. Maathuis, F.J.M. Sodium in Plants: Perception, Signalling, and Regulation of Sodium Fluxes. J. Exp. Bot. 2014, 65, 849–858. [Google Scholar] [CrossRef]
  34. Obreza, T.A.; Vavrina, C.S. Production of Chinese Cabbage in Relation to Nitrogen Source, Rate, and Leaf Nutrient Concentration. Commun. Soil Sci. Plant Anal. 1993, 24, 1465–1479. [Google Scholar] [CrossRef]
  35. Evans, J.R.; Terashima, I. Photosynthetic Characteristics of Spinach Leaves Grown with Different Nitrogen Treatments. Plant Cell Physiol. 1988, 29, 157–165. [Google Scholar]
  36. Evans, J.R. Photosynthesis and Nitrogen Relationships in Leaves of C 3 Plants. Oecologia 1989, 78, 9–19. [Google Scholar] [CrossRef] [PubMed]
  37. Poorter, H.; Evans, J.R. Photosynthetic Nitrogen-Use Efficiency of Species That Differ Inherently in Specific Leaf Area. Oecologia 1998, 116, 26–37. [Google Scholar] [CrossRef]
  38. Dreccer, M.F.; Schapendonk, A.H.C.M.; van Oijen, M.; Pot, C.S.; Rabbinge, R. Radiation and Nitrogen Use at the Leaf and Canopy Level by Wheat and Oilseed Rape during the Critical Period for Grain Number Definition. Funct. Plant Biol. 2000, 27, 899–910. [Google Scholar] [CrossRef]
  39. Rácz, D.; Radocz, L. Nutrient Deficiency and Effects of Various Nutrition Technologies on Crop Health. Acta Agrar. Debr. 2019, 2, 109–113. [Google Scholar] [CrossRef]
  40. Smoleń, S.; Sady, W. The Effect of Nitrogen Fertilizer Form on the Content of Sixteen Elements in Red Cabbage. Acta Sci. Pol. Hortorum Cultus 2008, 7, 35–44. [Google Scholar]
  41. Ai, Z.; Wang, G.; Liang, C.; Liu, H.; Zhang, J.; Xue, S.; Liu, G. The Effects of Nitrogen Addition on the Uptake and Allocation of Macroand Micronutrients in Bothriochloa Ischaemum on Loess Plateau in China. Front. Plant Sci. 2017, 8, 1476. [Google Scholar] [CrossRef] [PubMed]
  42. Gul, V.; Ozturk, E.; Polat, T.; Coban, F. Effects of Nitrogen Treatments on Macro and Microelement Contents of Oil Sunflower (Helianthus annuus L.) Seeds. Int. J. Res. Stud. Agric. Sci. 2017, 3, 44–51. [Google Scholar] [CrossRef]
  43. Lošák, T.; Válka, T.; Elbl, J.; Kintl, A.; Keutgen, A.; Keutgen, N.; Demková, L.; Árvay, J.; Varga, L.; Hnátková, H.; et al. Fertilization with Magnesium- and Sulfur-Supplemented Digestate Increases the Yield and Quality of Kohlrabi. Sustainability 2020, 12, 5733. [Google Scholar] [CrossRef]
  44. Geng, G.; Cakmak, I.; Ren, T.; Lu, Z.; Lu, J. Effect of Magnesium Fertilization on Seed Yield, Seed Quality, Carbon Assimilation and Nutrient Uptake of Rapeseed Plants. Field Crops Res. 2021, 264, 108082. [Google Scholar] [CrossRef]
  45. Hamilton, E.W.; Giovannini, M.S.; Moses, S.A.; Coleman, J.S.; McNaughton, S.J. Biomass and Mineral Element Responses of a Serengeti Short-Grass Species to Nitrogen Supply and Defoliation: Compensation Requires a Critical [N]. Oecologia 1998, 116, 407–418. [Google Scholar] [CrossRef]
  46. Tian, Q.; Liu, N.; Bai, W.; Li, L.; Chen, J.; Reich, P.B.; Yu, Q.; Guo, D.; Smith, M.D.; Knapp, A.K.; et al. A Novel Soil Manganese Mechanism Drives Plant Species Loss with Increased Nitrogen Deposition in a Temperate Steppe. Ecology 2016, 97, 65–74. [Google Scholar] [CrossRef]
  47. Sinkhorn, E.R. Non-Linear Nitrogen Dynamics and Calcium Depletion along a Temperate Forest Soil Nitrogen Gradient. Master’s Thesis, Oregon State University, Corvallis, OR, USA, 2007. [Google Scholar]
  48. Muzolf-Panek, M.; Kleiber, T.; Kaczmarek, A. Effect of Increasing Manganese Concentration in Nutrient Solution on the Antioxidant Activity, Vitamin C, Lycopene and Polyphenol Contents of Tomato Fruit. Food Addit. Contam. Part A 2017, 34, 379–389. [Google Scholar] [CrossRef] [PubMed]
  49. Wang, Y.; Hu, X.; Jin, G.; Hou, Z.; Ning, J.; Zhang, Z. Rapid Prediction of Chlorophylls and Carotenoids Content in Tea Leaves under Different Levels of Nitrogen Application Based on Hyperspectral Imaging. J. Sci. Food Agric. 2019, 99, 1997–2004. [Google Scholar] [CrossRef]
  50. Elsayed, S.I.M.; Glala, A.A.; Abdalla, A.M.; El, A.; El-Sayed, G.A.; Darwish, M.A. Effect of Biofertilizer and Organic Fertilization on Growth, Nutrient Contents and Fresh Yield of Dill (Anethum graveolens). Bull. Natl. Res. Cent. 2020, 44, 122. [Google Scholar] [CrossRef]
  51. Kirova, E.B.; Geneva, M.P.; Kostadinov, K.; Filipov, S. Improving Yield and Quality-Related Physiological Characteristics of Lettuce by Integrated Inorganic and Organic Fertilizers Management. Agric. Conspec. Sci. 2022, 87, 127–134. [Google Scholar]
  52. Lee, J.S.; Chandra, D.; Son, J. Growth, Physicochemical, Nutritional, and Postharvest Qualities of Leaf Lettuce (Lactuca sativa L.) as Affected by Cultivar and Amount of Applied Nutrient Solution. Horticulturae 2022, 8, 436. [Google Scholar] [CrossRef]
  53. Hassama, P.; Sirinupong, M.; Ruangrak, E. Comparing Sources of Nitrogen Fertilizer on Growth in Sunflower Microgreens. J. Food Sci. Agric. Technol. 2022, 6, 52–58. [Google Scholar]
  54. Vinale, F.; Guadalupe Peralta-Sánchez, M.; Gómez-Merino, F.C.; Tejeda-Sartorius, O.; Trejo-Téllez, L.I. Nitrogen Nutrition Differentially Affects Concentrations of Photosynthetic Pigments and Antioxidant Compounds in Mexican Marigold (Tagetes erecta L.). Agriculture 2023, 13, 517. [Google Scholar] [CrossRef]
  55. Olarewaju, O.A.; Alashi, A.M.; Taiwo, K.A.; Oyedele, D.; Adebooye, O.C.; Aluko, R.E. Influence of Nitrogen Fertilizer Micro-Dosing on Phenolic Content, Antioxidant, and Anticholinesterase Properties of Aqueous Extracts of Three Tropical Leafy Vegetables. J. Food Biochem. 2018, 42, e12566. [Google Scholar] [CrossRef]
  56. Ochoa-Velasco, C.E.; Valadez-Blanco, R.; Salas-Coronado, R.; Sustaita-Rivera, F.; Hernández-Carlos, B.; García-Ortega, S.; Santos-Sánchez, N.F. Effect of Nitrogen Fertilization and Bacillus Licheniformis Biofertilizer Addition on the Antioxidants Compounds and Antioxidant Activity of Greenhouse Cultivated Tomato Fruits (Solanum lycopersicum L. Var. Sheva). Sci. Hortic. 2016, 201, 338–345. [Google Scholar] [CrossRef]
  57. Jalloh, M.A.; Chen, J.; Zhen, F.; Zhang, G. Effect of Different N Fertilizer Forms on Antioxidant Capacity and Grain Yield of Rice Growing under Cd Stress. J. Hazard. Mater. 2009, 162, 1081–1085. [Google Scholar] [CrossRef] [PubMed]
  58. Qadir, O.; Siervo, M.; Seal, C.J.; Brandt, K. Manipulation of Contents of Nitrate, Phenolic Acids, Chlorophylls, and Carotenoids in Lettuce (Lactuca sativa L.) via Contrasting Responses to Nitrogen Fertilizer When Grown in a Controlled Environment. J. Agric. Food Chem. 2017, 65, 10003–10010. [Google Scholar] [CrossRef]
Figure 1. Changes of the L*a*b* colour coordinates as affected by the N source and level. Vertical bars indicate standard errors.
Applsci 13 05691 g001
Figure 2. Phenolic content (TPC—total phenolic content, TFC—total flavonoid content) of the flowering Chinese cabbage cultivated with various N nutrition sources.
Applsci 13 05691 g002
Figure 3. Antioxidant activity (DPPH, TEAC, FRAP) of the flowering Chinese cabbage cultivated with various N nutrition sources.
Applsci 13 05691 g003
Figure 4. Heatmap with a dendrogram for the flowering Chinese cabbage samples cultivated in the pot system.
Applsci 13 05691 g004
Figure 5. Heatmap with a dendrogram for the flowering Chinese cabbage samples cultivated in the hydroponic system.
Applsci 13 05691 g005
Table 1. Effect of various N nutrition sources on the yield of flowering Chinese cabbage (g of fresh matter per plant).
N SourceN Level
N-50N-70N-90MeanN-50N-70N-90Mean
Pot CultivationHydroponic Cultivation
NH4NO378.4 ± 6.4 a*94.1 ± 7.2 def117.3 ± 9.6 j96.6 B140.8 ± 11.4 e*174.2 ± 10.7 g156.2 ± 7.0 f157.1 A
Ca(NO3)282.7 ± 6.0 ab88.6 ± 9.3 bcd102.4 ± 5.8 gh91.2 A128.6 ± 11.4 d141.3 ± 11.4 bc170.4 ± 7.5 d146.8 A
Mg(NO3)291.1 ± 7.8 cde97.3 ± 6.8 efg118.4 ± 9.2 j102.3 C121.1 ± 6.3 a168.6 ± 8.9 d154.7 ± 5.0 cd148.1 A
NaNO384.8 ± 5.0 abc98.8 ± 8.1 fg114.2 ± 9.2 ij99.3 BC130.2 ± 6.2 ab166.0 ± 9.3 d160.4 ± 11.2 d152.2 A
CH4N2O81.3 ± 5.7 ab99.6 ± 4.5 fg107.4 ± 10.1 hi96.1 B
Mean83.7 A**95.7 B112.0 C 130.19 A162.5 B160.41B
* Values with the same letter within one type of cultivation were not significantly different (p > 0.05, Duncan’s test). ** Mean values for all the treatments in rows and columns with the same letter within the column and row for the parameter were not significantly different (p > 0.05, Duncan’s test).
Table 2. Content of macroelements in the leaves (% of d.m.) of the flowering Chinese cabbage grown with various N nutrition sources.
N Source N LevelNPKCaMg
Pot cultivationNH4NO3N-502.82 ± 0.09 bc*0.44 ± 0.03 ab5.32 ± 0.16 bc2.31 ± 0.19 bc0.35 ± 0.02 b–d
N-703.24 ± 0.09 d0.51 ± 0.05 b–d5.53 ± 0.20 b–e2.31 ± 0.12 bc0.38 ± 0.01 d–f
N-903.87 ± 0.03 e0.47 ± 0.07 ac6.25 ± 0.29 f2.83 ± 0.20 ef0.38 ± 0.02 ef
Mean3.31 ± 0.44 B**0.47 ± 0.06 AB5.70 ± 0.46 BC2.48 ± 0.30 AB0.37 ± 0.02 B
Ca(NO3)2N-502.89 ± 0.09 bc0.47 ± 0.01 a–c5.44 ± 0.05 b–d1.73 ± 0.02 a0.33 ± 0.02 a–c
N-703.34 ± 0.16 d0.51 ± 0.01 b–d4.68 ± 0.11 a2.50 ± 0.05 b–d0.36 ± 0.02 c–e
N-903.73 ± 0.20 e0.54 ± 0.02 cd5.99 ± 0.26 ef3.66 ± 0.07 i0.41 ± 0.02 f
Mean3.32 ± 0.38 B0.51 ± 0.03 BC5.37 ± 0.56 A2.63 ± 0.79 B0.37 ± 0.04 B
Mg(NO3)2N-502.87 ± 0.25 bc0.62 ± 0.03 e5.78 ± 0.40 c–f3.45 ± 0.18 hi0.38 ± 0.01 ef
N-703.64 ± 0.10 e0.49 ± 0.02 b–d5.85 ± 0.27 c–f2.62 ± 0.16 de0.46 ± 0.02 g
N-903.83 ± 0.12 e0.50 ± 0.01 a–d5.95 ± 0.12 d–f3.18 ± 0.09 gh0.53 ± 0.01 h
Mean3.45 ± 0.45 B0.54 ± 0.06 C5.86 ± 0.30 C3.08 ± 0.37 D0.46 ± 0.06 C
NaNO3N-502.78 ± 0.12 b0.55 ± 0.02 d5.22 ± 0.29 b3.10 ± 0.01 fg0.32 ± 0.01 ab
N-703.35 ± 0.12 d0.46 ± 0.02 ab5.36 ± 0.36 bc2.76 ± 0.20 de0.29 ± 0.02 a
N-903.75 ± 0.07 e0.46 ± 0.03 ab5.37 ± 0.09 bc2.56 ± 0.19 c–e0.30 ± 0.01 a
Mean3.29 ± 0.41 B0.49 ± 0.05 AB5.31 ± 0.28 A2.81 ± 0.27 C0.30 ± 0.02 A
Urea, CH4N2ON-502.49 ± 0.03 a0.48 ± 0.01 abc5.39 ± 0.15 bc2.63 ± 0.03 de0.29 ± 0.01 a
N-703.10 ± 0.03 cd0.48 ± 0.03 abc5.72 ± 0.16 b–e2.28 ± 0.17 bc0.31 ± 0.01 ab
N-903.32 ± 0.20 d0.43 ± 0.03 a5.51 ± 0.15 b–e2.25 ± 0.06 b0.31 ± 0.02 a
Mean2.97 ± 0.37 A0.46 ± 0.03 A5.54 ± 0.21 AB2.39 ± 0.20 A0.31 ± 0.02 A
MeanN-502.77 ± 0.20 A0.51 ± 0.07 A5.43 ± 0.31 A2.64 ± 0.61 B0.33 ± 0.04 A
N-703.34 ± 0.21 B0.49 ± 0.03 A5.43 ± 0.48 A2.50 ± 0.24 A0.36 ± 0.06 B
N-903.70 ± 0.24 C0.48 ± 0.05 A5.81 ± 0.38 B2.90 ± 0.51 C0.39 ± 0.08 C
Hydroponic cultivationNH4NO3N-504.71 ± 0.09 bc0.40 ± 0.01 e6.21 ± 0.04 b–d2.13 ± 0.27 b0.74 ± 0.04 cd
N-704.69 ± 0.11 b0.42 ± 0.0 ef6.91 ± 0.24 f1.03 ± 0.06 a0.75 ± 0.03 cd
N-905.03 ± 0.13 c–e0.45 ± 0.02 f6.68 ± 0.10 ef0.90 ± 0.03 a0.79 ± 0.03 d
Mean4.81 ± 0.18 B0.43 ± 0.03 D6.60 ± 0.33 C1.36 ± 0.58 A0.76 ± 0.04 B
Ca(NO3)2N-504.76 ± 0.26 b–d0.26 ± 0.02 b6.59 ± 0.21 d–f2.50 ± 0.12 cd0.86 ± 0.03 e
N-705.11 ± 0.20 e0.21 ± 0.02 a6.19 ± 0.25 bc3.17 ± 0.08 f0.64 ± 0.02 b
N-905.06 ± 0.09 de0.19 ± 0.01 a5.88 ± 0.06 ab3.15 ± 0.11 f0.53 ± 0.02 a
Mean4.98 ± 0.25 BC0.22 ± 0.03 A6.22 ± 0.35 B2.94 ± 0.33 D0.68 ± 0.14 A
Mg(NO3)2N-504.83 ± 0.20 b–e0.32 ± 0.03 cd6.14 ± 0.14 bc2.10 ± 0.11 b0.90 ± 0.03 e
N-704.34 ± 0.11 a0.33 ± 0.02 d6.62 ± 0.03 ef2.38 ± 0.02 bc1.16 ± 0.03 f
N-904.32 ± 0.12 a0.35 ± 0.02 d6.83 ± 0.16 f2.84 ± 0.04 e1.29 ± 0.02 g
Mean4.49 ± 0.28 A0.33 ± 0.03 C6.53 ± 0.32 C2.44 ± 0.31 B1.12 ± 0.17 C
NaNO3N-505.13 ± 0.12 e0.32 ± 0.01 cd6.37 ± 0.26 c–e2.84 ± 0.16 e0.77 ± 0.04 cd
N-705.13 ± 0.12 e0.26 ± 0.01 b6.08 ± 0.10 bc2.74 ± 0.18 de0.79 ± 0.02 d
N-905.09 ± 0.14 de0.29 ± 0.01 bc5.53 ± 0.24 a2.66 ± 0.14 de0.71 ± 0.02 c
Mean5.12 ± 0.13 C0.29 ± 0.03 B5.99 ± 0.41 A2.75 ± 0.18 C0.75 ± 0.04 B
MeanN-504.86 ± 0.24 A**0.33 ± 0.06 A6.33 ± 0.25 AB2.39 ± 0.35 A0.82 ± 0.07 A
N-704.82 ± 0.36 A0.31 ± 0.08 A6.45 ± 0.38 B2.33 ± 0.81 A0.84 ± 0.20 A
N-904.87 ± 0.34 A0.32 ± 0.09 A6.23 ± 0.57 A2.39 ± 0.88 A0.83 ± 0.28 A
* Values with the same letter within one type of cultivation for the parameter were not significantly different (p > 0.05, Duncan’s test). ** Mean values for all the treatments in columns with the same letter within the column for the parameter were not significantly different (p > 0.05, Duncan’s test).
Table 3. Content of microelements (mg·kg−1 of d.m.) and sodium (% of d.m.) in the leaves of the flowering Chinese cabbage grown with various N nutrition sources.
N SourceN LevelFeMnZnCuNa
Pot cultivationNH4NO3N-50116.3 ± 10.6 de*32.4 ± 2.80 b76.4 ± 0.80 b–d7.64 ± 0.30 a0.073 ± 0.01 ab
N-70109.1 ± 3.08 b–d32.4 ± 4.59 b79.8 ± 1.80 b–d7.88 ± 0.66 a0.090 ± 0.01 bc
N-90125.1 ± 7.10 e36.3 ± 3.11 c–e81.9 ± 0.86 c–e5.74 ± 0.24 a0.127 ± 0.01 d
Mean116.9 ± 10.01 BC**33.7 ± 2.22 A79.4 ± 4.24 C7.09 ± 1.05 A0.097 ± 0.02 B
Ca(NO3)2N-5093.7 ± 4.20 a32.9 ± 5.60 bc72.6 ± 2.74 b5.30 ± 0.68 a0.057 ± 0.01 a
N-70101.6 ± 7.78 ab33.7 ± 1.68 bc62.4 ± 1.90 a5.45 ± 0.20 a0.077 ± 0.01 ab
N-90106.5 ± 4.74 b–d39.3 ± 4.43 e77.3 ± 0.27 b–d6.34 ± 0.34 a0.097 ± 0.01 bc
Mean100.6 ± 7.82 A35.3 ± 3.45 A70.8 ± 7.50 A5.70 ± 0.99 A0.077 ± 0.02 A
Mg(NO3)2N-5094.1 ± 0.78 a32.6 ± 4.67 bc90.1 ± 1.76 e8.30 ± 0.80 a0.080 ± 0.01 ab
N-70103.1 ± 1.29 a–c34.2 ± 3.66 bc84.8 ± 2.30 de13.96 ± 0.97 b0.093 ± 0.01 bc
N-90139.4 ± 0.26 f39.1 ± 1.35 de84.3 ± 0.74 de17.99 ± 2.85 cd0.117 ± 0.01 cd
Mean112.2 ± 19.61 B35.3 ± 3.26 A86.4 ± 4.37 D13.42 ± 4.36 B0.097 ± 0.02 B
NaNO3N-50114.6 ± 9.09 c–e35.6 ± 0.44 b–d78.8 ± 2.47 b–d8.09 ± 0.98 a0.200 ± 0.03 e
N-70116.9 ± 5.79 de33.4 ± 3.13 bc76.1 ± 0.74 b–d5.73 ± 0.34 a0.340 ± 0.03 f
N-90137.9 ± 6.27 f34.5 ± 1.62 bc77.2 ± 0.37 b–d7.26 ± 0.36 a0.733 ± 0.01 g
Mean123.1 ± 12.71 C34.5 ± 1.76 A77.4 ± 2.33 BC7.03 ± 1.16 A0.424 ± 0.23 C
Urea, CH4N2ON-50104.8 ± 0.90 a–d27.0 ± 3.47 a71.6 ± 2.09 b19.12 ± 2.64 d0.077 ± 0.01 ab
N-70114.9 ± 0.93 c–e33.6 ± 7.55 bc79.0 ± 0.38 b–d15.47 ± 1.61 bc0.100 ± 0.01 b–d
N-90111.3 ± 3.09 b–d39.4 ± 1.56 e73.0 ± 1.72 bc7.07 ± 0.91 a0.117 ± 0.01 cd
Mean110.3 ± 4.60 B33.3 ± 5.32 A74.5 ± 5.83 AB13.89 ± 5.38 B0.098 ± 0.02 B
MeanN-50104.7 ± 11.65 A32.1 ± 3.52 A77.9 ± 7.64 A9.69 ± 5.02 A0.097 ± 0.05 A
N-70109.1 ± 7.65 A33.4 ± 1.71 A76.4 ± 8.82 A9.70 ± 4.31 A0.140 ± 0.10 B
N-90124.0 ± 14.31 B37.7 ± 2.20 B78.7 ± 4.78 A8.88 ± 4.82 A0.238 ± 0.25 C
Hydroponic cultivationNH4NO3N-5080.5 ± 1.43 a–c89.3 ± 3.46 b–d73.9 ± 3.21 bc3.35 ± 0.29 b0.110 ± 0.01 a
N-7087.7 ± 2.86 cd94.2 ± 5.86 c–e66.3 ± 2.66 b3.52 ± 0.18 bc0.197 ± 0.01 b
N-9092.9 ± 2.13 d102.3 ± 1.96 e82.7 ± 4.50 c–e3.35 ± 0.12 b0.177 ± 0.01 b
Mean87.0 ± 5.57 B95.3 ± 6.42 B74.3 ± 7.83 B3.41 ± 0.22 A0.161 ± 0.04 B
Ca(NO3)2N-50103.6 ± 2.57 e100.8 ± 3.25 e78.9 ± 4.71 cd4.16 ± 0.12 de0.110 ± 0.01 a
N-7088.1 ± 5.32 cd97.6 ± 4.80 de81.7 ± 2.27 c–e4.11 ± 0.20 c–e0.097 ± 0.01 a
N-9084.8 ± 4.46 b–d67.3 ± 2.03 a41.2 ± 2.32 a2.53 ± 0.21 a0.073 ± 0.01 a
Mean92.1 ± 9.24 C88.6 ± 15.46 A67.3 ± 18.82 A3.60 ± 0.78 A0.093 ± 0.02 A
Mg(NO3)2N-5084.0 ± 4.65 bc85.6 ± 5.18 bc90.2 ± 2.75 ef3.59 ± 0.33 b–d0.180 ± 0.02 b
N-7077.8 ± 2.22 ab81.0 ± 5.04 b97.1 ± 7.37 f4.04 ± 0.07 c–e0.207 ± 0.01 b
N-9081.8 ± 3.28 bc92.6 ± 5.31 c–e85.4 ± 2.67 de4.49 ± 0.31 ef0.203 ± 0.01 b
Mean81.2 ± 4.37 A86.4 ± 6.75 A90.9 ± 7.06 C4.04 ± 0.45 B0.197 ± 0.02 C
NaNO3N-5086.0 ± 2.68 b–d90.1 ± 3.73 b–d100.0 ± 6.88 f4.79 ± 0.31 f0.483 ± 0.03 c
N-70101.0 ± 1.90 e85.2 ± 7.46 bc111.4 ± 2.95 g5.49 ± 0.46 g0.603 ± 0.02 d
N-9072.6 ± 7.33 a87.7 ± 3.91 b–d111.4 ± 5.47 g4.99 ± 0.41 fg0.720 ± 0.07 e
Mean86.5 ± 12.49 B87.7 ± 5.71 A107.6 ± 7.67 D5.09 ± 0.49 C0.602 ± 0.11 D
MeanN-5088.5 ± 9.41 B**91.4 ± 7.34 A85.8 ± 10.88 B3.97 ± 0.62 A0.221 ± 0.15 A
N-7088.6 ± 8.89 B89.5 ± 7.96 A89.1 ± 17.86 B4.29 ± 0.78 B0.276 ± 0.20 B
N-9083.0 ± 8.68 A87.5 ± 13.37 A80.2 ± 25.40 A3.84 ± 1.00 A0.293 ± 0.25 B
* Values with the same letter within one type of cultivation for the parameter were not significantly different (p > 0.05, Duncan’s test). ** Mean values for all the treatments in columns with the same letter within the column for the parameter were not significantly different (p > 0.05, Duncan’s test).
Table 4. Contents of chlorophylls and carotenoids in the flowering Chinese cabbage cultivated with various N nutrition sources.
N Source N LevelChl a, mg/g DWChl b, mg/g DWCarotenoids (x + c), mg/g DWChl a + Chl b, mg/g DWChl a/Chl b(Chl a + Chl b)/(x + c)
Pot cultivationNH4NO3N-505.20 ± 0.03 bc*1.91 ± 0.05 ab0.96 ± 0.05 cde7.11 ± 0.01 bc2.72 ± 0.08 c7.42 ± 0.44 ab
N-705.17 ± 0.05 bc1.94 ± 0.01 ab0.97 ± 0.01 cde7.11 ± 0.06 bc2.67 ± 0.01 c7.31 ± 0.17 abc
N-904.99 ± 1.90 bcd1.96 ± 0.72 ab0.89 ± 0.33 de6.95 ± 2.62 bc2.55 ± 0.04 c7.83 ± 0.07 a
Mean5.12 ± 0.861.94 ± 0.320.94 ± 0.157.06 ± 1.182.64 ± 0.097.52 ± 0.33
Ca(NO3)2N-504.17 ± 0.76 cd1.53 ± 0.31 bc0.86 ± 0.13 de5.70 ± 1.07 bcd2.73 ± 0.06 c6.63 ± 0.27 bcd
N-704.83 ± 0.58 bcd1.54 ± 0.19 bc1.03 ± 0.11 cde6.38 ± 0.77 bcd3.13 ± 0.01 bc6.16 ± 0.06 def
N-905.04 ± 0.19 bcd1.65 ± 0.10 bc1.34 ± 0.03 b6.69 ± 0.29 bcd3.05 ± 0.07 bc4.98 ± 0.12 g
Mean4.68 ± 0.591.58 ± 0.181.08 ± 0.236.26 ± 0.752.97 ± 0.195.92 ± 0.77
Mg(NO3)2N-504.89 ± 0.20 bcd1.62 ± 0.09 bc1.25 ± 0.04 bc6.50 ± 0.29 bcd3.02 ± 0.05 bc5.22 ± 0.06 fg
N-704.73 ± 0.12 bcd1.50 ± 0.03 bc0.93 ± 0.02 de6.23 ± 0.14 bcd3.16 ± 0.02 bc6.72 ± 0.02 bcd
N-905.66 ± 0.19 bcd1.52 ± 0.50 bc1.13 ± 0.17 bcd7.19 ± 0.69 b3.91 ± 1.15 a6.49 ± 1.61 b–e
Mean5.09 ± 0.471.55 ± 0.231.10 ± 0.176.64 ± 0.563.36 ± 0.696.14 ± 1.02
NaNO3N-504.60 ± 0.19 bcd1.48 ± 0.07 bc0.98 ± 0.01 cde6.08 ± 0.26 bcd3.12 ± 0.03 bc6.20 ± 0.18 cef
N-704.79 ± 0.26 bcd1.49 ± 0.04 bc1.02 ± 0.14 cde6.27 ± 0.30 bcd3.22 ± 0.09 abc6.18 ± 0.54 cef
N-905.25 ± 0.02 bc1.75 ± 0.02 bc1.07 ± 0.02 bcd7.00 ± 0.04 bc2.99 ± 0.02 bc6.52 ± 0.14 b–e
Mean4.88 ± 0.331.57 ± 0.151.03 ± 0.086.45 ± 0.473.11 ± 0.116.30 ± 0.31
Urea, CH4N2ON-503.69 ± 0.11 cd1.23 ± 0.07 c0.78 ± 0.01 e4.92 ± 0.18 d3.00 ± 0.09 bc6.32 ± 0.27 b–f
N-703.90 ± 0.08 d1.24 ± 0.02 c0.85 ± 0.01 de5.14 ± 0.10 cd3.14 ± 0.00 bc6.07 ± 0.06 def
N-908.48 ± 0.72 a2.39 ± 0.11 a2.01 ± 0.14 a10.87 ± 0.61 a3.56 ± 0.46 ab5.40 ± 0.07 efg
Mean5.36 ± 2.451.62 ± 0.601.21 ± 0.626.98 ± 3.033.23 ± 0.345.93 ± 0.44
MeanN-504.51 ± 0.621.55 ± 0.260.96 ± 0.176.06 ± 0.872.92 ± 0.186.36 ± 0.78
N-704.69 ± 0.491.54 ± 0.250.96 ± 0.096.23 ± 0.723.06 ± 0.216.49 ± 0.53
N-905.88 ± 1.551.85 ± 0.431.29 ± 0.437.74 ± 1.903.21 ± 0.656.25 ± 1.18
Hydroponic cultivationNH4NO3N-504.92 ± 0.01 bc1.68 ± 0.02 a0.84 ± 0.02 cd6.60 ± 0.03 bc2.93 ± 0.04 e7.82 ± 0.15 a
N-705.02 ± 0.26 bc1.57 ± 0.08 ab0.99 ± 0.03 b6.58 ± 0.34 bc3.2 ± 0.01 d6.65 ± 0.12 b
N-905.39 ± 0.02 b1.69 ± 0.02 a0.93 ± 0.04 bc7.08 ± 0.00 b3.18 ± 0.05 d7.59 ± 0.33 a
Mean5.11 ± 0.251.65 ± 0.070.92 ± 0.076.75 ± 0.303.11 ± 0.147.35 ± 0.58
Ca(NO3)2N-503.89 ± 0.02 efg1.08 ± 0.08 de0.81 ± 0.02 d4.97 ± 0.10 fgh3.6 ± 0.23 bc6.12 ± 0.02 cd
N-703.80 ± 0.08 efg1.03 ± 0.01 e0.88 ± 0.01 cd4.83 ± 0.09 fgh3.68 ± 0.06 b5.51 ± 0.05 ef
N-904.31 ± 0.24 de1.24 ± 0.08 d0.91 ± 0.06 bcd5.55 ± 0.32 ef3.49 ± 0.04 bc6.08 ± 0.04 cd
Mean4.00 ± 0.271.12 ± 0.110.87 ± 0.055.12 ± 0.373.59 ± 0.145.90 ± 0.31
Mg(NO3)2N-504.88 ± 0.12 bc1.45 ± 0.02 bc0.99 ± 0.02 b6.32 ± 0.15 cd3.37 ± 0.03 cd6.39 ± 0.26 bc
N-708.24 ± 0.13 a1.67 ± 0.06 a2.29 ± 0.07 a9.91 ± 0.19 a4.94 ± 0.09 a4.33 ± 0.05 g
N-903.62 ± 0.08 fg0.97 ± 0.07 e0.85 ± 0.01 cd4.59 ± 0.15 gh3.73 ± 0.18 b5.38 ± 0.14 f
Mean5.58 ± 2.141.36 ± 0.321.38 ± 0.716.94 ± 2.434.01 ± 0.735.37 ± 0.93
NaNO3N-504.56 ± 0.6 cd1.27 ± 0.24 cd0.99 ± 0.09 b5.83 ± 0.90 de3.60 ± 0.16 bc5.87 ± 0.36 de
N-704.10 ± 0.10 def1.11 ± 0.03 de0.99 ± 0.00 b5.21 ± 0.13 efg3.69 ± 0.00 b5.26 ± 0.12 f
N-903.42 ± 0.10 g0.92 ± 0.04 e0.84 ± 0.03 cd4.34 ± 0.14 h3.71 ± 0.05 b5.19 ± 0.04 f
Mean4.06 ± 0.601.10 ± 0.190.94 ± 0.095.13 ± 0.793.67 ± 0.095.44 ± 0.48
MeanN-504.56 ± 0.511.37 ± 0.250.91 ± 0.105.93 ± 0.753.37 ± 0.316.55 ± 0.83
N-705.29 ± 1.891.34 ± 0.301.29 ± 0.656.63 ± 2.143.88 ± 0.695.44 ± 0.89
N-904.18 ± 0.831.20 ± 0.330.88 ± 0.055.39 ± 1.163.53 ± 0.256.06 ± 1.02
* Values with the same letter within one type of cultivation for the parameter were not significantly different (p > 0.05, Duncan’s test).
Table 5. Results of cluster analysis for the pot and hydroponic system.
SystemSamplesCluster No.
Pot cultivationUrea N-901
Mg(NO3)2 N-702
Mg(NO3)2 N-902
Ca(NO3)2 N-903
Mg(NO3)2 N-503
Urea N-504
Urea N-704
NH4NO3 N-905
NaNO3 N-905
NH4NO3 N-506
NH4NO3 N-706
Ca(NO3)2 N-506
Ca(NO3)2 N-706
NaNO3 N-506
NaNO3 N-706
Hydroponic cultivationNH4NO3 N-501
NH4NO3 N-701
NH4NO3 N-901
Mg(NO3)2 N-501
Ca(NO3)2 N-502
Ca(NO3)2 N-702
Ca(NO3)2 N-902
Mg(NO3)2 N-902
NaNO3 N-702
NaNO3 N-902
Mg(NO3)2 N-703
NaNO3 N-503
Disclaimer/Publisher’s Note: The statements, opinions and data contained in all publications are solely those of the individual author(s) and contributor(s) and not of MDPI and/or the editor(s). MDPI and/or the editor(s) disclaim responsibility for any injury to people or property resulting from any ideas, methods, instructions or products referred to in the content.

