


Sensitivity Analysis of the Design Parameters of Permanent Magnet Synchronous Motors for Vibration Reduction

1
Mechanical and Manufacturing Department, Faculty of Engineering, Mondragon Unibertsitatea, Loramendi 4, 20500 Arrasate-Mondragón, Spain
2
Electronics and Computing Department, Faculty of Engineering, Mondragon Unibertsitatea, Loramendi 4, 20500 Arrasate-Mondragón, Spain
3
Mechanical Engineering, Orona Elevator Innovation Center, Orona Ideo, Jauregi Bidea s/n, 20120 Hernani, Spain
*
Author to whom correspondence should be addressed.
Appl. Sci. 2023, 13(9), 5486; https://doi.org/10.3390/app13095486
Submission received: 5 April 2023
/
Revised: 21 April 2023
/
Accepted: 25 April 2023
/
Published: 28 April 2023
(This article belongs to the Special Issue Data-Driven Methods for Design and Analysis of Electromagnetic Devices)
Abstract
:The use of electric motors, and particularly, Permanent Magnet Synchronous Motors, is increasing in recent years, and their vibration response is one of the most crucial aspects regarding their behaviour. Thus, the reduction in vibrations is one of the key objectives when optimizing electric motors. In an initial design state, the influence of the main design parameters on the behaviour of the machines is not always clear. For that reason, this work presents a global sensitivity analysis procedure that allows identifying the most influential design parameters and determining guidelines to optimize the design of Permanent Magnet Synchronous Motors. First, the analytical calculations employed to estimate the electromagnetic torque and the vibration response of the machine are described. Then, the sensitivity analysis procedure, based on the Monte Carlo method, is presented, and the conditions to apply the method successfully and accurately are analysed. Finally, the sensitivity analysis is performed for a particular electric motor design, and some general design guidelines are deduced, which can be extrapolated to similar machines.
1. Introduction
Electric machines are widely used in many different applications, such as automotive drives, wind generators, railway transportation and elevators [1,2]. Among the different motor typologies used in industry, Permanent Magnet Synchronous Motors (PMSMs) are becoming increasingly popular in recent years, mainly due to their enhanced power density and efficiency [2,3,4,5].
The current trends of maximizing the power of electric machines and reducing their size lead to an increase in the noise and vibrations they generate, which affects the comfort of the users and the reliability of the components of the machines. Thus, the reduction in noise and vibrations should be one of the most crucial aspects to consider when optimizing the design of PMSMs, together with their efficiency and reliability.
The optimization of the design of electric machines is a highly challenging topic, as it involves performing a multiphysics analysis [6]. In the literature, many different approaches have been proposed in recent years to optimize the design of PMSMs regarding their vibration behaviour [7].
The optimization techniques are focused on different elements of the electric machines. Regarding the rotor, the most typical strategies are to modify the shape [8,9,10,11] and the height [12,13] of the permanent magnets. Some authors also vary the magnetization direction of the magnets [12] or include different notch geometries to the rotor [14,15,16,17].
Regarding the stator, several authors propose modifying the shape of the teeth [10,11,18,19], or varying the width [11,20,21] of both the teeth and the slots. Other approaches are to include notches in the teeth [12,14,16,22] or to modify the width of the stator [18,19,21].
In addition, some authors propose modifying the length of the air gap [12,23], implementing a skewed rotor [24], or changing the slot and pole number combination [25,26] in order to reduce the vibrations and noise of the electric machines.
In those works, interesting conclusions were obtained regarding the optimization of the design of electric machines. Multiple influential parameters were observed, which affect several aspects of the behaviour of a machine, but the effect of these parameters depends on the typology and dimensions of the motor.
For that reason, when developing a new machine design, or when optimizing an existing one, the influence of its design parameters needs to be analysed in detail. In the literature, numerous authors perform Finite Element calculations with that purpose, but when a high number of influential parameters is considered, the computational cost of Finite Element calculations becomes excessive.
Moreover, in an initial design state, the accuracy of the results is not usually the main objective, as it is more interesting to obtain general trends of how the behaviour of the machine changes with each of the input parameters. Therefore, in this type of optimization problem, fast analytical calculations must be used.
In this work, an optimization tool is presented, which consists of a global sensitivity analysis that studies the effect of various design parameters on the torque and vibration response of the machine. This tool can be useful when defining new machine designs, as it allows performing fast calculations and observing the trends of the behaviour of the machine in the function of the input parameters. Moreover, the optimization tool is applied to a specific PMSM, and certain design rules are concluded, which can be extrapolated to similar machines.
Previously developed analytical models are employed in order to estimate the electromagnetic torque and the vibration response of PMSMs. The analytical models are described in Section 2. Based on those models, a sensitivity analysis procedure is developed in order to study the influence of several design parameters on the behaviour of the machines. The procedure employed to define the sensitivity analysis is described in Section 3. Finally, the results of the sensitivity analysis are shown and discussed in detail in Section 4.
2. Analytical Calculation Procedure
In this section, the analytical development employed to estimate the behaviour of a surface-mounted PMSM is explained. First, the magnetic flux density that the permanent magnets create in the air gap is calculated. Next, the magnetic flux density is used to calculate the electromagnetic torque of the machine and the magnetic pressure on the stator teeth, which is then used to calculate the vibration on the external surface of the stator.
The analytical procedure is limited to ideal machines, which means that the eccentricity, the manufacturing tolerances or other types of faults are not considered in the analysis. Due to these assumptions, the prediction of the model will differ from the real behaviour of the machine. However, that error can be assumed, as the aim of the model is to observe the trends of the behaviour of the machine with respect to several design parameters, rather than to obtain a highly accurate prediction.
2.1. Calculation of the Magnetic Flux Density
The calculation procedure is based on the Fourier Spatial Series approach, in which all the harmonics of the magnetic flux density are described by expressions that are based on the physical parameters of the components of the machine [27].
The temporal and spatial distribution of the magnetic flux in the air gap due to the permanent magnets can be expressed as (1):
where and t are the angular position and time, p is the number of pole pairs, and is the rotational speed of the machine. are the coefficients of the Fourier series, which are calculated using Equation (2):
where is the angle pitch, and is the magnitude of the flux density created by the magnets, which can be calculated using Equation (3):
where is the height of the magnets, , are their relative permeance and remnant field, and g is the length of the air gap.
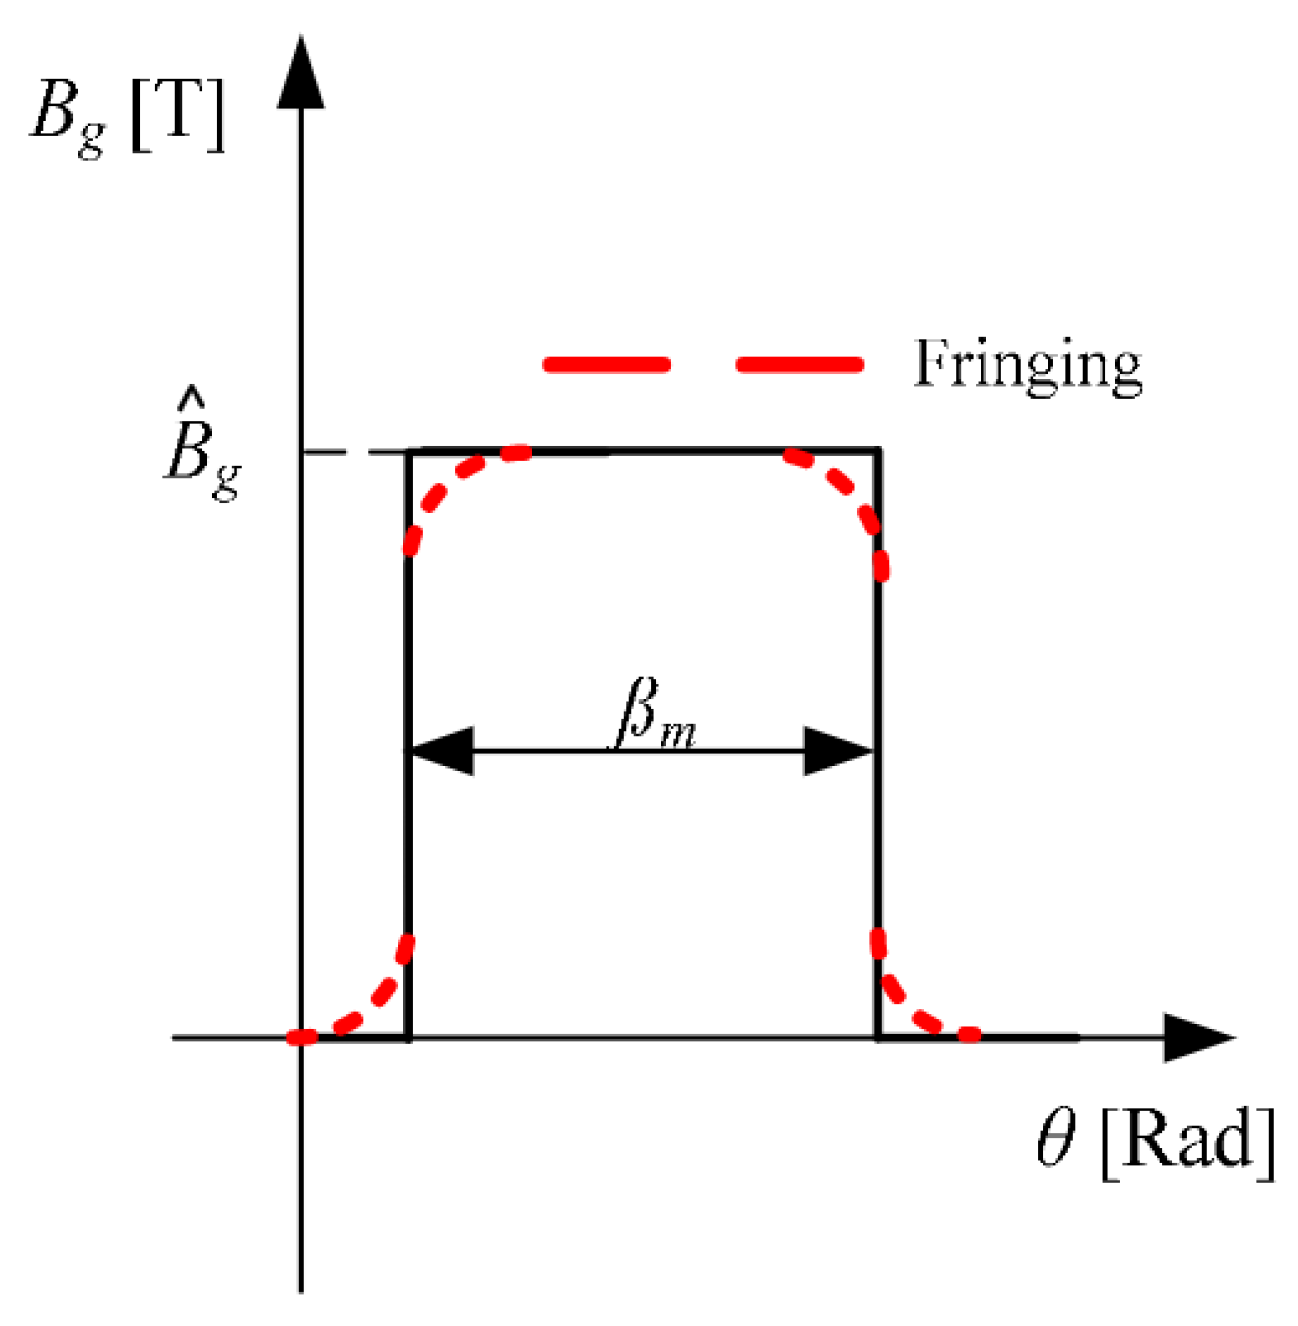
The fringing coefficient (a) from Equation (2) is used to shape the ideal rectangular distribution of the flux density, in order to obtain a more realistic waveform, as can be seen in Figure 1. The fringing coefficient can be expressed in the function of the machine dimensions, as shown in Equation (4):
where is the internal diameter of the rotor.
The expression defined in Equation (1) represents the magnetic flux density in an ideal slotless machine. However, due to the stator slots, the distribution of the air gap becomes non-uniform, which introduces a strong harmonic content to the air gap permeance. The eccentricity of the machine also modifies the air gap permeance, but as previously mentioned, the model employed in this work is limited to ideal machines, and the eccentricity is neglected. Thus, only the effect of the stator slots is considered, which can be modelled by defining a relative permeance function:
where is the number of stator slots, is the mean value of the permeance variation, and is the Fourier coefficient of order v.
Therefore, the magnetic flux density for a slotless machine can be multiplied to the relative permeance function in order to obtain the magnetic flux density in a slotted machine.
2.2. Calculation of the Electromagnetic Torque
The electromagnetic torque is created due to the electromagnetic coupling between the permanent magnet field and the armature fields [28].
First of all, the distribution of the winding conductors is defined according to the star of slots method [29]. Employing the winding periodicity (), which is the greatest common divisor (GCD) of the number of pole pairs and the number of slots, the number of pole pairs in a periodicity () and the number of slots in a periodicity () are calculated.
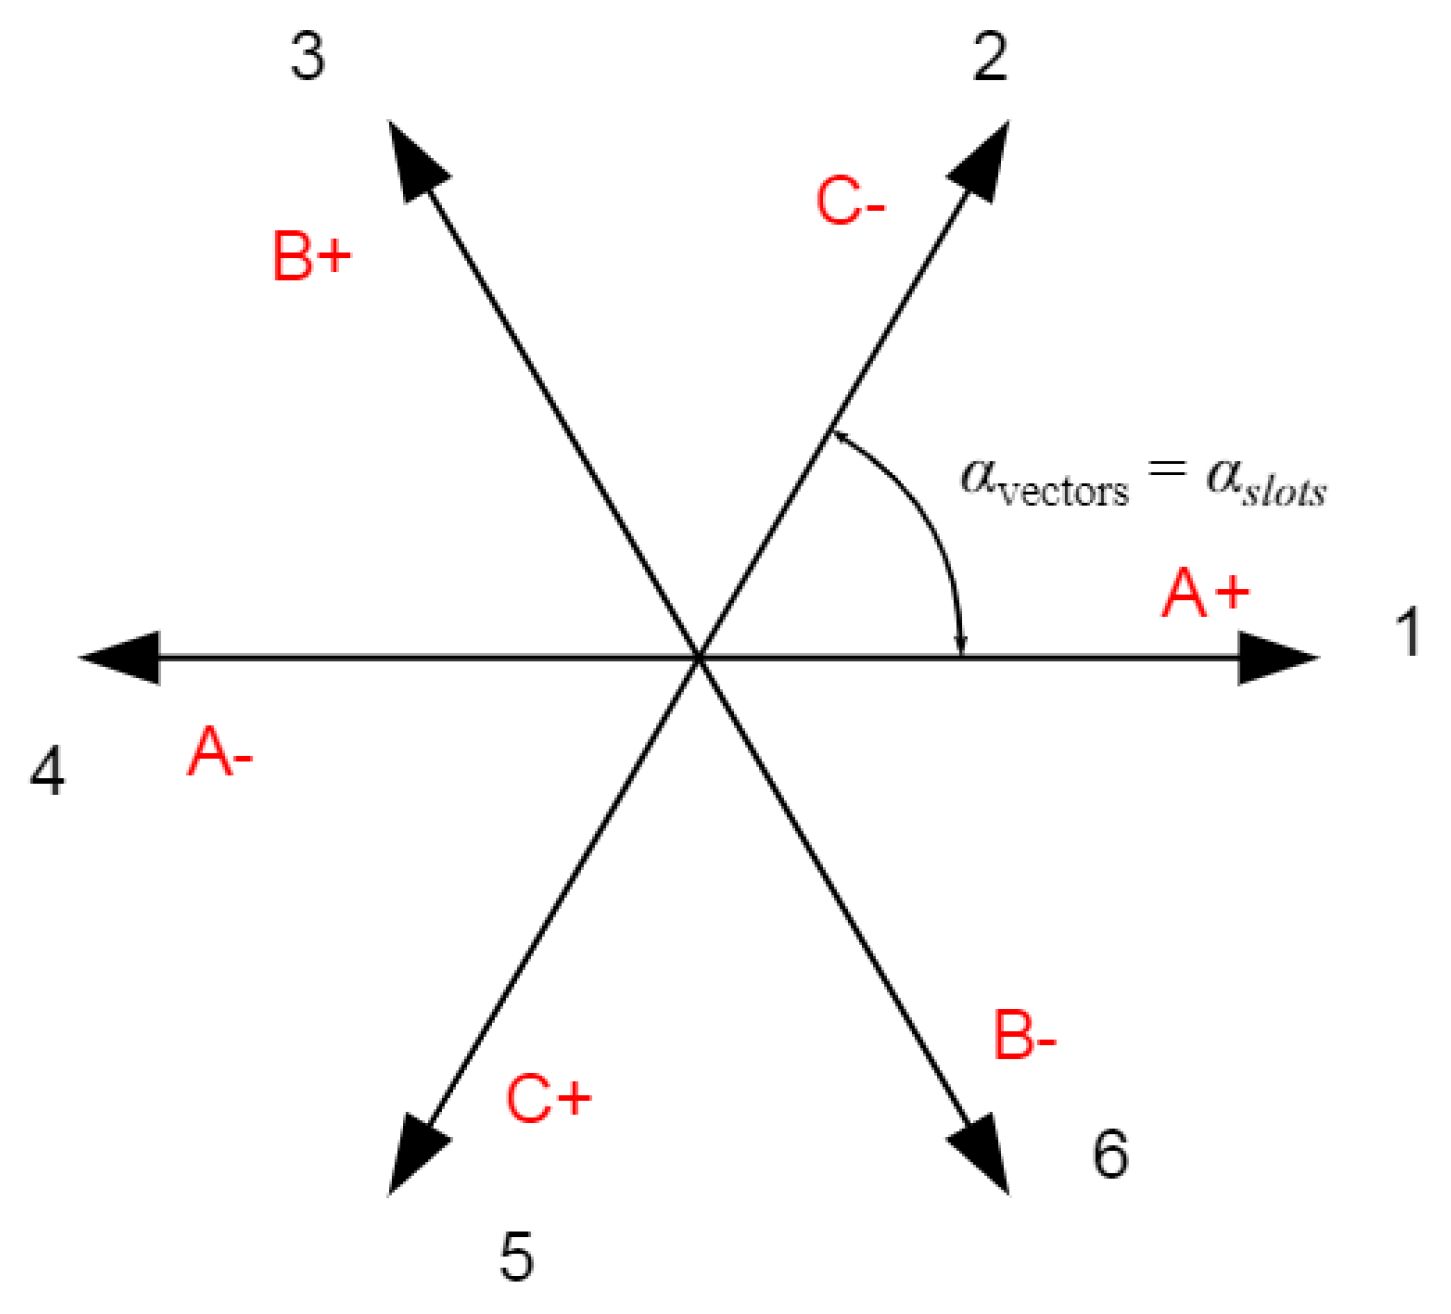
Then, a star can be drawn, which has as many vectors as , and those vectors are enumerated according to . The conductors are placed following the sequence A+ /C− /B+ /A− /C+ /B−. For example, Figure 2 shows the star of slots for a machine with 8 poles and 48 slots.
Based on the star of slots drawn for a machine, the winding factor () can be calculated, which represents the effectiveness of a coil in producing magnetomotive force. The harmonics of the winding factor can be calculated according to (9):
where and are the amplitude and phase of order k. For an ideal machine, the amplitude is unitary and the phase is kept constant between all the coils.
Using the winding factor, the conductor distribution per phase (C) can be obtained, as shown in (10) for phase A:
where c is the number of coils per phase, N is the number of turns per coil, and is the pitch angle of the coils.
The flux linkage () can be calculated in the function of the magnetic flux density (which is calculated as explained in Section 2.1) and the magnetomotive force, as shown in (12):
where and are the internal diameter and the length of the stator, respectively.
Finally, the electromagnetic torque () can be calculated considering the electromotive force and the current (I) of the three phases, as expressed in (14):
The total mechanical torque of the machine is composed of the electromagnetic torque and the cogging torque. However, this work is focused on the mean value of the total torque, which is not affected by the cogging torque. Therefore, the electromagnetic torque is the only component that is considered in the analytical development.
2.3. Calculation of the Vibration Response
First of all, the magnetic pressure acting on the stator teeth is calculated using the Maxwell stress tensor. Usually, it is assumed that the vibrations of the stator are mainly produced due to the radial component of the pressure, and the tangential component is neglected due to its reduced effect [27,30]. Thus, the radial pressure () is calculated, as shown in (15):
where is the magnetic permeability of the air.
The calculation procedure of the vibration response is explained in [26]. The pressure can be expressed as a sum of harmonic waves, as shown in Equation (16):
where is the amplitude of the pressure, is the rotational frequency of the pressure and is the wave number.
The modal superposition method is used, which considers that the response of the system is the result of the sum of the contribution of its vibration modes. According to this method, the vibration response in the radial direction can be expressed as:
where is the modal participation factor and the radial mode shape of mode i.
As the excitation force is a sum of harmonic pressure waves, the steady-state response is also a sum of harmonic responses, with a phase lag () respective to the force.
The amplitude of the response can be calculated by means of (19):
where and are the damping ratio and the natural frequency of mode i. The natural frequencies can be analytically estimated [31]. The damping is estimated according to the empirical expression proposed by Yang [32]. However, its influence will be negligible in steady-state conditions if the excitation frequencies are not close enough to the natural frequencies. is the modal force corresponding to the k-th pressure wave and i-th mode, which depends on the pressure distribution and the mode shapes of the structure.
Considering the stator as a cylinder, the general subscript i can be substituted by subscripts n and m, representing the radial-tangential and axial mode shapes, respectively. Thus, the modal force can be represented by means of (20):
where , , and are the length, the thickness, the equivalent radius and the equivalent density of the stator. , and are the mode components of the flexural, torsional and longitudinal vibrations.
The mode shapes are considered to be those of a cylindrical shell:
Introducing the expressions of the mode shapes in Equation (21):
Thus, the amplitude of the modal force can be obtained for every radial-tangential and axial mode, and for every pressure component. From Equation (20), it is concluded that the vibration is zero when . For the case of and odd values of m, the modal force can be expressed as:
Introducing this amplitude in Equation (19), and considering the corresponding natural frequencies and excitation frequencies, the amplitude of the vibration response is obtained.
3. Sensitivity Analysis
In this section, the procedure employed for the sensitivity analysis is explained in detail.
3.1. Description of the Reference Machine
In order to analyse the influence of the design parameters of a PMSM, a certain machine geometry is taken as a reference. This machine is a surface-mounted PMSM consisting of 48 slots and 8 pole pairs. Table 1 gathers its main geometrical dimensions:
3.2. Definition of the Sensitivity Analysis
The aim of a sensitivity analysis is to deduce how much each of the input parameters of a model contributes to the uncertainty or variation of its output response. There are different types of sensitivity analyses, but a general distinction can be made between local and global analyses. In local sensitivity analyses, which are usually based on gradients or partial derivatives, the sensitivity of an input parameter is studied in a small range while keeping the rest of the inputs constant. In global sensitivity analyses, all the input factors can be varied simultaneously, which allows obtaining the sensitivity of the inputs and their interactions in a wider range. The negative aspect of global analyses is that their computational cost is higher as they are based on the dispersion between the response of all the samples defined in the input parameter range.
In this work, even though a certain machine geometry is employed as a reference, there are no particular design restrictions, which means that the original dimensions can be modified when optimizing the design. For that reason, a global sensitivity analysis procedure was selected.
Among the different types of global techniques that are used in the literature, the variance-based sensitivity analysis is one of the most popular ones as it allows measuring the sensitivity across the entire input space, to consider non-linear responses and to measure interactions between parameters [33].
A model can be considered as a function , being X the vector of d input parameters . The function can be decomposed, as shown in Equation (27) [34]:
Assuming that the function is square integrable:
The left part of the equation is the variance of Y (Equation (29)), and the terms on the right part are the variance terms of the inputs (Equation (30)).
According to those definitions, the global sensitivity indices can be defined as:
It is important to notice that all the indices are higher than or equal to 0, and that their sum equals 1.
Moreover, two different indices can be distinguished: the first-order indices and the total-effect indices. The first-order sensitivity index (Equation (32)) represents the effect of modifying a certain input parameter alone. On the other hand, the total-effect sensitivity index (Equation (33)) represents the effect of modifying a certain input parameter, including the variances caused by its interactions with the other input parameters.
As an example, assuming a system with three input parameters, the first-order and the total-effect indices of the first input parameter would be expressed as:
Therefore, some conclusions can be established:
- If the interactions between the input parameters have no effect at all, , and .
- If the interactions between the input parameters affect the output of the system, , , and .
In most cases, the analytical calculation of the previous indices is not possible, so different approximation techniques are usually employed. In this work, the Monte Carlo method is used, which is based on generating a sequence of uniformly and independently distributed points inside the unit hypercube. Being d the number of input parameters and N the number of samples employed for each input, a sample matrix is created.
The first d columns are used as the matrix , and the rest of the columns as the matrix , obtaining two independent samples of N points for every input parameter. Based on matrices and , d, additional matrices are created. The matrices are equal to matrix , except for their i-th column, which is from matrix .
The calculations are performed for all the , and matrices, and the , and values are used to calculate the sensitivity indices. Different estimators are used in the literature, but in this work the improved estimators proposed by Saltelli et al. [33] were employed, which are represented by Equations (36) and (37).
Once the samples for all the input parameters are defined, the output values are calculated for every set of input parameters, and the variances of all the sets are calculated to obtain the influence of each parameter.
3.3. Input and Output Parameters
The objective of this work is to analyse the effect of the most significant geometrical dimensions of the machine on its electromagnetic and vibration response. More specifically, the mean torque of the machine and the RMS value of the acceleration of the external surface of the stator were defined as the outputs of the sensitivity analysis, which were calculated by means of the analytical procedure described in Section 2.
The torque and the vibration were selected as the outputs since they are two of the most representative parameters of the behaviour of an electric machine. On the one hand, the torque of the machine defines the output power it is able to provide, or in other words, its capacity. On the other hand, the vibration response of the machine is related to the comfort of the users and the fatigue of its components. For that reason, the ideal objective in an initial design stage would be to maximize the torque while minimizing the vibrations.
The geometrical dimensions shown in Table 1 are the main dimensions that define the electric machine. However, not all those parameters are independent. Due to the existing dependencies between them, a uniform and independent distribution cannot be defined for all the input parameters, as it would result in an incorrect machine definition.
In this work, the most influential parameters among all the geometrical dimensions were selected as independent. The internal diameter of the rotor () and the length of the stator () affect the size of the machine, and thus the electromagnetic torque. The height of the magnets () and the length of the air gap (g) are also critical parameters for the definition of a machine. Finally, the width of the stator yoke () defines its stiffness, and it is very influential on the vibration response. As a design restriction, it was decided to set the external diameter of the stator () constant in order to limit the size of the motor.
As a result, the rest of the input parameters were defined as dependent. The height of the teeth () is related to the diameters of the stator and the rotor, according to Equation (38):
Moreover, so that the area of the slots is kept constant (in order to introduce the same amount of windings), the width of the slots () is related to the height of the teeth, as shown in Equation (39):
where is the nominal area of the slots.
Finally, the width of the teeth () is calculated considering the radius of the mid-height of the teeth, according to Equation (40):
When defining the ranges of the input parameters, it was decided to take the nominal dimensions as a reference, and to define the lower and upper limits by applying a certain percentage. If this percentage is too high, inconsistent values might be obtained for the dependent parameters. Initially, a percentage of 10% was defined to ensure a correct machine definition in all the cases.
4. Results
In this section, the results of the sensitivity analysis are presented. First, several aspects of the Monte Carlo method are investigated, to ensure that the method is applied correctly and that reliable results are obtained. Then, the final results of the analysis are shown and discussed, and several design rules for an optimum machine behaviour are stated.
4.1. Application of the Monte Carlo Method
First of all, several simulations were performed to analyse various aspects of the Monte Carlo method and ensure a robust definition of the sensitivity analysis. More specifically, the number of samples employed for the input parameters, the effect of considering dependent parameters, and the influence of the parameter range were analysed.
4.1.1. Number of Samples
The accuracy of the technique depends on the number of samples used for the input values. Increasing the number of samples, the accuracy of the results will be higher, but the computational cost of the calculation will also be increased. Thus, an agreement must be reached between accuracy and computational cost.
In order to quantify the accuracy of the method, the Monte Carlo probable error [35] was employed. According to Equation (41), the standard deviation of the output mean () can be calculated in the function of the standard deviation of all the output values () and the number of samples.
As a criterion, a maximum error of ±0.5% was established, with a confidence rate of 99.7%, which is equivalent to three standard deviations. Thus, simulations were performed for different values of N, and Table 2 shows the standard deviation obtained for the vibration and the torque in each case.
Therefore, among the studied cases, 5000 samples would need to be employed in order to fulfil the criterion, as a maximum error of 0.465% and 0.351% would be committed in the 99.7% of the cases for the vibration and the torque, respectively.
Additionally, the sensitivity indices obtained for these cases are shown in Table 3, Table 4, Table 5 and Table 6:
Generally, quite similar values are obtained for all the cases. However, some illogical results are obtained for low values of N. For instance, when using 200 samples, the first-order indices of several parameters are higher than their total-effect indices; the sum of the first-order indices is higher than 1 for the vibration, and the sum of total-effect indices is lower than 1 for the torque. All these results are incorrect according to the definition of the sensitivity indices stated in Section 3.2, and some slight incoherences are still observed for 1000 samples.
For 5000 and 10,000 samples, all the values of the sensitivity indices are logical. Therefore, according both to the Monte Carlo probable error criterion and the definition of the sensitivity indices, a value of 5000 was selected as the number of samples for the analysis, in order to reach an agreement between accuracy and computational cost.
Another conclusion that can be obtained is that the effect of the interactions between the input parameters is negligible, as all the total-effect indices are almost equal to their corresponding first-order indices. Therefore, only the total-effect indices were considered when analysing the results of the sensitivity analysis.
4.1.2. Dependent Parameters
The variance-based sensitivity analysis considers that all the inputs are independently and uniformly distributed. However, as mentioned in Section 3.3, some relationships exist between the input parameters, and not all of them are independent. For that reason, the method might not be correct when dependent parameters are included in the analysis.
In order to check that statement, the same calculation was performed considering only the independent parameters as the inputs (which corresponds to the results shown in Table 5) and considering both the independent and dependent parameters as the inputs. Table 7 shows the sensitivity indices obtained for the latter case.
It is quite clearly observed that illogical results are obtained when dependencies exist between the input parameters of the sensitivity analysis. For the case of vibrations, the total-effect indices of the parameters defined as dependent are much lower than the first-order indices. Moreover, the indices for , which is defined as an independent input, are also wrong, proving that unreliable results might be obtained for any input parameter when dependencies exist between them.
4.1.3. Range of the Input Parameters
As mentioned in Section 3.3, the range of the input parameters was initially defined by modifying their nominal values in a 10%. However, the results might vary if that range is modified for some of the parameters, or if their nominal values are changed.
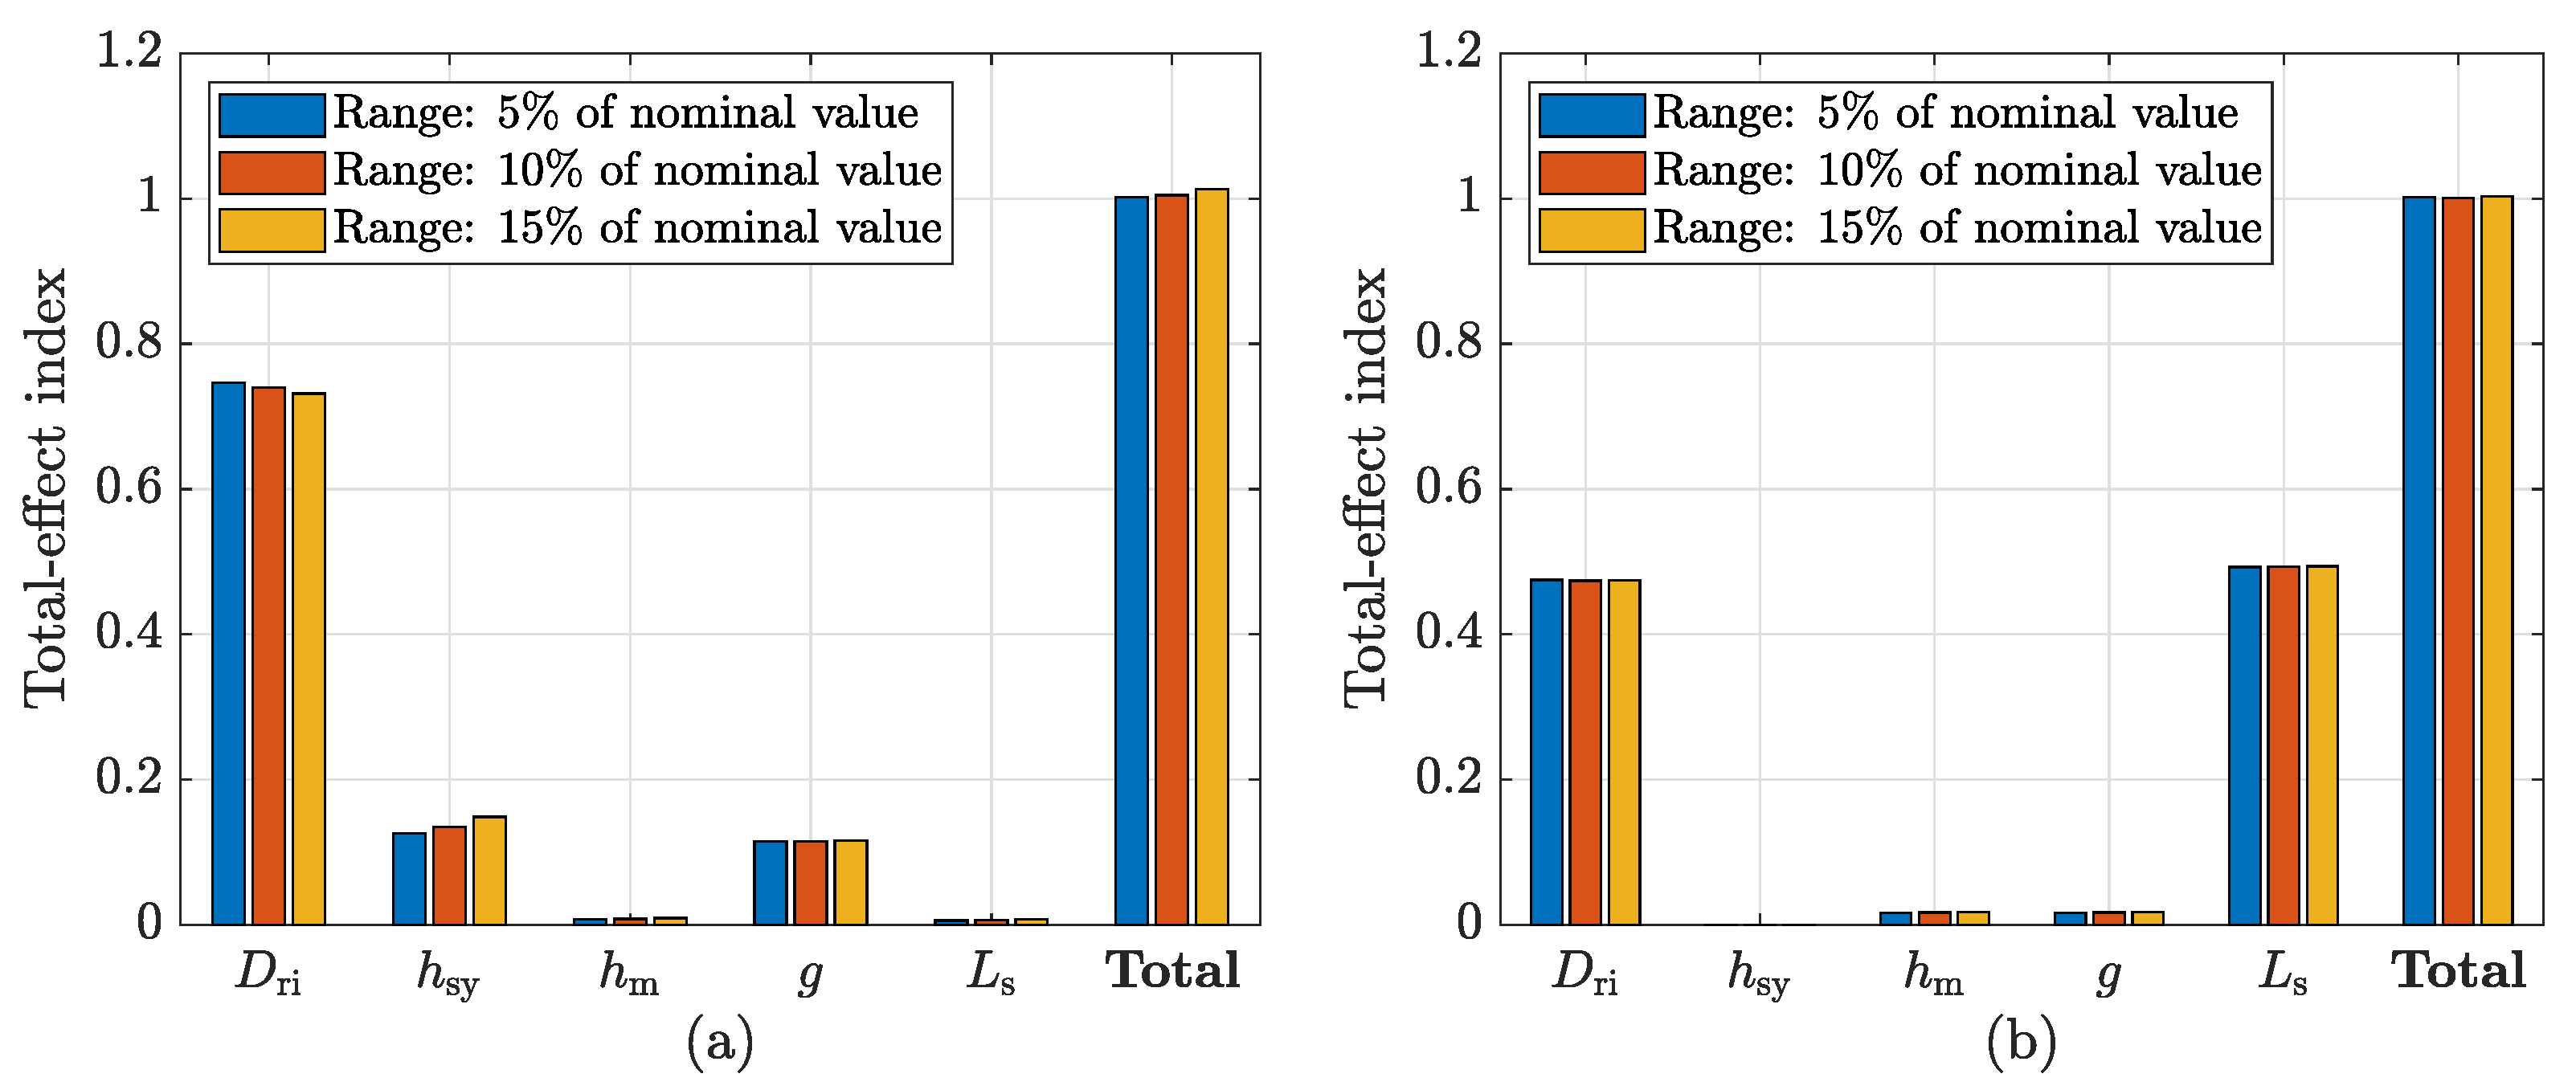
First, the effect of modifying the ranges of all the inputs was analysed. Figure 3 shows the comparison of the total-effect indices when using different range sizes.
It can be seen that if the range of all the input parameters is modified equally, there are no significant differences in the results. Thus, the robustness of the method is proven, as the same effect is obtained for all the input parameters regardless of the variation of the range size.
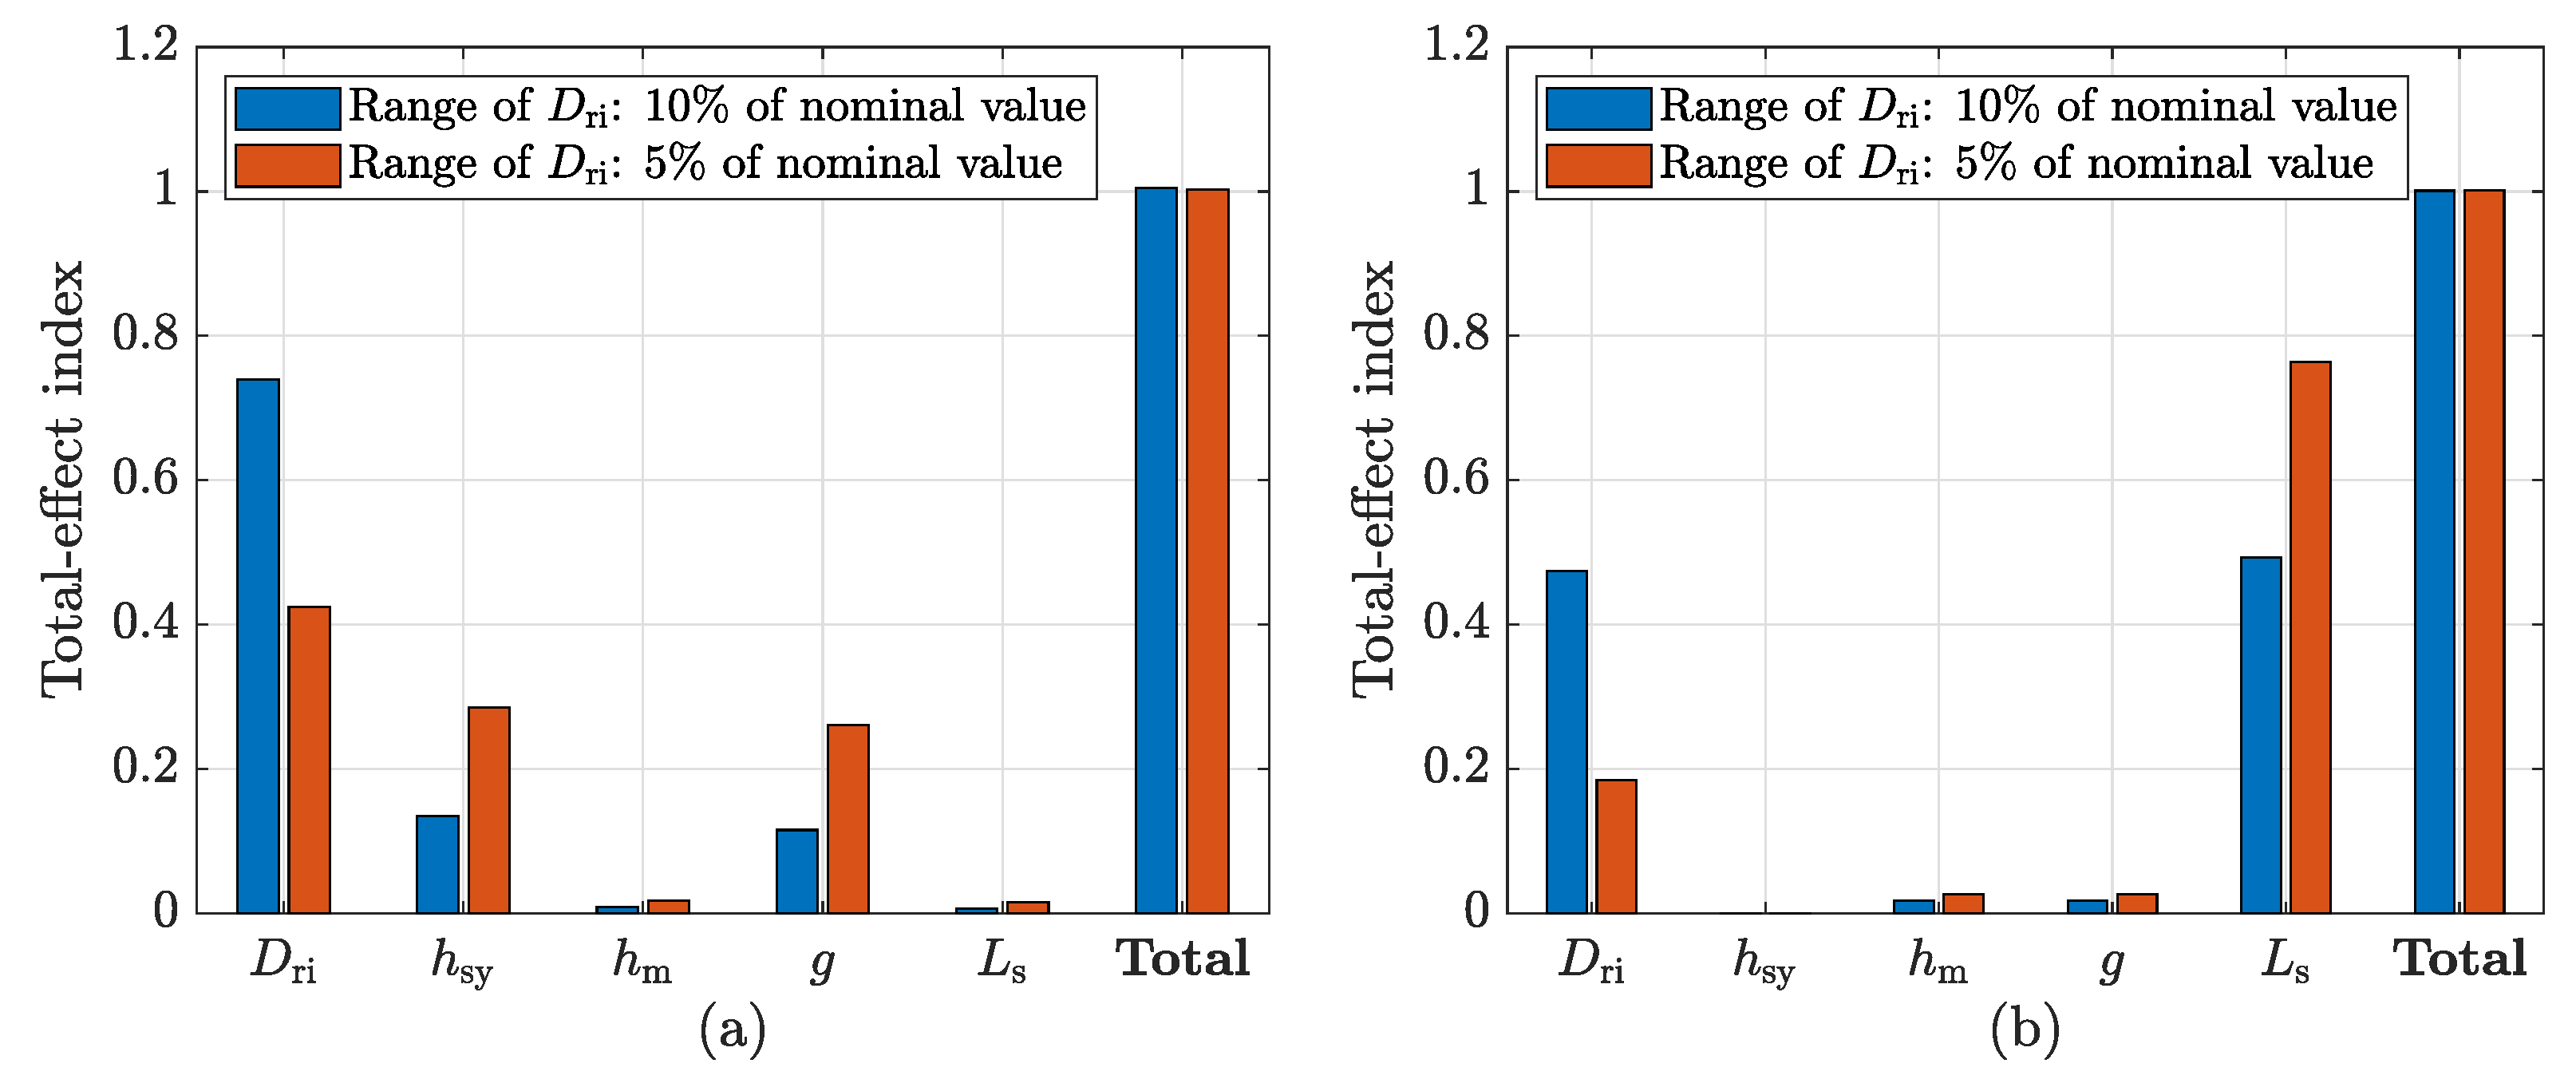
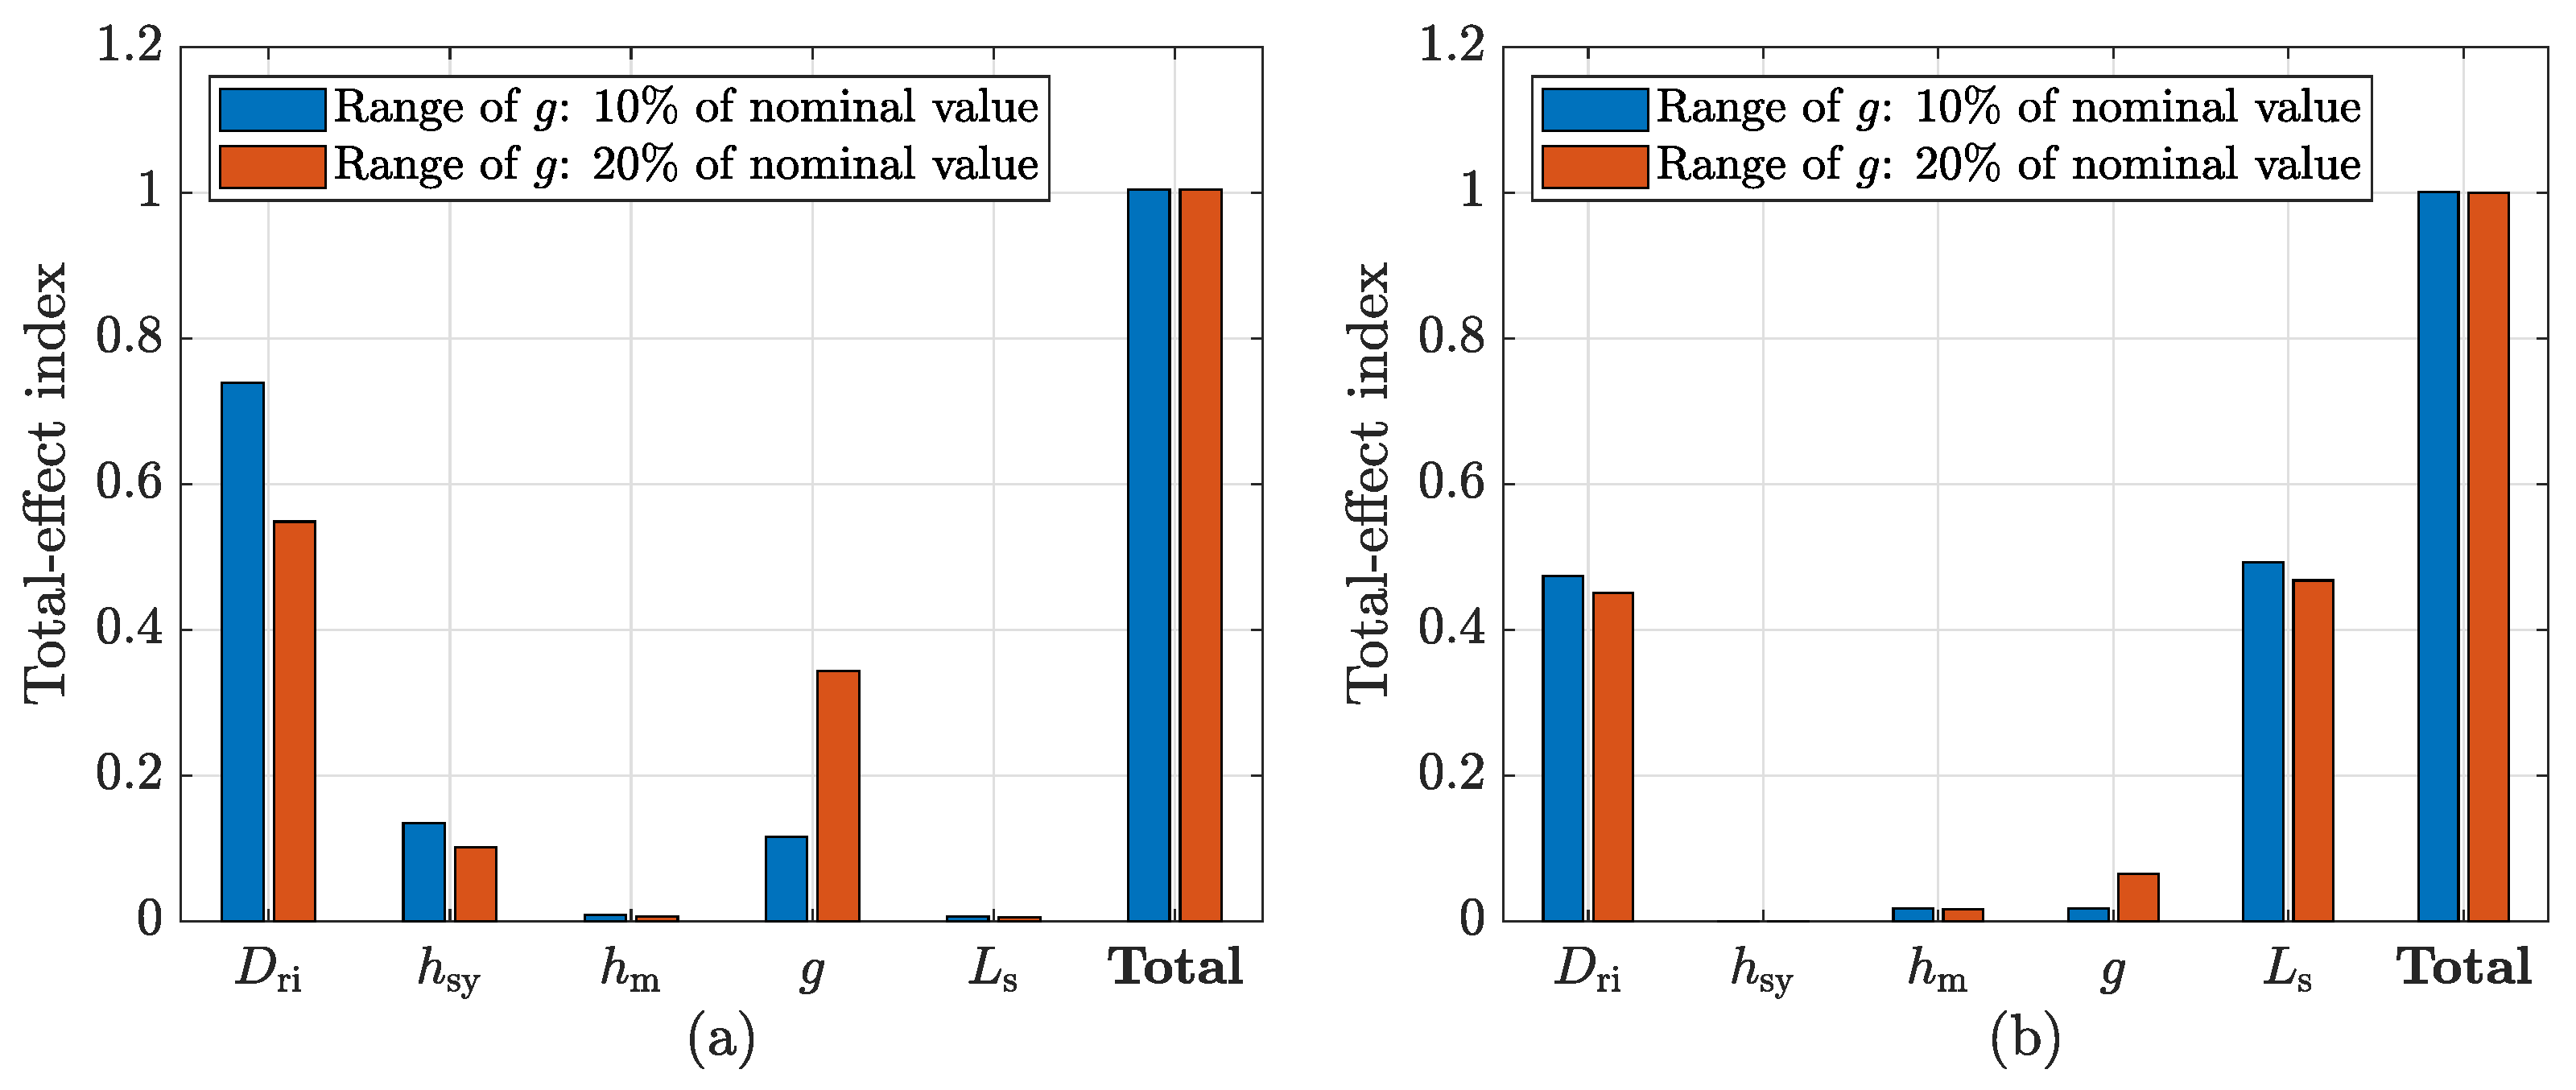
The effect of modifying the range of only one specific input was also analysed. Two different cases were analysed, and g, as they are the two inputs that have the highest effect considering both the torque and the vibrations.
Figure 4 and Figure 5 show the total-effect indices when the range of is reduced to a 5% of its nominal value, and when the range of g is increased to a 20% of its nominal value, respectively.
In both cases, it is clearly observed that the results vary significantly when the range of a specific input is modified. By considering a smaller range for the internal diameter of the rotor, part of its influence on vibrations is transferred to and g. Regarding the torque, becomes the most influential input. When increasing the range of g, its influence on both vibrations and torque is significantly increased, reducing the effect of .
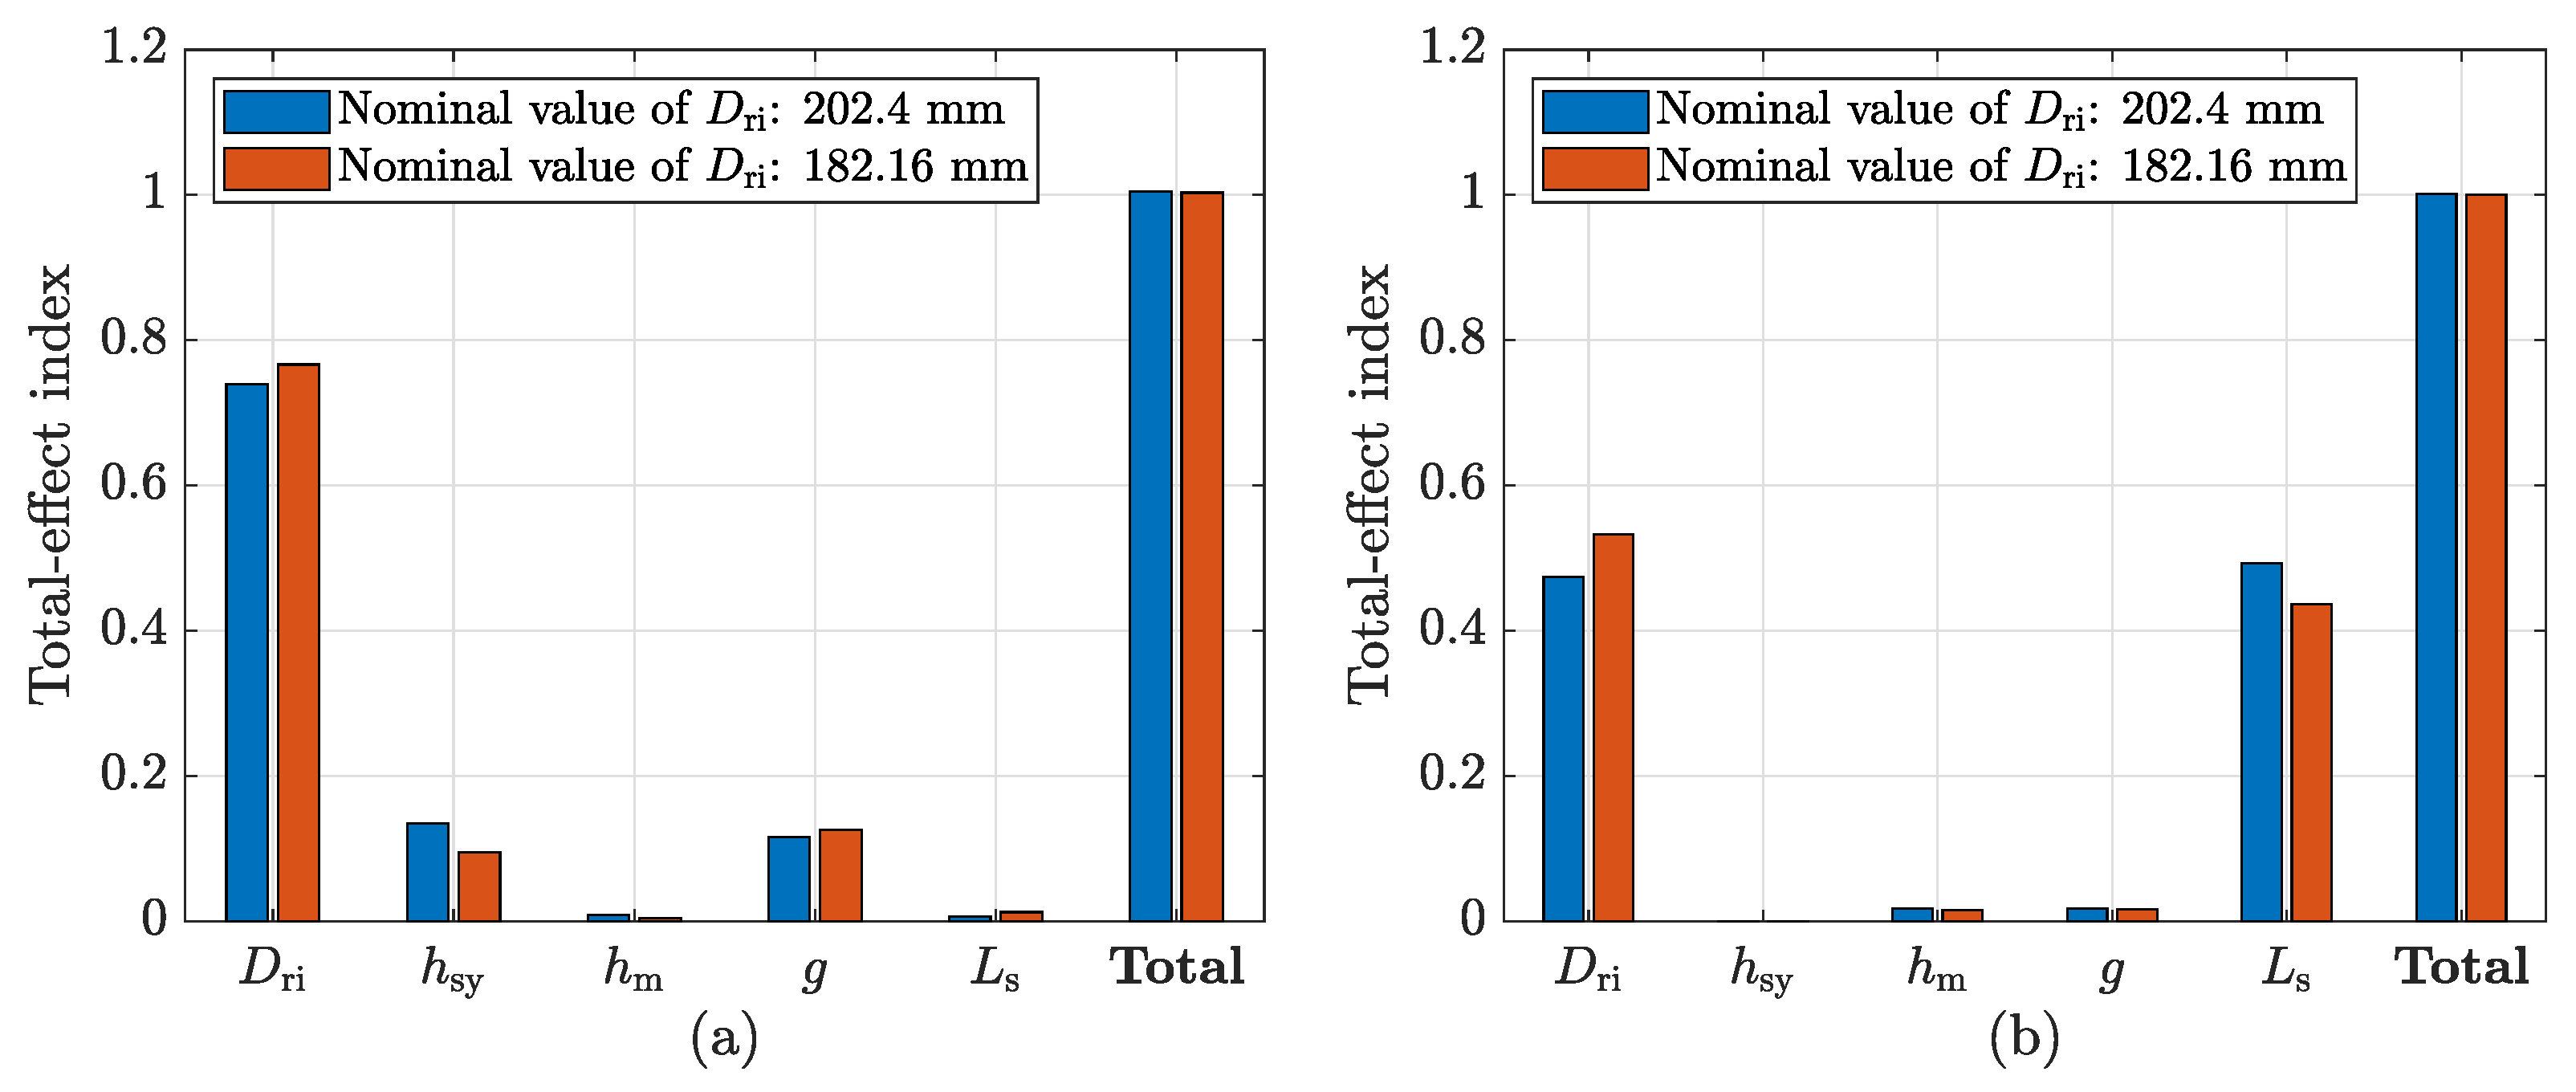
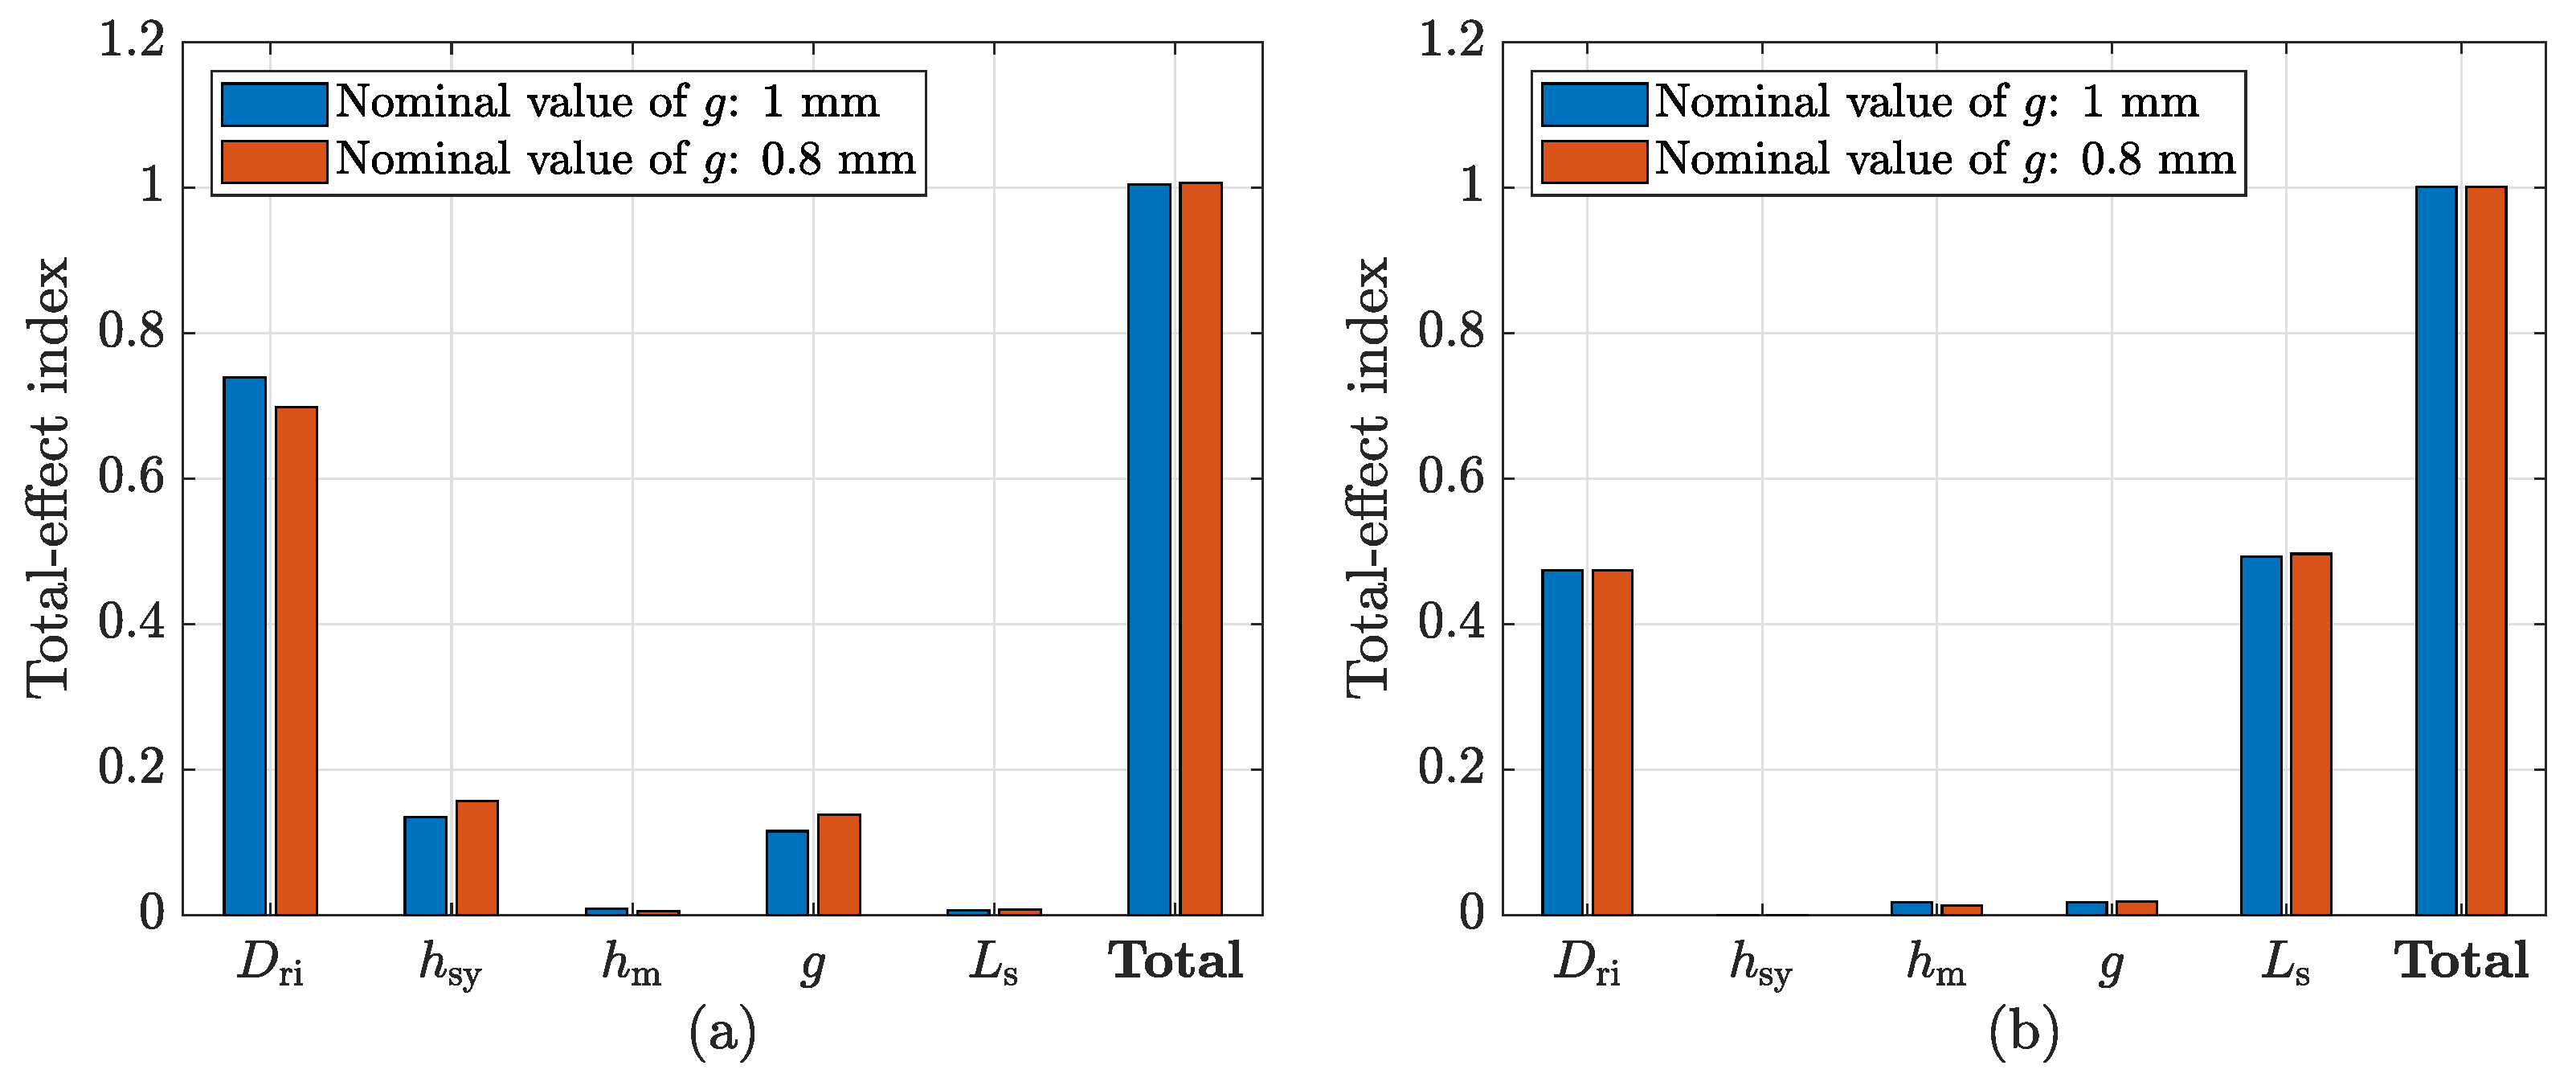
Finally, the effect of modifying the nominal value of a specific parameter was analysed, while keeping the same range size. Again, the cases of and g were analysed.
Figure 6 and Figure 7 show the total-effect indices when the nominal value of is reduced by 10%, and when the nominal value of g is reduced by 20%, respectively.
It can be observed that the nominal value of the parameters also modifies the results of the sensitivity analysis. In both cases, a lower nominal value results in a higher influence of that input, even though the changes are not as substantial as when modifying the range.
Therefore, if a sensitivity analysis is performed for a certain machine, the conclusions that are obtained can be extrapolated to other similar machines. Even though the values of the indices will not be correct, the trends will be very similar.
Nevertheless, when performing a sensitivity analysis, it is important to be aware of the influence of the ranges selected for the input parameters. The most correct approach would be to select the ranges considering the design restrictions of each particular case. From a theoretical point of view, as in this work, where no particular restrictions exist, the fairest approach is to set all the inputs within the same percentage. The value of that percentage is not relevant, as long as the same value is applied to all of the inputs, and feasible values are obtained for all the dependent parameters.
4.2. Results of the Sensitivity Analysis
After the conclusions obtained in Section 4.1 about the Monte Carlo method, it was decided to set the number of samples per input to 5000, to only consider the independent parameters as inputs, and to define the ranges of all the inputs as a 10% of their nominal value.
Therefore, the sensitivity analysis of the design parameters of the PMSM was performed under those conditions, in order to deduce their influence on the torque and the vibration response of the machine. In this section, the results of the sensitivity analysis are shown, and the most relevant conclusions are discussed.
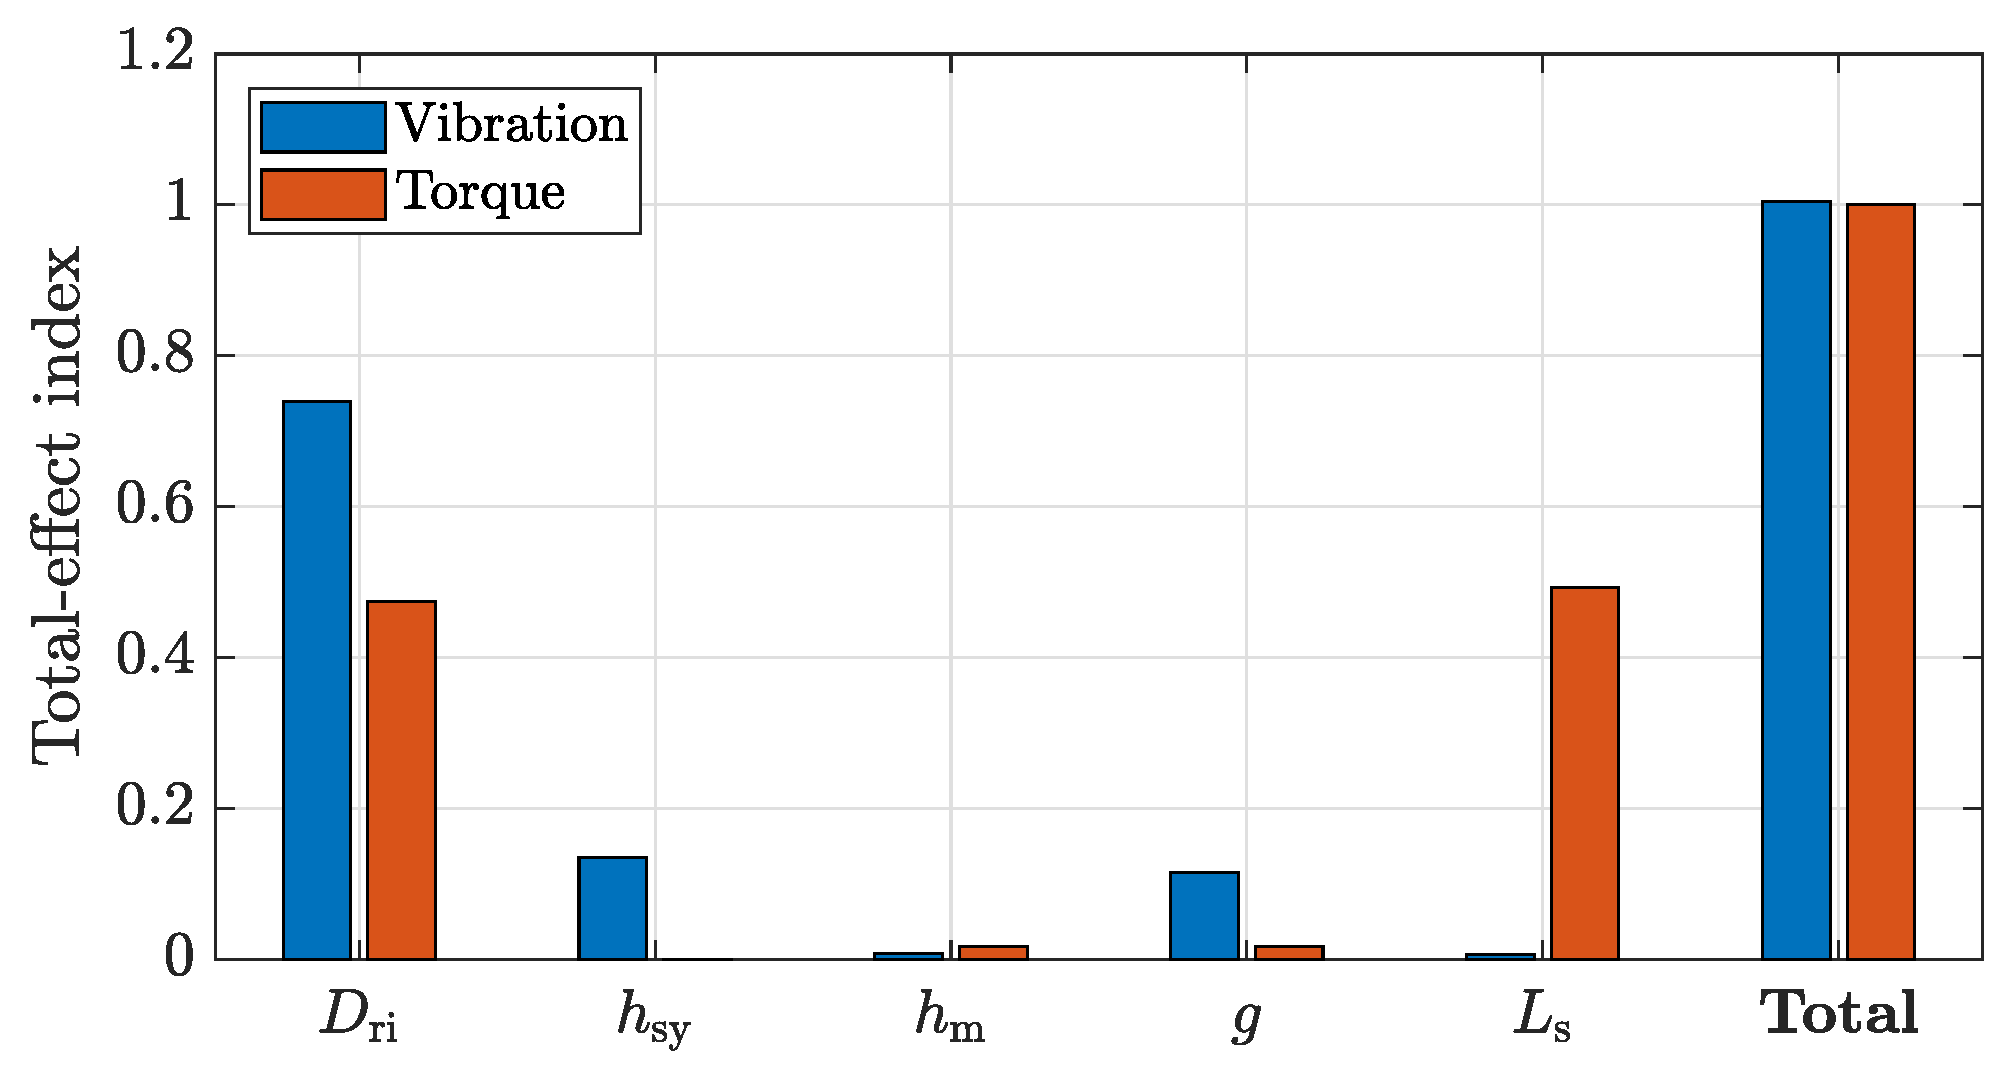
First, Figure 8 shows the total-effect indices of all the input parameters, which were calculated according to Equation (37). These indices measure the relative effect of modifying each of the inputs on the vibration response and the torque.
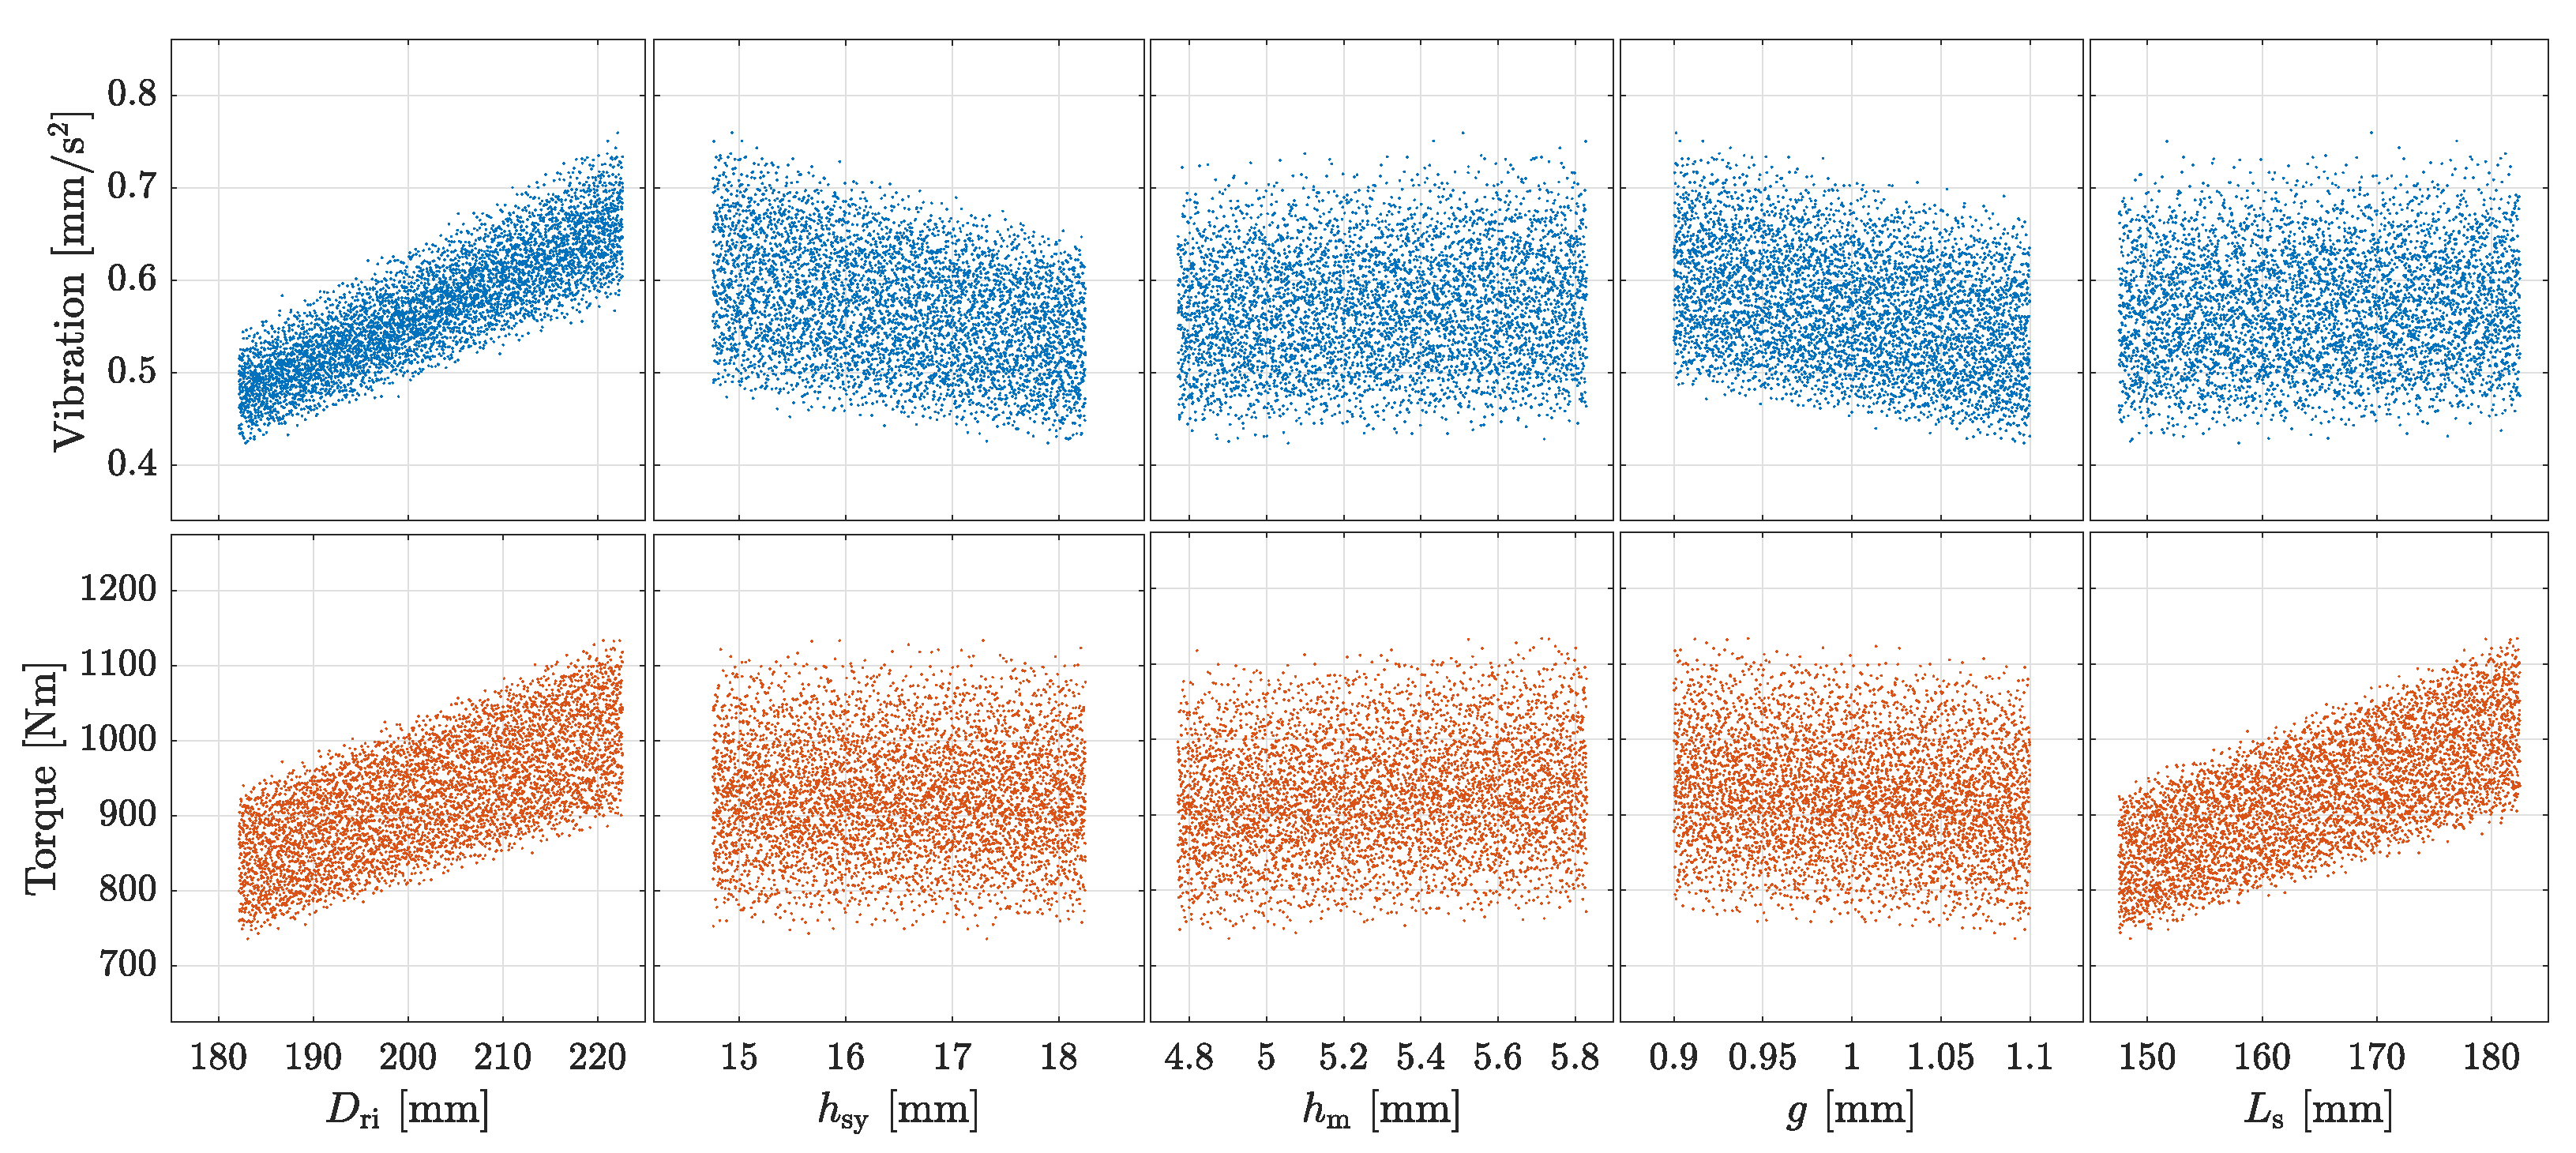
The sensitivity indices in Figure 8 represent the total influence of the inputs, but they do not show if the output value is increased or decreased on each of the cases. Thus, the scattered plot of the entire sample set is shown in Figure 9, where the output values of the vibration and torque are represented with respect to the values of the corresponding input parameter.
Therefore, the influence of the design parameters on the torque and the vibration response can be concluded observing the results in Figure 8 and Figure 9.
As it is logical, the machine produces a higher torque when increasing the diameter of the rotor and the height of the magnets. However, these two parameters have a similar effect on the vibration. Thus, if the objective is to increase the torque without worsening the vibration response, modifying these two parameters would not be a good solution.
Moreover, increasing the length of the stator would produce a higher torque without affecting the vibrations of the machine. Theoretically, a longer machine would have a lower stiffness, resulting in a worse vibration response. However, this particular machine has a very short length compared to its diameter, which is why a relatively small change of the length shows a very small effect on the vibrations. In a much longer machine, a more significant effect of the stator length will be observed.
An interesting solution might be to increase the width of the stator yoke, because it would produce a considerable reduction of vibrations without changing the torque. As the external diameter of the stator is kept constant, this would imply to reduce the height and the width of the stator teeth. Therefore, the increase of should be limited so that the width of the teeth is not too small, as this would carry saturation issues that would affect the behaviour of the machine.
Another option would be to increase the length of the air gap. Even though it would imply a reduction in the torque, its contribution to the reduction in vibrations would be even higher, which makes it an interesting alternative.
5. Conclusions
In this work, a sensitivity analysis procedure to optimize the design of PMSMs was developed. A global sensitivity analysis procedure was employed, based on the Monte Carlo method, in order to study the influence of the most critical design parameters of the machine in a wide input parameter range.
Regarding the definition of the sensitivity analysis, it was concluded that the method is not suitable when there are dependencies between the input parameters. In order to obtain consistent results, all the input parameters must be independent. According to the Monte Carlo probable error and the definition of the sensitivity indices, 5000 samples were selected to reach an agreement between accuracy and computational cost.
Moreover, the nominal value of the inputs affects their influence on the output parameters, but as long as the variation is not very significant, the differences are not remarkable. Thus, the conclusions obtained with the proposed calculation procedure for a particular machine can be extrapolated to similar configurations.
The method is more sensitive to the upper and lower limits of the input parameters. Generally, if an input is varied within a higher range, its effect on the output parameters will be increased. Therefore, the ranges of the input parameters should be defined according to the design restrictions of every specific study case.
After analysing the correct definition of the sensitivity analysis procedure, the particular case of a PMSM was studied, and some design guidelines were presented, with the objective of maximizing the torque produced by the machine while minimizing the vibrations.
Increasing the internal diameter of the rotor or the height of the magnets, the permanent magnet volume is increased, which produces higher magnetic forces. Thus, although a higher torque could be obtained by modifying these two parameters, they penalize the vibration response at the same extent, so modifying them would not be an adequate solution.
An interesting option would be to increase the length of the stator, as the machine would produce a higher torque, with a negligible effect on the vibration response. This conclusion is valid for short machines, as the influence of this parameter on the vibration response will be more significant in much longer machines.
The opposite phenomenon occurs with the height of the stator yoke. As this parameter affects the stiffness of the stator, it changes the vibration significantly, but it does not affect the magnetic forces. Therefore, a thicker stator would improve the vibration response without compromising the torque.
Increasing the length of the air gap could be another interesting solution. Even though a slightly lower torque would be produced, the reduction of vibrations would be more significant. In addition, the length of the air gap has a high sensitivity to the manufacturing tolerances, so a higher value would help reduce its variability.
Author Contributions
Conceptualization, M.M. and A.M.; methodology, A.M. and J.P.; software, M.M.; validation, J.P. and S.Z.; investigation, M.M. and A.M.; resources, L.I.; data curation, S.Z.; writing—original draft preparation, M.M.; writing—review and editing, S.Z. and L.I.; visualization, M.M.; supervision, J.P.; project administration, L.I.; funding acquisition, A.M. and L.I. All authors have read and agreed to the published version of the manuscript.
Funding
This research was funded by the Basque Government (MECOVA ZL-2019/00554 and VEGAN KK21-0044, and predoctoral grant), by the Provincial Council of Gipuzkoa (NVHCONTROL), and by Orona EIC.
Conflicts of Interest
The authors declare no conflict of interest.
Abbreviations
The following abbreviations are used in this article:
| GCD | Greatest Common Divisor |
| PMSM | Permanent Magnet Synchronous Motor |
| RMS | Root-Mean Square |
References
- Gerada, D.; Mebarki, A.; Brown, N.L.; Gerada, C.; Cavagnino, A.; Boglietti, A. High-speed electrical machines: Technologies, trends, and developments. IEEE Trans. Ind. Electron. 2014, 61, 2946–2959. [Google Scholar] [CrossRef]
- Riba, J.R.; López-Torres, C.; Romeral, L.; Garcia, A. Rare-earth-free propulsion motors for electric vehicles: A technology review. Renew. Sustain. Energy Rev. 2016, 57, 367–379. [Google Scholar] [CrossRef]
- Royo, J.; Segui, R.; Pardina, A.; Nevot, S.; Arcega, F.J. Machine current signature analysis as a way for fault detection in permanent magnet motors in elevators. In Proceedings of the 2008 18th International Conference on Electrical Machines, Vilamoura, Portugal, 6–9 September 2008; pp. 1–6. [Google Scholar] [CrossRef]
- Corovic, S.; Miljavec, D. Modal Analysis and Rotor-Dynamics of an Interior Permanent Magnet Synchronous Motor: An Experimental and Theoretical Study. Appl. Sci. 2020, 10, 5881. [Google Scholar] [CrossRef]
- Blázquez, F.; Rebollo, E.; Platero, C.A.; Blánquez, F.R. Design and Construction of a Laboratory Bench System for the Teaching and Training of Engineers on Diagnostics of Permanent Magnet Motors. In Proceedings of the 2015 IEEE 10th International Symposium on Diagnostics for Electrical Machines, Power Electronics and Drives (SDEMPED), Guarda, Portugal, 1–4 September 2015; pp. 131–137. [Google Scholar] [CrossRef]
- Li, Y.; Lei, G.; Bramerdorfer, G.; Peng, S.; Sun, X.; Zhu, J. Machine Learning for Design Optimization of Electromagnetic Devices: Recent Developments and Future Directions. Appl. Sci. 2021, 11, 1627. [Google Scholar] [CrossRef]
- Galfarsoro, U.; McCloskey, A.; Almandoz, G.; Hernández, X.; Arrasate, X. Stator Teeth Tips Shape Influence in Permanent Magnet Synchronous Motors on a Test Bench. In Proceedings of the 2018 XIII International Conference on Electrical Machines (ICEM), Alexandroupoli, Greece, 3–6 September 2018; pp. 975–981. [Google Scholar] [CrossRef]
- van der Giet, M.; Franck, D.; Rothe, R.; Hameyer, K. Fast-and-easy acoustic optimization of PMSM by means of hybrid modeling and FEM-to-measurement transfer functions. In Proceedings of the 19th International Conference on Electrical Machines, ICEM 2010, Rome, Italy, 6–8 September 2010; pp. 1–6. [Google Scholar] [CrossRef]
- Jang, G.H.; Lieu, D.K. The effect of magnet geometry on electric motor vibration. IEEE Trans. Magn. 1991, 27, 5202–5204. [Google Scholar] [CrossRef]
- Krotsch, J.; Piepenbreier, B. Harmonic diversity and determining factors of radial forces in external rotor permanent magnet synchronous motors with concentrated windings. In Proceedings of the 19th International Conference on Electrical Machines (ICEM 2010), Rome, Italy, 6–8 September 2010; pp. 1–7. [Google Scholar] [CrossRef]
- Hallal, J.; Pellerey, P.; Marion, F.; Druesne, F.; Lanfranchi, V. Harmonic pressure optimization on numerical electric motor model. In Proceedings of the 19th International Conference on the Computation of Electromagnetic Fields (COMPUMAG 2013), Budapest, Hungary, 30 June–4 July 2013. [Google Scholar] [CrossRef]
- Li, Y.; Li, S.; Xia, J.; Zhang, F. Noise and vibration characteristics analysis on different structure parameters of permanent magnet synchronous motor. In Proceedings of the 2013 International Conference on Electrical Machines and Systems (ICEMS 2013), Busan, Republic of Korea, 26–29 October 2013; pp. 46–49. [Google Scholar] [CrossRef]
- Marwaha, S.; Marwaha, A. Finite Element Based Parametric Analysis of PMSM for Electric Vehicle Applications. J. Eng. Sci. Technol. 2023, 18, 735–750. [Google Scholar]
- Kim, S.E.; You, Y.M. Optimization of a Permanent Magnet Synchronous Motor for e-Mobility Using Metamodels. Appl. Sci. 2022, 12, 1625. [Google Scholar] [CrossRef]
- Ge, H.; Guo, B.; Qiu, X.; Yang, J.; Feng, C.; Bai, C.; Jin, Z.; Zhang, Y. Optimising the flux barriers of interior permanent magnet machine for noise reduction under certain load conditions. IET Electr. Power Appl. 2021, 15, 1512–1528. [Google Scholar] [CrossRef]
- Wu, Z.; Fan, Y.; Lee, C.H.; Gao, D.; Yu, K. Vibration Optimization of FSCW-IPM Motor Based on Iron-Core Modification for Electric Vehicles. IEEE Trans. Veh. Technol. 2020, 69, 14834–14845. [Google Scholar] [CrossRef]
- Wang, S.; Li, H. Reduction of Electromagnetic Vibration and Noise in Permanent Magnet Motor for EVs by Optimizing Design of Rotor Based on GPR-PSO Model. J. Electr. Eng. Technol. 2020, 15, 1231–1243. [Google Scholar] [CrossRef]
- Besbes, M.; Picod, C.; Camus, F.; Gabsi, M. Influence of stator geometry upon vibratory behaviour and electromagnetic performances of switched reluctance motors. IEE Proc. Electr. Power Appl. 1998, 145, 462–467. [Google Scholar] [CrossRef]
- Kim, H.J.; Lee, T.G.; Kwon, S.O.; Hong, J.P. Vibration analysis according to stator shape design in a PMSM. In Proceedings of the 2010 International Conference on Electrical Machines and Systems, Incheon, Republic of Korea, 10–13 October 2010; pp. 1235–1238. [Google Scholar]
- Valavi, M.; Nysveen, A.; Nilssen, R.; Rolvag, T. Slot harmonic effect on magnetic forces and vibration in low-speed permanent-magnet machine with concentrated windings. IEEE Trans. Ind. Appl. 2014, 50, 3304–3313. [Google Scholar] [CrossRef]
- Li, X.; Zhang, L.; Ying, H.; Huang, S.; Zhang, Q. IET Electric Power Applications Study of suppression of vibration and noise of PMSM for electric vehicles. IET Electr. Power Appl. 2020, 14, 1274–1282. [Google Scholar] [CrossRef]
- Moon, J.H.; Kang, D.W. Torque Ripple and Cogging Torque Reduction Method of IPMSM Using Asymmetric Shoe of Stator and Notch in Stator. J. Electr. Eng. Technol. 2022, 17, 3465–3471. [Google Scholar] [CrossRef]
- Liang, J.; Parsapour, A.; Yang, Z.; Caicedo-Narvaez, C.; Moallem, M.; Fahimi, B. Optimization of air-gap profile in interior permanent-magnet synchronous motors for torque ripple mitigation. IEEE Trans. Transp. Electrif. 2019, 5, 118–125. [Google Scholar] [CrossRef]
- Zhou, Y.; Ji, J.; Zhao, W.; Zhu, S.; Liu, H. Modulated Vibration Reduction Design for Integral-Slot Interior Permanent Magnet Synchronous Machines. IEEE Trans. Ind. Electron. 2022, 69, 12249–12260. [Google Scholar] [CrossRef]
- Zhu, S.; Zhao, W.; Ji, J.; Liu, G.; Lee, C.H. Design to Reduce Modulated Vibration in Fractional-Slot Concentrated-Windings PM Machines Considering Slot-Pole Combination. IEEE Trans. Transp. Electrif. 2023, 9, 575–585. [Google Scholar] [CrossRef]
- Mendizabal, M.; McCloskey, A.; Poza, J.; Zarate, S.; Iriondo, J.; Irazu, L. Optimum slot and pole design for vibration reduction in permanent magnet synchronous motors. Appl. Sci. 2021, 11, 4849. [Google Scholar] [CrossRef]
- Gómez, I.; García, G.; McCloskey, A.; Almandoz, G. Analytical model to calculate radial forces in permanent-magnet synchronous machines. Appl. Sci. 2021, 11, 10865. [Google Scholar] [CrossRef]
- Almandoz, G.; Poza, J.; Ángel Rodríguez, M.; González, A. Analytical Model of a PMSM Considering Spatial Harmonics. In Proceedings of the 2008 International Symposium on Power Electronics, Electrical Drives, Automation and Motion, Ischia, Italy, 11–13 June 2008; pp. 603–608. [Google Scholar] [CrossRef]
- Gomez, I. Design Methodology for Achieving Reliable Permanent Magnet Synchronous Machines. Ph.D. Thesis, Mondragon Unibertsitatea, Mondragón, Spain, 2017. [Google Scholar]
- Xu, X.; Han, Q.; Chu, F. Review of Electromagnetic Vibration in Electrical Machines. Energies 2018, 11, 1779. [Google Scholar] [CrossRef]
- McCloskey, A.; Arrasate, X.; Hernández, X.; Gómez, I.; Almandoz, G. Analytical calculation of vibrations of electromagnetic origin in electrical machines. Mech. Syst. Signal Process. 2018, 98, 557–569. [Google Scholar] [CrossRef]
- Yang, S. Low-Noise Electrical Motors; Clarendon Press: New York, NY, USA, 1981. [Google Scholar]
- Saltelli, A.; Annoni, P.; Azzini, I.; Campolongo, F.; Ratto, M.; Tarantola, S. Variance based sensitivity analysis of model output. Design and estimator for the total sensitivity index. Comput. Phys. Commun. 2010, 181, 259–270. [Google Scholar] [CrossRef]
- Sobol, I.M. Global sensitivity indices for nonlinear mathematical models and their Monte Carlo estimates. Math. Comput. Simul. 2001, 55, 271–280. [Google Scholar] [CrossRef]
- Homma, T.; Saltelli, A. Importance measures in global sensitivity analysis of nonlinear models. Reliab. Eng. Syst. Saf. 1996, 52, 1–17. [Google Scholar] [CrossRef]
Figure 1.
Magnetic flux density waveform, with and without the fringing coefficient, from [27].
Figure 1.
Magnetic flux density waveform, with and without the fringing coefficient, from [27].

Figure 2.
Example of a star of slots, from [29].
Figure 2.
Example of a star of slots, from [29].

Figure 3.
Total-effect indices for several input range sizes, (a) Vibration, (b) Torque.

Figure 4.
Total-effect indices modifying the range of , (a) Vibration, (b) Torque.

Figure 5.
Total-effect indices modifying the range of g, (a) Vibration, (b) Torque.

Figure 6.
Total-effect indices modifying the nominal value of , (b) Vibration, (a) Torque.

Figure 7.
Total-effect indices modifying the nominal value of g, (a) Vibration, (b) Torque.

Figure 8.
Total-effect indices for the Vibration and Torque.

Figure 9.
Scattered plot of all the simulated cases.


Table 1.
Geometrical dimensions of the electric machine.
| Name | Description | Value [mm] |
|---|---|---|
| Internal diameter of the rotor | 202.4 | |
| Height of the magnets | 5.3 | |
| g | Length of the air gap | 1 |
| Height of the teeth | 25 | |
| Width of the teeth | 7.71 | |
| Width of the slots | 8 | |
| Width of the stator yoke | 17.5 | |
| External diameter of stator | 300 | |
| Length of the stator | 175 |
Table 2.
Standard deviations of the mean for different numbers of samples.
| Vibration | 0.773% | 0.346% | 0.155% | 0.110% |
| Torque | 0.583% | 0.261% | 0.117% | 0.082% |
Table 3.
Sensitivity indices—200 samples.
| g | Total | ||||||
|---|---|---|---|---|---|---|---|
| Vibration | 0.718 | 0.173 | 0.005 | 0.123 | 0.012 | 1.031 | |
| 0.760 | 0.133 | 0.009 | 0.111 | 0.006 | 1.019 | ||
| Torque | 0.476 | 0.001 | 0.006 | 0.015 | 0.456 | 0.954 | |
| 0.469 | 0.000 | 0.017 | 0.016 | 0.473 | 0.976 |
Table 4.
Sensitivity indices—1000 samples.
| g | Total | ||||||
|---|---|---|---|---|---|---|---|
| Vibration | 0.733 | 0.124 | 0.007 | 0.113 | 0.007 | 0.984 | |
| 0.739 | 0.135 | 0.008 | 0.114 | 0.007 | 1.003 | ||
| Torque | 0.471 | 0.000 | 0.016 | 0.014 | 0.502 | 1.002 | |
| 0.474 | 0.000 | 0.017 | 0.017 | 0.494 | 1.002 |
Table 5.
Sensitivity indices—5000 samples.
| g | Total | ||||||
|---|---|---|---|---|---|---|---|
| Vibration | 0.735 | 0.130 | 0.008 | 0.115 | 0.007 | 0.995 | |
| 0.740 | 0.135 | 0.008 | 0.115 | 0.007 | 1.005 | ||
| Torque | 0.472 | 0.000 | 0.017 | 0.017 | 0.492 | 0.997 | |
| 0.474 | 0.000 | 0.017 | 0.017 | 0.493 | 1.001 |
Table 6.
Sensitivity indices—10,000 samples.
| g | Total | ||||||
|---|---|---|---|---|---|---|---|
| Vibration | 0.737 | 0.129 | 0.008 | 0.115 | 0.006 | 0.995 | |
| 0.741 | 0.134 | 0.008 | 0.115 | 0.007 | 1.006 | ||
| Torque | 0.474 | 0.000 | 0.017 | 0.017 | 0.491 | 0.998 | |
| 0.475 | 0.000 | 0.017 | 0.017 | 0.492 | 1.002 |
Table 7.
Sensitivity indices—Dependent inputs.
| g | Total | |||||||||
|---|---|---|---|---|---|---|---|---|---|---|
| Vibration | 0.179 | 0.258 | 0.002 | 0.118 | 0.007 | 0.122 | 0.114 | 0.254 | 1.055 | |
| 0.083 | 0.251 | 0.004 | 0.119 | 0.007 | 0.012 | 0.012 | 0.144 | 0.631 | ||
| Torque | 0.490 | 0.000 | 0.018 | 0.017 | 0.493 | 0.000 | −0.008 | −0.008 | 1.002 | |
| 0.492 | 0.000 | 0.017 | 0.017 | 0.493 | 0.000 | 0.000 | 0.000 | 1.020 |
Disclaimer/Publisher’s Note: The statements, opinions and data contained in all publications are solely those of the individual author(s) and contributor(s) and not of MDPI and/or the editor(s). MDPI and/or the editor(s) disclaim responsibility for any injury to people or property resulting from any ideas, methods, instructions or products referred to in the content. |
© 2023 by the authors. Licensee MDPI, Basel, Switzerland. This article is an open access article distributed under the terms and conditions of the Creative Commons Attribution (CC BY) license (https://creativecommons.org/licenses/by/4.0/).
Share and Cite
MDPI and ACS Style
Mendizabal, M.; McCloskey, A.; Poza, J.; Zarate, S.; Irazu, L. Sensitivity Analysis of the Design Parameters of Permanent Magnet Synchronous Motors for Vibration Reduction. Appl. Sci. 2023, 13, 5486. https://doi.org/10.3390/app13095486
AMA Style
Mendizabal M, McCloskey A, Poza J, Zarate S, Irazu L. Sensitivity Analysis of the Design Parameters of Permanent Magnet Synchronous Motors for Vibration Reduction. Applied Sciences. 2023; 13(9):5486. https://doi.org/10.3390/app13095486
Chicago/Turabian StyleMendizabal, Mikel, Alex McCloskey, Javier Poza, Sergio Zarate, and Leire Irazu. 2023. "Sensitivity Analysis of the Design Parameters of Permanent Magnet Synchronous Motors for Vibration Reduction" Applied Sciences 13, no. 9: 5486. https://doi.org/10.3390/app13095486
Note that from the first issue of 2016, this journal uses article numbers instead of page numbers. See further details here.