
Optimization Convolutional Neural Network for Automatic Skin Lesion Diagnosis Using a Genetic Algorithm


Institute of Systems Science, Durban University of Technology, Durban 4000, South Africa
*
Author to whom correspondence should be addressed.
Appl. Sci. 2023, 13(5), 3248; https://doi.org/10.3390/app13053248
Submission received: 2 February 2023
/
Revised: 24 February 2023
/
Accepted: 1 March 2023
/
Published: 3 March 2023
(This article belongs to the Section Computing and Artificial Intelligence)
Abstract
:Examining and predicting skin cancer from skin lesion images is challenging due to the complexity of the images. Early detection and treatment of skin lesion disease can prevent mortality as it can be curable. Computer-aided diagnosis (CAD) provides a second opinion for dermatologists as they can classify the type of skin lesion with high accuracy due to their ability to show various clinical identification features locally and globally. Convolutional neural networks (CNNs) have significantly improved the performance of CAD systems for medical image segmentation and classifications. However, tuning CNNs are challenging since the search space of all possible hyperparameter configurations is substantially vast. In this paper, we adopt a genetic algorithm to automatically configure a CNN model for an accurate, reliable, and robust automated skin lesion classification for early skin lesion diagnosis. The optimized CNN model uses four public datasets to train and be able to detect abnormalities based on skin lesion features in different orientations. The model achieves the best scores for each of the DICE coefficients, precision measure, and F-score. These scores compare better than other existing methods. Considering the success of this optimized model, it could be a valuable method to implement in clinical settings.
1. Introduction
Computer-aided diagnosis (CAD) uses a computer-generated output to assist a clinician in making a diagnosis. CAD can assist doctors in predicting deadly skin cancer diseases where the treatments are accessible and easier to implement at an early stage [1,2]. Dermatologists have traditionally used two approaches to identify the type of cancer, manual screening, and the use of dermoscopy tools which are magnifiers that can identify more details. Dermatology tools have been used widely to detect melanoma because they can identify melanoma cancer features in the early stages of development. Dermoscopy enables the viewer to detect structures and details that the naked eye cannot see under the epidermis. It provides a better representation of many pigmented structures such as pigment networks, blue-white areas, dots, and streaks, which cannot be observed by the naked eye [3,4]. Given that skin cancer is not easily identified as melanoma using one feature alone, dermatologists are more confident distinguishing the types of lesions using dermoscopy images. However, there are limitations in using either visual screening or dermoscopy tools to detect skin cancer diseases.
Screening of lesion images through manual or dermoscopic methods is tedious, complex, and prone to errors due to the subjective nature of skin lesion images [5,6]. The complexity of skin lesion images, including elements such as hair, blood vessels, oils, bubbles, and other image noise, make it challenging to identify lesion details unambiguously [7,8,9]. Furthermore, low contrast between the surrounding skin and lesion area, along with varying sizes, shapes, and skin lesion colors, hinder the efficiency of these methods [6,7,8]. As a result, manual screening has become challenging for dermatologists, and the need for an automatic computerized diagnostic system for accurate skin lesion detection and quick decision-making by dermatologists has become imperative [1,9,10,11].
The need for reliable, robust, and accurate CAD systems is fundamental and necessary. CAD can decrease the time taken for image examination and increase the accuracy of the final diagnosis. The limitations of visual skin lesion screening can be overcome by using a CAD system. The CAD system takes an image of the skin lesion as input and extracts a set of valuable features used to identify the type of skin lesion. Initial feasibility studies of CAD systems of skin lesions concluded that such systems could be a low-cost diagnostic tool [12]. A survey by Burroni et al. [13] found that even using a simple computer vision analysis algorithm produced reliable diagnostic results.
Recently, with advancements in technology, various CAD systems have been developed to analyze and diagnose skin cancer from medical images. The integration of CAD systems with dermoscopy images has become a significant field of research since they provide meaningful skin lesion information. This integration allows for further improvements in quick and accurate melanoma diagnoses. Thus, the current primary challenge for CAD systems is to develop an efficient automated tool for early disease diagnosis while ensuring a high level of accuracy in their diagnoses [14,15,16].
Moreover, research improvements in classifying and detecting skin cancer using CAD systems have evolved rapidly in recent years. However, there is still room for more enhancements due to several challenges [16]. First, the extraction of lesion structures such as pigment networks, region borders, streaks, and globules or dots is complicated and needs more attention. Second, poor image quality, such as intensity inhomogeneity and noise, can result in CAD systems failing to reach the optimal detection results due to the complicated structures of the melanoma. Third, most CAD systems focus on the binary classification of melanoma even though non-melanoma cancer can classify into several types of skin cancers. Fourth, most of these systems suffer from performance deterioration across different datasets; hence, they are dataset-dependent to some degree [14,15,16]. With these issues in mind, the primary purpose of this research is to propose an automated CAD system that can identify, differentiate and classify several types of skin cancers and improve the performance of the existing CAD system.
A classification model for skin lesions can assist dermatologists in accurately identifying the type of skin cancer, which can facilitate early detection and improve patient outcomes. Automated classification can also help reduce subjectivity in diagnosis, enable faster and more accurate triage, and improve access to care, particularly in areas where dermatology specialists are scarce. Therefore, developing a skin lesion classification model for skin cancers is a significant motivation for advancing the field of dermatology and improving patient outcomes. This motivated our study to propose a genetic algorithm that could generate the best hyperparameters from a well-known CNN architecture.
The optimized CNN was trained and tested on different datasets to detect and distinguish various skin lesions. The training images are pre-processed to remove hair, blood vessels, and other factors interfering with identifying boundaries and improving low contrasts between the lesion area and the surrounding skin causing blurry boundaries. Pre-processed techniques are also applied to smooth weak, irregular, fuzzy borders and remove unwanted small regions. This process can assist in extracting deep features and producing more discriminative and robust representations. Second, a normalization technique is applied since skin lesion images usually have different sizes, shapes, and colors depending on skin conditions, which could hamper achieving high classification accuracy. The genetic algorithm developed here is used in a unique way to find the optimal hyperparameters of the CNN. To our knowledge, this use of a genetic algorithm is new to this type of methodology.
The aim of the optimized CNN model presented here is to create a fully automatic computer-aided diagnosis system for skin lesion detection and classification that: (a) reduces the computational cost, and (b) provides efficient extraction of skin lesion features even in the case of limited training datasets.
2. Related Works
In biomedical applications, Convolution Neural Network (CNN) models are prominent. hundreds of thousands of articles on CNN-based medical image applications are published every year. The authors Wen-Yu Chang et al. [17] proposed a new CADx system to analyze and diagnose melanocytic and non-melanocytic skin lesions. This model was developed using conventional digital photographic images. The model is based on support vector machines to classify lesions as benign or malignant. They concluded that conventional digital micrographs could provide essential information for the CAD system to achieve the desired objectives.
CAD system using texture analysis method has been developed for skin lesion detection [18]. The system provides four stages: hair removal, image filtering, feature extraction, and classification techniques. Each stage plays a significant role in skin lesion classification. Additionally, a survey study provided a comprehensive analysis of methods and algorithms that have been proposed to segment and classify the types of skin lesions [16].
Suganya [19] used an automated CAD system of skin lesion detection and classification for dermoscopy images. K-means classification was used to cluster and segment the skin lesions. Then, support vector machines (SVM) are applied to classify the types of skin lesions, such as melanoma, basal cell carcinoma (BCC), seborrhoeic keratosis (SK) and Nevus. A CAD system that applies two stages to segment and classifies skin cancer melanoma from skin lesion images is developed [20]. The approach starts with a preprocessing step that removes unwanted noise as well as hair; then, the segmentation stage selects the region of interest using a mean-shift algorithm. The features extraction algorithm is used to obtain features to feed into various classification algorithms such as KNN, a decision tree and SVM. A CAD system for segmentation and classification of skin lesion disease diagnosis was also developed by Sumithra et al. [21]. In this model, a region-growing algorithm is used for the segmentation while SVM and KNN classifiers were used to predict the skin lesion type.
A fully automated CAD system was proposed to segment and classify skin lesions based on deep learning features by Adegun and Viriri [14]. The method incorporates five essential stages of segmentation and classification. Firstly, contrast stretching is applied with a hybrid approach using local color-controlled histogram intensity values (LCcHIV). Thereafter, a deep saliency-based technique is adopted to compute a saliency map refined through a superpixel technique. After that, images are transformed into binary images, and morphological algorithms are performed to refine the extracted lesions.
The majority of the techniques discussed above make use of a large number of parameters which makes deep neural networks more complex. These systems can perform the classification of skin lesions using a moderate number of parameters in the deep convolutional neural network. Some of the architectures discussed in this section are slow and require a significant amount of computing processing power to perform real-time medical analysis and diagnosis. The system proposed here should improve this performance.
Finding the optimal hyperparameters for CNN architectures used for skin lesion classification can be challenging due to several factors. One of the factors is the large number of parameters in most CNN architectures, which makes training them computationally expensive and requires a substantial amount of labeled data. There are several approaches researchers have proposed in order to overcome these challenges. One method is a genetic algorithm (GA) for skin lesion classification to optimize the CNN model [22,23,24]. Genetic algorithms are inspired by evolution theory and use natural operations such as mutation, crossover, and selection. It determines and selects the fittest individual for the propagation of the search. Particle swarm optimized (PSO) is also used to optimize a CNN model to reduce skin lesion challenges [24,25,26]. PSO is a stochastic optimization technique; it employs the concept of social interaction to solve search problems. It iteratively uses several items to achieve the optimization goal. Differential evolution (DE) is another CNN optimization algorithm used to find the best hyperparameters [24,27]. DE is a population-based metaheuristics algorithm; it uses a large population of search agents to interact with each other and predict the best search in the solution space. Ant colony optimization (ACO) is a heuristic search algorithm that mimics the foraging behavior of ant colonies and possesses excellent global and local search capabilities. In addition, ACO can accelerate the search process by incorporating a filter-based feature selection (FS) model and using additional parameters to guide the search [28,29]. However, there is still room for finding new CNN optimization algorithms for training CNNs. While many optimization algorithms have been proposed, there is ongoing research to develop new optimization algorithms that can overcome limitations and achieve better performance.
3. Materials and Methods
To improve skin lesion detection and classification a fully automatic CAD system is presented based on enhancements to the models discussed above. The model is CCN-based with a fully connected neural framework using a genetic algorithm to generate the best hyperparameters. This approach reduces the computational cost and weight size by integrating compressed convolutional blocks, via downsampling and a fully connected neural network (FCN). Downsampling integrated with the FCN also allows the system to efficiently extract skin lesion features even with limited training datasets.
The proposed optimized CNN-based model is trained and tested using four available public datasets of skin lesion images, each with their ground truth image label. The ground truth information is crucial in evaluating the training and testing stages to validate the proposed model. It can also be used in the testing phase for performance evaluation metrics.
3.1. The Proposed Model
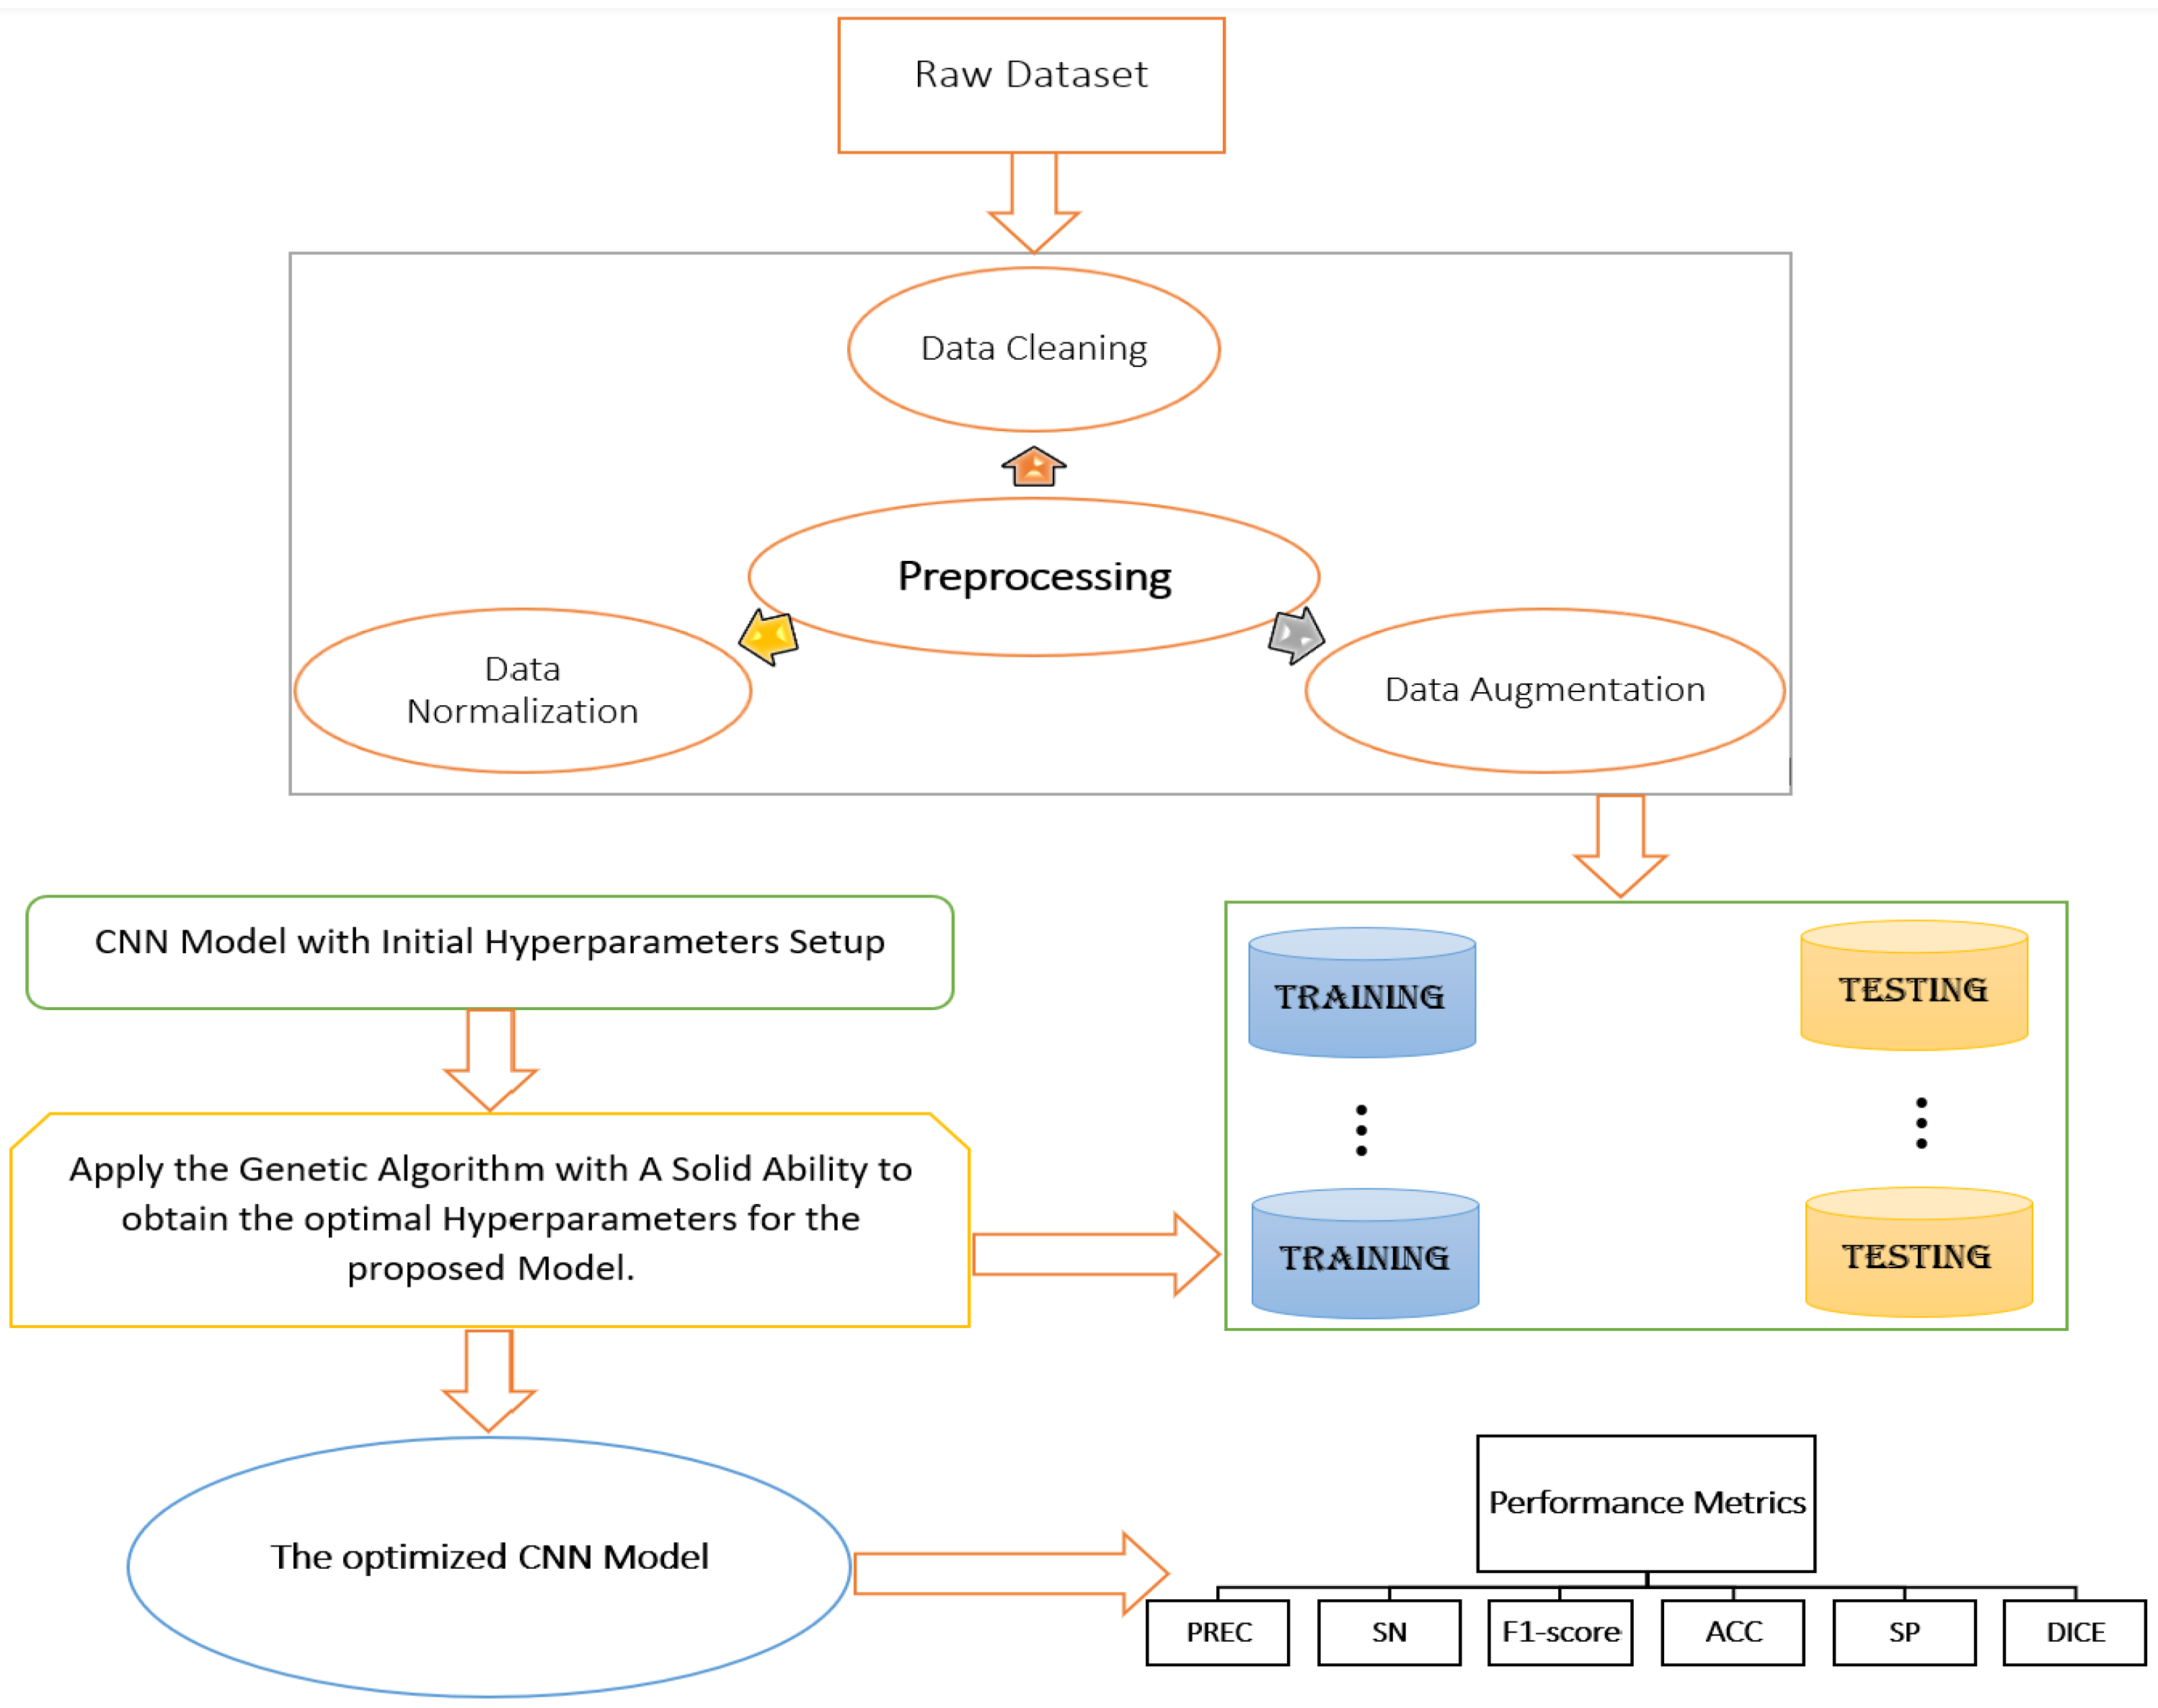
The steps of the method are shown in Figure 1. First, an image pre-processing stage is applied which includes image augmentation to balance the datasets and data normalization. After that, a genetic algorithm is applied to select the best hyperparameters that lead to an optimized CNN model. The model is then trained to extract the skin lesion features using pixel-wise and lesion classification. After that, the model is evaluated using six performance metrics including DICE, ACC, SN, SP, PREC and F-score.
3.2. Datasets
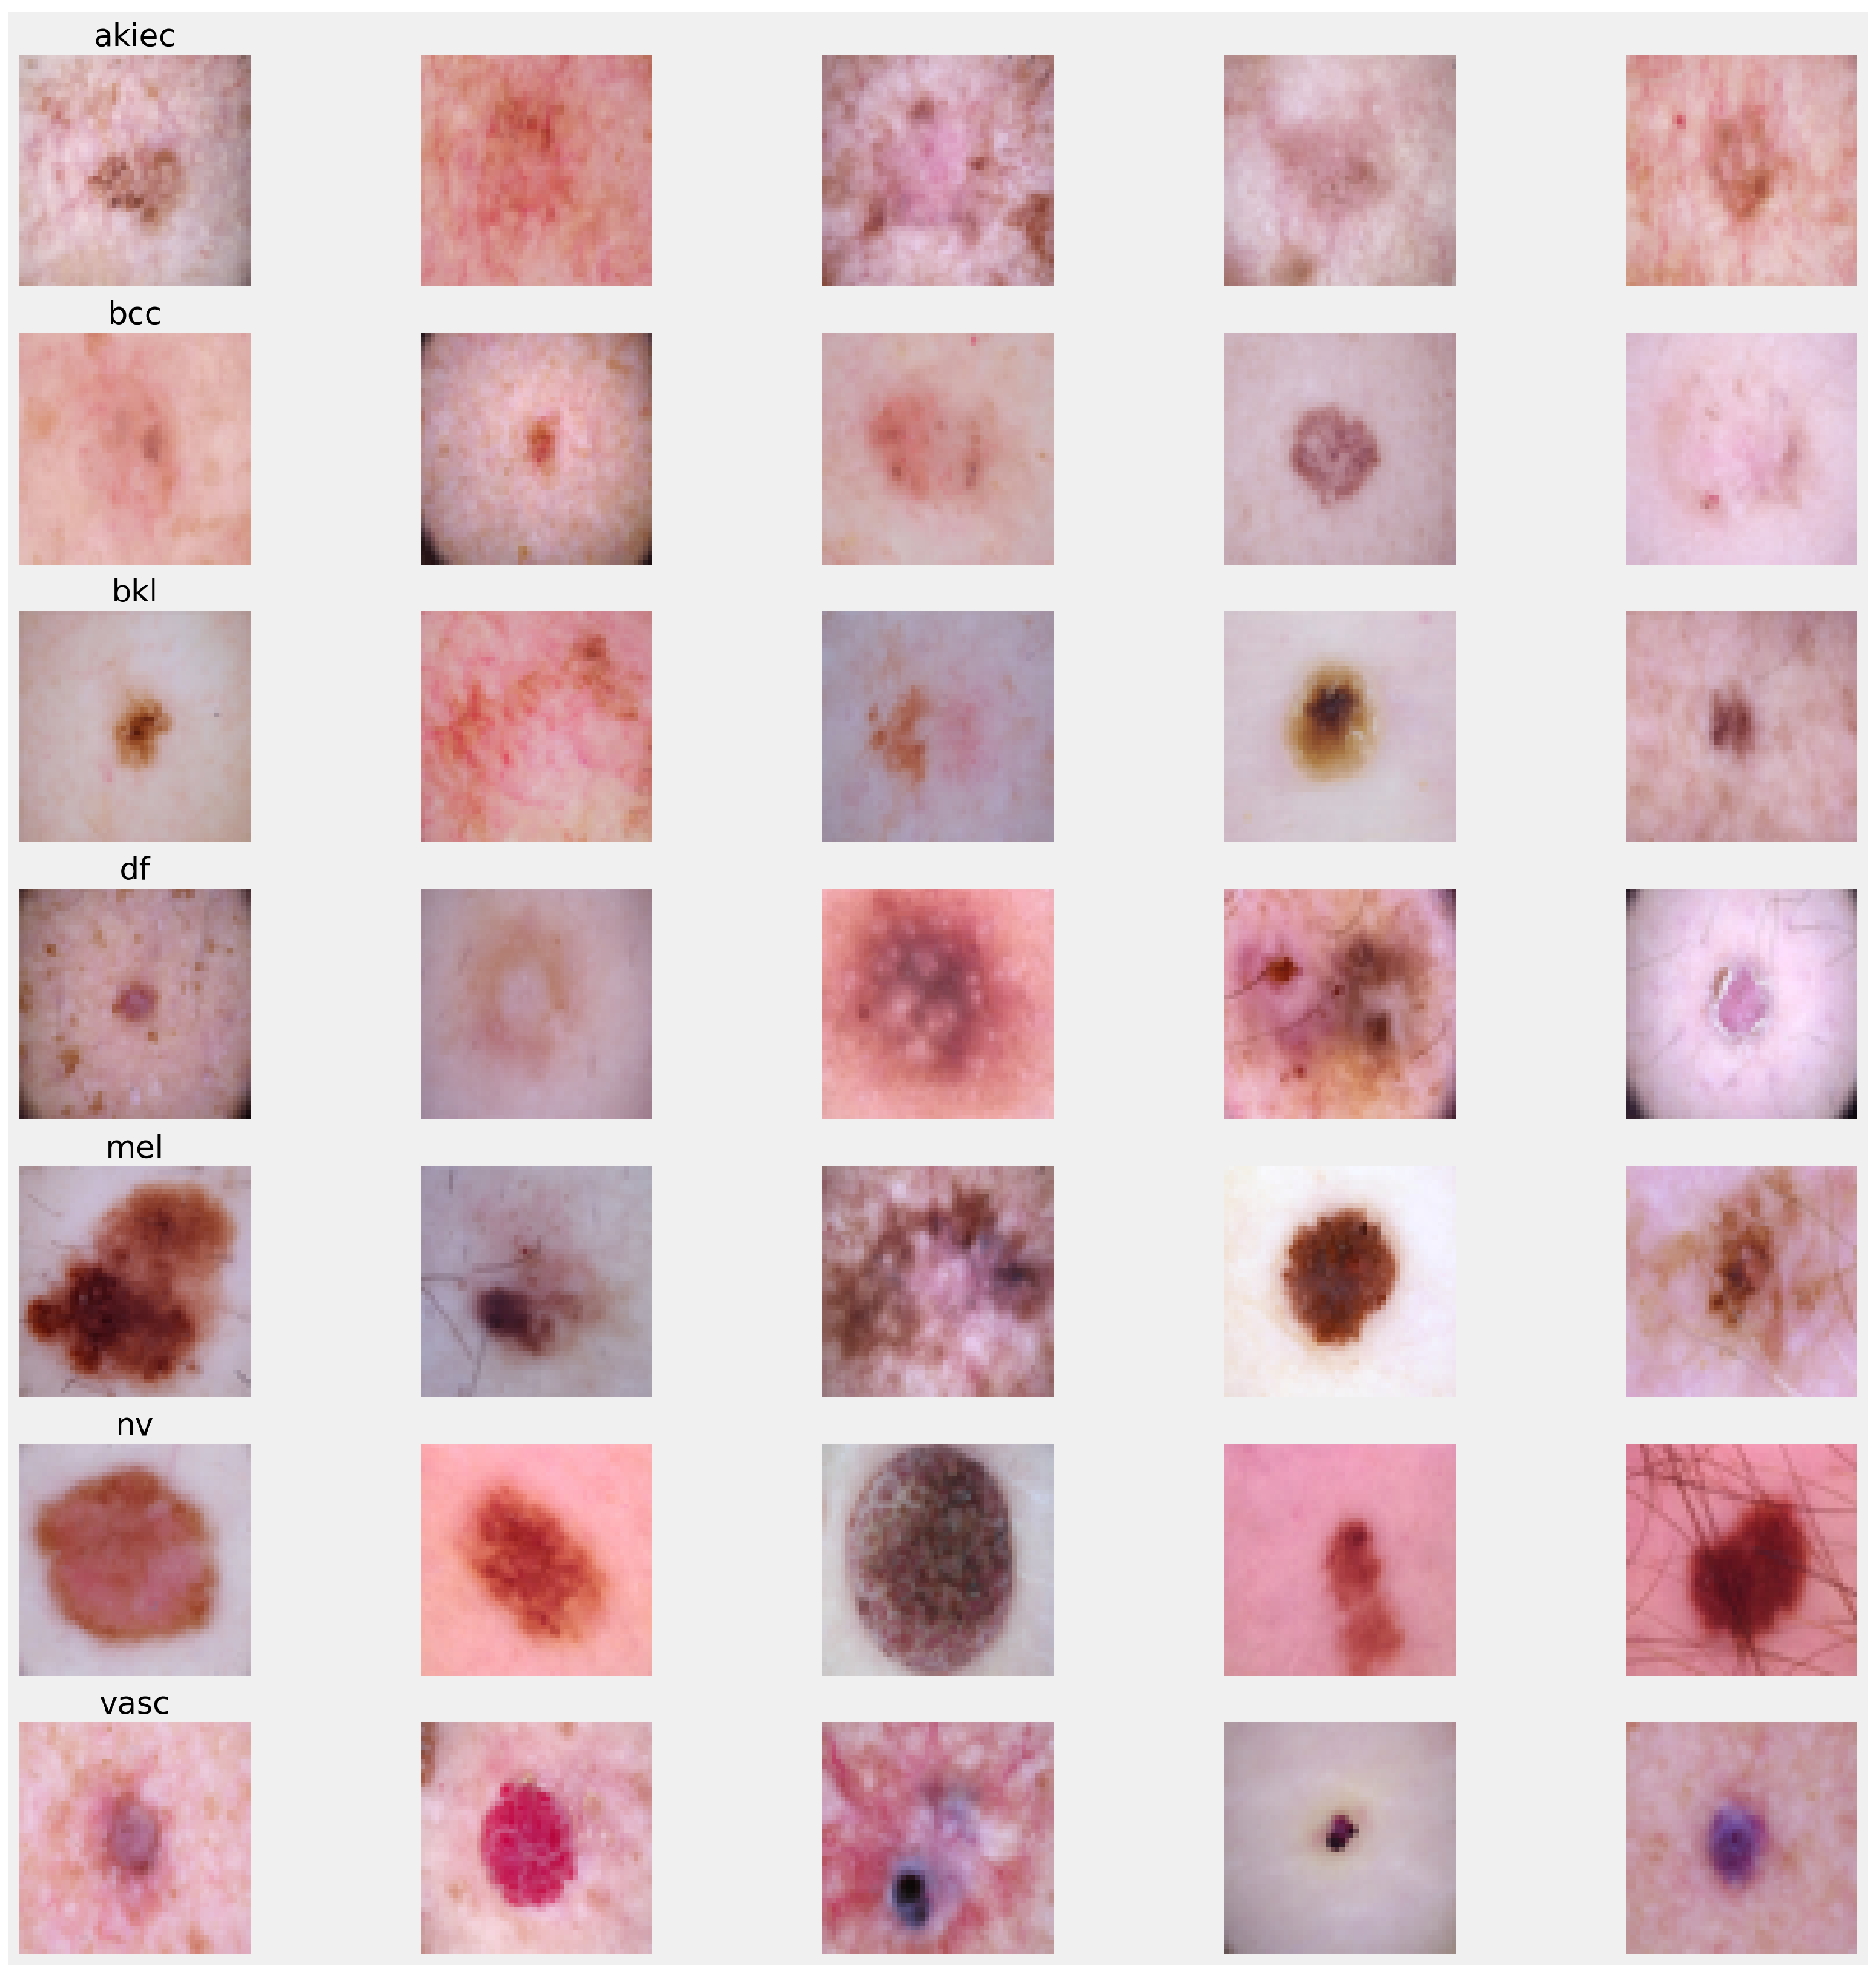
The HAM10000 (Human Against Machine with 10,000 training images) dataset has been made available [30] to tackle the lack of diversity in datasets available to train deep neural networks for the automated diagnosis of pigmented skin lesions. The HAM10000 dataset has been collected from various dermoscopic image data sources and stored in various modalities. It contains dermoscopic images and these are used here. The HAM10000 cases cover all the essential diagnostic categories of pigmented lesions. This includes melanoma (MEL= 1113), melanocytic nevus (NEV = 6705), basal cell carcinoma (BCC = 514), actinic keratosis or Bowen’s disease (AKIEC = 327), benign keratosis (BKL = 1099), dermatofibroma (DF = 115), and vascular lesions (VASC = 115). The dataset includes lesions with multiple images, which can be tracked to obtain the ground truth for each image using the HAM10000 metadata. Figure 2 depicts some of these samples.
The ISIC 2017, ISIC 2018 and ISIC 2019 datasets were published by the International Skin Imaging Collaboration (ISIC) as a large-scale dataset of dermoscopy images that allow researchers to tackle lesion classification challenges [30,31,32]. The dataset is updated annually by releasing annually updated dermoscopic image data from international health centers. The selected ISIC datasets contain 2000, 10,015 and 25,331 dermoscopic images in the ISIC 2017, ISIC2018 and ISIC2019 datasets, respectively. These datasets include the ground truth for various pigmented lesion categories. The ISIC 2017 images are used to classify skin lesions into three categories, including melanoma (MEL = 374), seborrheic keratos (KER = 254), and benign nevi (NEV = 1372). The ISIC2018 dataset classifies the dermoscopic images into one of the following categories: melanoma (MEL), melanocytic nevus (NEV), basal cell carcinoma (BCC), actinic keratosis or Bowen’s disease (AKIEC), benign keratosis (BKL), dermatofibroma (DF), and vascular lesions (VASC). The ISIC2019 dataset is also classified into the same categories with the addition of one more category for Squamous cell carcinoma (SCC). The datasets consist of color images with an RGB format and a high resolution.
3.3. Data Pre-Processing Techniques
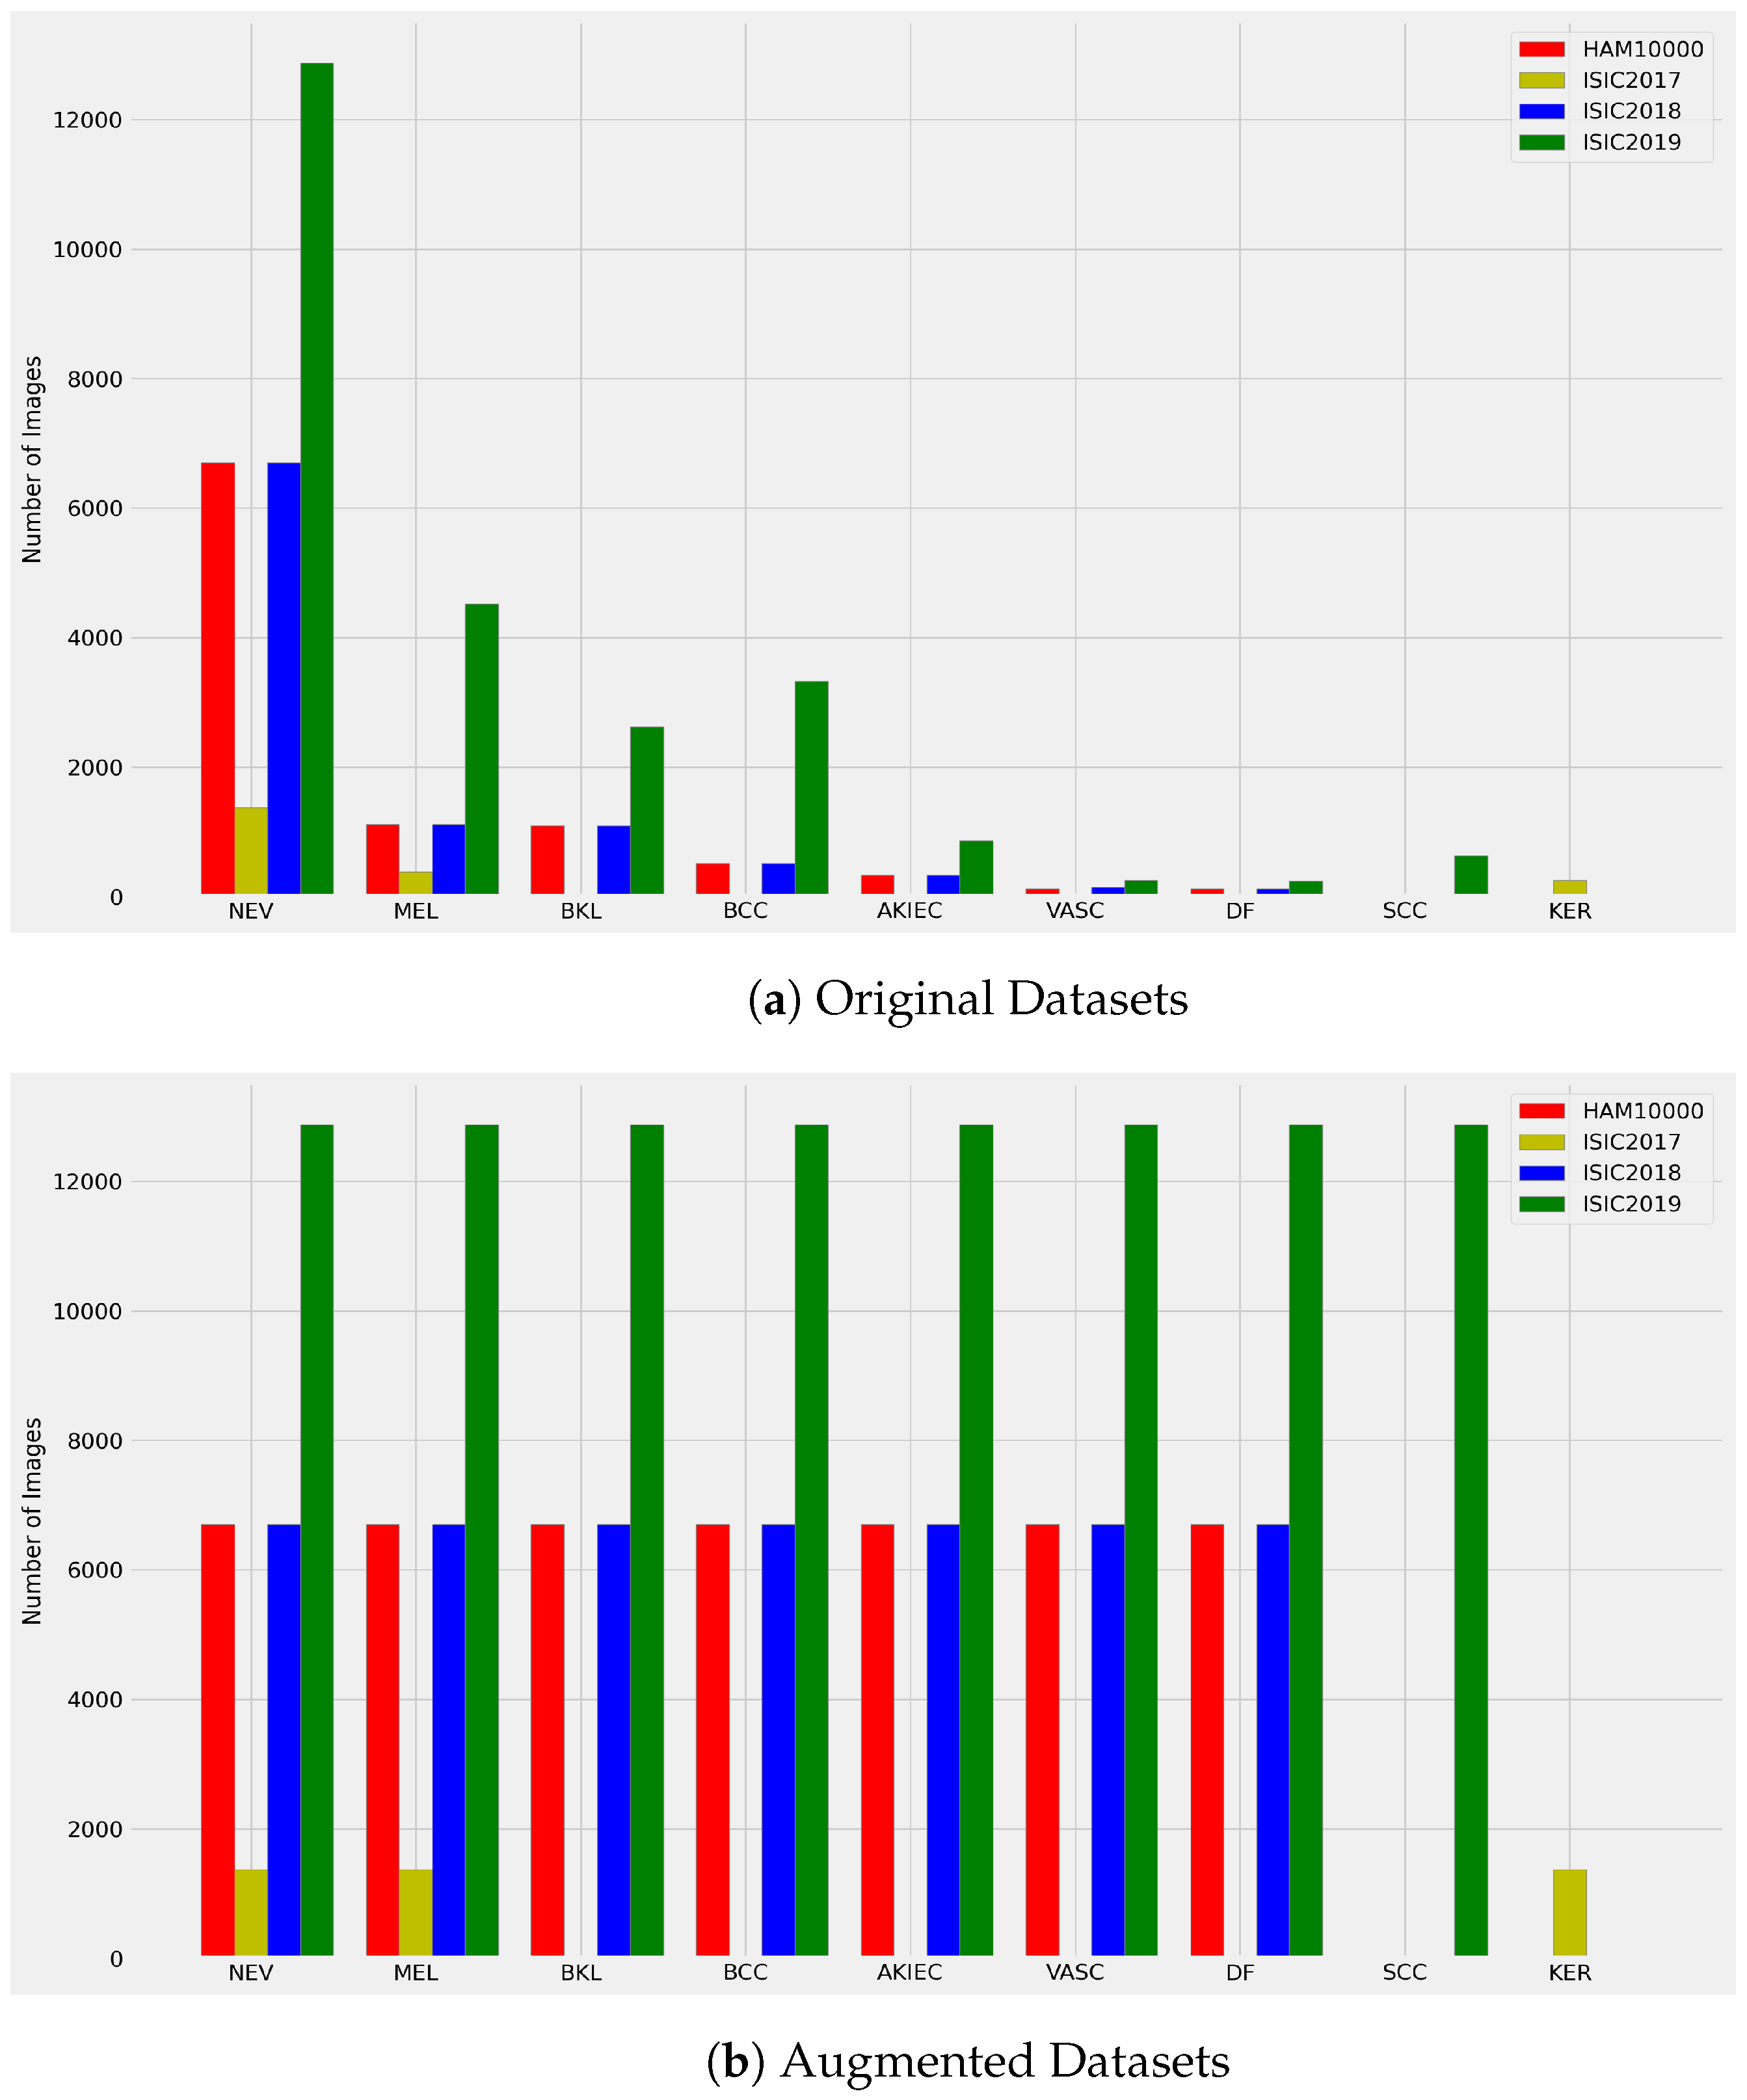
Imbalanced datasets have a severe skew in the class distribution. The available datasets for training and testing the optimized CNN model are imbalanced as depicted in Figure 3. For instance, the HAM10000 dataset includes seven classes of skin cancer where NEV lesion class has the 6705 images and the DF lesion class has 115 images only. This problem can lead to a bias during the training stage that can reduce the predictive performance of the model by undermining the minority classes in favor of the majority classes. This is a problem as it is typically the minority class predictions that are most important. Many approaches can address the class imbalance challenges, such as randomly resampling the training dataset. The two main approaches to randomly resampling an imbalanced dataset are to delete examples from the majority class, called undersampling, or duplicate examples from the minority class called oversampling [33]. In this work, we have used an oversampling approach to increase the number of minority classes without duplicating examples.
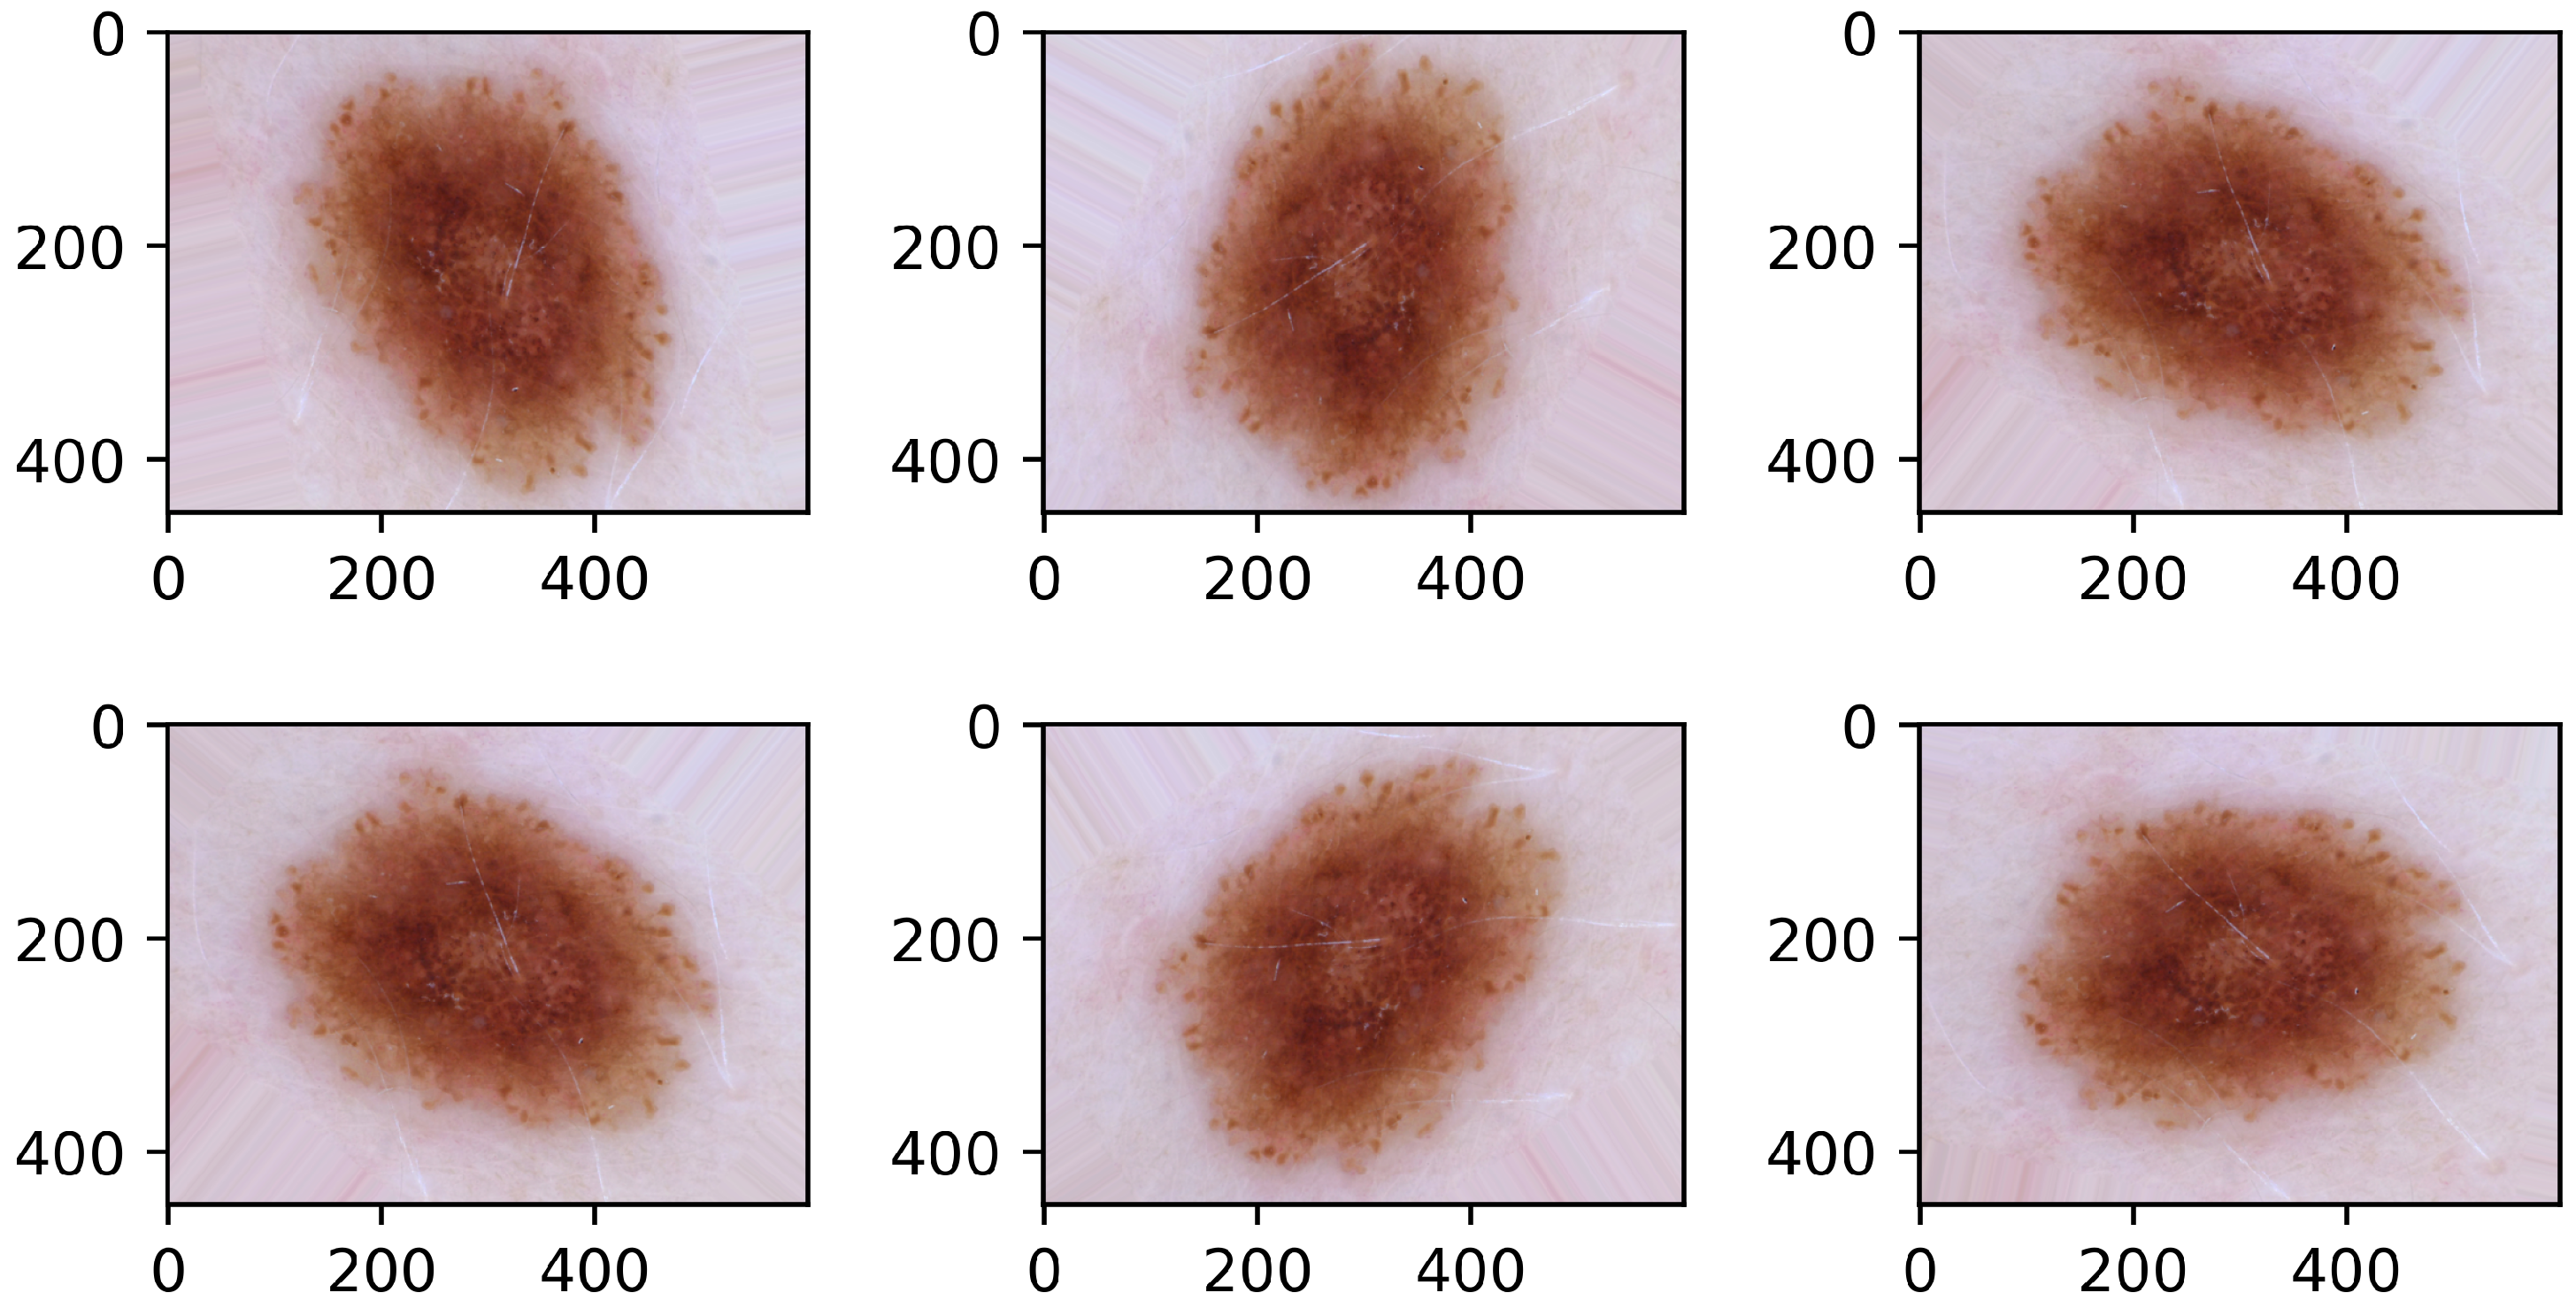
The augmentation technique was employed to balance the datasets instead of using duplication methods, as it offers an improved training data balance for the proposed model. The augmentation process involved applying elastic deformations through random displacements. These elastic deformations utilized local distortions, random affine transformations with random displacements, and smoothing operations with a Gaussian filter. Simple random rotations were also used in the augmentation process to improve performance further. The new augmented images were created by performing operations such as rotating, panning, twisting, and filling any gaps. Also. to ensure there were no mixed classes, they were produced using a separate approach for each class from the dataset. Figure 4 illustrates the augmented images that effectively address the imbalance issues in the datasets. As a result, the number of samples in the datasets were increased to 46,935, 102,976, 4116, and 46,935 images for HAM10000, ISIC2019, ISIC2017 and ISIC2018, respectively, (Figure 3).
After carefully using the image augmentation technique to balance the datasets the CNN is more likely to provide reliable results. Pre-processing of high-quality datasets can cause reliable models to provide outstanding results. After the augmentation has been applied, the images can possess variations in size as well as possess multi-scale and multi-resolution features. The next and most critical step in the pre-processing phase is to make sure that all the images are of equal scale and resolution through cropping, resizing, and re-sampling. We use a relatively small image size of as an input in this work because it allows for a more manageable feature map. The images are then normalized by first computing the mean pixel value, subtracting this value over the entire dataset to center the data, calculating the standard deviation, and dividing the pixel values by this value.
3.4. The Genetic Algorithm
This paper uses a genetic algorithm that has been shown to effectively select the optimal hyperparameters to achieve skin lesion classification [34,35,36]. However, the application of the algorithm used is unique as shown below.
Hyperparameter Optimization Problem Formulation: A CNN model can be defined as a function where is the set of all datasets, presents the space of all models and is the chosen hyperparameter configuration with being the p-dimensional hyperparameter space of CNN model . The learning model estimates a model that minimizes a loss function (e.g., misclassification rate) with its model regularization term :
Then, hyperparameter optimization aims to find the optimal hyperparameter configuration using a validation set, i.e.,
The is the miscalculation rate or loss function rate. The hyperparameter space includes all possible values that are usually defined as acceptable bounds for each hyperparameter and the number of the hyperparameter is the dimension of the function.
Contribution: this basic structure of the genetic algorithm considers only one function called the loss function as the test point, which can be sufficient for some applications. However, in biomedical image applications, the success of a CAD system is associated with tuning multi-evaluation metrics and each metric has the potential to improve the performance of the CAD system. For example, choosing the Recall metric to tune the CNN model without considering other metrics could lead to misclassification if other metrics are kept static. The genetic algorithm used for this work considers six evaluation metrics to tune the CNN model to overcome these issues. Thus, this genetic algorithm focuses on finding the optimal hyperparameters that correspond to the highest evaluation metrics and Equation (2) becomes:
where is a vector that contains five validation metrics, and i denotes each of these metrics (DICE, ACC, SN, SP, PREC and F-score). The hyperparameter response function is the misclassification rate for the corresponding i metric. Thus, the genetic algorithm selects the optimal hyperparameter that maximizes the six validation metrics [37,38,39]. In the context of a CNN model, a fitness function, based on six metrics, determines how well a particular set of model parameters performs on a skin lesion classification task. Unlike existing applications, the fitness function used here incorporates all the metrics. The fitness function is used to evaluate the fitness of different candidate solutions (i.e., sets of model parameters) and guide the selection of new solutions for further evolution. This modification of using multi-metrics was developed to ensure the optimized CNN model could classify the type of skin lesion with the lowest misclassification rate for various validation metrics. More details about the evaluation metrics are explained below.
3.4.1. Fitness Function
The GA developed here is used to find the optimal hyperparameters by treating the hyperparameters as the genes of an individual in a population. The individuals in the population represent different combinations of hyperparameters, and the fitness of each individual is evaluated using multi-evaluation metrics. To evaluate the fitness of an individual, the CNN model is trained using the hyperparameters represented by the individual, and the evaluation metrics are calculated on a test set. The evaluation metrics can be computed in parallel using multiple threads or processes, thereby speeding up the optimization process. The individuals in the population are then selected based on their fitness values. In this way, the genetic operators of crossover and mutation are applied to create new individuals for the next generation. The selection, crossover, and mutation process are repeated for multiple generations until the optimal set of hyperparameters is found.
Our proposed algorithm utilizes single-point crossover, where a chosen point in both parents’ chromosomes serves as the dividing point. In this stud, we use the midpoint of each chromosome as the crossover point. This divides the chromosomes into two equal parts. The child is created by taking the first half of genes from one parent and the second half from the other.
The mutation operator modifies a gene from the chromosome of individuals created through a crossover. The gene to be mutated is selected randomly, and the range of variation is restricted to the acceptable values defined for the same hyperparameter. This operator enhances population diversity, allowing the genetic algorithm to search a wider space.
3.4.2. GA Structure
The GA developed in this study operates on a group of individuals or chromosomes, each representing a potential solution with corresponding fitness values that assess its suitability for solving the problem. At each iteration, the GA selects candidate solutions randomly from the current generation, which acts as parents to create the next generation of children. This evolutionary process continues until an optimal solution is reached through multiple iterations. The GA uses genetic operators such as selection, mutation, and crossover to allow for the evolution of solutions, retaining stronger generations and removing weaker ones. While the GA employs a random search strategy, it also utilizes historical information to direct search operations toward better-performing areas. In the first iteration, the gene is selected randomly and for further generations, the top 50% elite individuals with the highest fitness values are to be included in the next generation. These selected individuals are used to create the next generation through the application of crossover and mutation.
3.5. The CNN Model
CNNs [40] are a class of artificial neural networks used to detect, extract, and analyze image features. It consists of neurons composed of a set of layers characterized to accept and process images with high dimensional vectors as input. The CNN general constructor has several hyperparameters that play an essential role in achieving model performance. These hyperparameters can be divided into two types:
(a) Hyperparameters that determine the network structure are:
- Kernel Size is the size of the filter,
- Kernel Type shows values of the actual filter (e.g., edge detection, sharpen),
- Stride is the rate at which the kernel passes over the input image,
- Padding adds layers of 0’s to make sure the kernel passes over the image edges,
- Hidden layer is layers between input and output layers,
- Number of neurons is the number of neurons in each hidden layers,
- Activation function is used to learn nonlinear prediction boundaries.
(b) Hyperparameters that determine the network trained, which are:
- Learning rate regulates the update of the weight at the end of each batch,
- Momentum updates current weights using the previous values,
- The number of epochs is the overall number of training iteration,
- Batch size is the number of patterns shown to the network before the weights are updated.
The first skin lesion images are fed to the first layer. Then nine series of combined convolutional operations, Relu activation, and max-pooling are performed on them. Then, the extracted features from the first step are applied to a flattened layer, two dense layers, and a softmax operation to obtain the classification results. The optimized CNN aimed at achieving accurate classification of skin cancer images. The convolution layer is the foundation of the CNN and extracts features from the input images through filters, enabling recognition of more complex and significant portions of the image. The ReLU transformation is applied to the feature map after each convolution process to introduce nonlinearity to the model. Further convolutional layers or pooling layers are included to perform downsampling, reducing the size of the image maps. Finally, a fully connected layer is responsible for classifying the images based on the features extracted in the previous layers through various filters. The fully connected layer employs a softmax activation function to assign probabilities to each image class, with the class having the highest probability being selected as the final prediction.
3.6. Evaluation Metric Calculation
Various skin lesion classification metrics are used to evaluate the optimized CNN model, including the Dice similarity coefficient (DICE), Accuracy (ACC), Sensitivity (SN), Specificity (SP), Precision (PREC), and F-score to assess the performance of the proposed model. These metrics have been used widely in several studies and they are considered the most common evaluation metrics for image segmentation and classification. More details about these metrics are discussed as follows.
DICE measures the level of similarity or overlap between the actual result and the predicted outcomes [41]. This measure is defined as follows.
where the number of false positive, false negative, and true positive pixels are represented by and , respectively.
The ACC is a metric representing the ratio of correct results (both positive and negative) to the overall number of samples studied. [41], and has the following definition
where true negative pixels are presented by .
The SN, also known as recall or true positive rate (TPR), is a metric that quantifies the number of true positive predictions relative to the total number of positive cases. It is calculated as the ratio of true positive predictions to the number of positive cases. The calculation of SN is given
The SP calculates the accuracy of negative predictions by dividing the number of true negatives by the total number of negatives. It is also referred to as the true negative rate (TNR).
Precision (PREC), also known as the positive predictive value (PPV), is calculated as the ratio of the number of true positive predictions to the total number of positive predictions made.
Furthermore, the F-score is used to evaluate the model since it is the harmonic mean of precision and recall and can provide better insight into model performance. It is given
3.7. Experimental Setup
The experiments in this paper were executed on a personal computer equipped with an 11th Generation Intel Quadcore i7 processor with a clock speed of 2.11 GHz. The operating system on this machine was a 64-bit version of Windows 10. The computer’s hard drive was designed with a generous storage capacity of 1 TB, along with 16 GB of RAM, to ensure efficient and speedy performance. The experiments were implemented using the universal programming language Python and leveraged the capabilities of two essential packages—Tensorflow v1.1.0 and TFlearn 0.3. In addition, the python-friendly environment of Google Colab was utilized to enhance the experiments further. This environment is equipped with a full amount of storage space for datasets, 100 GB, and ample RAM, 13 GB, which were used to ensure the experiments were run with maximum efficiency.
4. Experimental Results
4.1. Training
This section presents the training and testing steps of a comprehensive and robust CNN model to classify skin lesions into multiple categories. The genetic algorithm is used to optimize the model’s hyperparameters by training it on an augmented HAM10000 dataset only, which was split into 80% training and 20% testing sets. Table 1 displays the hyperparameters found by the genetic algorithm. Once the optimized CNN model was obtained from the genetic algorithm, it was further trained and tested using three different datasets: HAM10000, ISIC2018, and ISIC2019. Each of these datasets was also divided into 80% training and 20% testing sets. The optimized model was also evaluated based on its ability to classify skin lesion images and achieve the best results as discussed below. All the results presented in this paper were obtained using the testing data of each dataset.
4.2. Hyperparameters Tunning
The GA developed here is employed to generate the optimal hyperparameters for the CNN model using the augmented version of the HAM10000 dataset, which is split into 80% and 20%, for training and testing, respectively. The other augmented datasets are not used to generate the optimal hyperparameters; instead, they are used to train and test the optimized CNN model only.
The GA starts the process using the initial values of the hyperparameters, which are shown in Table 2. The outcome of the algorithm is the model configuration with the highest fitness values. As a result, the optimized CNN model generated by the genetic algorithm has 13 layers consisting of one input layer, three convolutional layers, three Relu layers, three max-pooling layers, and three fully-connected layers (FCL). The FCL consists of one flattened layer, one dense layer, one softmax layer and one classification layer. Furthermore, the learning rate and epochs provided by the GA were 0.0001 and 50, respectively. The other best values for the hyperparameters of the genetic algorithm are represented in Table 1.
4.3. Performance Evaluation Analysis
This section presents the optimized CNN model’s experimental results of skin lesion classification. The model performance was assessed through the six evaluation metrics and tested on of the augmented HAM10000, ISIC2018, and ISIC2019 datasets. The evaluation metrics for the predicted classes using the testing datasets are shown in Table 3, Table 4, Table 5 and Table 6. These results display impressive results for all evaluation metrics of each skin lesion type and indicate that the optimized CNN model effectively identified and differentiated different skin lesion types from the augmented datasets.
The results show that the optimized CNN model performed exceptionally well when tested on the HAM10000 and ISIC2018 datasets. The accuracy was when tested on the HAM10000 dataset and on the ISIC2019 dataset. As shown in Table 3, all predicted classes in the augmented HAM10000 dataset performed well, indicating that the optimized CNN model can accurately differentiate between various features for each class. The F-score values, which ranged from 0.95 to 1, further demonstrate the effectiveness of the optimized CNN model in each class. Furthermore, Table 4 shows that all classes from the augmented ISIC2018 dataset produced high evaluation results.
The results in Table 5 show an F-score ranging between . From the defined ranges of classified F-score values, an F-score value greater than is acceptable, but values less than are not. Hence, the F-score range for this application is considered acceptable, since its F-score values fall above . Moreover, the PREC metric shows performance values between on the ISIC2019 dataset while the optimized model showed better performance for the HAM10000 and ISIC2018 datasets. For the PREC metric, best performance values are close to 1, where 0 exhibits a perfect negative performance and 1 exhibits a perfect positive performance. Hence, using this measure, the performance values of the optimized CNN model, can indicate how good the results are over all the datasets.
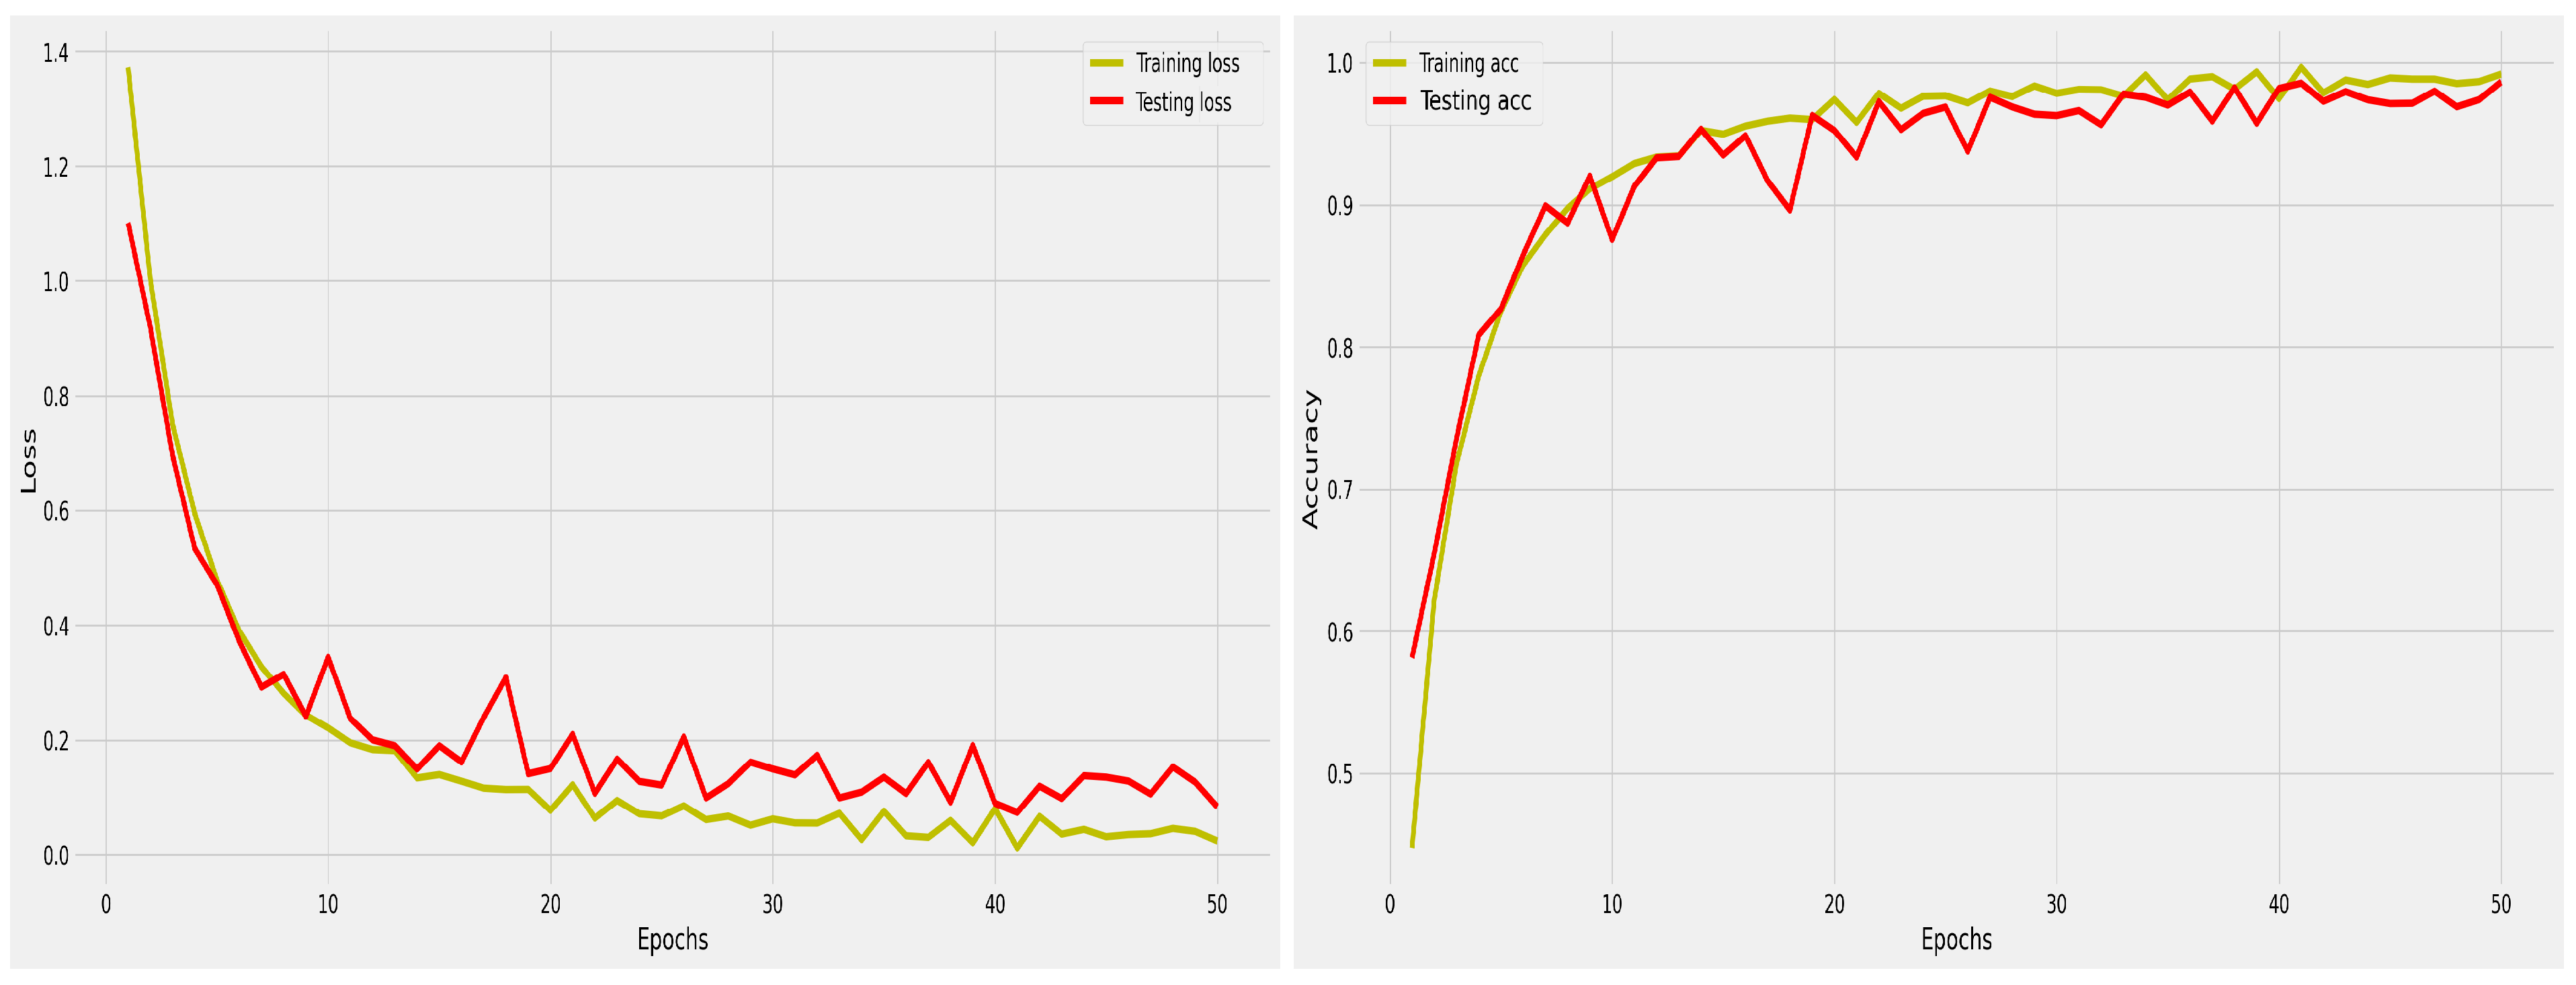
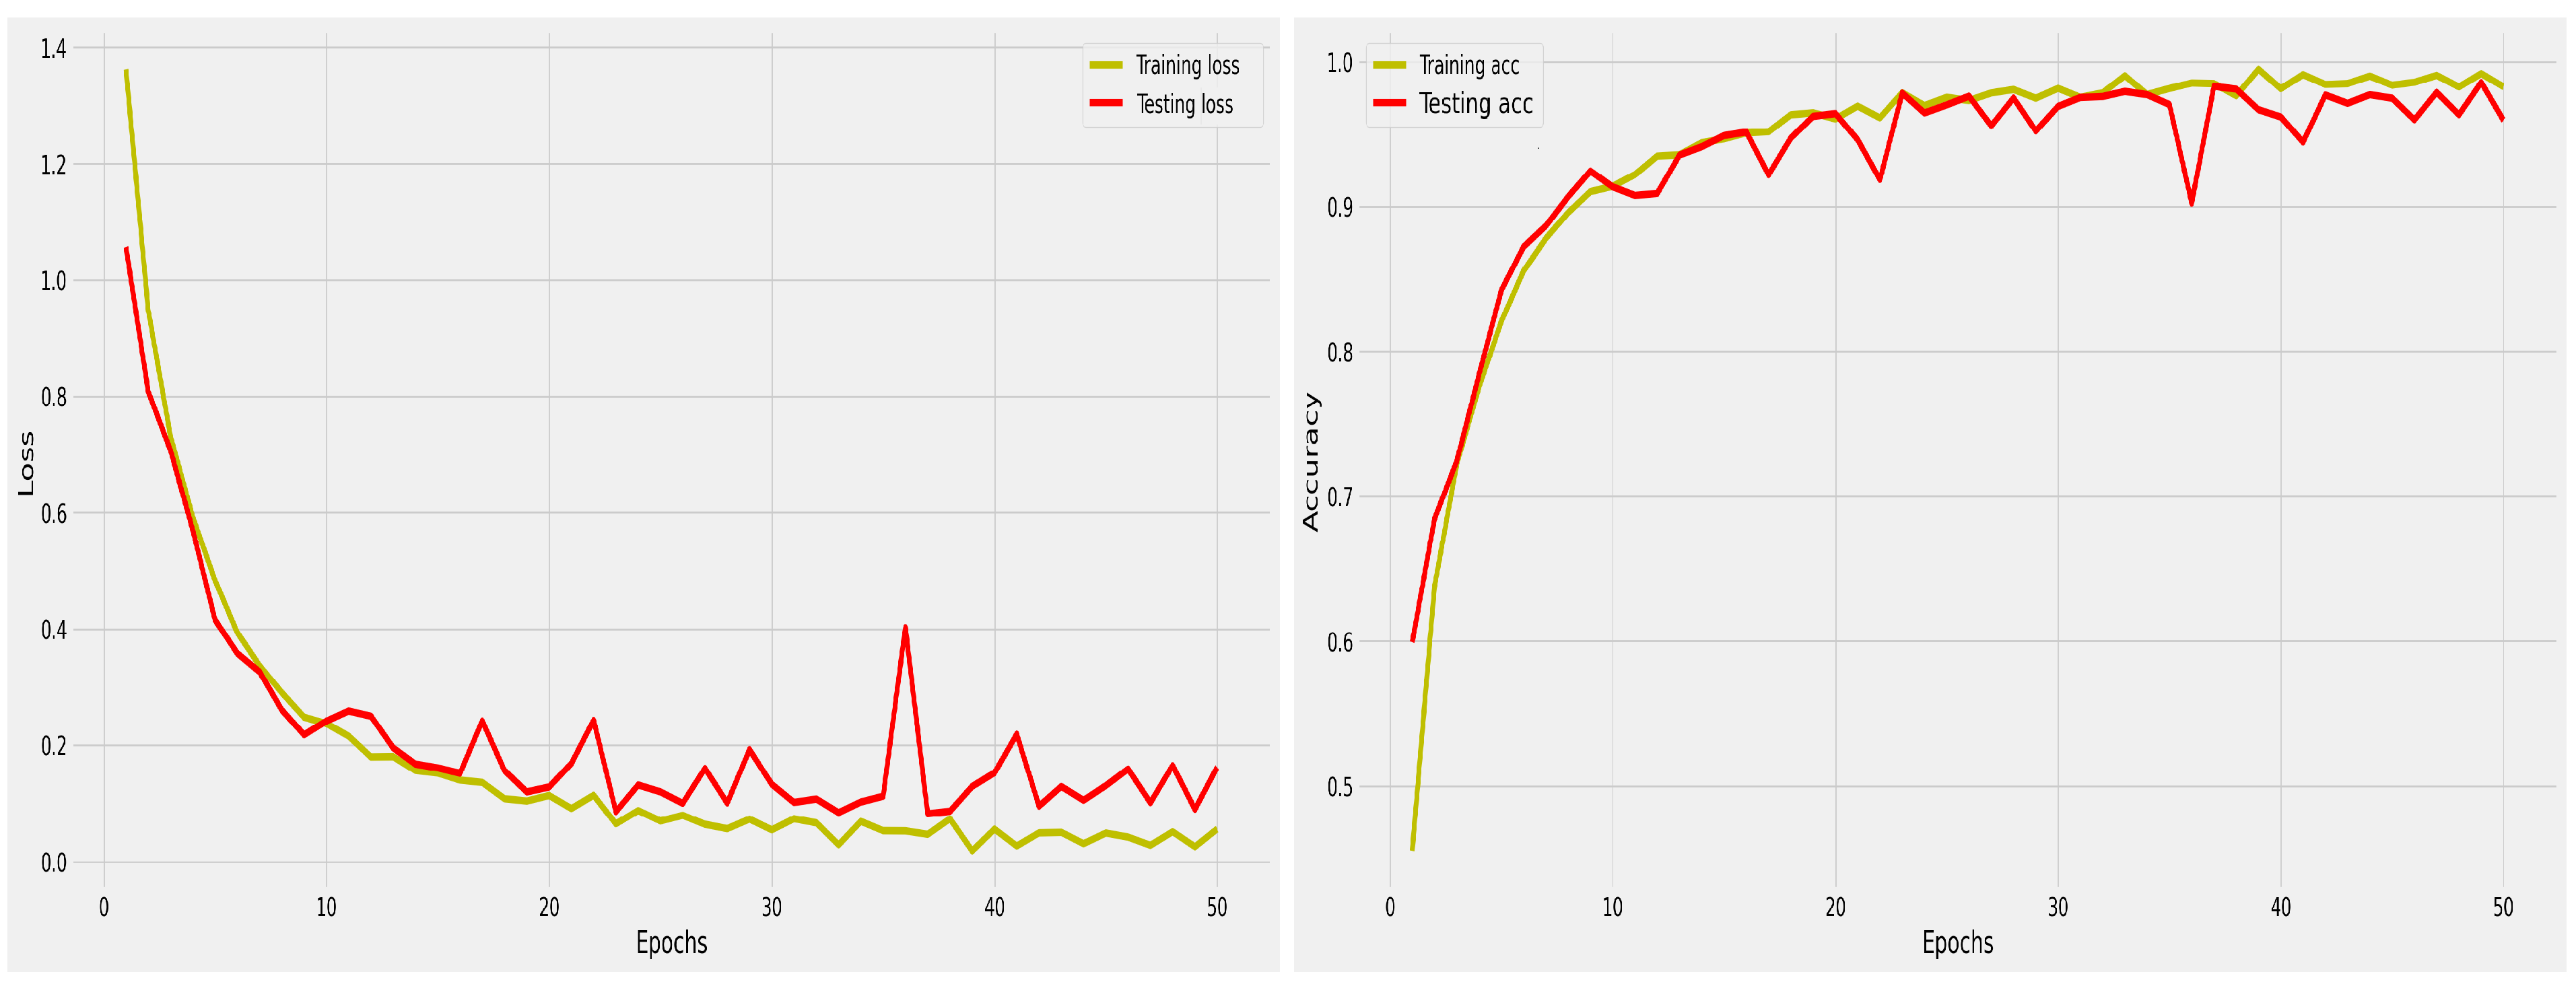
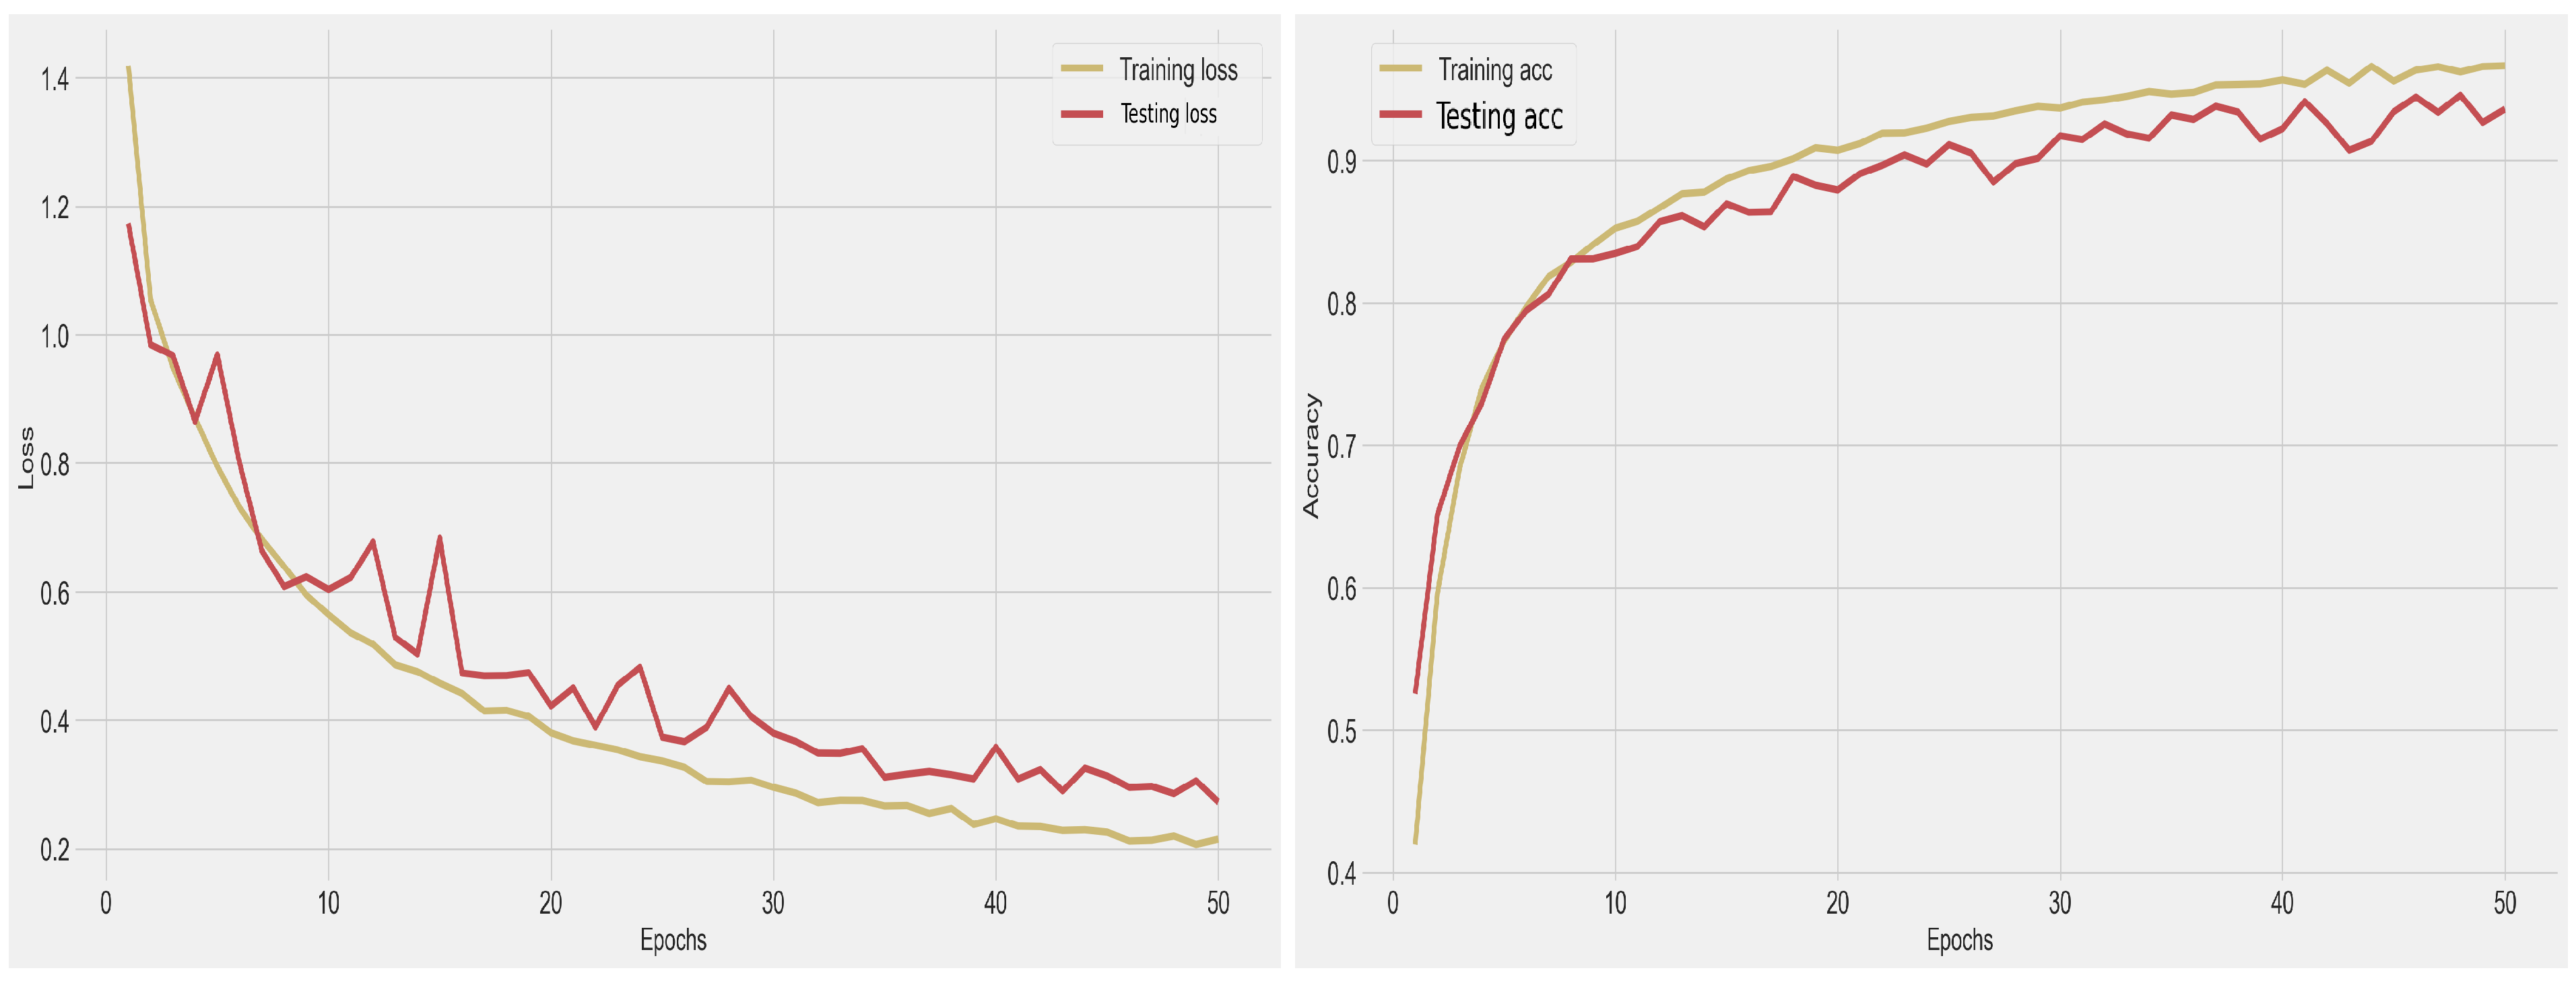
In addition, the performance of the optimized CNN model is evaluated using the relevant metrics and by examining the training and testing accuracies and losses. These are essential indicators that provide insight into the performance of the proposed model and where any inconsistencies lie. Plotting the loss and accuracy functions during training provides valuable insights into the model’s performance. A consistent decrease in the loss function indicates improvement, while fluctuation or increase could mean overfitting, optimization issues, or other data or model architecture inconsistencies. Thus, tracking the loss function can help identify and monitor these inconsistencies. The accuracy and loss curves for the HAM10000, ISIC2018, and ISIC2019 datasets are shown in Figure 5, Figure 6 and Figure 7. These figures demonstrate the learning ability of the optimized CNN through experiments, with increasing accuracy observed in the training and testing processes. The robustness of the model is evidenced by the accuracy values reaching over with low numbers of training epochs for datasets with a reasonable number of samples. As seen from the figures, some fluctuations in accuracy values and losses occur due to prediction errors during some epochs. The figures for the ISIC2018 and ISIC2019 datasets display the training and testing curves and losses. The results of this research are crucial for developing efficient computer-aided diagnosis systems for skin cancer classification, enabling doctors to make informed decisions based on metadata information. The drive to create accurate and trustworthy computer-aided diagnosis systems for early skin cancer treatment.
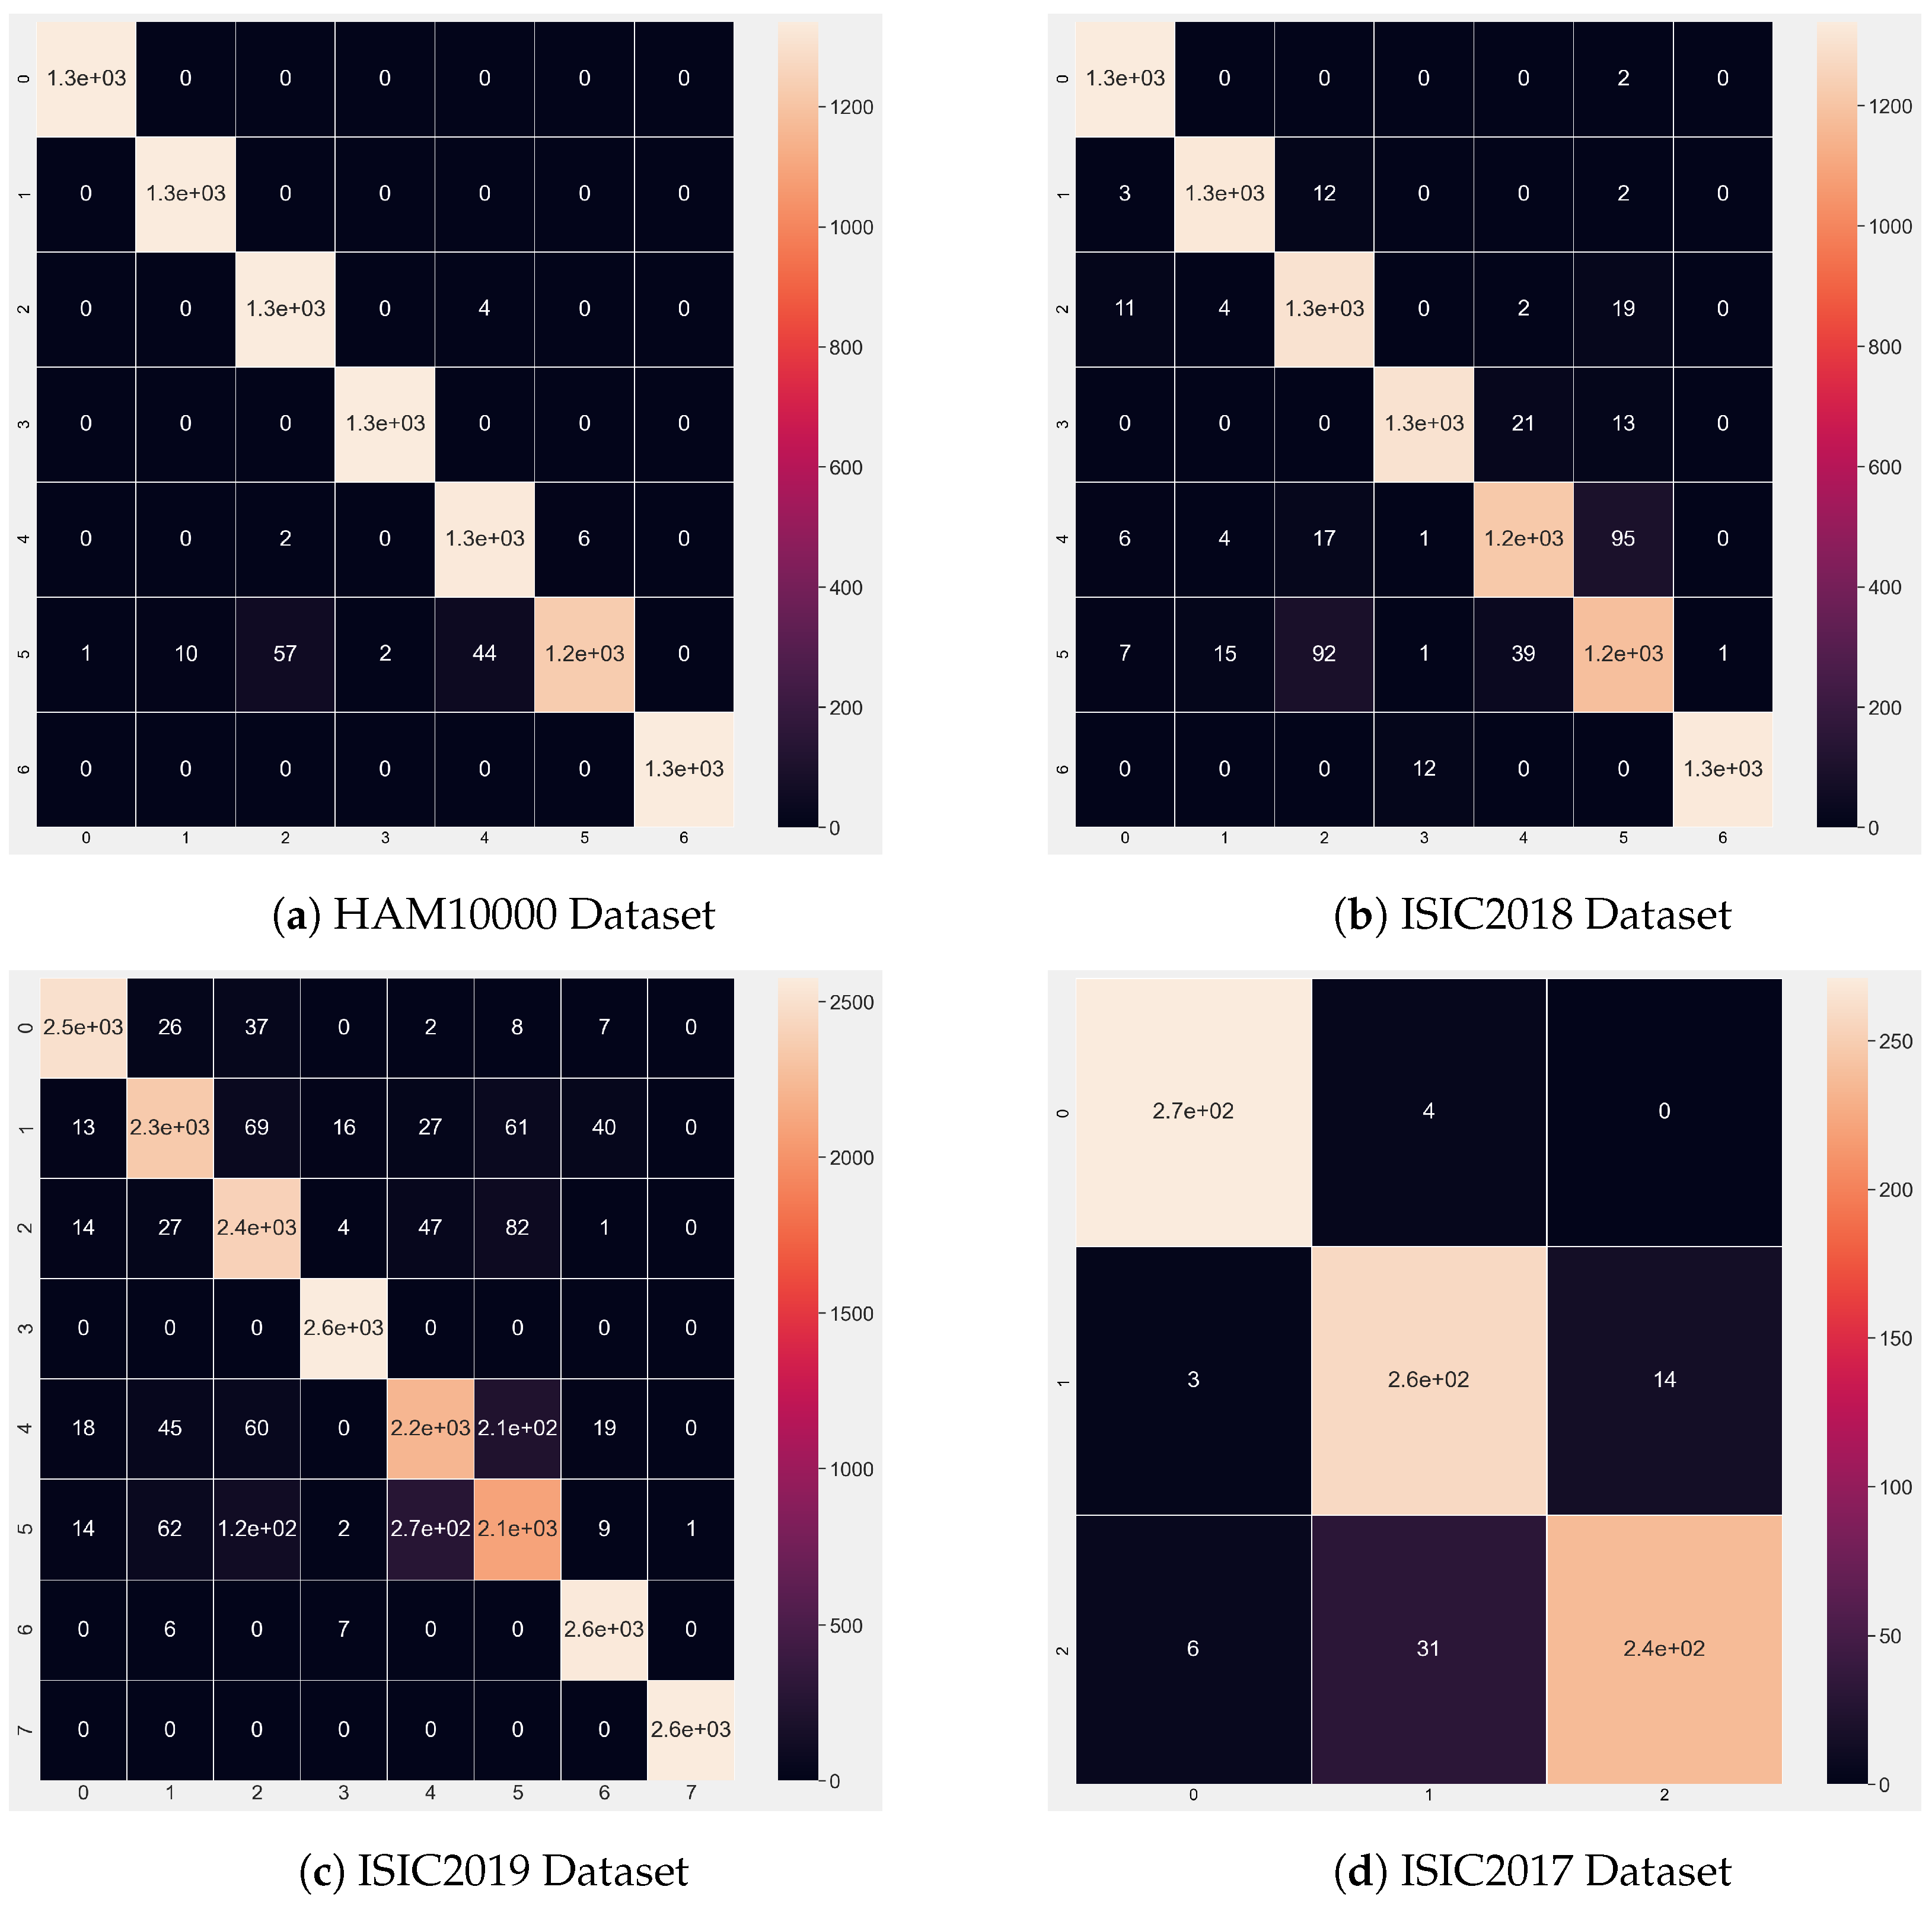
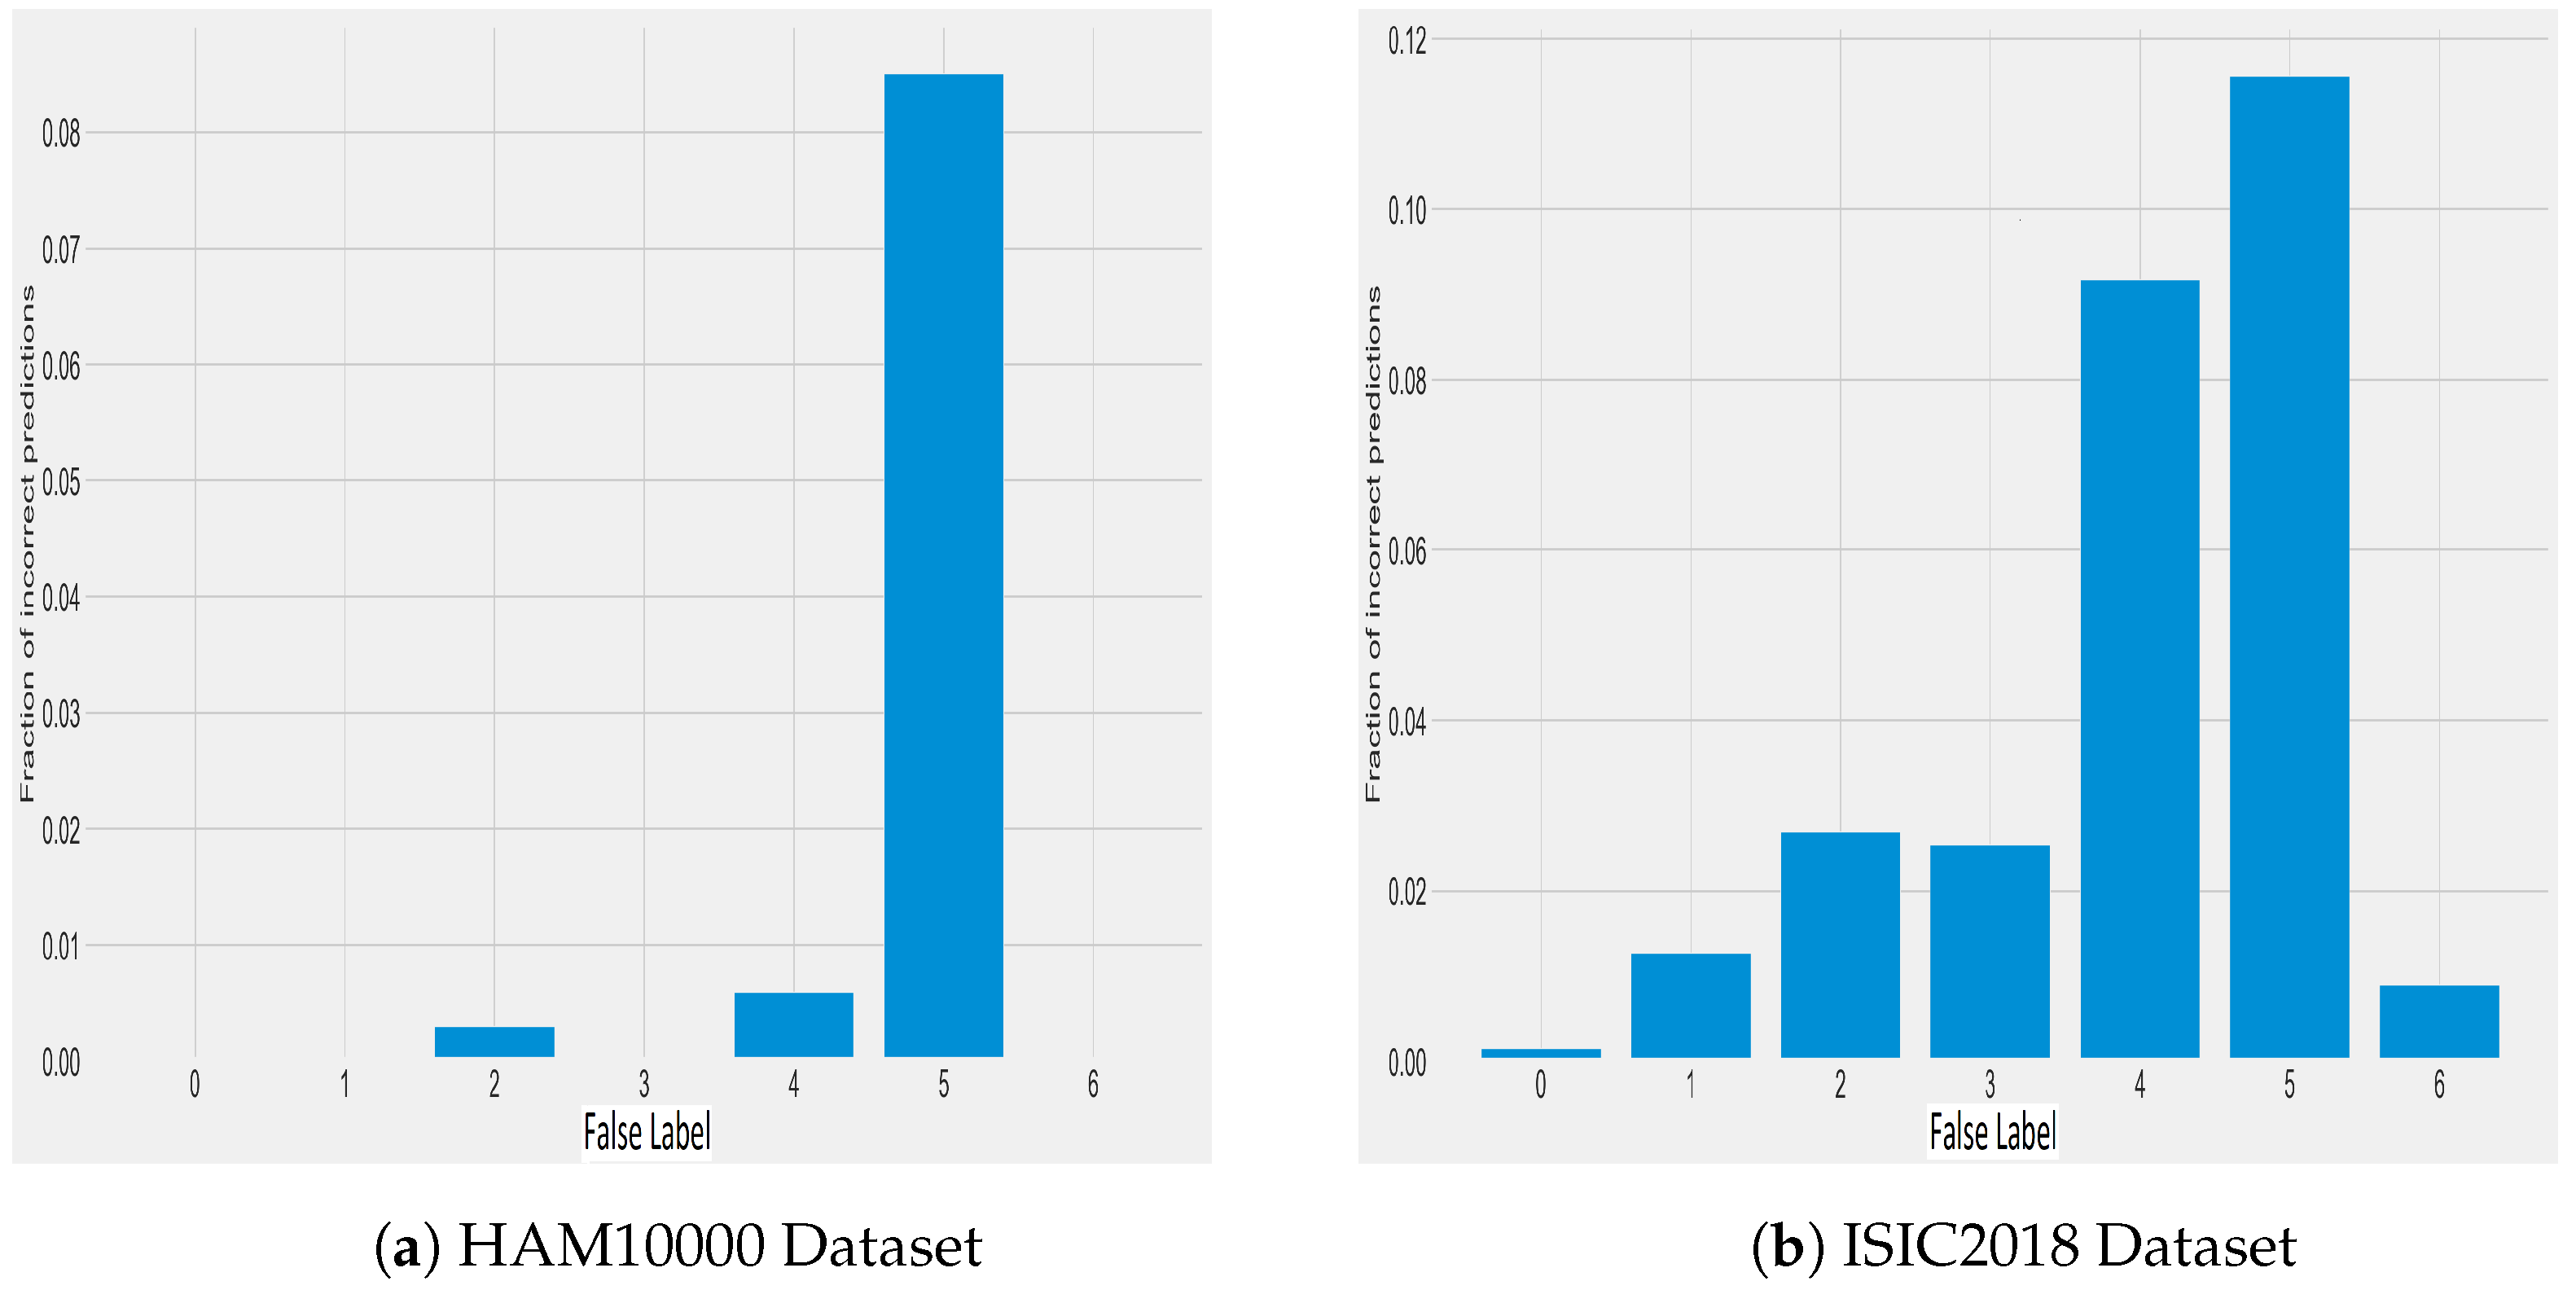
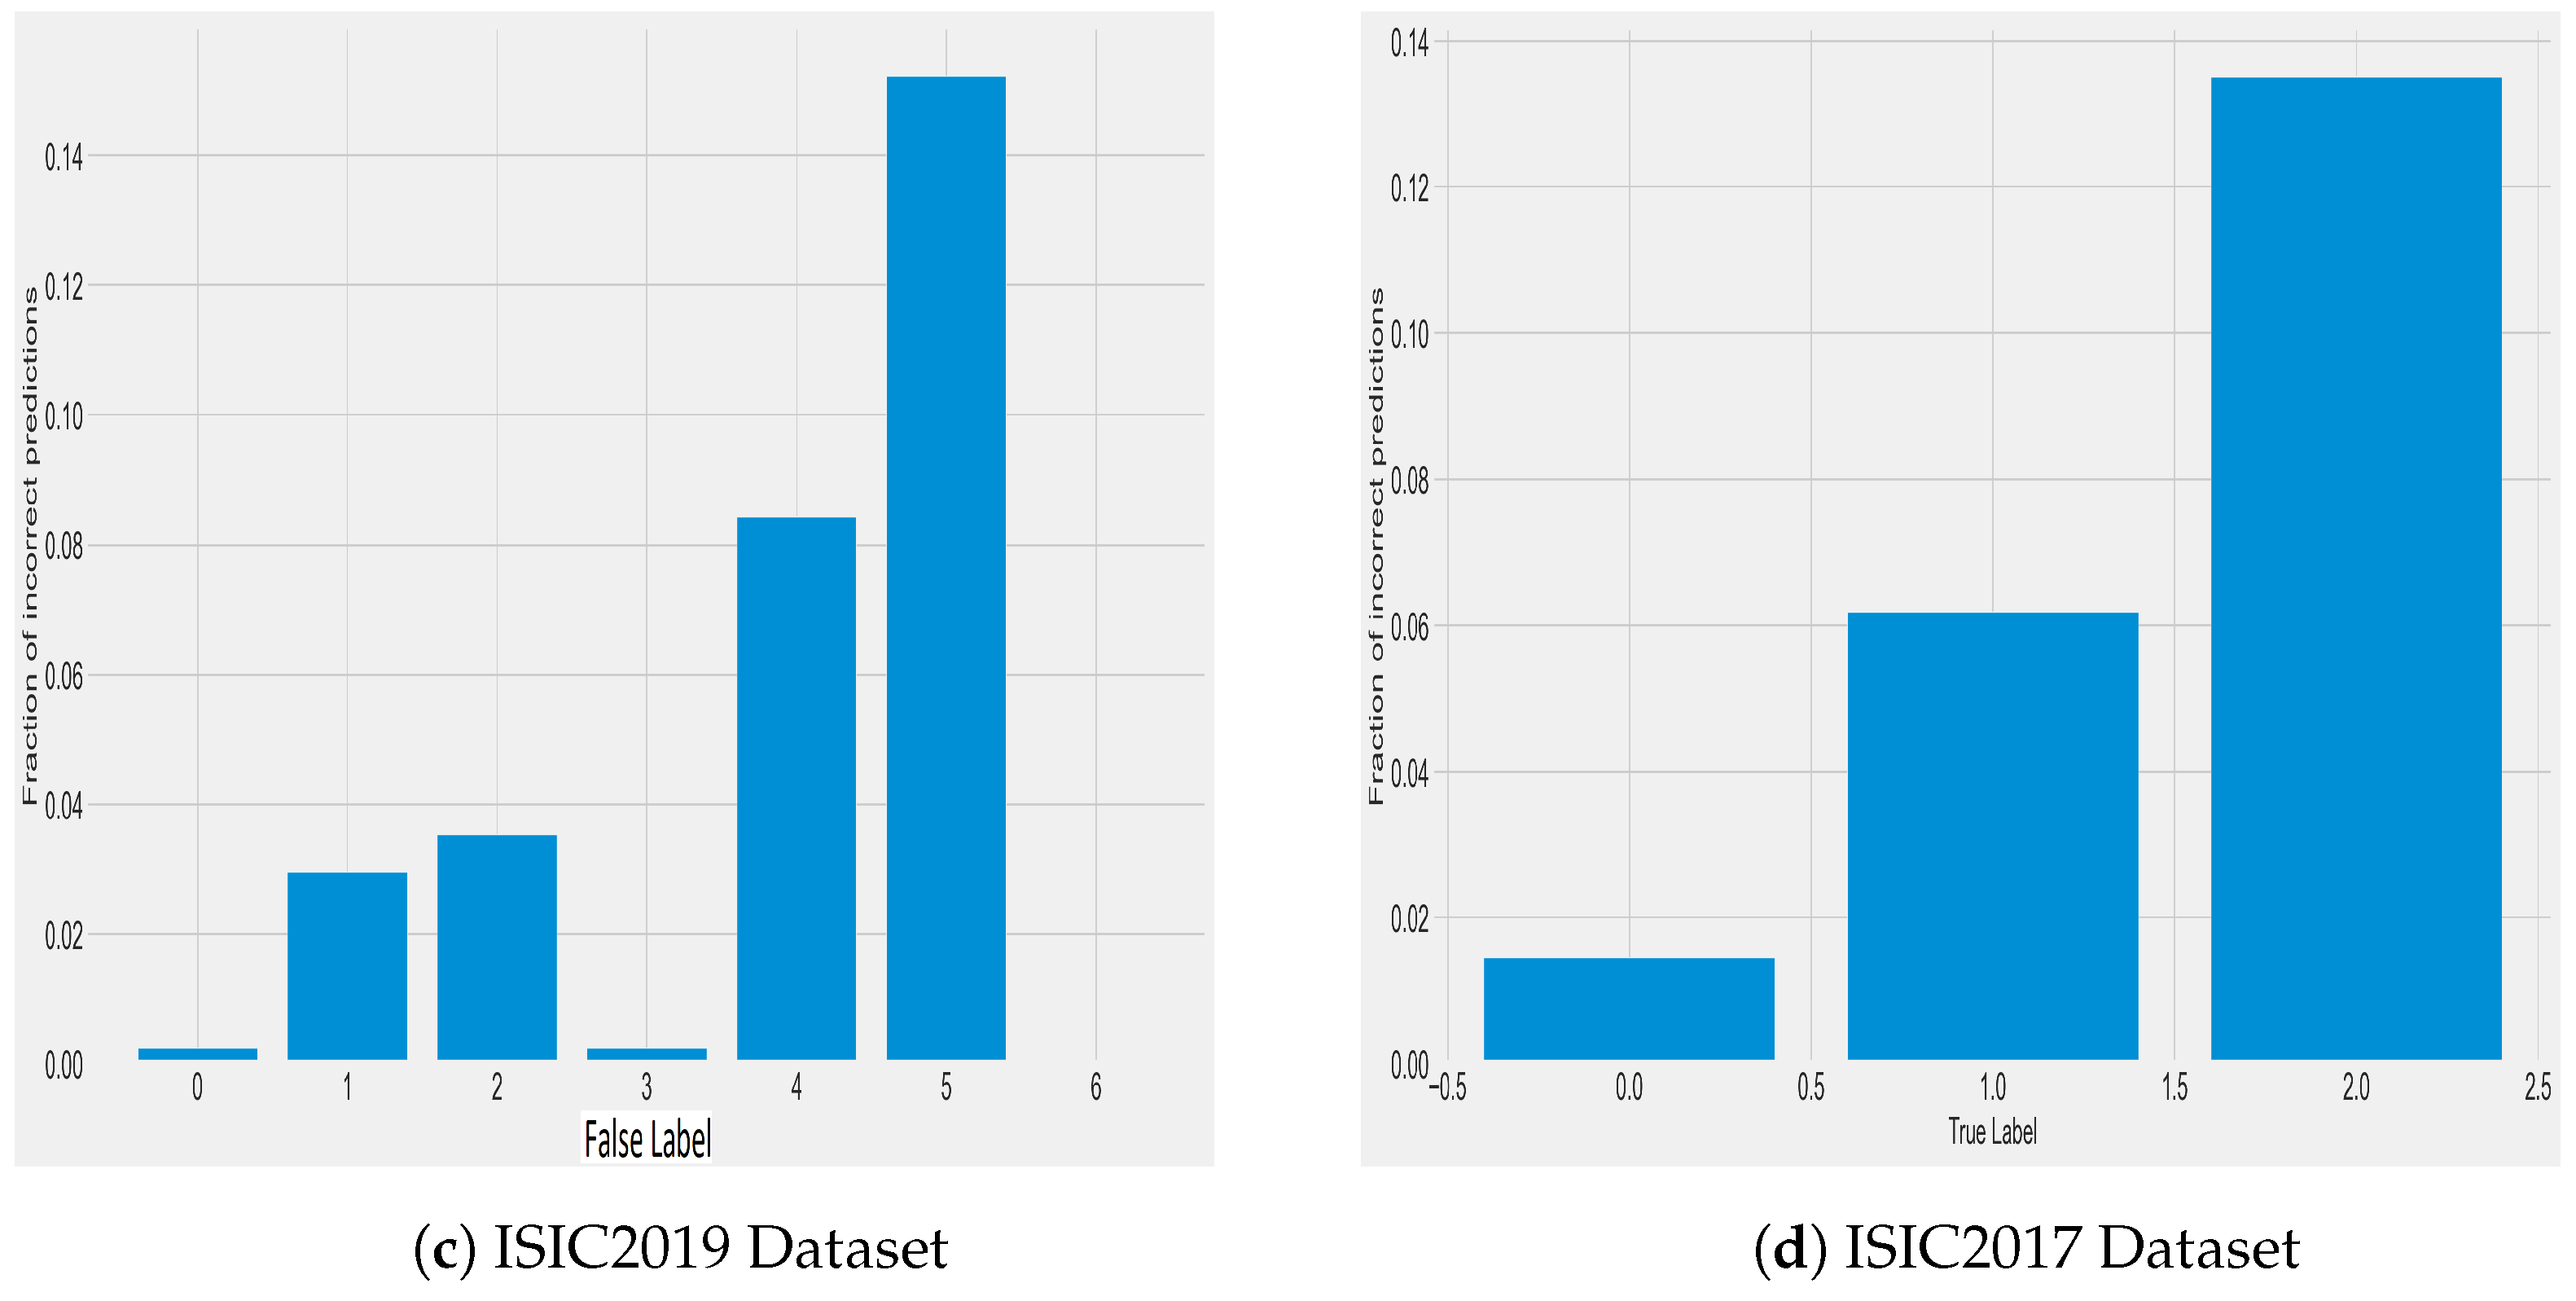
A confusion matrix technique is another method to summarize an algorithm’s classification performance. Calculation of the confusion matrix provides a way of finding the number of classifications that are confused by the algorithm. Correct and incorrect predictions are broken down into classes. Our results using a confusion matrix are summarized in Figure 8, for each dataset. The diagonal view shows the correct prediction for each class and the off-diagonal blocks show confusion between the corresponding classes in that row and column. Figure 9 shows the overall numbers of incorrect prediction values for each class.
4.4. Comparison to Existing Methods
4.4.1. Skin Lesion Classification Model Comparison
Based on the results presented in Table 7, our method outperformed the other classification methods in terms of precision, sensitivity, F-score, accuracy, and specificity. The method reached a precision of 98.86%, sensitivity of 98.57%, F-score of 98.71%, accuracy of 98.66% and specificity of 99.23% on the HAM10000 dataset. The following best method in terms of accuracy is the NM+TLN method, which scored 97.73%. The NM+TLN method only used precision and accuracy for evaluation, it would require more work to compare its performance with our method in terms of sensitivity, F-score, and specificity. However, based on the presented results, our method outperforms NM+TLN in terms of precision and accuracy. The MobileNetV2+LSTM method reached a reasonable specificity of 95.01%, but the accuracy and specificity are lower than our method. The Conventional+DL method has the highest accuracy of the other methods, but its accuracy is still lower than our method. The ELM method performed reasonably well, with an accuracy of 93.40%, but this is still less than for the method developed here.
From the ISIC2019 dataset, the method proposed here for skin lesion classification is the overall best performer among the methods compared (Table 7). It demonstrates superior performance across the various evaluation metrics, including precision, sensitivity, F-score, accuracy, and specificity. The CNN+TF method scored higher accuracy, but it only uses this metric. Likewise, the GoogleNet+SVM method had better accuracy and all the methods that used specificity did better for this measure. However, these methods fall short of our method in overall performance.
The ISIC2018 dataset was also used to evaluate the various skin lesion classification methods to the method developed here (Table 7). Our method performed best among the methods compared. It demonstrated exceptional performance across all the evaluation metrics, including precision, sensitivity, F-score, accuracy, and specificity. Our developed model also performed well in evaluating skin lesion classification methods using the ISIC2017 dataset, as shown in Table 7.
Overall, in comparison to existing methods, the result shows our method performed well for skin lesion classification. The method proposed here could provide a comprehensive and effective solution for the task considered. Generally, the high precision, sensitivity, and specificity values make it a reliable and trustworthy tool. Furthermore, compared to widely used CNN architectures like VGG16, AlexNet, and ResNet, which have over a million trainable parameters, our optimized model has significantly fewer parameters at 384,455. Together with the fact that our method is shown here to be functional, much fewer parameters are required to reduce the computational cost and memory requirements during training, which minimizes computation time overall. A smaller number of parameters also means a more compact model size, making it easier to deploy on edge devices or in resource-constrained environments. In comparison, the method developed here has fewer layers than most standard CNN architectures of layers at a better computational cost, consisting of 13 layers, compared to the standard architectures, which typically have more than 13 layers.
4.4.2. Optimization Algorithm Comparison
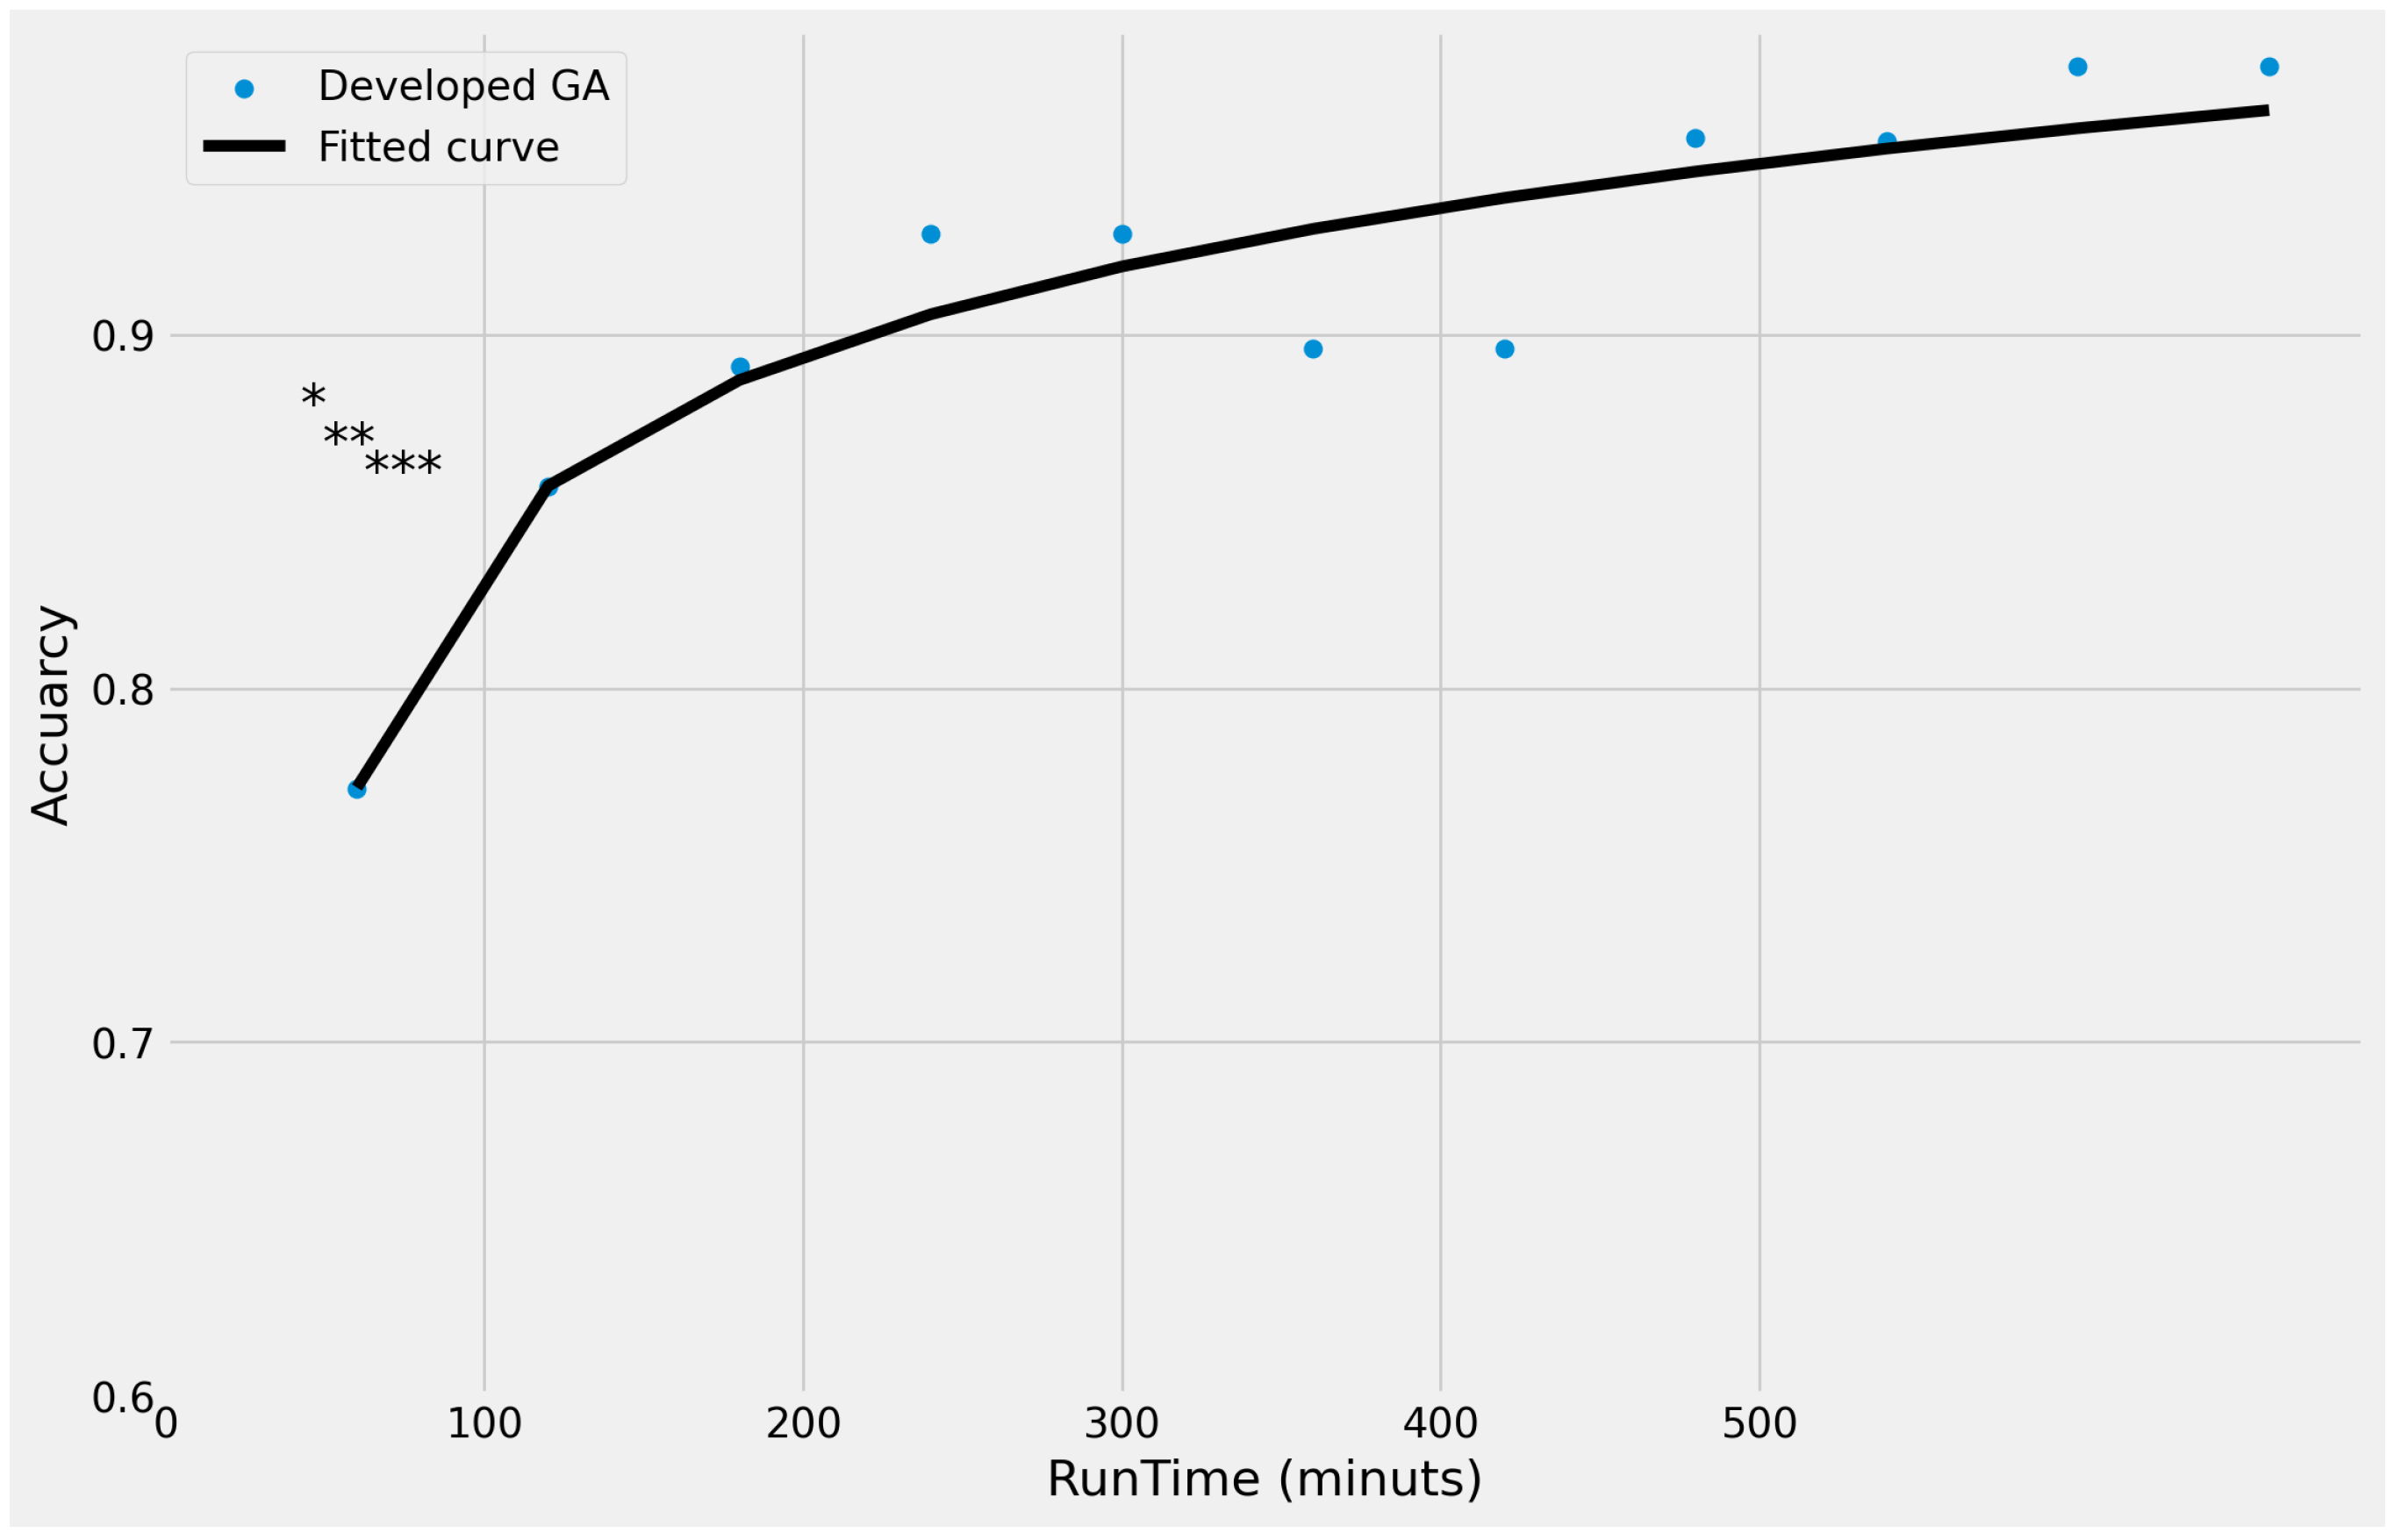
This section compares the genetic algorithm with other state-of-the-art methods. For this comparison, a genetic algorithm (GA) [23,24], a particle swarm optimization algorithm (PSO) [24,25,26], a differential evolution algorithm (DE) [24,27], and a spotted hyena optimizer algorithm (SHO) [42] have been chosen because they use skin lesion images to find the optimal hyperparameters for the CNN model. The performance of the GA, PSO, DE, and SHO have been compared for algorithmic run time, convergence speed, and the performance of skin lesion classification. The genetic algorithm developed here was executed five times to test the speed. For comparison, each of the other optimization algorithms was executed five times to optimize the CNN model hyperparameters [24]. Afterward, the average run time of the five executions was considered the final result. Figure 10 shows the run times of our GA and other state-of-the-art algorithms in finding the optimal hyperparameters. The algorithm developed here was slower than the other three algorithms (Figure 10). This could be for many reasons. First, this algorithm uses an augmented dataset for training and this data contained large samples after the augmentation process. Second, it uses multi-evaluation metrics to find the optimal hyperparameters. However, the genetic algorithm developed here performed well in finding optimal hyperparameters and with very good accuracy. In conclusion, this algorithm returns optimal hyperparameters but takes longer to find them compared to other state-of-the-art algorithms.
The results of the GA developed here demonstrate its superior accuracy performance compared to the other methods under consideration, albeit with a slower rate of progress (Figure 10). Specifically, beyond two hours, the GA continually outperforms the other methods (Figure 10). Thus, it requires at least double the time but achieves better accuracy. Since the developed GA required more runtime to converge to a better solution, this should lead our work to search strategies or parameters that may need to be refined to perform better within the given runtime constraints. Further investigation will be covered in the future to determine the root cause of the lower output and identify potential avenues for improvement. Furthermore, the GA’s performance stabilizes after 600 min of runtime, based on the degree of similarity of the previous three consecutive accuracy measures.
5. Discussion
This paper proposes an optimized CNN model for skin lesion classification and diagnosis prediction. CNN methods for skin lesion classification often have challenges with calculating hyperparameters and tuning, resulting in coarse skin lesion classification. Our method is developed here as an attempt to overcome some of these challenges. A genetic algorithm was used to optimize the hyperparameter tuning of the CNN model. The optimized CNN model contains two stages, an encoder and a fully connected network (FCN), with each stage in charge dealing with a different aspect of the classification process. The encoder stage is focused on extracting the skin lesion features through various layers. At the same time, the FCN classifies the types of skin lesion features by applying a fully connected network. A DICE function calculates the loss values between model image prediction and the label images (ground truth). It uses less computational time because it does not apply sample re-weighting, unlike other loss functions such as the cross-entropy method.
The proposed model reached up to a accuracy, a specificity, and a sensitivity on the HAM10000 dataset. It also achieved high accuracy, specificity, and sensitivity of , and using the ISIC 2018 dataset. the accuracy of the optimized CNN model highlights several key factors. Firstly, the input features selected for the optimized CNN model were comprehensive and included all essential factors for skin lesion classification. This was crucial in ensuring the model had the necessary information to differentiate between different types of skin lesions. Secondly, the use of a genetic algorithm in the optimization process significantly contributed to the high-performance results of the optimized CNN model. The genetic algorithm enabled the model to identify the optimal hyperparameters, such as the number of neurons and activation functions, leading to improved accuracy. Finally, preprocessing, normalization, and data augmentation techniques were crucial in balancing the dataset and avoiding overfitting. Data augmentation was significant in increasing the number of images in the dataset, which helped the model to generalize better and improve performance. By carefully considering all these factors, the optimized CNN model achieved remarkable accuracy when tested on the datasets.
From the evaluation of the architecture developed here, the model’s usefulness is significantly encouraging and could join other state-of-the-art architectures as a new method. The application of the genetic algorithm is unique because of the application of the multi-evaluation function and this enhances the performance of the optimized CNN model. This improved performance suggests more research into optimization problems using CNN architectures. In particular, while the algorithm shows promising accuracy it is slow and further research improving the speed could be investigated.
6. Conclusions
This paper proposes an optimized Convolutional Neural Network (CNN) model for early skin lesion diagnosis using a genetic algorithm to select optimal hyperparameters. The model was trained and tested using three publicly available datasets for skin lesion classification. Pre-processed was preform using evolutionary techniques to provide optimal mapper designs for the model to learn patterns. The use of a multi-evaluation function and a genetic algorithm in combination with pre-processing technique, normalization and data augmentation helped to improve the performance of the model. The proposed optimized CNN model showed impressive results for evaluation metrics such as PREC, SN, F-score, ACC, SP, and the DICE coefficient.
The results also show that the proposed model is able to identify and differentiate various types of skin lesions. The proposed optimized CNN model can be cost-effectively implemented as a tool for early skin lesion diagnosis by doctors. Further developments in the method could lead to its wider use and a significant improvement in early skin lesion diagnosis. The results of this study contribute to the advancement of automated skin lesion classification, providing a promising step toward developing an effective and efficient diagnostic tool for early skin lesion diagnosis.
Author Contributions
Conceptualization, O.S.; Funding acquisition, K.J.D.; Methodology, O.S.; Software, O.S.; Supervision, K.J.D.; Writing—original draft, O.S.; Writing—review & editing, K.J.D. All authors have read and agreed to the published version of the manuscript.
Funding
This work is based on the research supported in part by the National Research Foundation of South Africa (Grant Numbers 131604).
Informed Consent Statement
Not applicable.
Data Availability Statement
The data that support the findings of this study are publicly available. However, the pre-processed datasets are available on request from the corresponding author.
Conflicts of Interest
The authors declare no conflict of interest.
References
- Masood, A.; Ali Al-Jumaily, A. Computer aided diagnostic support system for skin cancer: A review of techniques and algorithms. Int. J. Biomed. Imaging 2013, 2013, 323268. [Google Scholar] [CrossRef]
- Adeyinka, A.A.; Viriri, S. Skin lesion images segmentation: A survey of the state-of-the-art. In Proceedings of the International Conference on Mining Intelligence and Knowledge Exploration, Cluj-Napoca, Romania, 20–22 December 2018; Springer: Berlin/Heidelberg, Germany, 2018; pp. 321–330. [Google Scholar]
- Celebi, M.E.; Iyatomi, H.; Schaefer, G.; Stoecker, W.V. Lesion border detection in dermoscopy images. Comput. Med. Imaging Graph. 2009, 33, 148–153. [Google Scholar] [CrossRef] [Green Version]
- Zhang, J.; Xie, Y.; Wu, Q.; Xia, Y. Skin lesion classification in dermoscopy images using synergic deep learning. In Proceedings of the International Conference on Medical Image Computing and Computer-Assisted Intervention, Granada, Spain, 16–20 September 2018; Springer: Berlin/Heidelberg, Germany, 2018; pp. 12–20. [Google Scholar]
- Yu, L.; Chen, H.; Dou, Q.; Qin, J.; Heng, P.A. Automated melanoma recognition in dermoscopy images via very deep residual networks. IEEE Trans. Med. Imaging 2016, 36, 994–1004. [Google Scholar] [CrossRef] [PubMed]
- Vestergaard, M.; Macaskill, P.; Holt, P.; Menzies, S. Dermoscopy compared with naked eye examination for the diagnosis of primary melanoma: A meta-analysis of studies performed in a clinical setting. Br. J. Dermatol. 2008, 159, 669–676. [Google Scholar] [CrossRef] [PubMed]
- Wang, F.; Jiang, M.; Qian, C.; Yang, S.; Li, C.; Zhang, H.; Wang, X.; Tang, X. Residual attention network for image classification. In Proceedings of the IEEE Conference on Computer Vision and Pattern Recognition, Honolulu, HI, USA, 21–26 July 2017; pp. 3156–3164. [Google Scholar]
- Salih, O.; Viriri, S.; Adegun, A. Skin lesion segmentation based on region-edge Markov random field. In Proceedings of the Advances in Visual Computing: 14th International Symposium on Visual Computing, Lake Tahoe, NV, USA, 7–6 October 2019; Springer: Berlin/Heidelberg, Germany, 2019; pp. 407–418. [Google Scholar]
- Al-Masni, M.A.; Al-Antari, M.A.; Choi, M.T.; Han, S.M.; Kim, T.S. Skin lesion segmentation in dermoscopy images via deep full resolution convolutional networks. Comput. Methods Programs Biomed. 2018, 162, 221–231. [Google Scholar] [CrossRef]
- Balch, C.M.; Gershenwald, J.E.; Soong, S.J.; Thompson, J.F.; Atkins, M.B.; Byrd, D.R.; Buzaid, A.C.; Cochran, A.J.; Coit, D.G.; Ding, S.; et al. Final version of 2009 AJCC melanoma staging and classification. J. Clin. Oncol. 2009, 27, 6199. [Google Scholar] [CrossRef] [PubMed] [Green Version]
- Mobiny, A.; Singh, A.; Van Nguyen, H. Risk-aware machine learning classifier for skin lesion diagnosis. J. Clin. Med. 2019, 8, 1241. [Google Scholar] [CrossRef] [Green Version]
- Cascinelli, N.; Ferrario, M.; Tonelli, T.; Leo, E. A possible new tool for clinical diagnosis of melanoma: The computer. J. Am. Acad. Dermatol. 1987, 16, 361–367. [Google Scholar] [CrossRef]
- Burroni, M.; Corona, R.; Dell’Eva, G.; Sera, F.; Bono, R.; Puddu, P.; Perotti, R.; Nobile, F.; Andreassi, L.; Rubegni, P. Melanoma computer-aided diagnosis: Reliability and feasibility study. Clin. Cancer Res. 2004, 10, 1881–1886. [Google Scholar] [CrossRef] [Green Version]
- Adegun, A.A.; Viriri, S. FCN-based DenseNet framework for automated detection and classification of skin lesions in dermoscopy images. IEEE Access 2020, 8, 150377–150396. [Google Scholar] [CrossRef]
- Adegun, A.A.; Viriri, S. Deep learning-based system for automatic melanoma detection. IEEE Access 2019, 8, 7160–7172. [Google Scholar] [CrossRef]
- Adegun, A.; Viriri, S. Deep learning techniques for skin lesion analysis and melanoma cancer detection: A survey of state-of-the-art. Artif. Intell. Rev. 2021, 54, 811–841. [Google Scholar] [CrossRef]
- Chang, W.Y.; Huang, A.; Yang, C.Y.; Lee, C.H.; Chen, Y.C.; Wu, T.Y.; Chen, G.S. Computer-aided diagnosis of skin lesions using conventional digital photography: A reliability and feasibility study. PLoS ONE 2013, 8, e76212. [Google Scholar] [CrossRef] [PubMed] [Green Version]
- Mahmoud, H.; Abdel-Nasser, M.; Omer, O.A. Computer aided diagnosis system for skin lesions detection using texture analysis methods. In Proceedings of the 2018 International Conference on Innovative Trends in Computer Engineering (ITCE), Aswan, Egypt, 19–21 February 2018; pp. 140–144. [Google Scholar]
- Suganya, R. An automated computer aided diagnosis of skin lesions detection and classification for dermoscopy images. In Proceedings of the 2016 International Conference on Recent Trends in Information Technology (ICRTIT), Chennai, India, 8–9 April 2016; pp. 1–5. [Google Scholar]
- Lynn, N.C.; Kyu, Z.M. Segmentation and classification of skin cancer melanoma from skin lesion images. In Proceedings of the 2017 18th International Conference on Parallel and Distributed Computing, Applications and Technologies (PDCAT), Taipei, Taiwan, 18–20 December 2017; pp. 117–122. [Google Scholar]
- Sumithra, R.; Suhil, M.; Guru, D. Segmentation and classification of skin lesions for disease diagnosis. Procedia Comput. Sci. 2015, 45, 76–85. [Google Scholar] [CrossRef] [Green Version]
- Holland, J.H. Adaptation in Natural and Artificial Systems: An Introductory Analysis with Applications to Biology, Control, and Artificial Intelligence; MIT Press: Cambridge, MA, USA, 1992. [Google Scholar]
- Whitley, D. A genetic algorithm tutorial. Stat. Comput. 1994, 4, 65–85. [Google Scholar] [CrossRef]
- Golnoori, F.; Boroujeni, F.Z.; Monadjemi, A. Metaheuristic algorithm based hyper-parameters optimization for skin lesion classification. Multimed. Tools Appl. 2023, 1–33. [Google Scholar] [CrossRef]
- Kennedy, J.; Eberhart, R. Particle swarm optimization. In Proceedings of the ICNN’95-International Conference on Neural Networks, Perth, WA, Australia, 27 November–1 December 1995; Volume 4, pp. 1942–1948. [Google Scholar]
- Shi, Y.; Eberhart, R.C. Parameter selection in particle swarm optimization. In Proceedings of the Evolutionary Programming VII: 7th International Conference, EP98, San Diego, CA, USA, 25–27 March 1998; Proceedings 7. Springer: Berlin/Heidelberg, Germany, 1998; pp. 591–600. [Google Scholar]
- Storn, R.; Price, K. Differential evolution-a simple and efficient heuristic for global optimization over continuous spaces. J. Glob. Optim. 1997, 11, 341. [Google Scholar] [CrossRef]
- Ma, W.; Zhou, X.; Zhu, H.; Li, L.; Jiao, L. A two-stage hybrid ant colony optimization for high-dimensional feature selection. Pattern Recognit. 2021, 116, 107933. [Google Scholar] [CrossRef]
- Rujan, L.; Neagoe, V.E. A Hybrid Sequential Classifier for Hyperspectral Imagery using Deep CNN with Ant Colony Optimization. In Proceedings of the 2022 14th International Conference on Electronics, Computers and Artificial Intelligence (ECAI), Ploiesti, Romania, 30 June–1 July 2022; pp. 1–6. [Google Scholar]
- Tschandl, P.; Rosendahl, C.; Kittler, H. The HAM10000 dataset, a large collection of multi-source dermatoscopic images of common pigmented skin lesions. Sci. Data 2018, 5, 180161. [Google Scholar] [CrossRef]
- Codella, N.; Rotemberg, V.; Tschandl, P.; Celebi, M.E.; Dusza, S.; Gutman, D.; Helba, B.; Kalloo, A.; Liopyris, K.; Marchetti, M.; et al. Skin lesion analysis toward melanoma detection 2018: A challenge hosted by the international skin imaging collaboration (isic). arXiv 2019, arXiv:1902.03368. [Google Scholar]
- Rotemberg, V.; Kurtansky, N.; Betz-Stablein, B.; Caffery, L.; Chousakos, E.; Codella, N.; Combalia, M.; Dusza, S.; Guitera, P.; Gutman, D.; et al. A patient-centric dataset of images and metadata for identifying melanomas using clinical context. Sci. Data 2021, 8, 34. [Google Scholar] [CrossRef] [PubMed]
- Shorten, C.; Khoshgoftaar, T.M. A survey on image data augmentation for deep learning. J. Big Data 2019, 6, 1–48. [Google Scholar] [CrossRef]
- Wicaksono, A.S.; Supianto, A.A. Hyper parameter optimization using genetic algorithm on machine learning methods for online news popularity prediction. Int. J. Adv. Comput. Sci. Appl. 2018, 9, 263–267. [Google Scholar] [CrossRef] [Green Version]
- Sureka, A.; Indukuri, K.V. Using genetic algorithms for parameter optimization in building predictive data mining models. In Proceedings of the International Conference on Advanced Data Mining and Applications, Chengdu, China, 8–10 October 2008; pp. 260–271. [Google Scholar]
- Loussaief, S.; Abdelkrim, A. Convolutional neural network hyper-parameters optimization based on genetic algorithms. Int. J. Adv. Comput. Sci. Appl. 2018, 9, 252–266. [Google Scholar] [CrossRef] [Green Version]
- Long, Q.; Wu, C.; Wang, X.; Jiang, L.; Li, J. A multiobjective genetic algorithm based on a discrete selection procedure. Math. Probl. Eng. 2015, 2015, 349781. [Google Scholar] [CrossRef] [Green Version]
- Khuri, A.I.; Conlon, M. Simultaneous optimization of multiple responses represented by polynomial regression functions. Technometrics 1981, 23, 363–375. [Google Scholar] [CrossRef]
- Fishburn, P.C. Utility Theory for Decision Making; Research Analysis Corp.: McLean, VA, USA, 1970; Available online: https://apps.dtic.mil/sti/pdfs/AD0708563.pdf (accessed on 28 February 2023).
- Krizhevsky, A.; Sutskever, I.; Hinton, G.E. Imagenet classification with deep convolutional neural networks. Adv. Neural Inf. Process. Syst. 2012, 25, 84–90. [Google Scholar] [CrossRef] [Green Version]
- Real, R.; Vargas, J.M. The probabilistic basis of Jaccard’s index of similarity. Syst. Biol. 1996, 45, 380–385. [Google Scholar] [CrossRef]
- Alam, T.M.; Shaukat, K.; Khan, W.A.; Hameed, I.A.; Almuqren, L.A.; Raza, M.A.; Aslam, M.; Luo, S. An Efficient Deep Learning-Based Skin Cancer Classifier for an Imbalanced Dataset. Diagnostics 2022, 12, 2115. [Google Scholar] [CrossRef]
- Srinivasu, P.N.; SivaSai, J.G.; Ijaz, M.F.; Bhoi, A.K.; Kim, W.; Kang, J.J. Classification of skin disease using deep learning neural networks with MobileNet V2 and LSTM. Sensors 2021, 21, 2852. [Google Scholar] [CrossRef]
- Dhivyaa, C.; Sangeetha, K.; Balamurugan, M.; Amaran, S.; Vetriselvi, T.; Johnpaul, P. Skin lesion classification using decision trees and random forest algorithms. J. Ambient. Intell. Humaniz. Comput. 2020, 1–13. [Google Scholar] [CrossRef]
- Bibi, A.; Khan, M.A.; Javed, M.Y.; Tariq, U.; Kang, B.G.; Nam, Y.; Mostafa, R.R.; Sakr, R.H. Skin lesion segmentation and classification using conventional and deep learning based framework. Tech Sci. Press 2022, 71, 2477–2495. [Google Scholar] [CrossRef]
- Alenezi, F.; Armghan, A.; Polat, K. A Novel Multi-Task Learning Network Based on Melanoma Segmentation and Classification with Skin Lesion Images. Diagnostics 2023, 13, 262. [Google Scholar] [CrossRef] [PubMed]
- Afza, F.; Sharif, M.; Khan, M.A.; Tariq, U.; Yong, H.S.; Cha, J. Multiclass skin lesion classification using hybrid deep features selection and extreme learning machine. Sensors 2022, 22, 799. [Google Scholar] [CrossRef]
- Alizadeh, S.M.; Mahloojifar, A. Automatic skin cancer detection in dermoscopy images by combining convolutional neural networks and texture features. Int. J. Imaging Syst. Technol. 2021, 31, 695–707. [Google Scholar] [CrossRef]
- Kassem, M.A.; Hosny, K.M.; Fouad, M.M. Skin lesions classification into eight classes for ISIC 2019 using deep convolutional neural network and transfer learning. IEEE Access 2020, 8, 114822–114832. [Google Scholar] [CrossRef]
- Benyahia, S.; Meftah, B.; Lézoray, O. Multi-features extraction based on deep learning for skin lesion classification. Tissue Cell 2022, 74, 101701. [Google Scholar] [CrossRef] [PubMed]
- Almaraz-Damian, J.A.; Ponomaryov, V.; Sadovnychiy, S.; Castillejos-Fernandez, H. Melanoma and nevus skin lesion classification using handcraft and deep learning feature fusion via mutual information measures. Entropy 2020, 22, 484. [Google Scholar] [CrossRef] [Green Version]
- Salih, O.; Viriri, S. Skin lesion segmentation using stochastic region-merging and pixel-based Markov random field. Symmetry 2020, 12, 1224. [Google Scholar] [CrossRef]
- Zhang, J.; Xie, Y.; Xia, Y.; Shen, C. Attention residual learning for skin lesion classification. IEEE Trans. Med. Imaging 2019, 38, 2092–2103. [Google Scholar] [CrossRef] [PubMed]
Figure 1.
Methodology Flowchart.

Figure 2.
Samples of dermoscopic images along with their categories.

Figure 3.
The original datasets without and with the augmentation technique.

Figure 4.
The generated image sample uses the augmented technique.

Figure 5.
The loss and the accuracy training and validation curves for the HAM10000 dataset.

Figure 6.
The loss and the accuracy training and validation curves for the ISIC2018 dataset.

Figure 7.
The loss and the accuracy training and validation curves for the ISIC2019 dataset.

Figure 8.
The Confusion Matrices for the HAM10000, ISIC2018 and ISIC2019 datasets, respectively.

Figure 9.
The incorrect values for each class using the HAM10000, ISIC2018 and ISIC2019, ISIC2017 datasets.
Figure 9.
The incorrect values for each class using the HAM10000, ISIC2018 and ISIC2019, ISIC2017 datasets.


Figure 10.
Comparing the computational time and accuracy of the developed GA with other algorithms: (*) GA [23,24], (**) PSO [24,25,26], and (***) DE [24,27]. The line fit is for visual purposes only.


Table 1.
Best values of hyperparameters of genetic algorithm.
| Dataset | Droupout | Learning Rate | Epoach | Activatin Function |
| HAM10000 | 0.3 | 0.0001 | 50 | Relu and Softmax |
| Optimizer | Momentum | Batch Size | Kernel Size | Nodes |
| Adam | 0.95 | 64 | (3, 3) | 256 128, 64, 256, 32, 8 |
Table 2.
Hyperparameters range of CNN.
| Hyperparameter | Interval Value | Hyperparameter | Interval Value |
|---|---|---|---|
| Momentum | [0.1, 0.99] | Batch Size | [8, 16, 32, …, 256] |
| Epochs | [25, 50, 75, …, 500] | Learning Rate | [0.01, 0.1] |
| Dropout | [0.1, 0.9] | # of Nodes | [8,16,32, …, 256] |
| Activation Function | (Relu, Sigmoid, Linear) | # of filters | [8,16, …, 256] |
| Depth of the network | [1–15] | # of dense layers | [1–6] |
Table 3.
The optimized CNN model evaluated on the HAM10000 dataset.
| Class | PREC | SN | F-Score | ACC | SP | DICE |
|---|---|---|---|---|---|---|
| NEV | 1.00 | 1.00 | 1.00 | 0.99 | 0.99 | 0.99 |
| MEL | 0.99 | 1.00 | 1.00 | 0.99 | 0.99 | 0.99 |
| BCC | 0.96 | 1.00 | 0.98 | 0.99 | 0.99 | 0.99 |
| BKL | 1.00 | 1.00 | 1.00 | 0.99 | 0.99 | 0.99 |
| AKIEC | 0.97 | 0.99 | 0.98 | 0.99 | 0.99 | 0.99 |
| VASC | 1.00 | 0.91 | 0.95 | 0.99 | 0.99 | 0.99 |
| DF | 1.00 | 1.00 | 1.00 | 0.99 | 0.99 | 0.99 |
Table 4.
The optimized CNN model evaluated on the ISIC2018 dataset.
| Class | PREC | SN | F-Score | ACC | SP | DICE |
|---|---|---|---|---|---|---|
| NEV | 0.98 | 1.00 | 0.99 | 0.96 | 0.96 | 0.96 |
| MEL | 0.98 | 0.99 | 0.98 | 0.96 | 0.96 | 0.96 |
| BCC | 0.92 | 0.97 | 0.95 | 0.96 | 0.96 | 0.96 |
| BKL | 0.99 | 0.97 | 0.98 | 0.96 | 0.96 | 0.96 |
| AKIEC | 0.95 | 0.91 | 0.93 | 0.96 | 0.96 | 0.96 |
| VASC | 0.90 | 0.88 | 0.89 | 0.96 | 0.96 | 0.96 |
| DF | 1.00 | 0.99 | 1.00 | 0.96 | 0.96 | 0.96 |
Table 5.
The optimized CNN model evaluated on the ISIC2019 dataset.
| Class | PREC | SN | F-Score | ACC | SP | DICE |
|---|---|---|---|---|---|---|
| NEV | 0.98 | 0.97 | 0.97 | 0.94 | 0.93 | 0.94 |
| MEL | 0.94 | 0.91 | 0.92 | 0.94 | 0.93 | 0.94 |
| BCC | 0.90 | 0.93 | 0.92 | 0.94 | 0.93 | 0.94 |
| BKL | 0.99 | 1.00 | 1.00 | 0.94 | 0.93 | 0.94 |
| AKIEC | 0.87 | 0.85 | 0.86 | 0.94 | 0.93 | 0.94 |
| VASC | 0.86 | 0.81 | 0.84 | 0.94 | 0.93 | 0.94 |
| DF | 0.97 | 0.99 | 0.98 | 0.94 | 0.93 | 0.94 |
| SCC | 1.00 | 1.00 | 1.00 | 0.94 | 0.93 | 0.94 |
Table 6.
The optimized CNN model evaluated on the ISIC2017 dataset.
| Class | PREC | SN | F-Score | ACC | SP | DICE |
|---|---|---|---|---|---|---|
| NEV | 0.94 | 0.86 | 0.90 | 0.92 | 0.91 | 0.89 |
| MEL | 0.89 | 0.94 | 0.91 | 0.91 | 0.92 | 0.91 |
| KER | 0.97 | 0.99 | 0.98 | 0.95 | 0.96 | 0.94 |
Table 7.
Comparison of our method with other state-of-the-art methods in skin lesion recognition (%).
Table 7.
Comparison of our method with other state-of-the-art methods in skin lesion recognition (%).
| Method | Datasets | PREC | SN | F-Score | ACC | SP |
|---|---|---|---|---|---|---|
| EDLB [42] | HAM10000 | – | – | – | 91 | – |
| MobileNetV2+LSTM [43] | HAM10000 | – | 92.24 | – | 90.21 | 95.1 |
| DT+RF [44] | HAM10000 | – | – | – | 97.30 | – |
| Conventional+DL [45] | HAM10000 | 94.48 | – | – | 96.7 | – |
| NM-TLN [46] | HAM10000 | – | 90.2 | – | 97.73 | |
| ELM [47] | HAM10000 | – | – | – | 93.40 | – |
| Our prop method | HAM10000 | 98.86 | 98.57 | 98.71 | 98.66 | 99.23 |
| CNN+TF [48] | ISIC2019 | – | – | – | 96.30 | – |
| GoogleNet+SVM [49] | ISIC2019 | – | – | – | 94.92 | – |
| DenseNet201(Fine-tuned) [50] | ISIC2019 | 88.22 | 80.30 | 84.07 | 91.33 | 98.07 |
| DenseNet201+Cub SVM [50] | ISIC2019 | 84.82 | 92.04 | 86.82 | 92.04 | 96.40 |
| DenseNet201+Fine-KNN [50] | ISIC2019 | 85.22 | 92.75 | 86.96 | 92.75 | 96.38 |
| Our prop method | ISIC2019 | 93.88 | 93.25 | 93.63 | 93.57 | 93.45 |
| MS-SVM [47] | ISIC2018 | 91.52 | – | – | 91.84 | – |
| F-KNN [47] | ISIC2018 | 89.90 | – | – | 90.60 | – |
| ELM [47] | ISIC2018 | 94.08 | – | – | 94.36 | – |
| DLFF [51] | ISIC2018 | – | – | – | 92.40 | – |
| Attenation-RL [52,53] | ISIC2018 | – | – | – | 93.40 | – |
| Our prop method | ISIC2018 | 96.00 | 95.86 | 96.00 | 95.96 | 97.45 |
| Our prop method | ISIC2017 | 93.33 | 94.00 | 93.00 | 92.66 | 93.00 |
Disclaimer/Publisher’s Note: The statements, opinions and data contained in all publications are solely those of the individual author(s) and contributor(s) and not of MDPI and/or the editor(s). MDPI and/or the editor(s) disclaim responsibility for any injury to people or property resulting from any ideas, methods, instructions or products referred to in the content. |
© 2023 by the authors. Licensee MDPI, Basel, Switzerland. This article is an open access article distributed under the terms and conditions of the Creative Commons Attribution (CC BY) license (https://creativecommons.org/licenses/by/4.0/).
Share and Cite
MDPI and ACS Style
Salih, O.; Duffy, K.J. Optimization Convolutional Neural Network for Automatic Skin Lesion Diagnosis Using a Genetic Algorithm. Appl. Sci. 2023, 13, 3248. https://doi.org/10.3390/app13053248
AMA Style
Salih O, Duffy KJ. Optimization Convolutional Neural Network for Automatic Skin Lesion Diagnosis Using a Genetic Algorithm. Applied Sciences. 2023; 13(5):3248. https://doi.org/10.3390/app13053248
Chicago/Turabian StyleSalih, Omran, and Kevin Jan Duffy. 2023. "Optimization Convolutional Neural Network for Automatic Skin Lesion Diagnosis Using a Genetic Algorithm" Applied Sciences 13, no. 5: 3248. https://doi.org/10.3390/app13053248
Note that from the first issue of 2016, this journal uses article numbers instead of page numbers. See further details here.