
Calibrated Q-Matrix-Enhanced Deep Knowledge Tracing with Relational Attention Mechanism

1
Central China Normal University Wollongong Joint Institute, Central China Normal University, Wuhan 430079, China
2
Faculty of Artificial Intelligence in Education, Central China Normal University, Wuhan 430079, China
*
Author to whom correspondence should be addressed.
Appl. Sci. 2023, 13(4), 2541; https://doi.org/10.3390/app13042541
Submission received: 5 January 2023
/
Revised: 11 February 2023
/
Accepted: 14 February 2023
/
Published: 16 February 2023
(This article belongs to the Special Issue Recent Analysis and Applications of Algorithms, Programs and Data Based on Artificial Intelligence)
Abstract
:With the development of online educational platforms, numerous research works have focused on the knowledge tracing task, which relates to the problem of diagnosing the changing knowledge proficiency of learners. Deep-neural-network-based models are used to explore the interaction information between students and their answer logs in the current field of knowledge tracing studies. However, those models ignore the impact of previous interactions, including the exercise relation, forget factor, and student behaviors (the slipping factor and the guessing factor). Those models also do not consider the importance of the Q-matrix, which relates exercises to knowledge points. In this paper, we propose a novel relational attention knowledge tracing (RAKT) to track the students’ knowledge proficiency in exercises. Specifically, the RAKT model incorporates the students’ performance data with corresponding interaction information, such as the context of exercises and the different time intervals between exercises. The RAKT model also takes into account the students’ interaction behaviors, including the slipping factor and the guessing factor. Moreover, consider the relationship between exercise sets and knowledge sets and the relationship between different knowledge points in the same exercise. An extension model of RAKT is called the Calibrated Q-matrix relational attention knowledge tracing model (QRAKT), which was developed using a Q-matrix calibration method based on the hierarchical knowledge levels. Experiments were conducted on two public educational datasets, ASSISTment2012 and Eedi. The results of the experiments indicated that the RAKT model and the QRAKT model outperformed the four baseline models.
1. Introduction
Currently, the evolution of technology and science brings many conveniences to people and produces a large amount of user information involving education, health care, and finance. In the educational field, combining education theory with artificial technology has become a famous research direction for finding valuable information to promote the development of education. In recent years, after the improvement of the level of smart education and the combination of big educational data with educational theories, many smart educational platforms emerged worldwide, such as Coursera, Udacity, edX, and massive open online courses (MOOCs). These platforms provide many online courses and exercises that have attracted the attention of many researchers (e.g., [1]). These online platforms also provide students with many free, personalized learning materials and online courses to improve the performance of students during their studies (e.g., [2,3]). Teachers can utilize those smart educational systems to prepare remedial materials based on the situation of students [4]. However, recent research indicates that students are prone to losing their attention and show a high dropout rate regarding online courses (e.g., [5]). Personalized learning is a solution to this problem and has proven to be an efficient approach that involves the accurate extraction of learning materials (e.g., [6]).
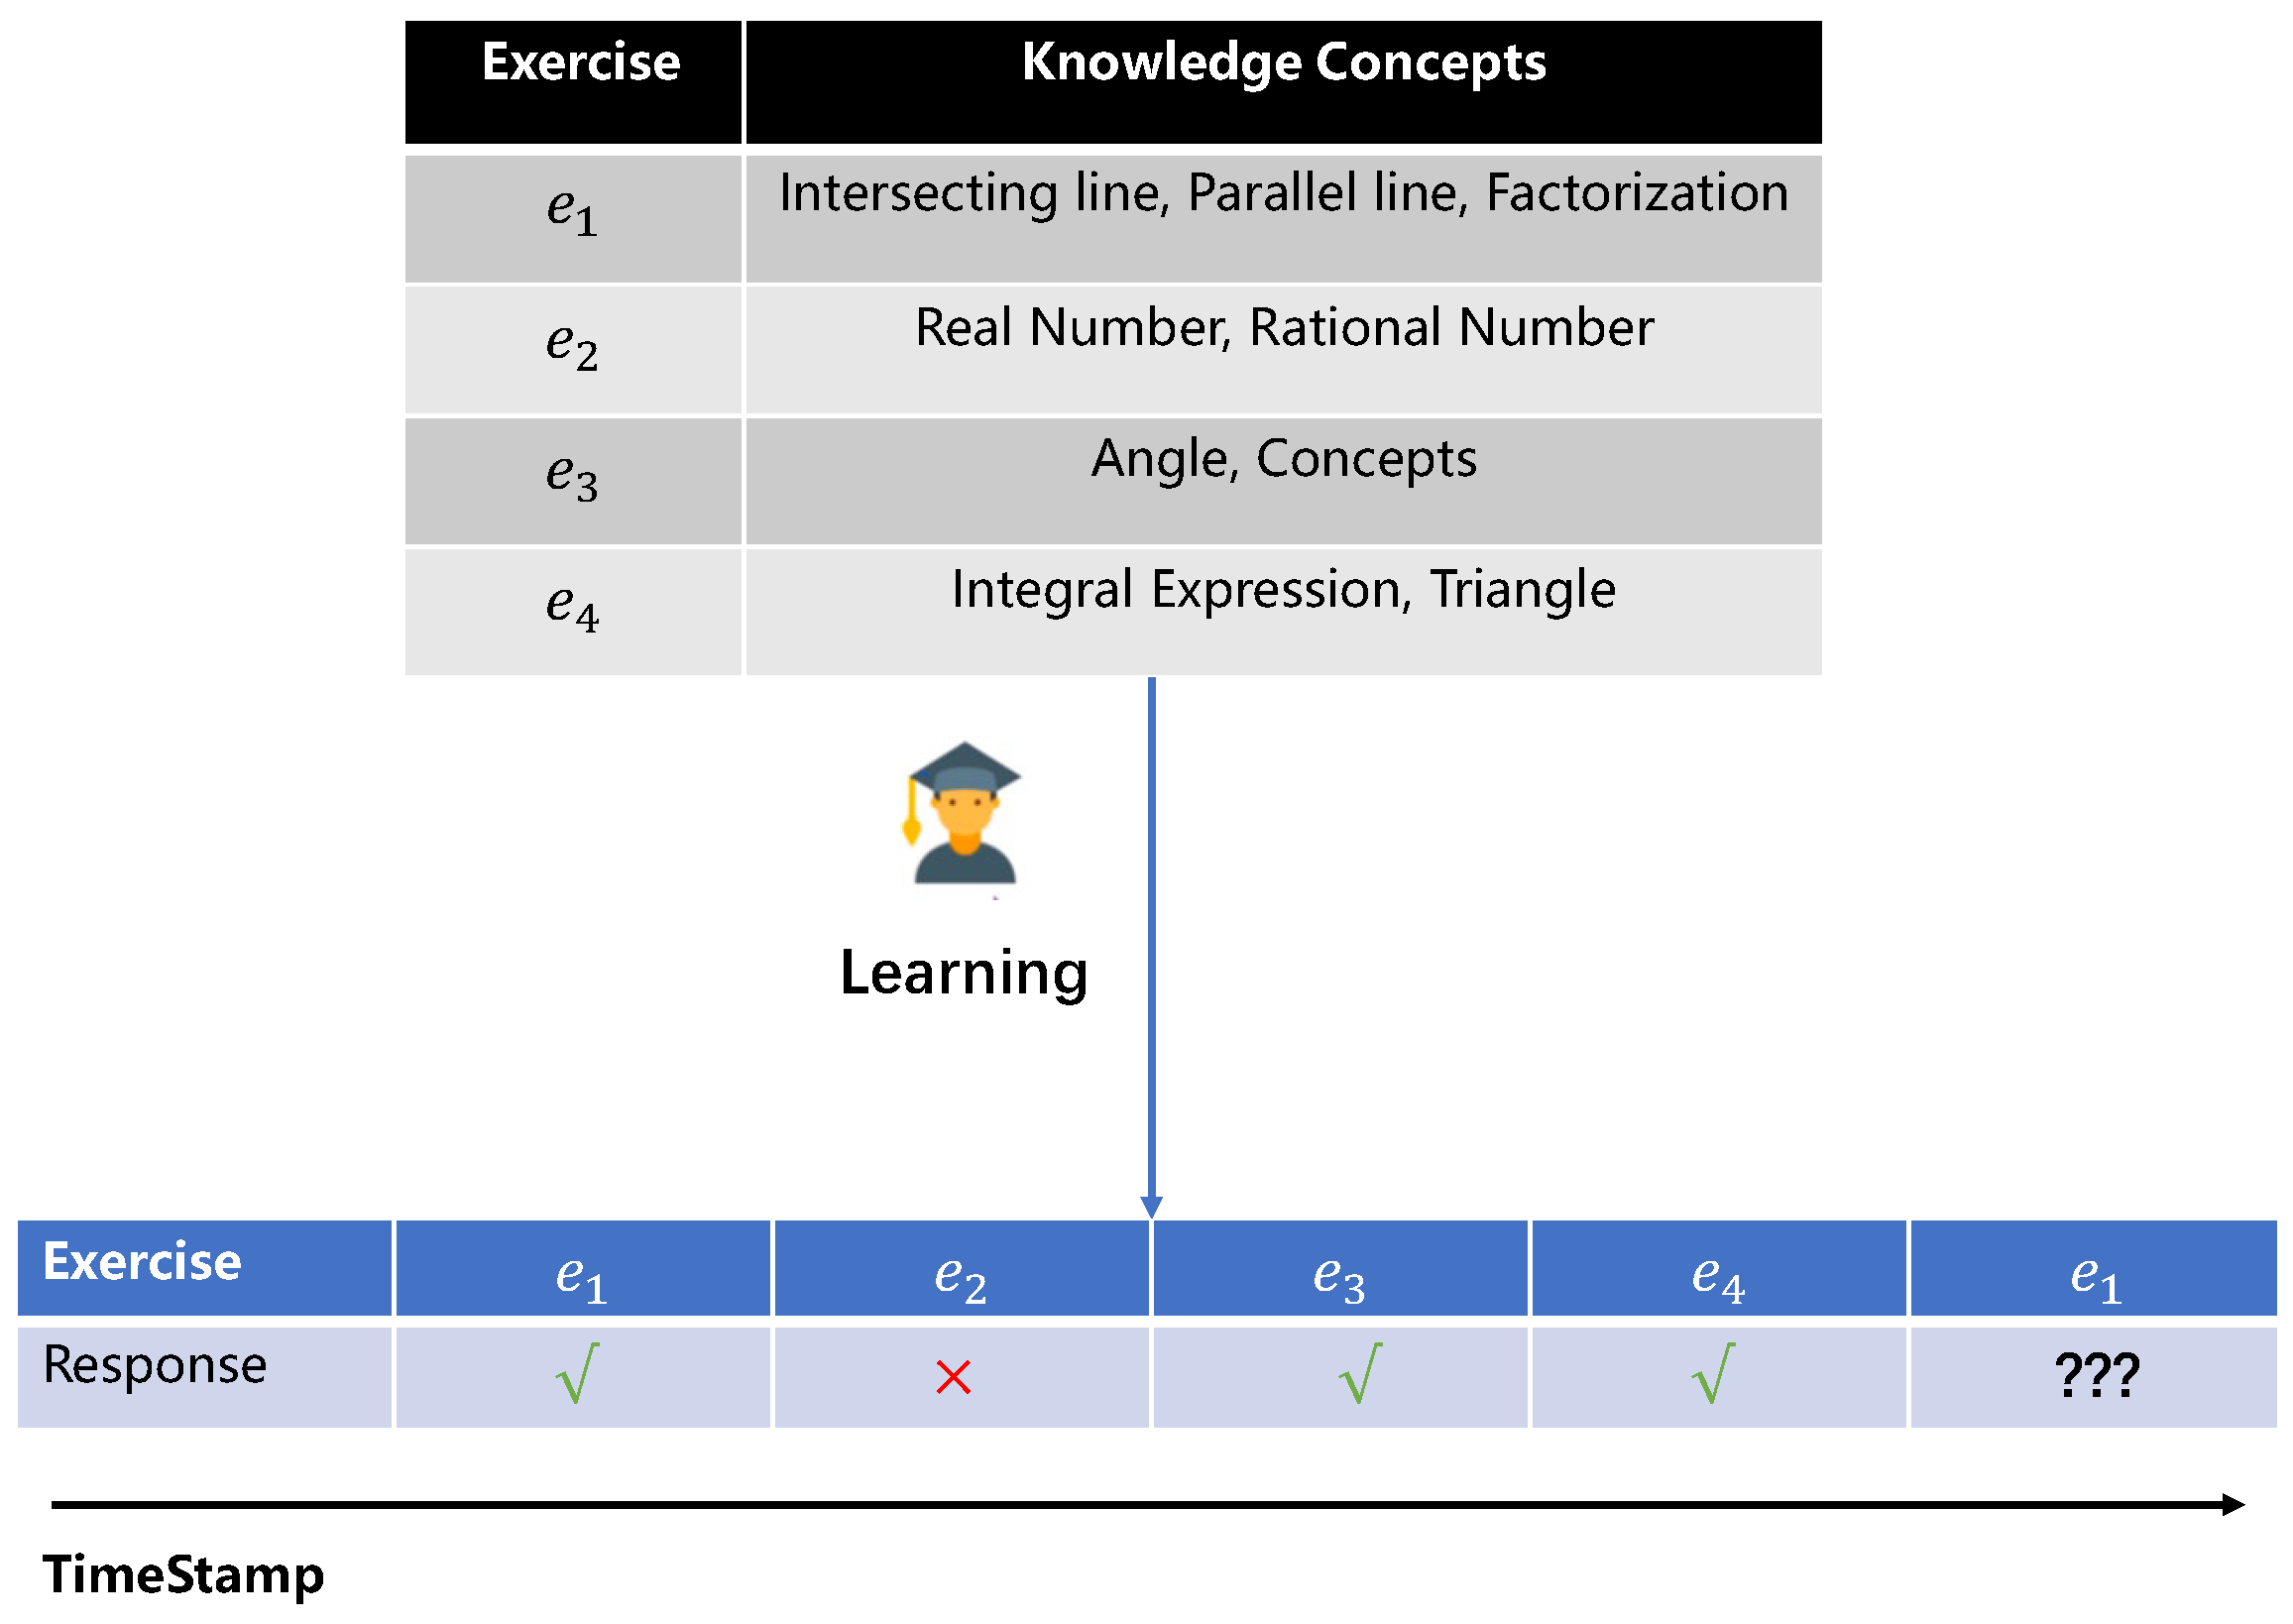
Knowledge tracing is the core of personalized exercise and is defined as the task of estimating how students master many knowledge points. Specifically, a student selects some exercises from problem sets (e.g., e, e, e, e) to learn some knowledge concepts (KCs) and leaves his/her response logs (e.g., right or wrong); see Figure 1. Knowledge tracing is then performed using his/her previous practice attempts and exercise–KC interactions to indicate the student’s own latent knowledge state on each KC [7]. The interactions from past exercises have a distinctive effect on the target KC and determine the mastery of a certain KC. Additionally, the impact varies depending on the situation. Generally, the effect of past interactions is determined by four factors. The first factor is the exercise relation. The closer the association between past interactions and current practice, the better the performance in the knowledge tracing task will be. The second factor is the time intervals between current practice and past interactions (e.g., e, e, e, e). When considering the forgetting behavior of learners, the degree of mastery of skills for students decays with time. Therefore, the shorter the time interval between the past interaction and the current interaction, the greater the probability that the students will answer the current exercise correctly. The third factor is the students’ interaction behaviors, including the guessing factor and the slipping factor. When students choose to guess the answer correctly or answer the question very carelessly, resulting in incorrect answers, the student’s mastery of the knowledge point will be worse. The last factor is the learning resource modeling. Cross-mapping between practices and KCs can be characterized as a Q-matrix, whose rows and columns reflect exercises and KCs, respectively. The Q-matrix is considered as the source of information about the exercise knowledge concept [5] with binary elements, in which “1” presents this KC, which is covered by an exercise, and “0” presents a non-association between the exercise and this KC. The Q-matrix is proven to have implicit semantic information and is directly helpful in tracking students’ knowledge proficiency.
In order to track the knowledge state evolution of students, a sequential modeling method called the deep knowledge tracing (DKT) model has been designed based on the idea of deep learning (e.g., [8]). The relation between KCs incorporated in the design of the DKT model has been proven to be significant. For example, the dynamic Bayesian network model is applied to model the pre-requisite relationship between KCs [9]. However, the relationship between these KCs is often treated as a priori inputs, which require a great deal of labor. Therefore, some models are created to automatically estimate the relationship between exercises. For example, Reference [10] utilized the question text of exercises to simulate the relationship of semantically comparable exercises. However, those knowledge tracing models do not take into consideration the time elapsed between exercises. Knowledge tracing’s temporal variables were discussed in [11,12]. Those techniques primarily focus on the time since the last interactions with the same KC or previous interactions. However, as mentioned, previous interactions and student behaviors are both engaged in the preceding interactions’ different effects on the knowledge tracing task. These techniques do not consider previous interactions and student behaviors.
The Q-matrix is used for the modeling of learning resources applied in many models (e.g., [5,13]). The Q-matrix is designed as a binary matrix, which only reflects the relationship between knowledge points and exercises. However, the binary Q-matrix ignores the relationship between knowledge points, such as the hierarchical levels of knowledge points. For example, in the knowledge graph, the rational number is the parent node of the fraction. However, when marking the Q-matrix, those two knowledge points are simply marked as “1” when an exercise contains both knowledge points: the rational number and the fraction.
In this paper, a novel relational attention knowledge tracing (RAKT) model and its extension model, the calibrated Q-matrix relational attention knowledge tracing model (QRAKT), are proposed. In the RAKT model, two types of self-attention mechanisms are applied for the KT task, the positional attention layer and the relational attention layer. Specifically, the positional attention layer is used to replace traditional absolute position encoding in the attention mechanism with a positional attention layer. The outputs of the positional attention layer are used as the inputs of the relational attention layer. The relational attention layer incorporates text information with relation modeling, including relation modeling exercises, forgetting behavior modeling, and student behavior modeling. These two types of attention mechanisms retain the adaptability and clarity of the traditional attention mechanism; see the works of [14]. When considering the student behaviors and the guessing factor and slipping factor, the RAKT model can more efficiently track the students’ knowledge state. Therefore, the online educational system, which applies the RAKT model, can provide personalized exercises for students based on each student’s behaviors. In the end, the extension of the RAKT model, QRAKT, was designed based on a calibrated Q-matrix, which not only indicates the relationship between exercises and KCs, but also presents the relationship between KCs in the same exercise. According to this calibrated Q-matrix, the corresponding knowledge vectors will replace the text representation in the positional attention layer. The smart educational system, which applies the QRAKT model, can provide more personalized exercises due to the fact that the QRAKT model further improves the ability to track the students’ knowledge state by incorporating the Q-matrix in the knowledge tracing process. Our experiments were carried out on two real-world datasets and indicated that RAKT and QRAKT performed better than the four baseline models.
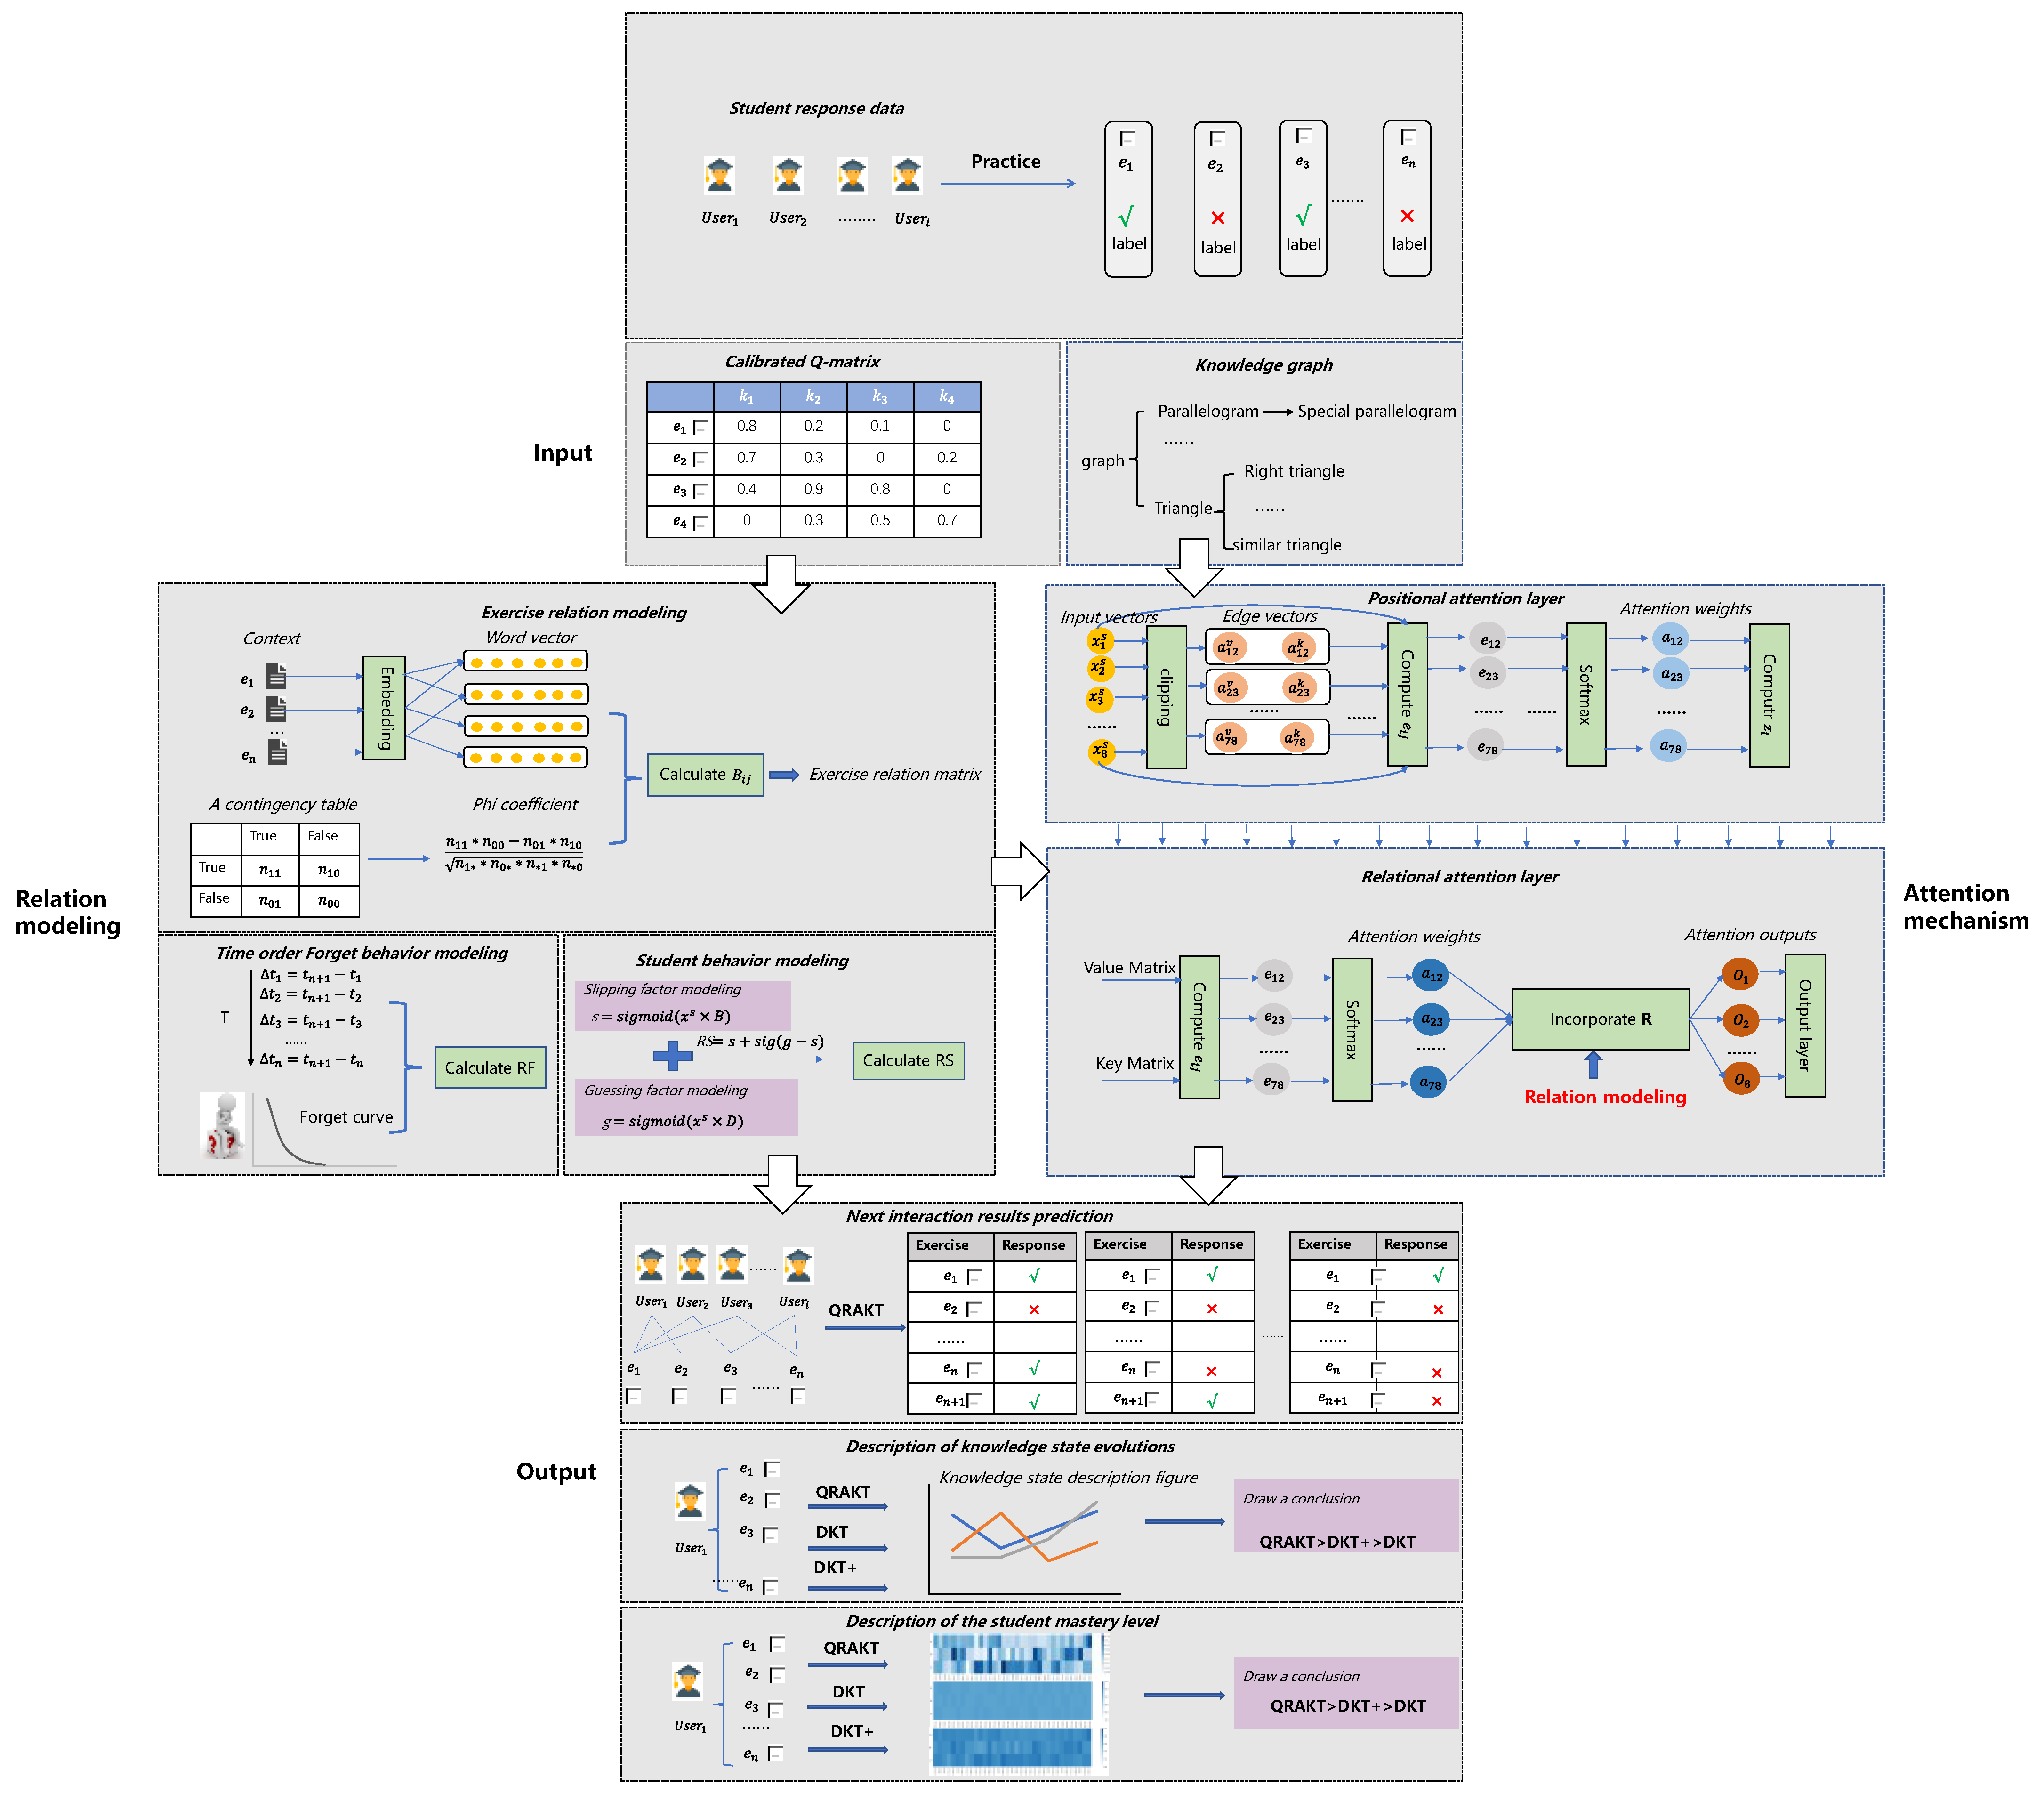
The general solutions of QRAKT can be seen in Figure 2. In Figure 2, there exist four parts to our paper. The first part is the input part. The student response data include exercise-related information, the corresponding student’s responses, and the corresponding knowledge vectors, which will replace the text representation in the positional attention layer. The second part is relation modeling, including exercise relation modeling, time-order forgetting behavior modeling, and student behavior modeling. Exercise relation modeling is developed according to the contingency table, which is calculated from students’ performance data and exercise word embedding vectors. Time-order forgetting behavior modeling is used for estimating the students’ forgetting behavior by calculating different time intervals between the previous exercises and the current exercise. All time is required to uniformize the time order, which means t < t < t < … < t. The last modeling is student behavior modeling, which considers the students’ interaction behavior, including the guessing factor and slipping factor to trace the students’ knowledge state. The third part is two types of attention mechanisms involving the positional attention and relational attention layers. In the positional attention layer, the relative distance, which combines edge vectors, replaces the absolute distance in the traditional attention mechanism to generate the output of this layer. In the relational attention layer, the results of the positional attention layer are applied as the inputs of the relational attention layer. The relational attention mechanism incorporates the relation modeling coefficient, R, with the traditional attention weights to produce the final relational attention weights. The last part is the output part: three outputs are specified, the next interaction result prediction, a description of knowledge state evolution, and a description of the student mastery level. In the next prediction of the interaction result, the QRAKT model will be applied to predict the performance of the next exercise e for each student. To illustrate the significance of the QRAKT model compared with two standard knowledge tracing models, the DKT model and the DKT+ model, the evolution of a student’s knowledge state in these three models is introduced. It is indicated that the QRAKT model outperformed the other two models. The last output is an illustration of the student’s mastery level. Three heat maps were used to estimate the student’s mastery level on Skill 49 and indicate that the QRAKT model also performed better than the other two models.
The contributions of our paper are as follows:
- The positional attention layer was utilized to replace the position encoding part with relative distances to capture the connection of each input vector to acquire better prediction results in the KT task.
- This paper designed three types of relation modeling, exercise relation modeling, time-order forgetting behavior modeling, and student behavior modeling. Compared with traditional exercise relation modeling in the EKT model [10], this paper considered the student behaviors such as the forgetting behavior. When considering the traditional student behavior modeling in the EKPT model [5], the Q-matrix is calibrated and the guessing factor and slipping factor are involved in the student behavior modeling to track the students’ knowledge state.
- The calibrated Q-matrix, which reveals hierarchical knowledge levels, was innovatively designed to help evaluate students’ overall ability utilizing latent feature values. The calibrated Q-matrix replaces the one-hot representation vectors in all exercises with representation vectors based on relevant knowledge points to obtain better explainable results of the knowledge state of students.
- In-depth experiments on two real-world public datasets were conducted to prove that the RAKT model and the QRAKT model not only outperformed the four baseline models, but also describe how the predictions were made.
The rest of the paper is organized as follows. Some related works are reviewed in Section 2. In Section 3, the general methods of this paper are introduced. Extensive experiments on two public educational datasets are conducted in Section 4. Finally, the conclusions and future work of this paper are presented in Section 6.
2. Related Works
Our proposed methodology applies to three major aspects of the research literature. Firstly, some advanced knowledge tracing techniques are compared in detail. Secondly, some modeling methods are introduced, exercises’ relation modeling, forgetting behavior relation modeling, and student behavior relation modeling. Lastly, the core idea of the attention mechanism and its application directions are presented.
2.1. Knowledge Tracing
According to the student response data, the knowledge tracking task aims to measure the state of knowledge of the students. Inspired by the great success of deep learning in the field of speech processing [15,16] and computer vision [17,18,19,20], various deep-learning-based KT models have demonstrated an improvement in tracing the students’ knowledge state. Regarding the state-of-the-art, the deep knowledge tracing (DKT) model was the first approach to use a neural network to reflect students’ complex educational process (e.g., [8]). The extension effect of the DKT model was further verified (e.g., [21]). Existing studies based on the DKT model are prone to simulating the knowledge state of students while ignoring the simulation to encode exercises and skills in a one-hot form. The EKT model uses exercise embedding modules to acquire an exercise model, which is applied to estimate students’ performance on upcoming exercises (e.g., [10]). Additionally, a memory-augmented neural network (MANN) model (e.g., [22]) was introduced to obtain higher explainable results compared with the DKT model in the knowledge tracing field. The MANN model uses the key and value as two metrics to discover the similarity between exercises and the student’s knowledge state. To estimate the performance of a target KC, the self-attentive knowledge tracing (SAKT) model [23] first determines the KCs from previous actions of students related to the target KC.
Currently, there exist some hybrid models incorporating the relationship between exercises, skills, and student behaviors with the attention mechanism. The attentive knowledge tracing model (AKT) was proposed to incorporate the monotonic attention mechanism with the flexible deep neural network to provide more interpretability results [24]. A context-aware representation was designed in the AKT model to take learners’ history records into consideration. However, the AKT model does not consider the relationship between exercises and concepts. The semantic-enhanced questions embeddings pre-training (SEEP) method was designed to explore the relational information of questions and concepts [25]. The SEEP method combines the student–question–concept interactions with the two-level attention mechanism to generate the question embeddings. Compared with the SEEP method, the pre-trained question embedding via Relation map for knowledge tracing (PERM) model learns the question embedding according to a question–concept bipartite graph with a two-level attention aggregation mechanism [26]. However, the SEEP method and PERM method both ignore student behavior modeling such as forgetting behavior modeling or guessing behavior modeling. Therefore, a graph-based knowledge tracing model, the SGKT model, was designed to model the forgetting behavior with a self-attention mechanism and applies graph neural networks to generate the accurate knowledge tracing results [27]. In the SGKT model, there exist two types of graphs: the session graph and the relationship graph. The session graph is used to model the response process of students, and the relationship graph is applied to model the relationship between exercises and skills. However, the SGKT model ignores the situation in which students can guess a question or students answer the wrong question because of their carelessness.
The RAKT model and the QRAKT model, which is considered the extension of SAKT, incorporate the relationship of exercises involved in the interaction with the forgetting behavior of students with the slipping factor and the guessing factor and apply two attention mechanisms to track students’ knowledge state.
2.2. Relation Modeling
2.2.1. Exercise Relation Modeling
Based on psychological science, the exercise relation has been widely investigated in many papers to trace the state of students’ knowledge (e.g., [28,29,30]). In some proposed methodologies, the Q-matrix is used by researchers to map exercises to knowledge points to explore the relationship between two exercises. Two exercises show a connection when they belong to the same knowledge concept. In addition to the Q-matrix-based method, researchers pay attention to extracting connections between two exercises based on the exercises’ content (e.g., [11,31]). According to the content of the exercises, the semantic similarity scores of exercises are calculated as the attention coefficients of the previous interactions to model the importance of past interactions. In general, combining exercise relation modeling with the KT task is a tremendous potential area, which has attracted many researchers to explore it (e.g., [32,33]). The methods in this paper incorporate the content of the exercises and previous interactions to generate better results for the KT task.
2.2.2. Forgetting Behavior Modeling
According to the forgetting curve theory, the degree of a student’s cognitive ability influences how quickly his/her memory will decline over time (e.g, [34]). The DKT+Forget model [11] recently implemented different time step features based on the DKT model. The DKT+Forget model incorporates recurrence and sequential time gaps with the number of previous experiments, and this model is regarded as an effective knowledge tracing method with temporal information. Compared with the DKT+Forget model, the KPT model tracks and explains the evolution of knowledge proficiency by combining the learning factor and forgetting factor [5]. This model relates each exercise to a knowledge vector, where each element employs a Q-matrix to represent a specific knowledge topic.
2.2.3. Student Behavior Modeling
Technically, the item response theory (IRT) [35] is utilized in educational assessment and measurement and promotes factor analysis models including the slipping factor, the guessing factor, etc. The core idea is to learn a function, usually a logistic function, based on various characteristics in a population of students who complete a group of questions. The Rasch model [36] is regarded as the simplest IRT model that defines a one-parameter logistic regression (1PL) model. This 1PL model takes into account the difficulty parameter and the difficulty of an item. There are several logistic regression models constructed for IRT. For example, the four-parameter logistic (4PL) model originally contained a discrimination factor, a difficulty factor, a guessing factor, and a slipping factor, and this logistic regression model was first presented by Barton and Lord [37]. In our work, the exercise relation, forgetting behavior, and slipping and guessing factor were incorporated to trace the knowledge state of students.
2.3. Attention Mechanism
The attention mechanism [38] is an effective approach to sequence modeling tasks. The core idea of this mechanism is to predict the outcome by focusing on important elements of the input. The attention mechanism calculates the input vectors’ attention weights to focus on a specific input and make a specific prediction. The attention mechanism is applied in machine translation tasks, which extract the words from the input sequences in order to generate the subsequent word in the target sentence. In our tasks, the self-attention mechanism was developed to learn the attention weights based on relation modeling and previous response logs for the knowledge tracing task.
3. Preliminaries
There are three parts in this section. The first part defines the task of our paper. Then, the second part describes some of the terminology of this paper, including the calibrated Q-matrix, relation modeling, and relational attention mechanism. Next, the goals of this paper are introduced in detail.
3.1. Problem Definition
Given a question set containing the n exercises (e.g., e, e, e … e) for the student in the smart educational system from Timestamps 1 to t, the online system generates the answering records of the student. Those interactions are denoted as S = { s, s, s … s }, and each interaction s is presented as a tuple: s = (e,r,t), where e is the exercise that this student attempted, is the answer of the student, and t is the time that s occurs. Our goal was to predict the probability p that the students will provide the correct answer according to their interactions: S.
3.2. Terminologies
Definition 1
(calibrated Q-matrix). The Q-matrix was used for the learning resource modeling between exercises and skills. However, there exists the problem that different hierarchical knowledge concepts are treated as the same status in the Q-matrix. Therefore, the calibrated Q-matrix based on hierarchical knowledge levels was developed to indicate the knowledge levels.
Definition 2
(relation modeling). The relation modeling was designed to model the exercise relation and student behaviors including the forgetting behavior, the guessing factor, and the slipping factor.
Definition 3
(relational attention mechanism). The relational attention mechanism was developed to incorporate relational information compared with the traditional attention mechanism by combining the relational attention weights, which are generated by the relation modeling.
3.3. Goals
The goals of this paper aimed at providing an excellent knowledge tracing model that has the best Accuracy and Stability compared with the baseline models for the online educational system. The knowledge tracing model can dynamically track the knowledge state of students.
3.3.1. Accuracy
Generally, accurate knowledge tracing models help the intelligent educational system recommend precise and personalized questions. Therefore, the knowledge tracing models need to be quantified for their Accuracy. To evaluate the Accuracy of the knowledge tracing models, providing a set of questions (e.g, e, e, e, e) to a student, the performance of the student in the next timestamp needs to be predicted. Accuracy is the probability of the knowledge tracing model correctly predicting the performance of students at the next interaction. The Accuracy can be measured by two metrics, AUC and ACC, which will be discussed in detail in Section 4.
3.3.2. Stability
The Stability is based on the Accuracy metric to evaluate the knowledge tracing model. Generally, an online educational system, which applies a stable knowledge tracing model, can provide students with exercises. Those exercises can consistently improve the student performances because the performance of the model is more stable and the recommendation of test questions based on the stable knowledge model can more accurately capture the learning status of the students and recommend more suitable test questions. The Stability of the knowledge tracing model can be measured by comparing the Accuracy between the knowledge tracing model and baseline models at each testing batch. The details of the formulation of the Stability of the knowledge tracing model will be introduced in Section 4.
4. Methods
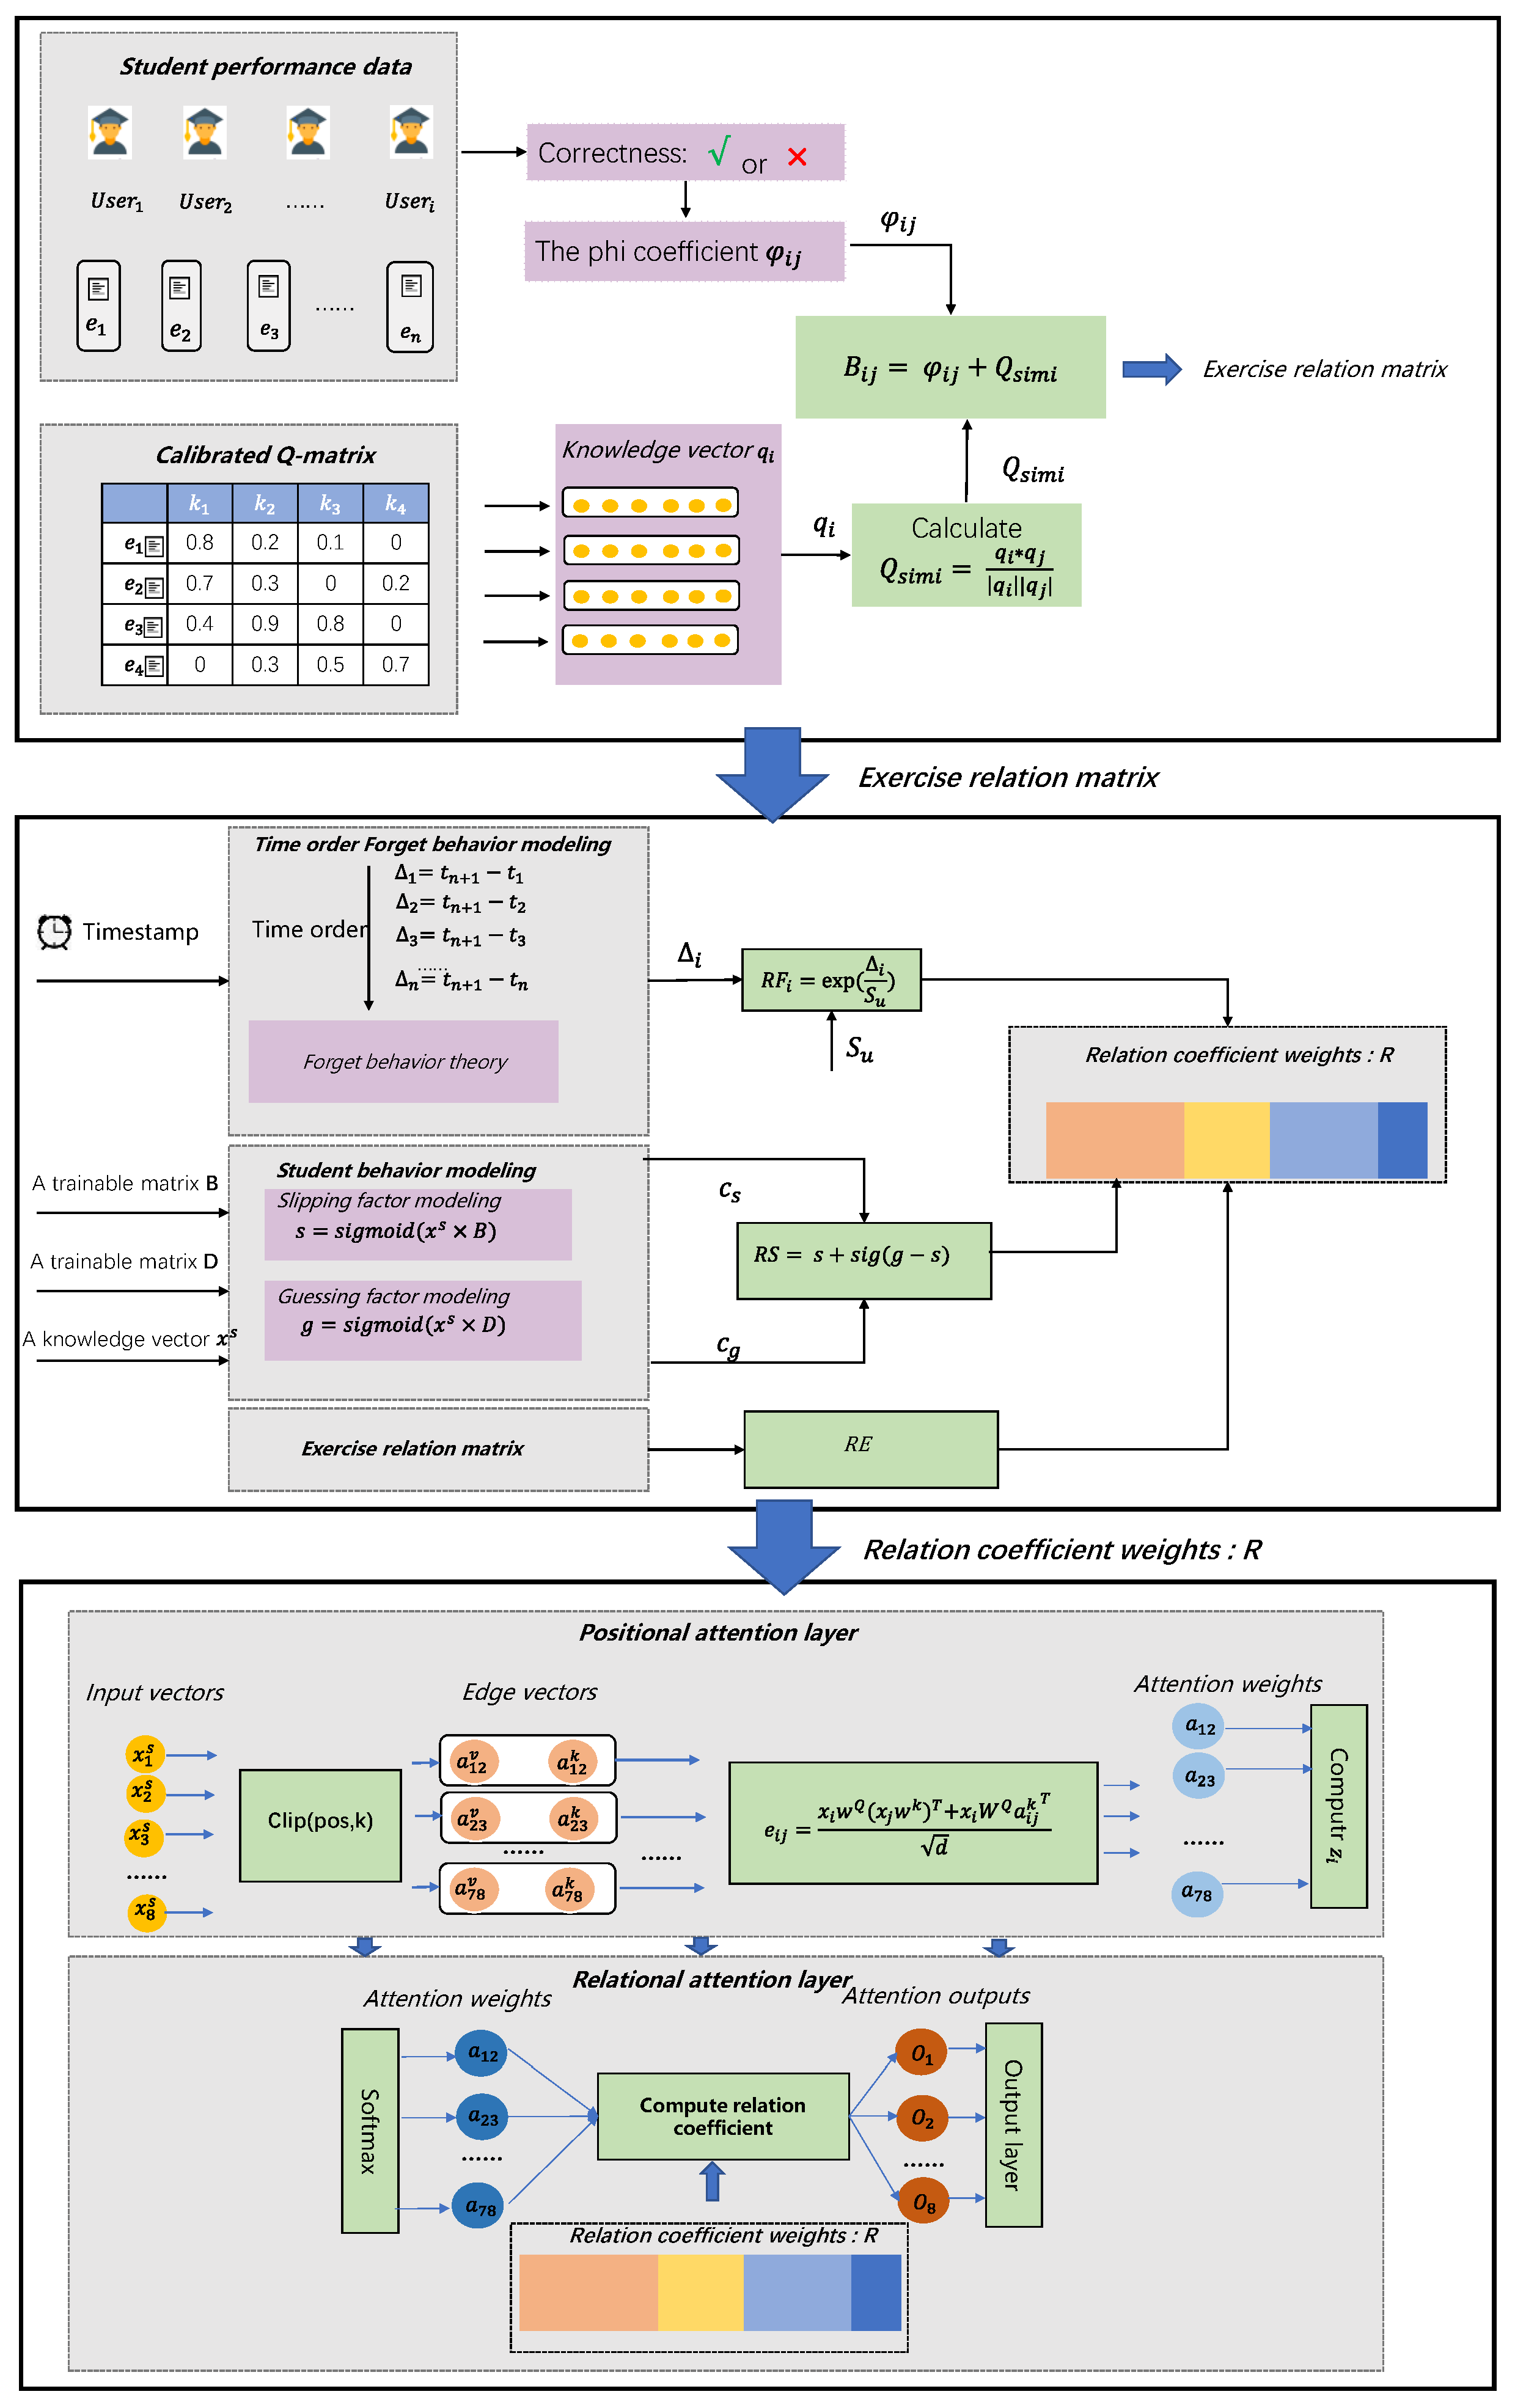
In this section, the relational attention knowledge tracing model (RAKT) is introduced. This model includes relation modeling, the position attention mechanism, and the relational attention mechanism to trace the state of knowledge. Next, the aforementioned calibrated Q-matrix method is integrated to generate an extension model of RAKT called the calibrated Q-matrix relational attention model (QRAKT). This calibrated Q-matrix method based on different hierarchical knowledge levels was designed to explore the relationship between knowledge concepts. The overall architecture of QRAKT can be seen in the following Figure 3. Firstly, the calibrated Q-matrix is computed based on the hierarchical knowledge-level-based Q-matrix calibration method. The students’ performance data were used to obtain the corresponding Phi coefficient. After acquiring Q and , the exercise relation matrix, RE, is calculated. Secondly, the relation coefficient, R, is calculated based on time-order forgetting behavior modeling (), exercise relation modeling, and student behavior modeling (). Lastly, the positional attention layer and relational attention layer incorporate the relation coefficient to generate the final outputs. The mathematical annotations can be seen in the previous Table 1.
4.1. Relation Attention Knowledge Tracing Model
Following existing works (e.g., [14]), in order to obtain explainable and accurate results, the relationship of the previous sequence of interactions S = {s, s, s … s} was explored to design the knowledge tracing model based on the attention mechanism. Each interaction was characterized as a tuple s = (e, r, t). In the ith interaction of a student: s, e is the exercise that this student attempts, is the answer of the student, and t is the time of s occurs. The relative position of the input elements of the attention mechanism predicts the student’s performance on the next exercise. A two-parameter logistic regression model that contains a slipping factor and a guessing factor also needs to be incorporated to consider student interaction behaviors. Based on those ideas, a knowledge tracing method called the relation attention knowledge tracing model (RAKT) is proposed. This knowledge tracing model combines relation modeling and the relative position to obtain improved attention weights and generates the knowledge tracing results in the n + 1th interaction. Binary cross-entropy is used as the learning function in this model. The RAKT model will be introduced in three parts including the exercise matrix and relation modeling layer, the attention layer, and the knowledge tracing result prediction layer.
4.1.1. Exercise Matrix and Relation Modeling Layer
- : In order to obtain better semantic representations of exercises from the textual information, a word embedding technique was designed to learn the exercise representation. The word embedding matrix of the exercise i is the input in this part. Then, each representation of exercise E is obtained by taking a weighted combination of the embedding of all words. The exercise matrix was designed to reveal the relationship between different exercises. B can be calculated based on the Phi coefficient: and the similarity score of two exercises: . In order to obtain B, there exist three steps. The first step is to obtain the Phi coefficient. A contingency Table 2 needs to be extracted from previous students’ interactions. Based on Table 2, the Phi coefficient is computed as a measurement for the relationship between exercise i and exercise j, and the computation of the Phi coefficient can be seen in the following Formula (1).As the formula of the Phi coefficient shows, this coefficient lies between −1 and 1. The high coefficient parameter indicates that exercises i and exercise j has highly related knowledge concepts. The second step is to obtain the similarity score: of exercises i and j. is calculated based on the word embedding of exercises i and j: and , and the formula of can be given as follows (2):The last step is to compute B by the following formula:
- : In this part, the relational coefficient is calculated on the basis of the results of the relation modeling to predict the performance of the student in the next interaction. Specifically, exercise relation modeling, time-order forgetting behavior modeling, and student behavior modeling are described in detail.Exercise relation modeling: This part involves the relationship between two different exercises. Given an exercise sequence (e, e, e … e) for a student, the goal is to predict the performance of the student in the next interaction e. To achieve this goal, the exercise relation matrix is computed as RE = (B, B … B) based on the previous exercise matrix B. Time-order forgetting behavior modeling: Learning theory shows that students will forget knowledge points after a while. This theory is called the forgetting curve theory, which has been applied in many fields of cognitive diagnosis. If a student forgets some concepts of knowledge after the interaction i, the relevance of the interaction i should be diminished when predicting the next student’s interaction performance. According to the forgetting curve theory, a kernel function was used to model the importance of the interaction concerning the timestamp; see the works of [14]. The kernel function was designed as an exponentially decaying curve based on the idea of forget curve theory, specifically when given a timestamp sequence of the interaction of a student T = that must uniformize the time order and the time of the student who tries to complete the exercise in the next interaction denoted as t. The relative time between t and the ith interaction is given as . Then, the coefficient RF based on the forgetting factor can be obtained. RF = . S refers to the strength memory of the student i and is a trainable parameter for our network. Student behavior modeling: This part involves the slipping and guessing factor modeling. This two-parameter logistic regression model (2PL) was developed on the item response theory; see the work of [37]. When a student attempts to finish an exercise, the student may answer this question very carelessly, leading to the wrong answer or the student may guess an answer for this exercise. In order to model these two situations, the slipping factor s and the guessing factor g were designed. Specifically, the slipping factor s and the guessing factor g can be modeled as two trainable parameters in our network based on two trainable matrices: D and C, and the input element . After modeling the slipping factor and guessing factor, RS can be obtained by using the following formula:After combining these three types of modeling, the coefficient of the relation modeling can be obtained by using the following formula:
4.1.2. Attention Layer
This layer consists of two sublayers, including the positional attention layer and the relational attention layer, and combines the relation modeling coefficient, R, to generate the final attention weights:
- : The positional attention layer can be applied to consider the relative position of each word in an exercise in order to obtain a higher interpretation ability than the absolute position in the traditional attention mechanism. Specifically, positional attention has h attention heads, and each attention head has two input sequences X and , where . The edges between X and X are represented by vectors . In this positional attention layer, the maximum relative position of the input sequences is clipped to a value k. This process enables the model to generalize to sequence lengths that are not seen during the training process. a and a are calculated based on the maximum distance clipping using the following formula, and the relative position representations are and .Then, is calculated based on a compatibility function that compares two input elements, and . W and W are the parameter matrices. d is the dimension of the new sequence of Z.Next, a weight coefficient a is calculated based on e by applying the softmax function.Lastly, the final output of the positional attention layer, Z, is computed as follows:
- : In this layer, the output of the positional attention layer using Formula (9) is used as the input, and the relation coefficient R is incorporated into the relation attention mechanism, which pays more attention to some relevant interactions of students. is the attention weight of this relation attention mechanism using the following formula.where represents the word embedding of exercise e, represents the input element of this layer using Formula (9), and and are thequery matrix and key matrix for this relational attention layer. Next, the traditional attention weight and relation coefficient weight R is incorporated as the relational attention weight :Finally, the output of this layer is obtained by the following formula:where is the value matrix of the attention mechanism.
4.1.3. Knowledge Tracing Result Prediction Layer
In this layer, the pointwise feed-forward (FFN) and prediction layers are involved in obtaining the output of the RAKT model. In the FFN, a nonlinear ReLU activation function is used to incorporate the nonlinearity property of RAKT and to take into account the interaction between different latent dimensions. The output of the FFN is F = , where and are weight matrices and and are used as bias vectors for this model. In the prediction layer, the sigmoid function is applied to predict the performance of the students in the next interaction.
where p is the probability that the student can answer the next interaction exercise correctly, is the weighted matrix, and is the bias vector.
4.2. Calibrated Q-Matrix Relational Attention Knowledge Tracing Model
According to the work of [39], the relevant KCs are more important than other content in an exercise to obtain more explainable KT results. A binary Q-matrix, , was designed to further model KCs in exercises. This section introduces two parts, Q-matrix generation and validation, and incorporating the Q-matrix with the RAKT model generates its extension model called the calibrated Q-matrix relational attention knowledge tracing model (QRAKT).
4.2.1. Q-Matrix Generation and Validation
If an exercise i contains a KC k, then Q = 1; Q = 0 otherwise. Each row of the Q-matrix presents a vector of knowledge points that can relate an exercise to the corresponding KCs. However, when considering that an exercise often relates several numbers of KCs and a KC is also contained in several exercises, a binary skill mastery vector cannot take the relationship between exercises and KCs into account and cannot reveal the hierarchical knowledge levels of KCs based on the knowledge graph. Therefore, a hierarchical knowledge-level-based Q-matrix calibration method (HKLQC) was designed to solve those problems using the following algorithm in Algorithm 1. A partial order is defined as:
| Algorithm 1 Hierarchical knowledge-level-based calibration method. |
|
This means that KC: a has more knowledge importance than KC: b in exercise e and KC: b is a more significant knowledge concept than KC: c in exercise e. a, b, and c imply that KC: a, KC: b, and KC: c belong to hierarchical knowledge Levels 0, 1, and 2,respectively. For example, the real number is regarded as the parent node of the rational number, and the parent node of the fraction is the rational number. Therefore, in the knowledge map, the hierarchical knowledge level of the real number is 0, the hierarchical knowledge level of the rational number is 1, and the hierarchical knowledge level of the fraction is 2. The partial order set is defined as
Based on traditional Bayesian treatment, the calibrated Q-matrix, , follows a zero mean Gaussian prior with the standard deviation. To give the Q-matrix labels greater confidence, we define with a pairwise logistic-like function:
where , which is the hyper-parameter, controls the discrimination between different hierarchical knowledge levels. As a result, the posterior log probability over D on can be calculated as:
where C is a constant and I(*) is used as an indicator that equals 1 when the condition * is met. Finally, a calibrated Q-matrix , which is estimated by the KHLQC approach, is obtained.
4.2.2. Incorporating Q-Matrix with Relational Attention Knowledge Tracing Model
After obtaining a calibrated Q-matrix: , each row of was used as the raw exercise embedding q, instead of using the word embedding of an exercise. Then, the similarity of different exercises Qsimi was computed based on q and the following formula:
Then, the modified exercise relation matrix RE is defined as follows:
5. Experimental Results and Discussion
In this section, extensive experiments were conducted to evaluate the RAKT model and its extension model: QRAKT. Specifically, two datasets were introduced, and the steps of experiments were set up. The experiments were conducted from three aspects to validate the performance of the RAKT model and the QRAKT model in terms of the research goals given in Section 3. The first part compared the performance of the QRAKT model and the RAKT model with baseline models in terms of the AUC, ACC, and Stability rate. The second part focused on figuring out the impact of various key components based on the ablation experiments to validate the importance of those key components. The last part aimed at indicating the performance of the QRAKT model in terms of tracing the knowledge state of a student. The last part also proved the QRAKT model to be beneficial to improving student performance according to the results of the knowledge state evolution description.
In order to validate the performance of the knowledge tracing model in the big dataset and the small dataset, ASSIST2012 was used to evaluate the performance of the knowledge tracing models on a big dataset. The Eedi dataset was applied to measure the performance of the knowledge tracing models on a small dataset. The datasets details are as follows.:
- Assistment2012(ASSIST2012): This dataset is an open dataset collected by the Assistment Online tutoring system. This dataset is often used by researchers for knowledge tracing or cognitive diagnosis. The problem bodies of ASSIST2012 were used to conduct our experiments.
- Eedi: This dataset is an open dataset, which was released by The NeuralPS 2020 Education Challenge with four tasks. In this paper, the datasets of Task 3 and Task 4 were used for the knowledge tracing task.
Table 3 presents some statistical information on the Assistment2012 dataset and the Eedi dataset.
5.1. Framework Setting
In this section, the network initializations are specified as given in the following Table 4.
To evaluate the performances of the RAKT model and its extension model, QRAKT, previous approaches are compared in the following part. The details of those approaches are as follows:
- DKT [8]: DKT was used as an implementation of LSTM, which incorporates a set of one-hot representations of exercises to predict the performance of students on the next interaction on certain exercises.
- DKT+ [40]: DKT+ is an extension of DKT and addresses two problems in DKT, including the failure of the model to reconstruct the observed input and the lack of consistency in the performance of students across time steps.
- DKVMN [41]: This model is based on a memory-augmented recurrent neural network, which combines the relationship between different KCs presented by the key matrix with the learner mastery matrix presented by the value matrix.
- EKT [10]: This model explores both student’s exercise records and the textual information of corresponding exercises. This model also applies the knowledge state matrix to incorporate knowledge concept information.
- EKPT [5]: This model applies the Q-matrix to associate the exercises with the knowledge concepts. The EKPT model uses two classical educational theories, the learning curve and the forgetting curve, to track the students’ knowledge state.
5.2. Results and Discussion
The prediction of student performance was a binary value. The value of 1 represents the students answering the next question correctly. The value of 0 represents the students who did not choose the appropriate options. The area under the curve (AUC) and the Accuracy (ACC) were used to evaluate all baseline models, the RAKT model, and the QRAKT model. The model was trained during the training phase and the testing phase. Generally, a value 0.5 of the AUC or ACC represents that the result is randomly guessed. The larger the value of the AUC or ACC, the better the knowledge tracing performance is.
The Stability metric is designed based on the AUC metric. Intuitively, if a knowledge tracing model can produce a better AUC in most cases compared with the other baseline models, the performance of the knowledge tracing model K is stable. According to this idea, a Stability rate (Sta(K)) was developed to measure the Stability of the knowledge tracing model. The formulation of the Sta(i) can be shown as follows. means the performance rank parameter of the knowledge tracing model k in batch i. refers to the number of baseline models that perform worse than the knowledge tracing model k in terms of the AUC metric, and n indicates the number of knowledge tracing models. is the number of batches used in the testing phase. For example, if there exist 100 testing batches and three models, the QRAKT model, the DKT model, and the DKT+ model, the QRAKT model performed better than the DKT model and the DKT+ model on 94 testing batches. However, on the remaining six testing batches, the QRAKT model only outperformed the DKT model. Therefore, n was three, and N was 100. n was 2 on 94 testing batches and 1 on 6 testing batches. Under these conditions, Sta(QRAKT) = 98%.
As stated in Section 3, this paper aimed at providing a knowledge tracing model that has a good Accuracy and Stability for the online educational system to recommend personalized exercises. The Accuracy was measured by the AUC metric, and the knowledge tracing model K was better when this model had a higher value of the AUC. The Stability was evaluated by the Stability rate Sta(K). The larger the value of Sta(K), the better the knowledge tracing model performance is.
5.2.1. Students Performance Predictions (RQ1)
Table 5 presents the performance of all baseline models, the RAKT model, and the QRAKT model. According to Table 5, our QRAKT model outperformed all the baseline models with a noticeable gap. DKT+ performed better than DKT due to the fact that the inputs were reconstructed and making the student performance consistent in each timestamp on the two datasets. SAKT further improved the model performance to some extent on ASSIST2012, indicating the significance of the relevance between past interactions and the next exercise. DKVMN had high performance compared with the DKT+ model, the DKT model, and the SRAKT model on the Eedi dataset because this model can learn representations based on nonlinear d high performance compared with the DKT+ model, the DKT model, and the SRAKT model on the Eedi dataset because this model can learn representations based on nonlinear transformations. Compared with SAKT, EKT considers the knowledge concepts’ information and exercise relation and obtained better results in terms of the AUC, ACC, and Stability rate (Sta). However, the EKT model ignored the student behaviors when tracking the knowledge state of students. The EKPT model considered the student behaviors including the learning behavior and the forgetting behavior and applied the traditional Q-matrix to model the relationship between exercises and knowledge concepts to improve the performance on student performance prediction. However, the EKPT model still has some drawbacks. The first is that the Q-matrix does not consider the hierarchical knowledge levels in knowledge concepts. The second is that two situations were ignored: the student may guess an answer to a question or provide the wrong answer for the questions because of his/her carelessness. In order to solve these problems, the RAKT model incorporates the relation modeling of exercises, the forgetting theory, and student behaviors with two types of attention mechanisms to improve the performance in terms of the AUC, ACC, and Stability rate (Sta).
DKVMN had high performance compared with the DKT+ model, the DKT model, and the SRAKT model on the Eedi dataset because this model can learn representations based on nonlinear transformations. Furthermore, the relative position and relation modeling of exercises are used in RAKT to trace the knowledge state of students and obtain a better performance than all baseline models on the two datasets. This demonstrated that the relation modeling of exercises and forgetting theory and student behaviors also need to be considered in knowledge tracing. The extension of RAKT, QRAKT, had the best performance compared to the other models on the two educational datasets. The QRAKT model used the knowledge vector matrix, the Q-matrix, to generate the embedding of the raw exercise and considered different hierarchical levels of knowledge on the knowledge graph to validate the Q-matrix compared to RAKT. Therefore, the results of the QRAKT model were more interpretable and accurate than simply using the word2vector method in the RAKT model.
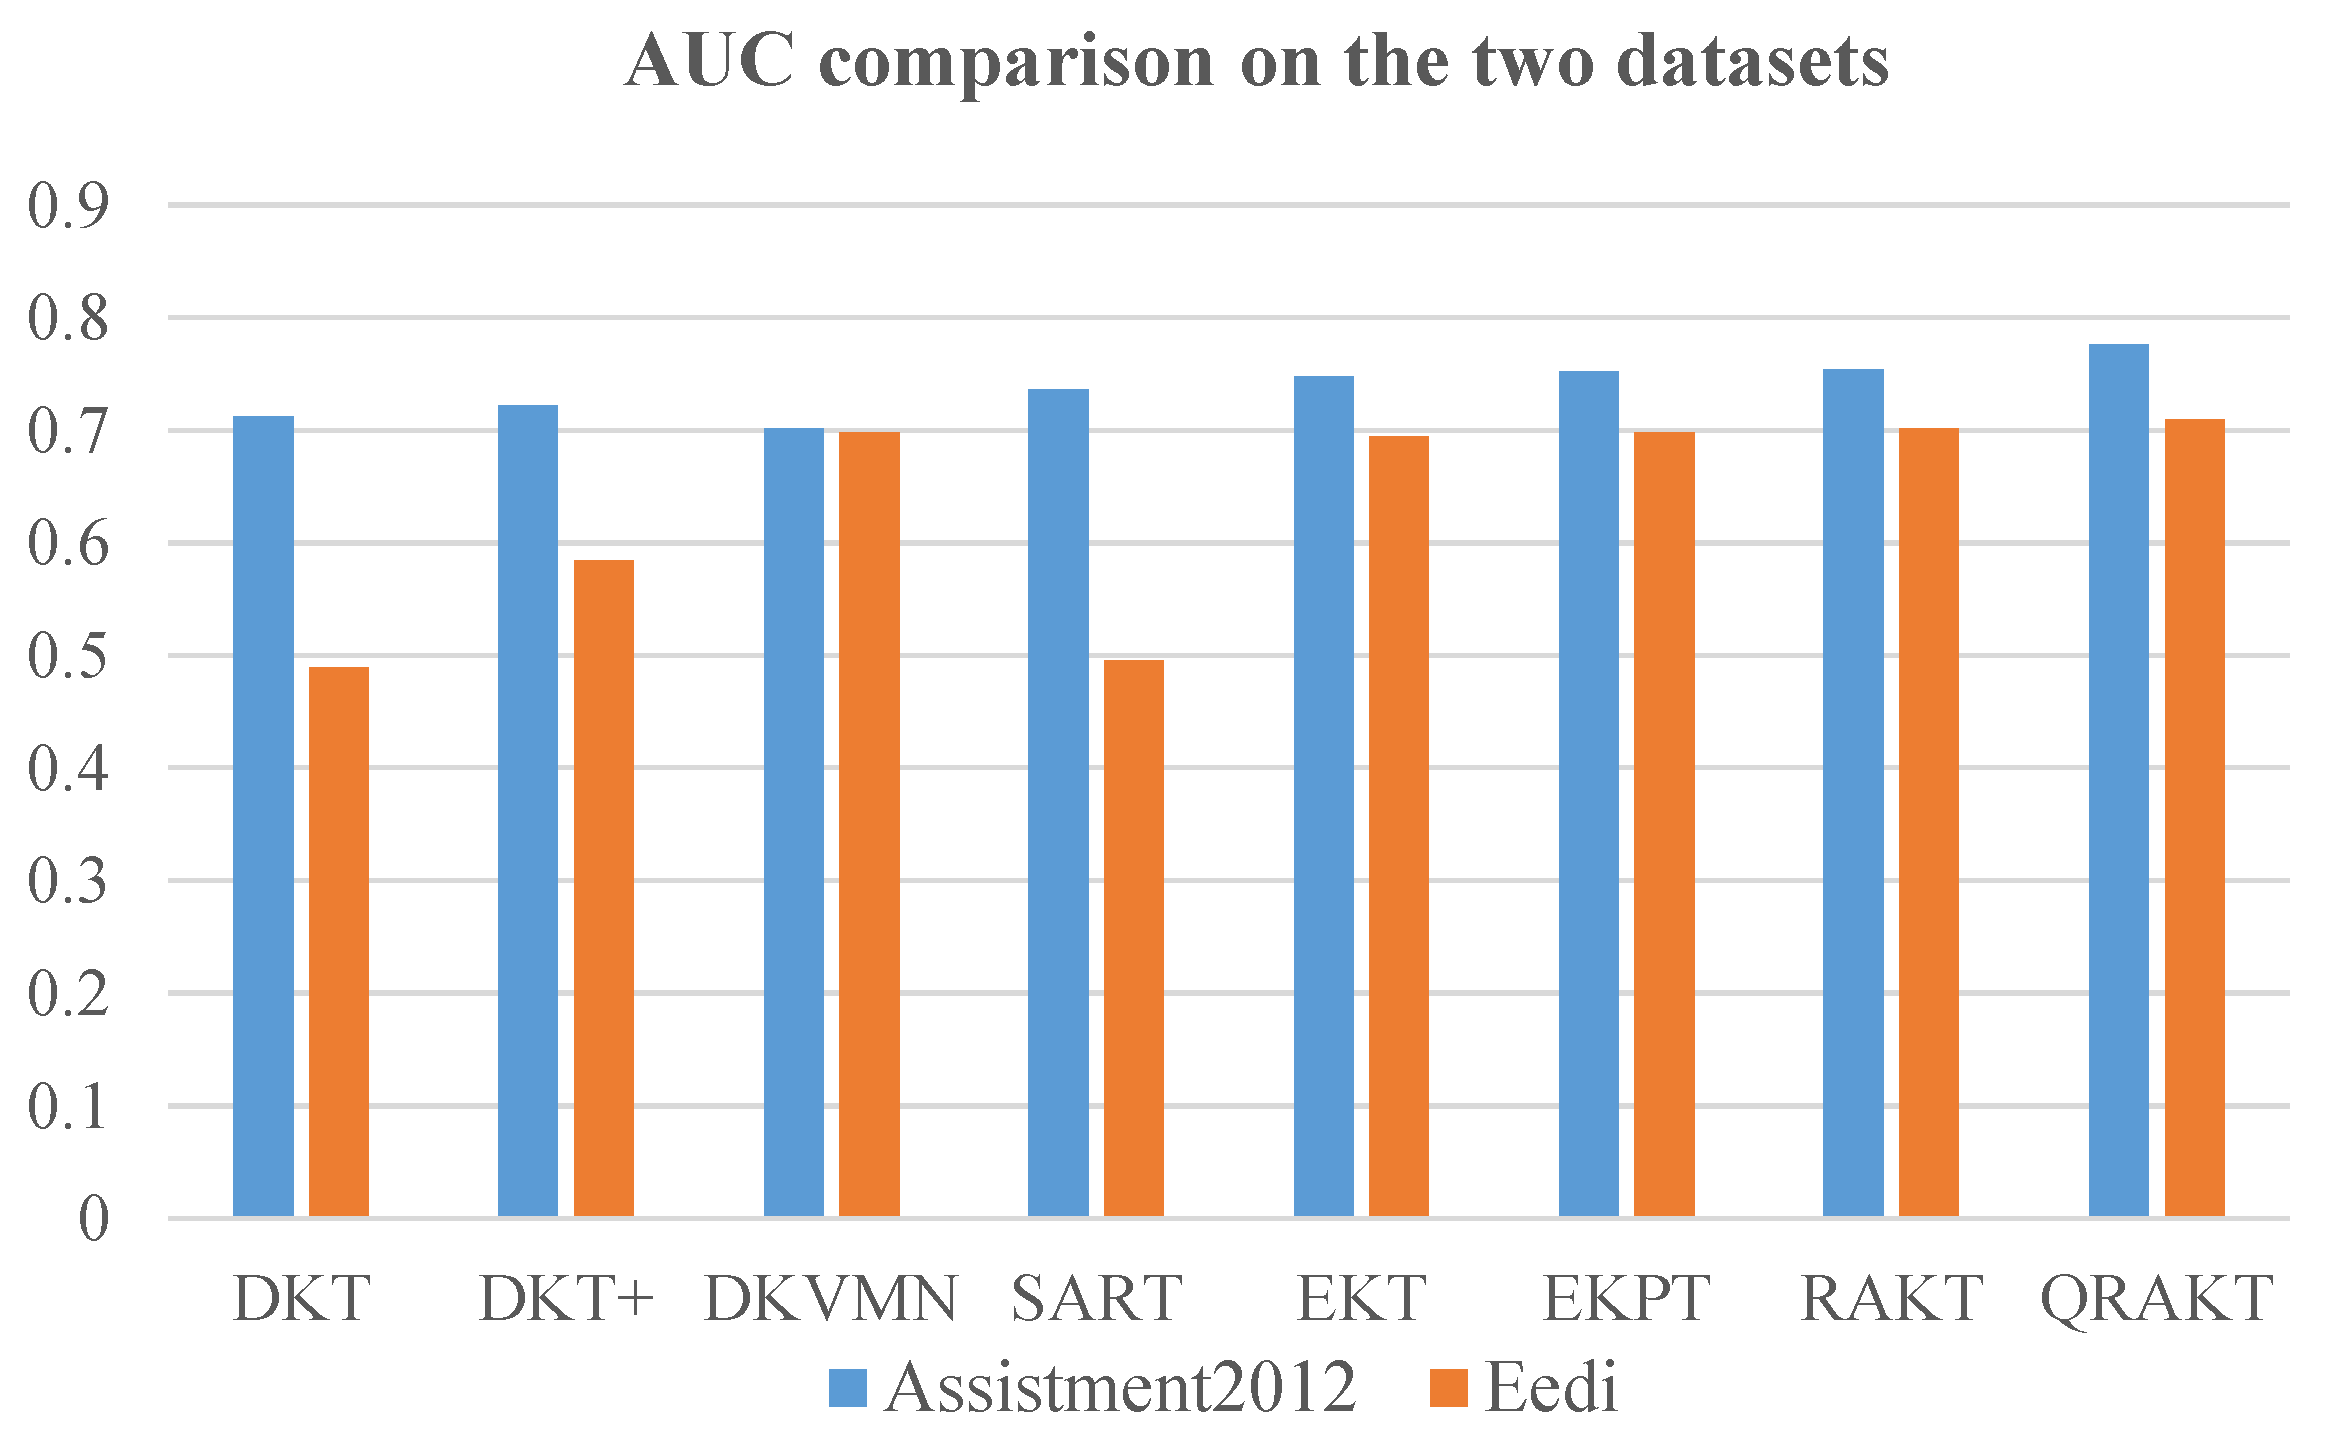
As shown in Figure 4, the different performance of these models on the two datasets was due to the ASSIST2012 dataset having more student response data than the Eedi dataset. Therefore, those models that are suitable for processing an extensive dataset will lead to better performance on the AUC and ACC on the ASSIST2012 dataset, such as the SAKT model. Those models that are appropriate for handling a small dataset will perform better on the Eedi dataset, such as the DKVMN model.
5.2.2. Ablation Experiments (RQ2)
This section aims at detecting the influence of the key components proposed in this section. An ablation experiment was conducted in this section to see how those key components affected the final results of the QRAKT model. There are seven variations of QAKT, each of which takes one or more methods out of the QAKT model. Specifically, PA, CQ, and RM indicate that the positional attention layer, calibrated Q-matrix, and relation modeling are removed from QRAKT, respectively. PA+CQ, PA+RM, and CQ+RM mean that two components are removed concurrently in QRAKT, i.e., the positional attention layer and the calibrated Q-matrix, the positional attention layer and relation modeling, and the calibrated Q-matrix and relation modeling. PA+CQ+RM indicates that the calibrated Q-matrix, positional attention layer, and relation modeling are removed from QRAKT concurrently. Table 6, Table 7 and Table 8 provide some essential conclusions.
Firstly, the performance improved when more components were involved, which met our expectations. Secondly, on the Eedi dataset, when the positional attention layer was removed, the performance of the QRAKT model was significantly worse than when removing the other two factors. The effect of the model dropped by about 19.2%, as seen in Table 6. Therefore, the positional attention layer is a necessary part of the QRAKT model. On the ASSIST2012 datasets, relation modeling deletion leads to the most outstanding performance decline, which drops about 3.1%, as seen in Table 8. According to the results of Table 8, the relation model is an integral part of the QRAKT model. The different removal results of the two datasets are due to the fact that the number of student records on the Eedi dataset is much smaller than on the ASSIST2012 dataset. Therefore, relational modeling had relatively little impact on the results of the Eedi dataset. Lastly, the calibrated Q-matrix significantly improved the performance of the RAKT model, as seen in Table 7, which indicates that the calibrated Q-matrix is also a key component in the QRAKT model.
5.2.3. Knowledge State Evolution Description (RQ3)
This section aimed at validating the performance of the QRAKT model, the DKT model, and the DKT+ model in tracking a student’s knowledge state. The impacts of the QRAKT model on improving student performance are also illustrated in this section. Heat maps were applied to describe the evolution of the student’s knowledge state.
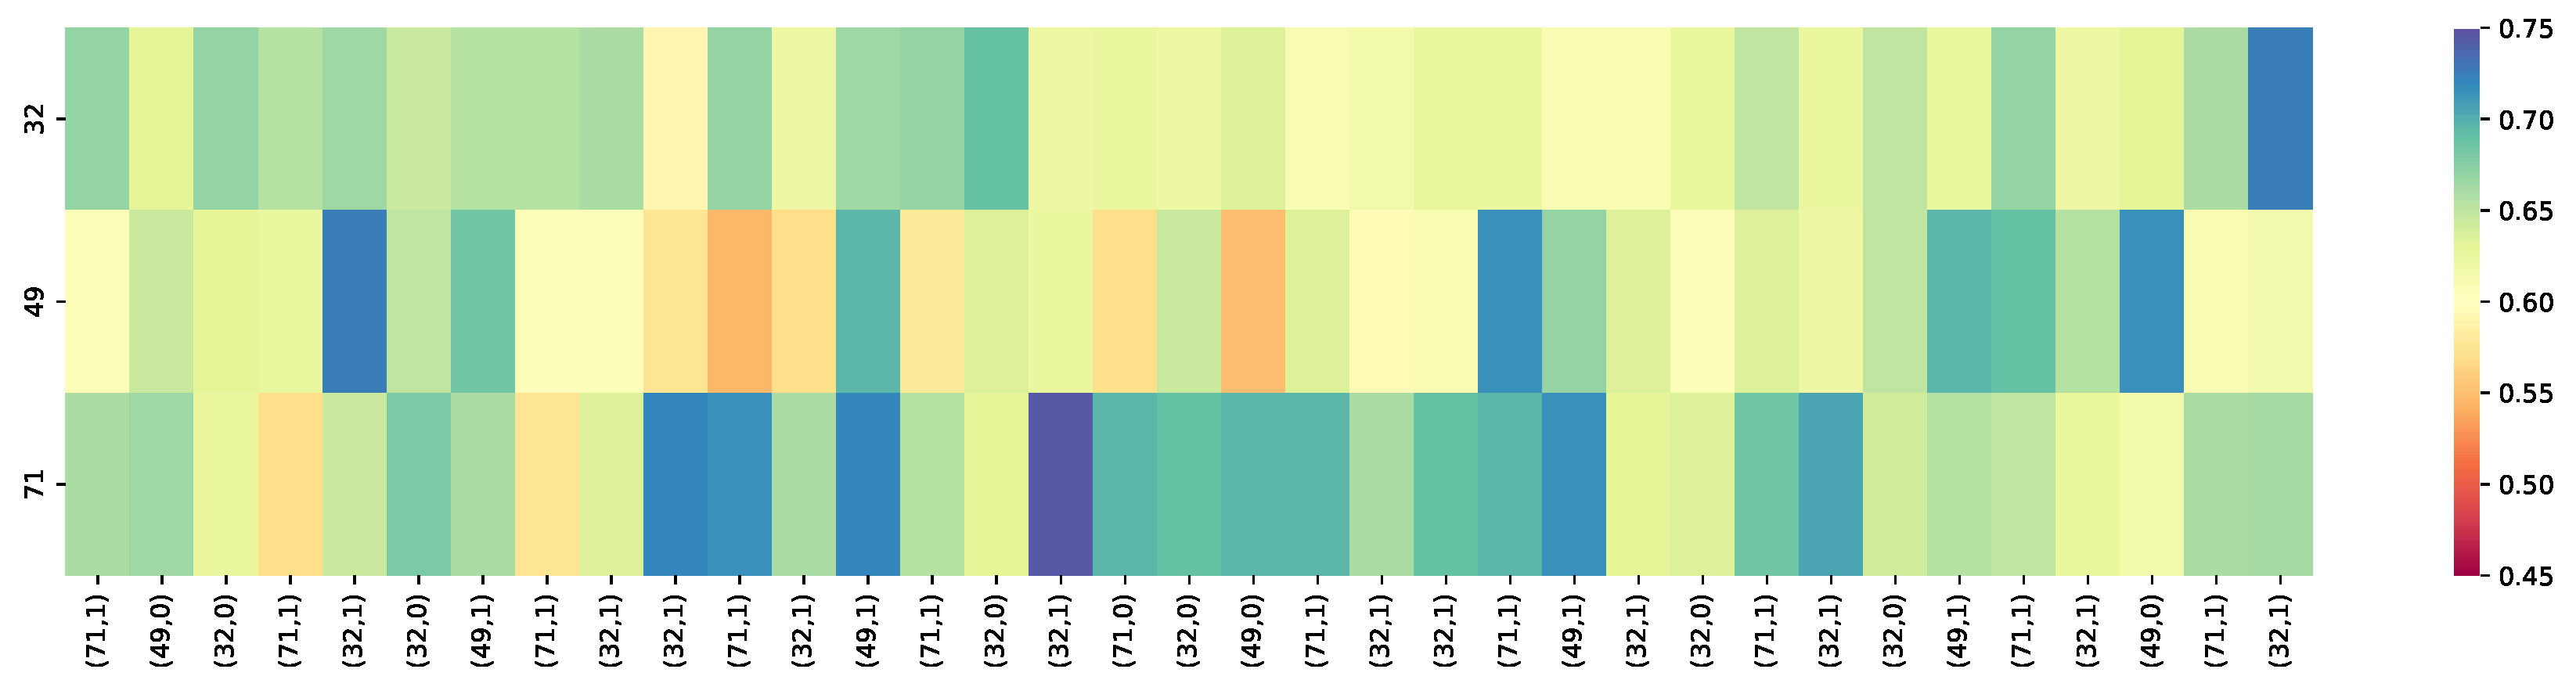
Figure 5, Figure 6 and Figure 7 present the heat maps of a learner whose knowledge state constantly changes on skill sets on the Eedi dataset. These figures present the difference of the heat maps based on different knowledge tracing models, including QRAKT, DKT, and DKT+, to predict student performance on three skills, 32, 49, and 71. Figure 8 shows the evolution of student’s learning process on these three knowledge points.
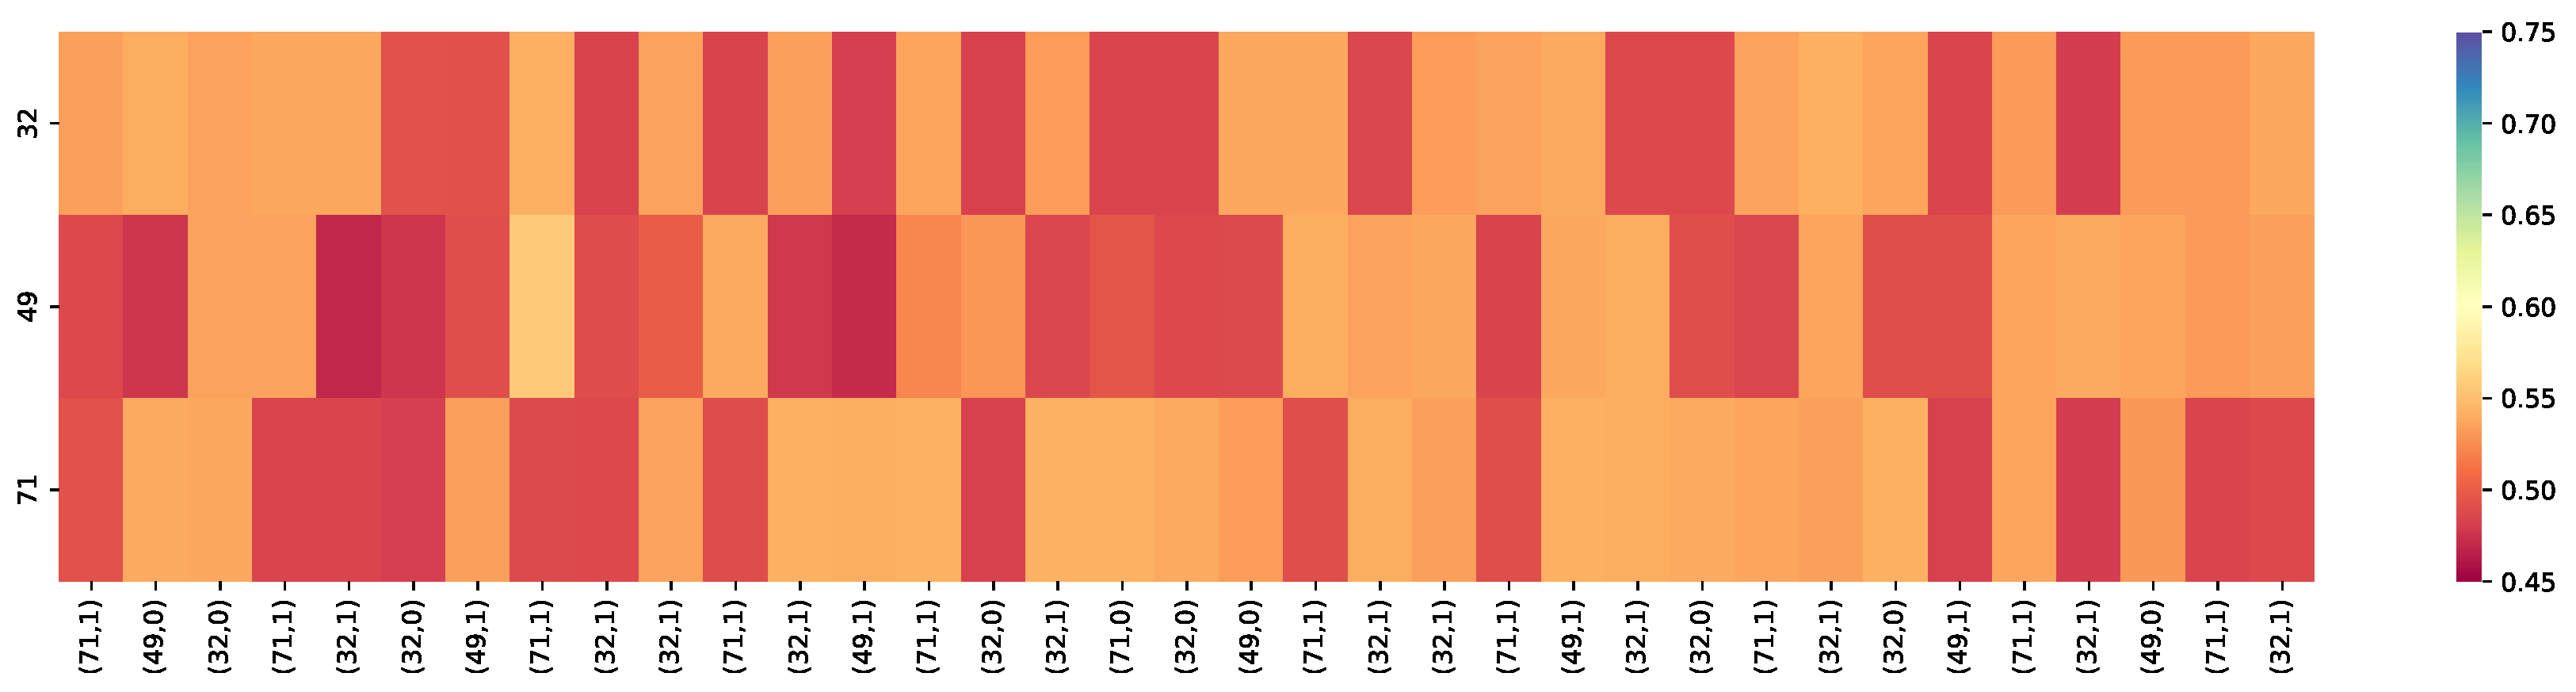
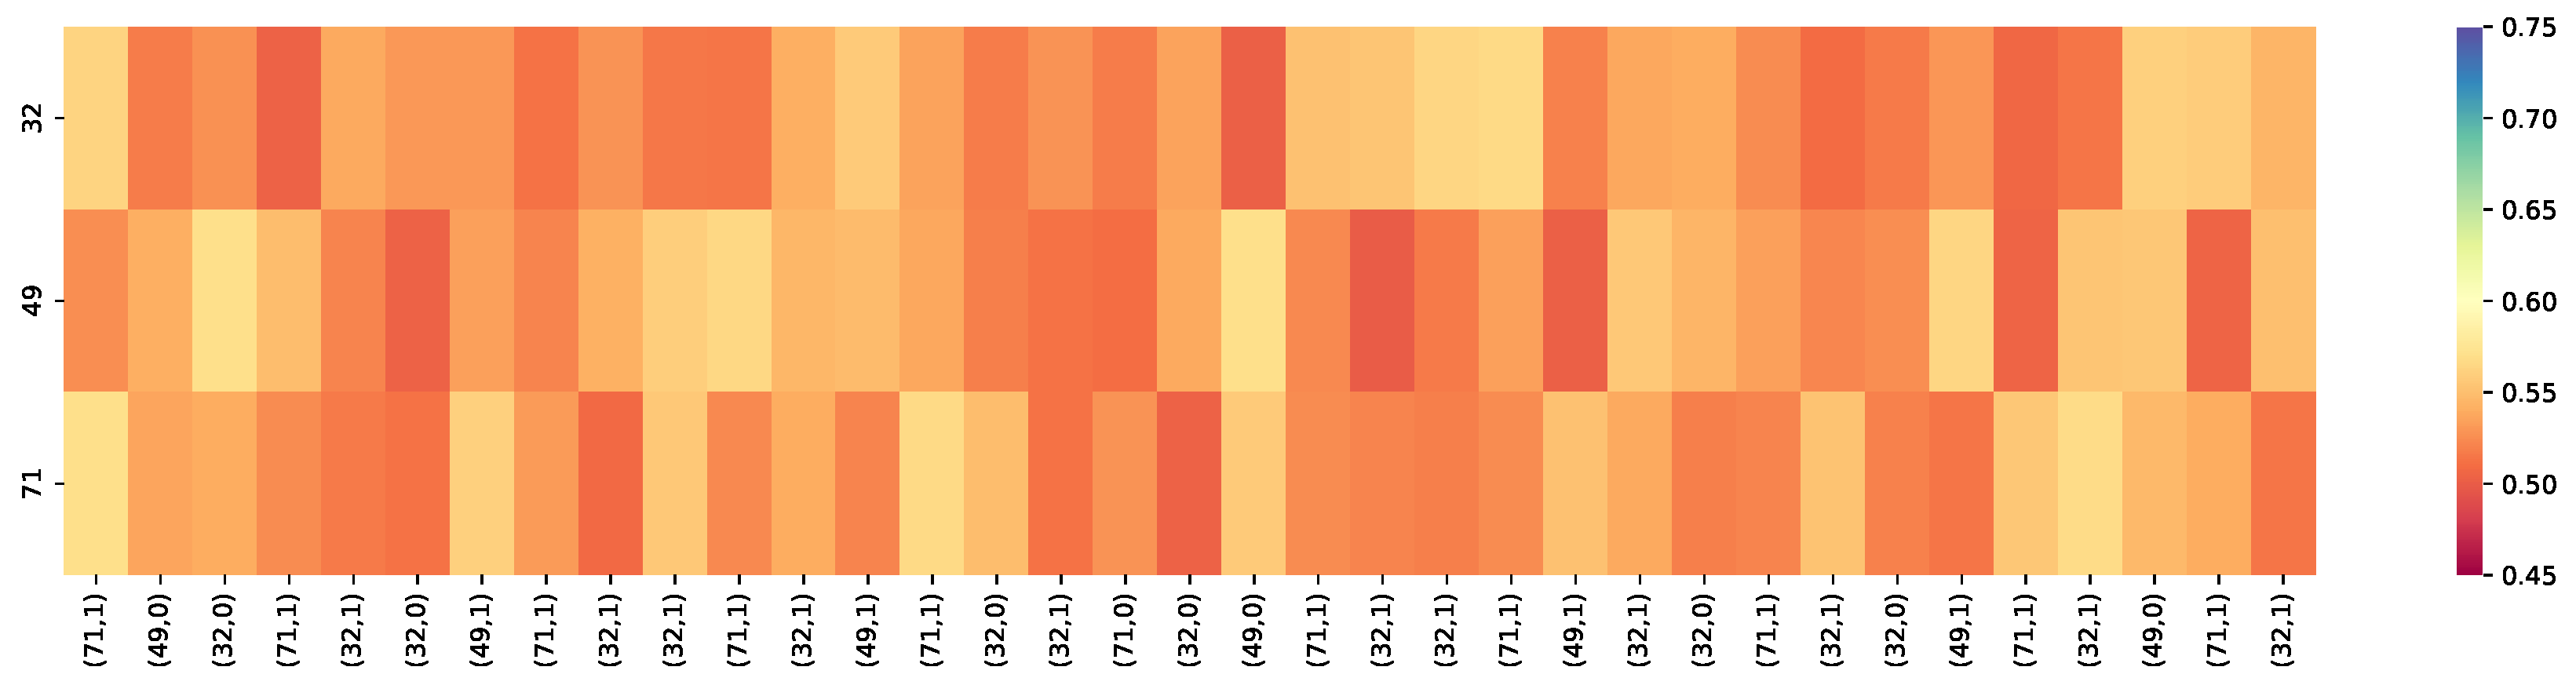
In Figure 5, Figure 6 and Figure 7, the vertical dimension label corresponds to three skill IDs (32, 49, and 71). The horizontal dimension shows a sequence of KCs labeled and related student responses (“1” indicates that the student answered the questions with appropriate knowledge concepts; otherwise, it is “0“). Those labels of the KCs, such as (71, 1) refer to the knowledge concept input into the model at each time step from the testing set. The color of the heat map indicates the probability that the student mastered this skill correctly. The brighter the color of the heat map, the better the effect of knowledge tracing was. As Figure 6 illustrates, the DKT model performed worse than the other models in tracing the student knowledge state. The student failed to master Skills 32, 49, and 71 because of the low-level mastery level of the skills. Compared with the DKT model, the DKT+ model as the extension of the DKT model solved the reconstruction problem and the wavy transition problem in the DKT model to track the student’s mastery level. The performance of DKT+ in tracking the student knowledge state was better than the DKT model and improved the student knowledge state performance, as seen in Figure 7. Compared with the non-hybrid methods, the DKT model and the DKT+ model, the hybrid model, QRAKT, further improved the knowledge state performance by incorporating the student behaviors and the attention mechanism to obtain more accurate results of the knowledge state prediction, as seen in Figure 7.
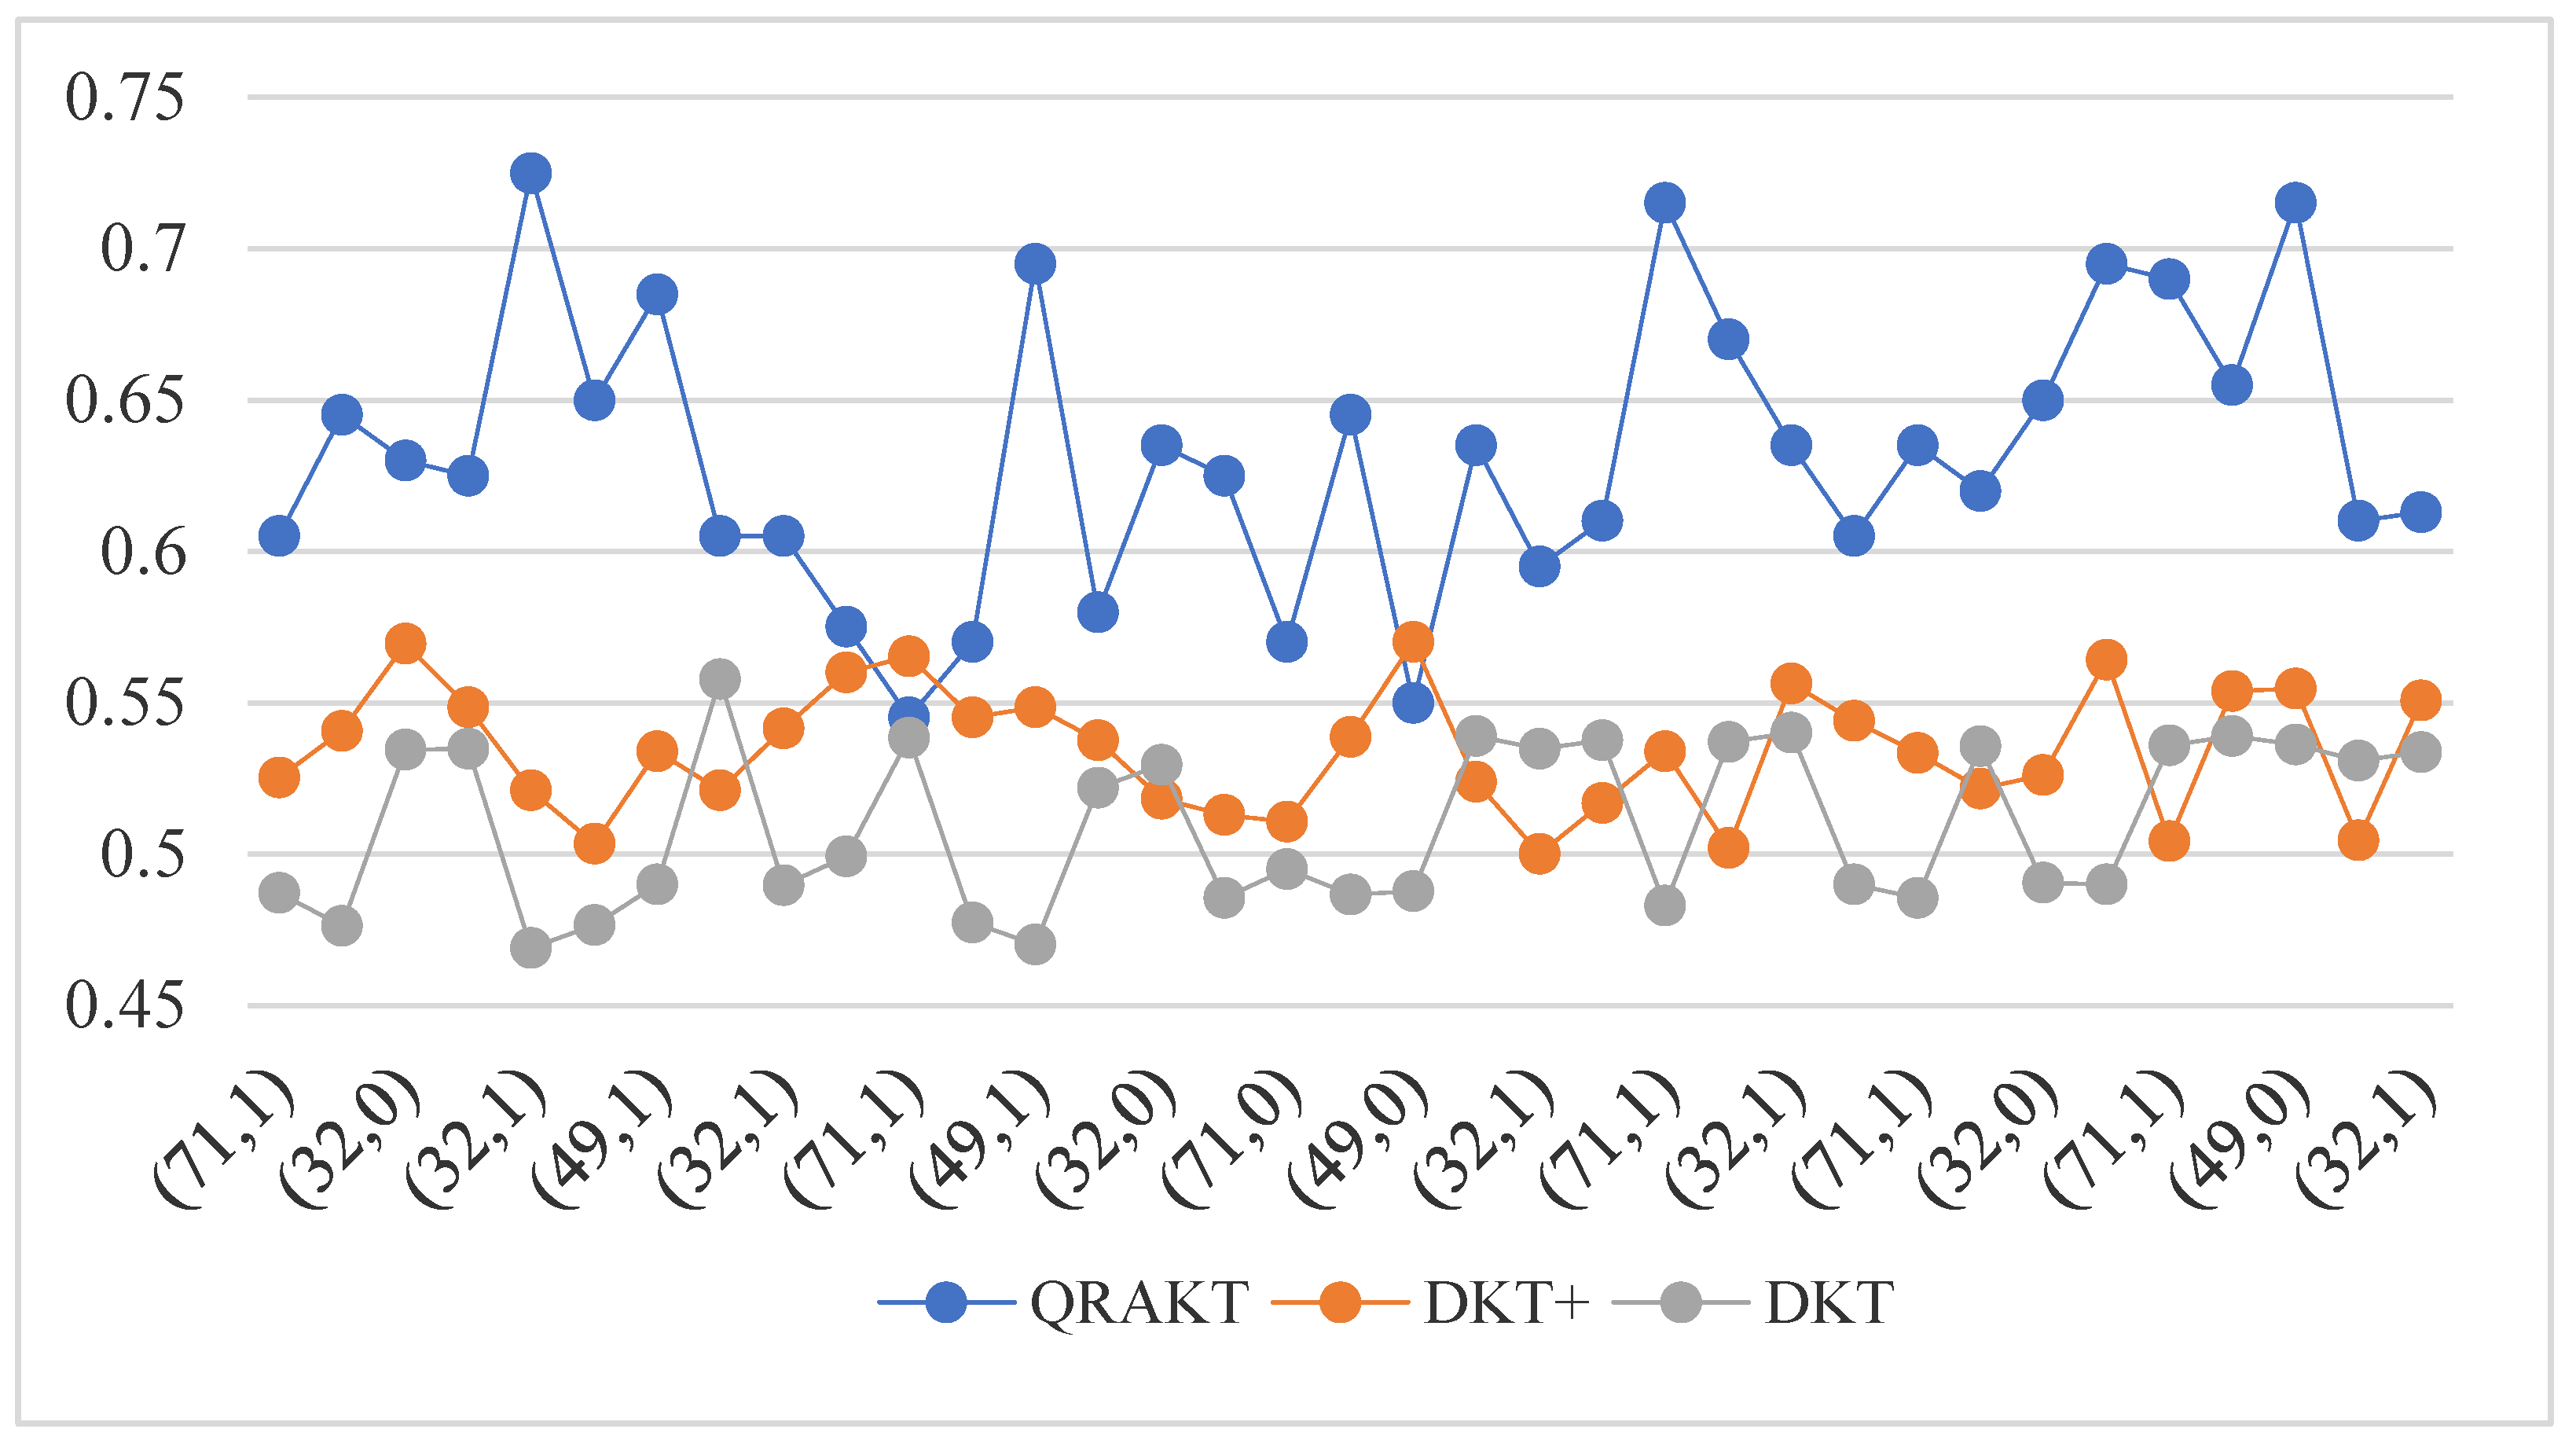
Figure 5, Figure 6 and Figure 7 only illustrate the difference in the knowledge state prediction Stability of QRAKT, DKT, and DKT+. In order to more specifically present the model performance differences in tracking the student knowledge state, the overall performance was further compared at each time step through the line chart given in Figure 9. Figure 9 shows that the QRAKT model outperformed the DKT model and the DKT+ model in the performance in tracking student knowledge state. After applying the QRAKT model to the online educational system, the student mastery level for Skills 32, 49, and 71 was stable and higher than the DKT model and the DKT+ model. The Stability rate of the QRAKT model, the DKT+ model, and the DKT model could be obtained: Sta(QRAKT) = 0.961%, Sta(DKT+) = 0.727%, and Sta(DKT) = 0.125%, respectively. The results of the Stability rate indicated that the QRAKT model had much higher Stability than the DKT+ and the DKT models.
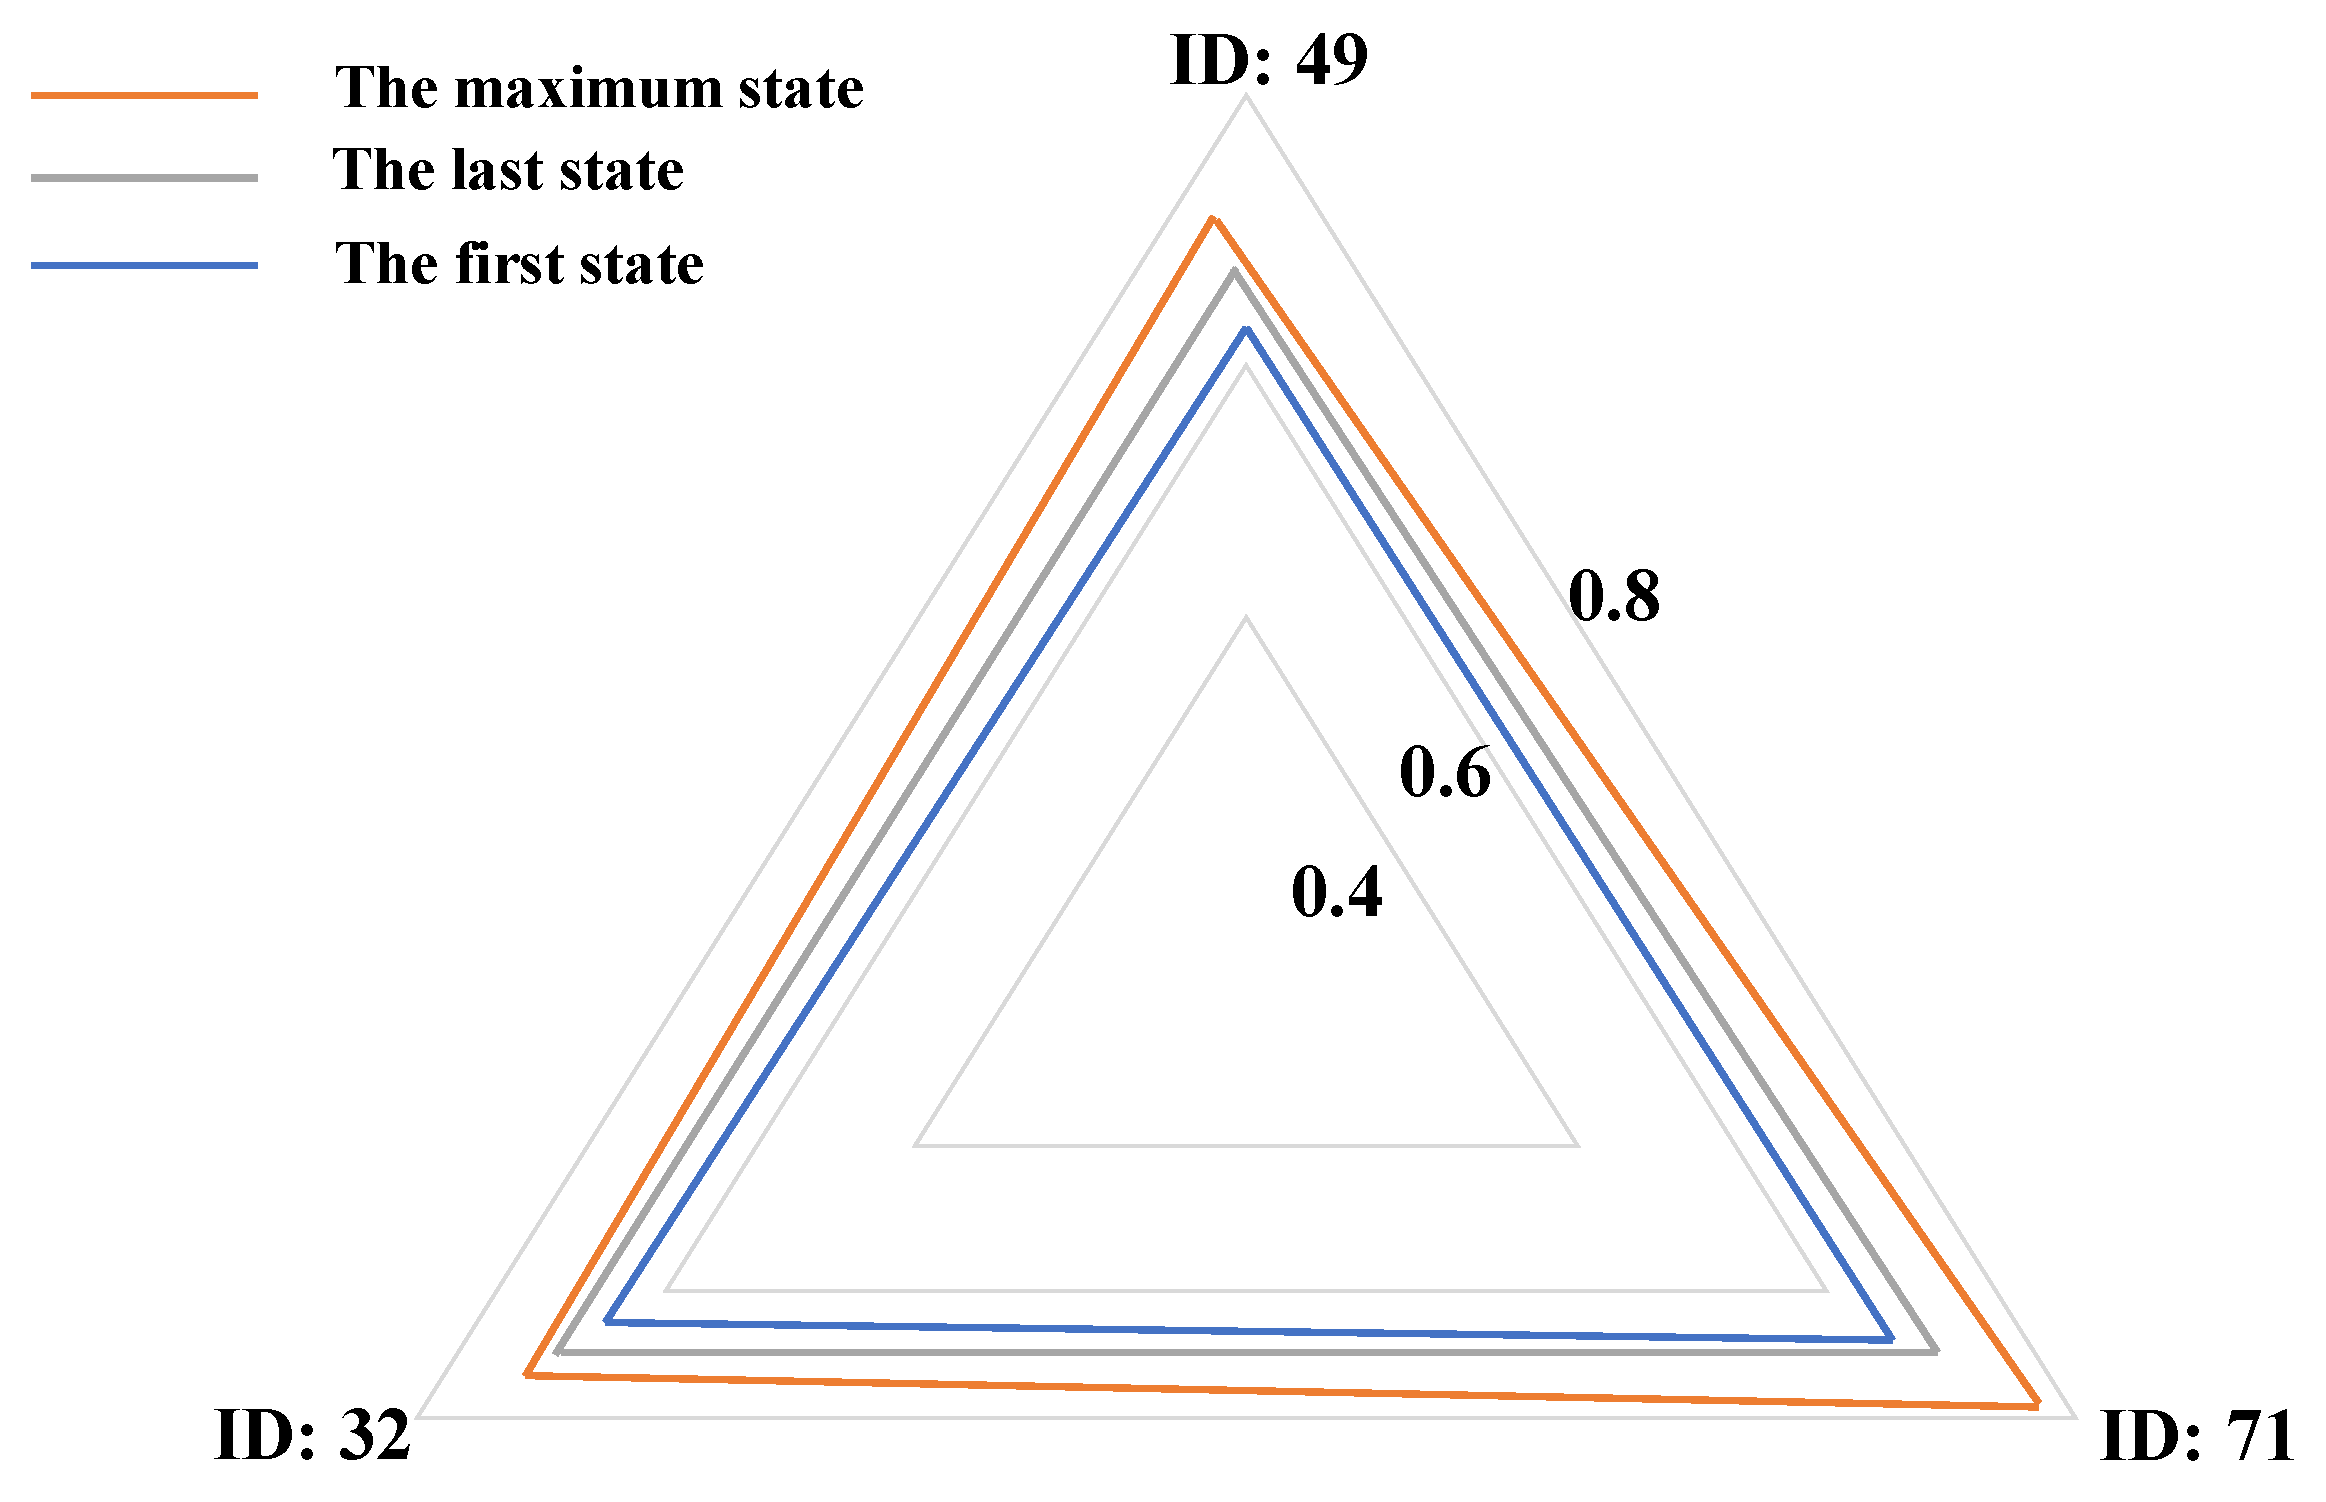
The impact of the knowledge tracing model, QRAKT, can be discussed from three aspects, including the student-related aspects, the teacher-related aspects, and the online-educational-system-related aspects. For the student-related aspects, after tracking the knowledge state of a student with the form of a heat map and a radar diagram, as given in Figure 5 and Figure 8 respectively, the student’s strengths and weaknesses for each skill were intuitively observed. Therefore, the student was more motivated to address these shortcomings efficiently. For the online-educational-system-related aspects, the smart educational system, which applied the QRAKT model, could accurately track the knowledge state of students and recommend exercises related to the students’ weak knowledge to improve the students’ overall cognitive level. Additionally, from the perspective of the educators, teachers can use the recommendation system to prepare practice questions and make corresponding adjustments based on his/her own teaching experience to improve the students’ mastery of the knowledge points.
6. Conclusions and Future Work
This paper proposed the novel frameworks, the RAKT model and the QRAKT model. First, relation modeling, including exercise relation modeling, time-order forgetting behavior modeling, and student behavior modeling, was designed to incorporate the relationship of exercises, temporal features, and student behaviors. Second, the positional attention layer and the relational attention layer included relation modeling and exercise content for the KT task. Thirdly, the extension of RAKT, QRAKT, was based on a calibrated Q-matrix generated by a novel hierarchical knowledge-level-based Q-matrix calibration method. Lastly, the effect of the QRAKT model was validated on two public educational datasets, ASSIST2012 and Eedi, in terms of the ACC and AUC. The knowledge state evolution description of a student was conducted to track the student’s knowledge state, and an ablation experiment was designed to find the influence of crucial components.
A significant issue in research in the field of data mining for education is knowledge tracing. Traditional knowledge tracing methods do not take the relation modeling and hierarchical knowledge levels of KCs into consideration. This work improved the performance of the traditional knowledge tracing model in terms of the Accuracy and Stability. The online educational system, which applies the QRAKT model, can more accurately track the students’ knowledge state and recommend a more personalized and targeted practice. However, the QRAKT model and the RAKT model still have some limitations. The first limitation is that the QRAKT model and the RAKT model only consider the relationship between exercises and knowledge concepts. However, the relationship between students, exercise, and skills is ignored. The second limitation is that this work only considered the hierarchical levels of knowledge concepts. The deeper relationship of knowledge concepts such as relevance or belonging was not considered. Therefore, more work on those problems needs to be performed in the future.
Author Contributions
Methodology research, L.L. and Z.W.; model realization, L.L.; supervision Z.W.; writing and editing, L.L. and Z.W.; data collection, L.L. and Z.W.; model evaluation, L.L. and Z.W.; funding acquisition, Z.W. All authors have read and agreed to the published version of the manuscript.
Funding
The research work of this paper was supported by the National Natural Science Foundation of China (Nos. 62177022 and 61901165), AI and Faculty Empowerment Pilot Project (No. CCNUAI&FE2022-03-01), the Collaborative Innovation Center for Informatization and Balanced Development of K-12 Education by MOE and Hubei Province (No. xtzd2021-005), and the National Natural Science Foundation of China (No. 61501199).
Institutional Review Board Statement
Not applicable.
Informed Consent Statement
Not applicable.
Data Availability Statement
Data will be made available upon reasonable request.
Conflicts of Interest
The authors declare no conflict of interest.
References
- Hamid, S.N.M.; Lee, T.T.; Taha, H.; Rahim, N.A.; Sharif, A.M. E-content module for Chemistry Massive Open Online Course (MOOC): Development and students’ perceptions. J. Technol. Sci. Educ. 2021, 11, 67–92. [Google Scholar] [CrossRef]
- Bezus, S.N.; Abduzhalilov, K.A.; Raitskaya, L.K. Distance Learning Nowadays: The Usage of Didactic Potential of MOOCs (on platforms Coursera, edX, Universarium) in Higher Education. In Proceedings of the 4th International Conference on Education and Multimedia Technology, Kyoto Japan, 19–22 July 2020; pp. 14–19. [Google Scholar]
- Marlina, W.A.; Rahmi, D.Y.; Antoni, R. Enhancing Student’s Understanding in Feasible Study Subject by Using Blended Learning Methods (Mind Mapping, Project Based Learning and Coursera). In Proceedings of the 3rd International Conference on Educational Development and Quality Assurance (ICED-QA 2020), Online, 27–28 October 2020; Atlantis Press: Paris, France, 2021; pp. 24–31. [Google Scholar]
- Taranto, E.; Arzarello, F. Math MOOC UniTo: An Italian project on MOOCs for mathematics teacher education, and the development of a new theoretical framework. ZDM 2020, 52, 843–858. [Google Scholar] [CrossRef]
- Huang, Z.; Liu, Q.; Chen, Y.; Wu, L.; Xiao, K.; Chen, E.; Ma, H.; Hu, G. Learning or forgetting? a dynamic approach for tracking the knowledge proficiency of students. ACM Trans. Inf. Syst. 2020, 38, 1–33. [Google Scholar] [CrossRef] [Green Version]
- Alamri, H.; Lowell, V.; Watson, W.; Watson, S.L. Using personalized learning as an instructional approach to motivate learners in online higher education: Learner self-determination and intrinsic motivation. J. Res. Technol. Educ. 2020, 52, 322–352. [Google Scholar] [CrossRef]
- Corbett, A.T.; Anderson, J.R. Knowledge tracing: Modeling the acquisition of procedural knowledge. User Model. User Adapt. Interact. 1994, 4, 253–278. [Google Scholar] [CrossRef]
- Piech, C.; Bassen, J.; Huang, J.; Ganguli, S.; Sahami, M.; Guibas, L.J.; Sohl-Dickstein, J. Deep knowledge tracing. Adv. Neural Inf. Process. Syst. 2015, 28, 1–9. [Google Scholar]
- Käser, T.; Klingler, S.; Schwing, A.G.; Gross, M. Beyond knowledge tracing: Modeling skill topologies with bayesian networks. In Proceedings of the International Conference on Intelligent Tutoring Systems, Bucharest, Romania, 7–11 June 2020; Springer: Berlin/Heidelberg, Germany, 2014; pp. 188–198. [Google Scholar]
- Liu, Q.; Huang, Z.; Yin, Y.; Chen, E.; Xiong, H.; Su, Y.; Hu, G. Ekt: Exercise-aware knowledge tracing for student performance prediction. IEEE Trans. Knowl. Data Eng. 2019, 33, 100–115. [Google Scholar] [CrossRef] [Green Version]
- Nagatani, K.; Zhang, Q.; Sato, M.; Chen, Y.Y.; Chen, F.; Ohkuma, T. Augmenting knowledge tracing by considering forgetting behavior. In Proceedings of the World Wide Web Conference, San Francisco, CA, USA, 13–17 May 2019; pp. 3101–3107. [Google Scholar]
- Pelánek, R. Modeling Students’ Memory for Application in Adaptive Educational Systems. International Educational Data Mining Society. 2015. Available online: https://files.eric.ed.gov/fulltext/ED560907.pdf (accessed on 20 December 2022).
- Wang, D.; Cai, Y.; Tu, D. Q-matrix estimation methods for cognitive diagnosis models: Based on partial known Q-matrix. In Multivariate Behavioral Research; Taylor and Francis: London, UK, 2020; pp. 1–13. [Google Scholar]
- Pandey, S.; Srivastava, J. RKT: Relation-aware self-attention for knowledge tracing. In Proceedings of the 29th ACM International Conference on Information & Knowledge Management, Online, 19–23 October 2020; pp. 1205–1214. [Google Scholar]
- Wang, Z.; Yang, Y.; Zeng, C.; Kong, S.; Feng, S.; Zhao, N. Shallow and Deep Feature Fusion for Digital Audio Tampering Detection. EURASIP J. Adv. Signal Process. 2022, 2022, 1–20. [Google Scholar] [CrossRef]
- Zeng, C.; Zhu, D.; Wang, Z.; Wu, M.; Xiong, W.; Zhao, N. Spatial and Temporal Learning Representation for End-to-End Recording Device Identification. EURASIP J. Adv. Signal Process. 2021, 2021, 41. [Google Scholar] [CrossRef]
- Wang, Z.; Wang, Z.; Zeng, C.; Yu, Y.; Wan, X. High-Quality Image Compressed Sensing and Reconstruction with Multi-Scale Dilated Convolutional Neural Network. In Circuits, Systems, and Signal Processing; Springer: Berlin/Heidelberg, Germany, 2022; pp. 1–24. [Google Scholar] [CrossRef]
- Zeng, C.; Yan, K.; Wang, Z.; Yu, Y.; Xia, S.; Zhao, N. Abs-CAM: A Gradient Optimization Interpretable Approach for Explanation of Convolutional Neural Networks. In Signal, Image and Video Processing; Springer: Berlin/Heidelberg, Germany, 2022; pp. 1–8. [Google Scholar] [CrossRef]
- Li, L.; Wang, Z.; Zhang, T. GBH-YOLOv5: Ghost Convolution with BottleneckCSP and Tiny Target Prediction Head Incorporating YOLOv5 for PV Panel Defect Detection. Electronics 2023, 12, 561. [Google Scholar] [CrossRef]
- Zeng, C.; Ye, J.; Wang, Z.; Zhao, N.; Wu, M. Cascade Neural Network-Based Joint Sampling and Reconstruction for Image Compressed Sensing. Signal Image Video Process. 2022, 16, 47–54. [Google Scholar] [CrossRef]
- Xiong, X.; Zhao, S.; Van Inwegen, E.G.; Beck, J.E. Going deeper with deep knowledge tracing. International Educational Data Mining Society. 2016. Available online: https://files.eric.ed.gov/fulltext/ED592679.pdf (accessed on 10 December 2022).
- Santoro, A.; Bartunov, S.; Botvinick, M.; Wierstra, D.; Lillicrap, T. Meta-learning with memory-augmented neural networks. In Proceedings of the International Conference on Machine Learning, PMLR, New York, NY, USA, 20–22 June 2016; pp. 1842–1850. [Google Scholar]
- Pandey, S.; Karypis, G. A self-attentive model for knowledge tracing. arXiv 2019, arXiv:1907.06837. [Google Scholar]
- Ghosh, A.; Heffernan, N.; Lan, A.S. Context-aware attentive knowledge tracing. In Proceedings of the 26th ACM SIGKDD International Conference on Knowledge Discovery & Data Mining, Online, 6–10 July 2020; pp. 2330–2339. [Google Scholar]
- Wang, W.; Ma, H.; Zhao, Y.; Yang, F.; Chang, L. SEEP: Semantic-enhanced question embeddings pre-training for improving knowledge tracing. Inf. Sci. 2022, 614, 153–169. [Google Scholar] [CrossRef]
- Wang, W.; Ma, H.; Zhao, Y.; Yang, F.; Chang, L. Perm: Pre-training question embeddings via relation map for improving knowledge tracing. In Proceedings of the Database Systems for Advanced Applications: 27th International Conference, DASFAA 2022, Virtual Event, 11–14 April 2022; Part III. Springer: Berlin/Heidelberg, Germany, 2022; pp. 281–288. [Google Scholar]
- Wu, Z.; Huang, L.; Huang, Q.; Huang, C.; Tang, Y. SGKT: Session graph-based knowledge tracing for student performance prediction. Expert Syst. Appl. 2022, 206, 117681. [Google Scholar] [CrossRef]
- Song, X.; Li, J.; Sun, S.; Yin, H.; Dawson, P.; Doss, R.R.M. SEPN: A sequential engagement based academic performance prediction model. IEEE Intell. Syst. 2020, 36, 46–53. [Google Scholar] [CrossRef]
- Yang, Y.; Shen, J.; Qu, Y.; Liu, Y.; Wang, K.; Zhu, Y.; Zhang, W.; Yu, Y. GIKT: A graph-based interaction model for knowledge tracing. In Proceedings of the Machine Learning and Knowledge Discovery in Databases: European Conference, ECML PKDD 2020, Ghent, Belgium, 14–18 September 2020; Part I. Springer: Berlin/Heidelberg, Germany, 2021; pp. 299–315. [Google Scholar]
- Song, X.; Li, J.; Lei, Q.; Zhao, W.; Chen, Y.; Mian, A. Bi-CLKT: Bi-graph contrastive learning based knowledge tracing. Knowl. Based Syst. 2022, 241, 108274. [Google Scholar] [CrossRef]
- Huo, Y.; Wong, D.F.; Ni, L.M.; Chao, L.S.; Zhang, J. Knowledge modeling via contextualized representations for LSTM-based personalized exercise recommendation. Inf. Sci. 2020, 523, 266–278. [Google Scholar] [CrossRef]
- Ji, M.; Joo, W.; Song, K.; Kim, Y.Y.; Moon, I.C. Sequential recommendation with relation-aware kernelized self-attention. In Proceedings of the AAAI Conference on Artificial Intelligence, New York, NY, USA, 7–12 February 2020; Volume 34, pp. 4304–4311. [Google Scholar]
- Wang, W.; Ma, H.; Zhao, Y.; Li, Z.; He, X. Tracking knowledge proficiency of students with calibrated Q-matrix. Expert Syst. Appl. 2022, 192, 116454. [Google Scholar] [CrossRef]
- Lyu, L.; Wang, Z.; Yun, H.; Yang, Z.; Li, Y. Deep Knowledge Tracing Based on Spatial and Temporal Representation Learning for Learning Performance Prediction. Appl. Sci. 2022, 12, 7188. [Google Scholar] [CrossRef]
- Embretson, S.E.; Reise, S.P. Item Response Theory; Psychology Press: London, UK, 2013. [Google Scholar]
- Rasch, G. Probabilistic Models for Some Intelligence and Attainment Tests; ERIC: New York, NY, USA, 1993. [Google Scholar]
- Barton, M.A.; Lord, F.M. An upper asymptote for the three-parameter logistic item-response model. ETS Res. Rep. Ser. 1981, 1981, 1–8. [Google Scholar] [CrossRef]
- Vaswani, A.; Shazeer, N.; Parmar, N.; Uszkoreit, J.; Jones, L.; Gomez, A.N.; Kaiser, Ł.; Polosukhin, I. Attention is all you need. In Proceedings of the Advances in Neural Information Processing Systems, Long Beach, CA, USA, 4–9 December 2017. [Google Scholar]
- Huo, Y.; Wong, D.F.; Ni, L.M.; Chao, L.S.; Zhang, J. HeTROPY: Explainable learning diagnostics via heterogeneous maximum-entropy and multi-spatial knowledge representation. Knowl. Based Syst. 2020, 207, 106389. [Google Scholar] [CrossRef]
- Yeung, C.K.; Yeung, D.Y. Addressing two problems in deep knowledge tracing via prediction-consistent regularization. In Proceedings of the Fifth Annual ACM Conference on Learning at Scale, London, UK, 26–28 June 2018; pp. 1–10. [Google Scholar]
- Zhang, J.; Shi, X.; King, I.; Yeung, D.Y. Dynamic key-value memory networks for knowledge tracing. In Proceedings of the 26th International Conference on World Wide Web, Perth, Australia, 3–7 April 2017; pp. 765–774. [Google Scholar]
Figure 1.
A depiction of the KT task for a student on mathematical exercises. The knowledge tracing process estimates the number of skills students mastered. A student can choose some exercises (e.g., e, e, e, e) containing different knowledge points from problem sets for practicing and leave his/her response logs. Now, the student wants to answer the exercise e.

Figure 2.
The general solutions of the calibrated Q-matrix relational attention knowledge tracing model (QRAKT). There exist four parts, the input part, the relation modeling part, the attention mechanism part, and the output part. In the input part, student response data, calibrated Q-matrix, and the knowledge graph are the inputs of the QRAKT model. In the relation modeling part, three types of relation modeling are introduced, exercise relation modeling, time-order forgetting behavior modeling, and student behavior modeling, to obtain the relational coefficient, R. In the attention mechanisms, positional attention and relational attention are applied to incorporate the relational attention coefficient, R, with traditional attention weights and generate the final attention weights. The last part is the output part. The output of the QRAKT model is specified as three aspects: the next interaction result prediction, the description of knowledge state evolution, and the student mastery level.

Figure 3.
The overall architecture of the calibrated Q-matrix relational attention knowledge tracing model. There exist three steps. The first step is to obtain the exercise relation matrix by incorporating the Phi coefficients and the knowledge vectors to generate the exercise relation matrix, RE. The second step is aimed at modeling the forgetting behavior and student behaviors and combining these two types of modeling with the RE to obtain the relational coefficient, R. The last step focuses on the data processing involving the positional attention mechanism and the relational attention mechanism to generate the final attention weights after combining the relational coefficient, R.

Figure 4.
The comparison of the AUC on the ASSIST2012 dataset and the Eedi dataset. The calibrated Q-matrix relational attention model presented the best results of the AUC compared to the other seven models on the two datasets of 0.771% and 0.707%, respectively.
Figure 4.
The comparison of the AUC on the ASSIST2012 dataset and the Eedi dataset. The calibrated Q-matrix relational attention model presented the best results of the AUC compared to the other seven models on the two datasets of 0.771% and 0.707%, respectively.

Figure 5.
The knowledge tracing results were based on the calibrated Q-matrix relational attention knowledge tracing model (QRAKT). (71, 1) is a input tuple, and 71 is the skill ID and 1 indicates the student answered the question correctly. The overall prediction results of the skill sets in the QRAKT model fluctuated around 65% for the Accuracy. After the 30th exercise, the student almost mastered those three skills: 32, 49, and 71, with a 68% Accuracy in answering the next exercise correctly.

Figure 6.
The knowledge tracing results were based on the DKT model. (71, 1) is a input tuple, and 71 is the skill ID and 1 indicates the student answered the question correctly. The overall prediction results of the skill sets in the DKT model fluctuated around 51% for the Accuracy, where the effect was the same as randomly guessing an answer. The student failed to master these three skills: 32, 49, and 71.

Figure 7.
The knowledge tracing results were based on DKT+. (71, 1) is a input tuple, and 71 is the skill ID and 1 indicates the student answered the question correctly. The overall prediction results of the skill sets in the DKT+ model fluctuated around 55% for the Accuracy. The student mastered these three skills: 32, 49, and 71, at a relatively low mastery level.

Figure 8.
The radar diagram of the QRAKT model. In the first interaction, the student’s knowledge state was minimum. After a period of study, the performance of the student on Skills 32, 47, and 71 reached the maximum. However, because of the forgetting behaviors and the impact of the guessing factor and the slipping factor, the knowledge state presented some reduction, but it still performed better than the first interaction.

Figure 9.
The comparison of the knowledge tracing result for Skill 49 based on the calibrated Q-matrix relational attention knowledge tracing model (QRAKT), the DKT model, and the DKT+ model. The QRAKT model outperformed the other two models with around a 65% Accuracy on Skill 49. Compared with the performance of the QRAKT model, the DKT model and the DKT+ model performed poorly with around a 48% and a 53% Accuracy on Skill 49.


Table 1.
The important mathematical notations.
| Notations | Descriptions |
|---|---|
| n | The total number of exercises |
| d | The dimension of latent variables |
| s | ith interaction of a student |
| e | An exercise solved by a student |
| k | The maximum absolute value |
| k | The total number of knowledge concepts |
| RE | Exercise relation matrix |
| RF | Forget behavior matrix |
| RS | Slip and guess matrix |
| B | Exercise matrix |
| E | Exercise embedding matrix |
| S | Interaction sequence of a student |
| Q | The expert labeled Q-matrix |
| The calibrated Q-matrix | |
| X | The input exercise sequence |
| Sta(K) | The Stability rate of the model: K |
Table 2.
The contingency table for exercise i and exercise j. This table is used to calculate the Phi coefficient between two exercises. In this contingency table, “F” means the student answers the exercise incorrectly and “T” means the student answers the exercise correctly.
Table 2.
The contingency table for exercise i and exercise j. This table is used to calculate the Phi coefficient between two exercises. In this contingency table, “F” means the student answers the exercise incorrectly and “T” means the student answers the exercise correctly.
| exercise i | ||||
|---|---|---|---|---|
| F | T | total | ||
| exercise j | F | n | n | n |
| T | n | n | n | |
| total | n | n | n | |
Table 3.
The statistics of ASSIST2012 and Eedi.
| Statistic | ASSIST2012 | Eedi |
|---|---|---|
| Number of records | 4,193,631 | 233,767 |
| Number of students | 39,364 | 2064 |
| Number of questions | 59,761 | 948 |
| Avg exercise record/student | 107 | 113 |
Table 4.
The framework setting for the relational attention knowledge tracing model and the calibrated Q-matrix relational attention knowledge tracing model.
Table 4.
The framework setting for the relational attention knowledge tracing model and the calibrated Q-matrix relational attention knowledge tracing model.
| ASSIST2012 | Eedi | |
|---|---|---|
| Attention embed size | 256 | 256 |
| Number of heads | 8 | 8 |
| Training batch size | 200 | 200 |
| Drop out rate | 1 × 10 | 1 × 10 |
| Threshold of exercise matrix | 0.8 | 0.8 |
| 1 | 1 |
Table 5.
Comparison of the results of the baseline models with the relational attention knowledge tracing model (RAKT) and the calibrated Q-matrix relational attention knowledge tracing model (QRAKT). The best model is boldfaced. The RAKT model performed better than the six baseline models, including the DKT model, the DKT+ model, the DKVMN model, and the SAKT model. The QRAKT model further improved the AUC and ACC to some extent compared to the RAKT model and had the best performance in terms of the AUC and ACC.
| ASSIST2012 | Eedi | |||||
|---|---|---|---|---|---|---|
| AUC | ACC | Sta | AUC | ACC | Sta | |
| DKT | 0.712 | 0.679 | 0.125 | 0.489 | 0.489 | 0.125 |
| DKT+ | 0.722 | 0.685 | 0.257 | 0.584 | 0.566 | 0.358 |
| DKVMN | 0.701 | 0.686 | 0.255 | 0.698 | 0.640 | 0.683 |
| SAKT | 0.736 | 0.692 | 0.492 | 0.495 | 0.493 | 0.266 |
| EKT | 0.748 | 0.690 | 0.668 | 0.694 | 0.648 | 0.695 |
| EKPT | 0.752 | 0.693 | 0.706 | 0.698 | 0.651 | 0.704 |
| RAKT | 0.754 | 0.695 | 0.793 | 0.702 | 0.652 | 0.791 |
| QRAKT | 0.771 | 0.702 | 0.967 | 0.707 | 0.670 | 0.961 |
Table 6.
Comparison of the results when the positional attention layer (PA) is removed. The best model is boldfaced. After removing the PA, the AUC of the model on the two datasets decreased by about 1.8% and 19.2%.
Table 6.
Comparison of the results when the positional attention layer (PA) is removed. The best model is boldfaced. After removing the PA, the AUC of the model on the two datasets decreased by about 1.8% and 19.2%.
| ASSIST2012 | Eedi | |||
|---|---|---|---|---|
| AUC | ACC | AUC | ACC | |
| PA | 0.753 | 0.689 | 0.515 | 0.541 |
| PA+CQ | 0.748 | 0.676 | 0.505 | 0.528 |
| PA+RM | 0.732 | 0.668 | 0.500 | 0.530 |
| PA+CQ+RM | 0.731 | 0.665 | 0.489 | 0.525 |
| QRAKT | 0.771 | 0.702 | 0.707 | 0.670 |
Table 7.
Comparison of the results when the calibrated Q-matrix (CQ) is removed. The best model is boldfaced. After removing the CQ, the AUC of the model on the two datasets decreased by about 1.7% and 2.6%.
Table 7.
Comparison of the results when the calibrated Q-matrix (CQ) is removed. The best model is boldfaced. After removing the CQ, the AUC of the model on the two datasets decreased by about 1.7% and 2.6%.
| ASSIST2012 | Eedi | |||
|---|---|---|---|---|
| AUC | ACC | AUC | ACC | |
| CQ | 0.754 | 0.695 | 0.681 | 0.633 |
| PA+CQ | 0.748 | 0.676 | 0.505 | 0.528 |
| CQ+RM | 0.735 | 0.670 | 0.684 | 0.632 |
| PA+CQ+RM | 0.731 | 0.665 | 0.489 | 0.525 |
| QRAKT | 0.771 | 0.702 | 0.707 | 0.670 |
Table 8.
Comparison of the results when removing relation modeling (RM). The best model is boldfaced. After removing the RM, the AUC of the model on the two datasets decreased by approximately 3.1% and 2.3%.
Table 8.
Comparison of the results when removing relation modeling (RM). The best model is boldfaced. After removing the RM, the AUC of the model on the two datasets decreased by approximately 3.1% and 2.3%.
| ASSIST2012 | Eedi | |||
|---|---|---|---|---|
| AUC | ACC | AUC | ACC | |
| RM | 0.740 | 0.678 | 0.684 | 0.637 |
| PA+RM | 0.732 | 0.668 | 0.500 | 0.530 |
| CQ+RM | 0.735 | 0.670 | 0.684 | 0.632 |
| PA+CQ+RM | 0.731 | 0.665 | 0.489 | 0.525 |
| QRAKT | 0.771 | 0.702 | 0.707 | 0.670 |
Disclaimer/Publisher’s Note: The statements, opinions and data contained in all publications are solely those of the individual author(s) and contributor(s) and not of MDPI and/or the editor(s). MDPI and/or the editor(s) disclaim responsibility for any injury to people or property resulting from any ideas, methods, instructions or products referred to in the content. |
© 2023 by the authors. Licensee MDPI, Basel, Switzerland. This article is an open access article distributed under the terms and conditions of the Creative Commons Attribution (CC BY) license (https://creativecommons.org/licenses/by/4.0/).
Share and Cite
MDPI and ACS Style
Li, L.; Wang, Z. Calibrated Q-Matrix-Enhanced Deep Knowledge Tracing with Relational Attention Mechanism. Appl. Sci. 2023, 13, 2541. https://doi.org/10.3390/app13042541
AMA Style
Li L, Wang Z. Calibrated Q-Matrix-Enhanced Deep Knowledge Tracing with Relational Attention Mechanism. Applied Sciences. 2023; 13(4):2541. https://doi.org/10.3390/app13042541
Chicago/Turabian StyleLi, Linqing, and Zhifeng Wang. 2023. "Calibrated Q-Matrix-Enhanced Deep Knowledge Tracing with Relational Attention Mechanism" Applied Sciences 13, no. 4: 2541. https://doi.org/10.3390/app13042541
Note that from the first issue of 2016, this journal uses article numbers instead of page numbers. See further details here.