Article

Effect of Tillage and Nitrogen Fertilization on Soil Properties and Yield of Five Durum Wheat Germoplasms in a Dry Area of Morocco

1
Laboratory of Materials, Nanotechnology and Environment, Department of Chemistry, Faculty of Sciences, Mohammed V University, Rabat P.O. Box 1014, Morocco
2
Research Unit on Environment and Conservation of Natural Resources, Regional Center of Rabat, National Institute of Agricultural Research, Rabat P.O. Box 6356, Morocco
3
International Center for Agricultural Research in the Dry Areas (ICARDA), Rabat P.O. Box 1014, Morocco
4
Division of Water and Climate, Direction of Studies and Scientific Research, National Center for Nuclear Energy, Sciences and Techniques (CNESTEN), Rabat P.O. Box 1014, Morocco
*
Author to whom correspondence should be addressed.
Appl. Sci. 2023, 13(2), 910; https://doi.org/10.3390/app13020910
Submission received: 24 September 2022 / Revised: 29 November 2022 / Accepted: 30 November 2022 / Published: 9 January 2023
(This article belongs to the Section Agricultural Science and Technology)

Abstract

:
In Morocco, cereal production is below the expected potential. The adoption of best agricultural practices that reduce vulnerability to climate is a major requirement. No-tillage (NT) agriculture is a system that could improve cereal production by enhancing soil fertility. Some factors, in combination with no-tillage, can further improve cereal yields, especially the choice of variety the adequate fertilization. The objective of our study is to investigate the effect of no-tillage agriculture and nitrogen fertilization on soil fertility and the yield of five durum wheat varieties developed in Morocco in a long-term (18 years) NT trial at the INRA Merchouch experimental station, Morocco. The results show that tillage type had a significant effect on soil organic carbon and CEC (measured before the start of the experiment), as well as on ammonium and nitrates (measured at the end of the experiment), whereas nitrogen dose had a significant effect on total nitrogen and nitrates (measured at the end of the experiment). Regarding wheat yield, as measured at the end of the experiment during the 2020–2021 cropping season, the results show that, under NT, the varieties Nachit, Faraj, and Louiza had grain yields of 4.5, 4.3, and 3.4 t ha−1 and straw yields of 9.8, 7.8, and 6.8 t ha−1, respectively, whereas the I.C and M.G germoplasms had grain yields of 4.05 and 3.72 t ha−1 and straw yields of 8.25 and 8.39 t ha−1, respectively. These values are low for a favorable area and correspond to a semi-arid area. In addition, no effects of nitrogen dose were observed due to water stress, which reduced nitrogen use efficiency. Nachit is the most adapted variety under NT, with the highest yield (5.1 t ha−1) under a low dose of nitrogen (20 kg N ha−1), followed by Faraj (4.7 t ha−1), still under NT but with a higher nitrogen dose (40 kg N ha−1) and Nachit (4.5 t ha−1) with the minimum nitrogen dose but under both NT and CT. In conclusion, Nachit and Faraj wheat varieties performed the best under no-tillage conditions with the minimal nitrogen dose. However, grain yield values were reduced, owing to water stress, which reduced nitrogen use efficiency.

1. Introduction

Soil is the main environment for the development of crops, guaranteeing a large part of the high yield. In recent years, there has been a trend of gradual transition from conventional tillage to new no-till techniques, culminating in no-tillage agriculture. Compared to other tillage practices, no-tillage techniques provide several economic, environmental, and agronomic advantages. It is a technique that has had generally positive effects on soil [1,2,3] by improving nitrogen levels [4], in addition to increasing grain yields. In the 2020–2021 growing year, the area of autumn cereals in Morocco reached 4.3 million hectares (ONICL, 2020). Cereals are grown in multiple of the country’s agroclimatic zones in rotation with other annual crops (MAPM, 2020). Morocco’s wheat imports in the 2020/2021 crop year were estimated at 6.2 million metric tons, which is approximately 35% higher than imports in 2019/2020. This significant increase was mainly the result of low domestic production and the suspension of import duties (ONICL, 2020).
The average Moroccan consumes 200 kg of wheat per year, which is three times more than the worldwide average. As in the other Maghreb countries, this cereal, particularly through bread, is a basic element in the diet. Durum wheat is the raw material for many byproducts (bread, semolina, pasta, pastries, and biscuits) and has received considerable attention, owing to its adaptation to semi-arid environments [5]. Wheat grain is an energetic food containing, on average, 70% starch, 12% protein, 9% pentosan and cellulose, and less than 5% free sugars, lipids, and minerals [6].
Nitrogen remains one of the most important elements for cereal production [7]. Its efficient use is decisive for the improvement of production in terms of quantity and quality [8,9,10]. Nitrogen fertilization of cereals should take into consideration the nature and the dose to be applied. Cereal nitrogen requirements vary depending on the growth phase [11,12]. The objective of our study is to investigate the effect of no-tillage techniques and nitrogen fertilization on soil fertility and the yield of five durum wheat varieties recently developed in Morocco—three new varieties (Louiza, Faraj, and Nachit) and two germplasms (M.G and I.C)—in a long-term NT (18 years) trial at the INRA Merchouch experimental station. Interactions between two or three factors can inform recommendations for farmers with respect to the optimal combination of tillage type, nitrogen dose, and variety.

2. Materials and Methods
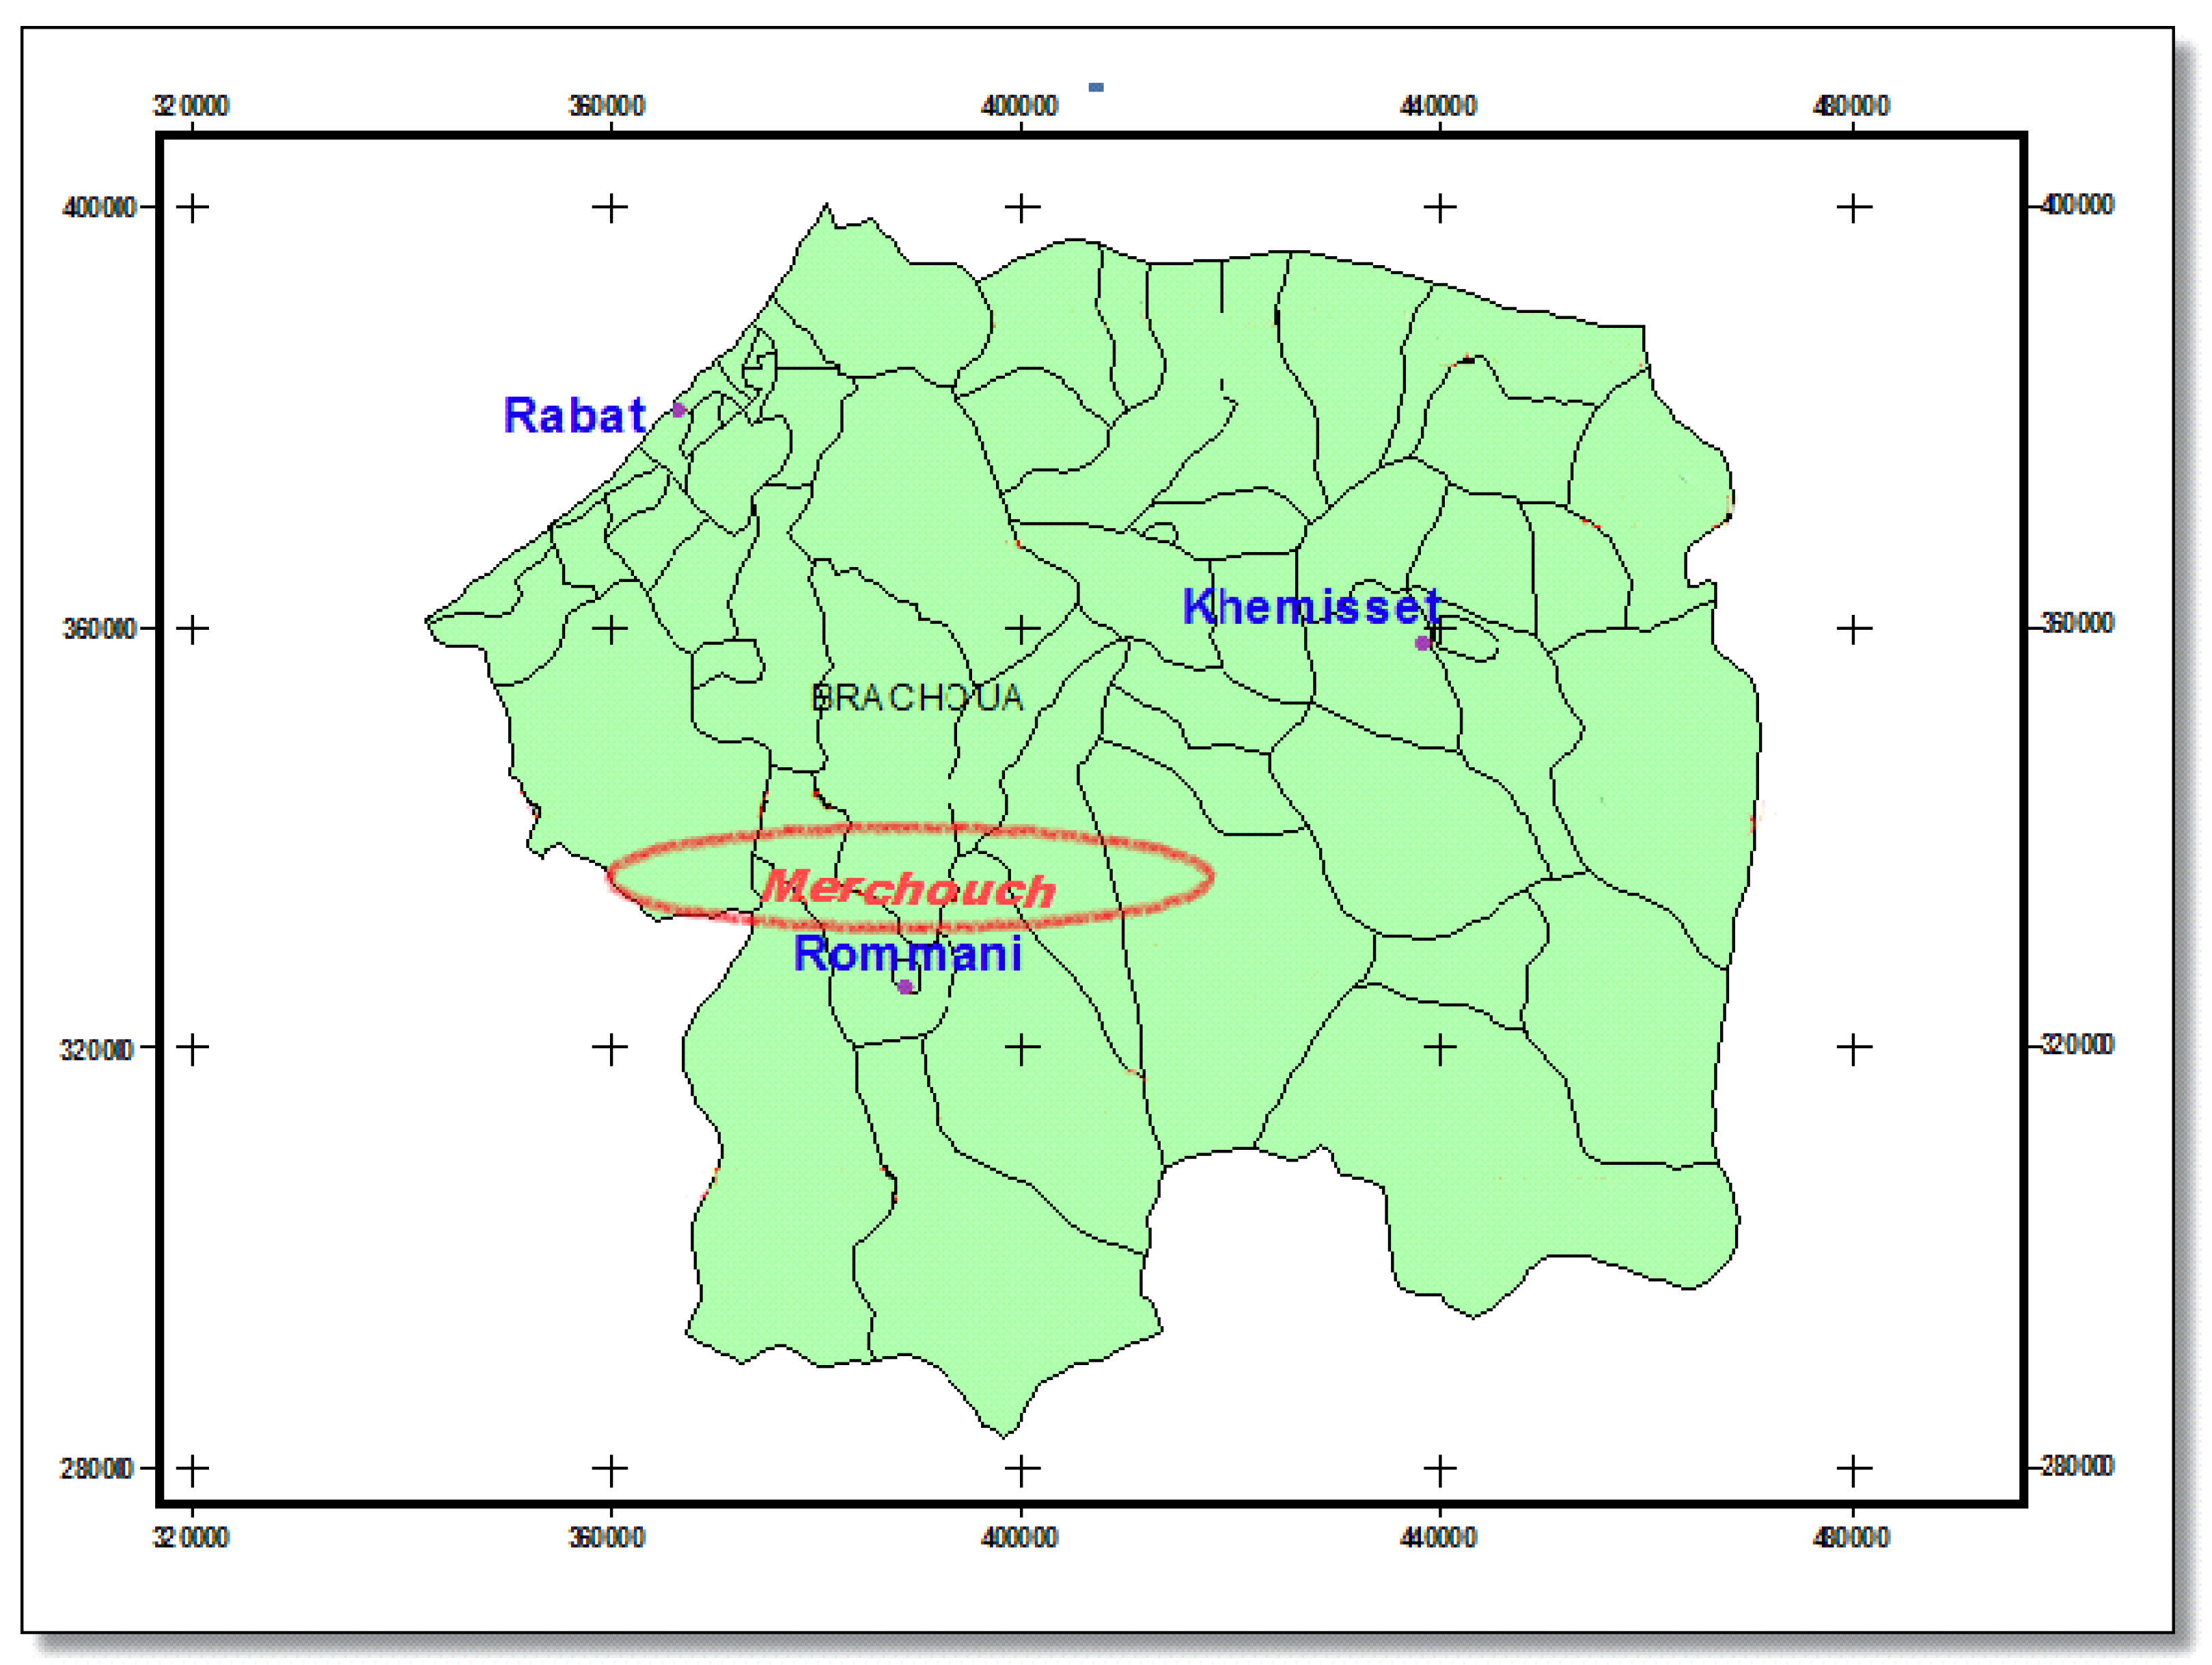
2.1. Study Area

The site (Figure 1) is located at the Merchouch experimental station of the National Institute of Agricultural Research (INRA) in the Zaer region (60 km south of Rabat; 33°37′ N; 6°43′ O). It is characterized by a Mediterranean climate with oceanic influence, with an average temperature of 28 °C and an average rainfall of 400 mm. The site was under no tillage since 2004, with cereal-food legume as rotation.

2.2. Soil sampling and Analysis

Soil samples were taken in September 2020 using a hand auger from both non-tillage (NT) and conventional tillage (CT) plots. Three replicates were considered for each tillage type at five depths (0–5, 5–10, 10–20, 20–40, and 40–60 cm) and each of the three nitrogen doses. After collection, soil samples were air-dried, hand-crushed, and sieved to 0.2 mm for laboratory analysis. Texture was determined using only two samples (one per tillage type) at a depth of 0–15 cm. Organic carbon (OC), phosphorus (P2O5), potassium (K2O), and cationic exchange capacity (CEC) were analyzed before the start of the experiment, whereas total nitrogen, ammonium, and nitrates were analyzed at the end of the experiment. Soil properties were determined following international standards. OC was determined by the method of Walkley and Black [13]. Assimilable phosphorus was extracted by a sodium bicarbonate reagent (HCO3Na) buffered at pH 8.5 with sodium hydroxide (NaOH) [14], potassium was evaluated using the normal “K exchangeable with ammonium acetate” method at pH = 7 [15], and CEC was measured by the Bower method [16]. Total nitrogen was determined by the Kjeldahl method [17], and ammonium and nitrates were extracted by a solution of KCl, then distilled [18].

2.3. Experimental Protocol

The experimental setup includes either ten treatments (two tillage types x five depths) for soil properties evaluated before the experiment or 30 treatments (two tillage types x three nitrogen doses x five depths for soil properties evaluated at the end of the experiment or two tillage types x three nitrogen doses x five varieties for wheat yield. The experimental design was a randomized complete block with three replications. Therefore, the corresponding experimental designs were either a split plot for soil properties determined before the start of the experiment (tillage type in main plots and depth in subplots) or a split–split plot for those determined at the end of the experiment and for wheat yield. For the former, tillage types were allotted to main plots, nitrogen doses were allotted to subplots, and depths were allotted to sub-subplots. The same is true for wheat yield, except varieties were allotted to sub-subplots. The two tillage types were conventional tillage (CT) and no tillage (NT). The three nitrogen doses were 20, 40, and 60 kg N ha−1. On 21 December 2020, the base fertilizer NPK 10-20-20 was applied at 150 kg ha−1, and on 20 January 2021 and 8 February 2021, ammonitrate 33.5% was supplied at a rate of 100 kg ha−1. The five varieties of durum wheat (Triticum durum Desf.) were Louiza (INRA-Morocco, 2011), Faraj (INRA-Morocco, 2007), and Nachit, as well as two germplasms (M.G and I.C). Some of the main characteristics of the three varieties are presented in Table 1; however, those relative to the two germoplasms are not yet publicly available.
Grain and straw yields were determined for each block, variety, nitrogen dose, and tillage type using two plots with a 1 m × 1 m square metal stem quadrats placed directly on the vegetation.

2.4. Statistical Analysis

Descriptive statistical parameters (mean, standard deviation, minimum, maximum, and coefficient of variation (CV)) of the various soil and crop characteristics were computed. Then, two conditions were verified: normality (using the Shapiro–Wilk test) and equality of variances (using the Levene test). Because both conditions were met, an analysis of variance (ANOVA) with 3 or 4 factors was used to compare the means corresponding to the two tillage types, the three nitrogen doses, and either the five depths or varieties, as well as their interactions. All factors were considered fixed, except block (replications), which was considered random, resulting in mixed ANOVA models. All the tests were applied at a significance level of 0.05. If significant differences were found, Duncan’s multiple-range post hoc test was used for pairwise comparisons. All statistical analyses were performed using SPSS software, version 25 (IBM Corp., Armonk, NY, USA).

3. Results and Discussion

3.1. Soil

3.1.1. Texture

The results of the particle size analysis of the soil samples from the two plots (CT and NT) show that the soil has a clayey texture (Table 2) with almost 50% clay and less than 10% sand.

3.1.2. Chemical Properties

Mean values of organic carbon (OC), potassium, phosphorus, and cationic exchange capacity (CEC) for the two tillage types and at the five depths are presented in Table 3.
With respect to organic carbon (OC) contents, ANOVA (Table 4) showed a highly significant difference (F value = 143.06 and p-value = 0.007) between NT and CT, with a slightly higher mean value for NT (8.8 g kg−1) compared to CT (8.4 g kg−1). There was also a very highly significant difference between depths (F value = 71.42 and p-value < 0.001), with the highest mean values at the soil surface (11.1 and 10.5 g kg−1 at the 0–5 and 5–10 cm depths, respectively), as opposed to the 40–60 cm depth (6.0 g kg−1). Duncan’s post hoc test showed that only the 10–20 and 20–40 cm depths did not differ significantly, with mean OC values of 7.9 and 7.5 g kg−1, respectively. This result is in agreement with research on organic matter stocks in conservation systems, which are higher at the surface than in ploughed systems [19,20,21], with small differences at deeper horizons [22]. Other studies have shown that OC levels in conservation systems are generally higher in the top 10 cm of soil compared to tilled soil, decreasing sharply in the underlying horizons [23]. There was no significant interaction between the two factors (F value = 2.36 and p-value = 0.060), indicating that the ranking of tillage types in terms of OC content was the same for the five depths and higher for NT than CT.
ANOVA (Table 4) showed no significant differences between NT and CT in terms of available phosphorus (F value = 12.57 and p-value = 0.071), with mean values of 115 mg kg−1 for NT and 113 mg kg−1 for CT. This qualifies the soil as rich in P2O5 according to the interpretation standards. Phosphorus levels decrease significantly with depth for both NT and CT (F value = 536.17 and p-value < 0.001), with the highest content at the soil surface (177 mg kg−1 at the 0–5 cm depth) and the lowest content in the deepest layer (50 mg kg−1 at the 40–60 cm depth). There was a very highly significant interaction between the two factors (F value = 48.87 and p-value < 0.001), indicating that the ranking of tillage types changed with depths; for example, at the 0–5 cm depth, NT content (196 mg kg−1) was higher than CT content (161 mg kg−1), whereas at the 20–40 cm depth, the trend was reversed (57 mg kg−1 for NT vs. 93 mg kg−1 for CT).
According to ANOVA, exchangeable potassium content was not significantly different between NT and CT (F value = 11.66 and p-value = 0.076), with a slightly higher mean value for NT (92 mg kg−1) compared to CT (84 mg kg−1). These values show that the soil is moderately rich in potassium according to the standards. ANOVA also revealed highly significantly differences between depths (F value = 117.07 and p-value < 0.001), with the highest mean values at the soil surface (110 mg kg−1 at the 0–5 cm depth) and the lowest in the deepest layer (56 mg kg−1 at the 40–60 cm depth). Duncan’s post hoc test showed that each depth has significantly different potassium content than all the other depths, except 5–10 and 10–20 cm (97 and 95 mg kg−1). At the 0–10 cm horizon, soil under NT has higher potassium content than that under CT, in agreement with the results of studies on the effect of direct seeding on potassium [3]. Previous studies showed that under no-tillage conditions, the amount of potassium can be reduced with depth [24]. There was a highly significant interaction between the two factors (F value = 7.23 and p-value < 0.001).
ANOVA indicated a significant difference between NT and CT for CEC (F value = 74.23 and p-value = 0.013), with a higher mean value for NT (48 meq/100 g) than for CT (36 meq/100 g), which can be explained by the increase in organic matter under NT vs. CT. Furthermore, highly significantly differences in CEC were observed relative to depth (F value = 51.55 and p-value < 0.001), with the highest mean value at the soil surface (58 meq/100 g at the 0–5 cm depth) and the lowest in the deepest layers (31 meq/100 g at the 20–40 and 40–60 cm depths). Duncan’s post hoc revealed significant differences between all depths, except the two deepest levels. There was no significant interaction between the two factors (F value = 2.42 and p-value = 0.056).

3.1.3. Total Nitrogen

Table 5 shows total nitrogen mean values for the five soil depths (0–5, 5–10, 10–20, 20–40, and 40–60 cm) with the three nitrogen doses (20, 40, and 60 kg N ha−1) for each tillage type (NT and CT), and ANOVA results are presented in Table 6.
ANOVA indicated no significant difference between the two tillage types (F value = 16.94 and p-value = 0.054), with mean values of 595 and 572 mg kg−1 for CT and NT, respectively. In contrast, there were highly significant differences between the three nitrogen doses (F value = 33.55 and p-value < 0.001) and the five depths (F value = 80.76 and p-value < 0.001). Duncan’s post hoc test showed no significant difference between 20 and 60 kg N ha−1 with higher total nitrogen content (585 and 626 mg kg−1, respectively) compared to 40 kg N ha−1 with lower content (539 mg kg−1). Regarding soil depths, there were three groups: 0–5 and 40–60 cm, which did not significantly differ (708 and 705 mg kg−1; 5–10 cm (647 mg kg−1); and 10–20 and 20–40 cm, which did not significantly differ (420 and 437 mg kg−1, respectively). For 20 and 40 kg N ha−1, the total surface nitrogen content was higher in NT than in CT, whereas for 60 kg N ha−1, CT was higher than NT. All interactions were statistically significant, indicating that the effect of each of the three factors depends on the levels of the other two factors. Therefore, there is no unique optimal nitrogen dose and wheat variety for both tillage types.
In NT, fertilizer remained concentrated at the surface (0–10 cm), mainly under 20 and 40 kg N ha−1 nitrogen doses, whereas under conventional tillage, fertilizer was distributed along the profile. This result is in line with studies that reported that N use efficiency (NUE) in wheat varied with environmental conditions and that it is higher with low N input and decreases with increasing N input [25,26].

3.1.4. Ammonium

Measurements of ammonium in the soil samples for the five soil depths (0–5, 5–10, 10–20, 20–40, and 40–60 cm) with the three nitrogen doses (20, 40, and 60 kg N ha−1) for each type of tillage (NT and CT) are presented in Table 7, and ANOVA results are reported in Table 6.
ANOVA (Table 6) showed no significant difference between the three nitrogen doses (F value = 0.60 and p-value = 0.573), with mean values of 8.7, 8.3, and 8 mg kg−1 for the 20, 40, and 60 kg N ha−1 doses, respectively. Tillage type (F value = 325.14 and p-value = 0.003) and soil depth (F value = 5.94 and p-value = 0.001) were differed significantly. Mean ammonium content was much higher under NT (10.6 mg kg−1) compared to CT (6.0 mg kg−1). Duncan’s post hoc test identified three groups of depths: 0–5 cm, with a mean value of 10.1 mg kg−1; 5–10, 10–20, and 20–40 cm, which did not significantly differ, with mean values of 8.3, 7.9, and 8.1 mg kg−1, respectively; and 40–60 cm, with a mean value of 7.3 mg kg−1. Ammonium content at the soil surface was higher in NT than in CT, with an advantage under 40 kg N ha−1 treatment, in agreement with studies evaluating the effect of N dose [27] or N form [28,29]. With respect to total nitrogen, all interactions between the three factors were statistically significant.

3.1.5. Nitrate

Mean soil nitrate contents for each tillage type, nitrogen dose, and soil depth are presented in Table 8, and ANOVA results are reported in Table 6. Table 8 shows that nitrate contents for each nitrogen dose are higher under conventional conditions than under no-tillage conditions.
ANOVA (Table 6) revealed highly significant differences for the three factors: F value = 50.10 and p-value = 0.019 for tillage type, F value = 30.74 and p-value < 0.001 for nitrogen dose, and F value = 11.81 and p-value < 0.001 for soil depth. Mean values were higher for CT (13.8 mg kg−1) than NT (11.6 mg kg−1). Duncan’s post hoc test showed that the three nitrogen doses significantly differed, with mean values of 8.4, 13.9, and 15.8 mg kg−1 corresponding to 20, 40, and 60 kg N ha−1, respectively. Regarding soil depth, three groups were identified: 10–20 cm, with a mean value of 14.6 mg kg−1; 5–10, 20–40, and 40–60 cm, which did not significantly differ, with mean values of 13.6, 12.5, and 13.1 mg kg−1, respectively; and 0–5 cm, with a mean value of 9.9 mg kg−1. All interactions, except tillage type x nitrogen dose, were statistically significant.
The levels of total nitrogen and ammonium in NT were higher than in CT, contrary to nitrate content, which can be explained by the use of excess nitrogen fertilizers or by the use of plant protection products. In addition, nitrate content for each nitrogen treatment was higher under CT than NT, although nitrate has higher mobility than ammonium, which could be impacted by leaching.

3.2. Wheat Yield

Grain and straw yields of the five varieties for each tillage type are presented in Table 9 and Table 10 under the three nitrogen doses.
Globally, ANOVA results (Table 11) show that only variety has a very highly significant effect on grain and straw yields (F values = 14.62 and 6.41, respectively, and p-value < 0.001), whereas there were no significant differences between the two tillage types (F values = 4.40 and 1.20 and p-values = 0.171 and 0.388, respectively) and the three nitrogen doses (F values = 3.95 and 2.06 and p-values = 0.064 and 0.190, respectively). None of the interactions was significant.
Duncan’s post hoc test showed that the Louiza variety had the lowest grain yield (3.18 t ha−1), followed by I.C and M.G with intermediate grain yields (4.05 and 3.72 t ha−1, respectively) and finally Faraj and Nachit with the highest grain yield (4.13 and 4.46 t ha−1) (Table 9). A comparison of the values presented in Table 9 with those presented in Table 1 shows that grain yields for the three varieties correspond to considerably increased yields in semi-arid areas, although the study site is in a favorable area. In addition, the observed yield values are much lower than those corresponding to the yield potential that can be reached if all crop conditions (soil, climate, and crop management practices) are optimal. These low grain yield values are mostly the consequence of water stress that occurred for the last three years. A slightly higher grain yield was attained under NT (4.07 t ha−1) compared to CT (3.75 t ha−1). The effect of tillage type on yield was not significant, although there were significant differences in soil properties (especially OC, CEC, ammonium, and nitrates) corresponding to the two tillage types, which could also be explained by water stress that prevented these varieties from using all available nitrogen. With respect to nitrogen doses, mean grain yields were 4.09, 3.92, and 3.72 t ha−1 under 20, 40, and 60 kg N ha−1, respectively. Water stress is likely the cause of the absence of nitrogen dose effect, reducing nitrogen use efficiency.
In terms of straw yield, Duncan’s post hoc test identified two groups of varieties: in the first group, Louiza, with the lowest mean yield (6.38 t ha−1), and in the second group, the four remaining varieties, with mean yields ranging between 8.25 and 8.77 t ha−1. In terms of tillage type, mean straw yields were 7.85 t ha−1 for CT and 8.37 t ha−1 for NT. For nitrogen doses, straw yields varied between 7.77 and 8.54 t ha−1 with 60 and 20 kg N ha−1, respectively.
Comparing NT to CT, the former resulted in higher grain and straw yields with most combinations (11 out of 15) nitrogen doses and varieties (Table 9 and Table 10). In terms of grain yield, CT outperformed NT only for Faraj and Nachit varieties under 20 kg N ha−1 and I.C and Louisa varieties under 40 kg N ha−1, whereas in terms of straw yield, CT achieved better results than NT only for the Faraj variety under the three nitrogen doses and Louisa variety under 40 kg N ha−1.
Ignoring varieties and comparing the two tillage types for the three nitrogen doses, grain and straw yields were always higher for NT compared to CT, independent of the nitrogen dose (Table 9 and Table 10). Furthermore, combining nitrogen dose and comparing tillage types for the different varieties, the ranking of the varieties was the same for both tillage types in terms of grain yield, with Nachit identified as the best variety (4.30 t ha−1 under CT and 4.62 t ha−1 under NT) and Louiza identified as the variety providing the lowest yield (3.19 t ha−1 under CT and 3.17 t ha−1 under NT). The behavior of varieties was different considerably in terms of straw yield. Although the Louiza variety had the lowest yield under both NT and CT, it the ranking of the Nachit variety changed drastically from the best variety under CT (9.57 t ha−1) to the second lowest yield under NT (7.97 t ha−1).
Grain yield results show that all three nitrogen doses resulted in higher yields in NT compared to CT (Table 9), with mean values of 4.3, 4.1, and 3.9 t ha−1 as opposed to 3.9, 3.8, and 3.6 t ha−1 corresponding to 20, 40, and 60 kg N ha−1, respectively. The same applies to straw yield, with mean values of 8.8, 8.2, and 8.1 t ha−1 compared to 8.3, 7.8, and 7.4 t ha−1 corresponding to 20, 40, and 60 kg N ha−1, respectively.
Louisa, M.G, and I.C had higher grain yields (3.42, 4.52, and 4.74 t ha−1) under NT than under CT with the minimum nitrogen dose (20 kg N ha−1) (Table 9). On the other hand, the varieties Faraj and, in particular, Nachit require more nitrogen under NT than under CT (40 kg N ha−1) to achieve an increased grain yield (4.32 and 5.14 t ha−1, respectively) (Table 9).

4. Conclusions

After 18 years, all the seven soil properties differed by depth, with higher values at soil surface under no-tillage conditions, except for nitrates. Furthermore, total nitrogen, ammonium, and nitrates measured at the end of the experiment differed between the three nitrogen doses. In addition, total nitrogen content on the surface under 20 and 40 kg N ha−1 was higher under NT than CT, and ammonium content on the surface was higher under NT than CT, which could be explained by the higher organic matter content measured before the start of the experiment under NT vs. CT.
Regarding wheat grain and straw yields measured at the end of the experiment during the 2020–2021 cropping season, differences were observed only between varieties. There were no differences between tillage types and nitrogen doses, and no interaction was significant. In particular, grain yields were low, similar to those in semi-arid areas, although the study site is a climatically favorable area, mainly as a result of water stress, with rainfall shortages reducing nitrogen use efficiency. The varieties Nachit and Faraj achieved the best performance, whereas the Louiza variety had the lowest yield. Nachit and Faraj are the most adapted to no-tillage (NT) conditions, with an increased yield under a low dose of nitrogen treatment (20 kg N ha−1). However, this result should be confirmed by repeating the research conditions and studying the effect of nitrogen on the grain quality for each germplasm. In contrast, the behavior of nitrogen dose is variable and differed between the two tillage types and the five germplasms, indicating that the optimal nitrogen dose depends on the tillage and the variety.

Author Contributions

Conceptualization, O.Z.; Methodology, H.M. and H.D.; Validation, H.M., R.M., A.G. and A.D.; Formal analysis, A.D.; Investigation, H.M. and R.M.; Writing—original draft, H.M.; Writing—review & editing, H.M. and A.D.; Visualization, H.M. and N.E.A.; Supervision, R.M., A.G. and A.Z.; Project administration, R.M.; Funding acquisition, R.M. All authors have read and agreed to the published version of the manuscript.

Funding

Research for this article was conducted as part of a project by MCGP and CAMA. We gratefully acknowledge the International Center for Agricultural Research in the Dry Areas (ICARDA), National Institute of Agronomic Research (INRA) and PRIMA CAMA project for supporting this publication including APC.

Institutional Review Board Statement

Not applicable.

Informed Consent Statement

Not applicable.

Data Availability Statement

Data are available upon request.

Conflicts of Interest

The authors declare no conflict of interest.

References

  1. Moussadek, R.; Mrabet, R.; Dahan, R. Effet de l’agriculture de conservation sur la qualité des sols au Maroc. Afr. Focus 2001, 25, 149–150. [Google Scholar]
  2. Laghrour, M.; Moussadek, R.; Zouahri, A.; Mekkaoui, M.; Dahan, R.; El Mourid, M. Impact du semis direct sur les propriétés physiques d’un sol argileux au Maroc central (Impact of No Tillage on physicalproprieties of a claysoil in Central Morocco). J. Mater. Environ. Sci. 2015, 6, 391–396. [Google Scholar]
  3. Maher, H.; Moussadek, R.; Zouahri, A.; Douaik, A.; Dakak, H.; El Moudane, M.; Ghanimi, A. Effect of no tillage on the physico-chemical properties of soils of the El Koudia region, Rabat (Morocco). E3S Web Conf. 2020, 150, 03010. [Google Scholar] [CrossRef]
  4. Mrabet, R.; Moussadek, R. Potentiels de restauration de la qualité des sols sous agriculture de conservation au Maroc. In Lutte Antiérosive: Réhabilitation des Sols Tropicaux et Protection Contre les Pluies Exceptionnelles; IRD Editions: Marseille, France, 2012; pp. 1–25. [Google Scholar]
  5. Nazco, R.; Villegas, D.; Ammar, K.; Pena, J.R.; Moragues, M.; Royo, C. Can Mediterranean durum wheat land races contribute to improved grain quality attributes in modern cultivars? Euphytica 2012, 185, 1–17. [Google Scholar] [CrossRef]
  6. Doré, T.; Le Bail, M.; Martin, P.; Ney, B.; Roger-Estrade, J. L’agronomie Aujourd’hui; Ed. Quae Editions: Versailles, France, 2006; p. 384. [Google Scholar]
  7. Ryan, J.; Ibrikci, H.; Sommer, R.; McNeill, A. Nitrogen in rain fed and irrigated cropping systems in the Mediterranean region. Adv. Agron. 2009, 104, 53–136. [Google Scholar]
  8. Fageria, N.K.; Baligar, V.C. Enhancing nitrogen use efficiency in crop plants. Adv. Agron. 2005, 88, 97–185. [Google Scholar]
  9. Garrido-Lestache, E.; López-Bellido, R.J.; López-Bellido, L. Durum wheat quality under Mediterranean conditions as affected by N rate, timing and splitting, N form and S fertilization. Eur. J. Agron. 2005, 23, 265–278. [Google Scholar] [CrossRef]
  10. Akhter, M.M.; Hossain, A.; Timsina, J.; Teixeira da Silva, J.A.; Islam, M.S. Chlorophyll meter-A decision-making tool for nitrogen application in wheat under light soils. Int. J. Plant Prod. 2016, 10, 289–302. [Google Scholar]
  11. Tranaviciene, T.; Urbonaviciute, A.; Samuoliene, G.; Duchovskis, P.; Vaguseviciene, I.; Sliesaravicius, A. The effect of differential nitrogen fertilization on photosynthetic pigment and carbohydrate contents in the two winter wheat varieties. Agron. Res. 2008, 6, 555–561. [Google Scholar]
  12. Biljana, B.; Aca, M. Correlation between nitrogen and chlorophyll content in wheat (Triticum aestivum L.). Kragujev. J. Sci. 2009, 31, 69–74. [Google Scholar]
  13. Walkley, A.J.; Black, I.A. Estimation of soil organic carbon by the chromic acid titration method. Soil Sci. 1934, 37, 29–38. [Google Scholar] [CrossRef]
  14. Olsen, S.R.; Sommers, L.E. Phosphorus. In Methods of Soil Analysis Part 2 Chemical and Microbiological Properties; Page, A.L., Ed.; American Society of Agronomy, Soil Science Society of America: Madison, WI, USA, 1982; pp. 403–430. [Google Scholar]
  15. McLean, E.O. Watson ME Soil measurements of plant-available potassium. In Potassium in Agriculture; Munson, R.D., Ed.; ASA, CSSA, SSSA: Madison, WI, USA, 1985; pp. 277–308. [Google Scholar]
  16. Sumner, M.E.; Miller, W.P. Cation exchange capacity, and exchange coefficients. In Methods of Soil Analysis. Part 2: Chemical Properties, 3rd ed.; Sparks, D.L., Ed.; ASA, SSSA, CSSA: Madison, WI, USA, 1996. [Google Scholar]
  17. Bremner, J.M. Nitrogen—Total. In Methods of Soil Analysis: Chemical Methods: Part 3. Soil Science Society of America Book Series No. 5; Sparks, D.L., Ed.; ASA-SSSA: Madison, WI, USA, 1996. [Google Scholar]
  18. Maynard, D.G.; Kalra, Y.P.; Crumbaugh, J.A. Nitrate and exchangeable ammonium nitrogen. In Soil Sampling and Methods of Analysis, 2nd ed.; Carter, M.R., Gregorich, E.G., Eds.; Canadian Society of Soil Science, CRC Press and Taylor & Francis Group: Oxford, UK, 2008. [Google Scholar]
  19. D’Haene, K.; Vandenbruwane, J.; De Neve, S.; Gabriels, D.; Salomez, J.; Hofman, G. The effect of reduced tillage on nitrogen dynamics in silt loam soils. Eur. J. Agron. 2008, 28, 449–460. [Google Scholar] [CrossRef]
  20. Moussadek, R.; Mrabet, R.; Dahan, R.; Zouahri, A.; El Mourid, M.; Van Ranst, E. Tillage system affects soil organic carbon storage and quality in Central Morocco. Appl. Environ. Soil Sci. 2014, 8, 654796. [Google Scholar] [CrossRef] [Green Version]
  21. Laghrour, M.; Moussadek, R.; Mrabet, R.; Dahan, R.; El-Mourid, M.; Zouahri, A.; Mekkaoui, M. Long and midterm effect of conservation agriculture on soil properties in dry areas of Morocco. Appl. Environ. Soil Sci. 2016, 9, 6345765. [Google Scholar] [CrossRef] [Green Version]
  22. Balesdent, J.; Chenu, C.; Balabane, M. Relationship of soil organic matter dynamics to physical protection and tillage. Soil Tillage Res. 2000, 53, 215–230. [Google Scholar] [CrossRef]
  23. Gál, A.; Vyn, T.J.; Michéli, E.; Kladivko, E.J.; Mcfee, W.W. Soil carbon and nitrogen accumulation with long-term no-till versus moldboard plowing over estimated with tilled-zone sampling depths. Soil Tillage Res. 2007, 96, 42–51. [Google Scholar] [CrossRef]
  24. Pekrun, C.; Kaul, H.P.; Claupein, W. Soil tillage for sustainable nutrient management. In Soil Tillage in Agroecosystems; El Titi, A., Ed.; CRC Press: Boca Raton, FL, USA, 2003. [Google Scholar]
  25. Karrou, M. Genotypic variation in nitrogen use efficiency in common wheat. Al Awamia 1996, 95, 39–51. [Google Scholar]
  26. Mosseddaq, F.; Moughli, L. Fertilisation azotée des céréales, cas des blés en Bour et en irrigué. MADRPM/DERD 1999, 62. [Google Scholar]
  27. Hemissi, I.; Gargouri, S.; Hlel, D.; Hachana, A.; Abdi, N.; Sifi, B. Impact of nitrogen fertilization on Fusarium foot and root rot and yield of durum wheat. Tunis. J. Plant Prot. 2018, 13, 31–38. [Google Scholar]
  28. Baha Eddine, S.; El Yousfi, B.; Douira, A. Interaction of nitrogen fertilizers with wheat growth stage and foliar treatment with urea effects on WCR induced by Fusarium culmorum. Plant Arch. 2019, 19, 2829–2835. [Google Scholar]
  29. Baha Eddine, S.; El Yousfi, B.; Douira, A. Effects of nitrogen forms and rates on Fusarium culmorum growth, fitness, aggressiveness and wheat, barley and triticale resistance to crown rot disease. Plant Cell Biotechnol. Mol. Biol. 2020, 21, 107–129. [Google Scholar]
Figure 1. Map showing the location of the experimental site (in red).
Applsci 13 00910 g001
Table 1. Main characteristics of the three varieties.
Wheat VarietyFarajNachitLouiza
Year of official inscription200720182011
QualityProtein (%)15.315.014.8
Yellow index292733
Yield (t ha−1)Favorable areas5.95.95.5
Semi-arid areas3.84.13.1
Potential6.87.16.0
Source: INRA. (2022). Nouvelles obtentions variétales INRA. INRA éditions: Rabat, Morocco.
Table 2. Soil texture measured before the start of the experiment for no tillage (NT) and conventional tillage (CT) at a 15 cm depth.
Texture
Clay (%)Fine Silt (%)Coarse Silt (%)Fine Sand (%)Coarse Sand (%)CaCO3 (%)
NT46.66.436.26.83.70.3
CT46.55.637.26.34.00.4
Table 3. Chemical properties measured before the start of the experiment for no tillage (NT) and conventional tillage (CT) at each soil depth. Means (n = 3) with standard deviations followed by the same letter are not statistically different at the 0.05 significance level according to Duncan’s post hoc test. OC: organic carbon; CEC: cationic exchange capacity.
Depth (cm)TillageOC (g kg−1)Potassium
(mg kg−1)
Phosphorus
(mg kg−1)
CEC
(meq/100 g)
0–5NT11.6 (0.6)117 (5)198 (6)64 (8)
CT10.6 (0.5)103 (7)155 (9)51 (5)
5–10NT10.8 (1.8)100 (11)179 (16)57 (7)
CT10.2 (1.4)94 (8)136 (8)43 (4)
10–20NT7.9 (0.8)95 (8)100 (8)46 (7)
CT7.8 (0.8)95 (6)120 (10)38 (8)
20–40NT7.6 (1.1)83 (10)60 (9)40 (9)
CT7.4 (0.9)83 (6)94 (9)21 (5)
40–60NT6.1 (0.7)65 (5)40 (8)35 (6)
CT5.9 (1.0)47 (7)60 (9)27 (6)
0–511.1 (0.9) a110 (13) a177 (20) a58 (11) a
5–1010.5 (1.6) b97 (11) b158 (18) b50 (11) b
10–207.9 (0.8) c95 (7) b110 (15) c42 (8) c
20–407.5 (1.0) c83 (9) c77 (20) d31 (10) d
40–606.0 (0.9) d56 (11) d50 (13) e31 (7) d
Table 4. ANOVA results for soil properties measured before the start of the experiment.
Soil PropertiesOrganic CarbonPotassiumPhosphorusCEC
Source of VariationF Valuep-ValueF Valuep-ValueF Valuep-ValueF Valuep-Value
Tillage (T) 143.060.007 **11.660.076 ns12.570.071 ns74.230.013 *
Depth (D) 71.42<0.001 ***117.07<0.001 ***536.17<0.001 ***51.55<0.001 ***
T × D 2.360.060 ns7.23<0.001 ***48.87<0.001 ***2.420.056 ns
ns: not significant; *, **, and ***: significant at the 0.05, 0.01, and 0.001 levels, respectively.
Table 5. Total nitrogen content (mg kg−1) measured at the end of the experiment for each nitrogen dose (kg N ha−1), tillage type, and soil depth (cm). Means (n = 3) with standard deviations followed by the same letter are not statistically different at the 0.05 significance level according to Duncan’s post hoc test. NT= no tillage, CT= conventional tillage.
Nitrogen
(kg N ha−1)
Tillage/Depth (cm)0–55–1010–2020–4040–60MeanMean
20NT700 (50)770 (90)280 (30)560 (40)840 (80)630 (197) 585 (166) A
CT420 (20)520 (50)490 (70)590 (40)680 (110)540 (127)
40NT870 (120)560 (80)280 (50)350 (60)700 (50)552 (215)539 (189) B
CT770 (60)490 (60)420 (60)350 (80)600 (60)526 (165)
60NT560 (50)630 (90)490 (130)420 (40)570 (80)534 (109)626 (186) A
CT930 (90)910 (60)560 (40)350 (70)840 (40)718 (213)
MeanNT710 (105)653 (122)350 (113)443 (138)703 (141)572 (183)
CT707 (204)640 (197)590 (88)430 (165)707 (133)595 (190)
Mean708 (158) a647 (159) b420 (117) c437 (148) c705 (133) a583 (186)
Table 6. ANOVA results for soil properties measured at the end of the experiment.
Soil PropertiesTotal NitrogenAmmoniumNitrates
Source of VariationF Valuep-ValueF Valuep-ValueF Valuep-Value
Tillage (T)16.940.054 ns325.140.003 **50.100.019 *
Nitrogen (N)33.55<0.001 ***0.600.573 ns30.74<0.001 ***
Depth (D)80.76<0.001 ***5.940.001 **11.81<0.001 ***
T × N32.62<0.001 ***9.250.008 **3.650.075 ns
T × D3.400.016 *15.05<0.001 ***7.83<0.001 ***
N × D19.91<0.001 ***7.62<0.001 ***3.760.002 **
T × N × D9.01<0.001 ***4.88<0.001 ***6.70<0.001 ***
ns: not significant; *, **, and ***: significant at the 0.05, 0.01, and 0.001 levels, respectively.
Table 7. Ammonium content (mg kg−1) measured at the end of the experiment for each nitrogen dose (kg N ha−1), tillage type, and soil depth (cm). Means (n = 3) with standard deviations followed by the same letter are not statistically different at the 0.05 significance level according to Duncan’s post hoc test. NT= no tillage, CT= conventional tillage.
Nitrogen
(kg N ha−1)
Tillage/Depth (cm)0–55–1010–2020–4040–60MeanMean
20NT17.8 (5.1)9.1 (0.4)7.1 (0.4)9.6 (0.9)13.6 (0.9)11.4 (3.5)8.7 (3.0) A
CT5.0 (0.8)6.6 (1.0)5.5 (0.9)8.0 (0.8)5.0 (1.1)6.0 (1.6)
40NT19.6 (3.6)10.1 (1.8)12.1 (2.5)9.8 (0.3)5.0 (0.9)11.3 (3.7)8.3 (4.1) A
CT6.0 (0.8)5.2 (0.8)4.0 (0.7)5.1 (0.6)6.0 (0.7)5.3 (1.2)
60NT7.4 (0.9)11.1 (1.7)10.6 (0.6)9.6 (1.0)7.1 (1.0)9.2 (1.7)8.0 (2.0) A
CT5.0 (0.9)7.5 (0.8)8.1 (0.5)6.6 (0.6)6.8 (0.6)6.8 (1.1)
MeanNT14.9 (5.1)10.1 (1.6)9.9 (2.8)9.7 (0.9)8.6 (1.3)10.6 (3.3)
CT5.3 (0.9)6.4 (1.3)5.9 (1.7)6.6 (1.6)5.9 (1.3)6.0 (1.4)
Mean10.1 (5.1)8.3 (2.8)7.9 (3.1)8.1 (1.8)7.3 (1.3)8.3 (3.1)
Table 8. Nitrate content (mg kg−1) measured at the end of the experiment for each nitrogen dose (kg N ha−1), tillage type, and soil depth (cm). Means (n = 3) with standard deviations followed by the same letter are not statistically different at the 0.05 significance level according to Duncan’s post hoc test. NT= no tillage, CT= conventional tillage.
Nitrogen
(kg N ha−1)
Tillage/Depth (cm)0–55–1010–2020–4040–60MeanMean
20NT5.5 (0.7)12.2 (1.2)8.7 (0.9)5.2 (0.9)5.2 (1.2)7.4 (2.4)8.4 (3.1)
CT6.9 (0.8)6.1 (0.8)10.8 (1.0)10.4 (0.6)12.6 (4.0)9.4 (3.2)
40NT6.9 (1.0)13.0 (1.8)8.7 (1.1)13.4 (1.3)15.1 (2.9)11.4 (2.8)13.9 (3.8)
CT17.8 (1.8)14.7 (1.9)19.9 (1.3)12.1 (0.9)17.8 (1.9)16.5 (2.8)
60NT11.2 (0.8)19.5 (3.7)19.9(4.3)19.0 (5.0)10.4 (0.9)16.0 (4.2)15.8 (3.9)
CT10.8 (0.5)16.0 (2.3)19.5 (2.1)14.7 (2.9)17.3 (4.5)15.7 (3.6)
MeanNT7.9 (2.4)14.9 (3.4)12.4 (4.9)12.5 (4.6)10.2 (3.3)11.6 (4.1)
CT11.8 (3.9)12.3 (4.7)16.7 (4.4)12.4 (2.4)15.9 (3.3)13.8 (4.0)
Mean9.9 (3.7)13.6 (4.0) A14.6 (5.0)12.5 (3.7) A13.1 (4.4) A12.7 (4.3)
Table 9. Wheat grain yield (t ha−1) measured at the end of the experiment during the 2020–2021 cropping season for all tillage types, nitrogen doses (kg N ha−1), and varieties. Means (n = 3) with standard deviations followed by the same letter are not statistically different at the 0.05 significance level according to Duncan’s post hoc test. NT= no tillage, CT= conventional tillage.
Nitrogen (kg N ha−1)Tillage/
Variety
FarajI.CLouizaM.GNachitMeanMean
20NT4.31 (0.34)4.74 (0.42)3.42 (0.49)4.52 (0.96)4.47 (0.83)4.29 (0.73)4.09 (0.75) A
CT4.46 (0.34)3.87 (0.70)3.21 (0.55)3.40 (0.41)4.52 (0.74)3.89 (0.73)
40NT4.32 (0.17)3.88 (0.66)2.93 (0.66)3.97 (0.48)5.14 (1.03)4.05 (0.93)3.92 (0.81) A
CT3.77 (0.35)4.24 (0.19)3.34 (0.55)3.05 (0.13)4.48 (0.76)3.78 (0.67)
60NT4.04 (0.59)3.93 (0.44)3.17 (0.47)3.95 (0.13)4.24 (0.03)3.86 (0.51)3.72 (0.56) A
CT3.86 (0.20)3.63 (0.89)3.01 (0.15)3.43 (0.73)3.90 (0.50)3.57 (0.59)
MeanNT4.22 (0.38)4.18 (0.61)3.17 (0.52)4.15 (0.61)4.62 (0.78)4.07 (0.75)
CT4.03 (0.42)3.91 (0.63)3.19 (0.42)3.29 (0.46)4.30 (0.66)3.75 (0.67)
Mean4.13 (0.40) a4.05 (0.62) b3.18 (0.46) c3.72 (0.68) b4.46 (0.72) a3.91 (0.72)
Table 10. Wheat straw yield (t ha−1) measured at the end of the experiment during the 2020–2021 cropping season for all tillage types, nitrogen doses (kg N ha−1), and varieties. Means (n = 3) with (standard deviations) followed by the same letter are not statistically different at the 0.05 significance level according to Duncan’s post hoc test. NT= no tillage, CT= conventional tillage.
Nitrogen (kg N ha−1)Tillage/
Variety
FarajI.CLouizaM.GNachitMeanMean
20NT7.85 (1.74)10.25 (1.69)6.60 (1.31)9.21 (1.87)9.95 (1.55)8.77 (1.98)8.54 (2.03) A
CT10.76 (3.12)7.38 (1.13)6.34 (1.30)8.34 (0.31)8.75 (1.51)8.31 (2.12)
40NT8.17 (1.80)9.04 (1.93)5.48 (2.13)9.24 (1.25)9.00 (3.11)8.18 (2.31)8.01 (1.91) A
CT9.01 (1.12)7.54 (1.29)6.79 (2.07)7.48 (0.94)8.32 (1.48)7.83 (1.45)
60NT7.90 (1.73)7.88 (2.29)7.37 (0.38)8.95 (1.39)8.60 (0.35)8.14 (1.35)7.77 (1.50) A
CT8.93 (0.25)7.43 (2.12)5.69 (0.91)7.13 (1.72)7.81 (1.10)7.40 (1.59)
MeanNT7.97 (1.53)9.06 (2.00)6.48 (1. 51)9.13 (1.33)9.18 (1.85)8.37 (1.90)
CT9.57 (1.89)7.45 (1.37)6.27 (1.39)7.65 (1.13)8.29 (1.26)7.85 (1.75)
Mean8.77 (1.86) a8.25 (1.86) a6.38 (1.41) b8.39 (1.42) a8.74 (1.60) a8.11 (1.83)
Table 11. ANOVA results for wheat grain and straw yield (t ha−1) measured at the end of the experiment during the 2020–2021 cropping season.
Wheat YieldGrain Straw
Source of Variation F Valuep-ValueF Valuep-Value
Tillage (T) 4.400.171 ns1.200.388 ns
Nitrogen (N) 3.950.064 ns2.060.190 ns
Variety (V) 14.62<0.001 ***6.41<0.001 ***
T × N 0.140.876 ns0.130.880 ns
T × V 1.600.189 ns2.120.093 ns
N × V 0.760.637 ns0.160.996 ns
T × N × V 1.070.398 ns0.700.690 ns
ns: not significant; ***: significant at the 0.05, 0.01, and 0.001 levels, respectively.
Disclaimer/Publisher’s Note: The statements, opinions and data contained in all publications are solely those of the individual author(s) and contributor(s) and not of MDPI and/or the editor(s). MDPI and/or the editor(s) disclaim responsibility for any injury to people or property resulting from any ideas, methods, instructions or products referred to in the content.

