1. Introduction
FLASH radiotherapy (FLASH-RT) is a promising cancer irradiation treatment, currently under investigation, which reduces the toxicity on the healthy tissues while keeping the same efficiency in the tumor cure as in conventional treatments.
In the early 1960s, some experiments demonstrated that a very-high-dose rate in ultra-short radiation pulses increased cell survival, that is, it spares healthy tissues, compared to conventional (CONV) treatments [
1,
2,
3,
4]. After three decades, this phenomenon was again investigated and confirmed by Vincent Favaudon and their team [
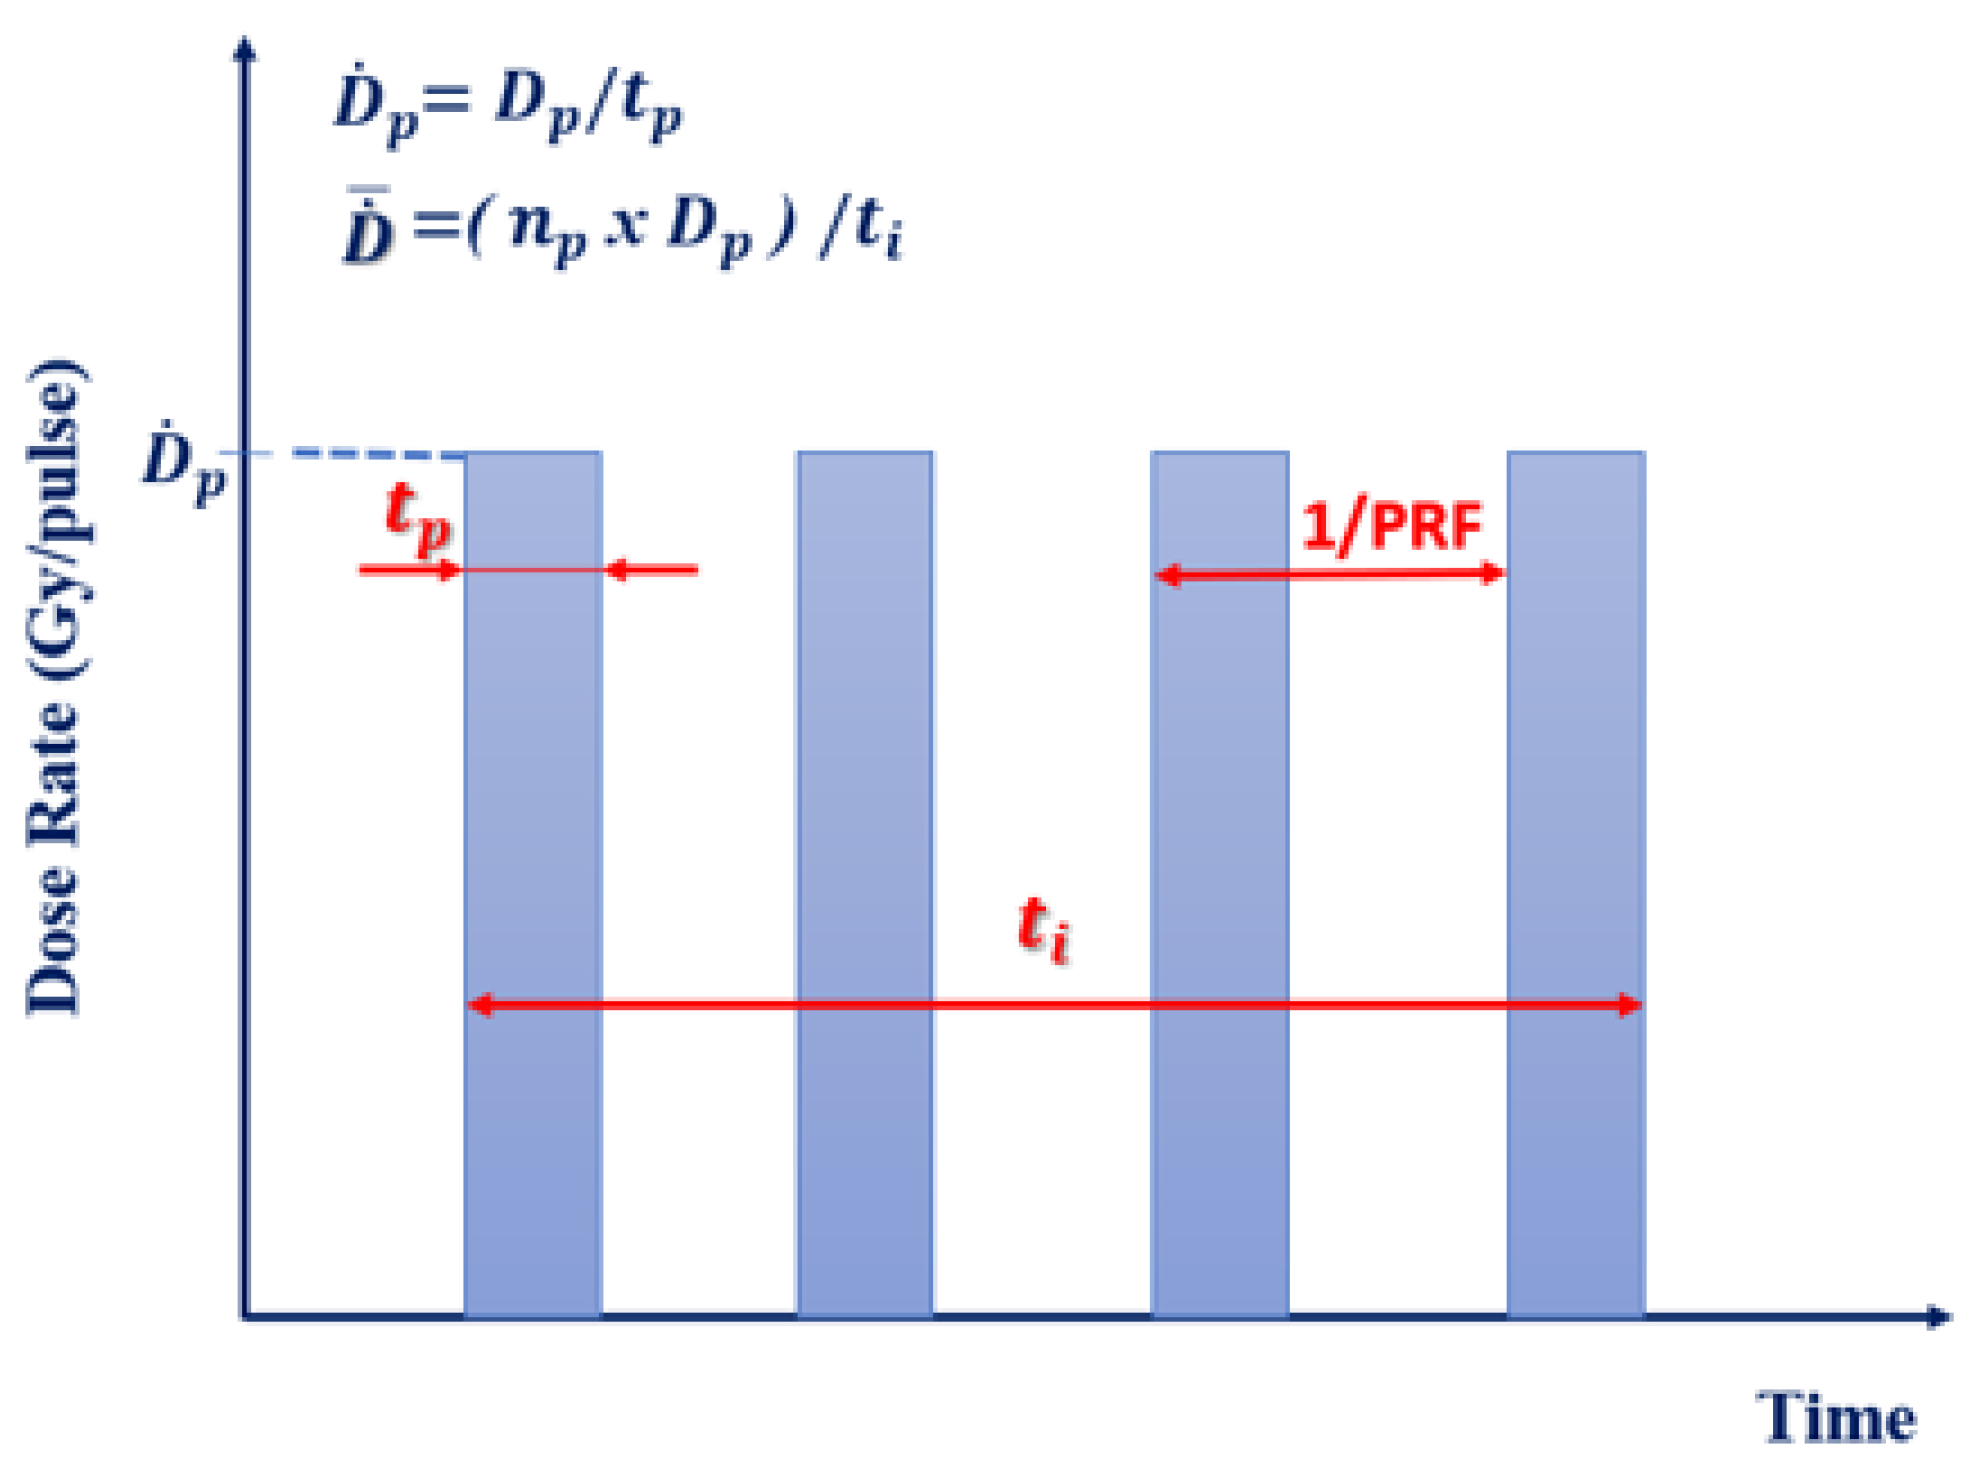
5]. In FLASH RT, the entire dose is delivered in a very short time. The definition of the FLASH regime demands the specification of different inter-dependent temporal parameters such as pulse repetition frequency (PRF), pulse number (
), pulse width (
), dose per pulse (
), in-peak dose rate (
), average dose rate (
), and the total irradiation time (
).
Typically, the FLASH effect was observed with an irradiation time of
< 100 ms [
6], an average dose rate
> 100 Gy/s [
7], an in-peak dose-rate of
, and a pulse repetition frequency PRF > 100 Hz [
8,
9]. It must be noted that these are not threshold values, and to the best of our current knowledge, there is no well-defined limit for the instantaneous dose rate, but only an empirical demonstration that sparing normal tissue can actually be achieved. In addition, the FLASH electron pulse usually provides a dose > 1 Gy, which is three orders of magnitude greater than a conventional electron pulse (<1 mGy/pulse). These parameters are shown in
Figure 1.
After Favaudon’s experiments, many multidisciplinary teams published articles that confirmed the beneficial FLASH effect in healthy tissues [
10]. Even though many studies have been carried out in recent years, the mechanisms underlying the FLASH effect remain largely unknown.
In order to investigate the FLASH effect, several efforts were made to develop new devices able to irradiate in an ultra-high-dose rate regime, such as the Oriatron eRT6 [
11] and the Mobetron [
12].
Furthermore, some clinical linacs were modified and successfully employed to deliver electron beams with an average dose rate of approximately 5000 Gy/s, so as to be compatible with the threshold values which define the FLASH effect (>40 Gy/s). However, because of their dosimetric and geometric properties, they are only suitable for small-animal experiments [
13,
14,
15].
A new linac dedicated to FLASH irradiation was installed at the Institut Curie in Orsay (France) to replace the Kinetron [
16] previously used by Favaudon’s team. The accelerating structure, described in some detail in
Section 2.1, is called ElectronFlash (EF) [
17,
18]. It operates at 5 and 7 MeV, and it can irradiate in conventional and FLASH modalities by changing the pulse width, the pulse repetition frequency, and the number of pulses. The flexibility of the machine allows the investigation of the FLASH effect on small animals or cell samples, with uniform dose profiles. The characterization of the electron beam in terms of doses was necessary to calibrate the data obtained in the radiobiological and pre-clinical experiments performed at Institut Curie.
2. Materials and Methods
2.1. Description of the Electron Linear Accelerator System
The FLASH electron linac installed at Institut Curie (Orsay) is based on a standing wave (SW) accelerating structure. It is 52 cm long and it works at 2.998 GHz (S-band) in the
resonant mode, with a bi-periodic geometry in which the accelerating cells are alternated with unexcited coupling cells. The nominal energies of the electron beam are 5 MeV or 7 MeV, for both FLASH and conventional radiation operations. A thermionic gun generates electrons with pulse peak currents up to 120 mA, which are necessary for the FLASH mode. The linac is powered by an S-band magnetron delivering 3.1 MW [
19] with the RF pulse adjustable between 0.5 and 4 μs. The magnetron is protected by a circulator from accidental power reflections in the waveguide of the SW Linac. The linac parameters are summarized in
Table 1.
In conventional mode, two ionization chambers are used for online dosimetry. They are automatically displaced from the beam axis when the FLASH regime is chosen because of their saturation when a high current per pulse is delivered. In this case, the beam current can be measured through a pair of toroids which also provide the pulse time duration.
An external Faraday cup monitoring system consisting of an aluminum cylinder 5 cm thick and 12 cm large was used. Almost all charges can be collected in the Faraday cup (>93%) according to the Albedo factor [
20]. The Faraday cup is connected through a high-quality coaxial wire to an oscilloscope which allows the measurement of the total charge per pulse and the time pulse profile. The system has a nano-second time resolution with the advantage of not saturating, even with a high charge in the electron pulse [
21,
22,
23,
24].
For the measurements of the dose parameters and profiles, two poly-methylmethacrylate (PMMA) cylindrical applicators were used. The PMMA applicators have a 5 mm wall thickness and 30 mm (A-d30) and 120 mm (A-d120) inner diameters, with a source-surface-distance (SSD) of 55 and 110 cm, respectively. Because of the charge interaction with PMMA walls, the current decreases by approximately 50% at the end of the applicators. The accelerator head was able to irradiate both in the vertical and horizontal directions. The vertical one is usually dedicated to in vitro irradiation while the horizontal one is for in vivo irradiation.
2.2. Dose Measurements with Gafchromic Films
The absorbed dose distribution in a sample has been evaluated in a PMMA phantom in terms of percentage depth dose (PDD) and beam dose profiles. PDD and beam transverse profiles at different depths were investigated by inserting Gafchromics films [
25] EBT-XD (Ashland Inc., Wilmington, DE, USA) in a PMMA slab phantom. The film response was calibrated with 10 EBT-XD films exposed in the range 0–30 Gy in CONV mode with a pulse width of 4
s, using a circular field of 120 mm in diameter, at 10 mm depth in a PMMA solid phantom for both 5 MeV and 7 MeV beams. To determine the dose applied to the calibration films, an advanced Markus ionization chamber (PTW, Breisgau, Germany) was used. For the ionization chamber read-out, a PTW UNIDOS webline electrometer with 400 V polarization was used. The conversion of the ionization chamber signal to the absorbed dose follows the general TRS-398 [
26] formalism. For PDD FLASH measurements, films placed parallel to the beam axis in the PMMA phantom were irradiated with both 5 MeV and 7 MeV beams, with applicators A-d120 and A-d30 and a pulse width of 4
s. In addition, three films were irradiated for each energy–applicator combination in correspondence with the dose peak value depth (R100), 80% depth (R80), and 50% depth (R50). Twenty-four hours after the irradiation, the films were scanned using an Epson 800, 48-bit color scanner, and the dose maps were analyzed with FilmQA Pro software [
25], with triple-channel and reference dose protocols.
2.3. Monte-Carlo Dose Simulations
Experimental measurements were compared with simulations obtained by means of the MC software 2020.0.10 FLUKA version [
27,
28]. In particular, the accelerator beam optics from the titanium window (at the end of the linac) to the end of the applicator was simulated.
As mentioned previously, the A-d30 and A-d120 applicators were chosen to validate the EF dosimetric proprieties according to the foreseen radio-biology experiments.
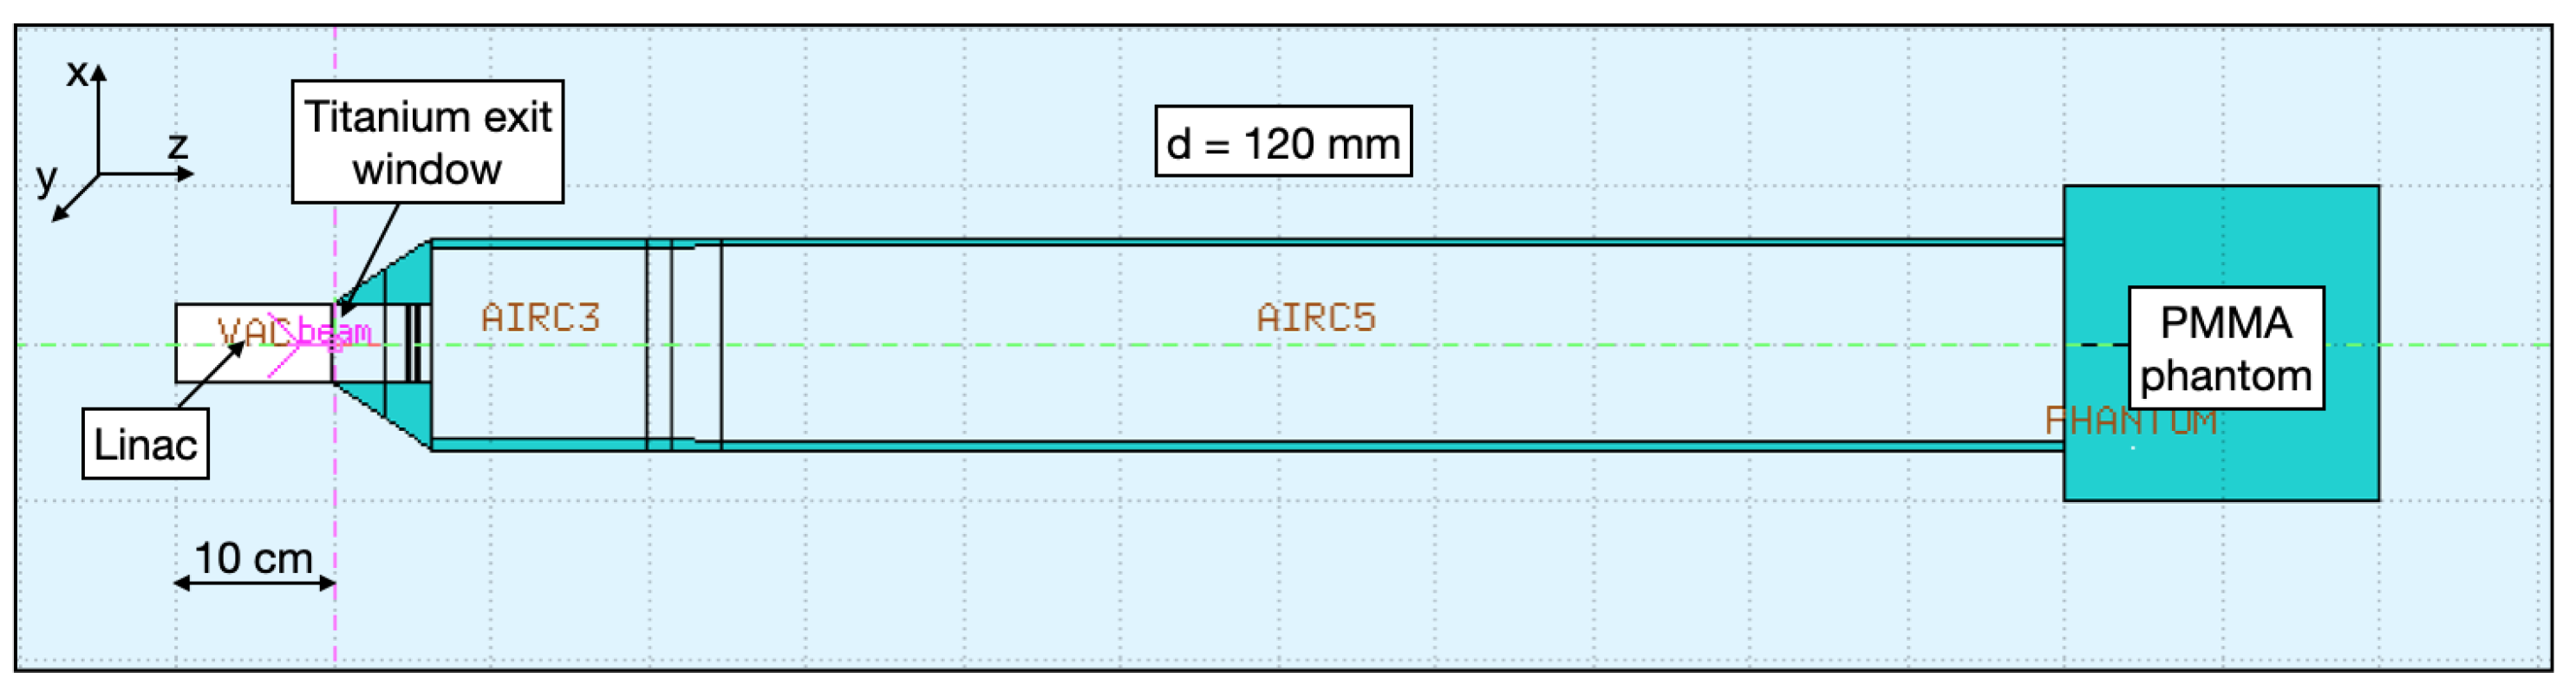
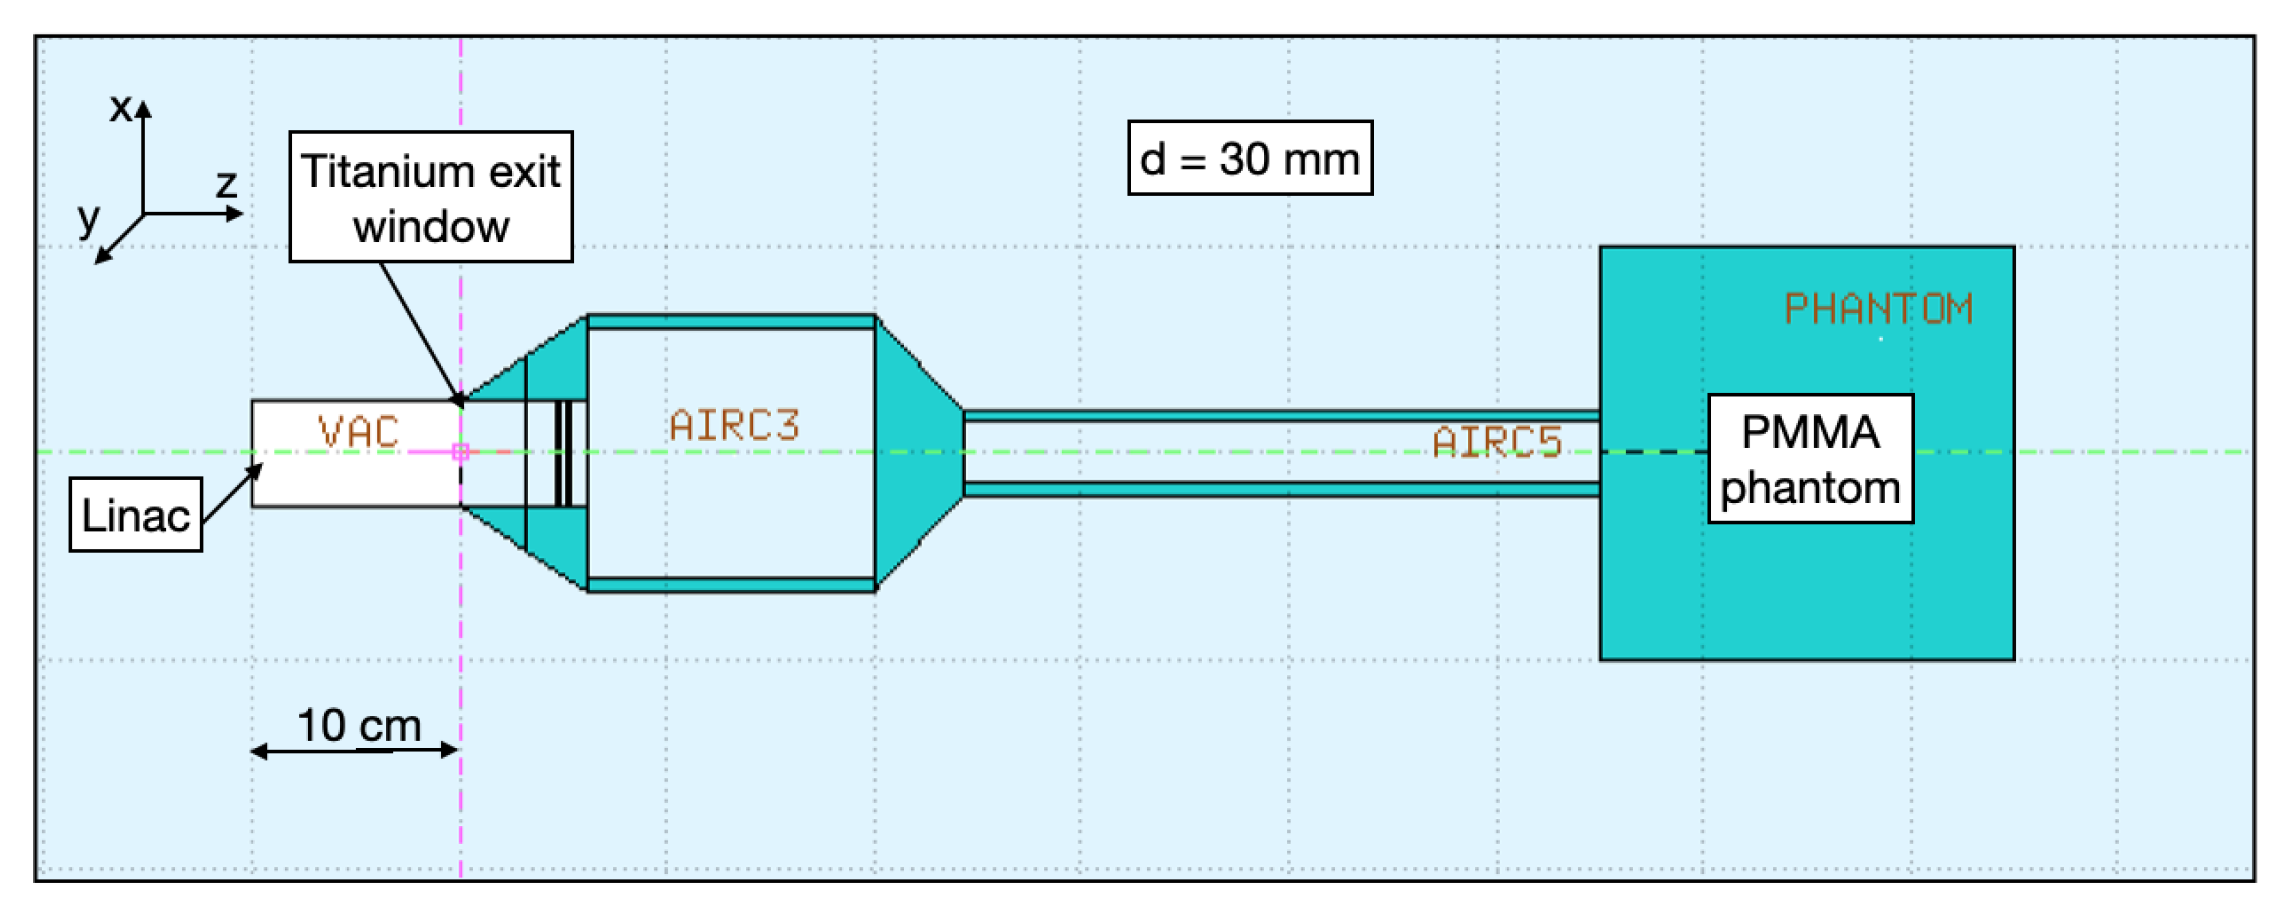
In the simulations, the electron beam exits from the linac and goes through a 55
m-thick titanium window that seals the linac vacuum. Depending on the applicator, the source-to-surface distances (SSDs) are 55 cm and 110 cm for the A-d30 and A-d120, respectively, (
Figure 2 and
Figure 3).
The A-d120 applicator was modeled as a series of three PMMA cylinders centered on the beam axis (z axis), with diameters of 50, 120, and 120.4 mm, a wall thickness of 5 mm and lengths of 62.6, 155.4, and 852.0 mm, and one truncated cone 30 mm long parallel to the z axis, with the larger and smaller circular base of 120.4 mm and 120 mm in diameter, respectively. The A-d30 applicator was modeled in the same way using three PMMA cylinders with diameters of 50 mm, 120 mm, and 30 mm, having 5 mm wall thickness and lengths of 62.6 mm, 155.4 mm, and 332.0 mm, and one truncated cone 43 mm long with the larger and smaller circular base of 120 mm and 30 mm diameter, respectively.
A PMMA phantom 40 × 40 × 40 cm3 was placed in both simulations at the exit of the applicator, according to the setup used for the experimental data acquisition.
The specification of the electron beam arriving on the titanium window was provided by the manufacturers and thus defined as a Gaussian distributed electron profile with full-width of half-maximum (FWHM) on the x and y planes of 3.4 mm and a negligible mean angular spread.
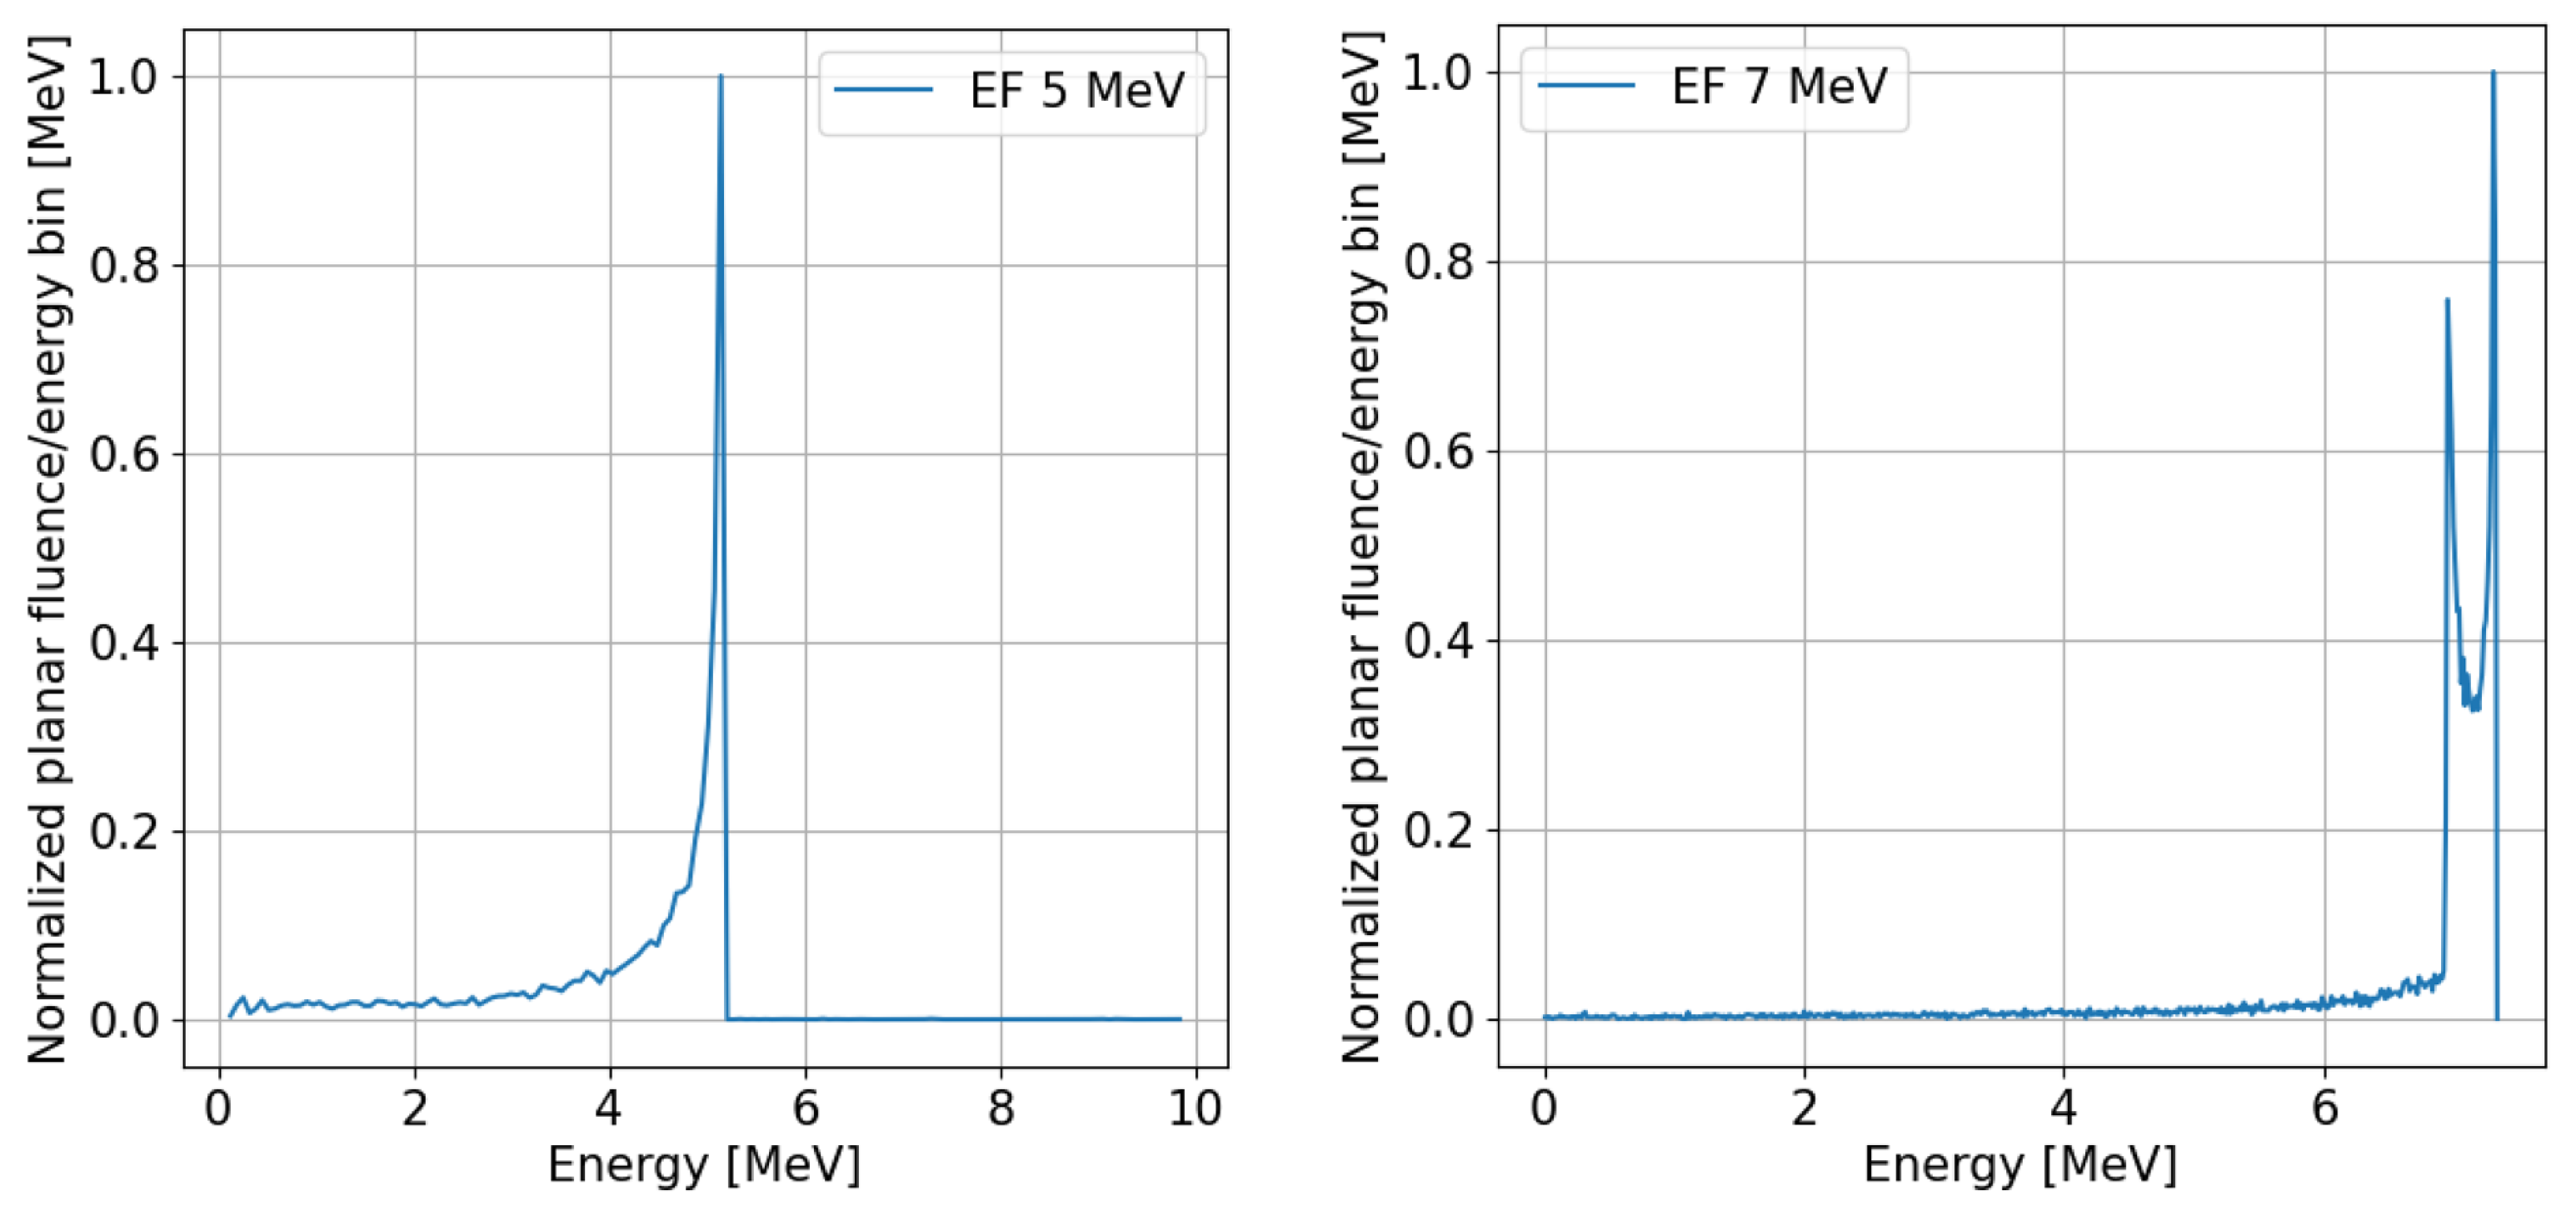
Figure 4 reports the energy distributions of EF electron beams at 5 MeV and 7 MeV. As shown in
Figure 4, two types of electron beam energy spectra are obtained, i.e., a single peak and a double peak case for the 5 MeV and 7 MeV, respectively. The difference between the two cases is due to the phasing between the electron bunch and the RF fields inside the linac. Since the RF field behaves as a cosine function in time and the bunch length is large compared to the RF wavelength, it is possible to have a situation in which the electrons experience two different stable points in terms of capture, at two different energies, for example, on the crest and slightly before or after. Nevertheless, these two points are so close in energy that no dosimetry change is expected between the single-peak and the double-peak cases. Indeed, we performed simulations with these types of beam spectra but no difference in the absorbed doses was appreciable between the two cases.
The energy cut-offs for the transport and production of both electrons and photons were set to EMFCUT = 10 keV (kinetic energy). Particles with an energy below this threshold are not transported further and their energy is locally deposited. The expected dose per electron was evaluated in the PMMA phantom. In order to score the energy deposition, the 40 × 40 × 20 cm3 phantom was divided into 201 × 201 × 200 voxels of size 2 × 2 × 1 mm3. In the next section, the results of the simulations are compared with measurements.
3. Results
3.1. Measurements of Dose Parameters
The results of dose measurements performed with gafchromic films at the R100 point using the previously applicators described (A-d30 and A-d120) at 5 MeV and 7 MeV with a maximum pulse width of 4
s, are reported in
Table 2. The uncertainty for the EBT-XD dose determination is ±5%. In all cases, the dose per pulse is above the FLASH threshold (>1 Gy). It is worth noting that the dose per pulse of A-d30 is higher than A-d120 by a factor of approximately 6, due to the reduced surface of irradiation and the shorter length of the applicator.
Table 3 reports the maximum instantaneous dose rate with a pulse duration of 4
s, and the average dose rate, calculated with the repetition frequency of 250 Hz. These dose rates, together with the dose per pulse, define the FLASH regime. We notice that the reference values of
Gy/s (instantaneous dose rate) and 100 Gy/s (average dose rate) are easily achieved with the A-d30 applicator normally used for in vivo experiments. In the case of the A-d120 applicator, the dose per pulse and the average dose rate fulfill the reference values adopted for FLASH, while the instantaneous dose is a bit lower than
Gy/s (it is
Gy/s at 7 MeV and
G/s at 5 Mev), nevertheless, in ref. [
7], it was shown that these values are sufficient to observe FLASH effects in radiobiological experiments.
Furthermore, by making use of the values of the charge in the pulse of 4
s measured with the Faraday cup, we also calculated the dose per nC (Gy/nC). These data are reported in
Table 4 for the same cases of
Table 2.
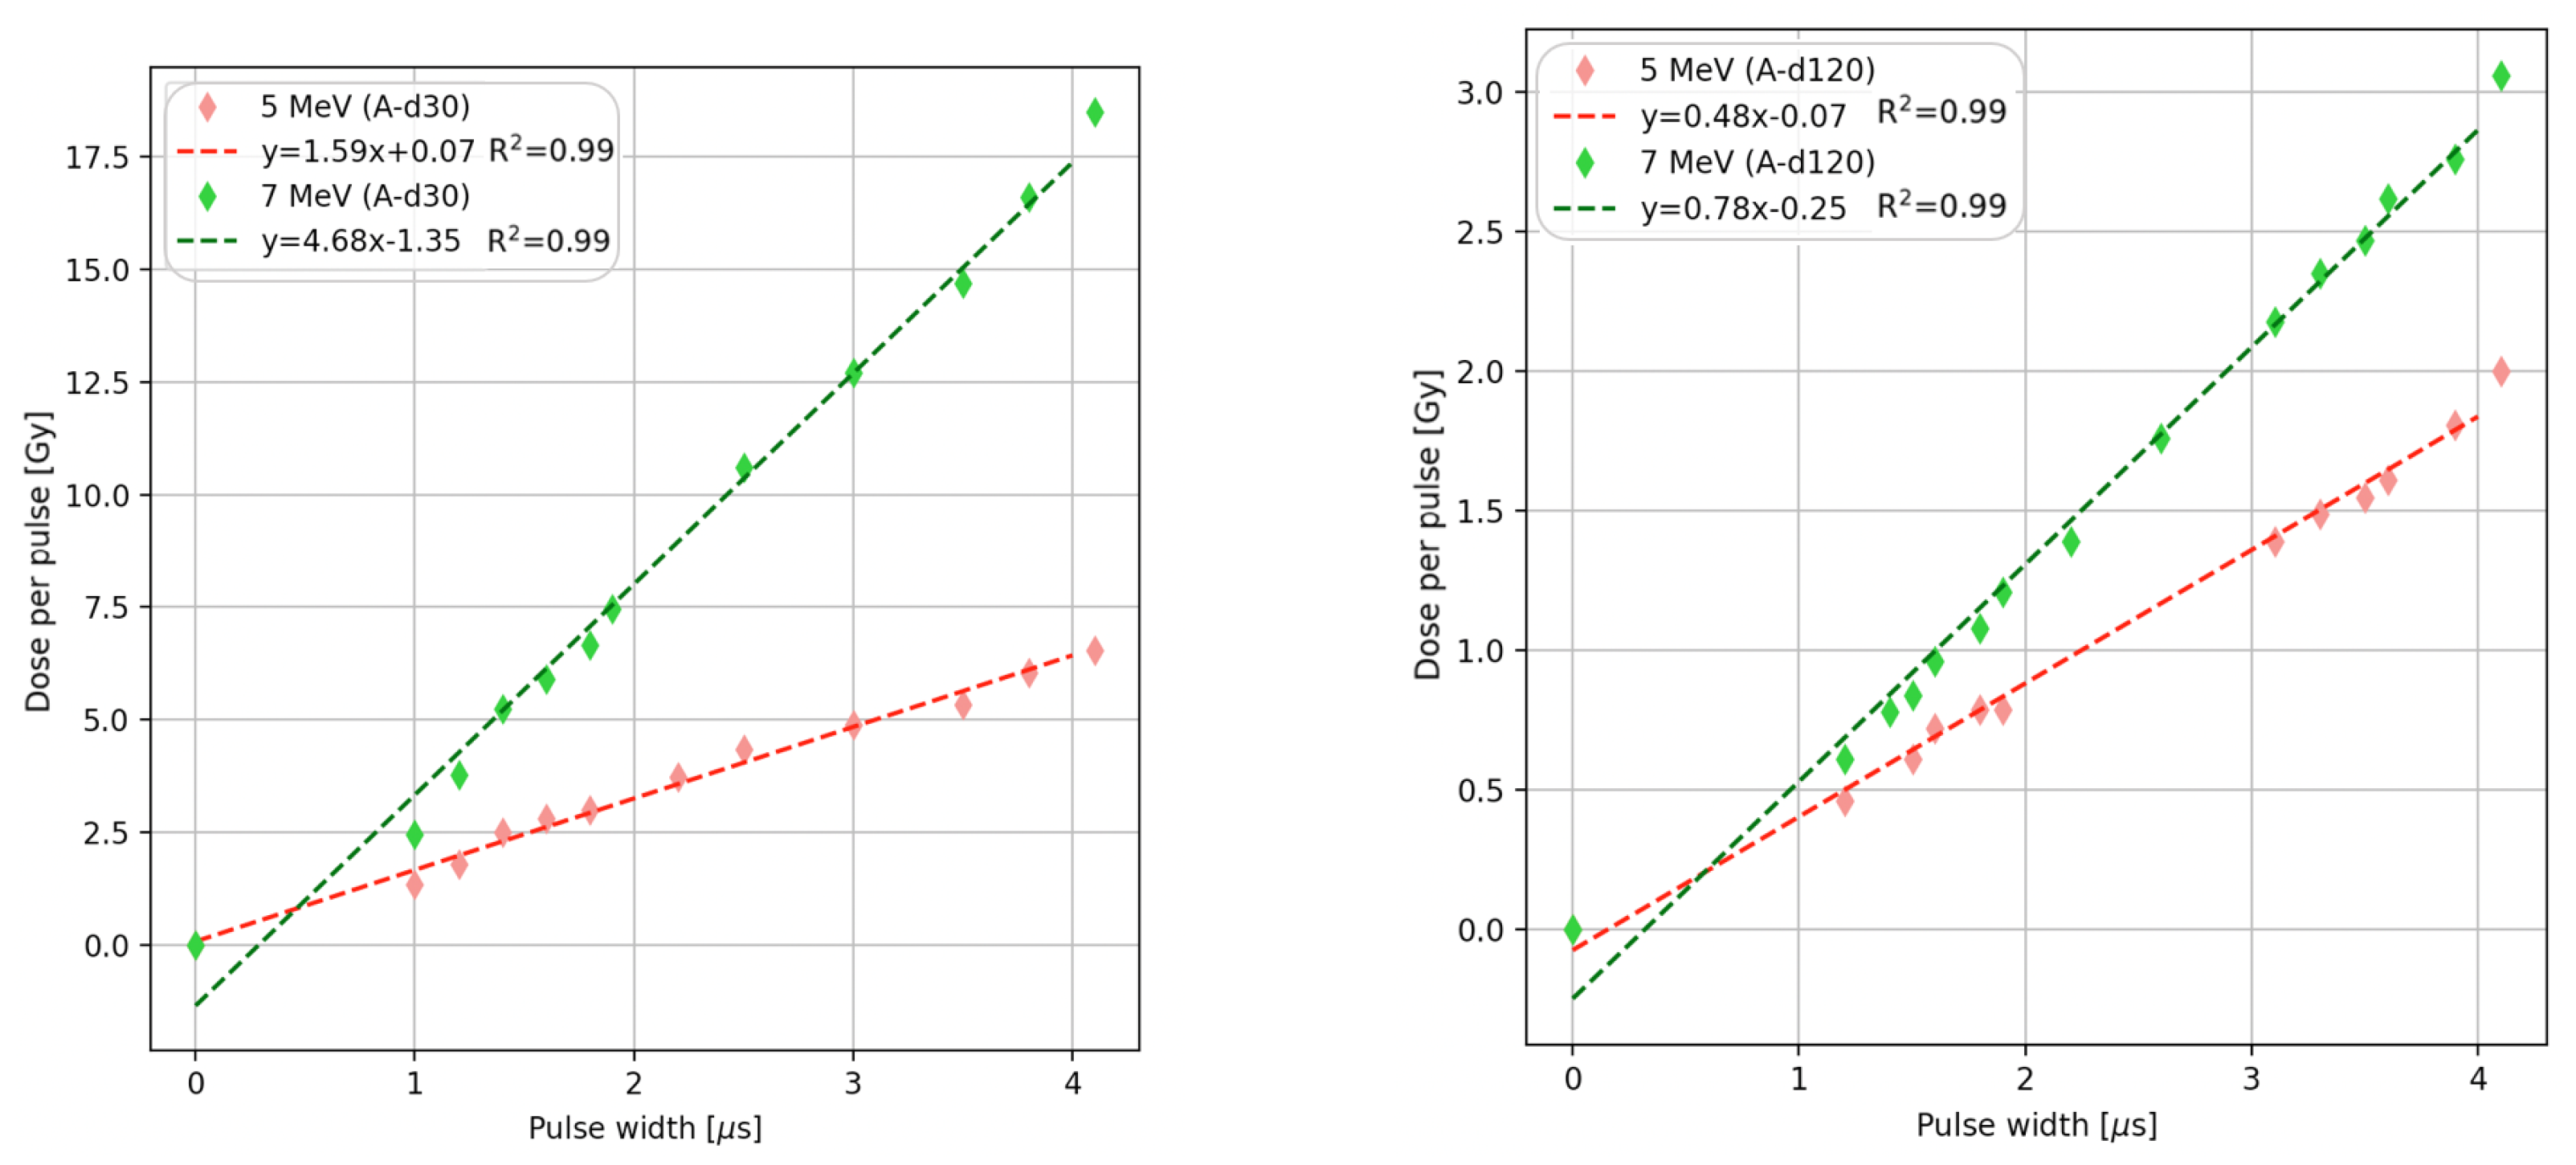
During the measurement campaign, we also investigated the dependence of the dose on the pulse width.
Figure 5 reports the results for applicators A-d30 and A-d120 and at the energies of 5 MeV and 7 MeV. The dose was measured with the EBT-XD films positioned on the top of the Faraday cup. R-squared analysis shows a linear relationship between the dose and the pulse width. We also observe that in the case of the A-d30 applicator, the delivered dose per pulse is >1 Gy in the entire range of measurement. Conversely, in the case of the A-d120, the dose only reaches the FLASH threshold for irradiation pulses larger than
s. In the case of 7 MeV, the linear fit extrapolation does not cross the zero value, suggesting the uncertainty of pulse widths <1
s, and of the corresponding charge in the pulse.
3.2. Measurements of the Percentage Depth Dose (PDD) Curve and of the Dose Profiles
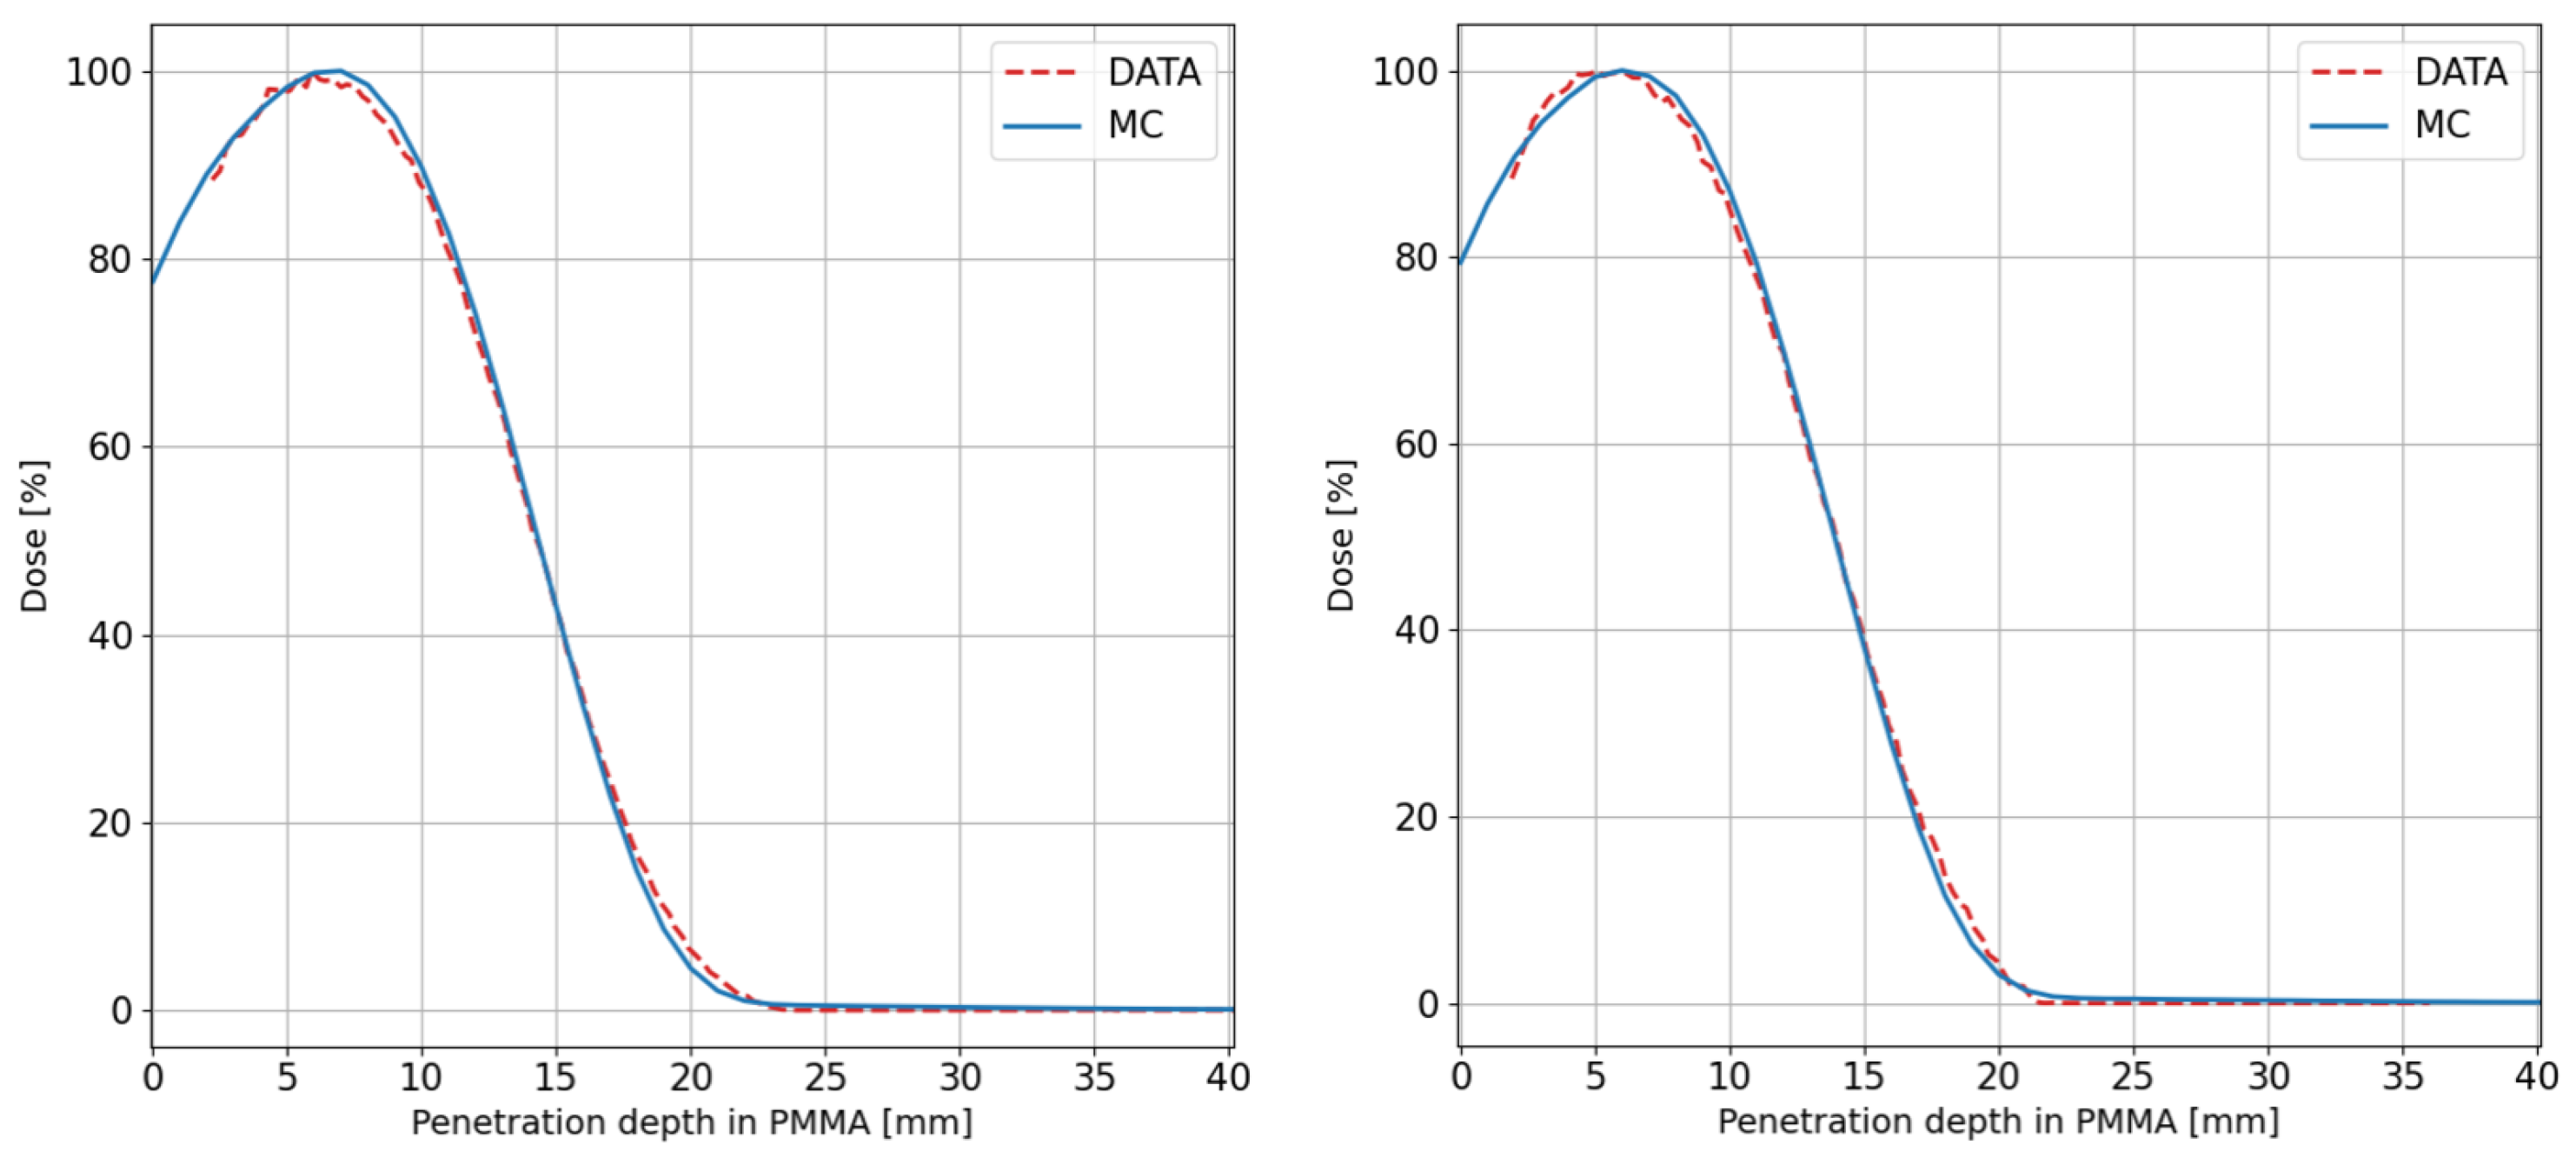
Figure 6 (red dots) reports the experimental data of PDD measured along the beam axis as a function of the depth in the PMMA phantom, for A-d30 and A-d120, and for electron beams with the energy of 5 MeV.
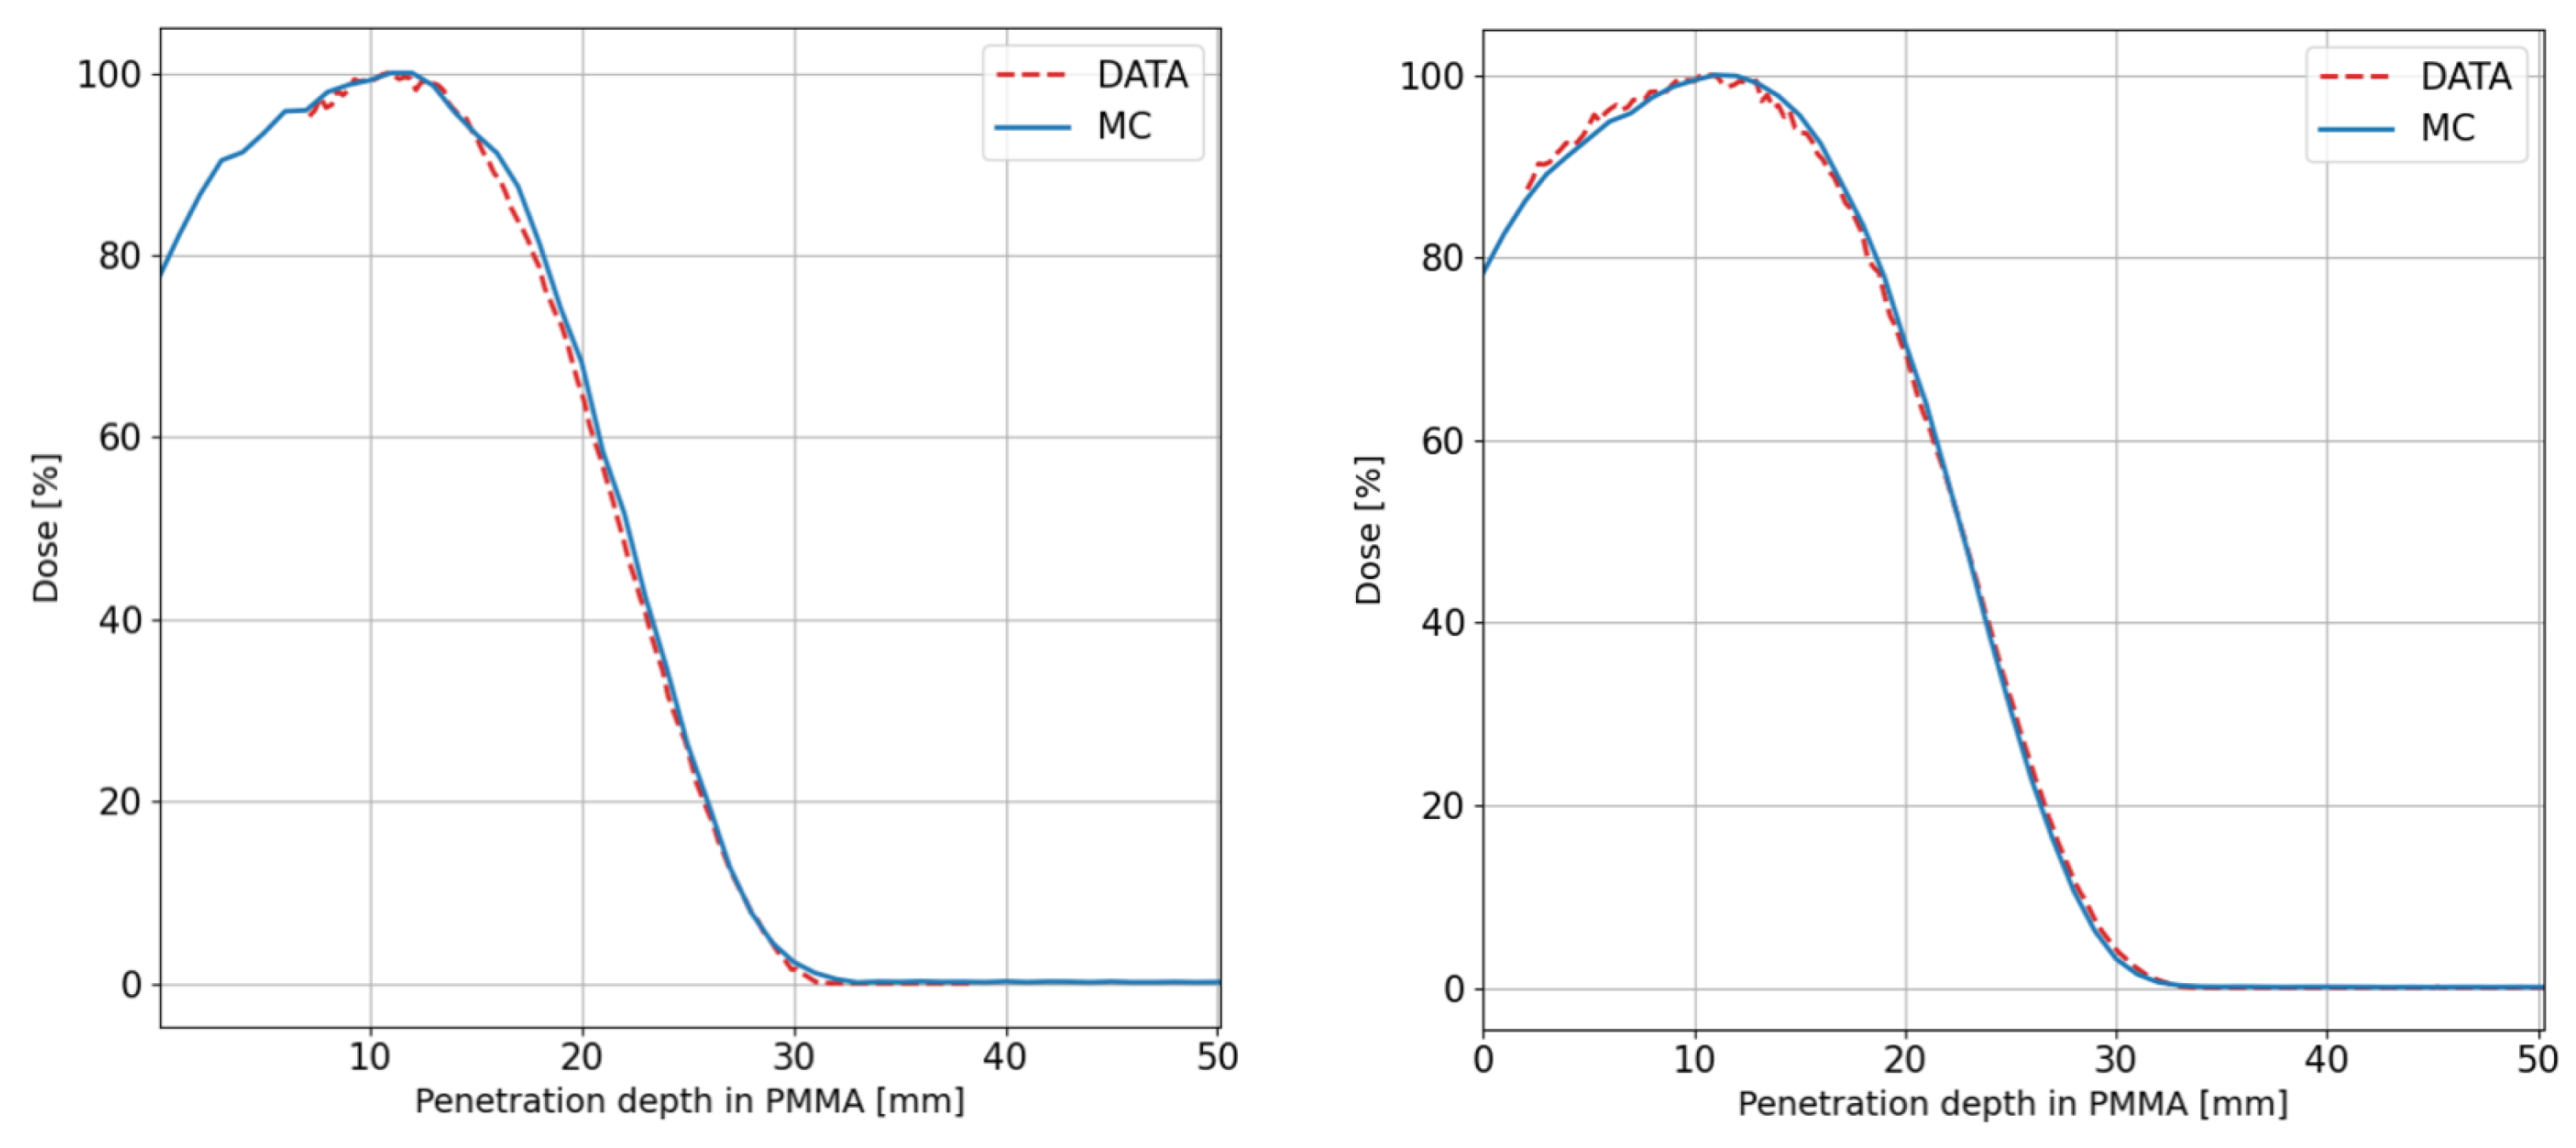
Figure 7 reports the data relative to the case of 7 MeV. Data concerning the depth–dose curves were normalized to their maximum value at a depth of 12 mm for the beam energy of 7 MeV and of 7 mm for the beam energy of 5 MeV.
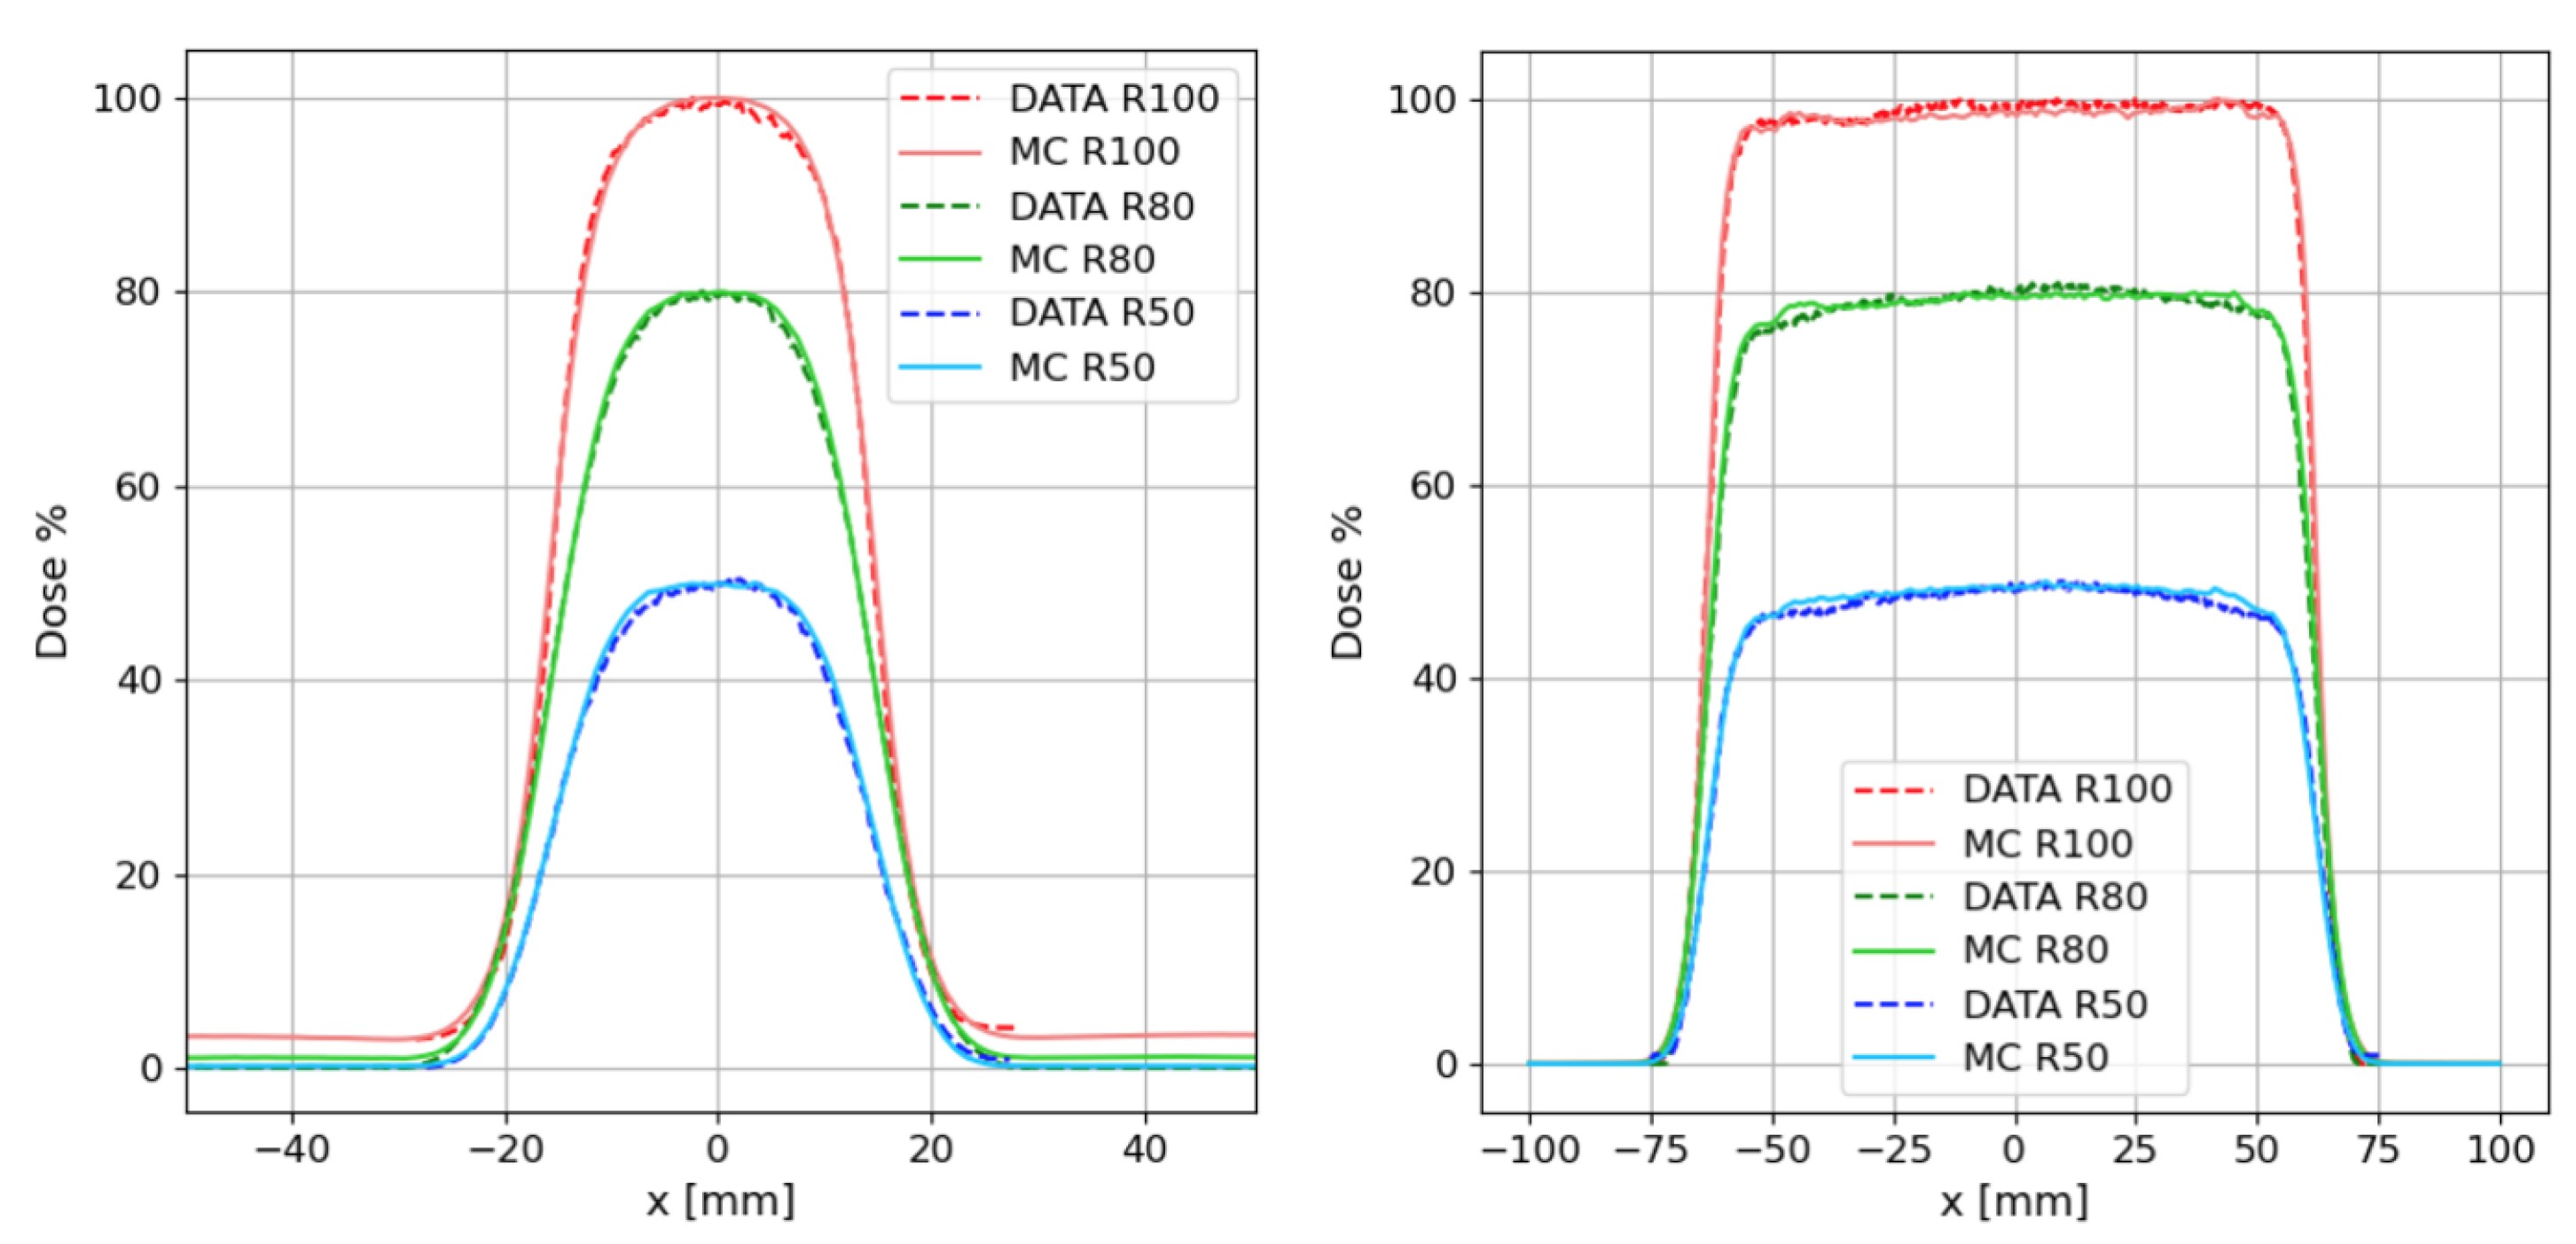
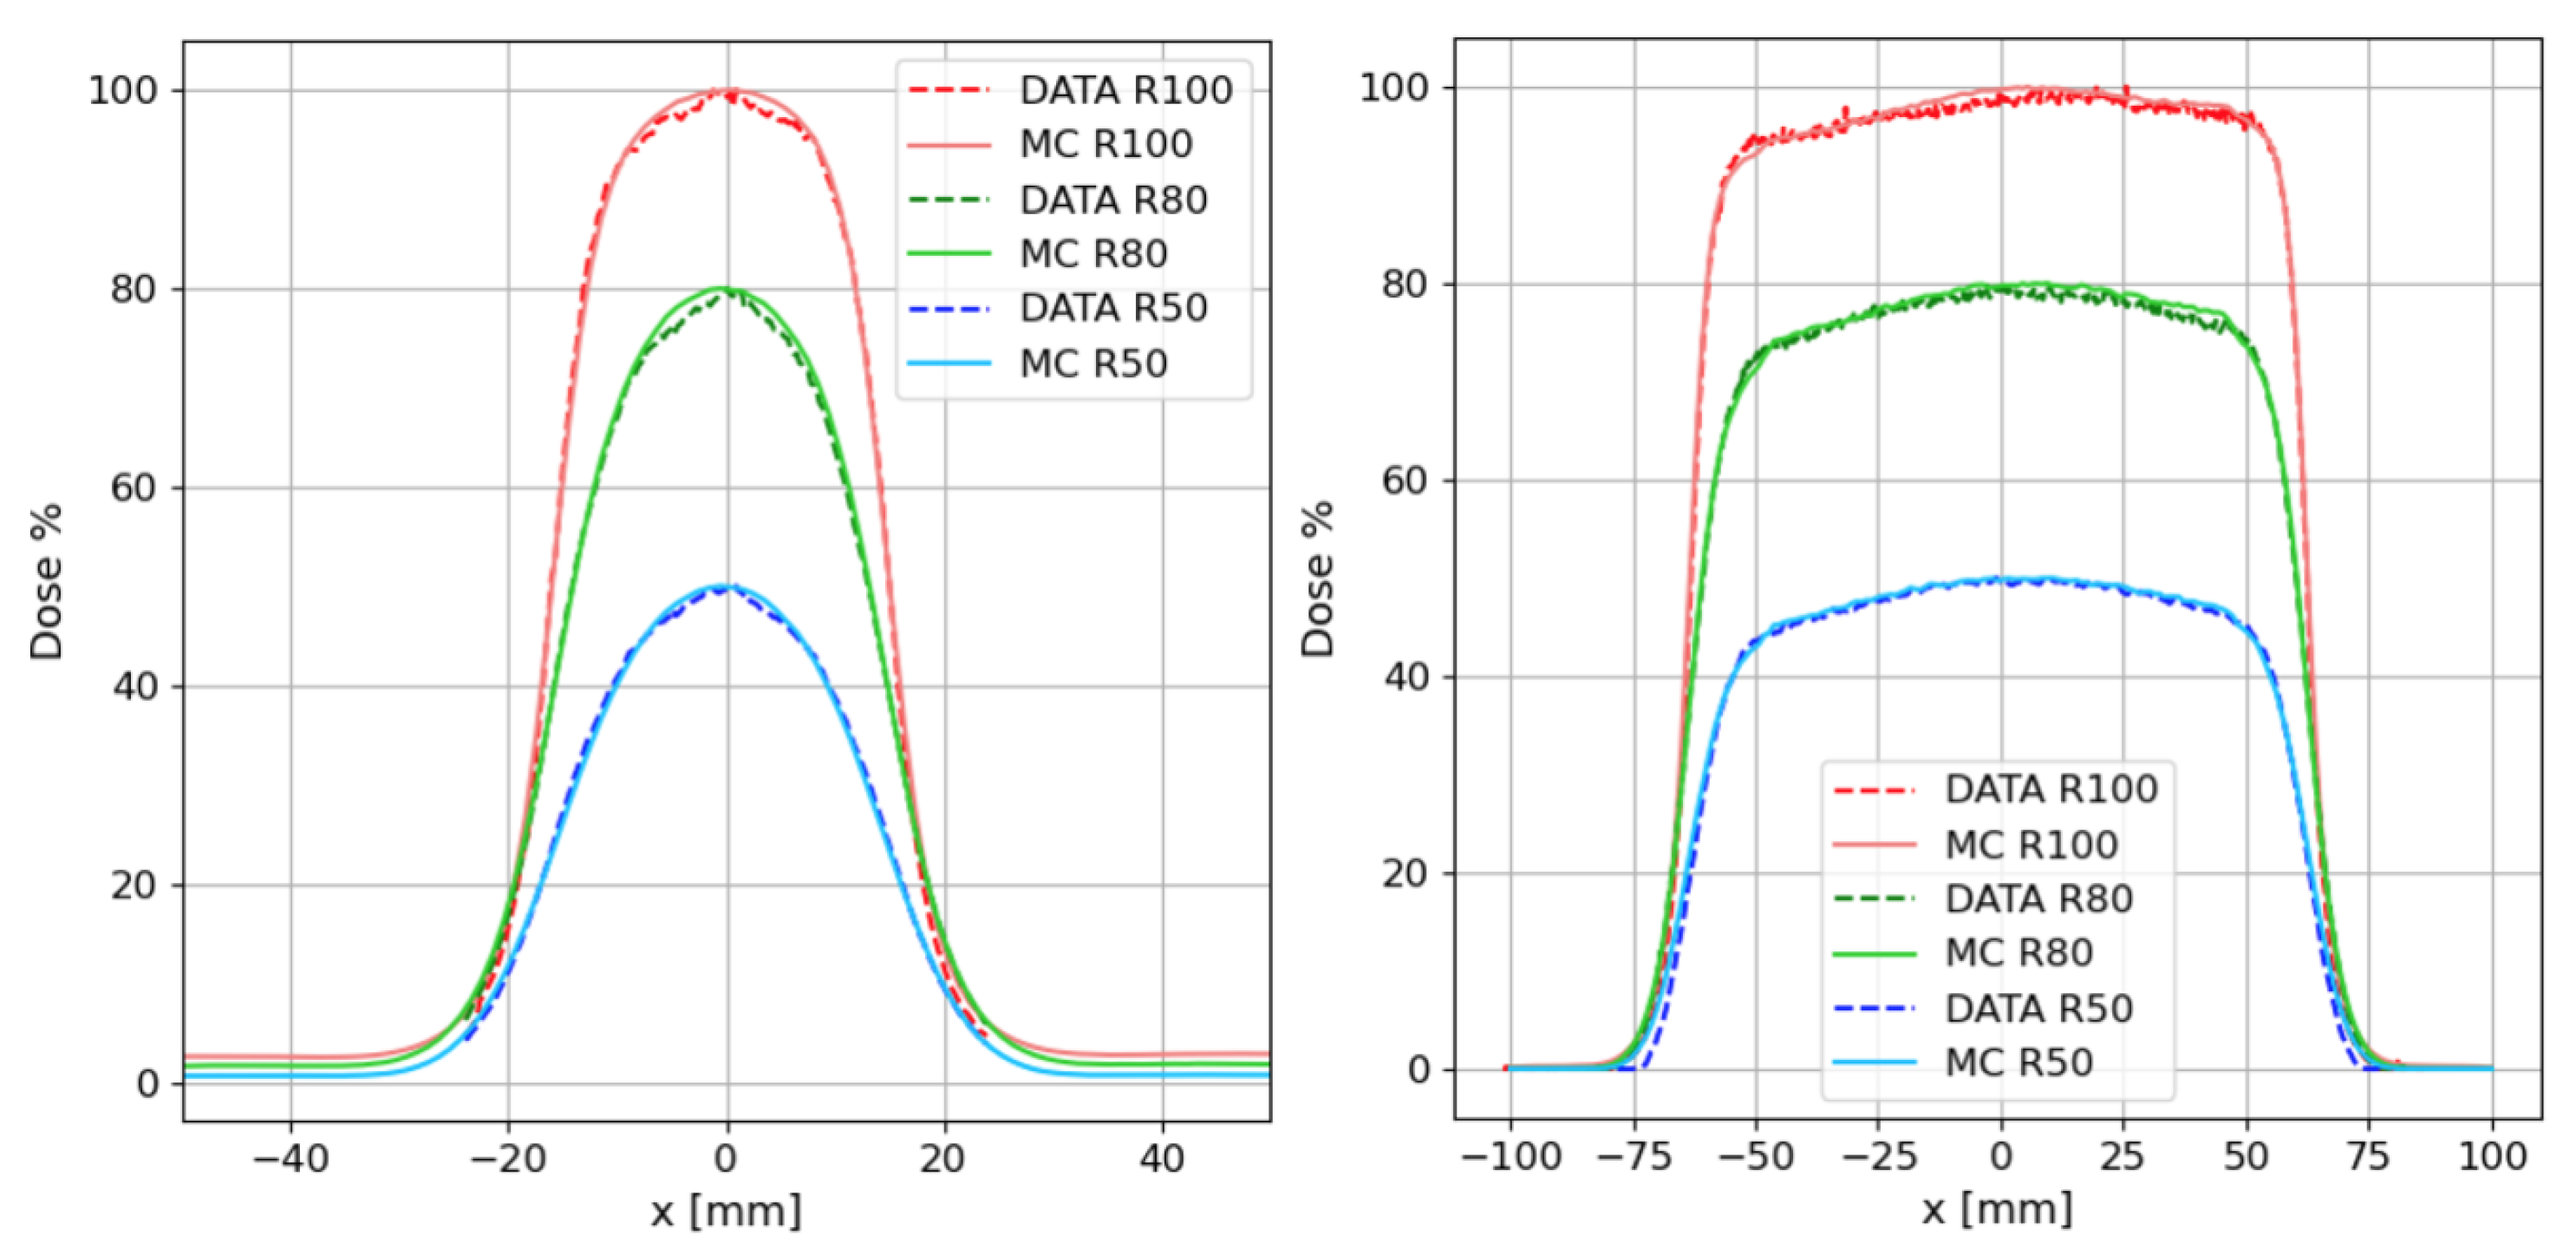
Starting from the data of the PDDs, the lateral dose profiles, at the points R100, R80, and R50, were obtained as shown in
Figure 8 and
Figure 9 for the energies and applicator cases considered in this analysis. The lateral dose profiles were investigated at 12 mm (R100), 17 mm (R80), and 21 mm (R50) depth for 7 MeV and at 7 mm (R100), 11 mm (R80), 14 mm (R50) depth for 5 MeV. The measured and simulated profiles were normalized to the maximum dose value. We observe a very good flatness over almost the entire field of radiation for A-d120. The flatness also remains fairly good for the case of A-d30.
Monte Carlo simulation results for PDDs and lateral dose profiles are shown for comparison on the same figures (
Figure 6,
Figure 7,
Figure 8 and
Figure 9) (continuous blue lines).
To evaluate the goodness of the agreement between the measured and simulated curves, a gamma index analysis [
30] was carried out. The best agreement was obtained with the minimum value of 3% 3 mm acceptance criteria, as reported in
Table 5 for PDD and in
Table 6 for transverse profiles.
4. Discussion
In this paper, we reported the methods and the results obtained in the characterization of the electron beam with the relative dose properties, used for the FLASH radiobiological experiments at the Institut Curie. For this purpose, the ElectronFlash Linac was used. The linac, operating at 5 and 7 MeV, can irradiate in conventional and FLASH modalities, by changing the pulse width, the pulse repetition frequency, and the number of pulses. Thanks to the PMMA applicators, it was possible to irradiate different field sizes with an extremely homogeneous beam spot. This is very important for the irradiation of animals (mice) and cells in culture. Because of the high dose per pulse and high dose rate, it was necessary to use an energy-independent and dose-rate-independent dosimeter to measure the depth–dose curves and beam profiles. To this end, EBT-XD Gafchromic films have been used. A beam monitoring system based on a Faraday cup was used to measure the total charge per pulse at the end of the applicators. The results of charge measurements were related to the absorbed dose at the applicator exit for several values of the pulse widths.
The dose per pulse was changed by varying the applicator diameter between 30 mm and 120 mm or by modifying the time pulse width for the same applicator. The dose delivered downstream the PMMA applicator A-d120 was 3 Gy/pulse at the energy of 7 MeV, corresponding to a UHDR of 0.75 Gy/s, and 2 Gy/pulse at 5 MeV, corresponding to a UHDR of approximately 0.5 Gy/s. With the PMMA A-d30, the dose was 19 Gy/pulse, corresponding to a UHDR of approximately 5 Gy/s at 7 MeV, and 12.3 Gy/pulse, corresponding to 3.07 Gy/s at 5 MeV. Therefore, with the applicator A-d30, we are always in the FLASH regime (>1 Gy/pulse) with one single pulse and time duration between s and s. For the applicator A-d120, we are in the FLASH regime with a pulse width between s and s.
As a consequence, the beam parameters are definitively suitable for the investigation of the mechanism underlying the FLASH effect for in vivo and in vitro experiments. The field radiation sizes and the electron beam penetration make the system suitable to perform total body irradiation of small animals (e.g., mice), or the superficial irradiation of cell cultures. Finally, the comparisons between Monte-Carlo simulations with the PDD and dose profile measurements showed a very good agreement with more than of the curve points under the chosen thresholds 3% 3 mm.
5. Conclusions
In this experimental study, we report the main results of the electron pulse and dose parameter characterization performed for the radiobiological experiments at Institut Curie with ElectronFlash linac at 5 MeV and 7 MeV, in conventional and in FLASH modality. The measurements were performed at the linac exit in FLASH mode, showed a maximum pulse peak current of 120 mA at 7 MeV and 108 mA at 5 MeV, while the values of the currents almost halved with the PMMA applicators. The expected linear relationship between the delivered dose and the pulse time width was confirmed by measurements. All the measured dose values complied with the FLASH parameters usually adopted by the radiobiology research community. One of the aims of this article was to compare PDD and dose profiles measured with the Gafcromic films with MC simulations. Comparisons between the experimental measurements of PDD and dose profiles, and Monte-Carlo simulations showed good agreement using the Gamma index analysis. The results show that the system can provide UHDR irradiation satisfying the FLASH requirements with very good performance in terms of the beam profile flatness for any size of the fields. The measurements have shown the reliability of the system in terms of electron beams and dose parameters, which allow for stability and reputability in pre-clinical radiobiological experiments at Institut Curie (Orsay, France).
Author Contributions
Conceptualization, L.P., V.F. and S.H.; Methodology, L.G. and A.P.; Software, G.F. (Gaia Franciosini), F.G. and M.P.; Formal analysis, L.G., V.F., A.P. and S.H.; Investigation, L.G. and L.A.; Data curation, G.F. (Gaia Franciosini); Writing—original draft, L.P., L.G. and M.M.; Writing—review & editing, L.P., M.M, L.F., A.P., L.G., and S.H.; Visualization, G.F. (Giuseppe Felici) and A.M.; Supervision, A.P. and S.H.; Funding acquisition, M.D. All authors have read and agreed to the published version of the manuscript.
Funding
This research received no external funding.
Institutional Review Board Statement
Not applicable.
Informed Consent Statement
Not applicable.
Data Availability Statement
Not applicable.
Conflicts of Interest
The authors declare no conflict of interest.
References
- Berry, R.J.; Hall, E.; Forster, D.; Storr, T.; Goodman, M. Survival of mammalian cells exposed to X rays at ultra-high dose-rates. Br. J. Radiol. 1969, 42, 102–107. [Google Scholar] [CrossRef] [PubMed]
- Field, S.B.; Bewley, D.K. Effects of dose-rate on the radiation response of rat skin. Int. J. Radiat. Biol. Relat. Stud. Phys. Chem. Med. 1974, 26, 259–267. [Google Scholar] [CrossRef] [PubMed]
- Inada, T.; Nishio, H.; Amino, S.; Abe, K.; Saito, K. High Dose-rate Dependence of Early Skin Reaction in Mouse. Int. J. Radiat. Biol. Relat. Stud. Phys. Chem. Med. 1980, 38, 139–145. [Google Scholar] [CrossRef] [PubMed]
- Hendry, J.; Moore, J.V.H.; Hodgson, B.W.; Keene, J.P. The constant low oxygen concentration in all the target cells for mouse tail radionecrosis. Radiat. Res. 1982, 92, 172–189. [Google Scholar] [CrossRef]
- Favaudon, V.; Caplier, L.; Monceau, V.; Pouzoulet, F.; Sayarath, M.; Fouillade, C.; Poupon, M.-F.; Brito, I.; Hupé, P.; Bourhis, J.; et al. Ultrahigh dose-rate FLASH irradiation increases the differential response between normal and tumor tissue in mice. Sci. Transl. Med. 2014, 6, 245ra93. [Google Scholar] [CrossRef]
- Vozenin, M.-C.; Fornel, P.D.; Petersson, K.; Favaudon, V.; Jaccard, M.; Germond, J.-F.; Petit, B.; Burki, M.; Ferrand, G.; Patin, D.; et al. The advantage of FLASH radiotherapy confirmed in mini-pig and cat cancer patients. Clin. Cancer. Res. 2018, 25, 35–42. [Google Scholar] [CrossRef] [Green Version]
- Montay-Gruel, P.; Petersson, K.; Jaccard, M.; Boivin, G.; Germond, J.; Petit, B.; Doenlen, R.; Favaudon, V.; Bochud, F.; Bailat, C.; et al. Irradiation in a FLASH: Unique sparing of memory in mice after whole brain irradiation with dose rates above 100 Gy/s. Radiother. Oncol. 2017, 124, 365–369. [Google Scholar] [CrossRef]
- Bourhis, J.; Sozzi, W.J.; Jorge, P.G.; Gaide, O.; Bailat, C.; Duclos, F.; Patin, D.; Ozsahin, M.; Bochud, F.; Germond, J.; et al. Treatment of a first patient with FLASH-radiotherapy. Radiother. Oncol. 2019, 139, 18–22. [Google Scholar] [CrossRef]
- Wilson, J.; Hammond, E.; Higgins, G.; Petersson, K. Ultra-High Dose Rate (FLASH) Radiotherapy: Silver Bullet or Fool’s Gold? Front. Oncol. 2020, 9, 1563. [Google Scholar] [CrossRef] [Green Version]
- Friedl, A.; Prise, K.M.; Butterworth, K.T.; Montay-Gruel, P.; Favaudon, V. Radiobiology of the FLASH effect. Med. Phys. 2022, 49, 1993–2013. [Google Scholar] [CrossRef]
- Jaccard, M.; Durán, M.T.; Petersson, K.; Germond, J.; Liger, P.; Vozenin, M.; Bourhis, J.; Bochud, F.; Bailat, C. High dose-per-pulse electron beam dosimetry: Commissioning of the Oriatron eRT6 prototype linear accelerator for preclinical use. Med. Phys. 2018, 45, 863–874. [Google Scholar] [CrossRef] [PubMed]
- Moeckli, R.; Jorge, P.G.; Grilj, V.; Oesterle, R.; Cherbuin, N.; Bourhis, J.; Vozenin, M.; Germond, J.; Bochud, F.; Bailat, C. Commissioning of an ultra-high dose rate pulsed electron beam medical LINAC for FLASH RT preclinical animal experiments and future clinical human protocols. Med. Phys. 2021, 48, 3134–3139. [Google Scholar] [CrossRef] [PubMed]
- Lempart, M.; Blad, B.; Adrian, G.; Bäck, S.; Knöös, T.; Ceberg, C.; Petersson, K. Modifying a clinical linear accelerator for delivery of ultra-high dose rate irradiation. Radiother. Oncol. 2019, 139, 40–45. [Google Scholar] [CrossRef] [PubMed]
- Schüler, E.; Trovati, S.; King, G.; Lartey, F.; Rafat, M.; Villegas, M.; Praxel, A.J.; Loo, B.W., Jr.; Maxim, P.G. Experimental platform for ultra-high dose rate FLASH irradiation of small animals using a clinical linear accelerator. Int. J. Radiat. Oncol. Biol. Phys. 2017, 97, 195–203. [Google Scholar] [CrossRef] [PubMed]
- Berne, A.; Petersson, K.; Tullis, I.D.; Newman, R.G.; Vojnovic, B. Monitoring electron energies during FLASH irradiations. Phys. Med. Biol. 2021, 66, 045015. [Google Scholar] [CrossRef]
- Lansonneur, P.; Favaudon, V.; Heinrich, S.; Fouillade, C.; Verrelle, P.; De Marzi, L. Simulation and experimental validation of a prototype electron beam linear accelerator for preclinical studies. Phys. Medica 2019, 60, 50–57. [Google Scholar] [CrossRef]
- Martino, F.D.; Barca, P.; Barone, S.; Bortoli, E.; Borgheresi, R.; Stefano, S.D.; Francesco, M.D.; Faillace, L.; Giuliano, L.; Grasso, L.; et al. FLASH Radiotherapy With Electrons: Issues Related to the Production, Monitoring, and Dosimetric Characterization of the Beam. Front. Phys. 2020, 8, 481. [Google Scholar] [CrossRef]
- Faillace, L.; Barone, S.; Battistoni, G.; Francesco, M.D.; Felici, G.; Ficcadenti, L.; Franciosini, G.; Galante, F.; Giuliano, L.; Grasso, L.; et al. Compact S-band linear accelerator system for ultrafast, ultrahigh dose-rate radiotherapy. Phys. Rev. Accel. Beams 2021, 24, 050102. [Google Scholar] [CrossRef]
- S-band Magnetron Company. Available online: https://www.teledyne-e2v.com (accessed on 30 December 2022).
- Tursucu, A. Albedo factor determination of some selected 3d alloy samples. Appl. Radiat. Isot. 2021, 169, 109505. [Google Scholar]
- Hu, J.B.; Rovey, J. Faraday cup with nanosecond response and adjustable impedance for fast electron beam characterization. Rev. Sci. Instruments 2011, 82, 073504. [Google Scholar] [CrossRef]
- Richter, C.; Karsch, L.; Dammene, Y.; Kraft, S.D.; Metzkes, J.; Schramm, U.; Schürer, M.; Sobiella, M.; Weber, A.; Zeil, K.; et al. A dosimetric system for quantitative cell irradiation experiments with laser-accelerated protons. Phys. Med. Biol. 2011, 56, 1529–1543. [Google Scholar] [CrossRef] [PubMed]
- Prokůpek, J.; Kaufman, J.; Margarone, D.; Krůs, M.; Velyhan, A.; Krása, J.; Burris-Mog, T.; Busold, S.; Deppert, O.; Cowan, T.E.; et al. Development and first experimental tests of Faraday cup array. Rev. Sci. Instruments 2014, 85, 013302. [Google Scholar] [CrossRef]
- Favaudon, V.; Lentz, J.M.; Heinrich, S.; Patriarca, A.; de Marzi, L.; Fouillade, C.; Dutreix, M. Time-resolved dosimetry of pulsed electron beams in very high dose-rate, FLASH irradiation for preclinical studies. Nucl. Instruments Methods Phys. Res. Sect. A Accel. Spectrometers Detect. Assoc. Equip. 2019, 944, 162537. [Google Scholar] [CrossRef]
- Available online: www.gafchromic.com (accessed on 30 December 2022).
- Andreo, P.; Burns, D.T.; Hohlfeld, K.; Huq, M.S.; Kanai, T.; Laitano, F.; Smyth, V.; Vynckier, S.P.; Andreo, D.; Burns, K.H.; et al. IAEA TRS-398—Absorbed Dose Determination in External Beam Radiotherapy: An International Code of Practice for Dosimetry Based on Standards of Absorbed Dose to Water; IAEA: Vienna, Austria, 2020; ISSN 1011-4289. [Google Scholar]
- Ferrari, A.; Sala, P.R.; Fasso, A.; Ranft, J. FLUKA: A Multi-Particle Transport Code (Program version 2005); CERN-2005-010: Geneva, Switzerland; SLAC-R-773: California, CA, USA; INFN-TC-05-11: Rome, Italy, 2005. [Google Scholar]
- Battistoni, G.; Bauer, J.; Boehlen, T.T.; Cerutti, F.; Chin, M.P.W.; Augusto, R.D.S.; Ferrari, A.; Ortega, P.G.; Kozłowska, W.; Magro, G.; et al. The FLUKA Code: An Accurate Simulation Tool for Particle Therapy. Front. Oncol. 2016, 6, 116. [Google Scholar] [CrossRef] [Green Version]
- Young, L.M. Los Alamos National Laboratory Report No. LA-UR-96-1835; Los Alamos National Laboratory: Los Alamos, NM, USA, 1996.
- Low, D.A.; Harms, W.B.; Mutic, S.; Purdy, J.A. A technique for the quantitative evaluation of dose distributions. Med. Phys. 1998, 25, 50. [Google Scholar] [CrossRef] [PubMed]
Figure 1.
Typical time structure of electron beam parameters.
Figure 1.
Typical time structure of electron beam parameters.
Figure 2.
Two-dimensional visualization of FLUKA simulation geometry used for the A-d120 simulation. The beam travels in the z direction.
Figure 2.
Two-dimensional visualization of FLUKA simulation geometry used for the A-d120 simulation. The beam travels in the z direction.
Figure 3.
Two-dimensional visualization of FLUKA simulation geometry used for the A-d120 simulation. The beam travels in the z direction.
Figure 3.
Two-dimensional visualization of FLUKA simulation geometry used for the A-d120 simulation. The beam travels in the z direction.
Figure 4.
EF at 5 MeV (
left) and 7 MeV (
right) normalized planar fluence out of the linac. The energy bin width is 50 keV. The two energy spectra were obtained using the TSTEP code, a derivative of Parmela, for beam dynamics simulation [
29].
Figure 4.
EF at 5 MeV (
left) and 7 MeV (
right) normalized planar fluence out of the linac. The energy bin width is 50 keV. The two energy spectra were obtained using the TSTEP code, a derivative of Parmela, for beam dynamics simulation [
29].
Figure 5.
Dose per pulse measurements with film at the end of the A-d30 (left) and A-d120 (right), for 5 MeV electron beam (red) and 7 MeV (green), as a function of the pulse width. The dashed lines show the linear fit.
Figure 5.
Dose per pulse measurements with film at the end of the A-d30 (left) and A-d120 (right), for 5 MeV electron beam (red) and 7 MeV (green), as a function of the pulse width. The dashed lines show the linear fit.
Figure 6.
Measured (dotted red line) and simulated (continuous blue line) PDD in the PMMA phantom obtained for the 5 MeV electron beam collimated with the A-d30 (left) and A-d120 (right) applicators.
Figure 6.
Measured (dotted red line) and simulated (continuous blue line) PDD in the PMMA phantom obtained for the 5 MeV electron beam collimated with the A-d30 (left) and A-d120 (right) applicators.
Figure 7.
Measured (dotted red line) and simulated (continuous blue line) PDD in PMMA phantom obtained for the 7 MeV electrons beam collimated with the A-d30 (left) and A-d120 (right) applicators.
Figure 7.
Measured (dotted red line) and simulated (continuous blue line) PDD in PMMA phantom obtained for the 7 MeV electrons beam collimated with the A-d30 (left) and A-d120 (right) applicators.
Figure 8.
Measured (dotted line) and simulated (continuous line) transverse profile in the PMMA phantom obtained for the 5 MeV electrons beam collimated with the A-d30 (left) and A-d120 (right) applicators. The figures show the profiles obtained at 7 mm (R100), 11 mm (R80), and 14 mm (R50) depth.
Figure 8.
Measured (dotted line) and simulated (continuous line) transverse profile in the PMMA phantom obtained for the 5 MeV electrons beam collimated with the A-d30 (left) and A-d120 (right) applicators. The figures show the profiles obtained at 7 mm (R100), 11 mm (R80), and 14 mm (R50) depth.
Figure 9.
Measured (dotted line) and simulated (continuous line) transverse profile in the PMMA phantom obtained for the 7 MeV electrons beam collimated with the A-d30 (left) and A-d120 (right) applicators. The figures show the profiles obtained at 12 mm (R100), 17 mm (R80), and 21 mm (R50) depth.
Figure 9.
Measured (dotted line) and simulated (continuous line) transverse profile in the PMMA phantom obtained for the 7 MeV electrons beam collimated with the A-d30 (left) and A-d120 (right) applicators. The figures show the profiles obtained at 12 mm (R100), 17 mm (R80), and 21 mm (R50) depth.
Table 1.
Main features of ElectronFLASH.
Table 1.
Main features of ElectronFLASH.
| Parameters | Value |
|---|
| Output energy | 5 or 7 MeV |
| Pulse repetition frequency | 1–250 Hz |
| Pulse width | 0.5–4 s |
| Maximum peak beam current 7 MeV | 120 mA |
| Maximum peak beam current 5 MeV | 108 mA |
Table 2.
Dose per pulse measurements with film (uncertainty of 5%), obtained with different applicators for a 4 pulse duration of s at energies at 5 MeV and 7 MeV.
Table 2.
Dose per pulse measurements with film (uncertainty of 5%), obtained with different applicators for a 4 pulse duration of s at energies at 5 MeV and 7 MeV.
| Applicator Size ø(mm) | 7 MeV Dose per Pulse (Gy) | 5 MeV Dose per Pulse (Gy) |
|---|
| 120 | 3 | 2 |
| 30 | 19 | 12.3 |
Table 3.
Dose rate measurements with the film (uncertainty of 5%), obtained with different applicators for a pulse duration of 4 s at energies of 5 MeV and 7 MeV.
Table 3.
Dose rate measurements with the film (uncertainty of 5%), obtained with different applicators for a pulse duration of 4 s at energies of 5 MeV and 7 MeV.
| Applicator Size ø(mm) | Instantaneous Dose Rate (Gy/s) | Average Dose Rate (Gy/s) |
|---|
| 120 at 7 MeV | 0.75 | 750 |
| 120 at 5 MeV | 0.5 | 500 |
| 30 at 7 MeV | 4.75 | 4750 |
| 30 at 5 MeV | 3.07 | 3075 |
Table 4.
Summary of film and Faraday cup measurements. Beam size: A-d30 ( mm) and A-d120 ( mm); the dose per pulse is calculated on film with an uncertainty of 5%. The charge measurements were performed using a Faraday cup. The table shows the dose per pulse in Gy/nC, obtained with different applicators for a pulse duration of 4 s.
| Applicator Size ø(mm) | 7 MeV (Gy/nC) | 5 MeV (Gy/nC) |
|---|
| 120 | 0.012 | 0.014 |
| 30 | 0.08 | 0.11 |
Table 5.
Gamma index analysis for PDD, performed with 3% 3 mm threshold.
Table 5.
Gamma index analysis for PDD, performed with 3% 3 mm threshold.
| Irradiation Settings | PDD Index |
|---|
| A-d120 at 7 MeV | 95.68% |
| A-d120 at 5 MeV | 99.00% |
| A-d30 at 7 MeV | 98.67% |
| A-d30 at 5 MeV | 97.01% |
Table 6.
Gamma index analysis for transverse dose profiles at R100, R80, and R50, performed with 3% 3 mm threshold.
Table 6.
Gamma index analysis for transverse dose profiles at R100, R80, and R50, performed with 3% 3 mm threshold.
| Irradiation Settings | R100 -Index | R80 -Index | R50 -Index |
|---|
| A-d120 at 7 MeV | 99.00% | 100% | 96.29% |
| A-d120 at 5 MeV | 95.00% | 95.57% | 95.00% |
| A-d30 at 7 MeV | 98.40% | 99.60 % | 99.60% |
| A-d30 at 5 MeV | 96.01% | 100% | 96.41% |
| Disclaimer/Publisher’s Note: The statements, opinions and data contained in all publications are solely those of the individual author(s) and contributor(s) and not of MDPI and/or the editor(s). MDPI and/or the editor(s) disclaim responsibility for any injury to people or property resulting from any ideas, methods, instructions or products referred to in the content. |
© 2023 by the authors. Licensee MDPI, Basel, Switzerland. This article is an open access article distributed under the terms and conditions of the Creative Commons Attribution (CC BY) license (https://creativecommons.org/licenses/by/4.0/).

 ,
, 


