
Match Movement Profiles Differences in Spanish Soccer Competitive Leagues According to Opposition’s Team Ranking: A Comparison Study


 , , and
Abstract
:1. Introduction
2. Materials and Methods
2.1. Procedure and Variables
2.2. Statistical Analysis
3. Results
4. Discussion
4.1. Study Limitations and Future Prospects
4.2. Practical Applications
5. Conclusions
Author Contributions
Funding
Institutional Review Board Statement
Informed Consent Statement
Data Availability Statement
Conflicts of Interest
References
- O’Donoghue, P.; Holmes, L. Data Analysis in Sport, 1st ed.; Routledge: London, UK, 2014; ISBN 9781317810384. [Google Scholar]
- Fernandez-Navarro, J.; Fradua, L.; Zubillaga, A.; McRobert, A.P. Influence of contextual variables on styles of play in soccer. Int. J. Perform. Anal. Sport 2018, 18, 423–436. [Google Scholar] [CrossRef]
- Lago-Peñas, C. The influence of match location, quality of opposition, and match status on possession strategies in professional association football. J. Sports Sci. 2009, 27, 1463–1469. [Google Scholar] [CrossRef] [PubMed]
- Castellano, J.; Blanco-Villaseñor, A.; Álvarez, D. Contextual variables and time-motion analysis in soccer. Int. J. Sports Med. 2011, 32, 415–421. [Google Scholar] [CrossRef] [PubMed] [Green Version]
- García-Unanue, J.; Pérez-Gómez, J.; Giménez, J.V.; Felipe, J.L.; Gómez-Pomares, S.; Gallardo, L.; Sánchez-Sánchez, J. Influence of contextual variables and the pressure to keep category on physical match performance in soccer players. PLoS ONE 2018, 13, e0204256. [Google Scholar] [CrossRef]
- Kalapotharakos, V.; Gkaros, A.; Vassliades, E.; Manthou, E. Influence of contextual factors on match running performance in elite soccer team. J. Phys. Educ. Sport 2020, 20, 3267–3272. [Google Scholar]
- Ugalde-Ramírez, A. Physical activities according to playing positions, match outcome, and halves during the 2018 Soccer World Cup. J. Phys. Educ. Sport 2020, 20, 3635–3641. [Google Scholar]
- Torres-Ronda, L.; Beanland, E.; Whitehead, S.; Sweeting, A.; Clubb, J. Tracking systems in team sports: A narrative review of applications of the data and sport specific analysis. Sports Med.-Open 2022, 8, 15. [Google Scholar] [CrossRef]
- den Hollander, S.; Jones, B.; Lambert, M.; Hendricks, S. The what and how of video analysis research in rugby union: A critical review. Sports Med. Open 2018, 4, 27. [Google Scholar] [CrossRef]
- Liu, H.; Hopkins, W.; Gómez, M.A.; Molinuevo, J.S. Inter-operator reliability of live football match statistics from OPTA Sportsdata. Int. J. Perform. Anal. Sport 2013, 13, 803–821. [Google Scholar] [CrossRef] [Green Version]
- Sarmento, H.; Marcelino, R.; Anguera, M.T.; CampaniÇo, J.; Matos, N.; LeitÃo, J.C. Match analysis in football: A systematic review. J. Sports Sci. 2014, 32, 1831–1843. [Google Scholar] [CrossRef] [Green Version]
- Torres-Ronda, L.; Schelling, X. Critical process for the implementation of technology in sport organizations. Strength Cond J. 2017, 39, 54–59. [Google Scholar] [CrossRef]
- Sarmento, H.; Anguera, M.T.; Pereira, A.; Araújo, D. Talent identification and development in male football: A systematic review. Sports Med. 2018, 48, 907–931. [Google Scholar] [CrossRef] [PubMed]
- Zhou, C.; Zhang, S.; Lorenzo Calvo, A.; Cui, Y. Chinese soccer association Super League, 2012–2017: Key performance indicators in balance games. Int. J. Perform. Anal. Sport 2018, 18, 645–656. [Google Scholar] [CrossRef]
- O’Donoghue, P. Normative profiles of sports performance. Int. J. Perform. Anal. Sport 2005, 5, 104–119. [Google Scholar] [CrossRef]
- Harrop, K.; Nevill, A. Performance indicators that predict success in an English Professional League One soccer team. Int. J. Perform. Anal. Sport 2014, 14, 907–920. [Google Scholar] [CrossRef]
- Vigne, G.; Dellal, A.; Gaudino, C.; Chamari, K.; Rogowski, I.; Alloatti, G.; del Wong, P.; Owen, A.; Hautier, C. Physical outcome in a successful Italian Serie A soccer team over three consecutive seasons. J. Strength Cond Res. 2013, 27, 1400–1406. [Google Scholar] [CrossRef] [PubMed]
- Ponce-Bordón, J.C.; García-Calvo, T.; Candela-Guardiola, J.M.; Serpiello, F.R.; del Campo, R.L.; Resta, R.; Pulido, J.J. The relationship between running distance and coaches’ perception of team performance in professional soccer player during multiple seasons. Sci. Rep. 2022, 12, 1454. [Google Scholar] [CrossRef] [PubMed]
- Oliva Lozano, J.M.; Rago, V.; Fortes, V.; Muyor, J.M. Impact of match-related contextual variables on weekly training load in a professional soccer team: A full season study. Biol. Sport 2022, 39, 125–134. [Google Scholar] [CrossRef]
- Lago-Peñas, C.; Casais, L.; Dominguez, E.; Sampaio, J. The effects of situational variables on distance covered at various speeds in elite soccer. Eur. J. Sport Sci. 2010, 10, 103–109. [Google Scholar] [CrossRef]
- Rampinini, E.; Coutts, A.; Castagna, C.; Sassi, R.; Impellizzeri, F. Variation in top level soccer match performance. Int. J. Sports Med. 2007, 28, 1018–1024. [Google Scholar] [CrossRef] [Green Version]
- Aquino, R.; Martins, G.; Vieira, L.H.P.; Menezes, R.P. Influence of match location, quality of opponents, and match status on movement patterns in Brazilian professional football players. J. Strength Cond Res. 2017, 31, 2155–2161. [Google Scholar] [CrossRef] [PubMed]
- Folgado, H.; Duarte, R.; Fernandes, O.; Sampaio, J. Competing with lower level opponents decreases intra-team movement synchronization and time-motion demands during pre-season soccer matches. PLoS ONE 2014, 9, e97145. [Google Scholar] [CrossRef] [PubMed]
- Nobari, H.; Ramachandran, A.; Oliveira, R. The influence of opponent level on professional soccer players’ training and match performance assessed by using wearable sensor technology. Hum. Mov. 2022, 24, 1–10. [Google Scholar] [CrossRef]
- Aquino, R.; Gonçalves, L.G.; Galgaro, M.; Maria, T.S.; Rostaiser, E.; Pastor, A.; Nobari, H.; Garcia, G.R.; Moraes-Neto, M.V.; Nakamura, F.Y. Match running performance in Brazilian professional soccer players: Comparisons between successful and unsuccessful teams. BMC Sports Sci. Med. Rehabil. 2021, 13, 93. [Google Scholar] [CrossRef]
- Paraskevas, G.; Smilios, I.; Hadjicharalambous, M. Effect of opposition quality and match location on the positional demands of the 4-2-3-1 formation in elite soccer. J. Exerc. Sci. Fit. 2020, 18, 40–45. [Google Scholar] [CrossRef]
- Mohr, M.; Krustrup, P.; Bangsbo, J. Match performance of high-standard soccer players with special reference to development of fatigue. J. Sports Sci. 2003, 21, 519–528. [Google Scholar] [CrossRef] [Green Version]
- Bradley, P.; Carling, C.; Gomez Diaz, A.; Hood, P.; Barnes, C.; Ade, J.; Boddy, M.; Krustrup, P.; Mohr, M. Match performance and physical capacity of players in the top three competitive standards of English professional soccer. Hum. Mov. Sci. 2013, 32, 808–821. [Google Scholar] [CrossRef]
- Asian-Clemente, J.A.; Requena, B.; Jukic, I.; Nayler, J.; Santalla-Hernández, A.; Carling, C. Is physical performance a differentiating element between more or less successful football teams? Sports 2019, 7, 216. [Google Scholar] [CrossRef] [Green Version]
- Castellano, J.; Casamichana, D. What are the differences between First and Second Divisions of Spanish football teams? Int. J. Perform. Anal. Sport 2015, 15, 135–146. [Google Scholar] [CrossRef]
- Rampinini, E.; Martin, M.; Bosio, A.; Donghi, F.; Carlomagno, D.; Riggio, M.; Coutts, A.J. Impact of COVID-19 lockdown on professional soccer players’ match physical activities. Sci. Med. Footb. 2021, 5, 44–52. [Google Scholar] [CrossRef]
- Pons, E.; García-Calvo, T.; Cos, F.; Resta, R.; Blanco, H.; López del Campo, R.; Díaz-García, J. Integrating video tracking and GPS to quantify accelerations and decelerations in elite soccer. Sci. Rep. 2021, 11, 18531. [Google Scholar] [CrossRef] [PubMed]
- Pons, E.; García-Calvo, T.; Resta, R.; Blanco, H.; López del Campo, R.; Díaz García, J.; Pulido, J.J. A comparison of a GPS device and a multi-camera video technology during official soccer matches: Agreement between Systems. PLoS ONE 2019, 14, e0220729. [Google Scholar] [CrossRef] [PubMed]
- Brito de Souza, D.; López-Del Campo, R.; Blanco-Pita, H.; Resta, R.; del Coso, J. Association of match running performance with and without ball possession to football performance. Int. J. Perform. Anal. Sport 2020, 20, 483–494. [Google Scholar] [CrossRef]
- Yang, G.; Leicht, A.S.; Lago, C.; Gómez, M.Á. Key team physical and technical performance indicators indicative of team quality in the soccer Chinese Super League. Res. Sports Med. 2018, 26, 158–167. [Google Scholar] [CrossRef] [PubMed]
- R-Studio Team. RStudio: Integrated Development for R; R-Studio Team: Boston, MA, USA, 2020. [Google Scholar]
- Bates, D.; Machler, M.; Bolker, B.; Walker, S. Fitting Linear Mixed-Effects Models using Lme4. J. Stat. Softw. 2015, 67, 1–48. [Google Scholar] [CrossRef]
- Heck, R.H.; Thomas, S.L. An Introduction to Multilevel Modeling Techniques: MLM and SEM Approaches Using Mplus; Routledge: London, UK, 2015. [Google Scholar]
- Akaike, H. A new look at the statistical model identification. IEEE Trans. Automat. Control 1974, 19, 716–723. [Google Scholar] [CrossRef]
- Field, A. Discovering Statistics Using IBM SPSS Statistics, 4th ed.; SAGE Editorial: New York, NY, USA, 2013. [Google Scholar]
- Nakagawa, S.; Schielzeth, H. A general and simple method for obtaining R2 from Generalized Linear Mixed-Effects Models. Methods Ecol. Evol. 2013, 4, 133–142. [Google Scholar] [CrossRef]
- Ponce-Bordón, J.C.; Díaz-García, J.; López-Gajardo, M.A.; Lobo-Triviño, D.; López del Campo, R.; Resta, R.; García-Calvo, T. The influence of time winning and time losing on position-specific match physical demands in the top one Spanish Soccer League. Sensors 2021, 21, 6843. [Google Scholar] [CrossRef]
- Gomez-Piqueras, P.; Gonzalez-Villora, S.; Castellano, J.; Teoldo, I. Relation between the physical demands and success in professional soccer players. J. Hum. Sport Exerc. 2019, 14, 1–11. [Google Scholar] [CrossRef] [Green Version]
- Sæterbakken, A.; Haug, V.; Fransson, D.; Grendstad, H.N.; Gundersen, H.S.; Moe, V.F.; Ylvisaker, E.; Shaw, M.; Riiser, A.; Andersen, V. Match running performance on three different competitive standards in Norwegian soccer. Sports Med. Int. Open 2019, 3, 82–88. [Google Scholar] [CrossRef]
- Pons, E.; Ponce-Bordón, J.C.; Díaz-García, J.; del Campo, R.L.; Resta, R.; Peirau, X.; García-Calvo, T. A longitudinal exploration of match running performance during a football match in the Spanish La Liga: A four-season study. Int. J. Environ Res. Public Health 2021, 18, 1133. [Google Scholar] [CrossRef] [PubMed]
- Bradley, P.S.; Archer, D.T.; Hogg, B.; Schuth, G.; Bush, M.; Carling, C.; Barnes, C. Tier-specific evolution of match performance characteristics in the English Premier League: It’s getting tougher at the Top. J. Sports Sci. 2016, 34, 980–987. [Google Scholar] [CrossRef] [PubMed]


| L1 | Between-Groups Differences | |||||||||
|---|---|---|---|---|---|---|---|---|---|---|
| MB1 | MB2 | MB3 | MB4 | MB5 | MB1 | MB2 | MB3 | MB4 | MB5 | |
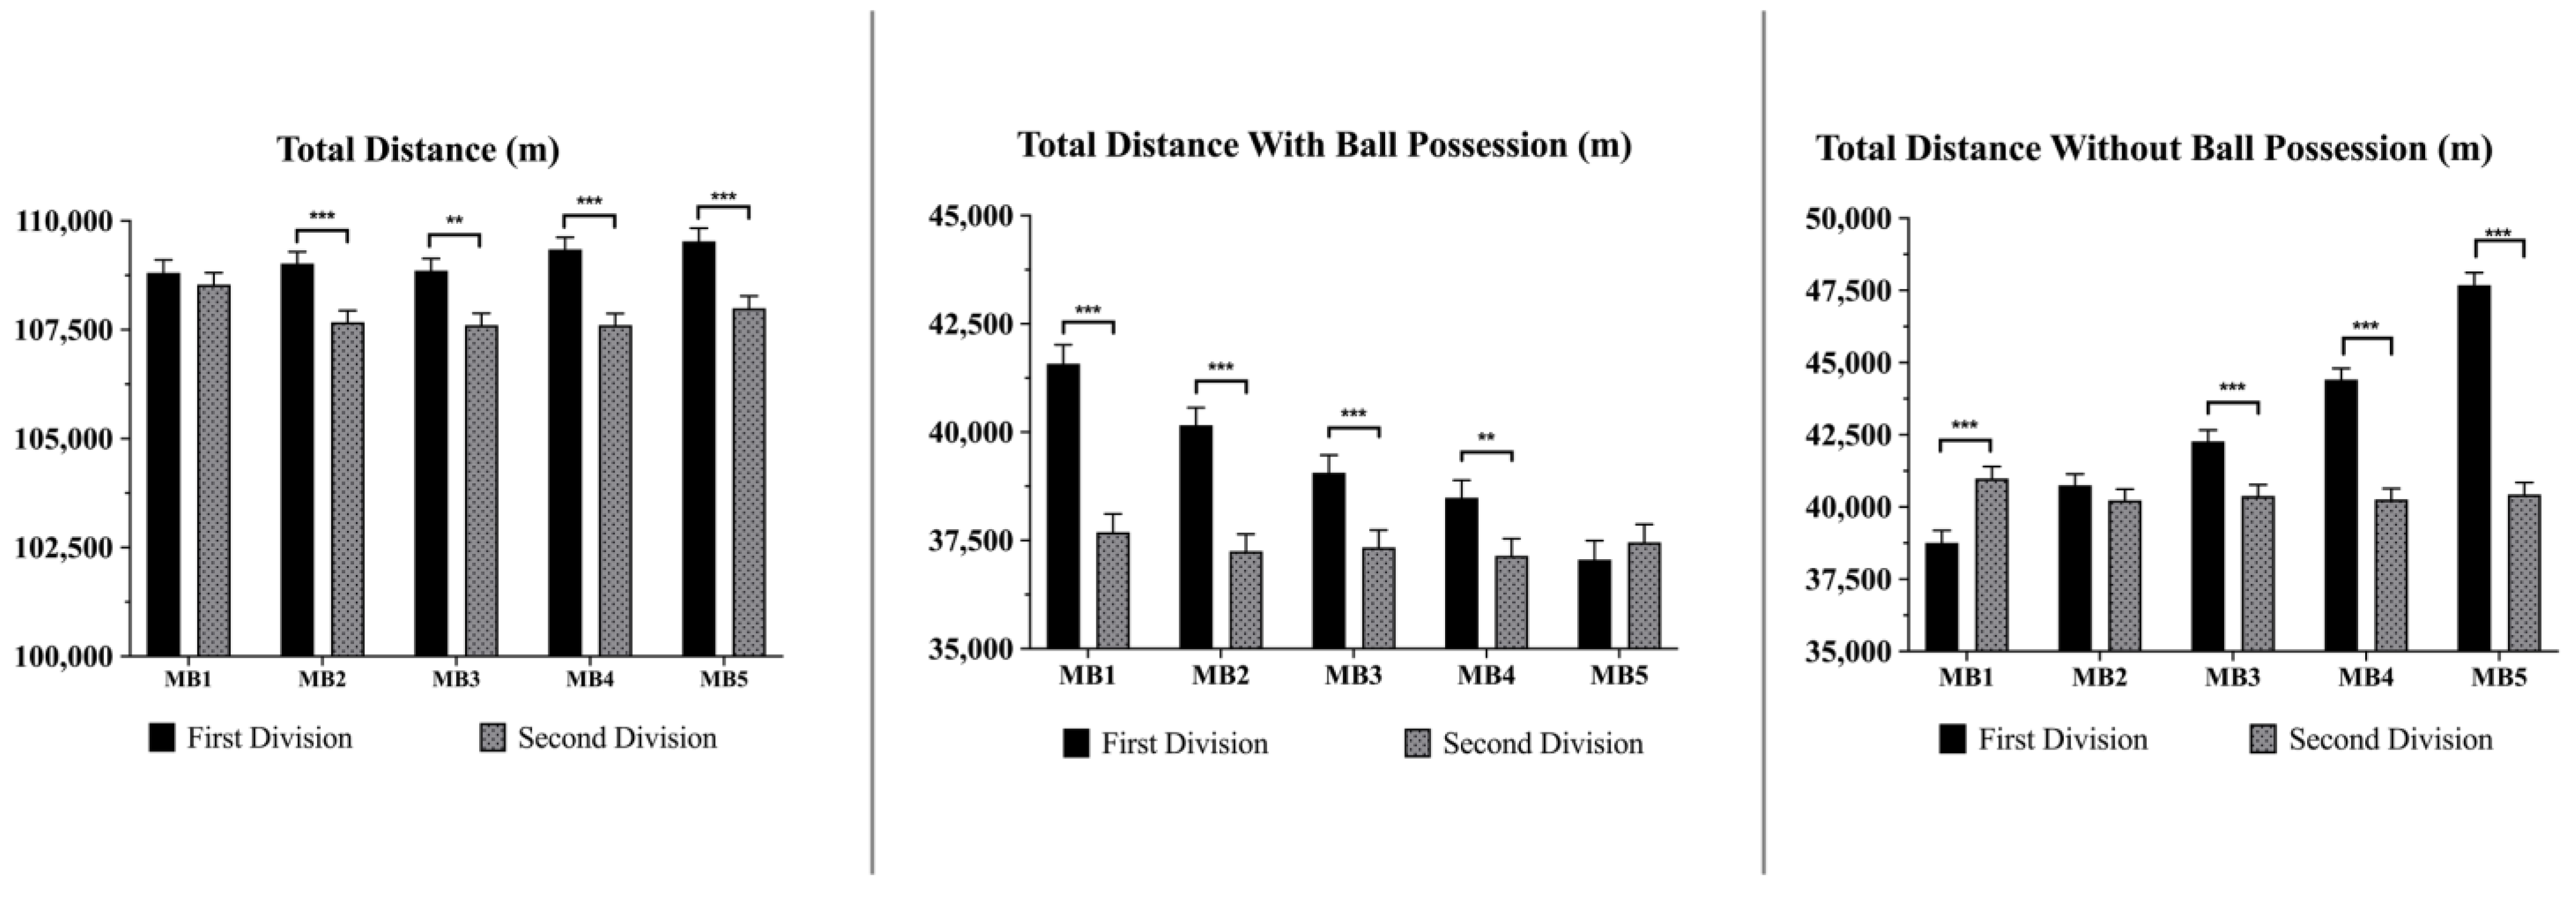
| TD (m) | 108,807 | 109,020 | 108,858 | 109,348 | 109,534 | d,e | e | d,e | a,b | a,b |
| TDWP (m) | 41,580 | 40,163 | 39,061 | 38,486 | 37,057 | b,c,d,e | a,c,d,e | a,b,e | a,b,e | a,b,c,d |
| TDWOP (m) | 38,759 | 40,755 | 42,271 | 44,418 | 47,681 | b,c,d,e | a,c,d,e | a,b,d,e | a,b,c,e | a,b,c,d |
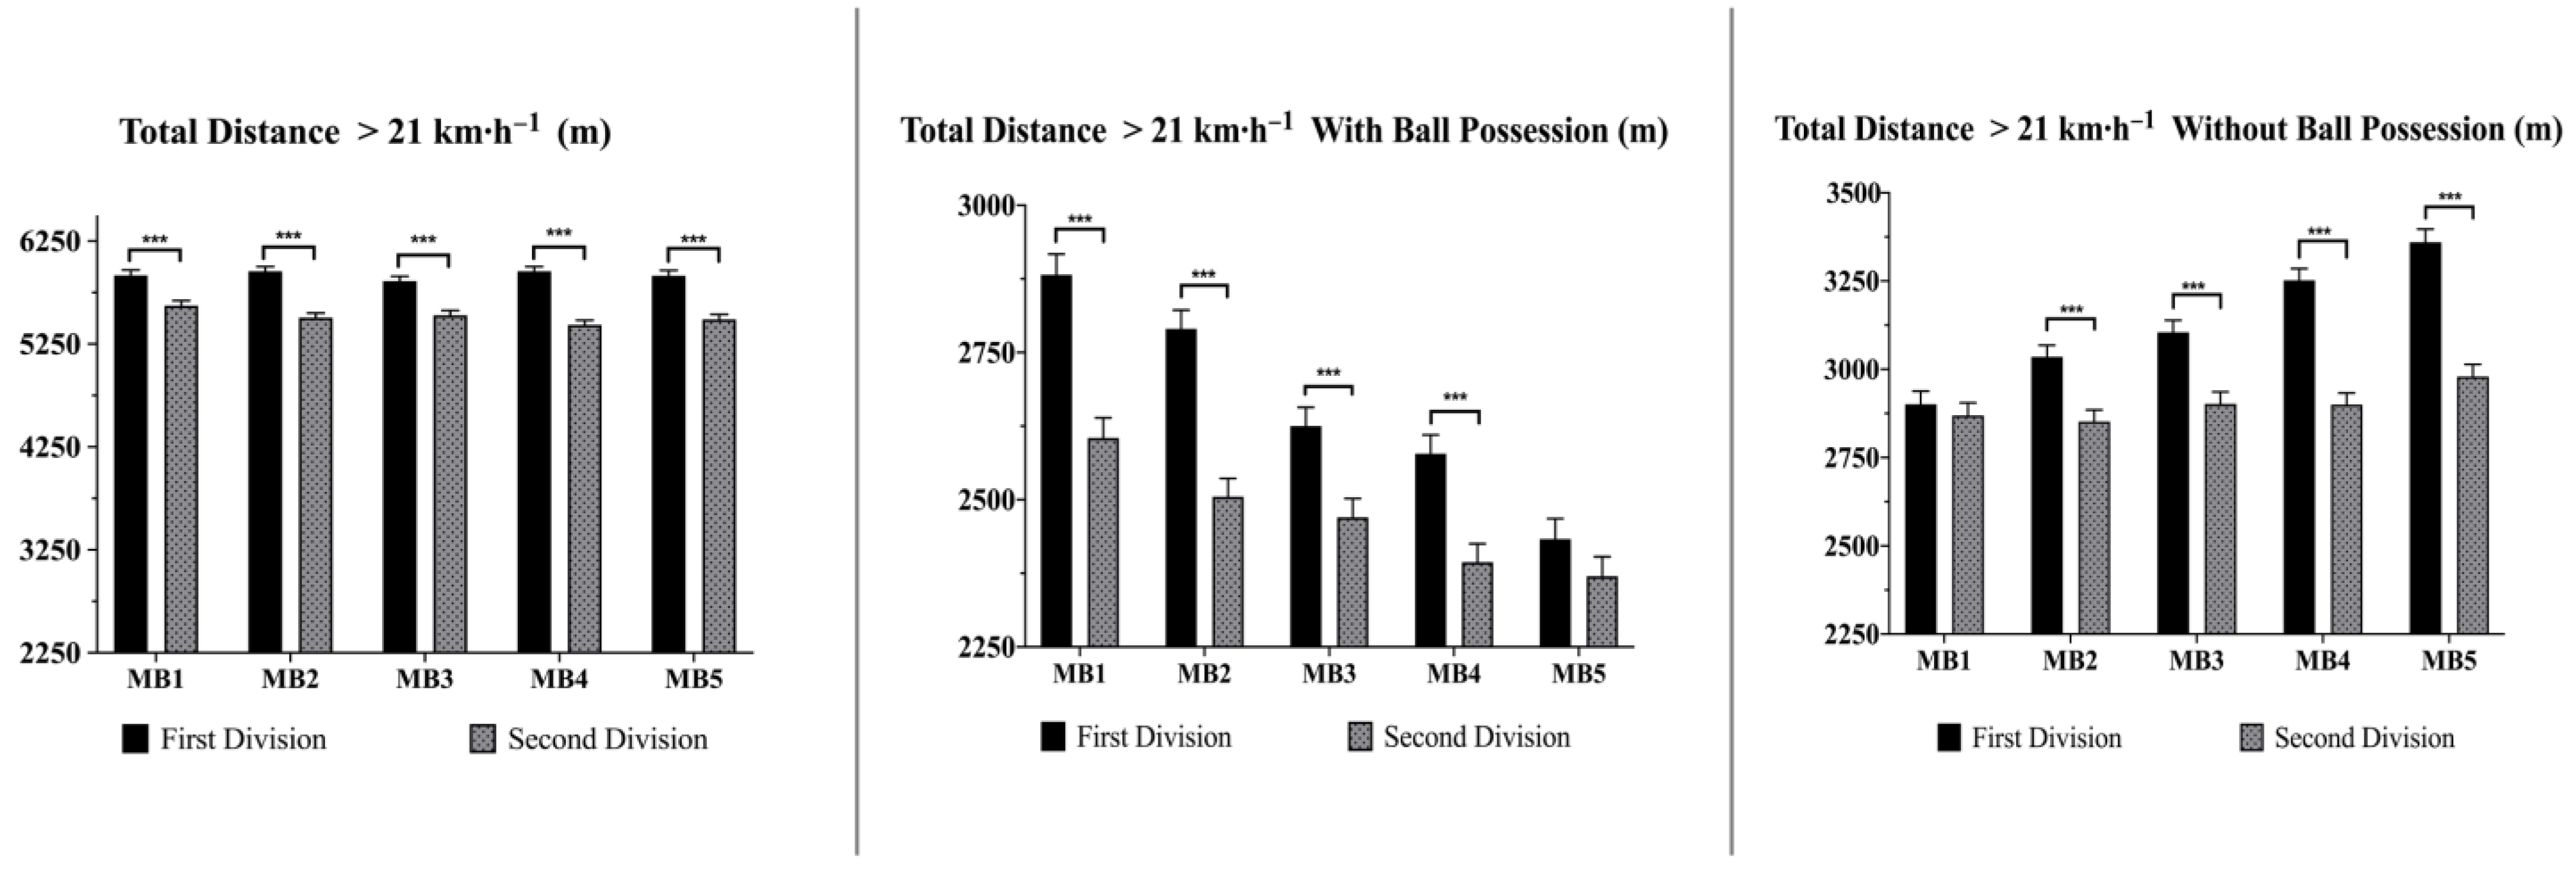
| TD < 21 km⋅h−1 (m) | 5918 | 5956 | 5861 | 5956 | 5914 | c | b,d | c | ||
| TDWP < 21 km⋅h−1 (m) | 2882 | 2790 | 2625 | 2578 | 2433 | b,c,d,e | a,c,d,e | a,b,e | a,b,e | a,b,c,d |
| TDWOP < 21 km⋅h−1 (m) | 2901 | 3035 | 3105 | 3252 | 3360 | b,c,d,e | a,c,d,e | a,b,d,e | a,b,c,e | a,b,c,d |
| L2 | Between-Groups Differences | |||||||||
|---|---|---|---|---|---|---|---|---|---|---|
| MB1 | MB2 | MB3 | MB4 | MB5 | MB1 | MB2 | MB3 | MB4 | MB5 | |
| TD (m) | 108,538 | 107,673 | 107,606 | 107,606 | 107,995 | b,c,d | a | a | a | |
| TDWP (m) | 37,692 | 37,248 | 37,340 | 37,146 | 37,457 | |||||
| TDWOP (m) | 40,990 | 40,235 | 40,381 | 40,255 | 40,436 | b | a | |||
| TD < 21 km⋅h−1 (m) | 5622 | 5505 | 5529 | 5436 | 5490 | b,c,d,e | a | a,d | a,c | a |
| TDWP < 21 km⋅h−1 (m) | 2605 | 2505 | 2470 | 2394 | 2370 | b,c,d,e | a,d,e | a,d,e | a,b,c | a,b,c |
| TDWOP < 21 km⋅h−1 (m) | 2869 | 2852 | 2902 | 2900 | 2979 | e | e | e | e | a,b,c,d |
Publisher’s Note: MDPI stays neutral with regard to jurisdictional claims in published maps and institutional affiliations. |
© 2022 by the authors. Licensee MDPI, Basel, Switzerland. This article is an open access article distributed under the terms and conditions of the Creative Commons Attribution (CC BY) license (https://creativecommons.org/licenses/by/4.0/).
Share and Cite
Ponce-Bordón, J.C.; Nobari, H.; Lobo-Triviño, D.; García-Calvo, T.; Vicente-Giménez, J.; López del Campo, R.; Resta, R.; Fernández-Navarro, J. Match Movement Profiles Differences in Spanish Soccer Competitive Leagues According to Opposition’s Team Ranking: A Comparison Study. Appl. Sci. 2022, 12, 12635. https://doi.org/10.3390/app122412635
Ponce-Bordón JC, Nobari H, Lobo-Triviño D, García-Calvo T, Vicente-Giménez J, López del Campo R, Resta R, Fernández-Navarro J. Match Movement Profiles Differences in Spanish Soccer Competitive Leagues According to Opposition’s Team Ranking: A Comparison Study. Applied Sciences. 2022; 12(24):12635. https://doi.org/10.3390/app122412635
Chicago/Turabian StylePonce-Bordón, José C., Hadi Nobari, David Lobo-Triviño, Tomás García-Calvo, Jesús Vicente-Giménez, Roberto López del Campo, Ricardo Resta, and Javier Fernández-Navarro. 2022. "Match Movement Profiles Differences in Spanish Soccer Competitive Leagues According to Opposition’s Team Ranking: A Comparison Study" Applied Sciences 12, no. 24: 12635. https://doi.org/10.3390/app122412635