
Reliability of a Global Gait Symmetry Index Based on Linear Joint Displacements
by
 , and
, and
Silvia Cabral
1,*,
Rita Fernandes
1,2,
William Scott Selbie
3,
Vera Moniz-Pereira
1 and
António P. Veloso
1,* 1
U Lisboa, Fac Motricidade Humana, CIPER, LBMF, P-1499-002 Lisboa, Portugal
2
Departamento de Fisioterapia, Escola Superior de Saúde, Instituto Politécnico de Setúbal, Campus do Instituto Politécnico de Setúbal, Estefanilha, Edifício ESCE, 2914-503 Setúbal, Portugal
3
HAS-Motion, Inc., Kingston, ON K7L 3G8, Canada
*
Authors to whom correspondence should be addressed.
Appl. Sci. 2022, 12(24), 12558; https://doi.org/10.3390/app122412558
Submission received: 5 October 2022
/
Revised: 21 November 2022
/
Accepted: 1 December 2022
/
Published: 8 December 2022
(This article belongs to the Special Issue Joint Kinematics Analysis and Injuries Recovery)
Abstract
:Gait symmetry is commonly used as an informal measure to assess functional gait recovery. As other outcome measures used for the evaluation of clinical change over time, gait symmetry indices must be reliable. However, studies assessing the reliability of symmetry indices are scarce and focused on discrete and local indices (i.e., peak joint angle, step length), which fail to assess overall gait symmetry. On the other hand, the repeatability of global symmetry indices (using multiple continuous waveforms) based on joint angles may be hampered by the sensitivity of these variables to marker placement imprecision. The aim of this study is to evaluate the test–retest intra-rater reliability and measurement error of an alternative global symmetry index. Two 3D gait analyses were performed on separate days (a week interval) on twenty-three healthy adults. Reliability and measurement error were assessed by calculating the intraclass correlation coefficient and the 95% limits of agreement, standard error of measurement and smallest detectable change, respectively. The new symmetry index presented acceptable results in terms of reliability (ICC = 0.71, 95% CI 0.33–0.88) and measurement error (95% LOA between −30.2% and 29.1%, SEM = 10.7% and SDC = 29.7%), thus being a more promising tool to assess overall gait symmetry.
1. Introduction
The clinical importance of gait symmetry, which is the identical behaviour of both limbs [1] throughout the gait cycle, is reflected by its increasing number of publications [2]. While a reduction in gait symmetry is often perceived as a result of pathology, it is also believed to have future implications. For example, restoring full a symmetrical range of motion of the knee after reconstructive ACL surgery has been identified as the most important factor in ensuring the best long-term successful surgical outcome and patient satisfaction [3]. In addition, gait symmetry may be associated with efficiency and balance control [4]. Therefore, it is one of the most commonly used informal measures to assess functional gait recovery [5].
An essential requirement of any outcome measure used for meaningful clinical decision-making and for the evaluation of clinical change over time is that they are consistent and reliable [6,7]. In other words, a reliable instrument or outcome measure is one that is free from measurement error, and therefore yields the same repeated measurement when a person has not undergone change in the assessed construct between measurements [8]. Despite the extensive use of symmetry indices in the literature and the existing growing effort to restore gait symmetry in clinical populations [9,10,11,12], only three studies [9,13,14] have analysed the reliability of symmetry indices.
Using spatiotemporal parameters [9,13], respectively, reported high inter-session reliability for a symmetry ratio, and poor inter-session reliability for a symmetry index. However, a limitation of these indices is that symmetry is calculated based on a single variable, such as step-length, a joint angle, ground reaction force, or other biomechanical variables. Assessing gait symmetry from spatiotemporal parameters alone is flawed, because step length may be symmetric even though overall gait is highly asymmetric [15]. Furthermore, when assessing symmetry in joint angles (or other biomechanical variables that vary throughout the gait cycle), these symmetry indices require the extraction of a single discrete value (i.e., peak angle, or angle at initial contact). Through this single value extraction, one may neglect the temporal information of gait waveforms [16] and may fail to capture important asymmetries that occur in other portions of the gait cycle [17]. Additionally, discrete values are prone to generating false positives [18].
The reliability of a global symmetry index called Global Gait Asymmetry (GGA) [19] was also previously analysed [14]. This index overcomes the limitations above, by including continuous gait data from various local parameters (the three components of the trunk, pelvis, hip, knee, and ankle joint angles). However, the GGA presented very poor reliability between sessions, possibly because of the cumulative sum (frame by frame and at various joints) of bilateral differences that are functionally irrelevant and/or caused by marker placement inconsistency.
Errors in anatomical landmark position determination are known to affect the position and orientation of a segment’s anatomical frame [20]. These errors are particularly detrimental to the precision of the longitudinal orientation component, especially on the femur and tibia. Furthermore, joint angles are highly sensitive to these variations in anatomical frame orientations and are less reliable for those components undergoing small variations. Specifically, while standing, transverse plane angles are generally the least precise, particularly at the knee. During motion, coronal and transverse plane angles are generally less reliable, and for the knee joint only, precision in these components depend on the level of flexion/extension [21]. Although one may expect that the exclusion of these less reliable joint angles from the symmetry index equation might improve the index’s reliability, the sensitivity of the remaining joint angles to errors in the anatomical frame orientation may still be detrimental to the reliability of a symmetry index. In fact, a previous small study [22] has shown that by excluding the least reliable joint angle components, as usually performed for other indices [23,24], the index reliability was slightly lower, contradicting the expectations.
A radical alternative, that may solve this problem, would be to not include angles at all. Considering the relationship between a segment angular and linear positions, joint angles could be replaced by the linear displacements of joints. Based on the 3D linear displacement of several joints, Troje [25] was able to identify and model walking patterns that are distinct between males and females. Similarly, gait symmetry could be reported from the bilateral differences in the linear position of joints (in relation to a central position), instead of the bilateral differences in joint angles. An advantage of calculating symmetry this way is that the segments’ end positions (the joints) are not affected by the longitudinal orientation of the segment coordinate system, which is the most affected by marker placement inconsistency [20]. Based on this premise, a new global gait symmetry index was developed, as presented hereafter. This new index, the Linear Global Gait Asymmetry (LGGA), is calculated using the same equation as the GGA and replacing the joint angles by the linear positions of the segment’s distal extremities in relation to the pelvis. Thus, the LGGA could be a useful tool to complement the clinical gait analysis, by informing, quantitatively, the clinician of the overall level of gait symmetry of a patient and how it is progressing throughout the rehabilitation process.
Thus, the aim of this study was to develop and assess the inter-session intra-rater reliability and measurement error of the LGGA. The authors hypothesised that the LGGA will be more reliable than global symmetry indices comprising joint angles.
2. Materials and Methods
2.1. Study Design
This study followed a prospective test–retest (intra-rater) design.
2.2. Participants
According to the equation of Kraemer and Thiemann [27] (Equation (1)), eighteen was the minimum sample size required for a predefined 5% level of significance with 80% power, and for a desired reliability coefficient () of 0.90 with a minimum reliability ( of 0.70.
To allow for non-attenders and increased precision, a convenience sample of twenty-three participants (34.8 ± 7.3 y, 66.4 ± 9.2 kg, 1.70 ± 0.07 m and body mass index of 23.0 ± 2.3 Kg/m2), was recruited from university staff and their associates, with ages between 18 and 65 years. Participants were screened by a physiotherapist to ensure they were free from any clinical condition (musculoskeletal, neurological, cardiac or pulmonary) or symptom that could affect their gait. Pregnant women were also excluded.
2.3. Protocol
The study’s protocol was approved by the Faculty Ethics Committee (22/2013), and written informed consent was obtained from the participants prior to the study. Each participant underwent two three-dimensional gait analyses, spaced by 7 to 11 days (median of 7) and performed at the same time of day. This time period was considered to be adequate to prevent assessor memory bias as well as changes in gait symmetry. Before marker placement, mass and height were measured. In both visits, passive markers were placed, by a single physiotherapist with experience in instrumented gait analysis, on the participant’s skin on specific anatomical landmarks (acromia, spinous process of C7, suprasternal notch, xiphoid process, highest point of each iliac crest, anterior and posterior superior iliac spines, medial and lateral femoral condyles, medial and lateral malleoli, first and fifth metatarsal heads, and posterior aspect of the calcaneus), as shown in Figure 1. Additionally, a rigid cluster with four markers were placed laterally on each thigh and each shank. In each visit, participants walked barefoot along a 14 m walkway, at their self-selected speed, during short periods of time (1–2 min). Following familiarisation, the markers 3D trajectories were recorded at 200 Hz using a Qualisys system with 13 Oqus cameras (Oqus 300 and 300+, Qualisys AB, Gothenburg, Sweden), synchronized in time and space with two Kistler (Kistler Group, Winterthur, Switzerland) and one AMTI (Advanced Mechanical Technology, IncWatertown, MA, USA) force platforms.
2.4. Data Processing
The marker trajectories were low pass filtered using a 4th order Butterworth filter with a cut off frequency of 10 Hz. A model with 8 segments (thorax, pelvis, thighs, shanks and feet) was built from a standing trial, allowing 6 degrees of freedom per segment. The segments local coordinate systems were defined based on the method described in [28], using the following anatomical landmarks: the medial and lateral femoral condyles and the hip joint centre (estimated by regression from the anterior superior iliac spines [29]) for the thigh; the medial and lateral malleoli and the mid-point between the femoral condyles for the shank; the first and fifth metatarsal heads and the mid-point between the malleoli (all projected onto the floor) for the foot; the right and left acromia and the mid-point between the anterior and posterior superior iliac spines for the thorax. The pelvis was defined as a CODA segment, using the four iliac spines previously mentioned [28]. The position and orientation of the segments during the walking trials was computed using a segment optimization technique [30] using the following tracking markers: the spinous process of C7, suprasternal notch and xiphoid process for the thorax; the highest point of each iliac crest, and the anterior and posterior superior iliac spines for the pelvis; the rigid clusters of markers for the thighs and shanks; and the lateral malleoli, first and fifth metatarsal heads, and posterior aspect of the calcaneus for the virtual feet.
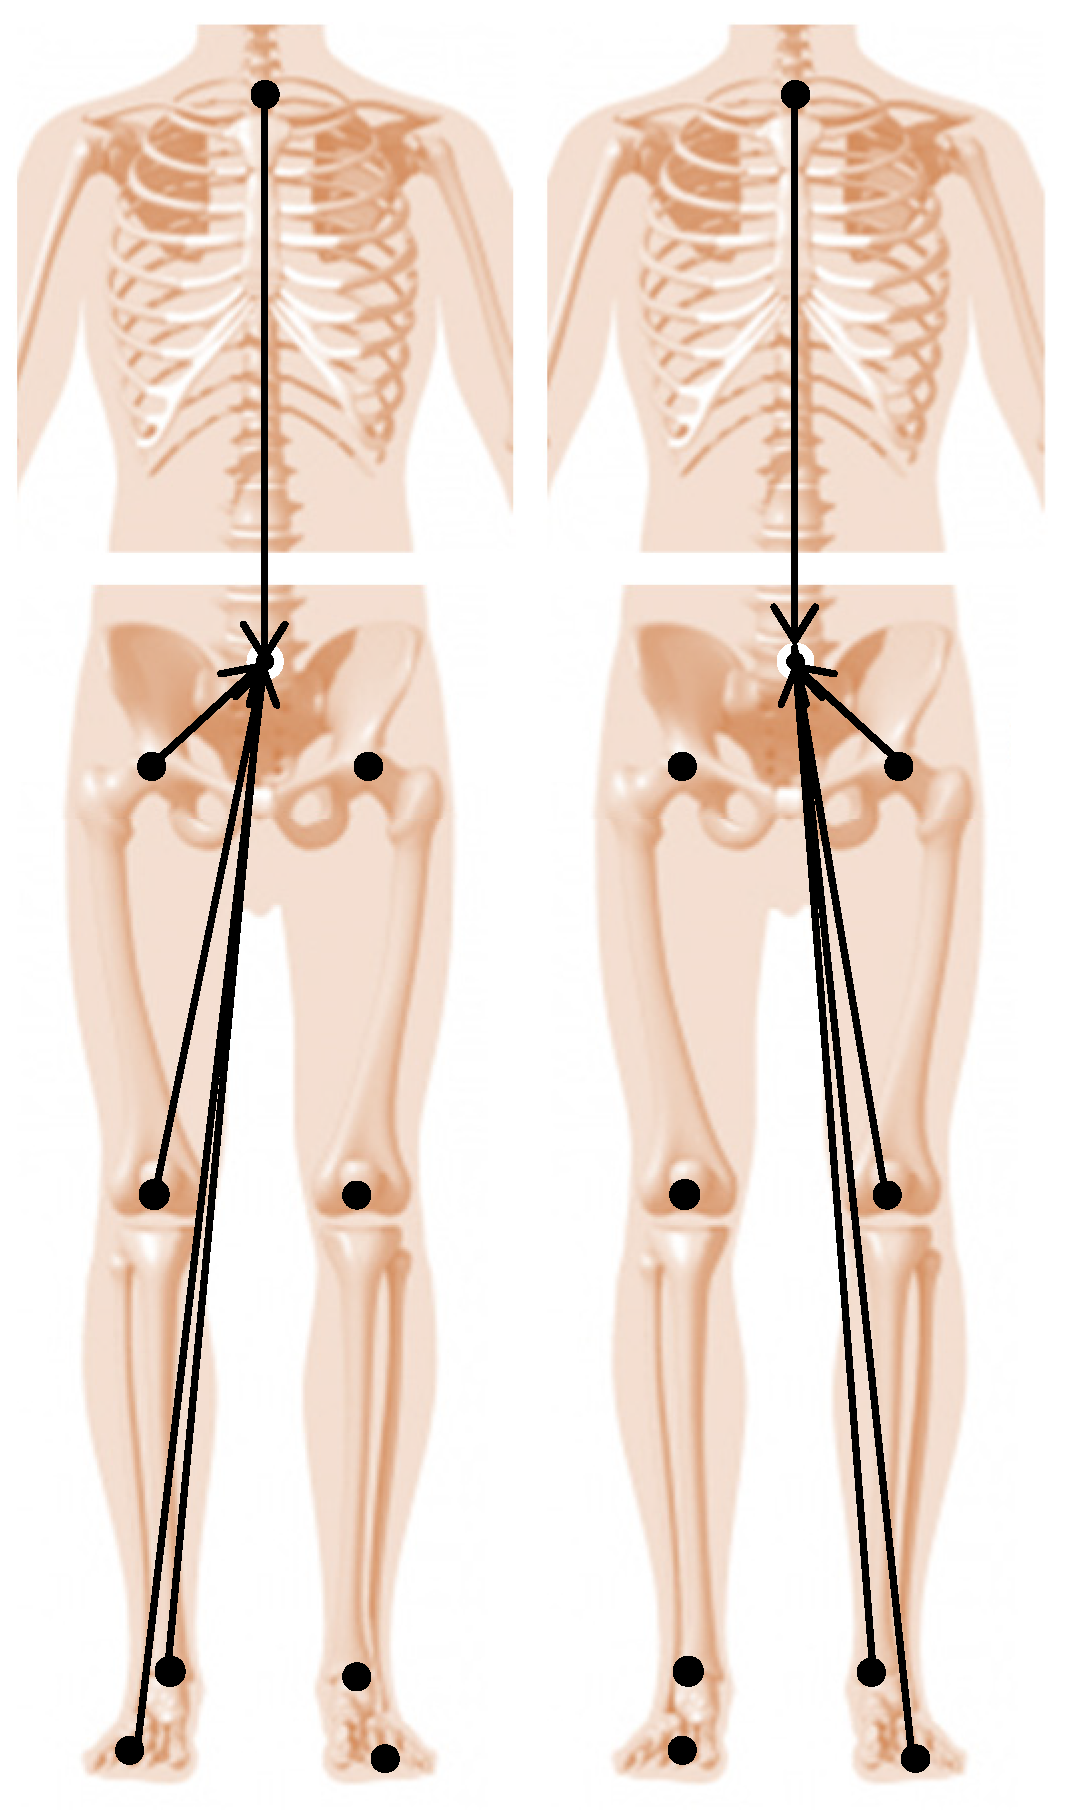
To calculate the symmetry index, firstly the Euclidean distances (Figure 2) from the “joint centres” to the pelvis origin (midpoint between the anterior and posterior superior iliac spines) were calculated and normalized to the gait cycle duration (101 points), for both sides. The “joint centres” positions were given by the coordinates of the distal extremities of the feet (midpoint between the first and fifth metatarsal heads), shanks (midpoint between the malleoli), thighs (midpoint between the femoral condyles) and thorax (midpoint between the acromia) in relation to the global coordinate system. More specifically, for the thorax, the same point is used for both sides, but normalised to the respective gait cycle. For the pelvis, the Euclidean distance from the left hip joint centre to the pelvis origin was calculated for the left gait cycle, and the Euclidean distance from the right hip joint centre to the pelvis origin was calculated for the right gait cycle.
Secondly, for each component of the time normalized Euclidean distances and for each joint, the squared differences between the left and right curves were computed for each of the 101 time points. For the frontal plane, the sign of the distance between the pelvis origin and the left “joint centres” was inverted prior to calculating the bilateral differences. For each joint and each component, these bilateral differences were summed throughout the gait cycle and the square root was taken. This yields the 15 components of the LGGA, which are the absolute bilateral differences obtained for each segment component (3 axes of five segments). Finally, these components were added to give the symmetry index as explained in Equation (2).
where i is the x, y and z components of the bilateral differences in the Euclidean distance from the 5 “joint centres” (distal ends of thorax, pelvis, thigh, shank, and foot) to the pelvis origin, and li,t and ri,t are the left and right Euclidean distances, respectively, at each percentage of the gait cycle.
Accordingly, the LGGA has a minimum theoretical value of zero, meaning that the gait is perfectly symmetrical, and increases with greater levels of asymmetry, having no maximum value. The index was purposefully calculated for each pair of left and right consecutive gait cycles, rather than non-consecutive or averaged gait cycles. The heel strike events, used for gait cycle definition, were determined from the force platform contacts, or from target pattern recognition for contacts outside the force platforms [31]. Gait speed was also computed and normalised to standing height. All data processing and model building were performed in Visual3D (Version 5.01.18, C-Motion, Inc, Germantown, MD, USA).
2.5. Data Analysis
The symmetry index was calculated for 10 pairs of left and right consecutive gait cycles from each participant in each visit. These were then averaged to assess the reliability of the index between visits. The measurement error and reliability were assessed based on the consensus from COSMIN [32]. Accordingly, the Bland and Altman 95% Limits of Agreement (95% LOA), the Standard Error of Measurement (SEM) and the Smallest Detectable Change (SDC) were calculated to assess measurement error using the following equations: 95% LOA = X̅diff ± 1.96 × SDdiff [33]; SEM = SDdiff/√2 [6], and SDC = 1.96 × √2 × SEM [34], where X̅diff and SDdiff are the mean and standard deviation of the differences between visits. Additionally, the Intraclass Correlation Coefficient (two-way mixed-effects model—ICCc,k) [35] and associated 95% confidence intervals (CI) were also calculated to assess reliability. To compare results with other symmetry indices from the literature that use different biomechanical variables, the quality of the 95% LOA, the SEM and the MDC results were also interpreted in terms of percentages of the symmetry index averaged between visits for all participants. The quality of the ICC values was interpreted in relation to the measurement error and the variation between subjects [36], but also considering a minimum value of 0.70 as acceptable [37]. Prior to these calculations, the presence of heteroscedasticity was assessed by visual inspection of the Bland and Altman plots, the normality of the differences between visits was checked via a Shapiro–Wilk test, and the existence of a relationship between the differences and the mean between visits was analysed via a Pearson Correlation test. The gait speeds from both visits were compared using a two-tailed paired T-test, after checking for normality. The 95% LOA, the SEM and the MDC were calculated using Microsoft Excel 2016 (Microsoft Corporation, Redmond, WA, USA). All other statistics were computed in IBM SPSS Statistics 26 (SPSS, Inc. Chicago, IL, USA), for an alpha of 0.05.
3. Results
The participants’ walking speed remained consistent between visits (0.71 ± 0.08 vs. 0.71 ± 0.09 statures/s; t(22) = 0.706, p = 0.488). The LGGA scores obtained in both visits are presented in Table 1.
The differences in symmetry between visits were normally distributed (p = 0.122). Visual inspection of the difference between visits boxplots showed the existence of one outlier. The standard deviation of these differences remained constant throughout the scores’ magnitude (no heteroscedasticity), as observed in the Bland and Altman Plots (Figure 3). Furthermore, these differences were not related to the magnitude of the scores (r(22) = 0.297, p = 0.169).
The values obtained for the measurement error and reliability of the LGGA are presented in Table 2. Accordingly, it is expected that repeated measurements may vary as much as 0.55, even when no real changes in symmetry are observed. This represents approximately 30% of the average score obtained in the healthy participants of this study, which may be reasonable. Additionally, the ICC was acceptable (being above 0.70); however, the 95% confidence intervals for this value were quite wide.
4. Discussion
This study assessed the reliability of a newly developed global gait symmetry index, the LGGA. This index was developed with the intention to provide the clinicians with a tool that can complement the clinical gait analysis with a measure of overall gait symmetry (similarly to how the Gait Profile Score [23] is used as a measure of overall gait quality but focused on symmetry). Thus, it is intended to aid the clinician in assessing the patient progress in terms of gait symmetry during injury recovery and/or in response to an intervention.
A strength of this study is its careful design. The time between visits was approximately equal and close to 7 days for all participants, with the second visit being performed at the same time of day as the first. Furthermore, participants maintained their healthy condition in both visits, were allowed a familiarisation period before each data collection, and did not know when the data were being recorded. These characteristics assured identical testing conditions and trustworthy data. Additionally, the present data set has been shown to be highly reliable [26]. On the other hand, the current results are limited to a single examiner and therefore should not be extrapolated to studies performed by multiple examiners.
As hypothesised, the LGGA presented higher reliability and lower measurement error than its predecessor, the GGA. More specifically, in terms of reliability, the ICC of 0.71 obtained for the LGGA is much higher than the 0.30 previously obtained for the GGA [14]. Additionally, the corresponding 95% confidence intervals obtained for the LGGA are also much narrower, indicating that this ICC value was estimated with greater precision. Nonetheless, these confidence intervals are still quite wide. The ICC result obtained was also well above the ICC values (0.01 to 0.35) obtained for a step time symmetry index in healthy individuals [13]. An ICC of 0.71 means that 71% of the variability observed in LGGA scores are attributed to real differences in gait symmetry between participants while the remaining 29% of this variability are attributed to measurement error [36]. This value is just above the 0.70 recommended for research purposes, but below the recommendations for clinical purposes (>0.90) [37]. However, these recommendations are not absolute standards, leaving space for the judgement of the researcher or clinician within the context of the specific score [38]. Previous research [9] has shown that the symmetry ratio presented higher ICC values (between 0.93 and 0.98), in a sample of stroke patients, than the LGGA. However, the ability of the symmetry ratio to discriminate stroke survivors from healthy individuals was not very good [2], despite obtaining ICC values above the recommendations for clinical purposes. The poor to moderate discriminative ability of the symmetry ratio in the face of high ICC values may be because spatio-temporal symmetry does not provide a fair assessment of overall gait symmetry [15]. Thus, by quantifying the bilateral differences in joint positions throughout the entire gait cycle, it is possible that the LGGA may be more sensitive to real differences in symmetry among individuals (i.e., more reliable), despite its greater proportion of error variance (lower ICC value). Of course, this can only be ascertained with future research to verify the ability of the LGGA to discriminate individuals with clinically relevant differences in gait symmetry.
In terms of measurement error, the 95% LOA of the GGA were close to plus and minus 60%, the SEM was 22.4% and the SDC was 62.1% [14]. The corresponding results obtained for the LGGA in the present study, with the same data set, were cut in half, as shown in Table 2. This drastic reduction in measurement error, in comparison to the GGA, can be explained by the lower variability in LGGA differences between visits (i.e., these differences were more consistent among participants), as seen by the standard deviation of the differences in Table 1 of both manuscripts. This was likely because the linear displacement of segment extremities is less sensitive to errors in landmark position determination than joint angles and confirms that this limitation of joint angles was contributing to the error of the GGA. Conversely, the SDC values of the LGGA (29.7%) were higher (worse) than those reported by [9] for the symmetry ratio in stroke patients (between 8% and 18%, as calculated based on the published data). However, the later values may be questionable, considering the width and variability of the time interval between visits (between 3 and 36 days) and the equation used to calculate the SEM (from which the MDC is calculated). Explicitly, the SEM should not be calculated using an ICC model that includes systematic error because this is not reflected in the pooled standard deviation. Furthermore, the calculation of SEM from the ICC is not recommended as it highly depends on the sample’s heterogeneity [6].
In practical terms, this study shows that a change of ≤0.2 in the LGGA score in a healthy person should be neglected, as it is considered measurement error. Moreover, based on the 95% LOA and SDC values obtained in this study, it is expected that the LGGA score may change by 0.55 when the same healthy participant is measured repeatedly without undergoing any real change between measurements [39]. Thus, only changes above 0.54 should be considered as real changes [6]. As for the clinical relevance of such a change, future investigations are needed to determine the minimal clinically important difference (as well as the other measurement properties analysed in this study) of the LGGA in specific clinical populations. Although the LGGA is more reliable than the GGA, a score based on linear joint displacements is more difficult to interpret rather than one based on joint angles.
5. Conclusions
The LGGA index was shown to be more reliable and have less measurement error than the GGA. It was also more reliable than a step time symmetry index assessed in healthy individuals, but it seems to be less reliable and have higher measurement error than the symmetry ratio of various spatiotemporal parameters assessed in stroke patients [9], although these published data should be considered with caution. Nonetheless, the LGGA overcomes the important limitations of the Symmetry Ratio and other local and discrete symmetry indices [19]. Furthermore, because the LGGA calculates symmetry based on the linear displacement of joints, instead of joint angles, it is comparable across different modelling conventions [40], and therefore across different laboratories. However, the bilateral differences in linear displacement of segment extremities in relation to the pelvis may be harder for clinicians to interpret. Further research is required to assess the measurement properties of the LGGA in clinical populations.
Author Contributions
Conceptualization, A.P.V., S.C. and W.S.S.; methodology, R.F., S.C., V.M.-P. and W.S.S.; software, W.S.S.; formal analysis, S.C.; investigation, S.C.; resources, A.P.V. and R.F.; writing—original draft preparation, S.C.; writing—review and editing, A.P.V., R.F., V.M.-P. and W.S.S.; supervision, A.P.V. and W.S.S. All authors have read and agreed to the published version of the manuscript.
Funding
This study was funded by the Portuguese Foundation for Science and Technology and CIPER (Research Project: UIDB/00447/2020; PHD Grant: SFRH/BD/69424/2010), who were not involved in any way in the production and submission of this manuscript.
Institutional Review Board Statement
The study was conducted in accordance with the Declaration of Helsinki, and approved by the Ethics Committee of the Faculdade de Motricidade Humana (protocol code 22/2013 approved on 19 November 2013).
Informed Consent Statement
Written informed consent was obtained from all subjects involved in the study.
Data Availability Statement
Due to the nature of this research, participants of this study did not agree for their data to be shared publicly, so supporting data is not available.
Acknowledgments
The authors gratefully thank Niko Troje for his intellectual contribution.
Conflicts of Interest
The authors declare no conflict of interest.
References
- Sadeghi, H.; Allard, P.; Prince, F.; Labelle, H. Symmetry and Limb Dominance in Able-Bodied Gait: A Review. Gait Posture 2000, 12, 34–45. [Google Scholar] [CrossRef] [PubMed]
- Patterson, K.K.; Gage, W.H.; Brooks, D.; Black, S.E.; McIlroy, W.E. Evaluation of Gait Symmetry after Stroke: A Comparison of Current Methods and Recommendations for Standardization. Gait Posture 2010, 31, 241–246. [Google Scholar] [CrossRef] [PubMed]
- Shelbourne, K.D.; Klotz, C. What I Have Learned about the ACL: Utilizing a Progressive Rehabilitation Scheme to Achieve Total Knee Symmetry after Anterior Cruciate Ligament Reconstruction. J. Orthop. Sci. 2006, 11, 318–325. [Google Scholar] [CrossRef] [PubMed] [Green Version]
- Patterson, K.K.; Parafianowicz, I.; Danells, C.J.; Closson, V.; Verrier, M.C.; Staines, W.R.; Black, S.E.; McIlroy, W.E. Gait Asymmetry in Community-Ambulating Stroke Survivors. Arch. Phys. Med. Rehabil. 2008, 89, 304–310. [Google Scholar] [CrossRef]
- Archer, K.R.; Castillo, R.C.; MacKenzie, E.J.; Bosse, M.J. Gait Symmetry and Walking Speed Analysis Following Lower-Extremity Trauma. Phys. Ther. 2006, 86, 1630–1640. [Google Scholar] [CrossRef] [Green Version]
- de Vet, H.C.; Terwee, C.B.; Knol, D.L.; Bouter, L.M. When to Use Agreement versus Reliability Measures. J. Clin. Epidemiol. 2006, 59, 1033–1039. [Google Scholar] [CrossRef] [Green Version]
- Klejman, S.; Andrysek, J.; Dupuis, A.; Wright, V. Test-Retest Reliability of Discrete Gait Parameters in Children with Cerebral Palsy. Arch. Phys. Med. Rehabil. 2010, 91, 781–787. [Google Scholar] [CrossRef]
- Mokkink, L.B.; Terwee, C.B.; Patrick, D.L.; Alonso, J.; Stratford, P.W.; Knol, D.L.; Bouter, L.M.; de Vet, H.C.W. The COSMIN Study Reached International Consensus on Taxonomy, Terminology, and Definitions of Measurement Properties for Health-Related Patient-Reported Outcomes. J. Clin. Epidemiol. 2010, 63, 737–745. [Google Scholar] [CrossRef] [Green Version]
- Lewek, M.D.; Randall, E.P. Reliability of Spatiotemporal Asymmetry during Overground Walking for Individuals Following Chronic Stroke. J. Neurol. Phys. Ther. 2011, 35, 116–121. [Google Scholar] [CrossRef]
- Lewek, M.D.; Feasel, J.; Wentz, E.; Brooks, F.P.; Whitton, M.C. Use of Visual and Proprioceptive Feedback to Improve Gait Speed and Spatiotemporal Symmetry Following Chronic Stroke-A Case Series. Phys. Ther. 2012, 92, 748–756. [Google Scholar] [CrossRef]
- Reisman, D.; McLean, H.; Keller, J.; Danks, K.; Bastian, A. Repeated Split-Belt Treadmill Training Improves Poststroke Step Length Asymmetry. Neurorehabil. Neural Repair 2013, 27, 460–468. [Google Scholar] [CrossRef] [Green Version]
- White, S.C.; Lifeso, R.M. Altering Asymmetric Limb Loading after Hip Arthroplasty Using Real-Time Dynamic Feedback When Walking. Arch. Phys. Med. Rehabil. 2005, 86, 1958–1963. [Google Scholar] [CrossRef] [PubMed]
- Senden, R.; Grimm, B.; Heyligers, I.C.; Savelberg, H.H.C.M.; Meijer, K. Acceleration-Based Gait Test for Healthy Subjects: Reliability and Reference Data. Gait Posture 2009, 30, 192–196. [Google Scholar] [CrossRef]
- Cabral, S.; Fernandes, R.; Selbie, W.S.; Moniz-Pereira, V.; Veloso, A.P. Inter-Session Agreement and Reliability of the Global Gait Asymmetry Index in Healthy Adults. Gait Posture 2017, 51, 20–24. [Google Scholar] [CrossRef]
- Roerdink, M.; Roeles, S.; van der Pas, S.C.H.; Bosboom, O.; Beek, P.J. Evaluating Asymmetry in Prosthetic Gait with Step-Length Asymmetry Alone Is Flawed. Gait Posture 2012, 35, 446–451. [Google Scholar] [CrossRef] [PubMed] [Green Version]
- Deluzio, K.J.; Astephen, J.L. Biomechanical Features of Gait Waveform Data Associated with Knee Osteoarthritis: An Application of Principal Component Analysis. Gait Posture 2007, 25, 86–93. [Google Scholar] [CrossRef] [PubMed]
- Nigg, S.; Vienneau, J.; Maurer, C.; Nigg, B.M. Development of a Symmetry Index Using Discrete Variables. Gait Posture 2013, 38, 115–119. [Google Scholar] [CrossRef]
- Pataky, T.C.; Vanrenterghem, J.; Robinson, M.A. The Probability of False Positives in Zero-Dimensional Analyses of One-Dimensional Kinematic, Force and EMG Trajectories. J. Biomech. 2016, 49, 1468–1476. [Google Scholar] [CrossRef] [Green Version]
- Cabral, S.; Resende, R.A.; Clansey, A.C.; Deluzio, K.J.; Selbie, W.S.; Veloso, A.P. A Global Gait Asymmetry Index. J. Appl. Biomech. 2016, 32, 171–177. [Google Scholar] [CrossRef] [PubMed]
- della Croce, U.; Leardini, A.; Chiari, L.; Cappozzo, A. Human Movement Analysis Using Stereophotogrammetry Part 4: Assessment of Anatomical Landmark Misplacement and Its Effects on Joint Kinematics. Gait Posture 2005, 21, 226–237. [Google Scholar] [CrossRef]
- della Croce, U.; Cappozzo, A.; Kerrigan, D.C. Pelvis and Lower Limb Anatomical Landmark Calibration Precision and Its Propagation to Bone Geometry and Joint Angles. Med. Biol. Eng. Comput. 1999, 37, 155–161. [Google Scholar] [CrossRef] [PubMed]
- Cabral, S.; Fernandes, R.; Moniz-Pereira, V.; Selbie, W.S.; Veloso, A.P. The Impact of Joint Kinematics Reliability on the Intersession Agreement and Reliability of Global Gait Symmetry Indices. In Proceedings of the XXVI Congress of the International Society of Biomechanics, Brisbane, Australia, 23–27 July 2017. [Google Scholar]
- Baker, R.; McGinley, J.L.; Schwartz, M.H.; Beynon, S.; Rozumalski, A.; Graham, H.K.; Tirosh, O. The Gait Profile Score and Movement Analysis Profile. Gait Posture 2009, 30, 265–269. [Google Scholar] [CrossRef] [PubMed]
- Lundh, D.; Coleman, S.; Riad, J. Movement Deviation and Asymmetry Assessment with Three Dimensional Gait Analysis of Both Upper- and Lower Extremity Results in Four Different Clinical Relevant Subgroups in Unilateral Cerebral Palsy. Clin. Biomech. 2014, 29, 381–386. [Google Scholar] [CrossRef] [PubMed]
- Troje, N.F. Decomposing Biological Motion-A Framework for Analysis and Synthesis of Human Gait Patterns. J. Vis. 2002, 2, 371–387. [Google Scholar] [CrossRef] [Green Version]
- Fernandes, R.; Armada-da-Silva, P.; Pool-Goudzwaard, A.; Moniz-Pereira, V.; Veloso, A.P. Three Dimensional Multi-Segmental Trunk Kinematics and Kinetics during Gait: Test-Retest Reliability and Minimal Detectable Change. Gait Posture 2016, 46, 18–25. [Google Scholar] [CrossRef] [PubMed]
- Kraemer, H.C.; Thiemann, S. How Many Subjects? Statistical Power Analysis in Research, 1st ed.; SAGE Publications, Inc.: Newbury Park, CA, USA, 1987. [Google Scholar]
- Robertson, D.G.E.; Caldwell, G.E.; Hamill, J.; Kamen, G.; Whittlesey, S.N. Research Methods in Biomechanics, 2nd ed.; Human kinetics: Champaign, IL, USA, 2014. [Google Scholar]
- Bell, A.L.; Pedersen, D.R.; Brand, R.A. A Comparison of the Accuracy of Several Hip Center Location Prediction Methods. J. Biomech. 1990, 23, 617–621. [Google Scholar] [CrossRef] [PubMed]
- Spoor, C.W.; Veldpaus, F.E. Rigid Body Motion Calculated from Spatial Coordinates of Markers. J. Biomech. 1980, 13, 391–393. [Google Scholar] [CrossRef] [Green Version]
- Stanhope, S.; Kepple, T.; McGuire, D.; Roman, N. Kinematic-Based Technique for Event Time Determination during Gait. Med. Biol. Eng. Comput. 1990, 28, 355–360. [Google Scholar] [CrossRef] [PubMed]
- Mokkink, L.B.; Terwee, C.B.; Patrick, D.L.; Alonso, J.; Stratford, P.W.; Knol, D.L.; Bouter, L.M.; de Vet, H.C.W. The COSMIN Checklist for Assessing the Methodological Quality of Studies on Measurement Properties of Health Status Measurement Instruments: An International Delphi Study. Qual. Life Res. 2010, 19, 539–549. [Google Scholar] [CrossRef] [Green Version]
- Bartlett, J.W.; Frost, C. Reliability, Repeatability and Reproducibility: Analysis of Measurement Errors in Continuous Variables. Ultrasound Obs. Gynecol. 2008, 31, 466–475. [Google Scholar] [CrossRef] [PubMed]
- de Vet, H.C.; Terwee, C.B.; Ostelo, R.W.; Beckerman, H.; Knol, D.L.; Bouter, L.M. Minimal Changes in Health Status Questionnaires: Distinction between Minimally Detectable Change and Minimally Important Change. Health Qual. Life Outcomes 2006, 4, 54–58. [Google Scholar] [CrossRef] [PubMed] [Green Version]
- McGraw, K.O.; Wong, S.P. Forming Inferences about Some Intraclass Correlation Coefficients. Psychol. Methods 1996, 1, 30–46. [Google Scholar] [CrossRef]
- Weir, J.P. Quantifying Test-Retest Reliability Using The Intraclass Correlation Coefficient and the SEM. J. Strength Cond. Res. 2005, 19, 231–240. [Google Scholar] [PubMed] [Green Version]
- Nunnaly, J.C. Psychometric Theory, 2nd ed.; McGraw-Hill: New York, NY, USA, 1978. [Google Scholar]
- Portney, L.G.; Watkins, M.P. Foundations of Clinical Research: Applications to Practice, 3rd ed.; Pearson Education, Inc.: Upper Saddle River, NJ, USA, 2009. [Google Scholar]
- Bland, J.M.; Altman, D.G. Measuring Agreement in Method Comparison Studies. Stat. Methods Med. Res. 1999, 8, 135–160. [Google Scholar] [CrossRef] [PubMed]
- Sigal, L.; Balan, A.; Black, M. HUMANEVA: Synchronized Video and Motion Capture Dataset and Baseline Algorithm for Evaluation of Articulated Human Motion. Int. J. Comput. Vis. 2010, 87, 324–344. [Google Scholar] [CrossRef]
Figure 1.
Anterior (left) and posterior (right) views of the marker placement. The rigid clusters (squares with 4 markers) were placed on the lateral aspect of the thighs and shanks. Anatomical markers are in black, tracking markers are in white with a black outline, and anatomical markers also used for tracking are in black with a white outline. The white marker with dotted black outline is a virtual marker created at the origin of the pelvis (midpoint between the anterior and posterior superior iliac spines), which was used to define the trunk.

Figure 2.
Vectors for the Euclidean distances computed during the right gait cycle (left) and during the left gait cycle (right) for the LGGA calculation. The 3D components of each of these vectors are the input i in this index equation.
Figure 2.
Vectors for the Euclidean distances computed during the right gait cycle (left) and during the left gait cycle (right) for the LGGA calculation. The 3D components of each of these vectors are the input i in this index equation.

Figure 3.
Bland and Altman plot for LGGA. The mean difference between visits (1st visit minus 2nd visit) is represented as a solid black line. The upper and lower 95% limits of agreement are represented by the dashed black lines. (a) Absolute values; (b) as a percentage of mean score between visits.


Table 1.
Asymmetry score values obtained during both visits. Mean values and differences between visits were also calculated, as well as the standard deviation and 95% CI of the differences. The differences and corresponding standard deviations are also presented as a percentage of the mean score between visits.
| Mean ± SD 1st Visit | Mean ± SD 2nd Visit | Mean | Diff (%) | SDdiff (%) | 95% CIdiff |
|---|---|---|---|---|---|
| 1.82 ± 0.33 | 1.83 ± 0.25 | 1.82 | −0.01 (−0.55) | 0.28 (15.4) | −0.13 to 0.11 |
Table 2.
Reliability and measurement error values. Measurement error is also presented as a percentage of the mean score.
Table 2.
Reliability and measurement error values. Measurement error is also presented as a percentage of the mean score.
| 95% LOA (%) | SEM (%) | SDC (%) | ICC | 95% CIICC |
|---|---|---|---|---|
| −0.55 to 0.55 (−30.2 to 29.1) | 0.20 (10.7) | 0.54 (29.7) | 0.71 | 0.33 to 0.88 |
Publisher’s Note: MDPI stays neutral with regard to jurisdictional claims in published maps and institutional affiliations. |
© 2022 by the authors. Licensee MDPI, Basel, Switzerland. This article is an open access article distributed under the terms and conditions of the Creative Commons Attribution (CC BY) license (https://creativecommons.org/licenses/by/4.0/).
Share and Cite
MDPI and ACS Style
Cabral, S.; Fernandes, R.; Selbie, W.S.; Moniz-Pereira, V.; Veloso, A.P. Reliability of a Global Gait Symmetry Index Based on Linear Joint Displacements. Appl. Sci. 2022, 12, 12558. https://doi.org/10.3390/app122412558
AMA Style
Cabral S, Fernandes R, Selbie WS, Moniz-Pereira V, Veloso AP. Reliability of a Global Gait Symmetry Index Based on Linear Joint Displacements. Applied Sciences. 2022; 12(24):12558. https://doi.org/10.3390/app122412558
Chicago/Turabian StyleCabral, Silvia, Rita Fernandes, William Scott Selbie, Vera Moniz-Pereira, and António P. Veloso. 2022. "Reliability of a Global Gait Symmetry Index Based on Linear Joint Displacements" Applied Sciences 12, no. 24: 12558. https://doi.org/10.3390/app122412558
Note that from the first issue of 2016, this journal uses article numbers instead of page numbers. See further details here.