

Seismic Retrofit of Existing Structures Based on Digital Surveying, Non-Destructive Testing and Nonlinear Structural Analysis: The Case of Gjirokastra Castle in Albania
 , ,
, ,
Abstract
:Featured Application
Abstract
1. Introduction
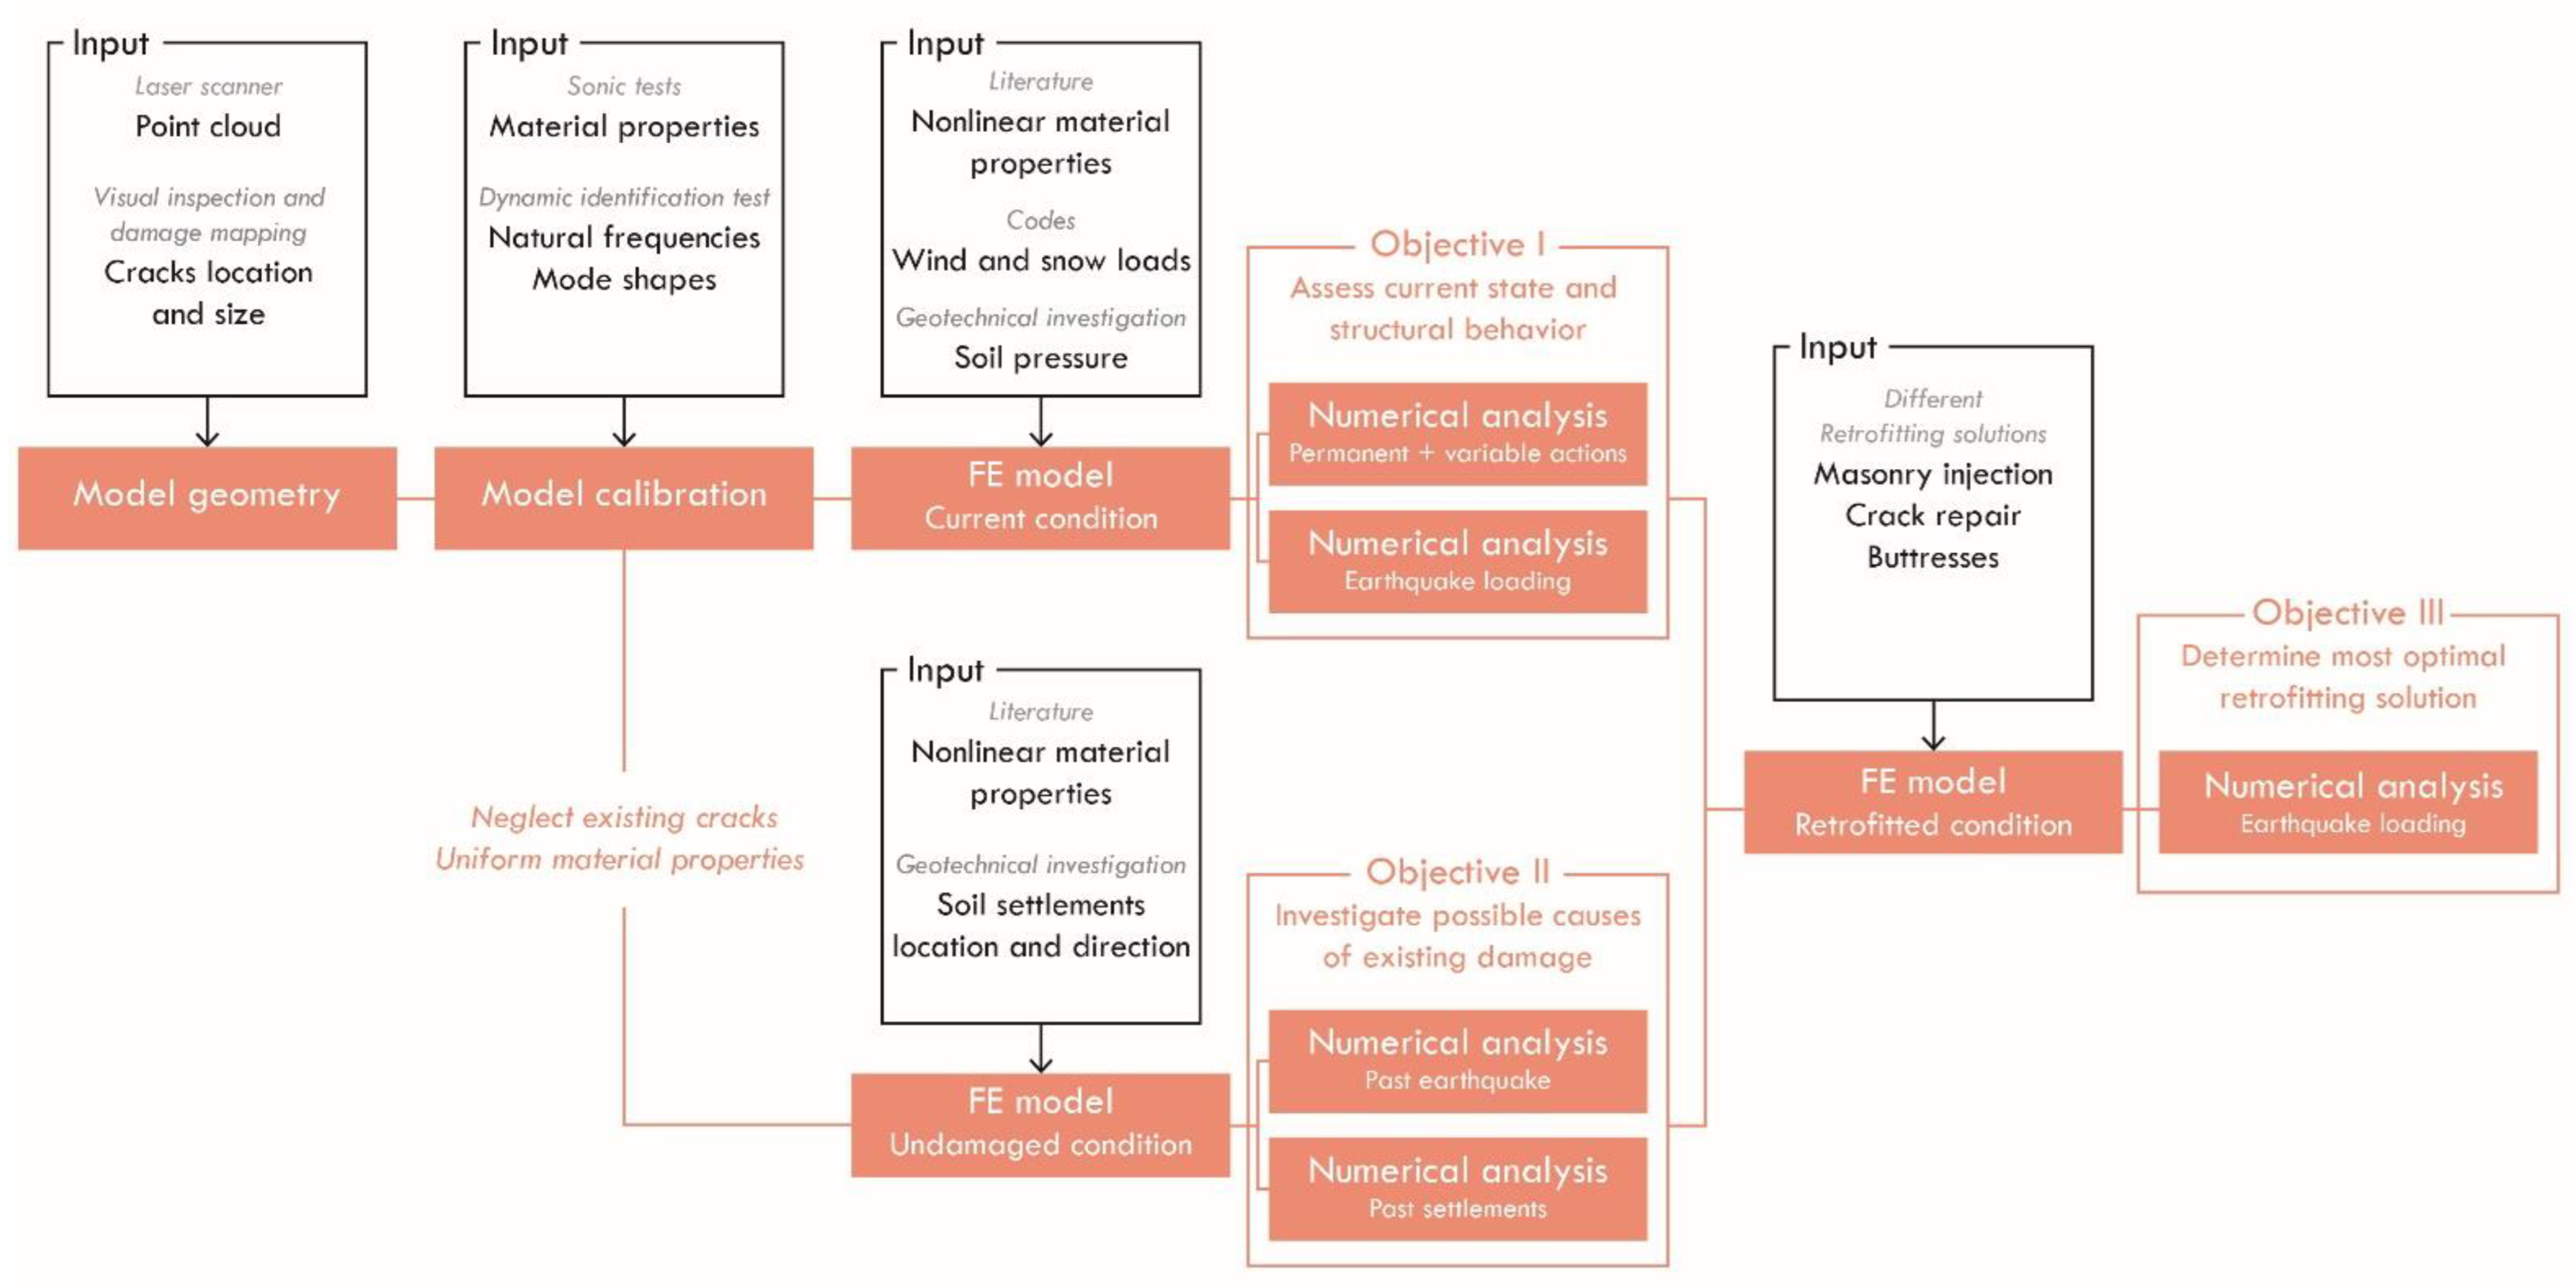
2. Applied Methodology
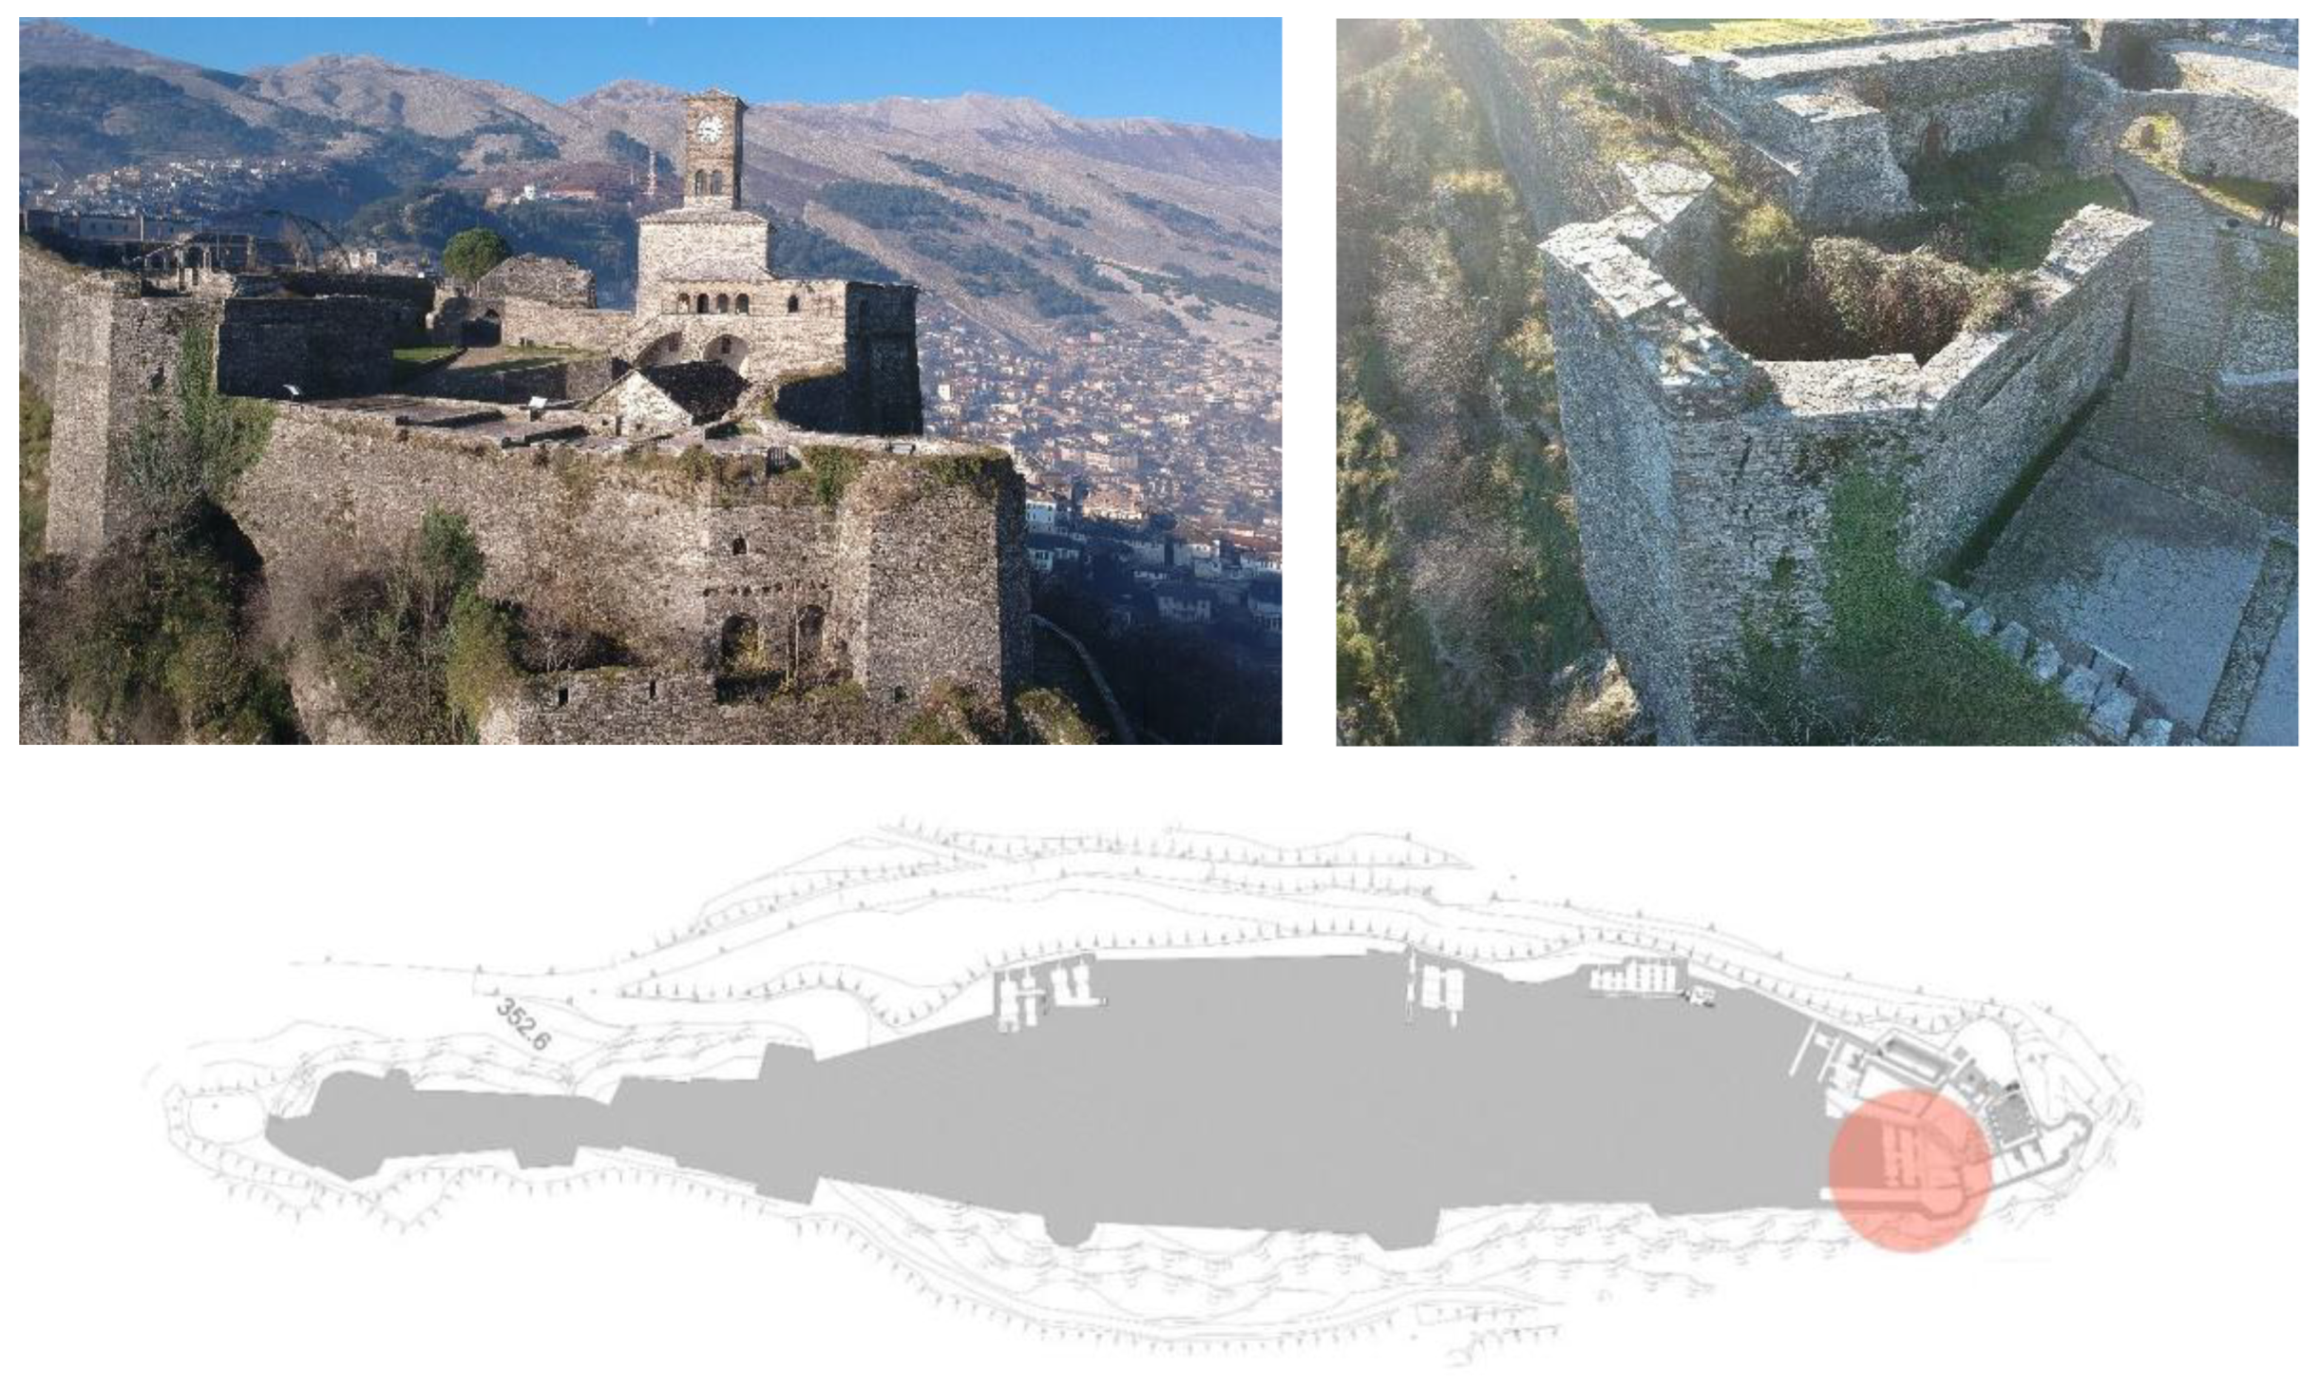
3. Description of the Building
4. Non-Destructive Investigation
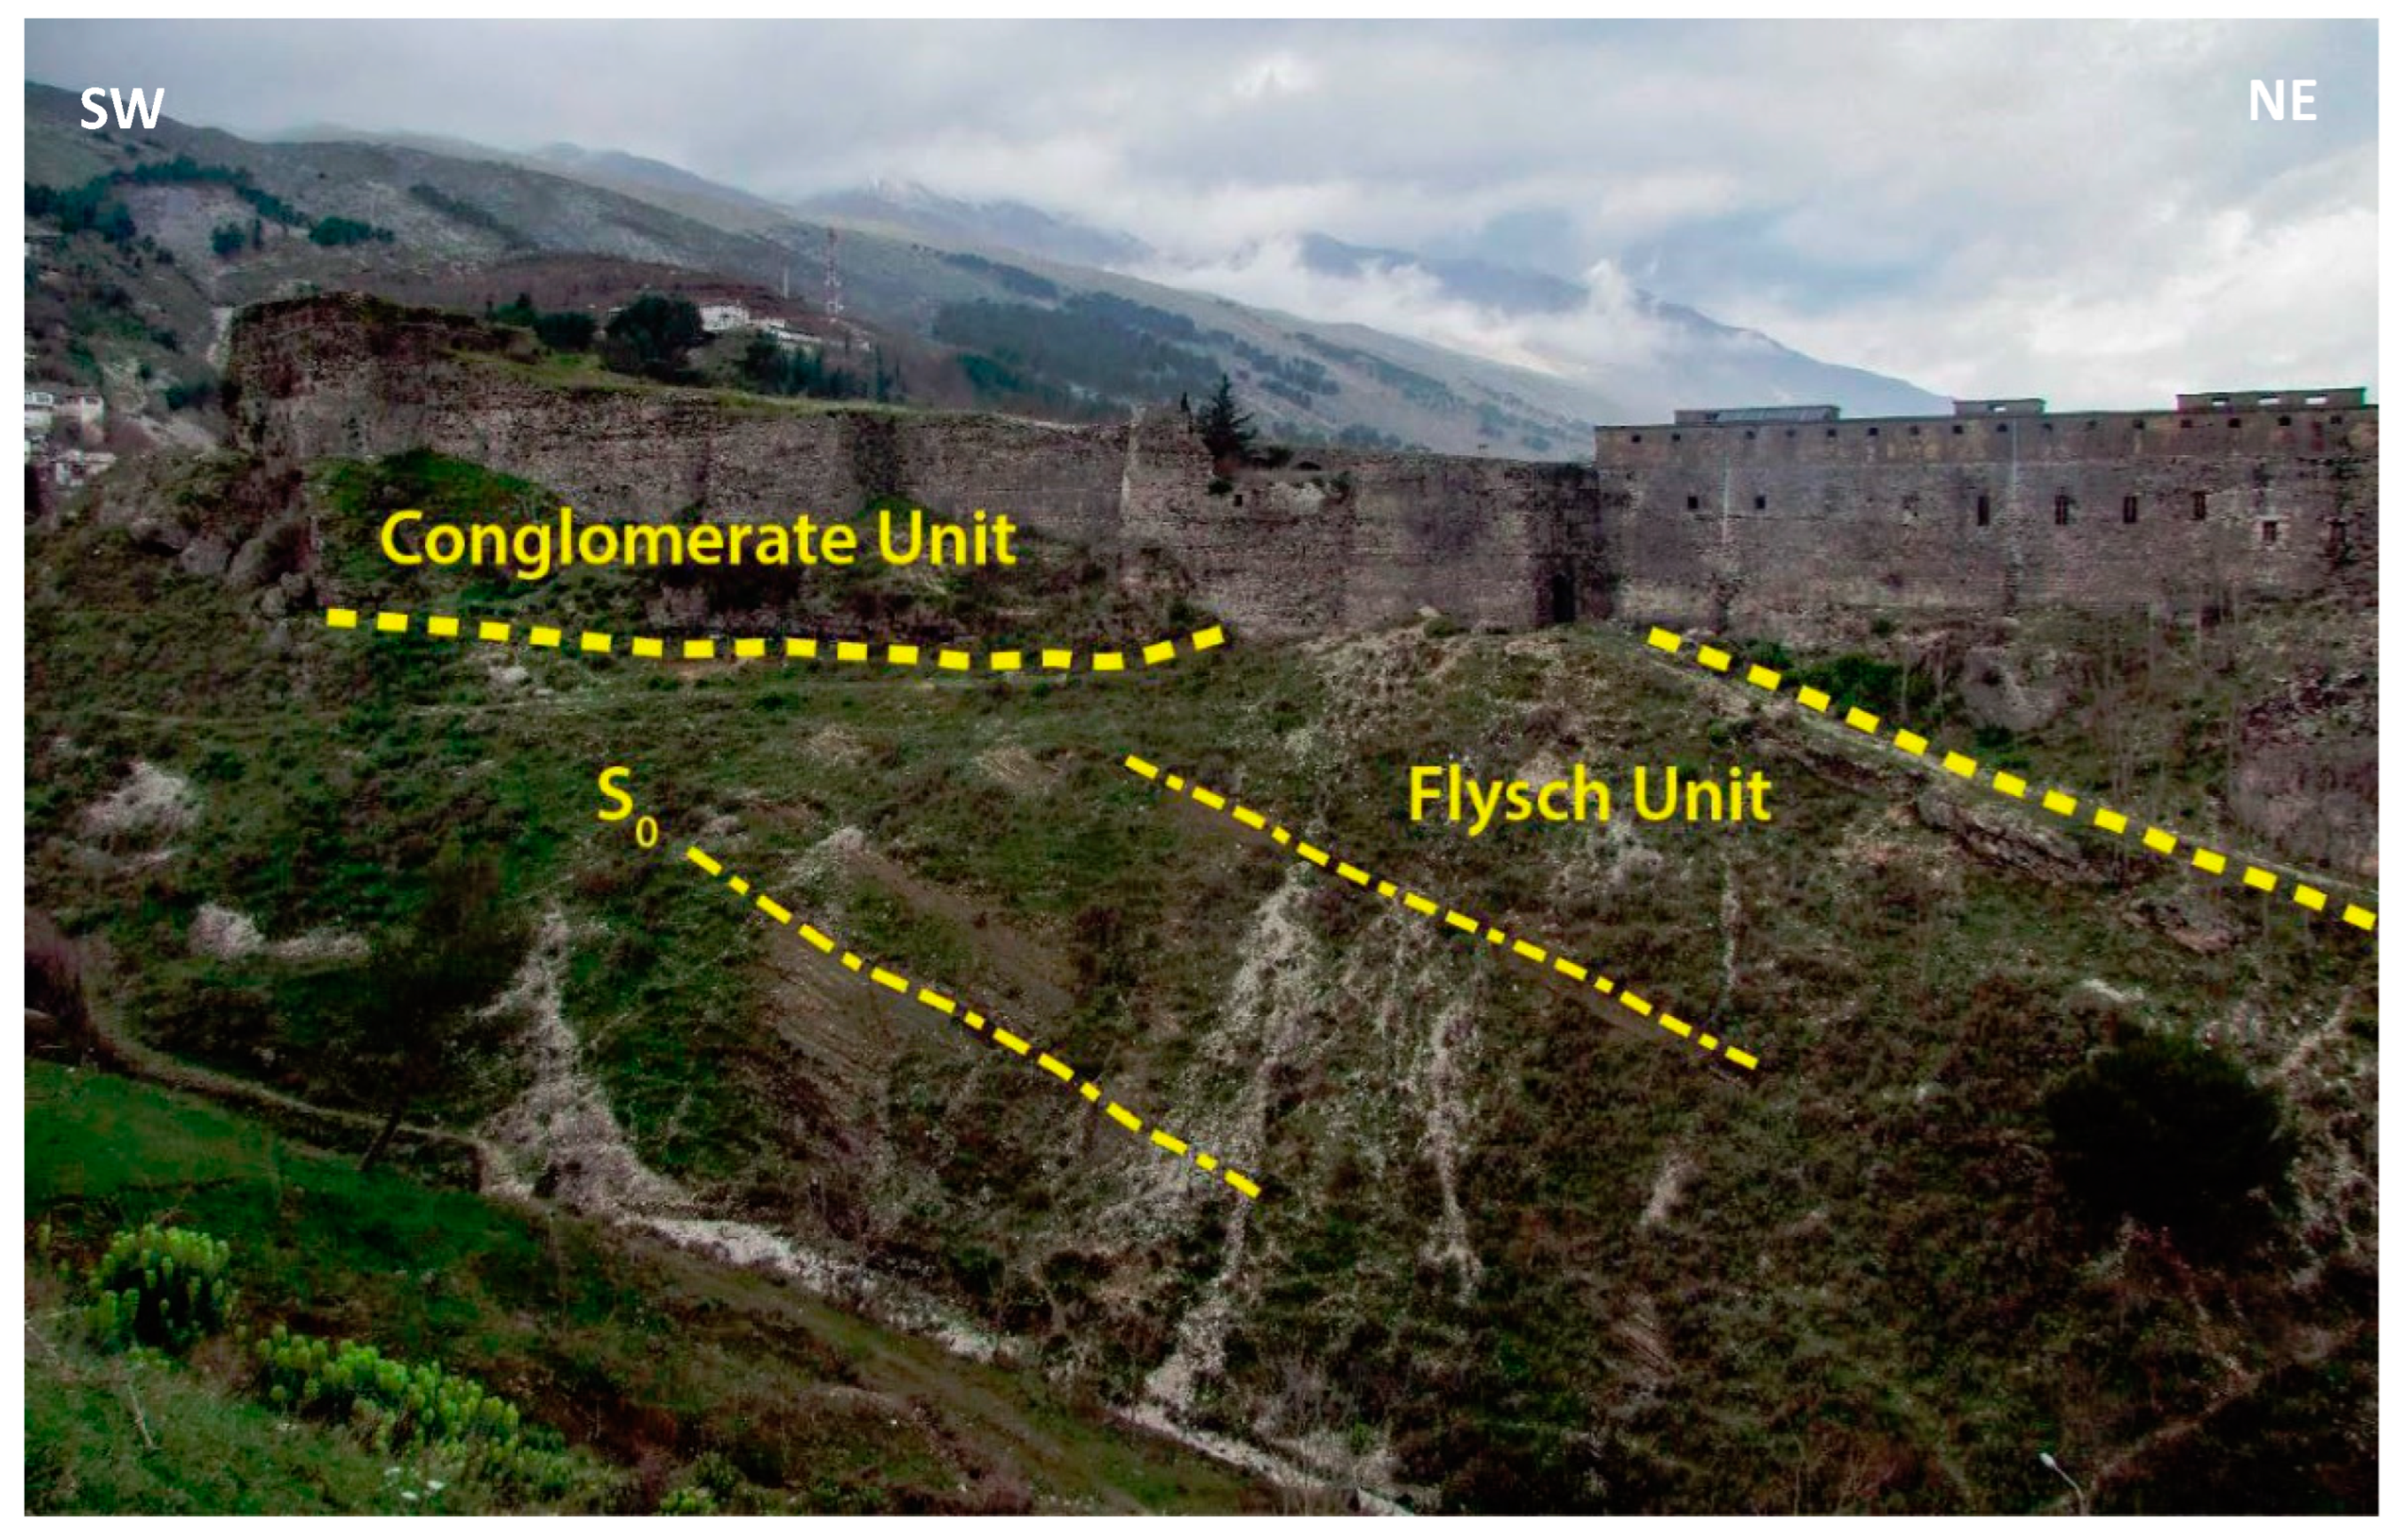
4.1. Geological and Geotechnical Investigation
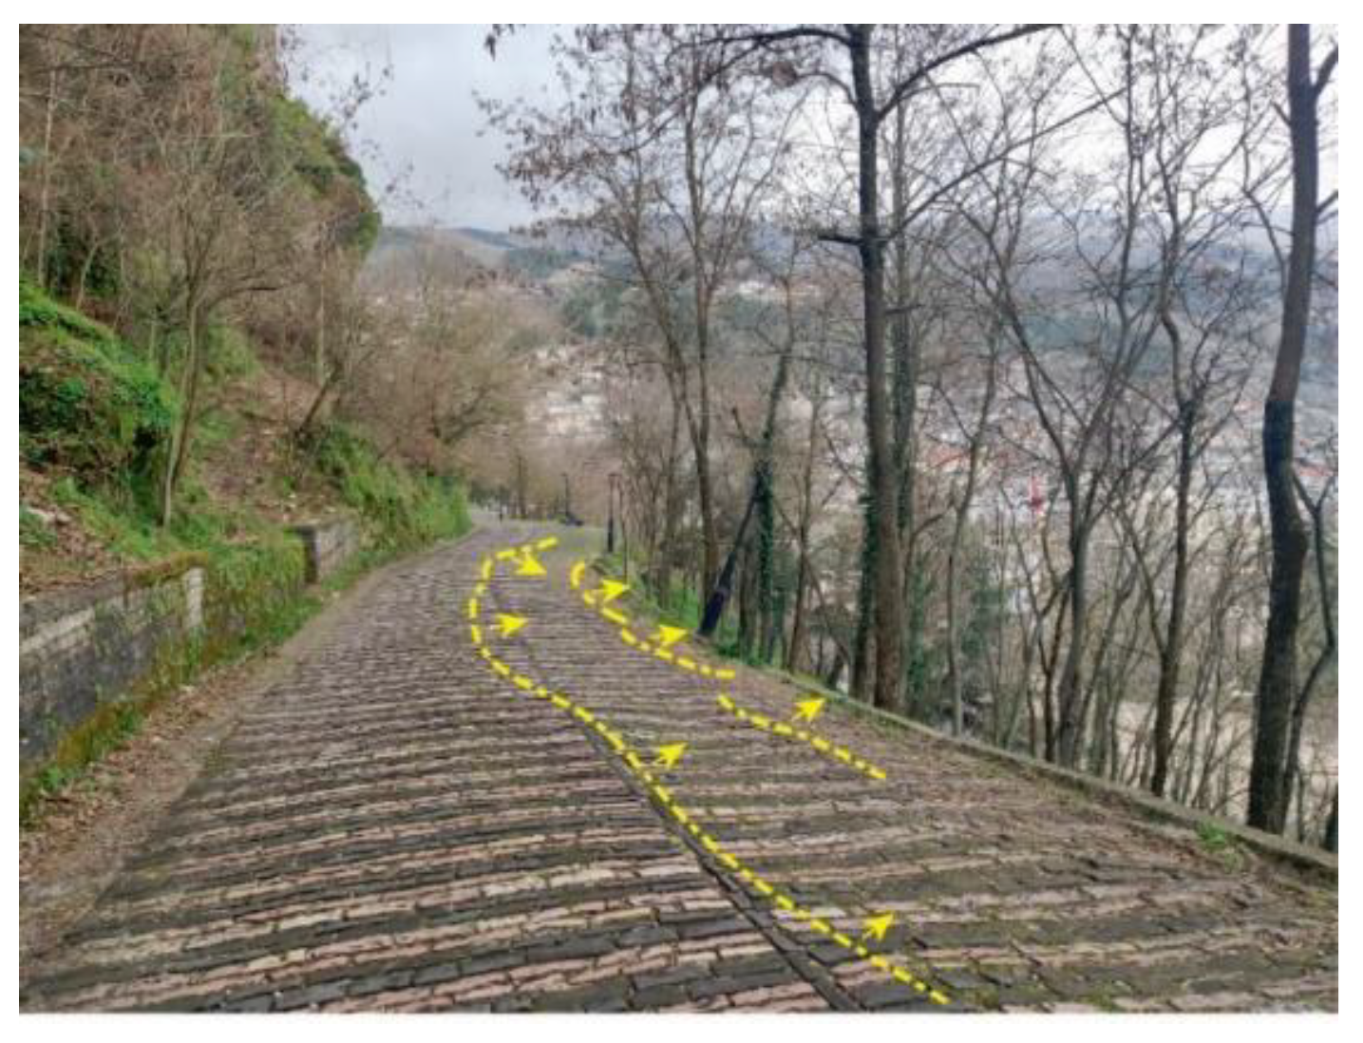
4.1.1. Geological, Geotechnical and Geomorphological Maps
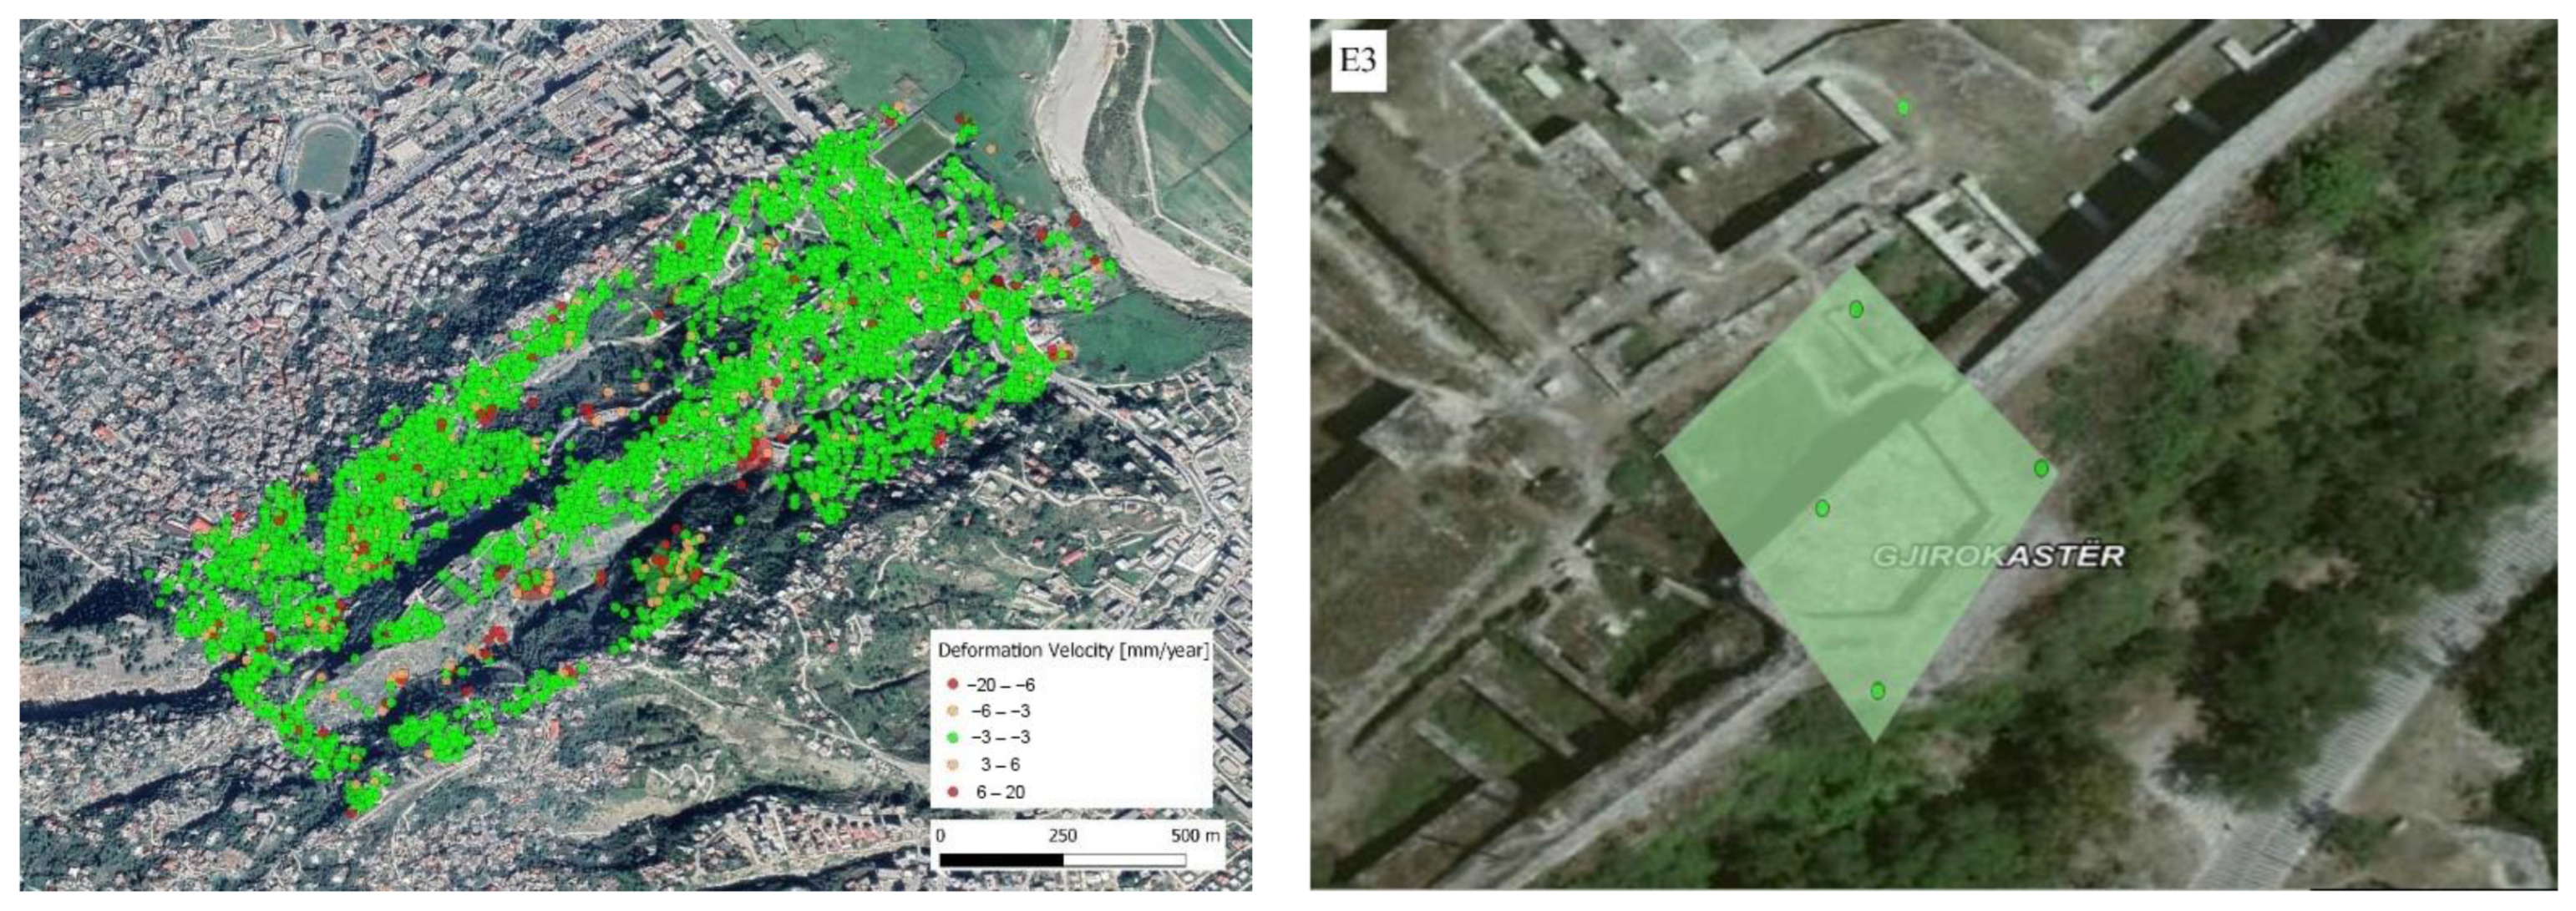
4.1.2. Remote Sensing Analysis: Persistent Scatterer Interferometry (PSI)
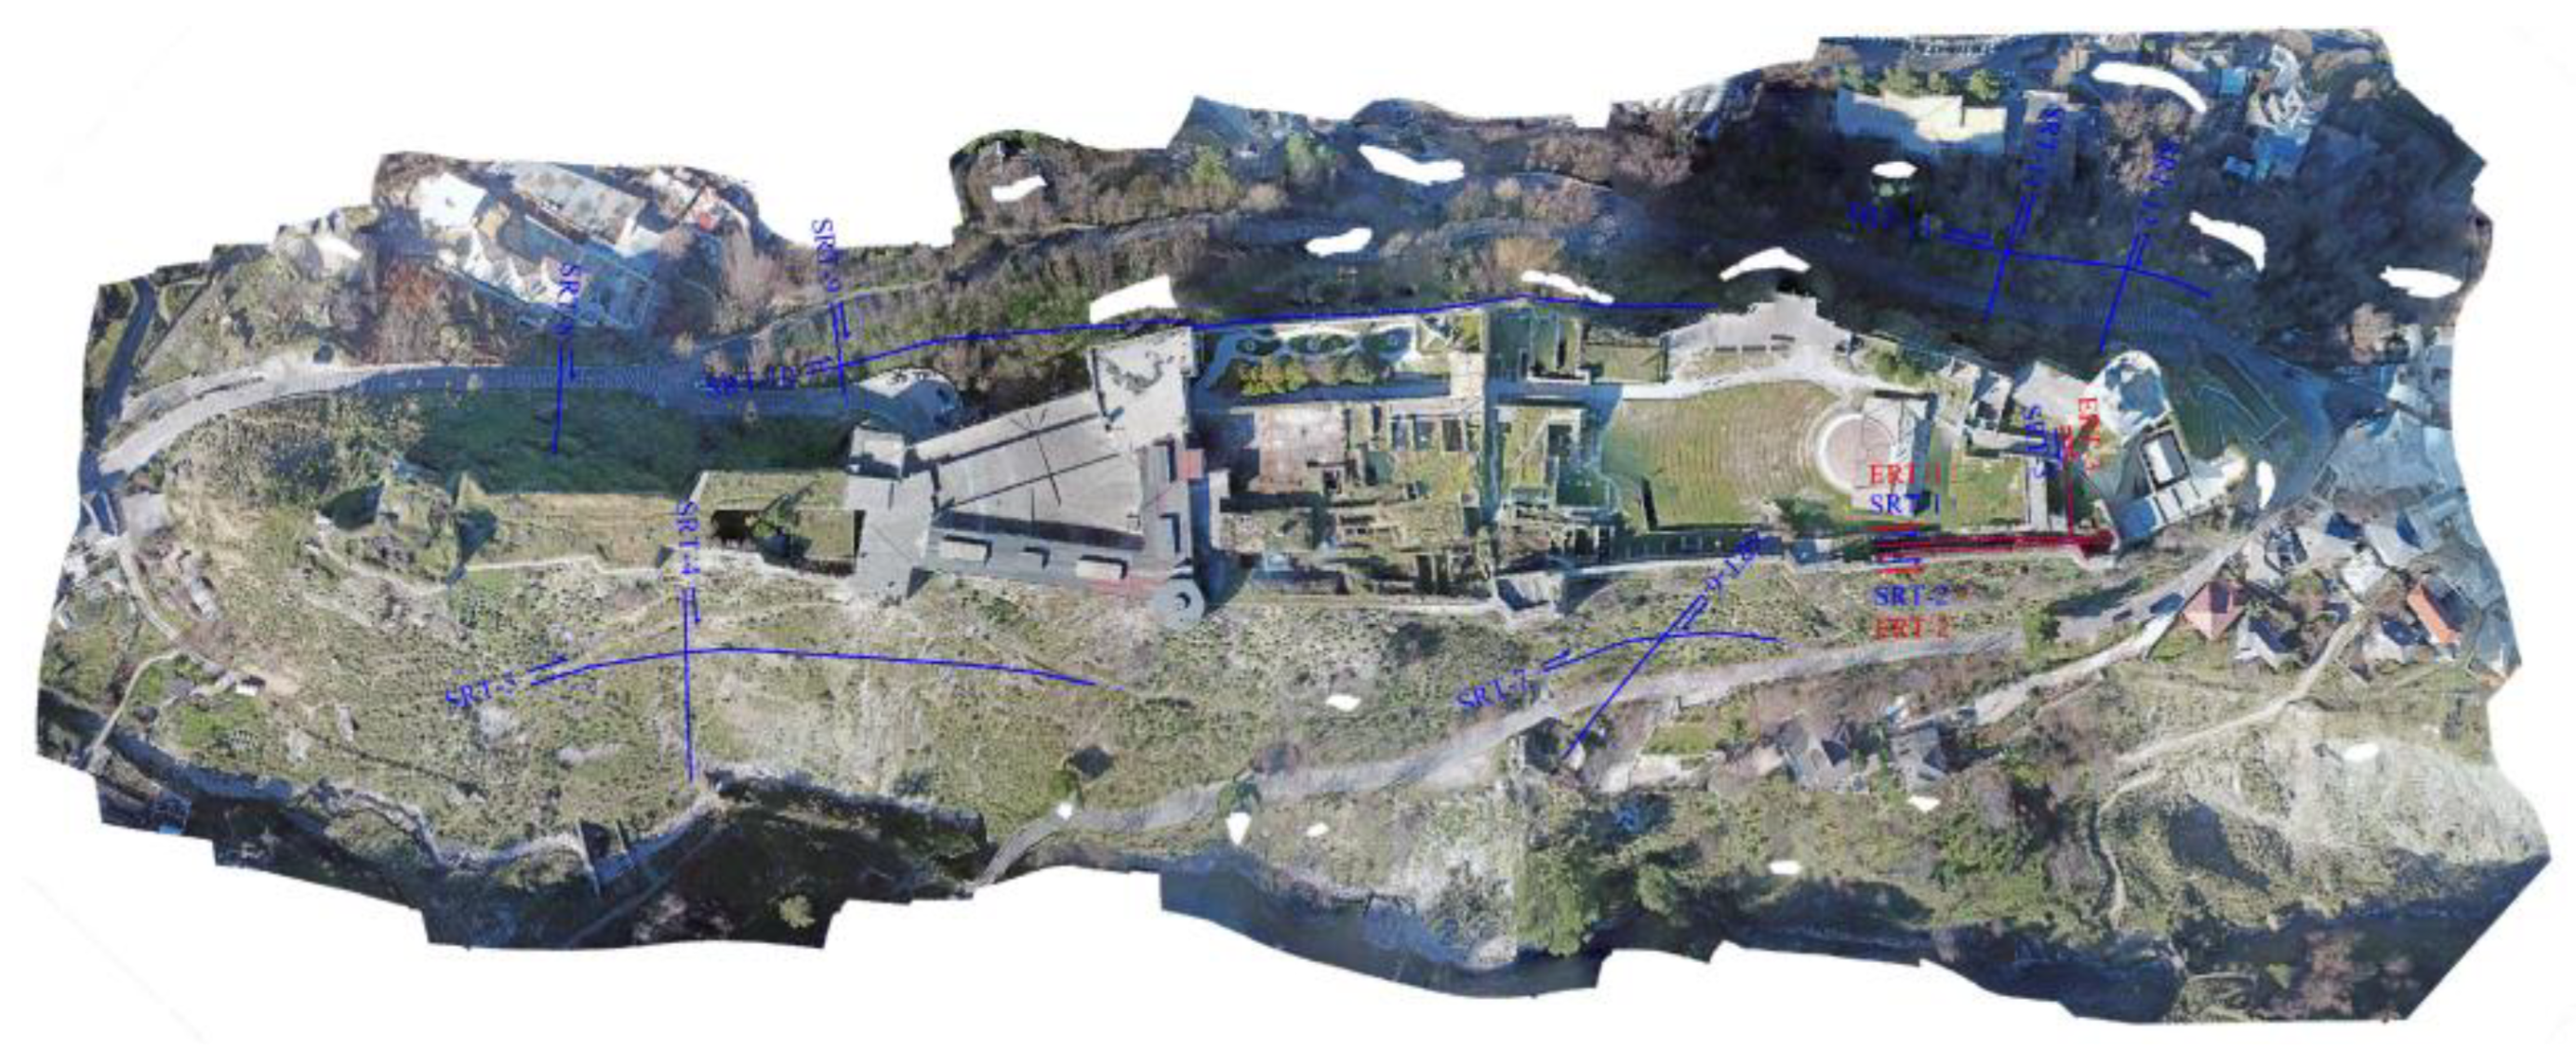
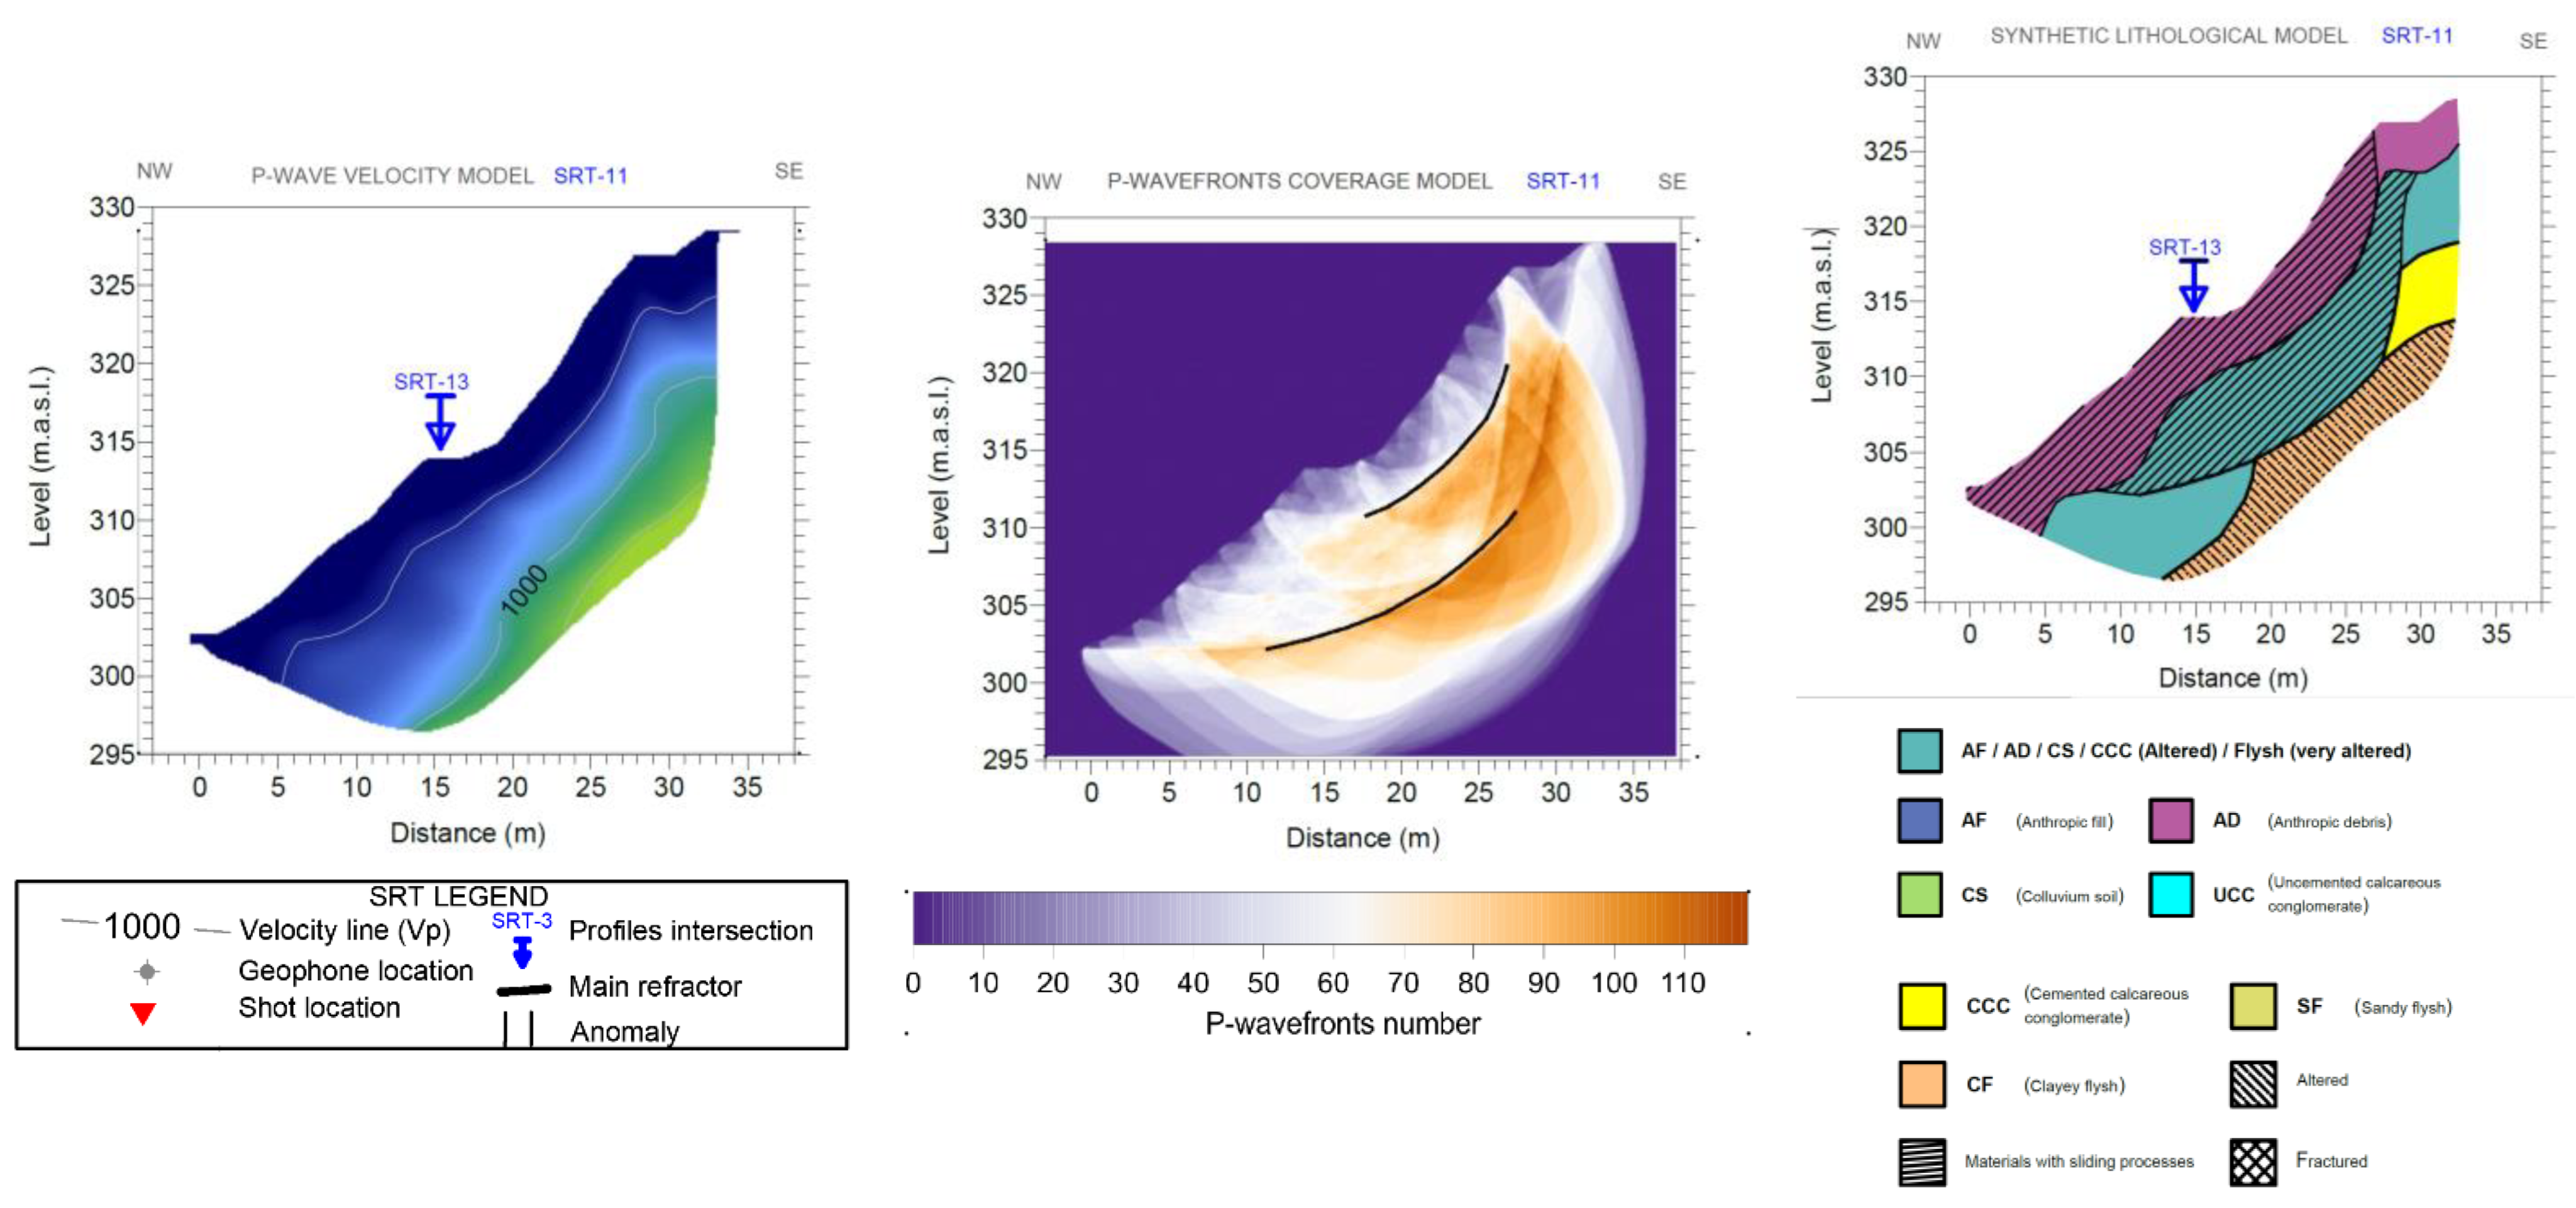
4.1.3. Multichannel Analysis of Surface Waves: Seismic Refraction Tomography
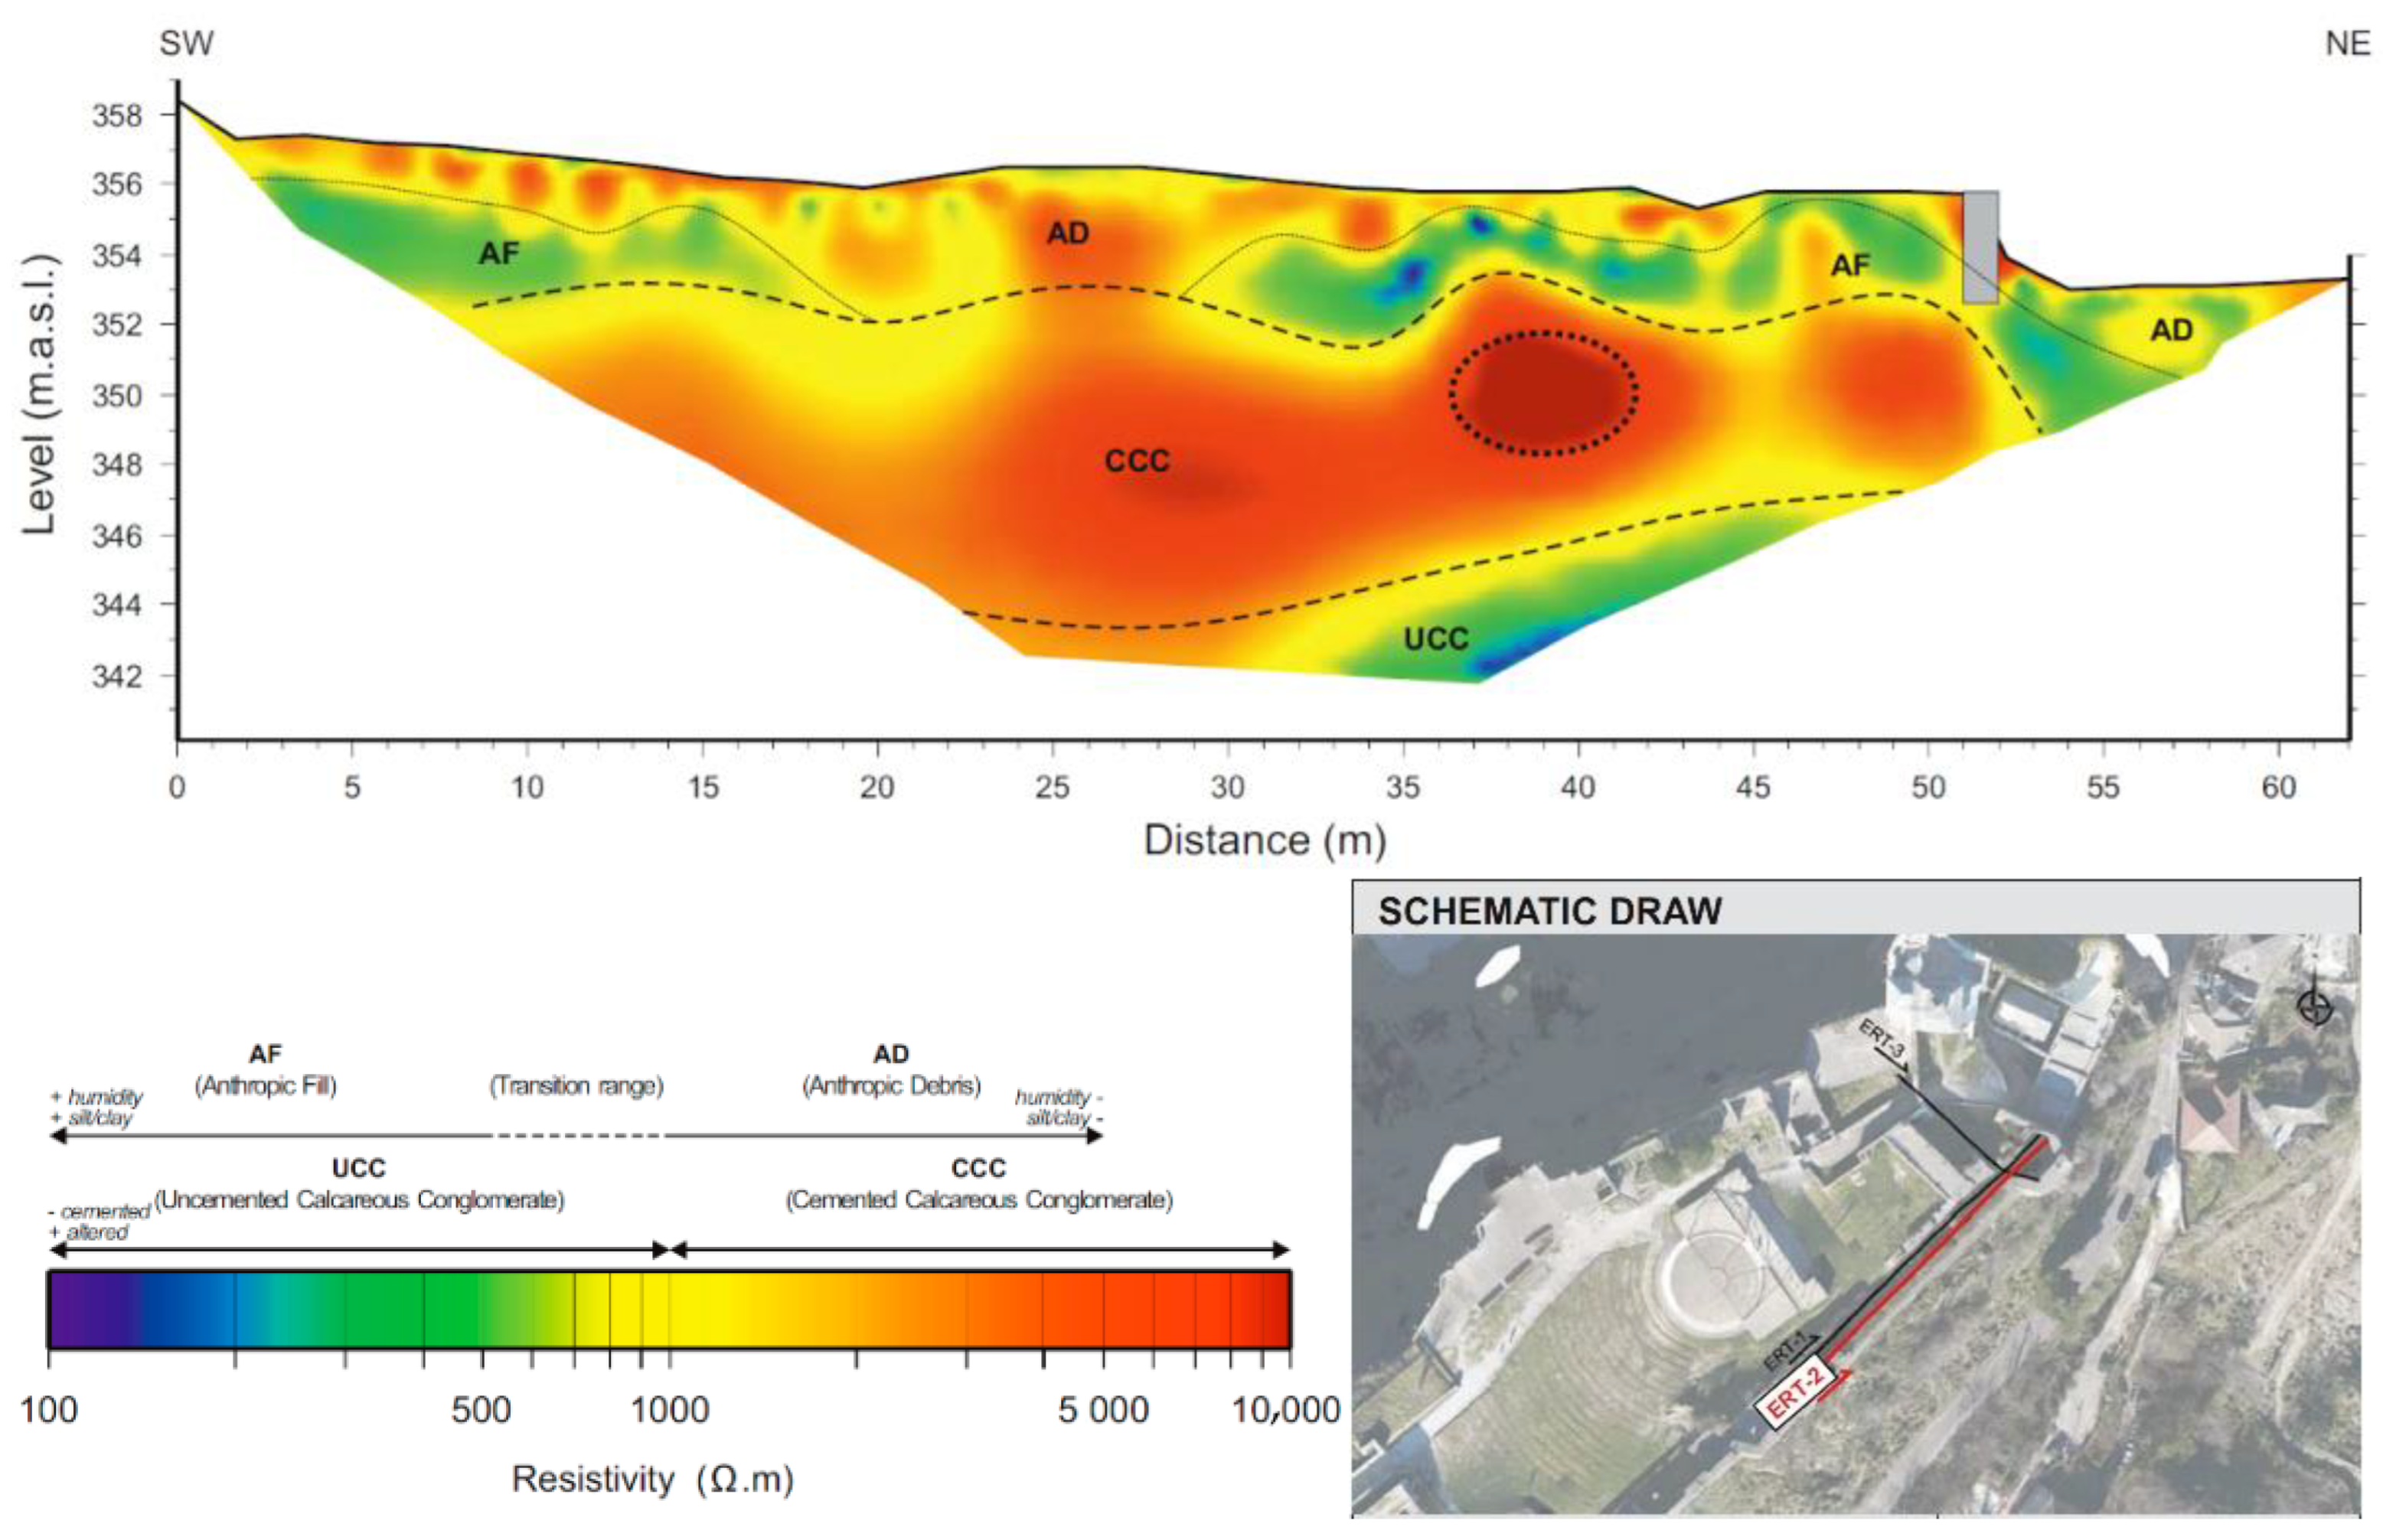
4.1.4. Electrical Resistivity Tomography (ERT)
4.2. Structural Investigation
4.2.1. Visual Inspection
4.2.2. LiDAR
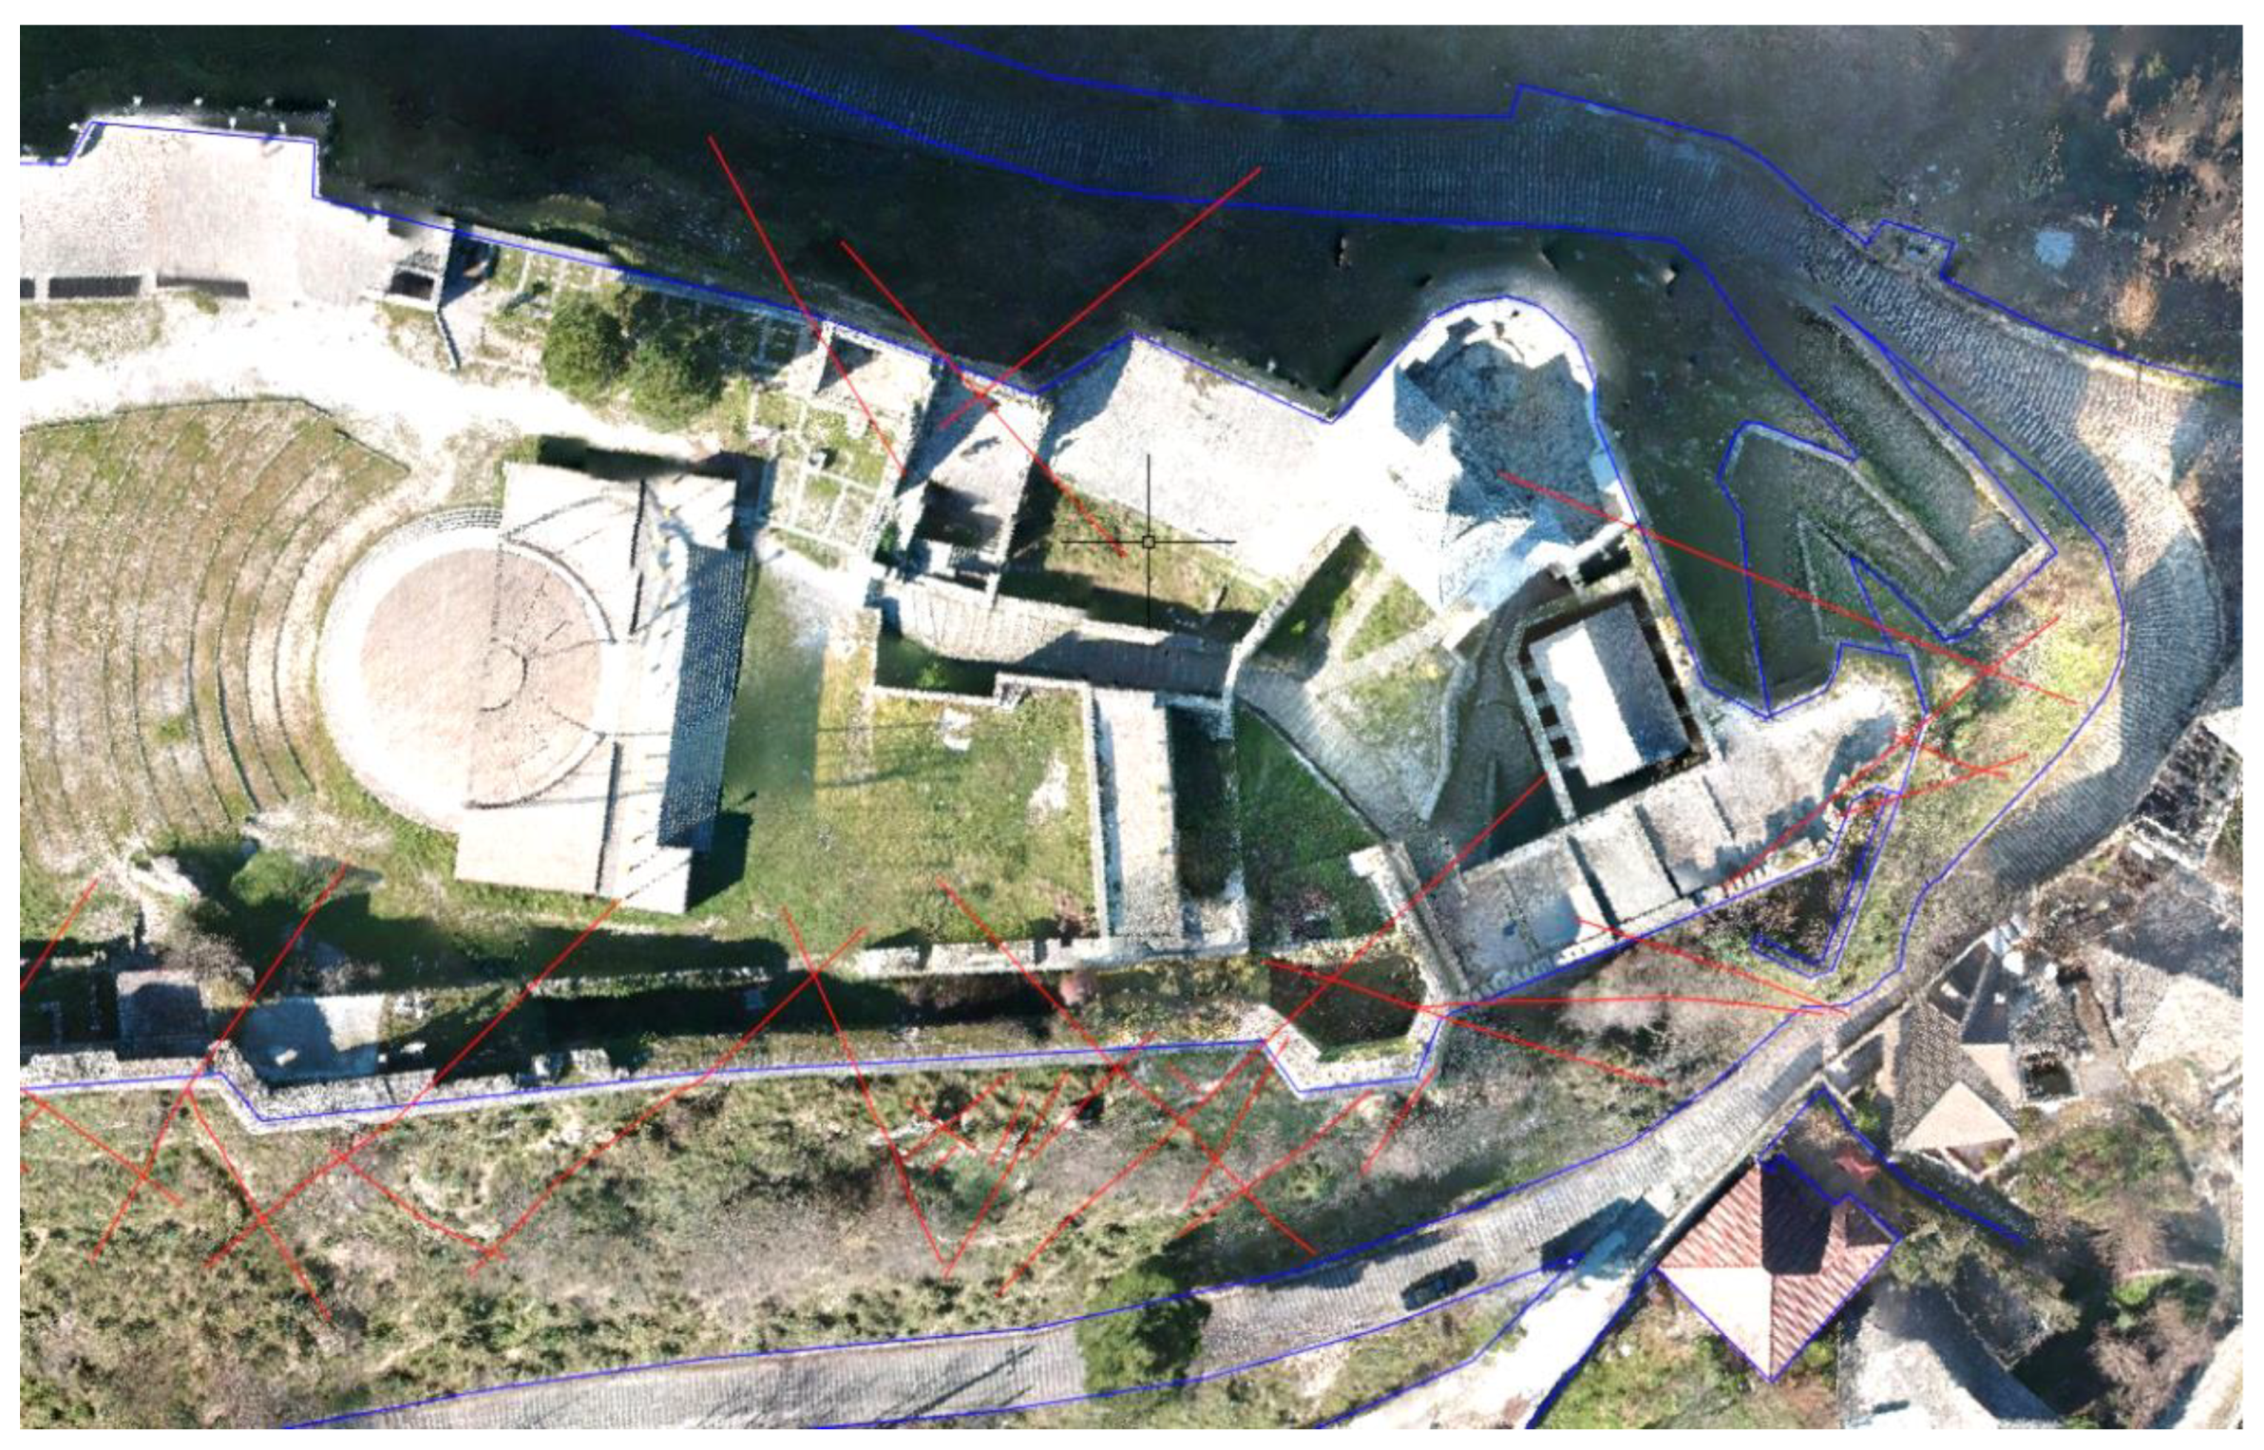
4.2.3. Drone Photogrammetry
4.2.4. Material Sampling and Testing
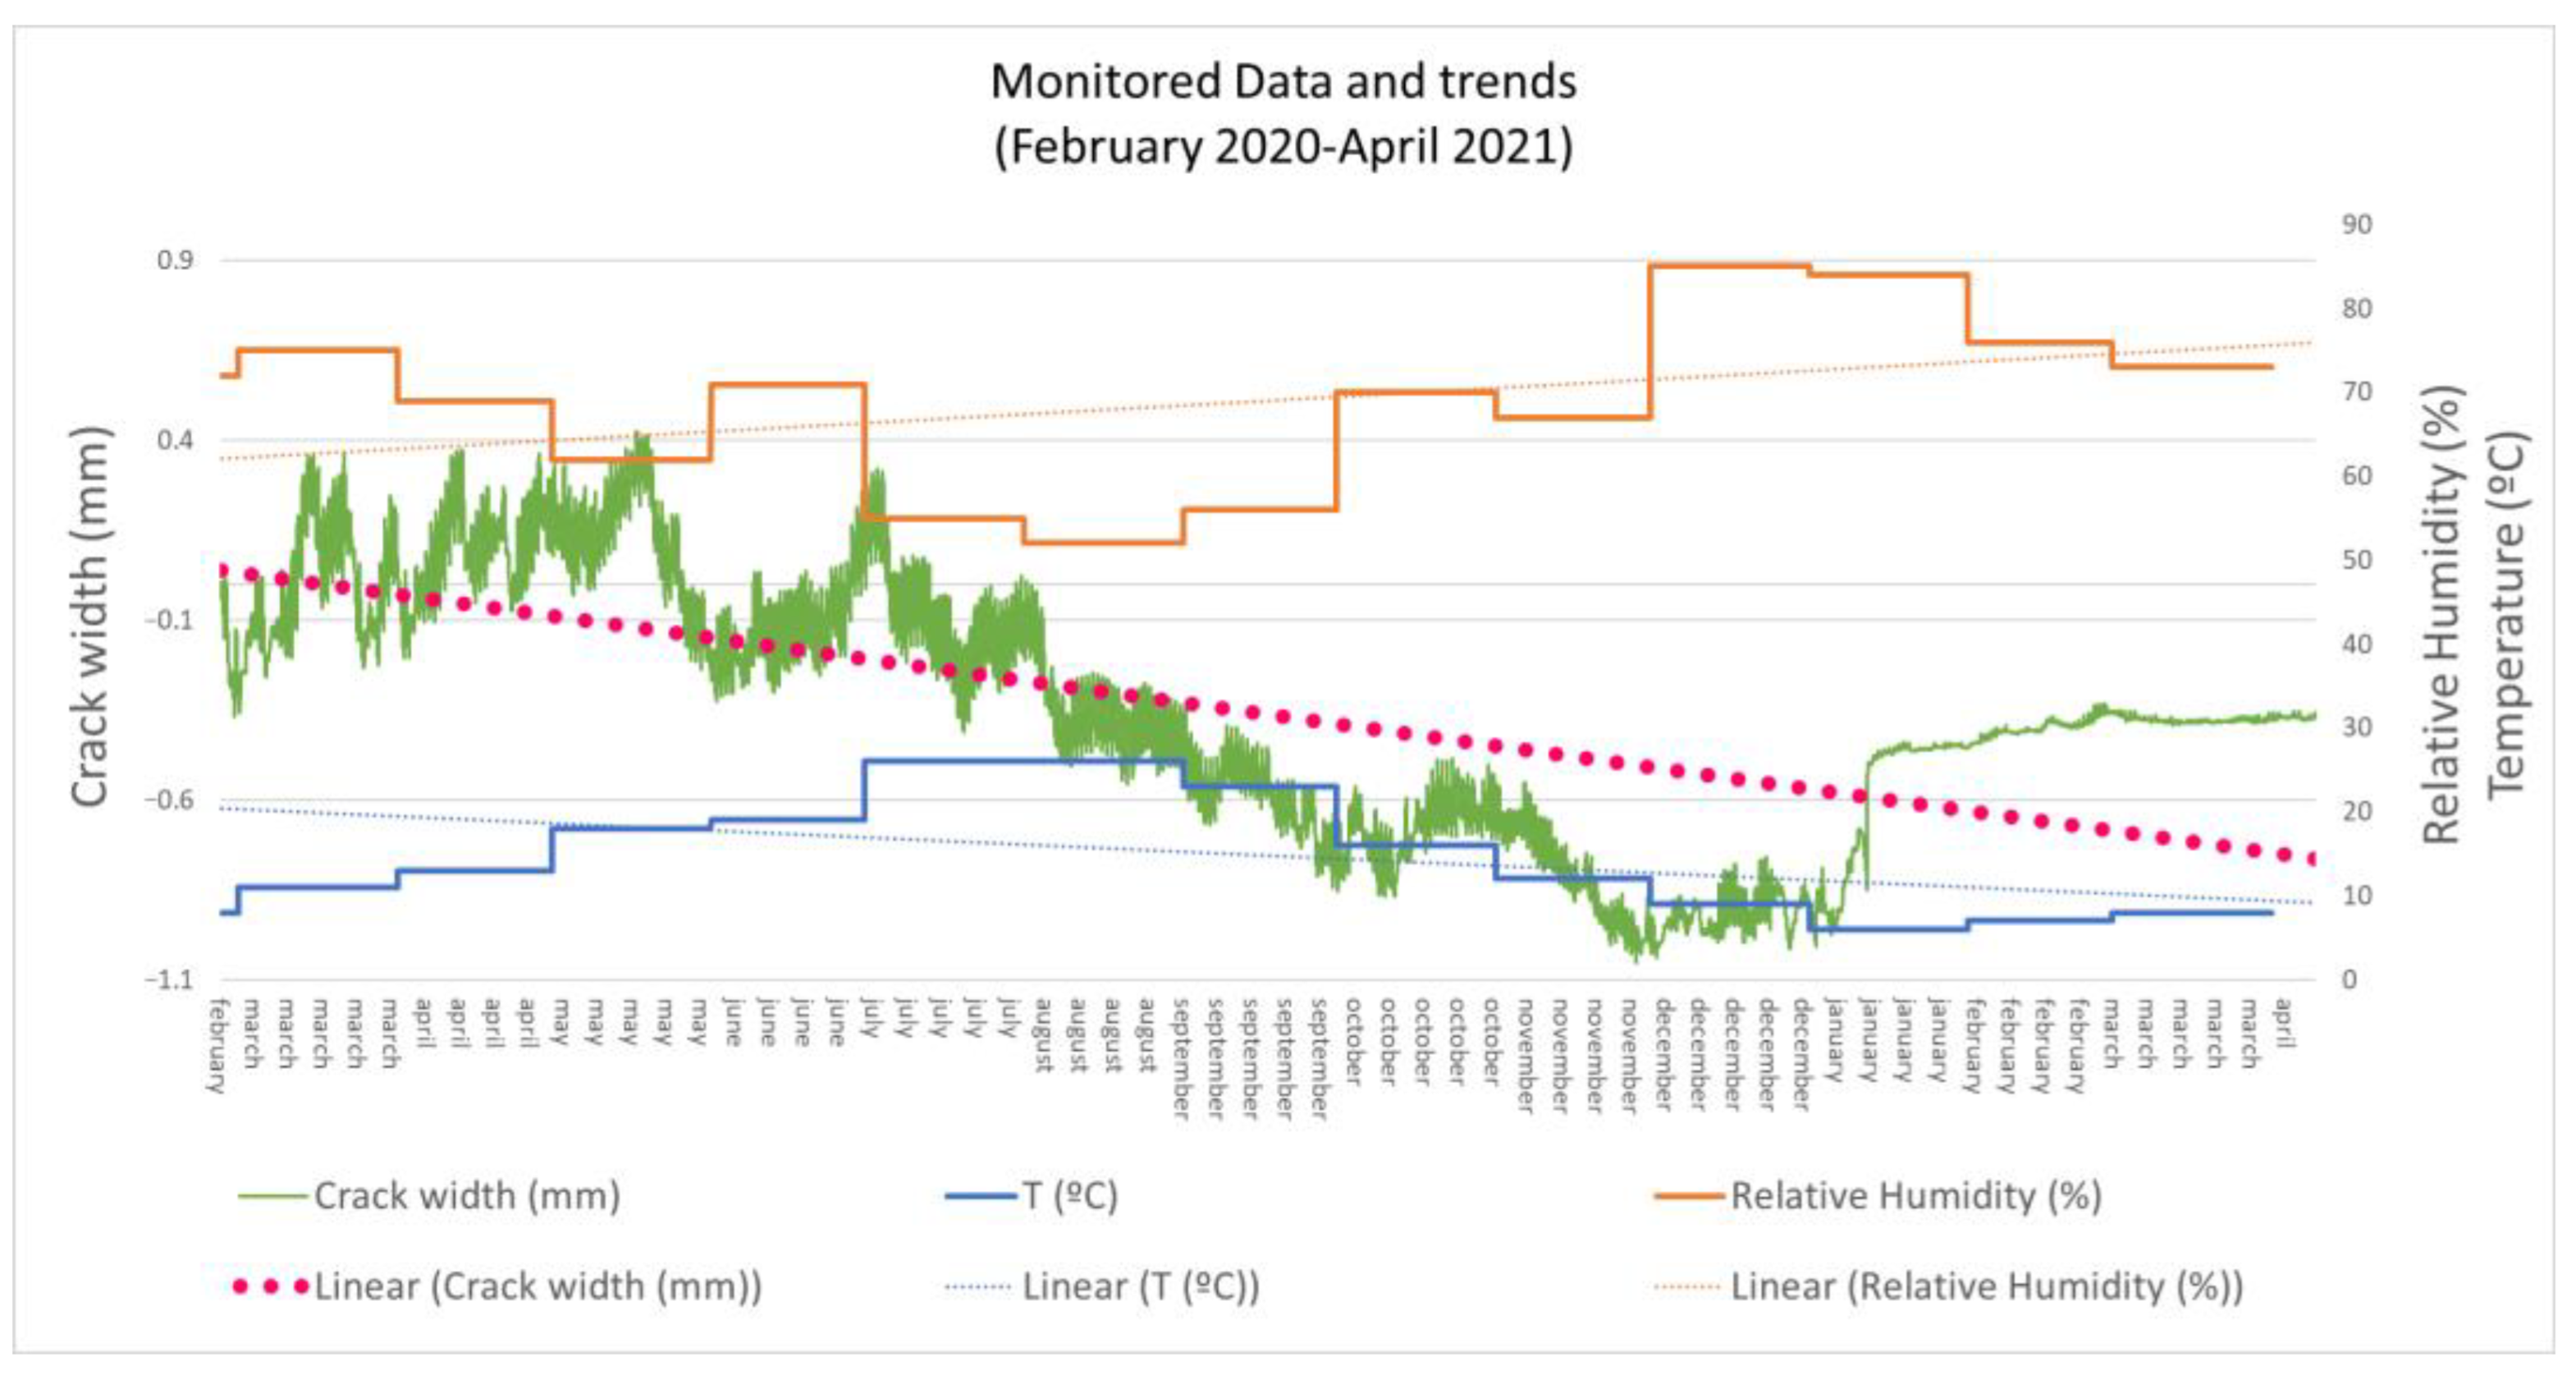
4.2.5. Monitoring
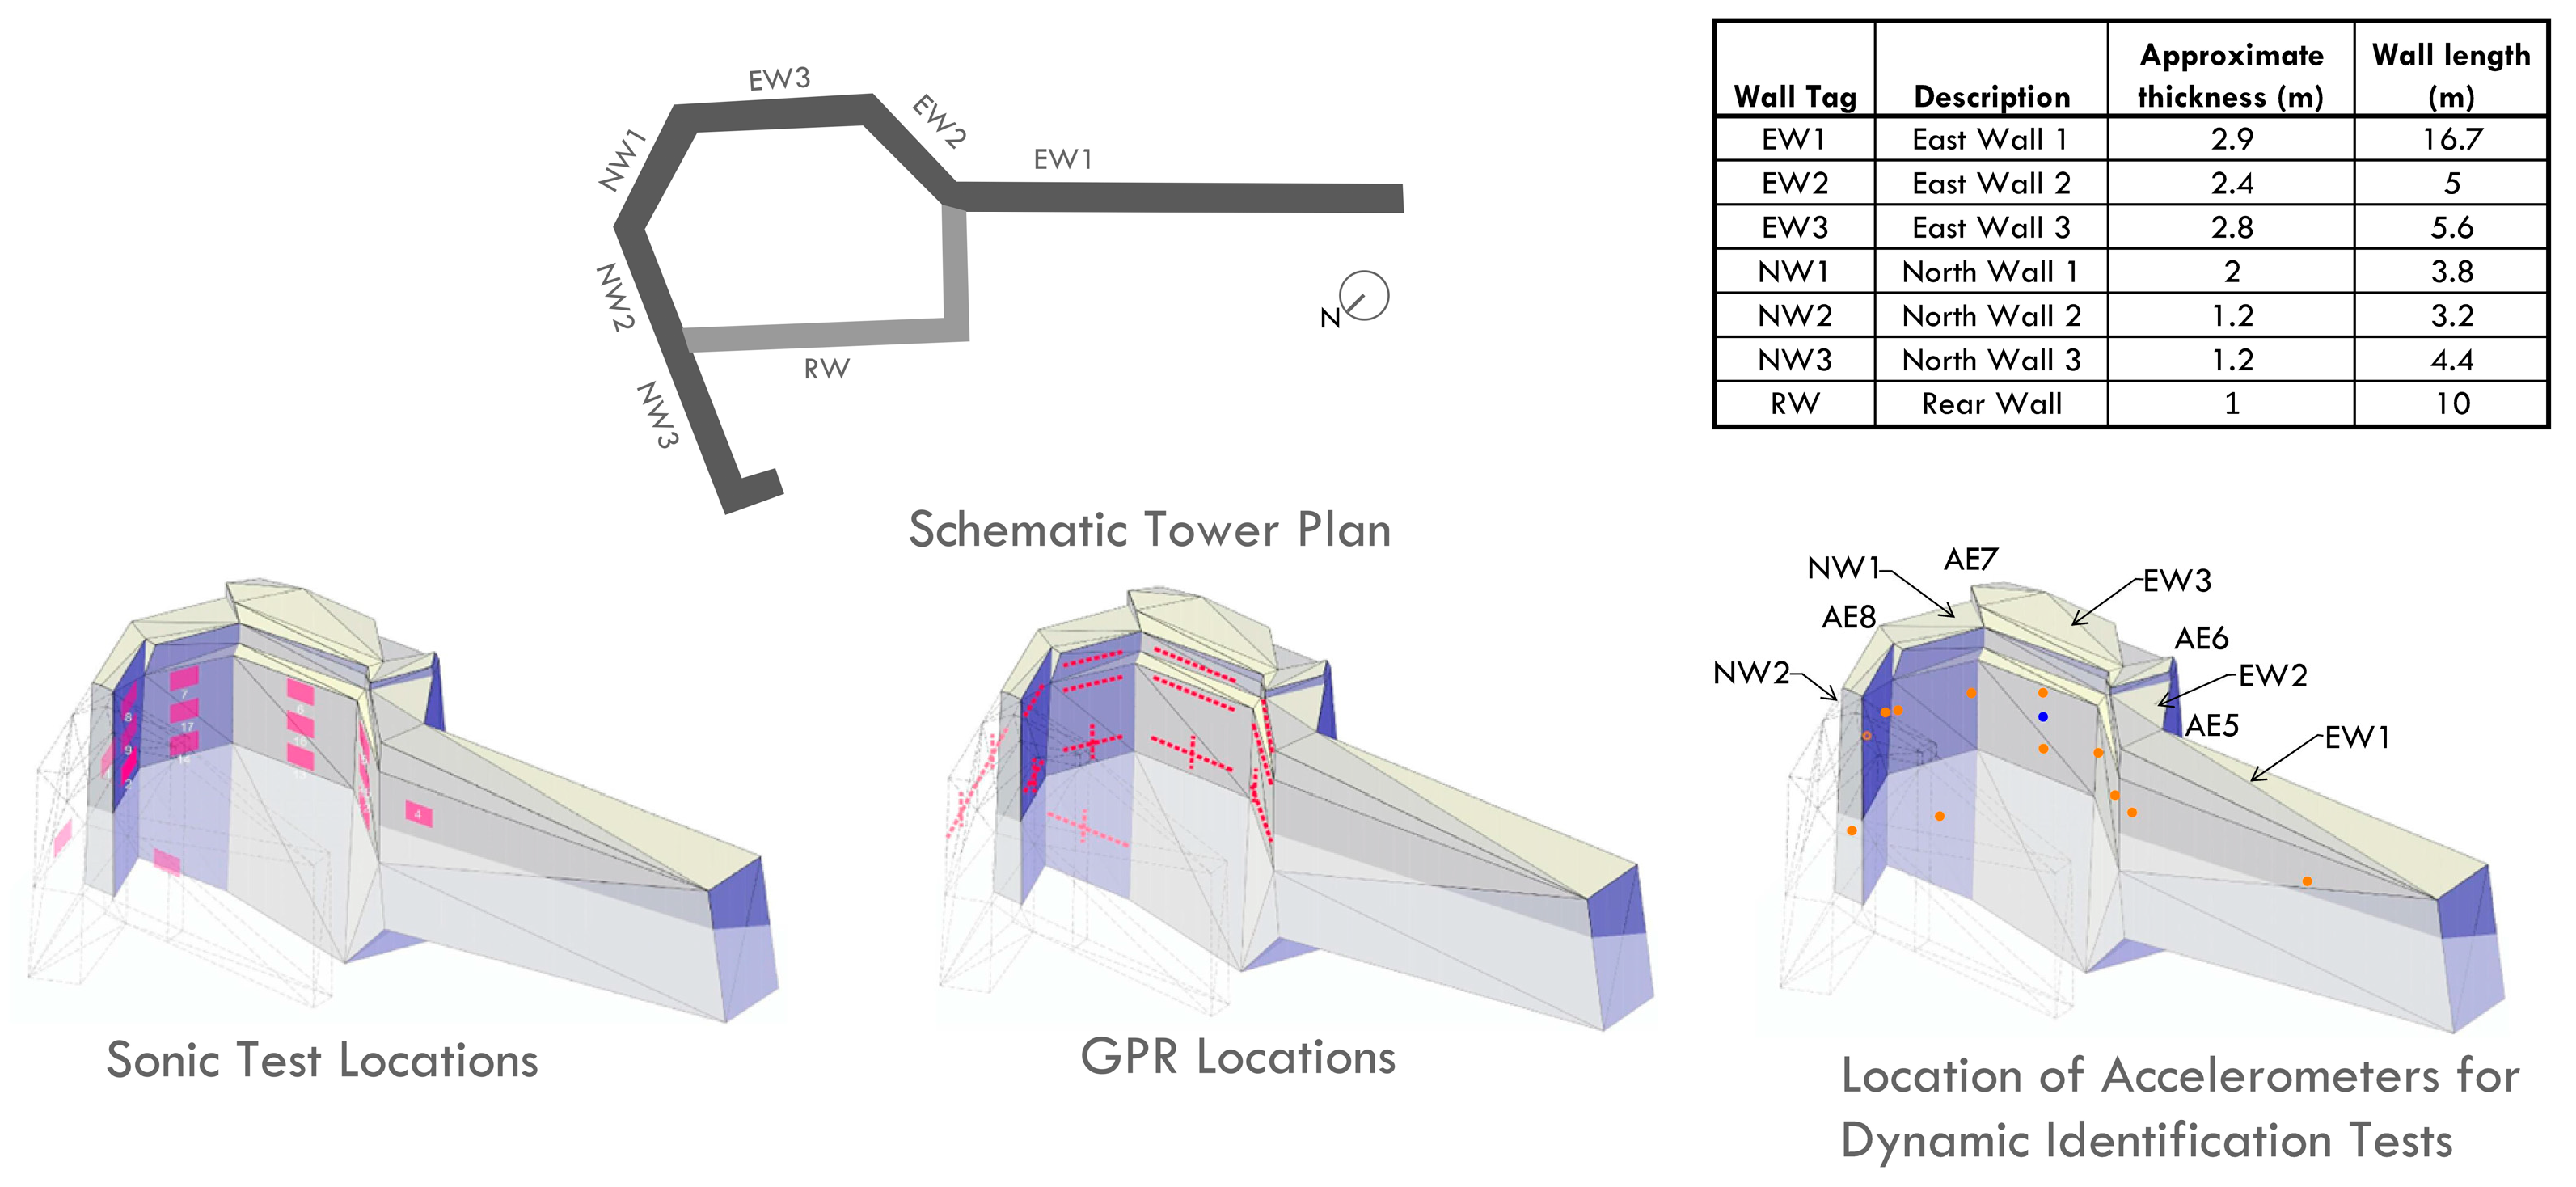
4.2.6. Sonic-Pulse Velocity Tests
4.2.7. Ground-Penetrating Radar (GPR)
4.2.8. Dynamic Investigation
5. Safety Assessment
5.1. Geological–Geotechnical Assessment
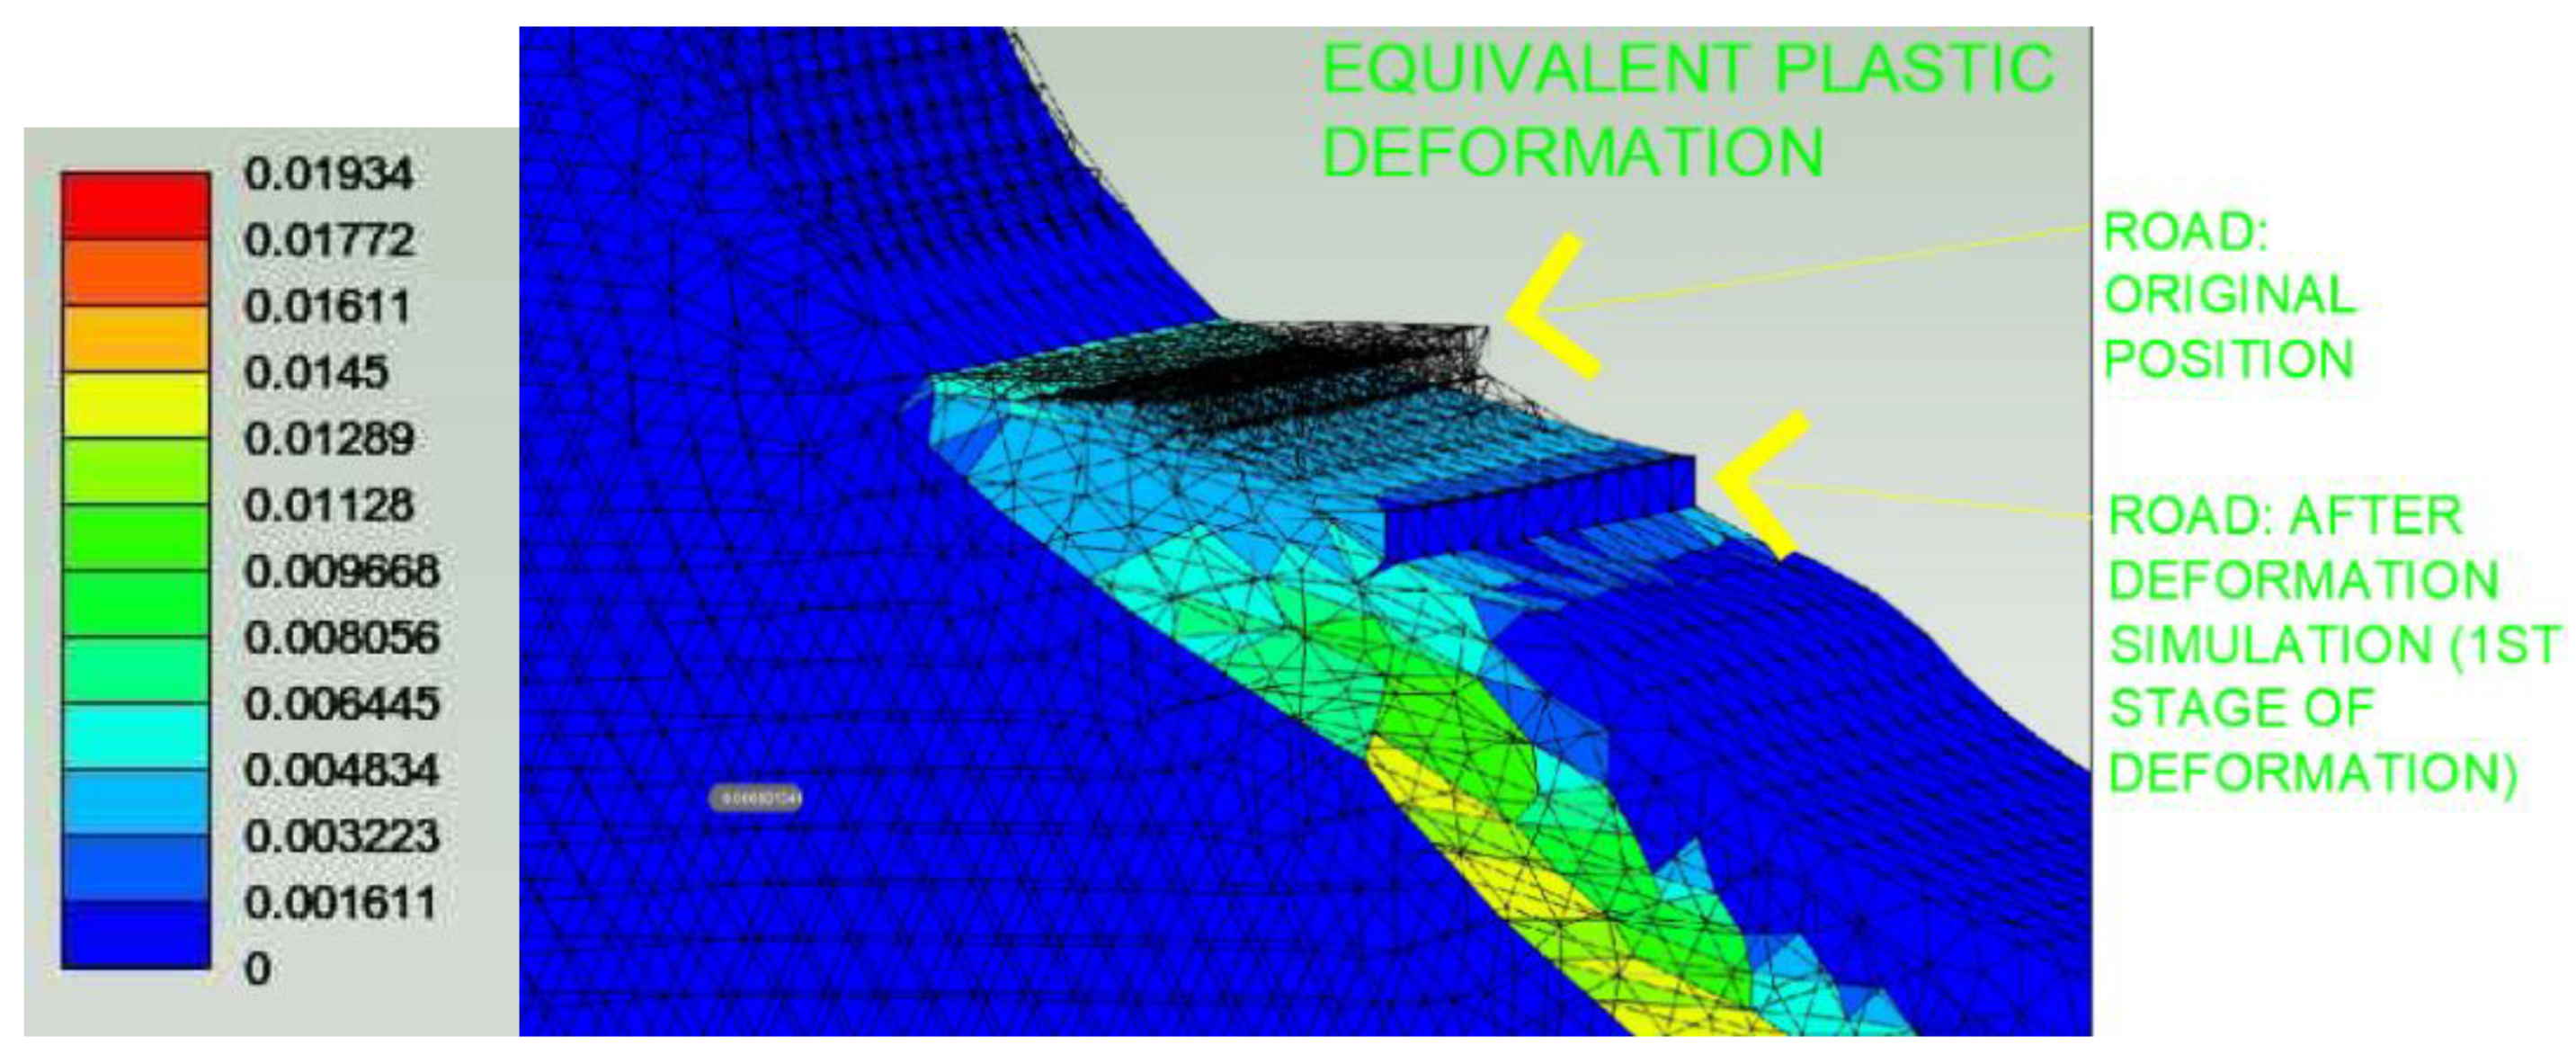
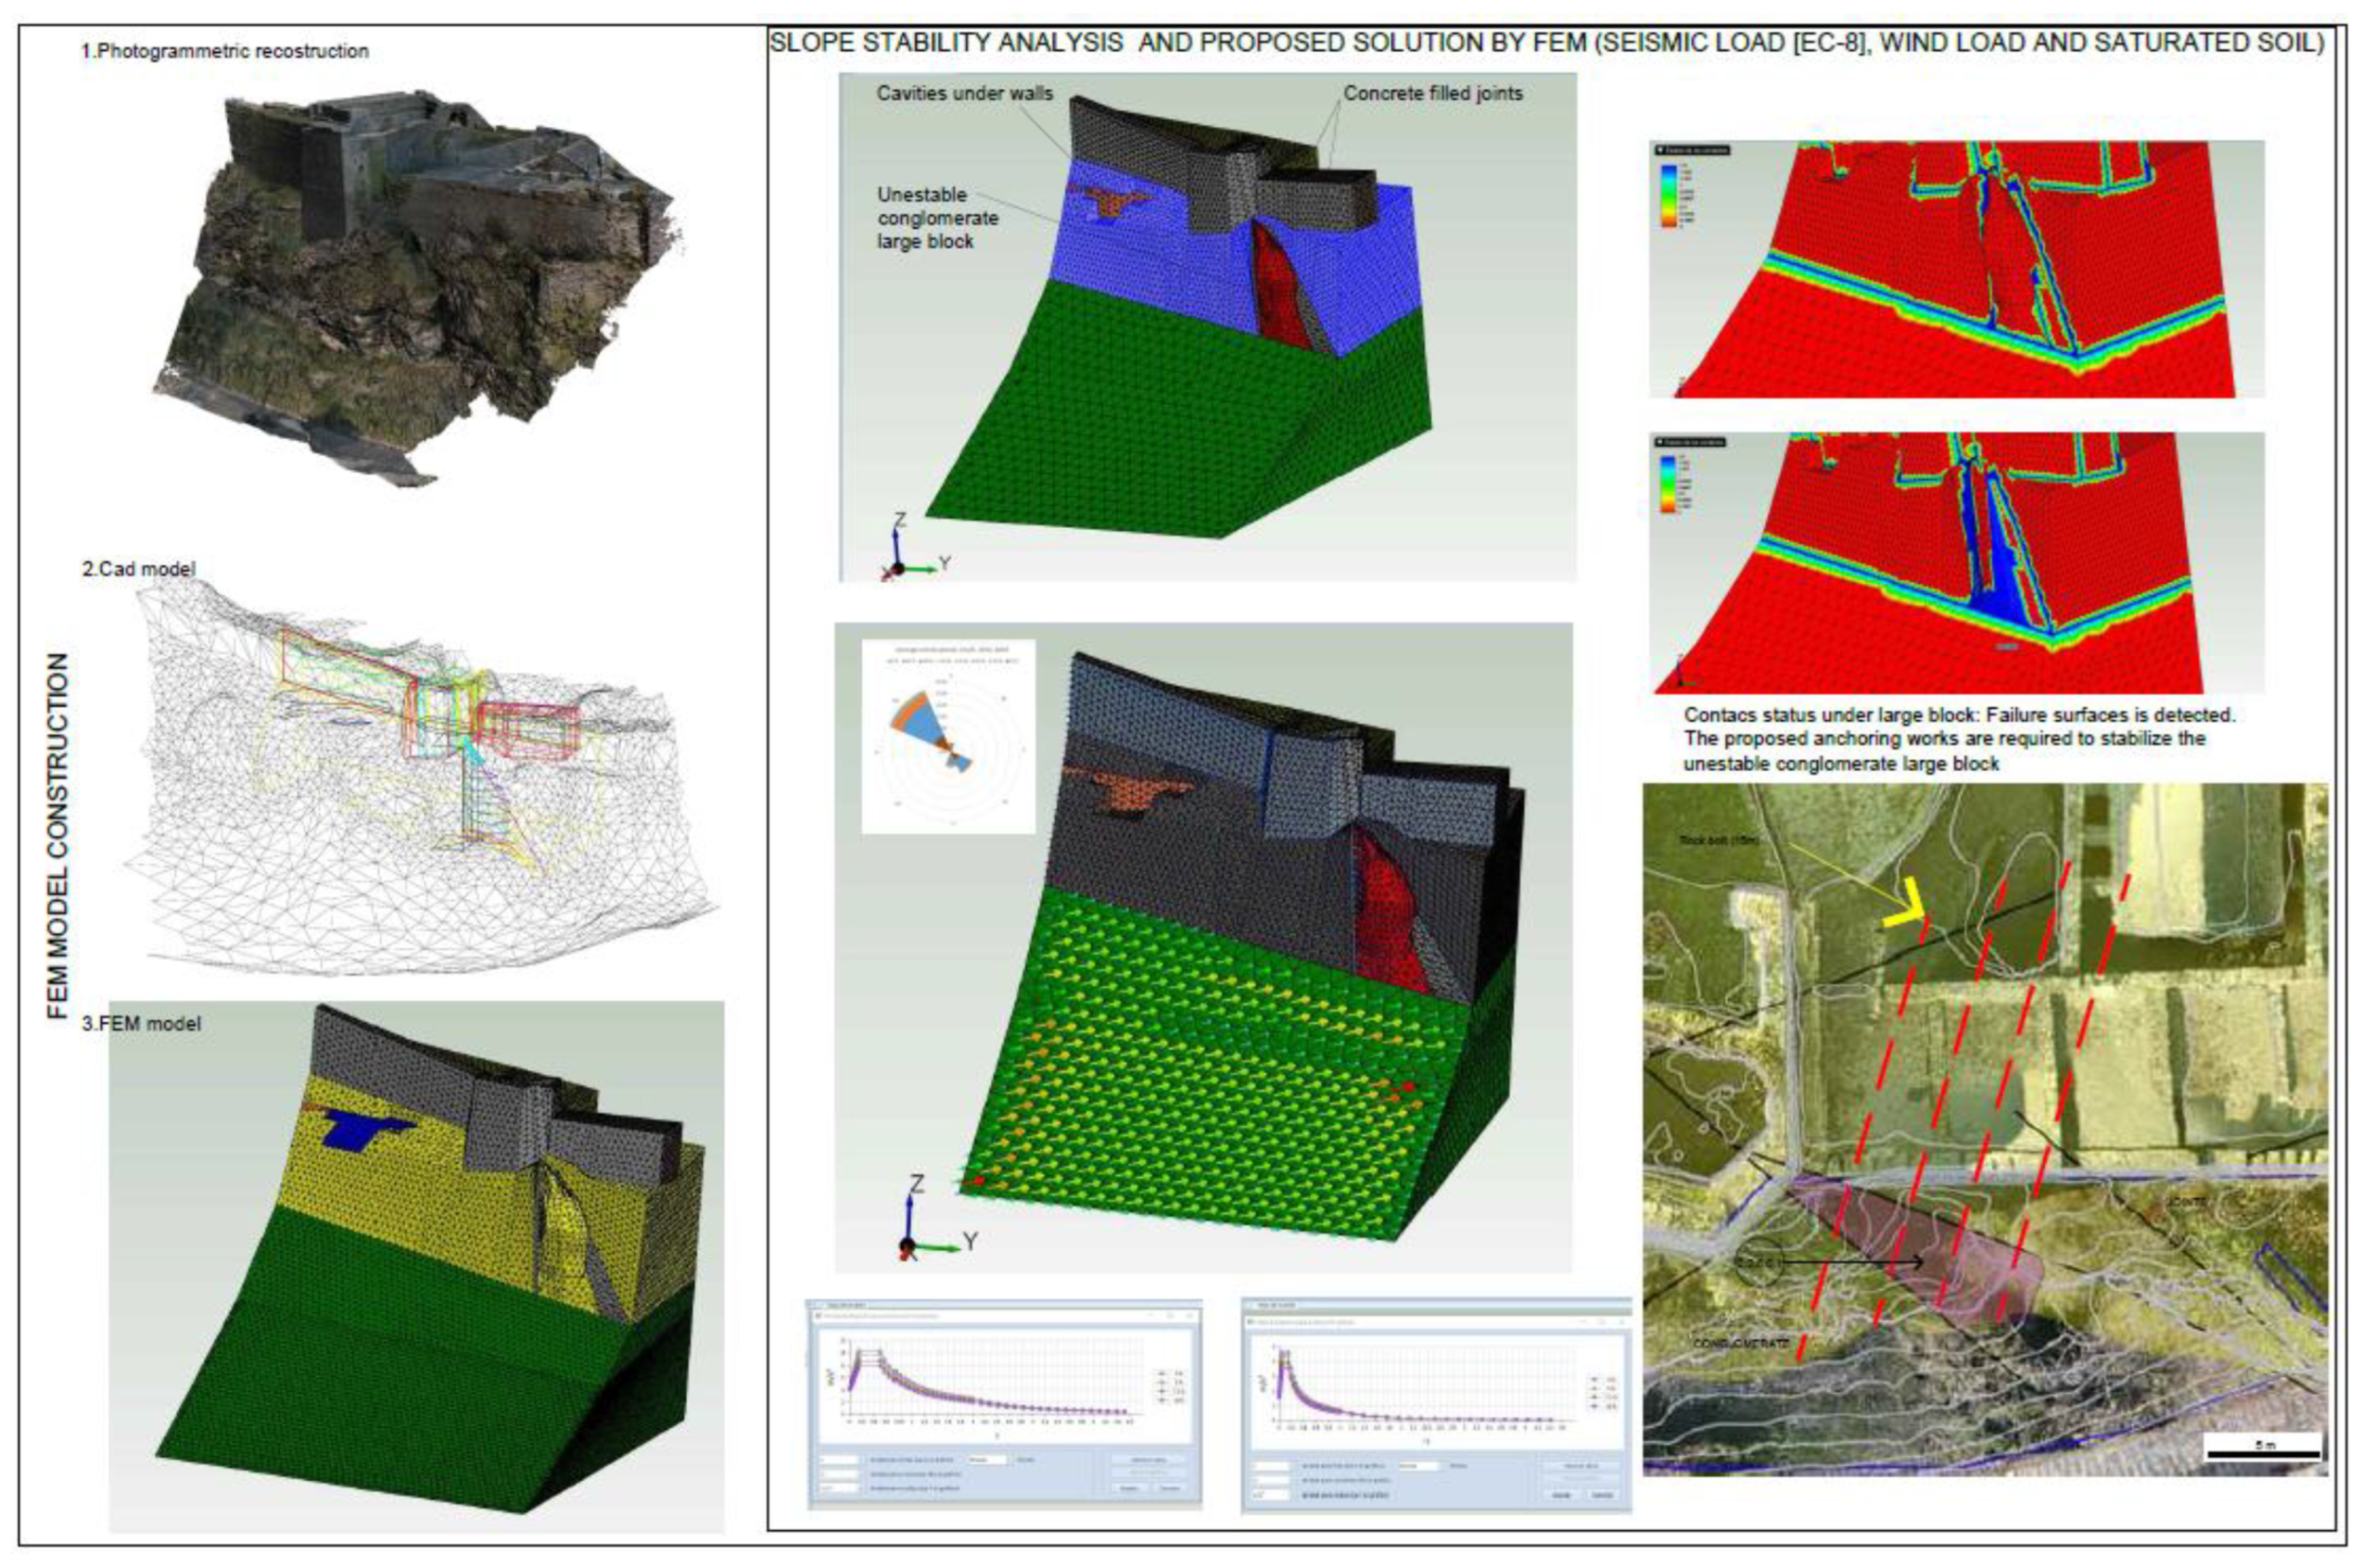
5.1.1. Slope Stability Analysis
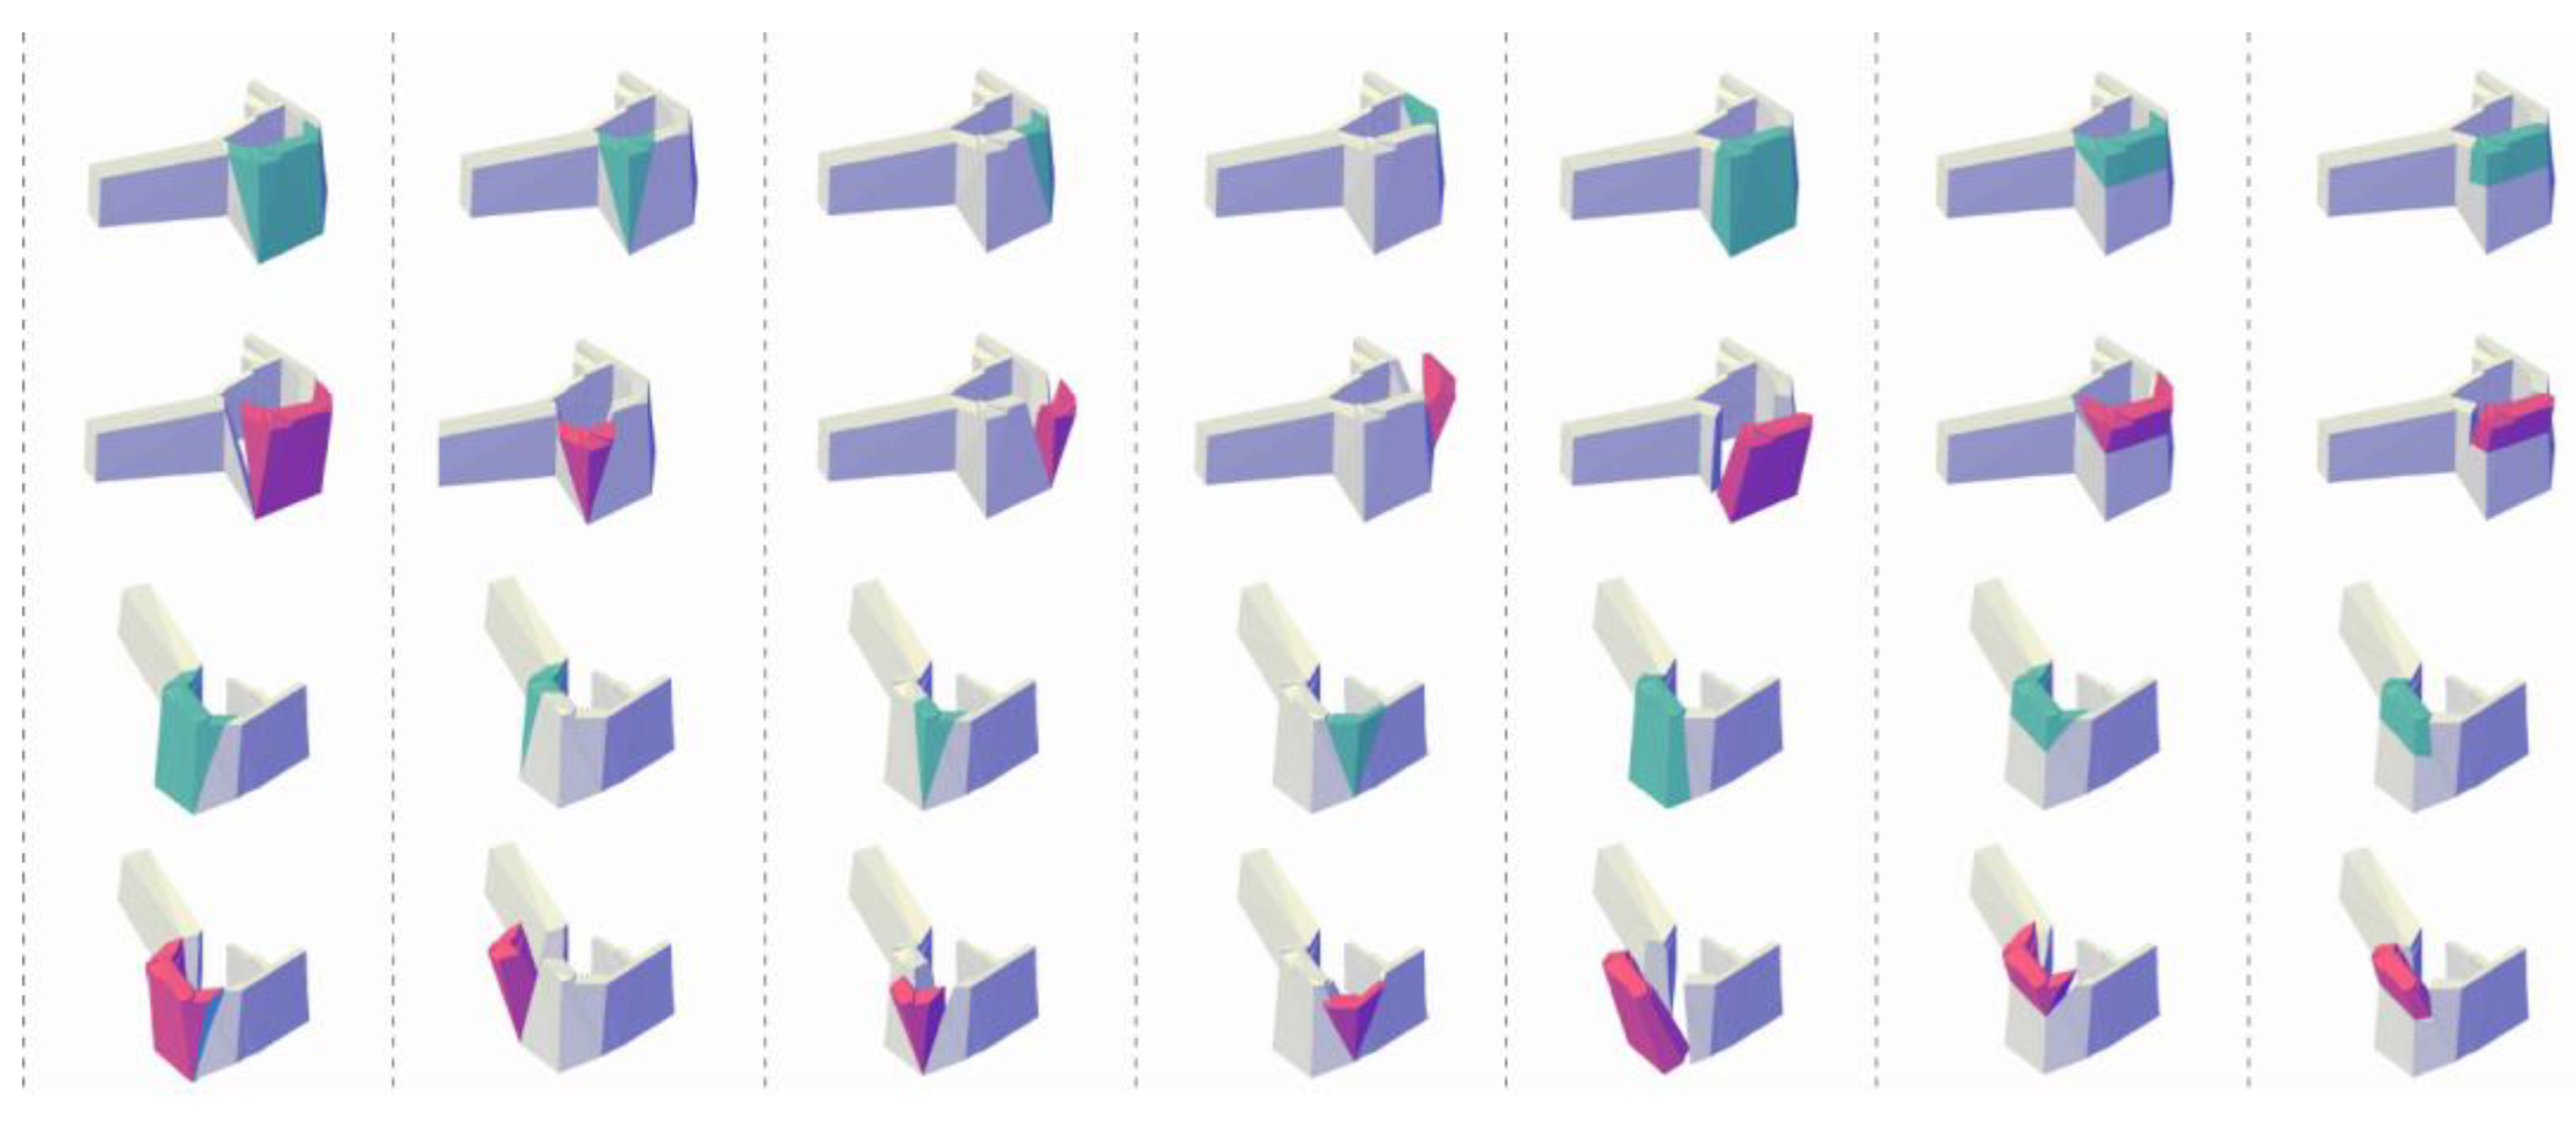
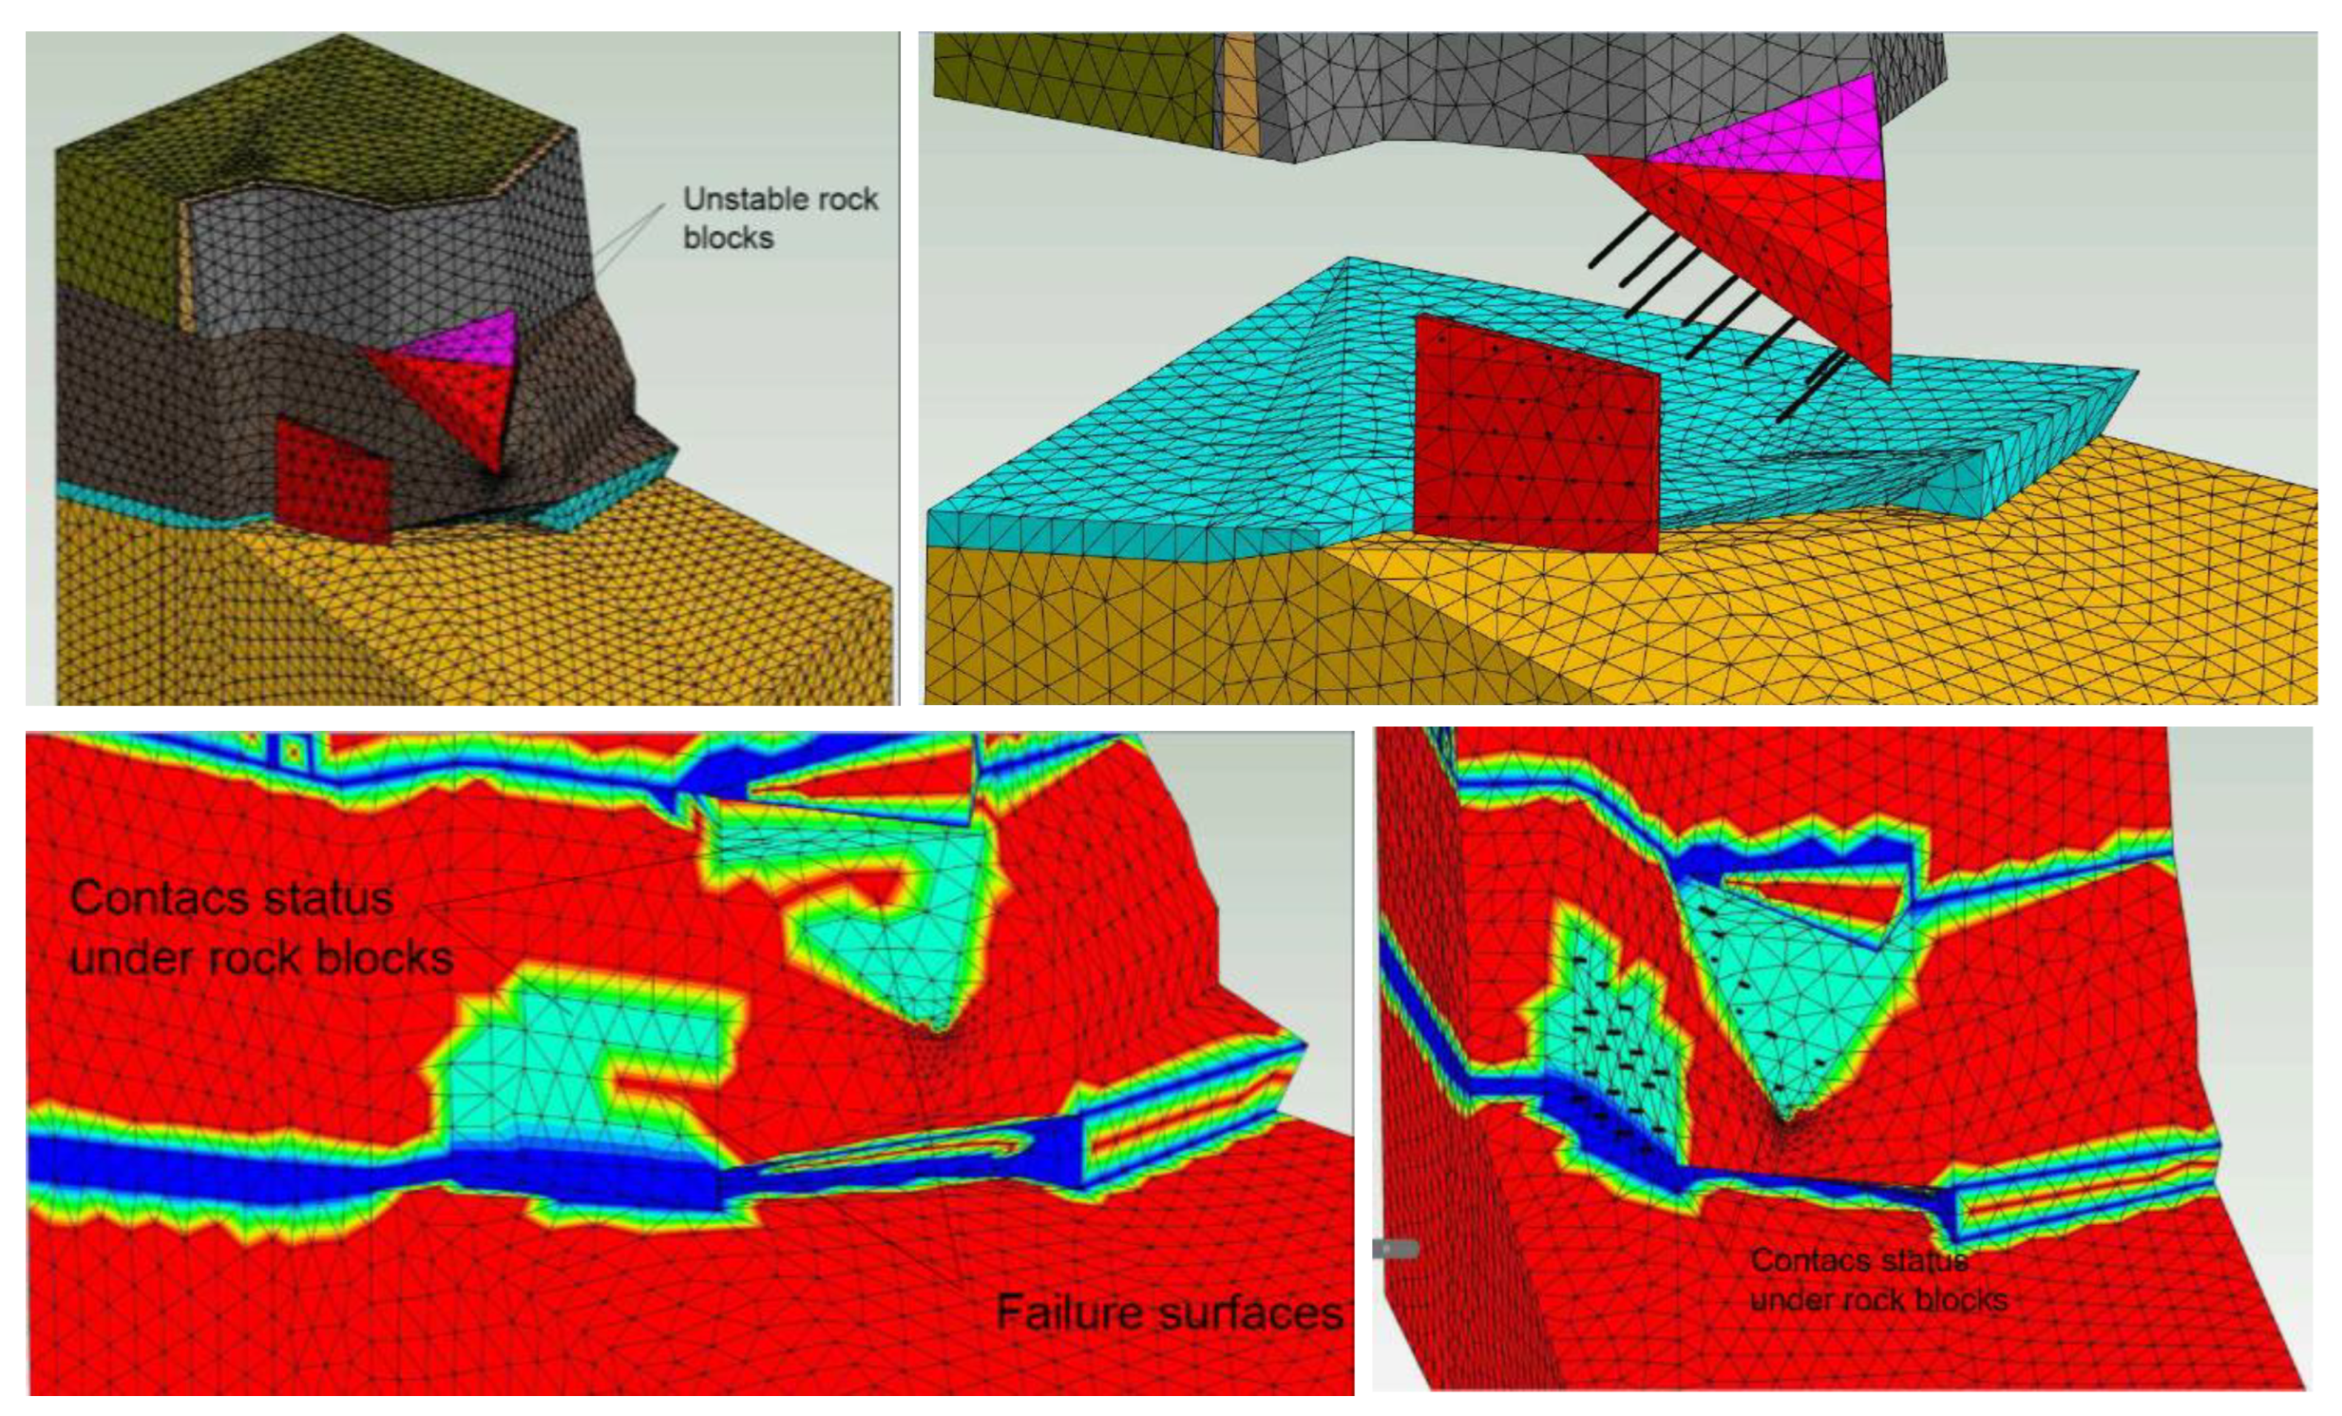
5.1.2. Cliff Stability Analysis
5.2. Structural Assessment
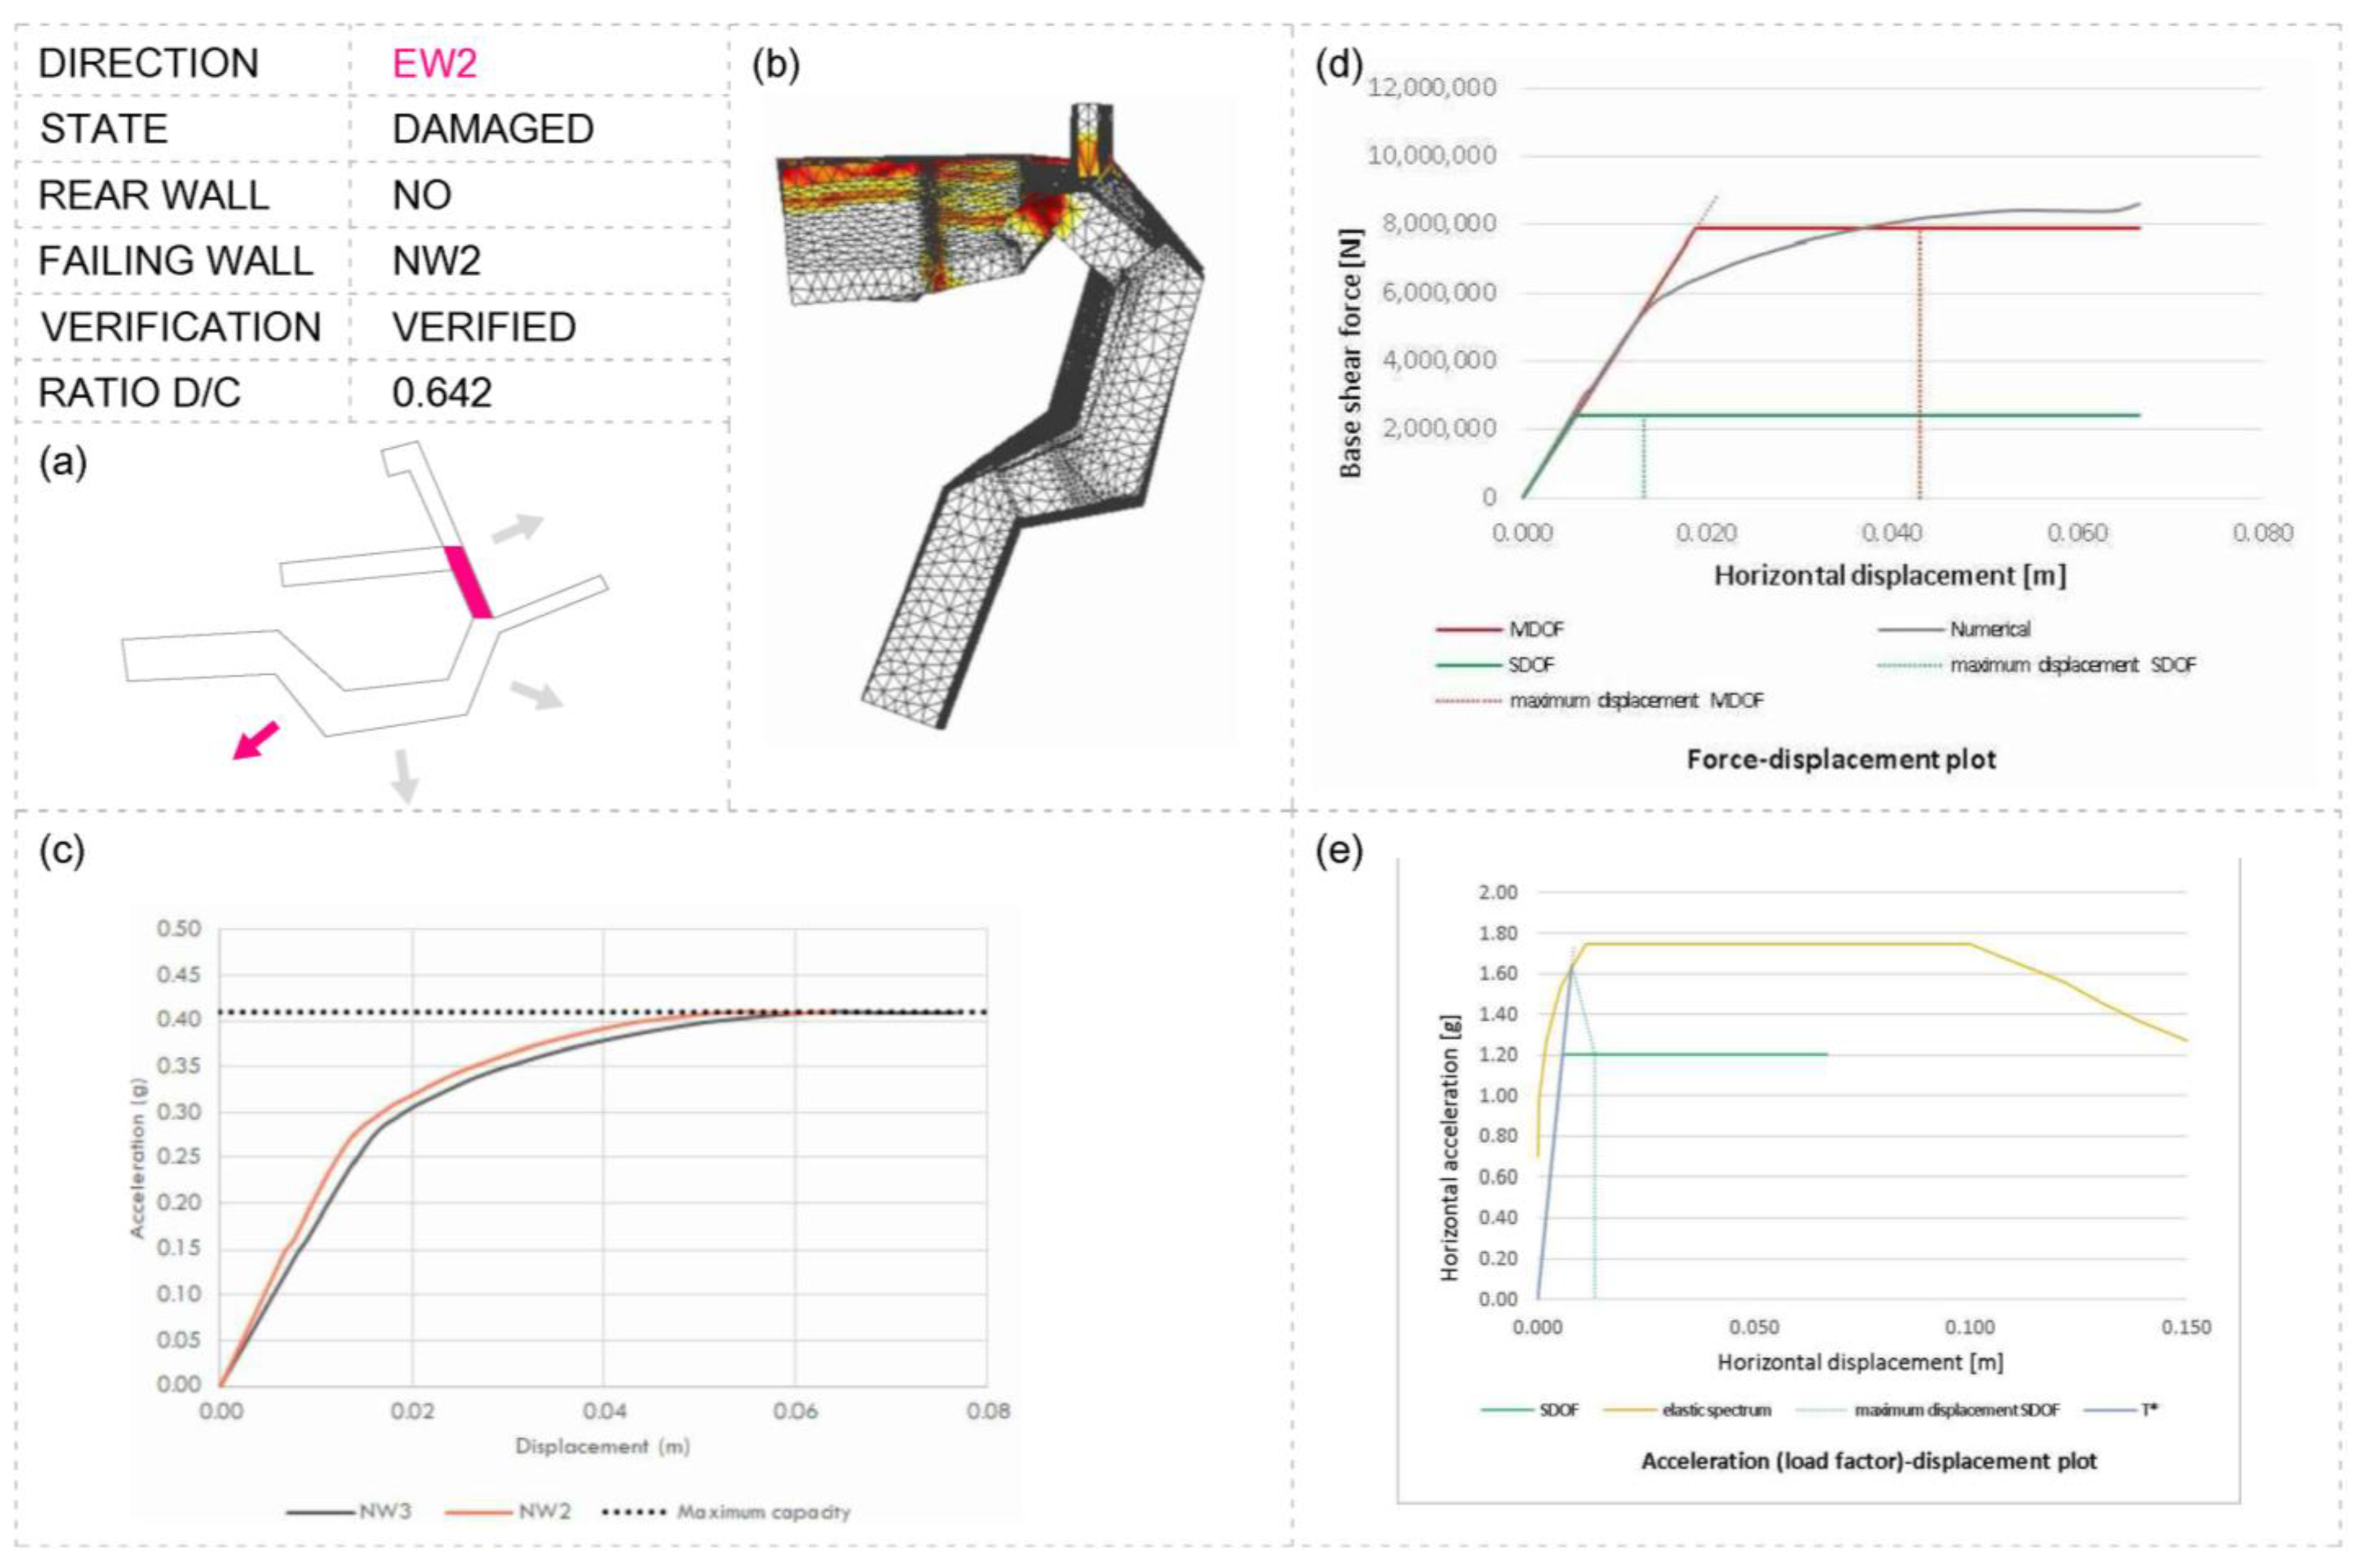
5.2.1. Kinematic Analysis
5.2.2. Numerical Analysis
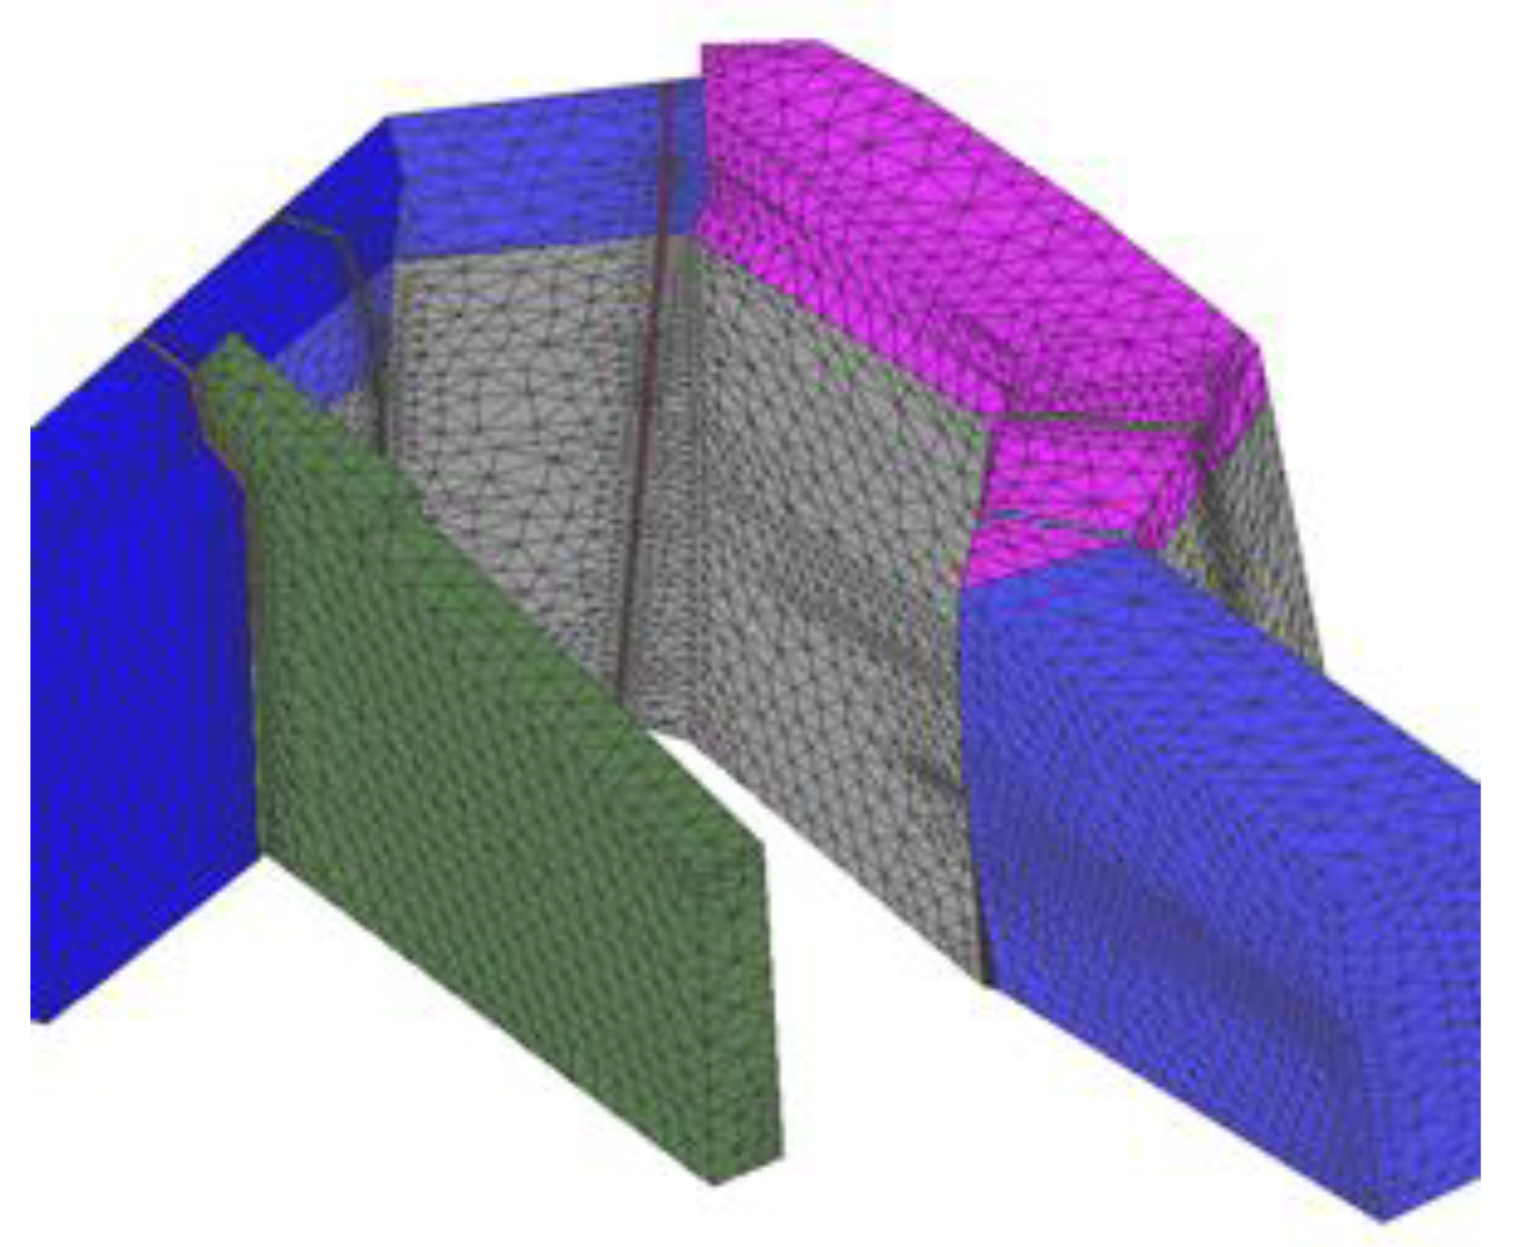
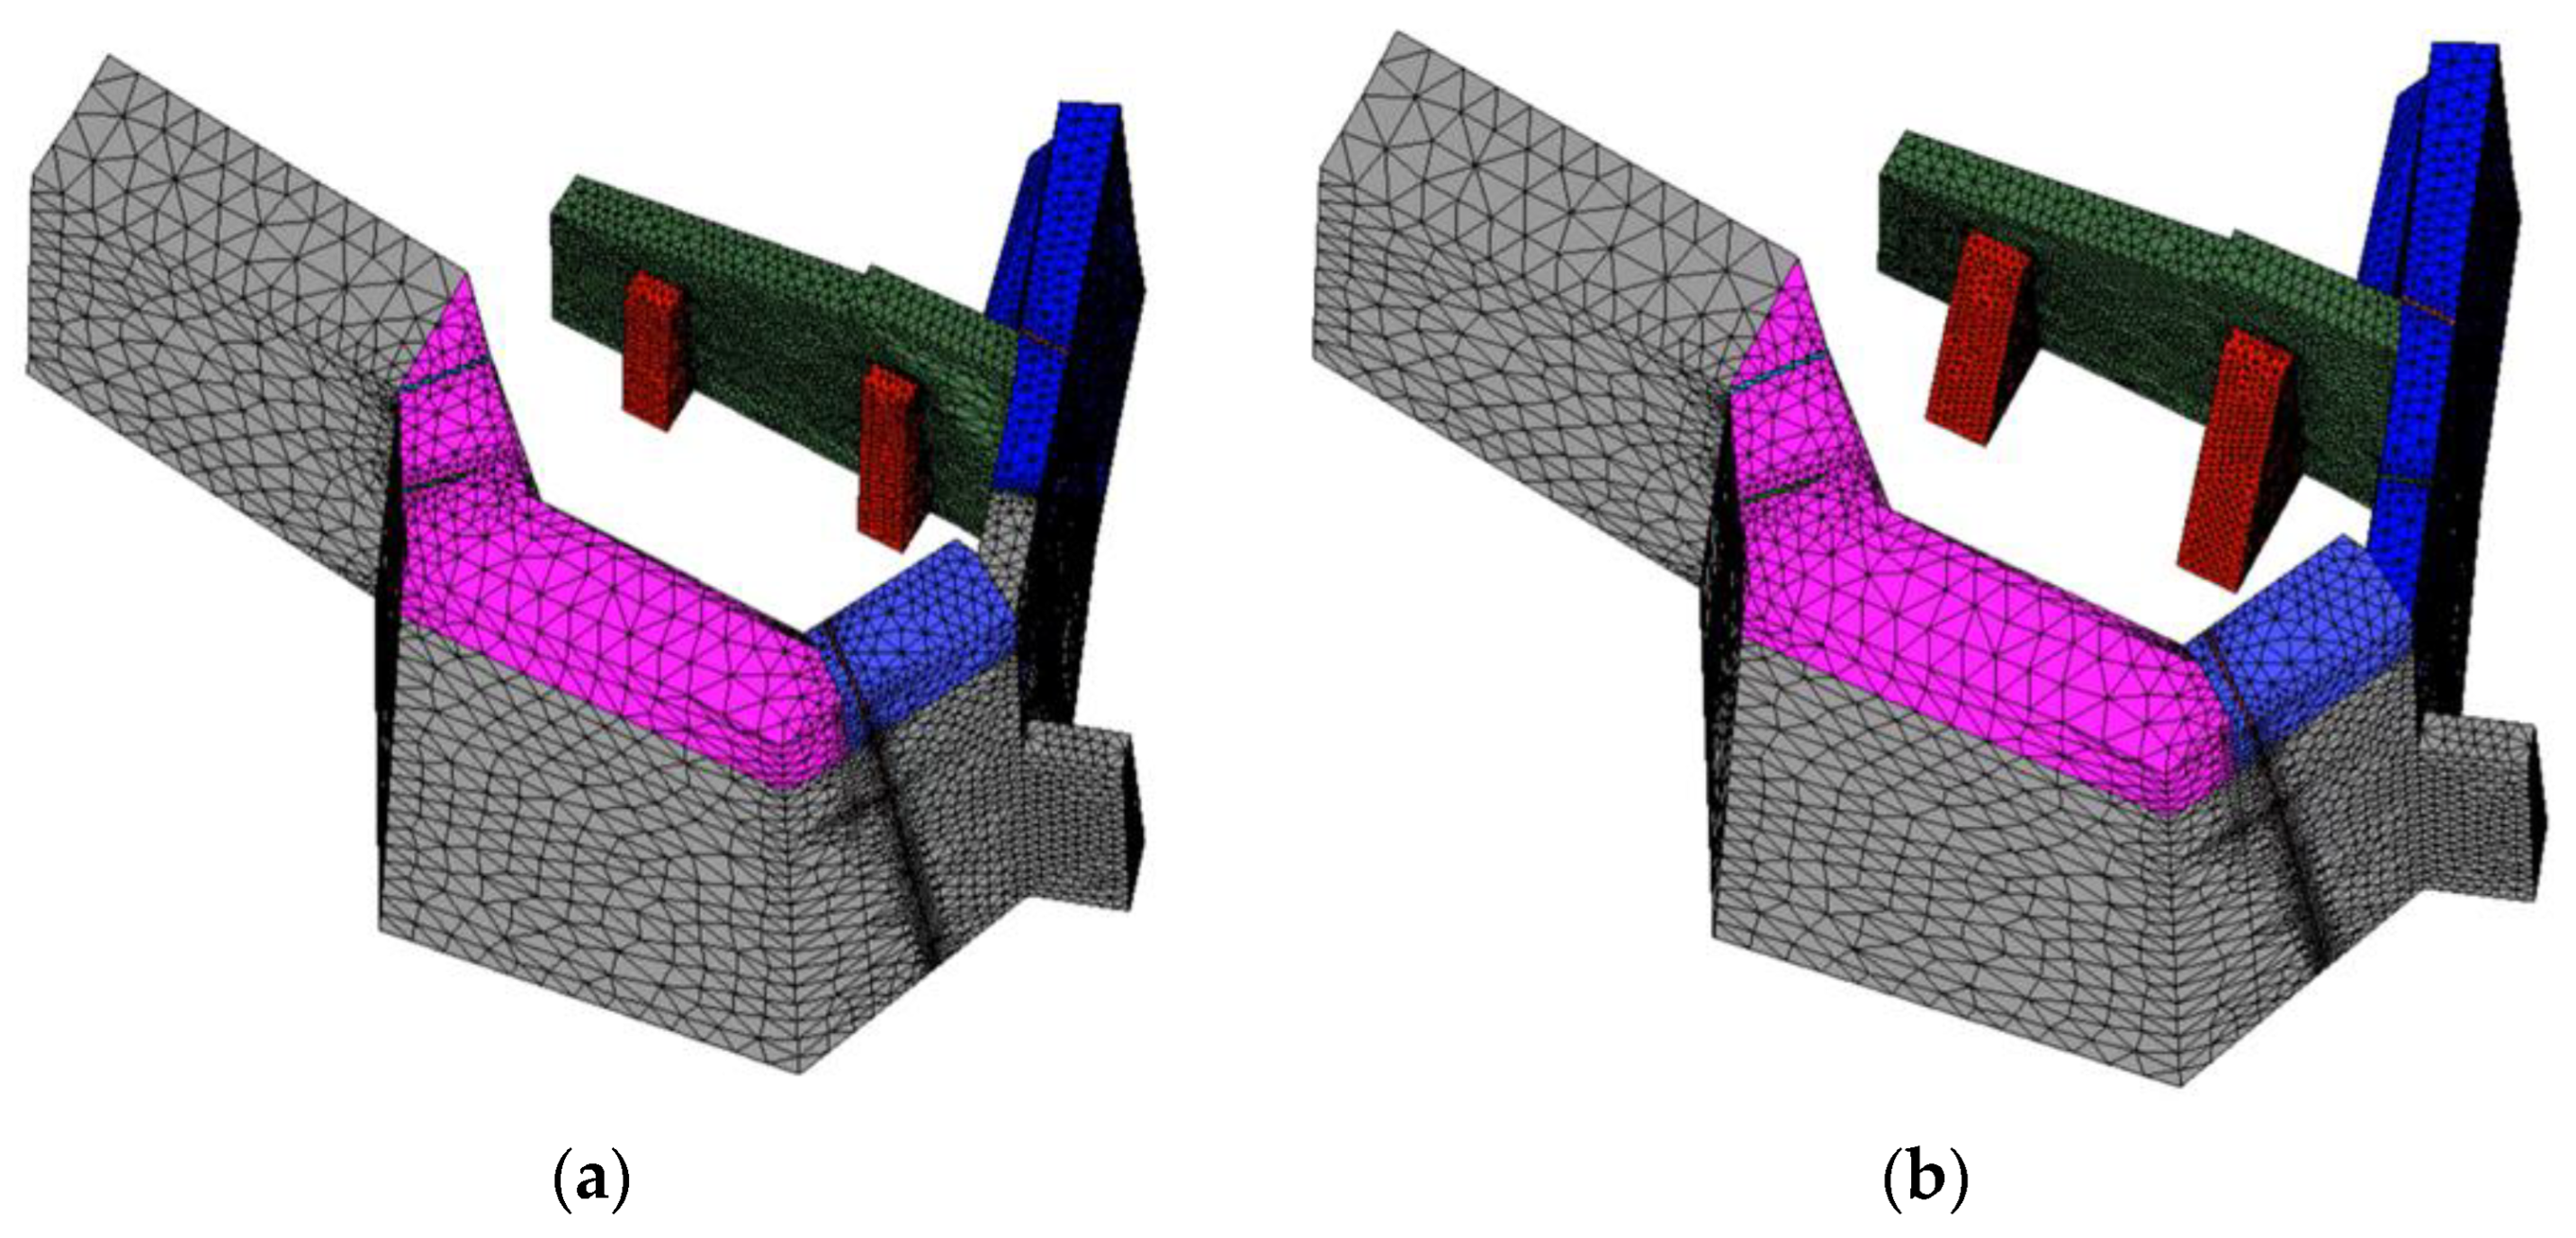
FE Model Generation
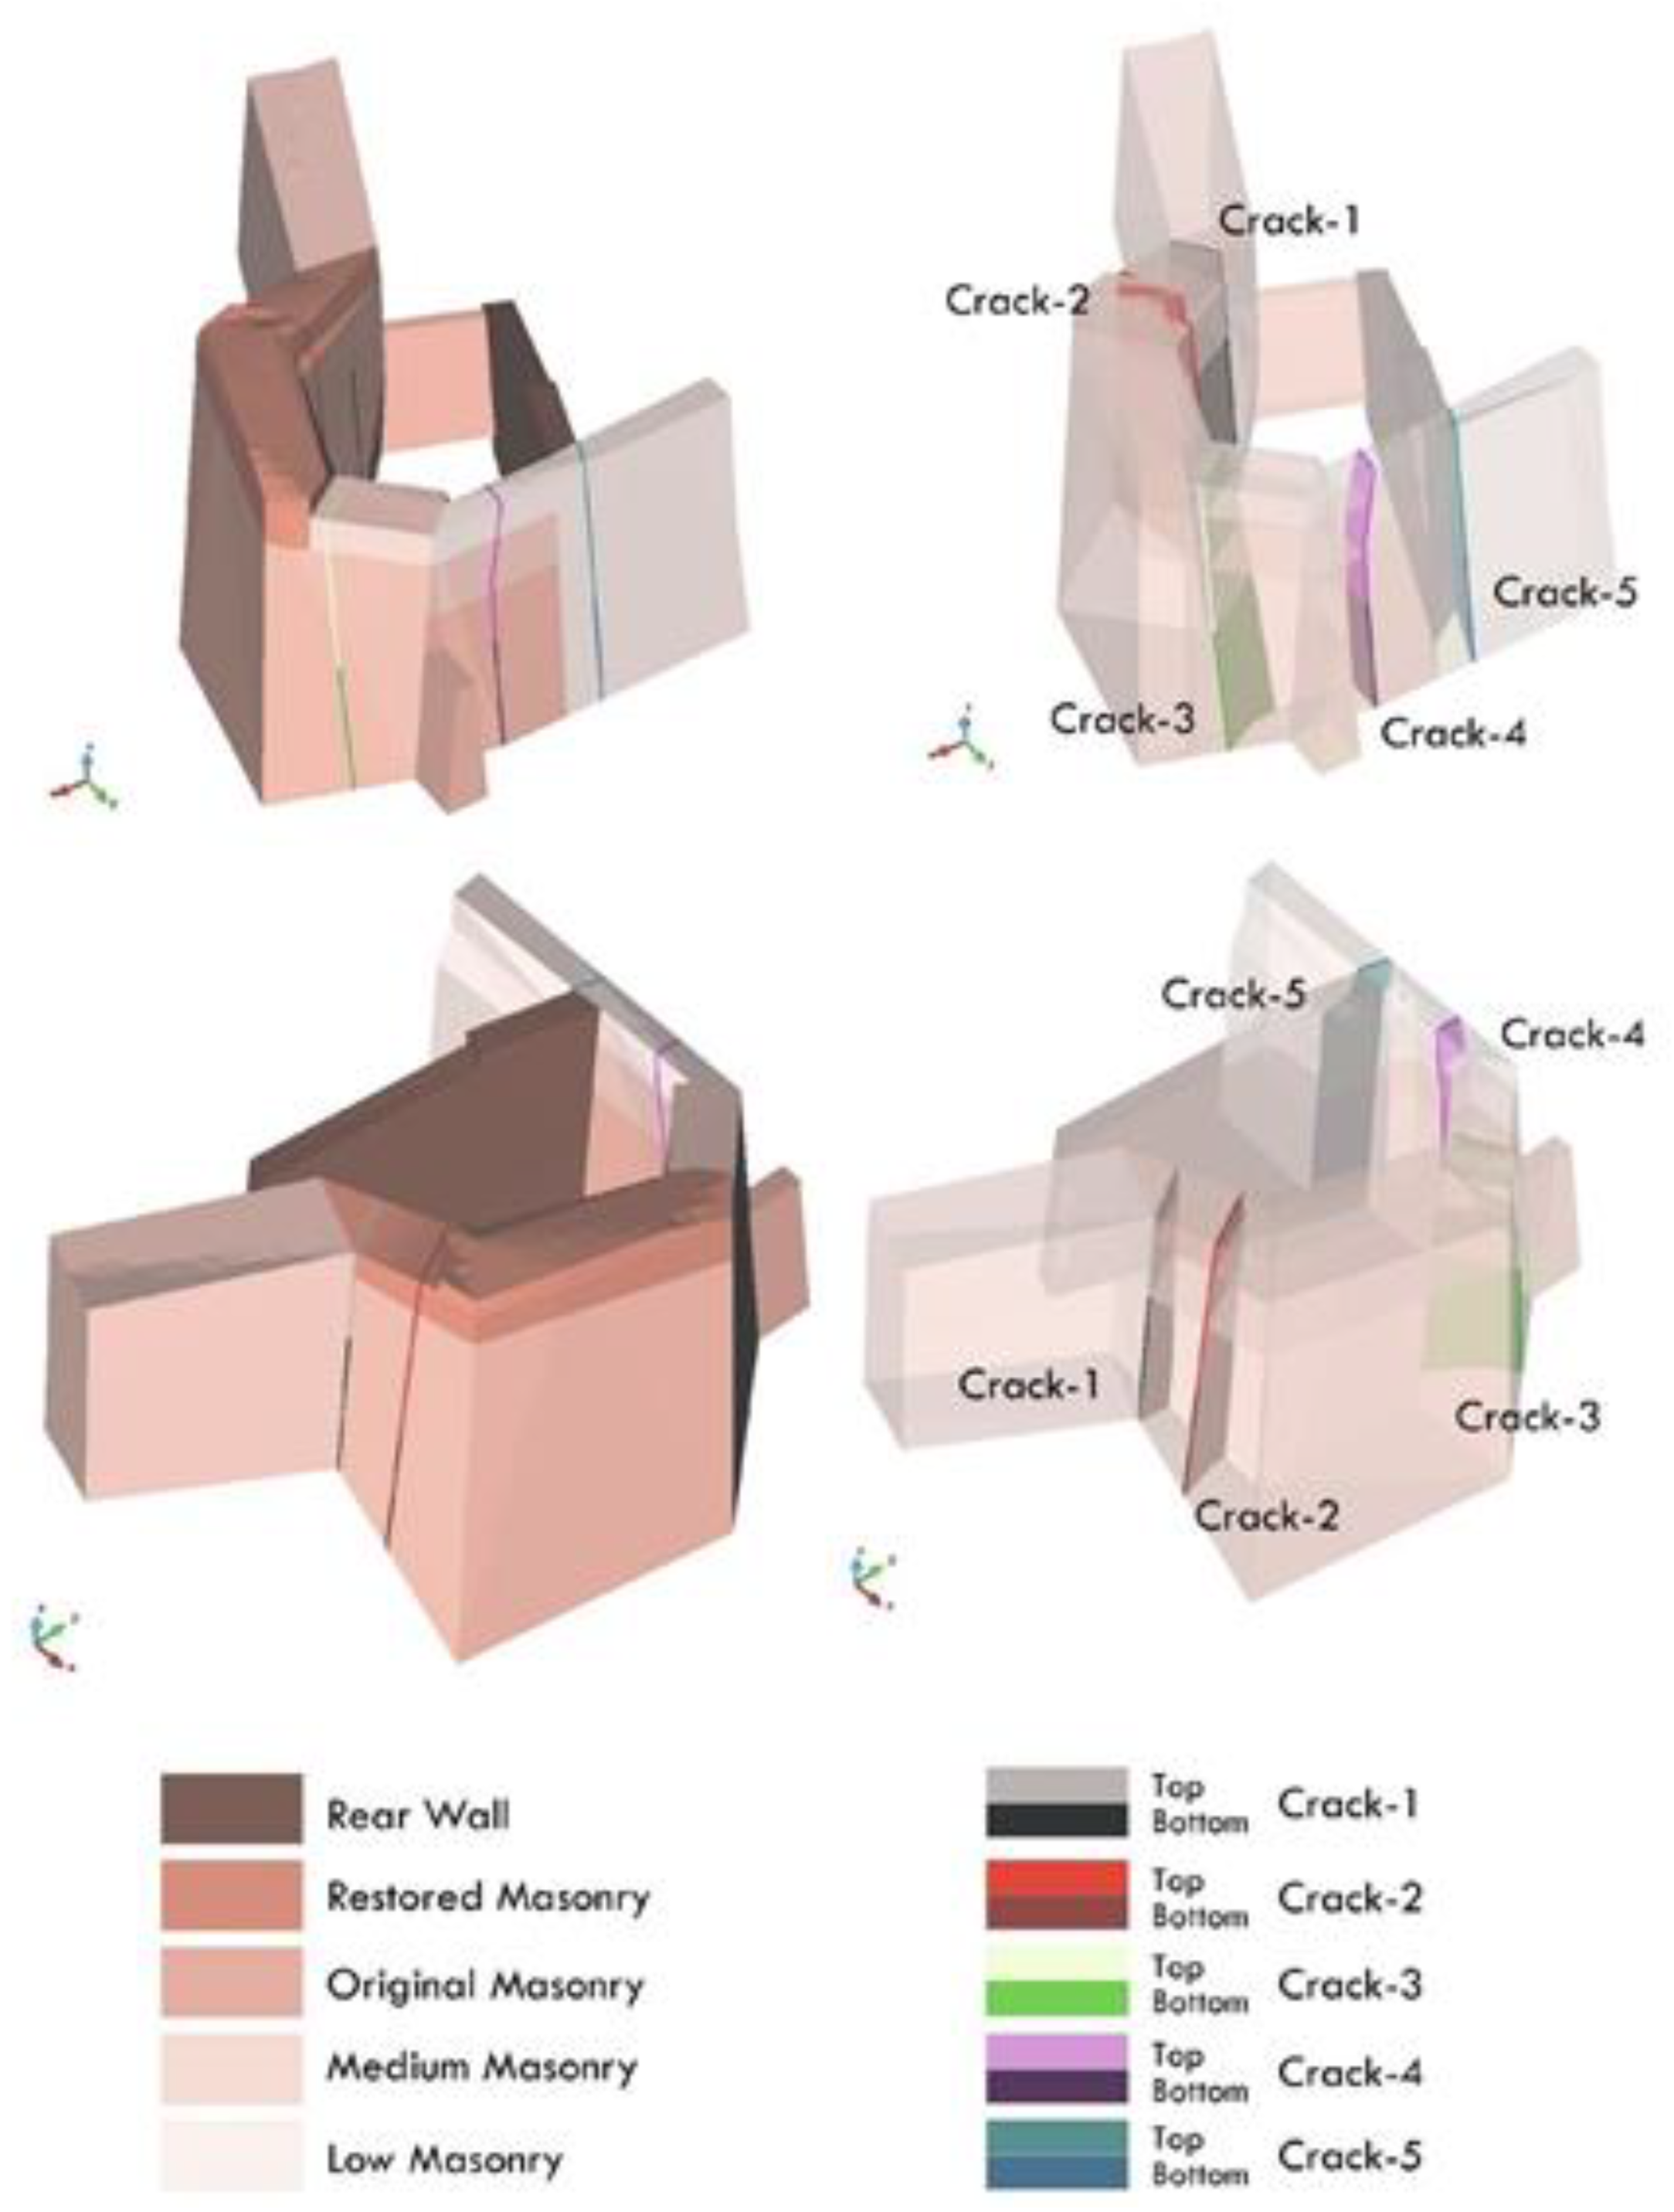
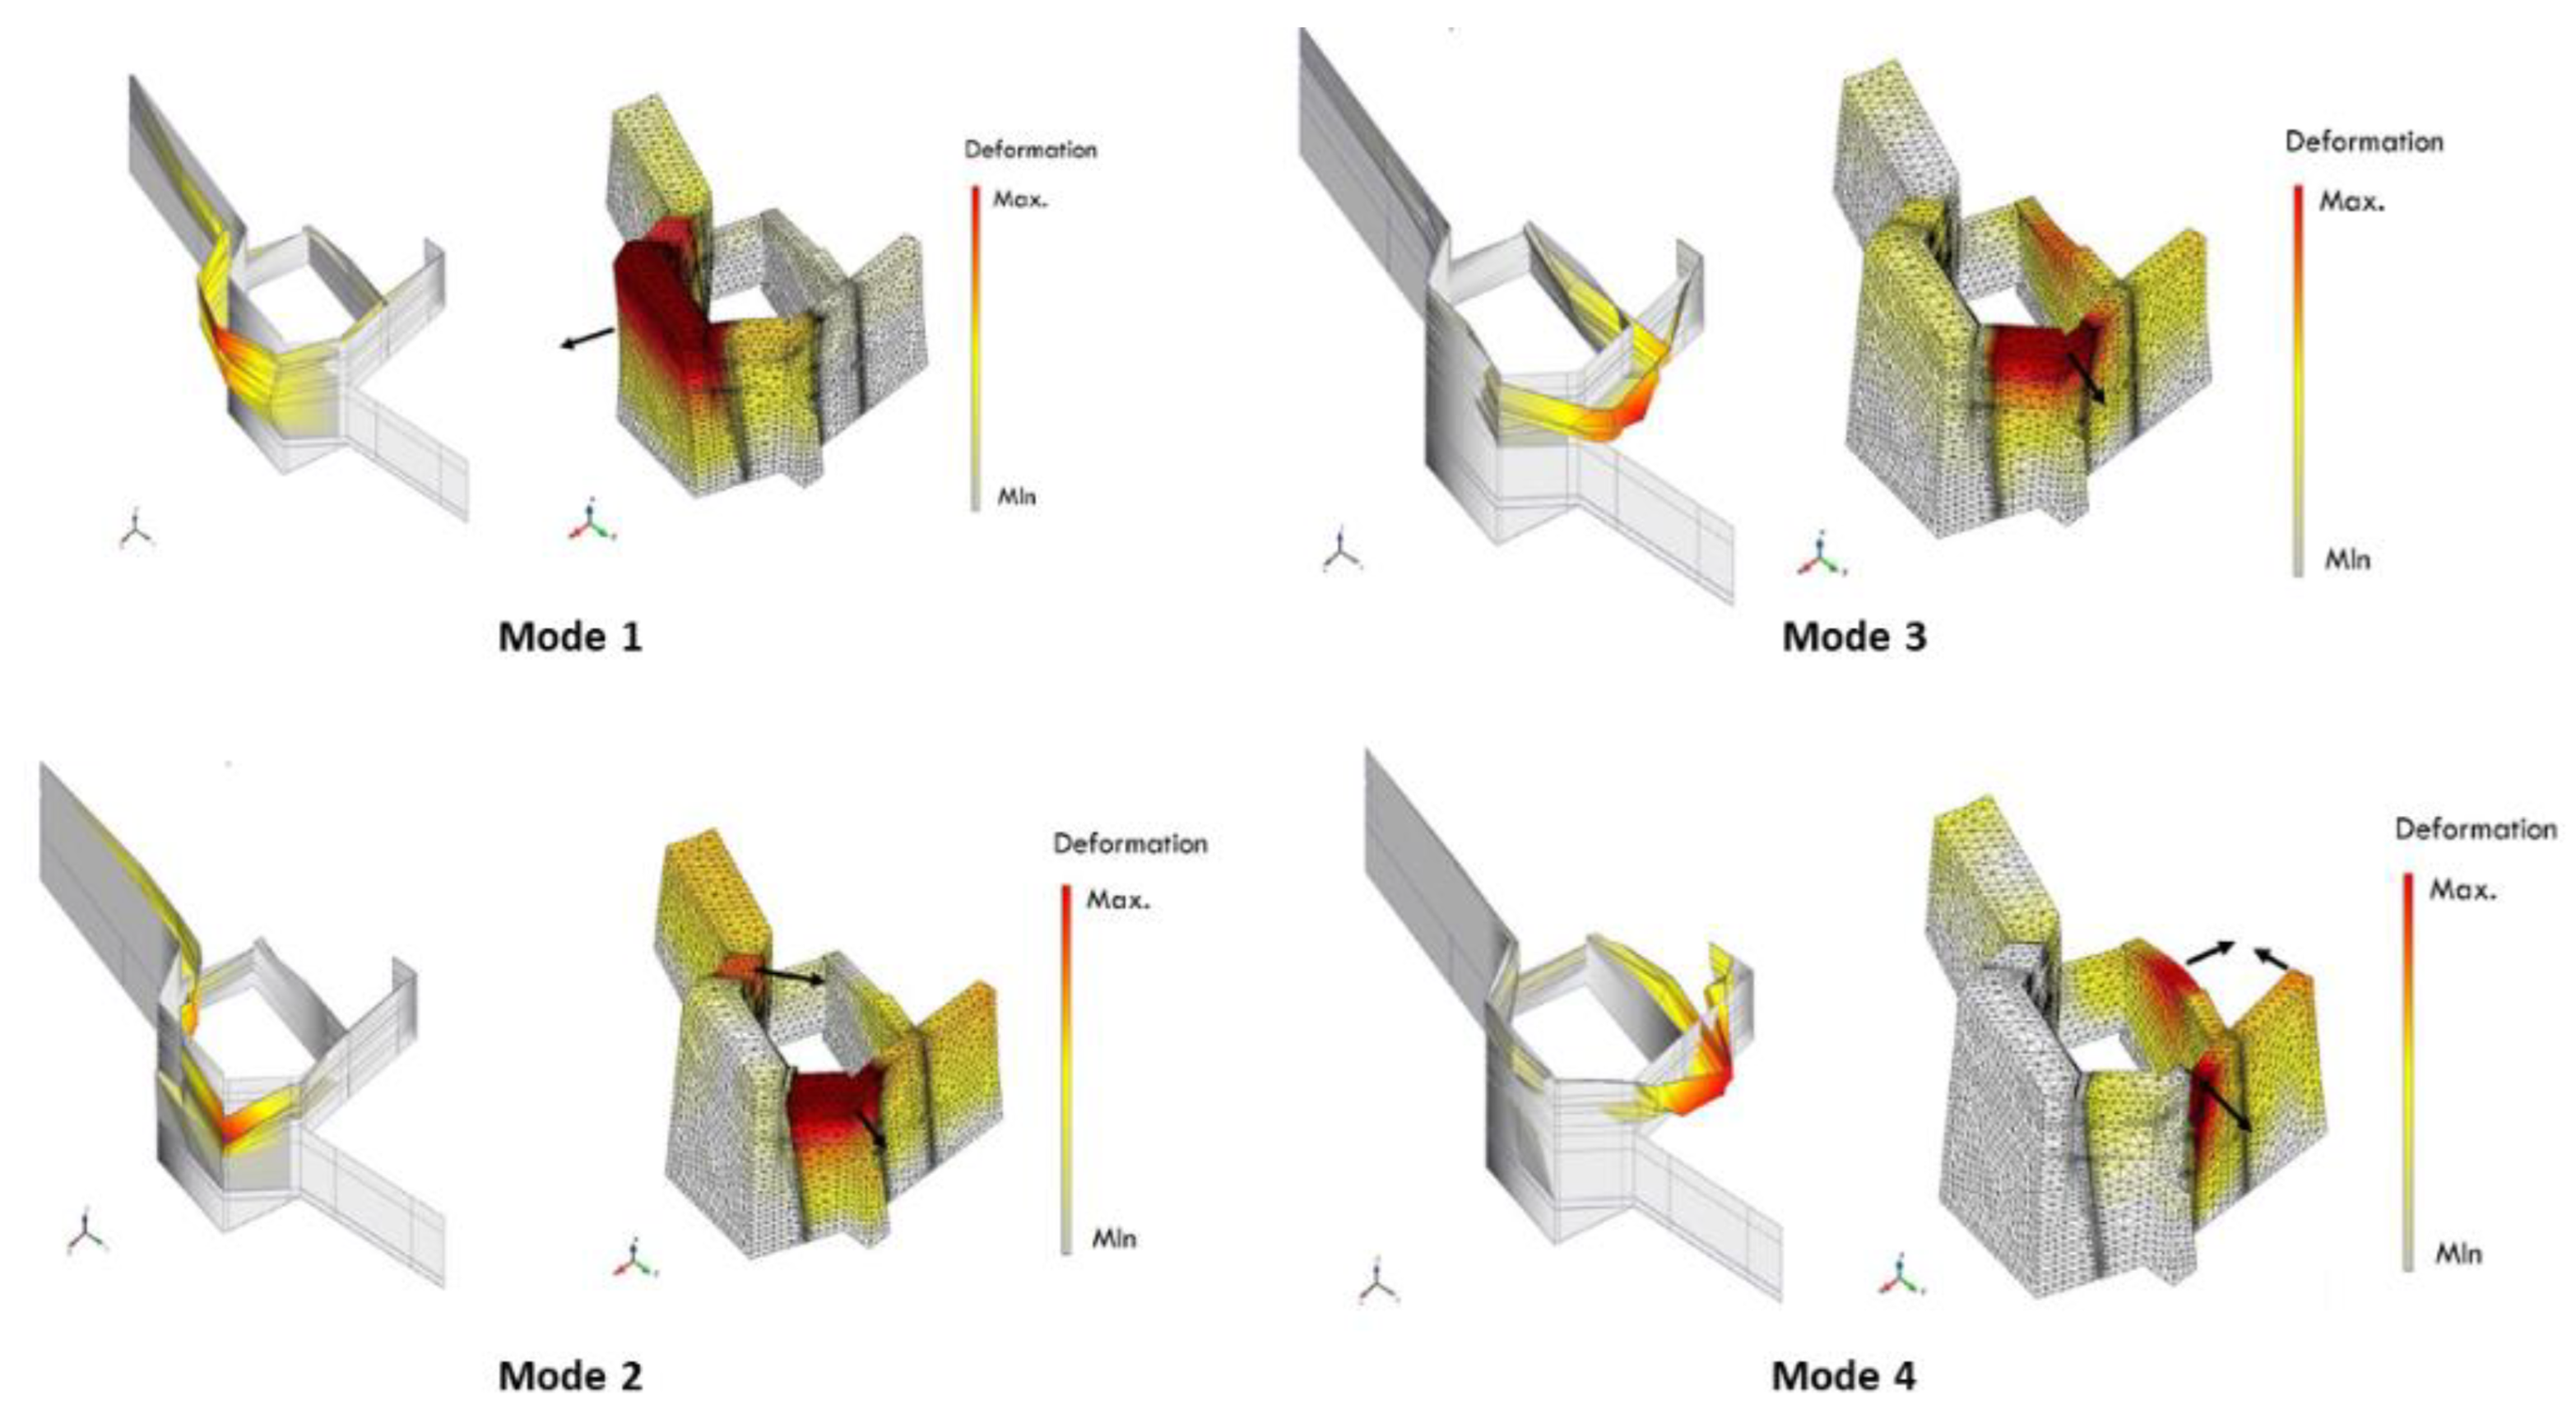
Model Calibration
- Crack-1: Crack at EW2, with one end at the corner between EW1 and EW2.
- Crack-2: Crack at EW2, close to the corner between EW2 and EW3.
- Crack-3: Crack at NW1, close to the corner between NW1 and EW3.
- Crack-4: Crack at NW2, close to the corner between NW1 and NW2.
- Crack-5: Construction joint/crack at NW2, separating NW2 and NW3.
Material Properties
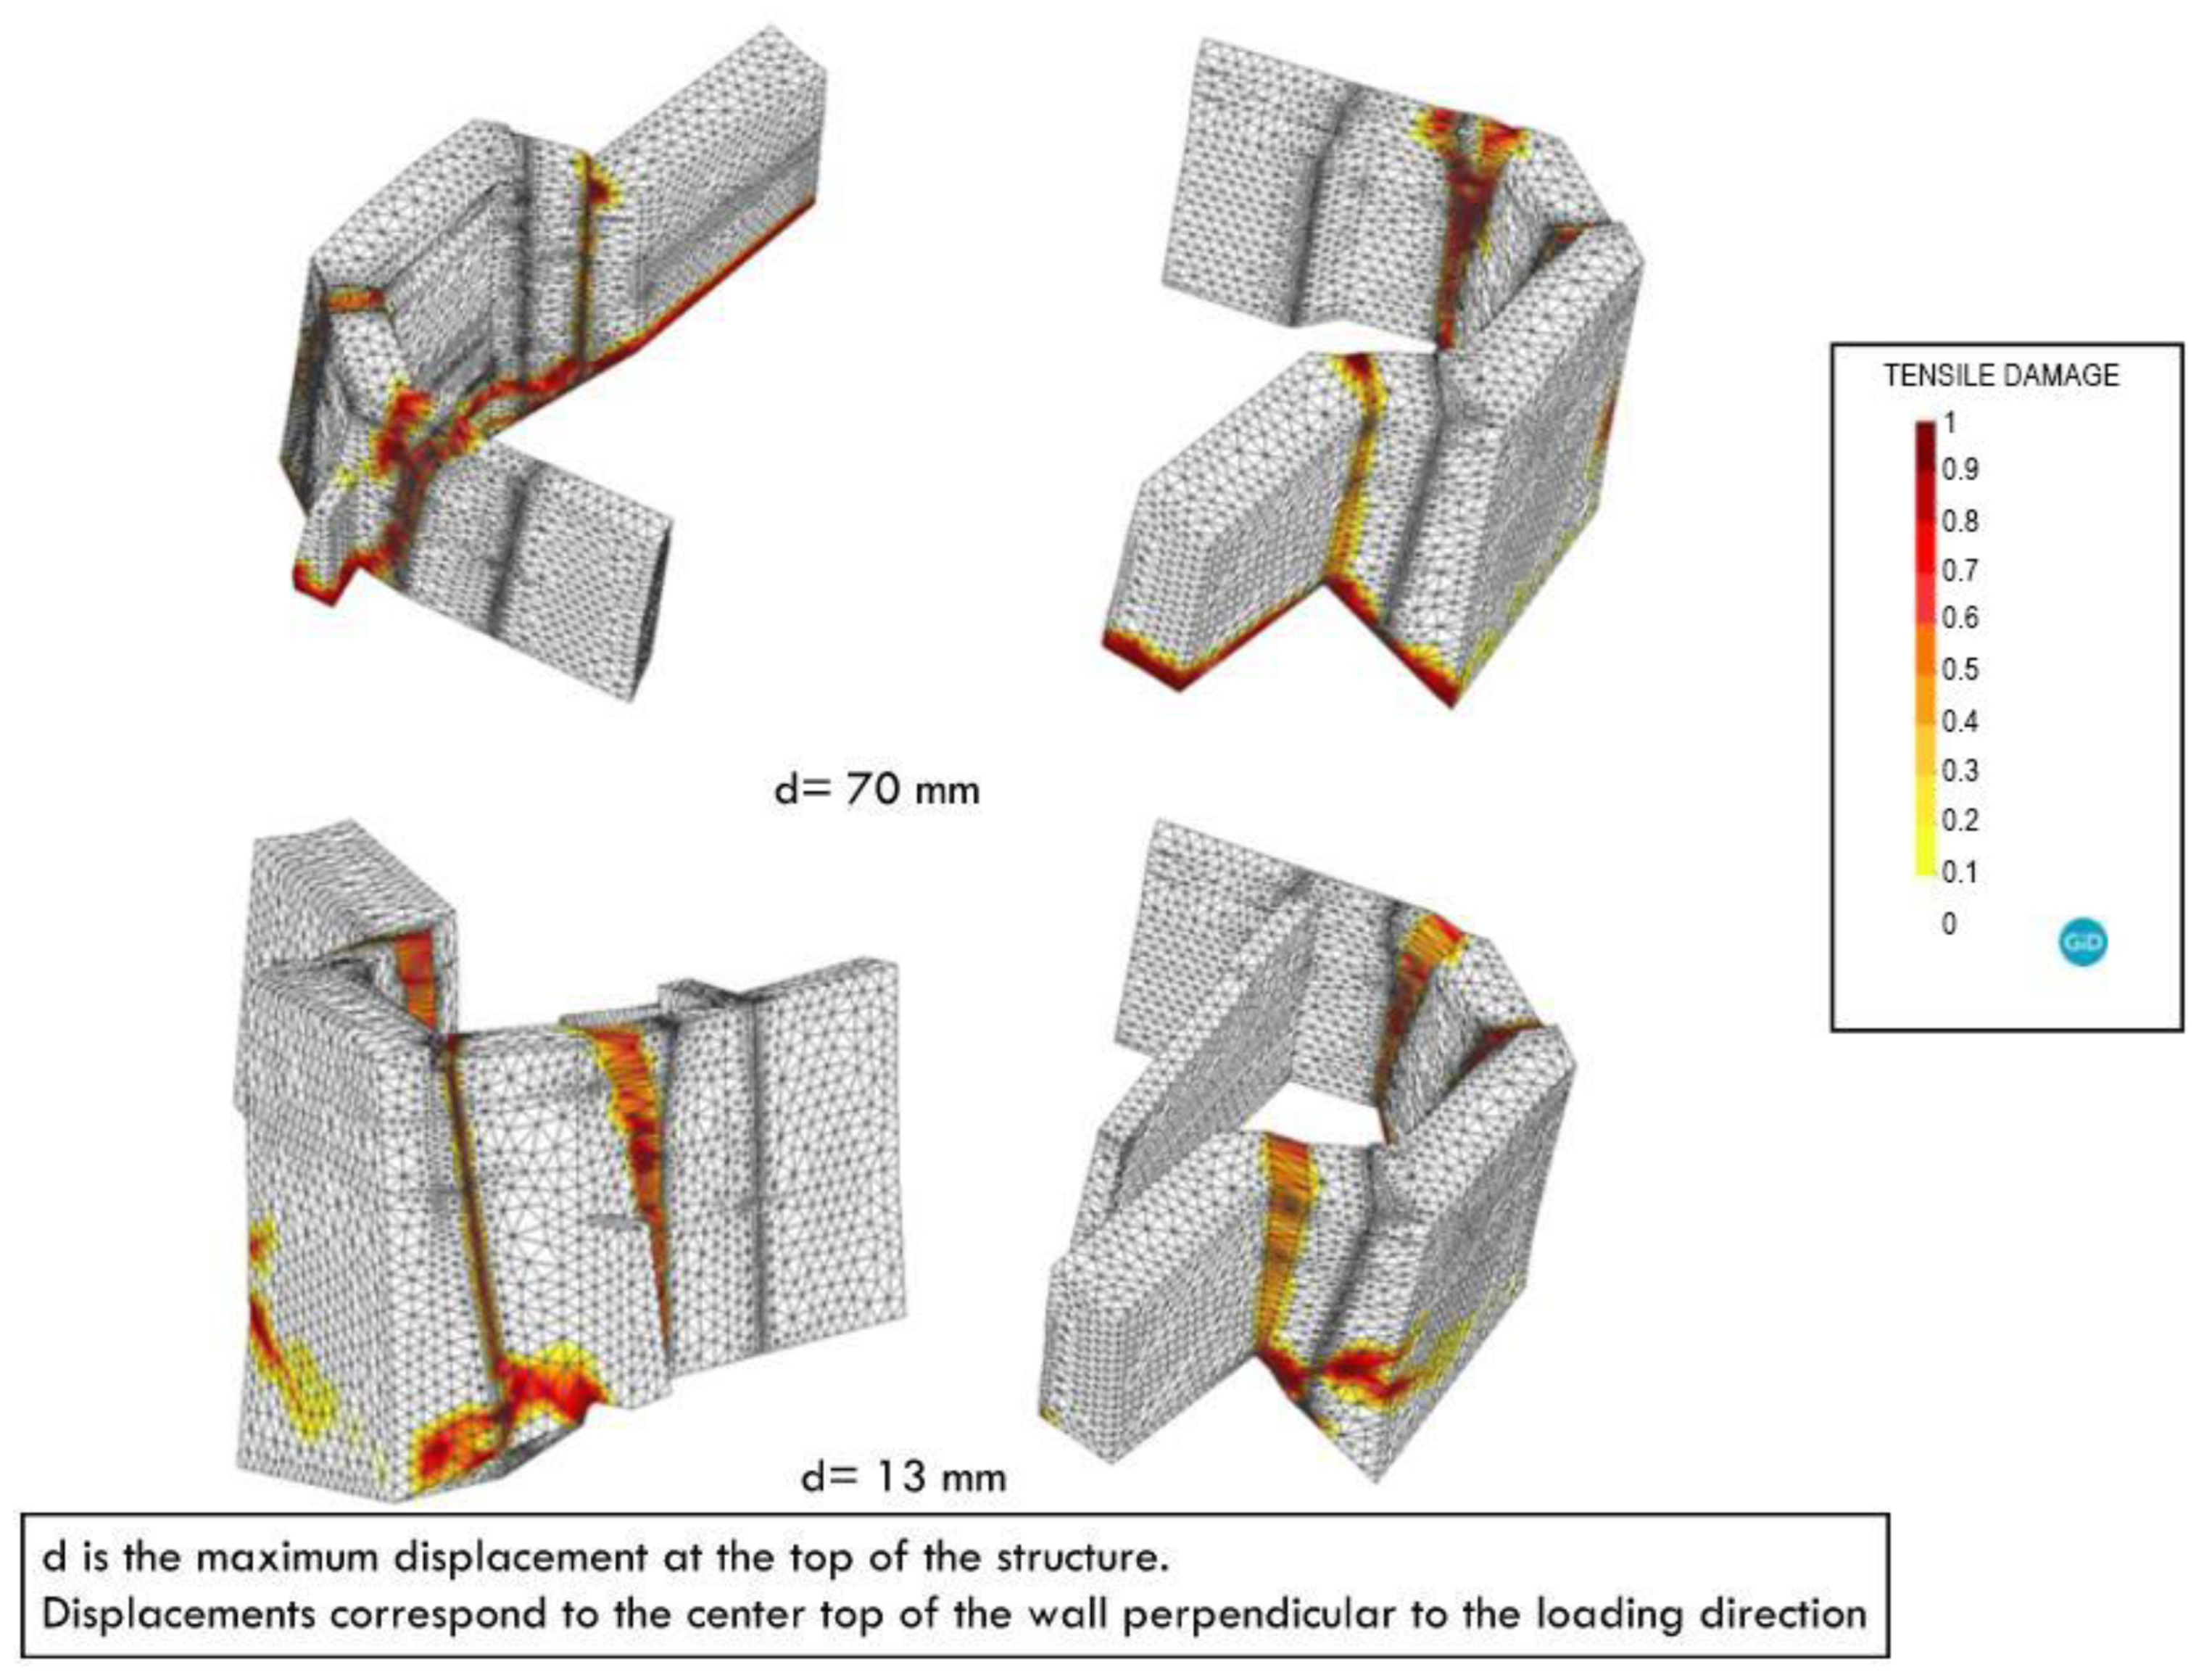
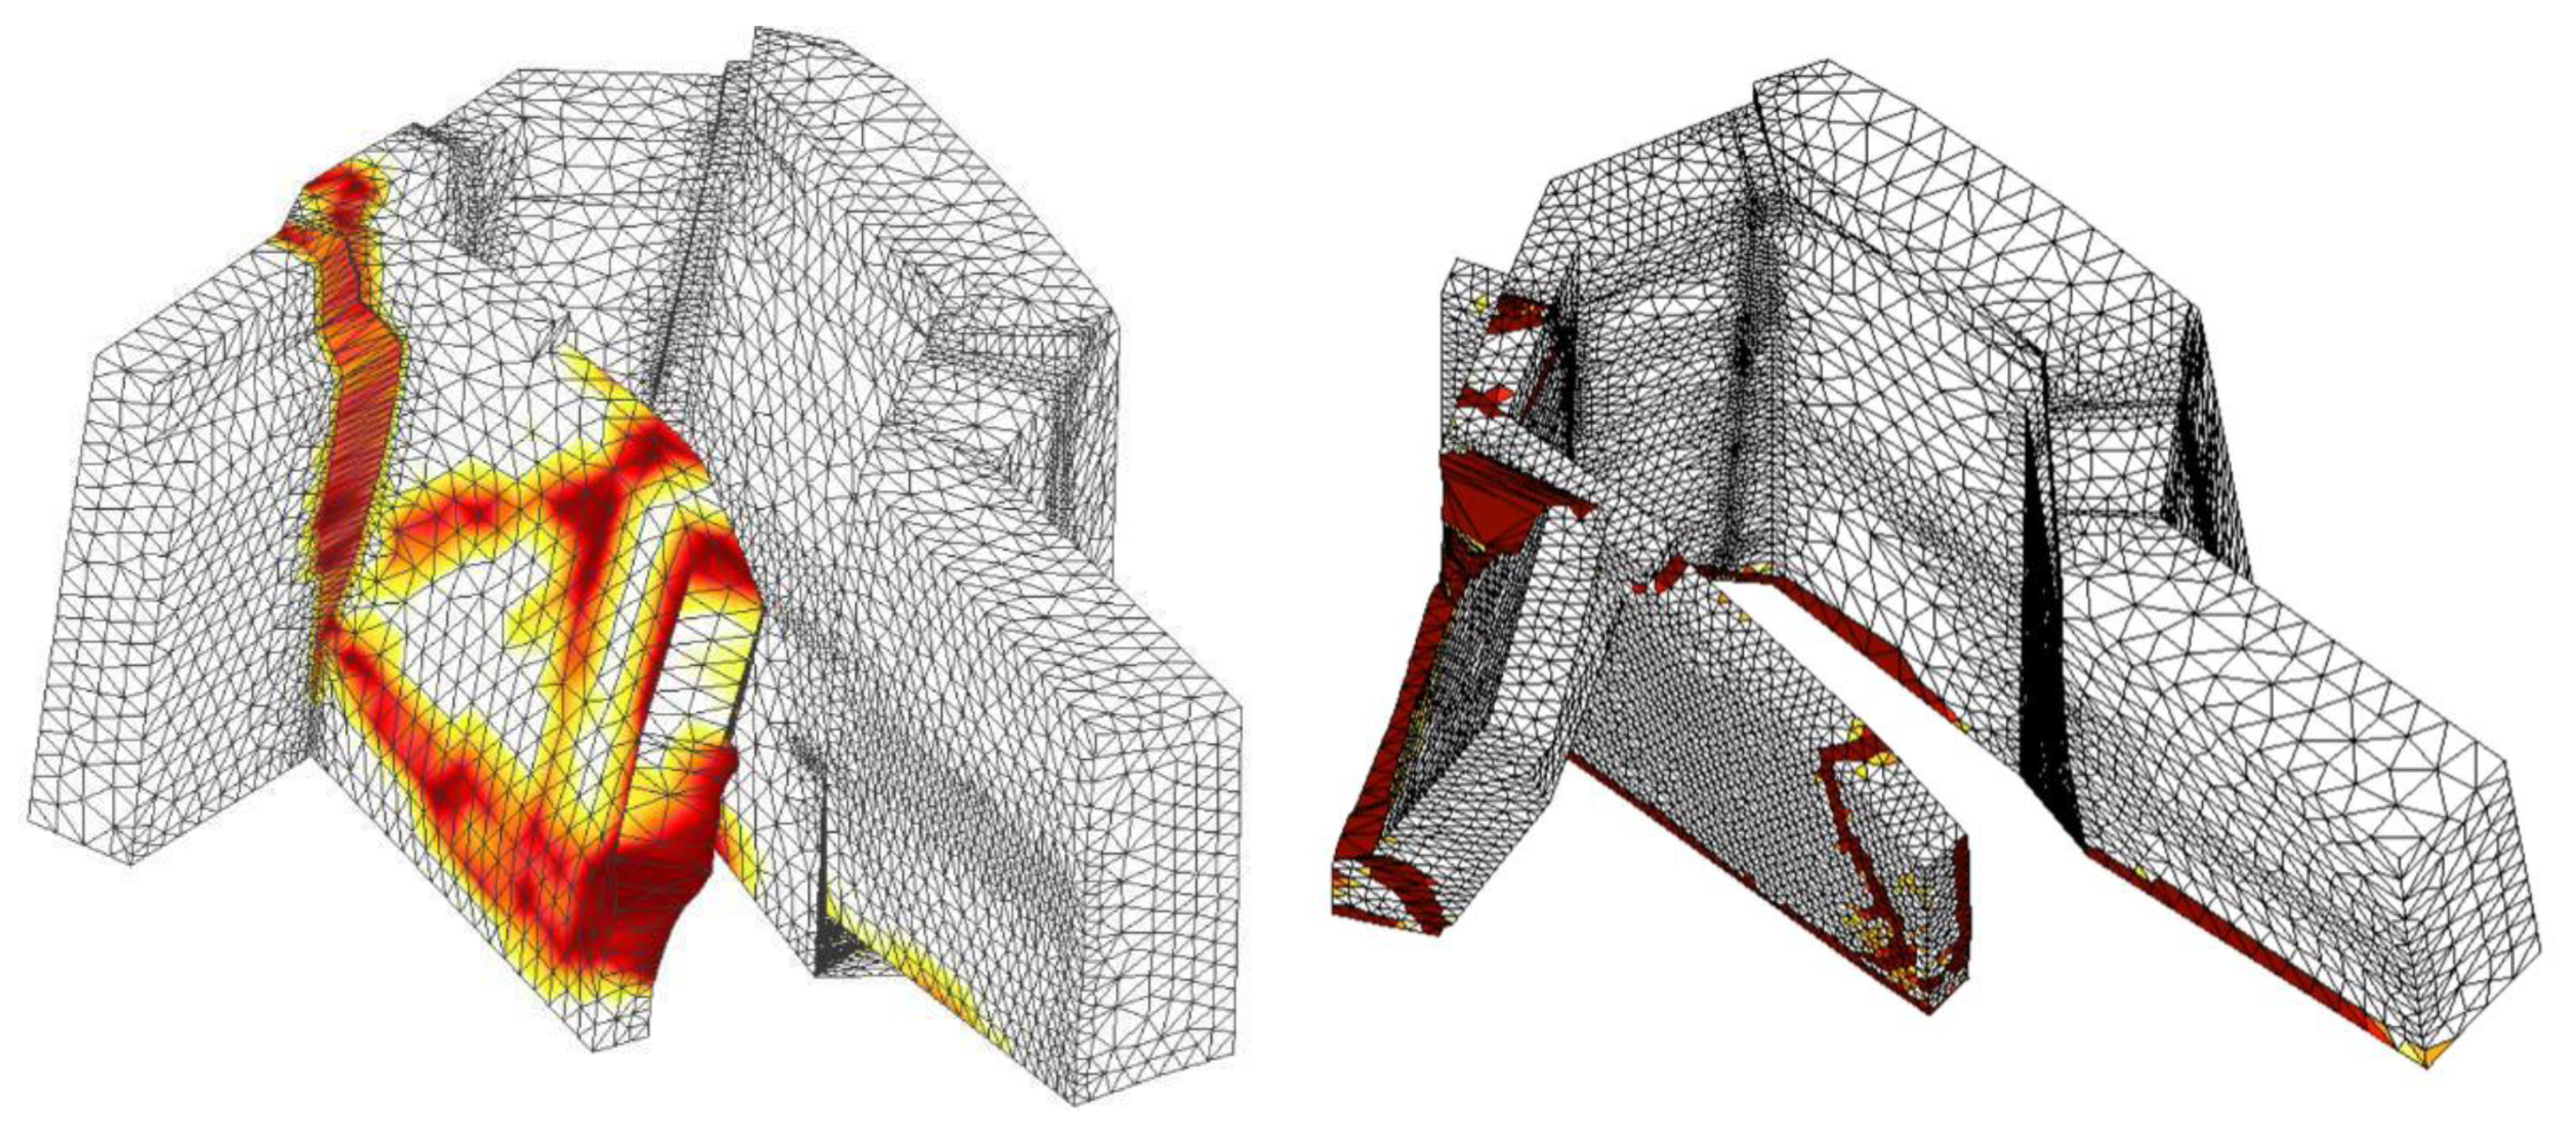
Damage Assessment
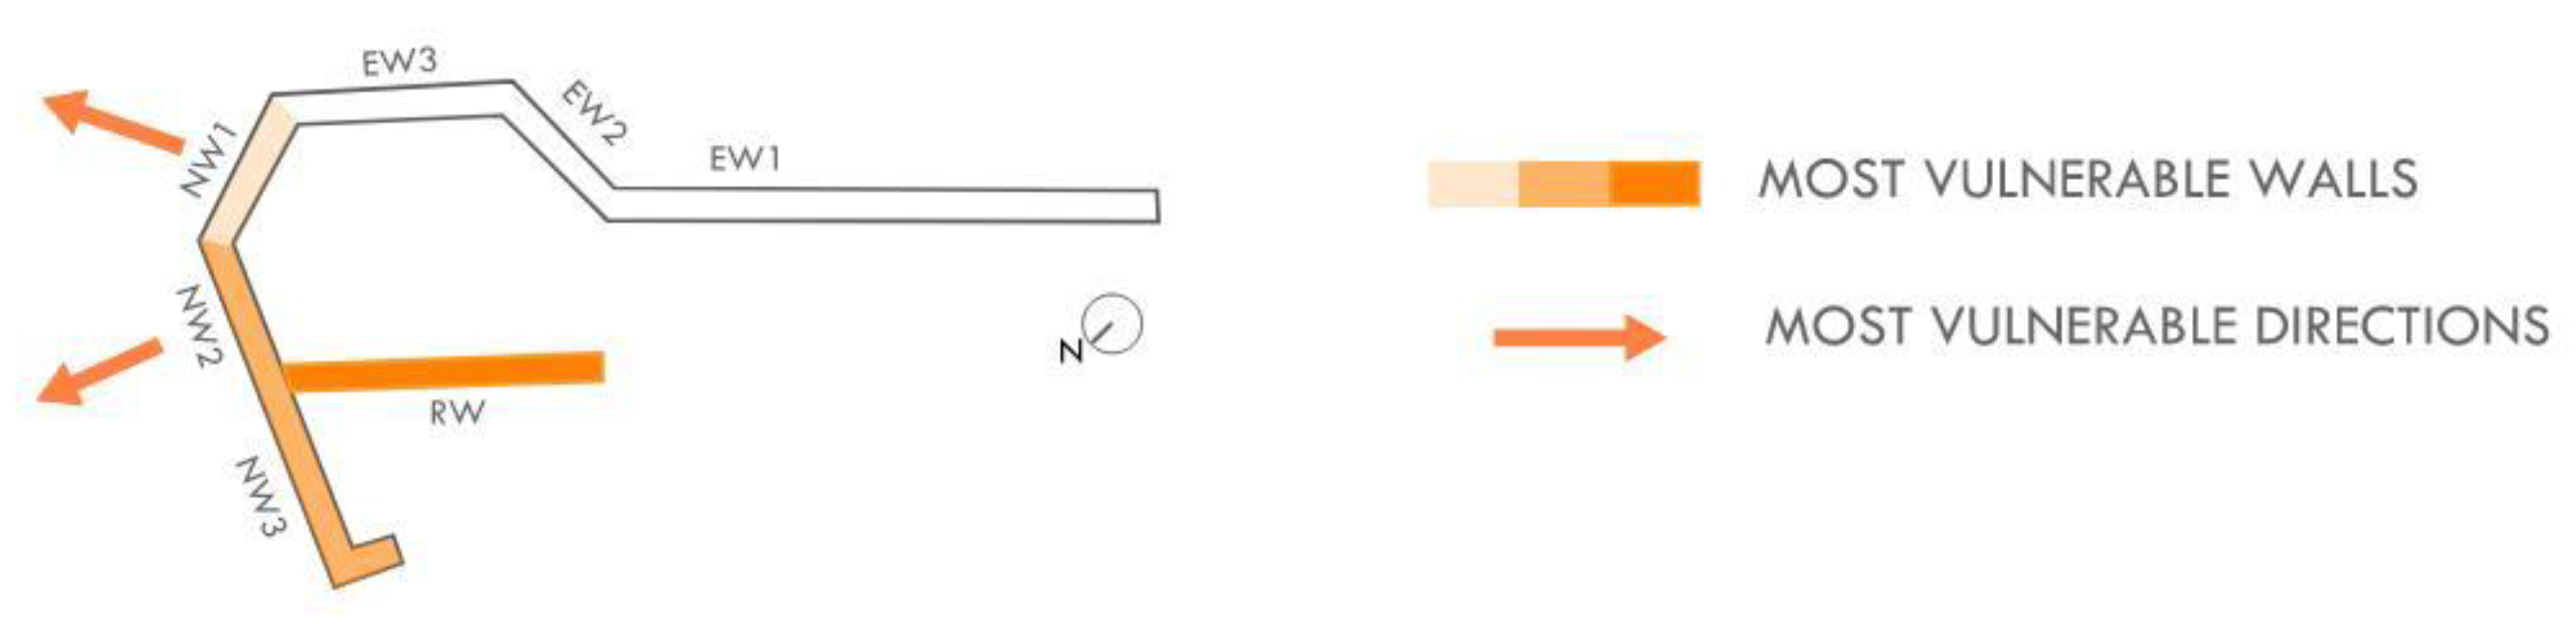
Seismic Assessment
6. Intervention
6.1. Geotechnical Intervention: Ground Stabilization
6.2. Structural Intervention: Seismic Retrofitting
Modelling of the Intervention
7. Conclusions
Author Contributions
Funding
Institutional Review Board Statement
Informed Consent Statement
Data Availability Statement
Acknowledgments
Conflicts of Interest
References
- ICOMOS/ISCARSAH (International Council on Monuments and Sites/International Scientific Committee on the Analysis and Restoration of Structures of Architectural Heritage) Committee. Recommendations for the Analysis, Conservation and Structural Restoration of Architectural Heritage; ICOMOS: Paris, France, 2005. [Google Scholar]
- Aguilar, A. Preservation Brief 41: The Seismic Rehabilitation of Historic Buildings; National Park Service, Historical Preservation Services, US Department of the Interior: Washington, DC, USA, 2016. [Google Scholar]
- Roca, P.; Cervera, M.; Gariup, G. Structural analysis of masonry historical constructions. Classical and advanced approaches. Arch. Comput. Methods Eng. 2010 17, 299–325. [CrossRef] [Green Version]
- Mallardo, V.; Malvezzi, R.; Milani, E.; Milani, G. Seismic vulnerability of historical masonry buildings: A case study in Ferrara. Eng. Struct. 2008, 30, 2223–2241. [Google Scholar] [CrossRef]
- Saloustros, S.; Pelà, L.; Roca, P.; Portal, J. Numerical analysis of structural damage in the church of the Poblet Monastery. Eng. Fail. Anal. 2015, 48, 41–61. [Google Scholar] [CrossRef]
- Castellazzi, G.; D’Altri, A.M.; de Miranda, S.; Ubertini, F. An innovative numerical modeling strategy for the structural analysis of historical monumental buildings. Eng. Struct. 2017, 132, 229–248. [Google Scholar] [CrossRef]
- Aranha, C.A.; Menon, A.; Sengupta, A. Determination of the causative mechanism of structural distress in the Presidential Palace of India. Eng. Fail. Anal. 2019, 95, 312–331. [Google Scholar] [CrossRef]
- Greco, F.; Lourenco, P.B. Seismic assessment of large historic vernacular adobe buildings in the Andean Region of Peru. Learning from Casa Arones in Cusco. J. Build. Eng. 2021, 40, 102341. [Google Scholar] [CrossRef]
- Dinani, A.T.; Destro Bisol, G.; Ortega, J.; Lourenço, P.B. Structural Performance of the Esfahan Shah Mosque. J. Struct. Eng. 2021, 147, 05021006. [Google Scholar] [CrossRef]
- D’Ambrisi, A.; Mariani, V.; Mezzi, M. Seismic assessment of a historical masonry tower with nonlinear static and dynamic analyses tuned on ambient vibration tests. Eng. Struct. 2012, 36, 210–219. [Google Scholar] [CrossRef]
- Costa, C.; Ribeiro, D.; Jorge, P.; Silva, R.; Arêde, A.; Calçada, R. Calibration of the numerical model of a stone masonry railway bridge based on experimentally identified modal parameters. Eng. Struct. 2016, 123, 354–371. [Google Scholar] [CrossRef]
- Torelli, G.; D’Ayala, D.; Betti, M.; Bartoli, G. Analytical and numerical seismic assessment of heritage masonry towers. Bull. Earthq. Eng. 2019, 18, 969–1008. [Google Scholar] [CrossRef]
- Spoldi, E.; Ippolito, I.; Stella, A.; Russo, S. Non-destructive techniques for structural characterization of cultural heritage: A pilot case study. Struct. Control. Health Monit. 2021, 28, e2820. [Google Scholar] [CrossRef]
- Oller, P.; Gonzalez, M.; Pinyol, J.; Marturià, J.; Martínez, P. Geohazards Mapping in Catalonia. J. Torrent Avalanche Landslide Rock Fall Eng. 2011, 74, 148–155. [Google Scholar]
- Achache, J.; Fruneau, B.; Delacourt, C. Applicability of SAR interferometry for operational monitoring of landslides. In Proceedings of the Second ERS Applications Workshop, London UK, 6–8 December 1995; pp. 165–168. [Google Scholar]
- Binda, L.; Saisi, A.; Tiraboschi, C. Investigation procedures for the diagnosis of historic masonries. Constr Build Mater 2000, 14, 199–233. [Google Scholar] [CrossRef]
- Miranda, L.F.; Rio, J.; Miranda Guedes, J.; Costa, A. Sonic Impact Method—A new technique for characterization of stone masonry walls. Constr. Build Mater. 2012, 36, 27–35. [Google Scholar] [CrossRef]
- Trifunac, M.D.; Todorovska, M.I.; Manic, M.I.; Bulajic, B. Variability of the fixed-base and soil–structure system frequencies of a building—The case of Borik-2 building. Struct. Control Health Monit. 2010, 17, 120–151. [Google Scholar] [CrossRef]
- Bulajic, B.D.; Todorovska, M.I.; Manic, M.I.; Trifunac, M.D. Structural health monitoring study of the ZOIL building using earthquake records. Soil Dyn. Earthq. Eng. 2020, 133, 106105. [Google Scholar] [CrossRef]
- Brinkers, R.; Kirkegaard, P. Special issue on operational modal analysis. Mech. Syst. Signal Process. 2001, 24, 1209–1212. [Google Scholar] [CrossRef]
- Peeters, B.; De Roeck, G. Reference-based stochastic subspace identification for output-only modal analysis. Mech. Syst. Signal Process. 1999, 13, 855–878. [Google Scholar] [CrossRef] [Green Version]
- SVS. ARTeMIS Extractor Pro User’s Manual, Release 6.0. Structural Vibration Solutions; SVS: Aalborg, Denmark, 2019. [Google Scholar]
- Pastor, M.; Binda, M.; Harčarik, T. Modal assurance criterion. Procedia Eng. 2012, 48, 543–548. [Google Scholar] [CrossRef]
- Ewins, D.J. Modal Testing: Theory, Practice and Applications, 2nd ed.; Research Studies Press: Baldock, UK, 2000. [Google Scholar]
- EN 1998-1; Eurocode 8: Design of Structures for Earthquake Resistance. Part 1: General Rules, Seismic Action and Rules for Buildings. European Committee for Standardisation (CEN): Brussels, Belgium, 2005.
- Freddi, F.; Novelli, V.; Gentile, R.; Velieu, E.; Andreev, S.; Andonov, A.; Greco, F.; Zhukelu, E. Observations from the 26th November 2019 Albania earthquake: The earthquake engineering feld investigation team (EEFIT) mission. Bull. Earthq. Eng. 2021, 19, 2013–2044. [Google Scholar] [CrossRef]
- KTP-N.2-89, 1989; Technical Aseismic Regulations. Publication of Academy of Sciences and Ministry of Constructions: Tirana, Albania, 1989. (In Albanian)
- Fajfar, P. A Nonlinear Analysis Method for Performance-Based Seismic Design. Earthq. Spectra 2000, 16, 573–592. [Google Scholar] [CrossRef]
- 29. EN 1990; Eurocode—Basis of Structural Design. European Committee for Standardisation (CEN): Brussels, Belgium, 2002.
- Brocher, T.M. Empirical relations between elastic wavespeeds and density in the Earth’s crust. Bull. Seismol. Soc. Am. 2005, 95, 2081–2092. [Google Scholar] [CrossRef]
- Karanikoloudis, G.; Lourenço, P.B. Structural assessment and seismic vulnerability of earthen historic structures. Application of sophisticated numerical and simple analytical models. Eng. Struct. 2018, 160, 488–509. [Google Scholar] [CrossRef] [Green Version]
- Pešić, N.; Živanović, S.; Dennis, J.; Hargreaves, J. Experimental and finite element dynamic analysis of incrementally loaded reinforced concrete structures. Eng. Struct. 2015, 103, 15–27. [Google Scholar]
- Lollino, G.; Giordan, D.; Marunteanu, C.; Christaras, B.; Yoshinori, I.; Margottini, C. Engineering Geology for Society and Territory–Volume 8: Preservation of Cultural Heritage; Springer: New York, NY, USA, 2015; pp. 1–584. [Google Scholar]
- FEMA. Evaluation of Earthquake Damaged Concrete and Masonry Wall Buildings. Basic Procedures Manual, Management; FEMA: Washington, DC, USA, 1998. [Google Scholar]
- Angelillo, M.; Lourenço, P.B.; Milani, G. Mechanics of Masonry Structures; Springer: New York, NY, USA, 2014; Volume 551. [Google Scholar]
- Faria, R.; Oliver, J.; Cervera, M. A strain-based plastic viscous-damage model for massive concrete structures. Int. J. Solids Struct. 1998, 35, 1533–1558. [Google Scholar] [CrossRef]
- Saloustros, S.; Pelà, L.; Cervera, M.; Roca, P. Finite element modelling of internal and multiple localized cracks. Comput. Mech. 2017, 59, 299–316. [Google Scholar] [CrossRef] [Green Version]
- Petracca, M.; Pelà, L.; Rossi, R.; Oller, S.; Camata, G.; Spacone, E. Regularization of first order computational homogenization for multiscale analysis of masonry structures. Comput. Mech. 2016, 57, 257–276. [Google Scholar] [CrossRef]
- Ministero per i Beni e le Attività Culturali. Linee Guida per la Valutazione e Riduzione del Rischio Sismico del Patrimonio Culturale; Ministero per i Beni e le Attività Culturali: Rome, Italy, 2021; ISBN 978-88-492-1165-8. [Google Scholar]


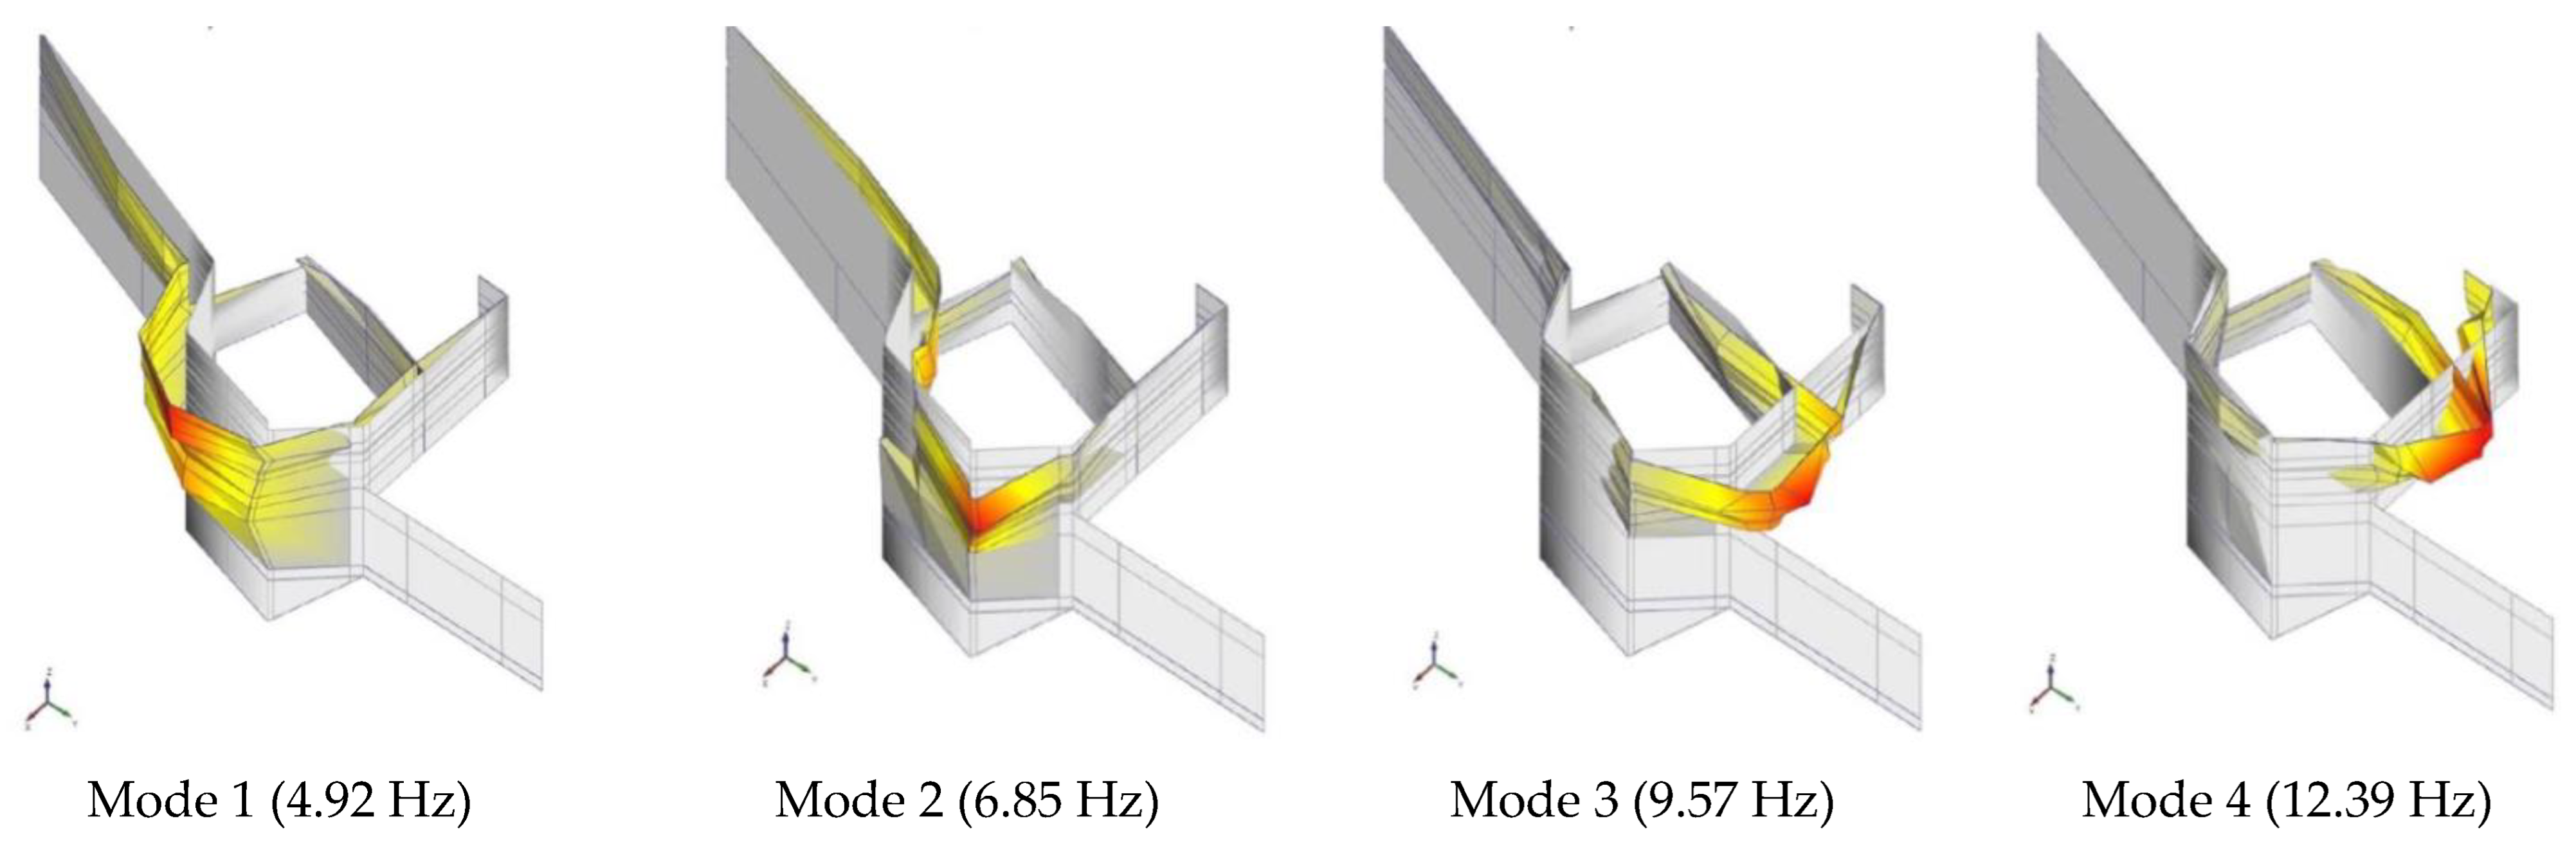
| Experimental Range of All Setups | Numerical Model | Absolute Error in Frequencies | MAC | |
|---|---|---|---|---|
| Modes | Freq. [Hz] | Freq. [Hz] | [%] | [-] |
| Mode 1 | 4.92 | 4.82 | 2.03 | 0.88 |
| Mode 2 | 6.85 | 6.88 | 0.44 | 0.78 |
| Mode 3 | 9.57 | 9.54 | 0.31 | 0.75 |
| Mode 4 | 12.39 | 12.42 | 0.24 | 0.75 |
| Material | E (N/mm2) | fc (N/mm2) | ft (N/mm2) | Gfc (N/mm2) | Gft (N/mm2) | ρ [kg/m3] |
|---|---|---|---|---|---|---|
| Masonry 1 “Original” | 2600 | 4.70 | 0.240 | 7.6 | 0.015 | 2100 |
| Masonry 2 “Medium” | 1400 | 2.55 | 0.130 | 4.1 | 0.009 | 2000 |
| Masonry 3 “Low” | 700 | 1.27 | 0.065 | 2.0 | 0.006 | 1900 |
| Masonry 4 “Restored” | 3600 | 6.55 | 0.320 | 10.5 | 0.018 | 2100 |
| Masonry 5 “Rear Wall” | 2200 | 4.00 | 0.200 | 6.4 | 0.013 | 2000 |
| Cracks 1, 3, 4 | 0.4 | - | - | - | - | 1000 |
| Crack 2 top | 0.4 | - | - | - | - | 1000 |
| Crack 2 bottom | 2.0 | - | - | - | - | 1000 |
| Crack 5 top | 100 | - | - | - | - | 1900 |
| Crack 5 bottom | 700 | - | - | - | - | 1900 |
| Masonry | E [N/mm2] | fc [N/mm2] | ft [N/mm2] | Gft [N/mm] | Gfc [N/mm] | ρ [kg/m3] | |||||
|---|---|---|---|---|---|---|---|---|---|---|---|
| Lower Bound | Upper Bound | Lower Bound | Upper Bound | Lower Bound | Upper Bound | Lower Bound | Upper Bound | Lower Bound | Upper Bound | ||
| “Original” | 3120 | 3640 | 5.70 | 6.60 | 0.28 | 0.33 | 0.017 | 0.018 | 9.1 | 10.6 | 2100 |
| “Medium” | 1680 | 1960 | 3.10 | 3.60 | 0.15 | 0.18 | 0.011 | 0.012 | 4.9 | 5.7 | 2100 |
| “Low” | 910 | 1050 | 1.70 | 1.90 | 0.07 | 0.08 | 0.007 | 0.008 | 2.6 | 3.1 | 2000 |
| “Restored” | 4320 | 5040 | 7.90 | 9.20 | 0.39 | 0.46 | 0.021 | 0.023 | 12.6 | 14.7 | 2100 |
| “Rear wall” | 2640 | 3080 | 4.80 | 5.60 | 0.24 | 0.28 | 0.015 | 0.016 | 7.7 | 9.0 | 2000 |
Publisher’s Note: MDPI stays neutral with regard to jurisdictional claims in published maps and institutional affiliations. |
© 2022 by the authors. Licensee MDPI, Basel, Switzerland. This article is an open access article distributed under the terms and conditions of the Creative Commons Attribution (CC BY) license (https://creativecommons.org/licenses/by/4.0/).
Share and Cite
Núñez García, M.; Saloustros, S.; Mateos Redondo, F.; Alonso Campanero, J.A.; Ortega, J.; Greco, F.; Aranha, C.; Martínez Cuart, I. Seismic Retrofit of Existing Structures Based on Digital Surveying, Non-Destructive Testing and Nonlinear Structural Analysis: The Case of Gjirokastra Castle in Albania. Appl. Sci. 2022, 12, 12106. https://doi.org/10.3390/app122312106
Núñez García M, Saloustros S, Mateos Redondo F, Alonso Campanero JA, Ortega J, Greco F, Aranha C, Martínez Cuart I. Seismic Retrofit of Existing Structures Based on Digital Surveying, Non-Destructive Testing and Nonlinear Structural Analysis: The Case of Gjirokastra Castle in Albania. Applied Sciences. 2022; 12(23):12106. https://doi.org/10.3390/app122312106
Chicago/Turabian StyleNúñez García, Marieta, Savvas Saloustros, Felix Mateos Redondo, José Alberto Alonso Campanero, Javier Ortega, Federica Greco, Chrysl Aranha, and Irene Martínez Cuart. 2022. "Seismic Retrofit of Existing Structures Based on Digital Surveying, Non-Destructive Testing and Nonlinear Structural Analysis: The Case of Gjirokastra Castle in Albania" Applied Sciences 12, no. 23: 12106. https://doi.org/10.3390/app122312106