1. Introduction
Currently, chlorinated organic compounds are mainly used in industry for degreasing and dry cleaning, but due to improper disposal procedures for the storage tanks, they are released into the environment, making soil and groundwater contaminated by chlorinated organic compounds a common problem [
1]. The subsequent disposal of these chlorinated organic compounds usually occurs in hazardous waste disposal sites, especially in urban industrial areas [
2]. Among the chlorinated organic compounds, trichloroethylene (TCE) and perchloroethylene (PCE) are volatile organic compounds (
Figure 1), which have been approved by the United States Department of Health and Human Services and confirmed to be carcinogenic chemicals [
3]. Therefore, in consideration of human health, it is necessary to establish effective remedial methods to protect groundwater plant sites polluted by chlorinated ethylenes, such as TCE and PCE.
The densities of TCE and PCE are 1.46 g cm
−3 and 1.62 g cm
−3, respectively [
4], and both of these compounds are dense nonaqueous phase liquids (DNAPLs), which are liquids with a density greater than water. The soil gaps in the saturated layers of groundwater systems are all filled with water and are under an anoxic environment, so DNAPLs cannot volatilize into their gas phases. Therefore, once they enter the groundwater system, they will sink to the bottom of the groundwater, increasing the difficulty of groundwater remediation [
5]. Kueper and McWhorter [
6] pointed out that chlorine-containing organic compound DNAPLs have a tendency to enter and flow through cracks even when the groundwater pores are small. In addition, due to the high density and low solubility of chlorinated organic compounds, TCE and PCE are more likely to diffuse downward through aquifers to form impermeable strata than other soluble pollutants. Therefore, DNAPL remediation is one of the most complex technical challenges faced by environmental engineers [
7,
8,
9].
The adsorption of an organic pollutant is usually described through adsorption isotherm, that is, the amount of adsorbate on the adsorbent as a function of its concentration at a constant temperature. At present, many adsorption isotherm models have been developed, among which the Langmuir isotherm and the Freundlich isotherm are the most common models. Therefore, the adsorption experimental data in this study will be interpreted in these two modes.
To assess whether there is a risk of exposure to groundwater, the general approach is to monitor the flow of chlorinated organic compounds along the groundwater stream and use the concentration of pollutants and byproducts to explore various natural attenuation (NA) mechanisms, such as physical, geochemical and microbial degradation [
5]. The NA of TCE and PCE in natural water bodies mainly occurs through physical dispersion and dilution processes, followed by a biochemical dechlorination process. TCE and PCE are often found together in groundwater because TCE is produced by the reductive dechlorination of PCE [
2]. PCE produces TCE through biological reduction and dechlorination, and, after various subsequent reductions, PCE can ultimately be reduced to ethylene, which is not harmful to the environment. However, the NA transformation process is quite slow and difficult, and the toxicity and fluidity of the substances produced after NA may be greater than those of the original pollutants [
10]. Therefore, technologies for removing pollutants from water evolved from the NA mechanisms to include biological degradation, incineration, condensation, extraction, ion exchange, adsorption, etc. [
11].
Among various treatment technologies for removing organic compounds from the environment, adsorption is a simple and effective method. The adsorption operation process is simpler, less expensive and results in less pollution [
12,
13]. Therefore, adsorption is a powerful, versatile and simple method for removing environmental pollutants from water streams [
14,
15,
16]. The adsorption effect of the adsorbent on the adsorbate depends on several factors, including the crystalline structure, particle size, pore dimensions, pore volume, specific surface area of the adsorbent and the type of adsorbate [
17]. Among them, the specific surface area and particle size have the most significant influences on the adsorption effect. The smaller the particle size is, the larger the specific surface area, and the larger the equilibrium adsorption capacity.
Based on the above advantages, it is considered to be an effective technology for the treatment of volatile organic compounds, such as TCE and PCE [
18]. In general, various artificial and natural porous materials are often used as adsorbents in typical adsorption methods, and the most effective adsorbent is activated carbon [
19]. Activated carbon is widely used in wastewater treatment and has received industrial attention because of its high surface area, high adsorption capacity and good porosity [
12,
20]. Pal et al. [
21] showed that different types of activated carbon have the largest adsorption capacity for ethanol, as high as 1900 mg g
−1 and 1650 mg g
−1. Kumar and Gupta [
15] pointed out that the adsorption capacity of activated carbon for naphthalene (naphthalene) is 73.01 mg g
−1. Anisuzzaman et al. [
22] and Shaarani and Hameed [
23] showed that the adsorption capacity of activated carbon for 2,4-dichlorophenol is 46.74 mg g
−1 and 258.71 mg g
−1, respectively. However, due to some shortcomings of adsorbents, such as pore blockage, short service life and high regeneration cost, their further industrial applications are limited [
18]. Traditional activated carbon is expensive to manufacture and is not easy to recycle. Therefore, its application in industry has gradually developed. Before activated carbon is used to treat polluted water, other kinds of adsorbents are added for treatment to reduce the consumption of activated carbon.
Silica gel is a kind of environmentally friendly and porous silica hydrate with good thermal conductivity and specific surface area [
24]. Therefore, silica gel is often used as an adsorbent for various substances. For example, Zhang et al. [
25] found that the adsorption capacity of two kinds of silica gel for dichromate is 24.03 mg g
−1 and 16.52 mg g
−1, respectively. In addition, a study by Fu et al. [
26] showed that the adsorption capacity of silica gel for Mn(II) is 3.3 mg g
−1. In addition to removing heavy metal pollution from the environment, silica gel can also be used to remove organic substances. A study by Sigot et al. [
27] indicated that the adsorption capacity of octamethylcyclotetrasiloxane with silica gel for volatile organic silicon compounds (VOSiCs) is 250 mg g
−1. Hong et al. [
18] found that the adsorption capacity of silica gel for toluene is 325 mg g
−1. In the above studies, silica gel was used as an adsorbent, and it was found that the adsorption capacity of silica gel for organic substances is better than that for heavy metals. In addition, silica gel is rarely used to adsorb chlorine-containing organic compounds (such as TCE and PCE). Therefore, in this study, we selected a silica gel gel with a good adsorption capacity for organic substances and a low price to carry out the TCE and PCE adsorption experiments.
According to the experimental results of Erto et al. [
28] on the activated-carbon adsorption of TCE, the Freundlich and Dubinin–Astakhov models can be used to analyze and interpret experimental data at a confidence level of 95%. Between them, the Dubinin–Astakhov model shows greater statistical uncertainty but is more suitable for high concentration ranges. Therefore, under the condition of a low solute concentration, the Freundlich model shows better affinity and applicability for adsorption mechanisms and experimental data [
29].
The Radio Company of America (RCA) Taoyuan Factory is located in Taoyuan City, Taiwan. It was established in 1970, focusing on TVs, electronic components and computer crystal products, and closed in 1992. On 19 March 1993, the Environmental Protection Agency of Taiwan announced that the RCA plant area was a groundwater pollution control site of about 7.2 hectares. The main pollutants are chlorinated organic solvents. In 2019, the RCA Company proposed the fourth phase of the remediation plan, the content of which is to improve the groundwater pollution. The fourth pilot test of the plan, including bioaugmentation and biostimulation, was completed in June 2020.
This study involved the processing of experimental data according to adsorption theory and the use of the Langmuir and Freundlich models for analysis to explain the adsorption behavior of chlorinated organic compounds (TCE and PCE) on the surfaces of two adsorbents, silica gel and activated carbon. According to the deduction results, we can understand the adsorption mode types of the two adsorbents. In addition, this study involved the use of models to predict the removal efficiency of adsorbents and the amount of adsorbent used and compares the error with the experimental value. Moreover, based on the results of the adsorption experiments combined with the evaluation of the on-site remediation of an actual contaminated groundwater site, the quality of the adsorbent needed and the economic cost were also analyzed. Finally, according to the adsorption results, the amount of adsorbent used during remediation was estimated, and then the best way to use different adsorbents during remediation and its cost estimation were proposed. This study hopes to quickly estimate the pollution remediation costs based on the adsorption results in the laboratory.
2. Methodology
2.1. Research Materials
2.1.1. Adsorbate
Chlorinated organic compounds are chlorinated aliphatic hydrocarbons (CAHs), and common types of CAHs include tetrachloroethylene, trichloroethylene, vinyl chloride, etc. These compounds are all chlorinated ethenes, which have the characteristics of high volatility, low flammability, low boiling point and low explosiveness. Among them, TCE and PCE are highly oxidized. It is easy to obtain electrons for reductive degradation reactions, and it is not easy to release electrons for oxidation reactions. Therefore, TCE and PCE have high chemical stabilities in aerobic environments [
7]. In addition, TCE and PCE are hydrophobic DNAPLs (
Table 1) [
30], and their solubilities are 1.10 and 0.15 g L
−1 (20 °C water), respectively. In addition, TCE and PCE are some of the most common chlorinated organic compounds in groundwater pollution, and their chlorinated byproducts include 1,1-dichloroethene, cis-1,2-dichloroethene, trans-1,2-dichloroethene and vinyl chloride, which pose potential threats to the environment and human health [
31].
2.1.2. Adsorbent and Activation Steps
In this study, two adsorbents, silica gel and activated carbon, were used. The basic properties of activated carbon and silica gel are listed in
Table 2. Silica gel (Macherey-Nagel, Germany) is a granular porous silica hydrate prepared by adding acid to sodium silicate and then washing and drying. It is a transparent or milky white solid. The preparation of silica gel mainly occurs through three steps, namely, gel preparation, aging and drying [
32]. Silica gel is often used as an adsorbent, desiccant, standard purification column technology and solid phase extraction cartridge method for purification. Because of its good adsorption characteristics, it is a widely used adsorption material, and it is less expensive than other adsorption materials [
33]. The activation of the silica gel in this study refers to the Tso and Chao [
34] silica gel heating activation method, heating at 110–120 °C for 24 h to remove moisture and impurities from the silica gel, thereby increasing the adsorption surface area of the silica gel.
Activated carbon (Merck, Netherlands) is an amorphous carbonaceous material. Because of its large specific surface area and large pore volume [
35], it has become one of the most popular and commonly used adsorbents. It is often used in industrial processes and daily life. In this research, physical activation is used to remove the atoms from the surface layer by using gas at a high temperature (800–1100 °C) to make the activated carbon form greater pore dimensions to increase the activated carbon adsorption surface area [
36].
2.2. Adsorption Experiment
Considering that the average flow velocity of groundwater is quite slow, only 1~2 m per day, all adsorption experiments in this study do not include external factors (such as shaking, stirring, etc.) after the adsorbent addition. Instead, the sorbent is allowed to react with the water sample during the precipitation process without agitation to achieve experimental conditions similar to those in the groundwater environment.
One microliter of TCE stock solution (≥99.5% purity, CAS Number 79-01-6, Merck, Germany) and PCE stock solution standards (≥99.5% purity, CAS Number 127-18-4, Merck, Germany) were added to 1 mL of methanol solvent (CAS Number 67-56-1, Avantor, USA) and diluted to make a TCE standard stock solution with a concentration of 1424 mg L−1 and a PCE standard stock solution with a concentration of 1625 mg L−1. In the high-concentration adsorption experiment, 400, 450, 500, 550, 600, 650 and 700 μL of TCE and PCE standard stock solutions were added to 100 mL of ultrapure water. After shaking evenly, 10 g of silica gel was added and allowed to stand for 5, 10, 20, 30, 60 and 120 min, and then the TCE and PCE contents in the water were measured after the adsorption process. In addition, in the low-concentration adsorption experiment, 40, 45, 50, 55, 60, 65 and 70 μL of TCE and PCE standard stock solutions were added to 100 mL of ultrapure water. After shaking evenly, 10 mg of activated carbon was added and allowed to stand for 5, 15, 30, 60, 120, 180 and 300 s, and then the TCE and PCE contents in the water were measured after the adsorption process. When the adsorption experiment was carried out, the room temperature was controlled under 20 °C to avoid the loss of TCE/PCE due to evaporation. In order to avoid the adsorption phenomenon caused by the glassware/vial/cap, there will be a control group for each adsorption experiment; that is, in the solution of known concentration, without adding the adsorbent, and finally getting on the computer and calculating the recovery rate and then controlling the recovery rate above 90%.
2.3. Analytical Method
Microsyringes were used to inject water samples containing chlorine-containing organic compounds into the blowing tube of a purge and trap concentrator (Tekmar 3000, GenTech Scientific, USA). The water sample was blown with nitrogen (purity 99.9995%) at 30 °C for 11 min, and the chlorine-containing organic compounds were introduced into the capture tube for collection. After the capture was completed, the organic matter was introduced into a gas chromatograph (6890, Agilent Technologies, USA) by instantaneously heating to 220 °C for desorption for 4 min and using nitrogen to pass through the capture tube in reverse. Then, a gas chromatography column (EquityTM-5, 30 m × 0.53 mm, Supelco) and nitrogen gas as the carrier gas (99.9995% purity) were used, the components were separated, and a flame ionization detector (FID) was used to analyze the chlorine-containing organic compounds in the water. The working temperature of the sampler was kept at 220 °C, and the working temperature of the detector was kept at 250 °C. The initial temperature of the oven was set at 25 °C, then it was increased to 100 °C at a rate of 8 °C per minute, and then the temperature was increased to 200 °C at a rate of 25 °C per minute and finally kept at 200 °C for 1 min.
To ensure the samples’ accuracy, a duplicated analysis was used to carry out qualitative and quantitative experiments on the standard products. Before the sample analysis, a mixture of the TCE (109.46 mg L
−1) and PCE (121.50 mg L
−1) standards with a known concentration was applied to test the reliability of the calibration line and calculate the recovery rate of the standard. The analysis results showed that the recovery rates of the TCE and PCE calibration lines were between 84–96% and 89–102%, respectively (
Table 3). In addition, before each experiment, a blank sample was administered to confirm the instrument condition. The blank tests of TCE and PCE in this study are 3.016 ± 0.351 and 3.141 ± 0.299 μg L
−1, respectively. The detection limits of TCE and PCE are 1.053 and 0.900 μg L
−1, respectively (
Table 4). In addition, the analysis of each sample was repeated at least four times to ensure the repeatability of the results, and the relative standard deviations (R.S.D.s) of the activated carbon and silica gel adsorption of TCE and PCE, respectively, were calculated. The R.S.D.s of the TCE and PCE in the adsorption study of silica gel were 0.83~11.63% and 0.68~8.28%, respectively (
Table 5). The R.S.D. ranges of the TCE and PCE in the study of activated carbon adsorption were 0.50~4.43% and 0.58~6.80%, respectively (
Table 6).
2.4. Adsorption Isotherm Models
The calculation formula of the adsorption capacity (qe; mg g
−1) of the adsorbent (silica gel and activated carbon) for the adsorbate (TCE and PCE) through the adsorption experiment is:
where V refers to the volume of the initial solution (mL), M refers to the mass of the adsorbent (g), C
0 refers to the initial adsorbate concentration (mg L
−1) and C
e refers to the adsorption equilibrium concentration (mg L
−1). The adsorption capacity varies according to the adsorption capacity of the adsorbent for the adsorbate, so it can be used to judge whether the adsorbent is suitable for adsorbing the adsorbate.
2.4.1. Langmuir Isotherm
Langmuir derived an isotherm adsorption equilibrium equation theoretically in 1916, and its formula is as follows:
where q
m is the maximum saturated adsorption capacity (mg g
−1) and K
L is the Langmuir isotherm adsorption constant, which is related to the adsorption energy. By plotting 1/q
e and 1/C
e, Equation (2) can be converted into a linear mode, and the constants q
m and K
L can be obtained from the intercept and slope of the line:
Webber and Chakkravorti [
37] used the Langmuir constant K
L to define a dimensionless constant for this isotherm adsorption mode, called the separation factor or equilibrium parameter, expressed as R
L:
The type of adsorption isotherm curve can be observed by the value of R
L [
38].
Substituting Equation (1) into Equation (2) yields a second-order function, where C
e is a variable parameter:
If all variables except C
e are regarded as constants, Equation (5) can be regarded as a quadratic equation, so C
e can be solved [
39]:
By obtaining a set of K
L and qm from an adsorption experiment, the solute concentration (C
e) at adsorption equilibrium can be estimated for a given initial solute concentration (C
0) and fixed volume (V) of the adsorbent mass (M). In addition, the removal efficiency of the organic pollutants is defined as R or the removal percentage R(%):
For the known initial adsorbate concentration and adsorbate removal efficiency, substituting Equations (1) and (7) into Equation (2), the equation for the adsorbent mass predicted by the Langmuir model (L model) can be obtained [
39,
40]:
Therefore, as long as the two parameters, KL and qm, obtained through an adsorption experiment are used, the relationship between the quality of the adsorbent and the adsorption removal efficiency can be calculated.
2.4.2. Freundlich isotherm
Freundlich [
41] derived an empirical formula based on the equilibrium result of the isothermal experiment, which is the Freundlich isotherm adsorption equation. The basic assumption of this model is that the solid surface has different adsorption positions and requires different adsorption energies. The equation is as follows:
where K
F is the Freund isotherm adsorption constant representing the adsorption capacity of the adsorbent, and n is the Freund isotherm adsorption constant representing the linear deviation. After taking the log on both sides of Equation (10), it can be converted into a linear form:
By plotting the log on both sides of Equation (10), a straight line with a slope of 1/n and an intercept of KF is obtained. From this, two constants, n and KF, can be determined, where the value of n will affect the type of adsorption curve.
The Freundlich adsorption isotherm can be re-expressed with mass balance [
39,
40]; that is, Equation (1) can be replaced by Equation (10):
Then, the initial solute concentration can be used to obtain the relationship between R and M:
Once the Langmuir and Freundlich adsorption isotherm parameters are derived from the data of the adsorption experiment, the equilibrium solute concentration in the solution and the removal efficiency of the adsorbent to the adsorbate or the removal efficiency of the research target can be calculated, and the required adsorbent quality can be determined.
3. Results and Discussion
3.1. Silica Gel and Activated Carbon Adsorption Experiment
From the adsorption curves of the high-concentration TCE (
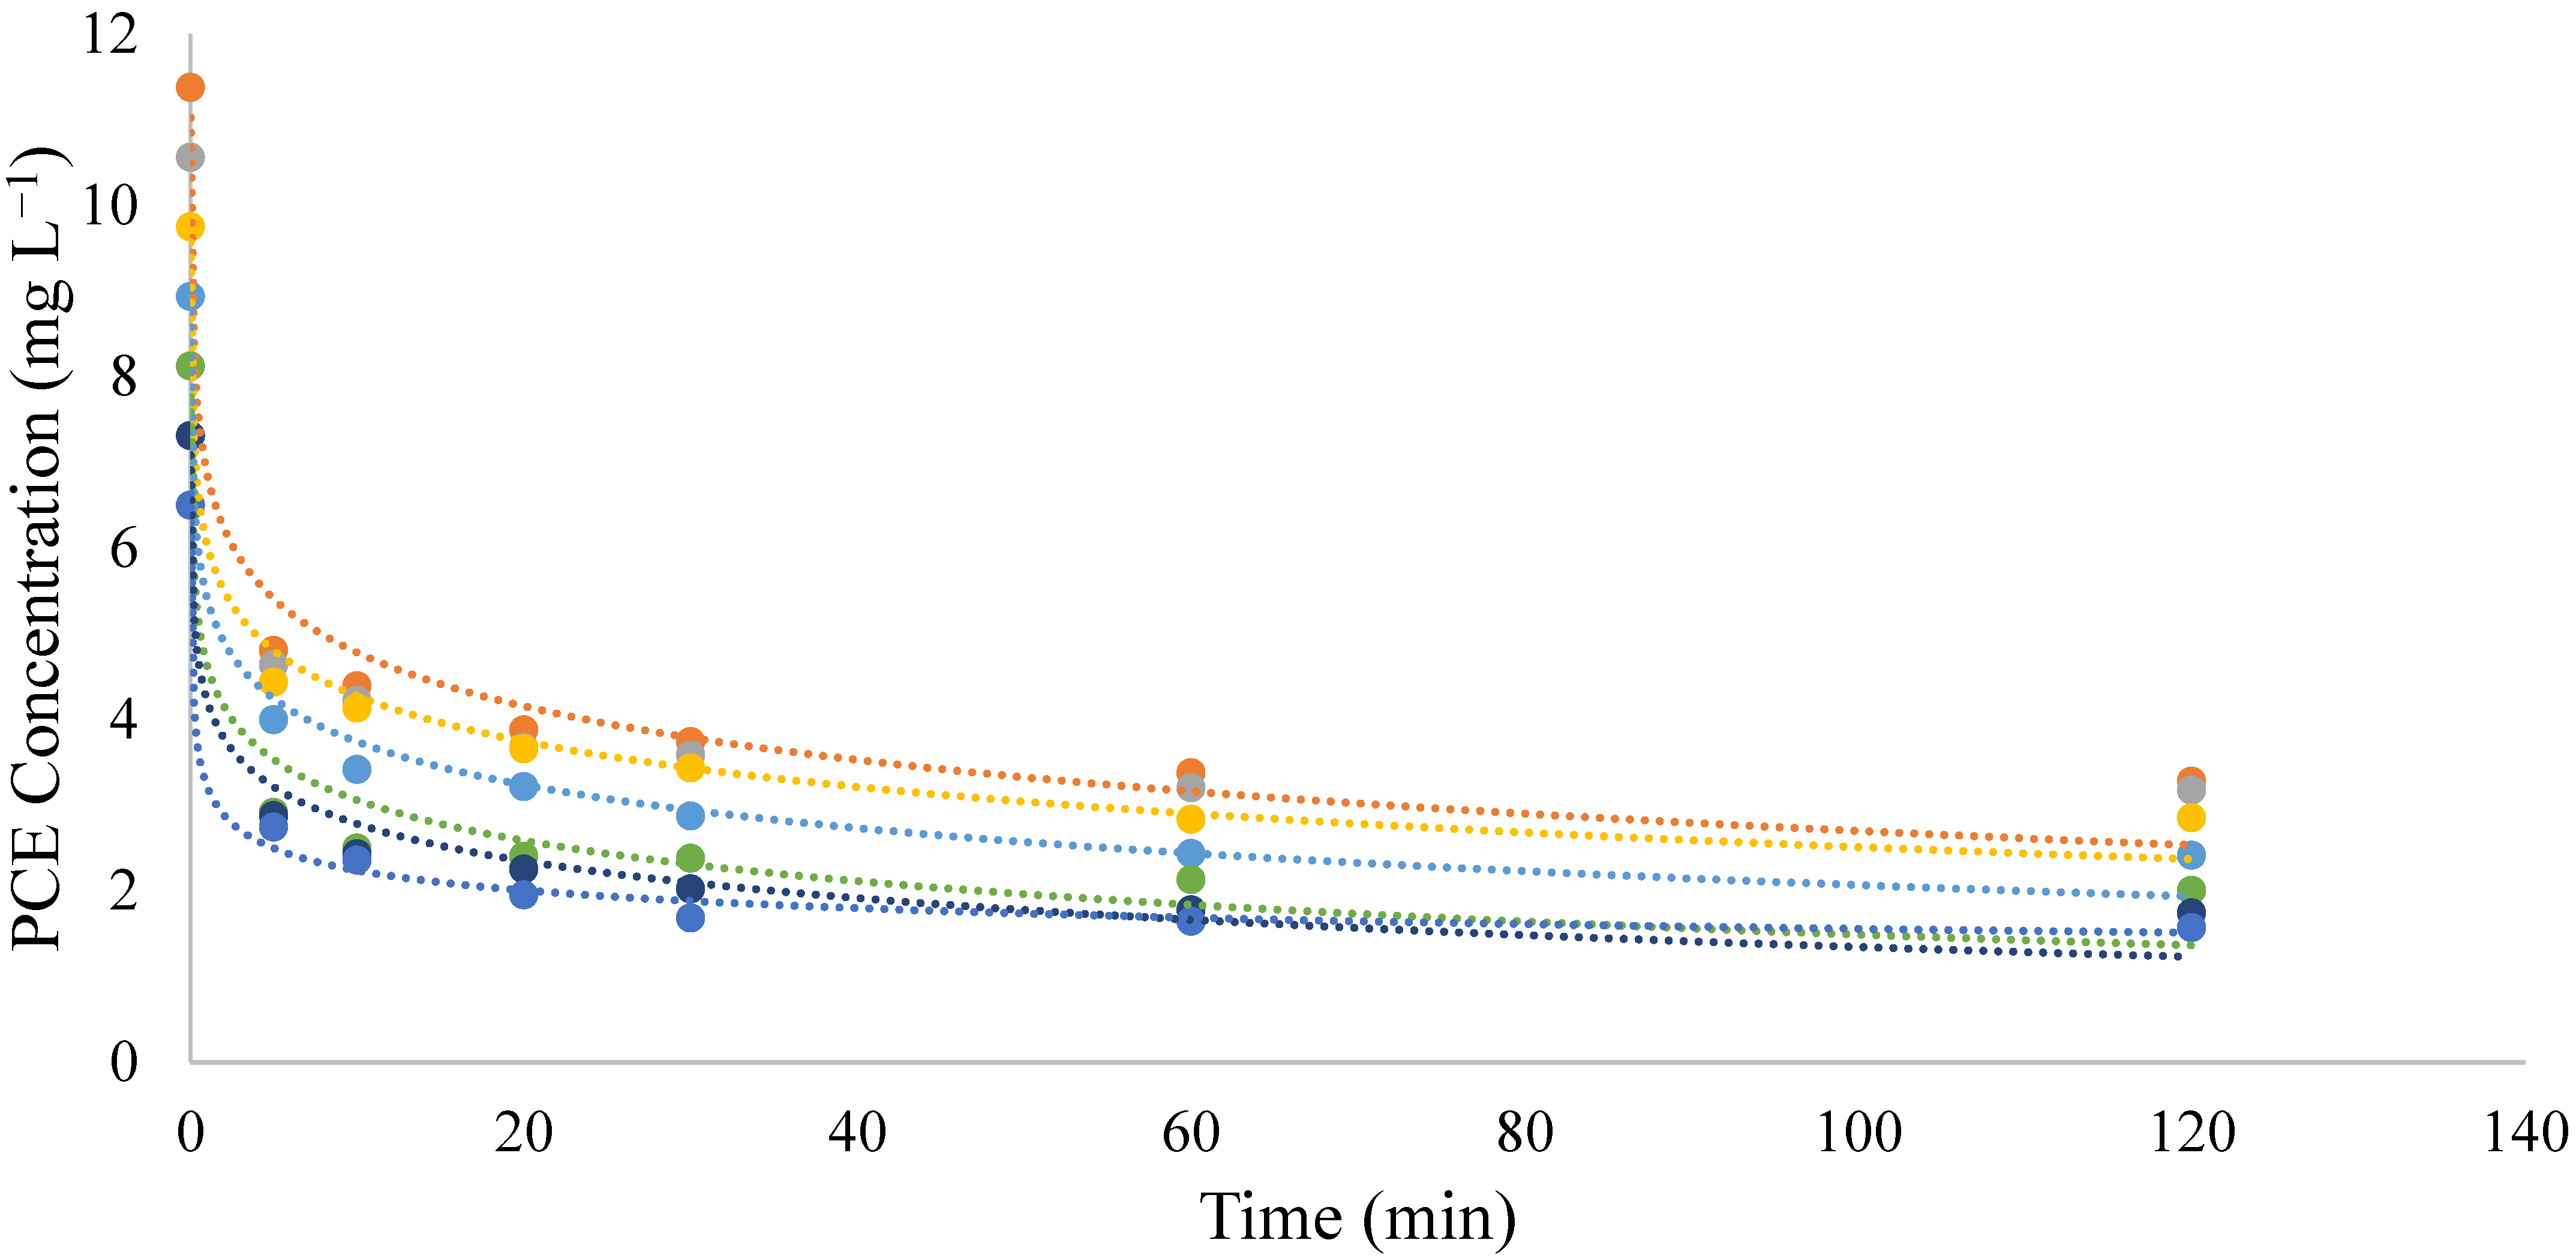
Figure 2) and PCE (
Figure 3) by the silica gel, it can be seen that the adsorption of the high-concentration TCE and PCE by the silica gel takes approximately 60 min to reach adsorption equilibrium. The equilibrium adsorption capacities of silica gel for the TCE and PCE are 4.221~6.893 mg L
−1 and 4.927~8.095 mg L
−1, respectively (
Table 7). In addition, the removal percentages (R%) of silica gel for the TCE and PCE are approximately 67.00~72.90% and 69.94~76.16%, respectively, indicating that the removal efficiency of silica gel for TCE and PCE is not much different.
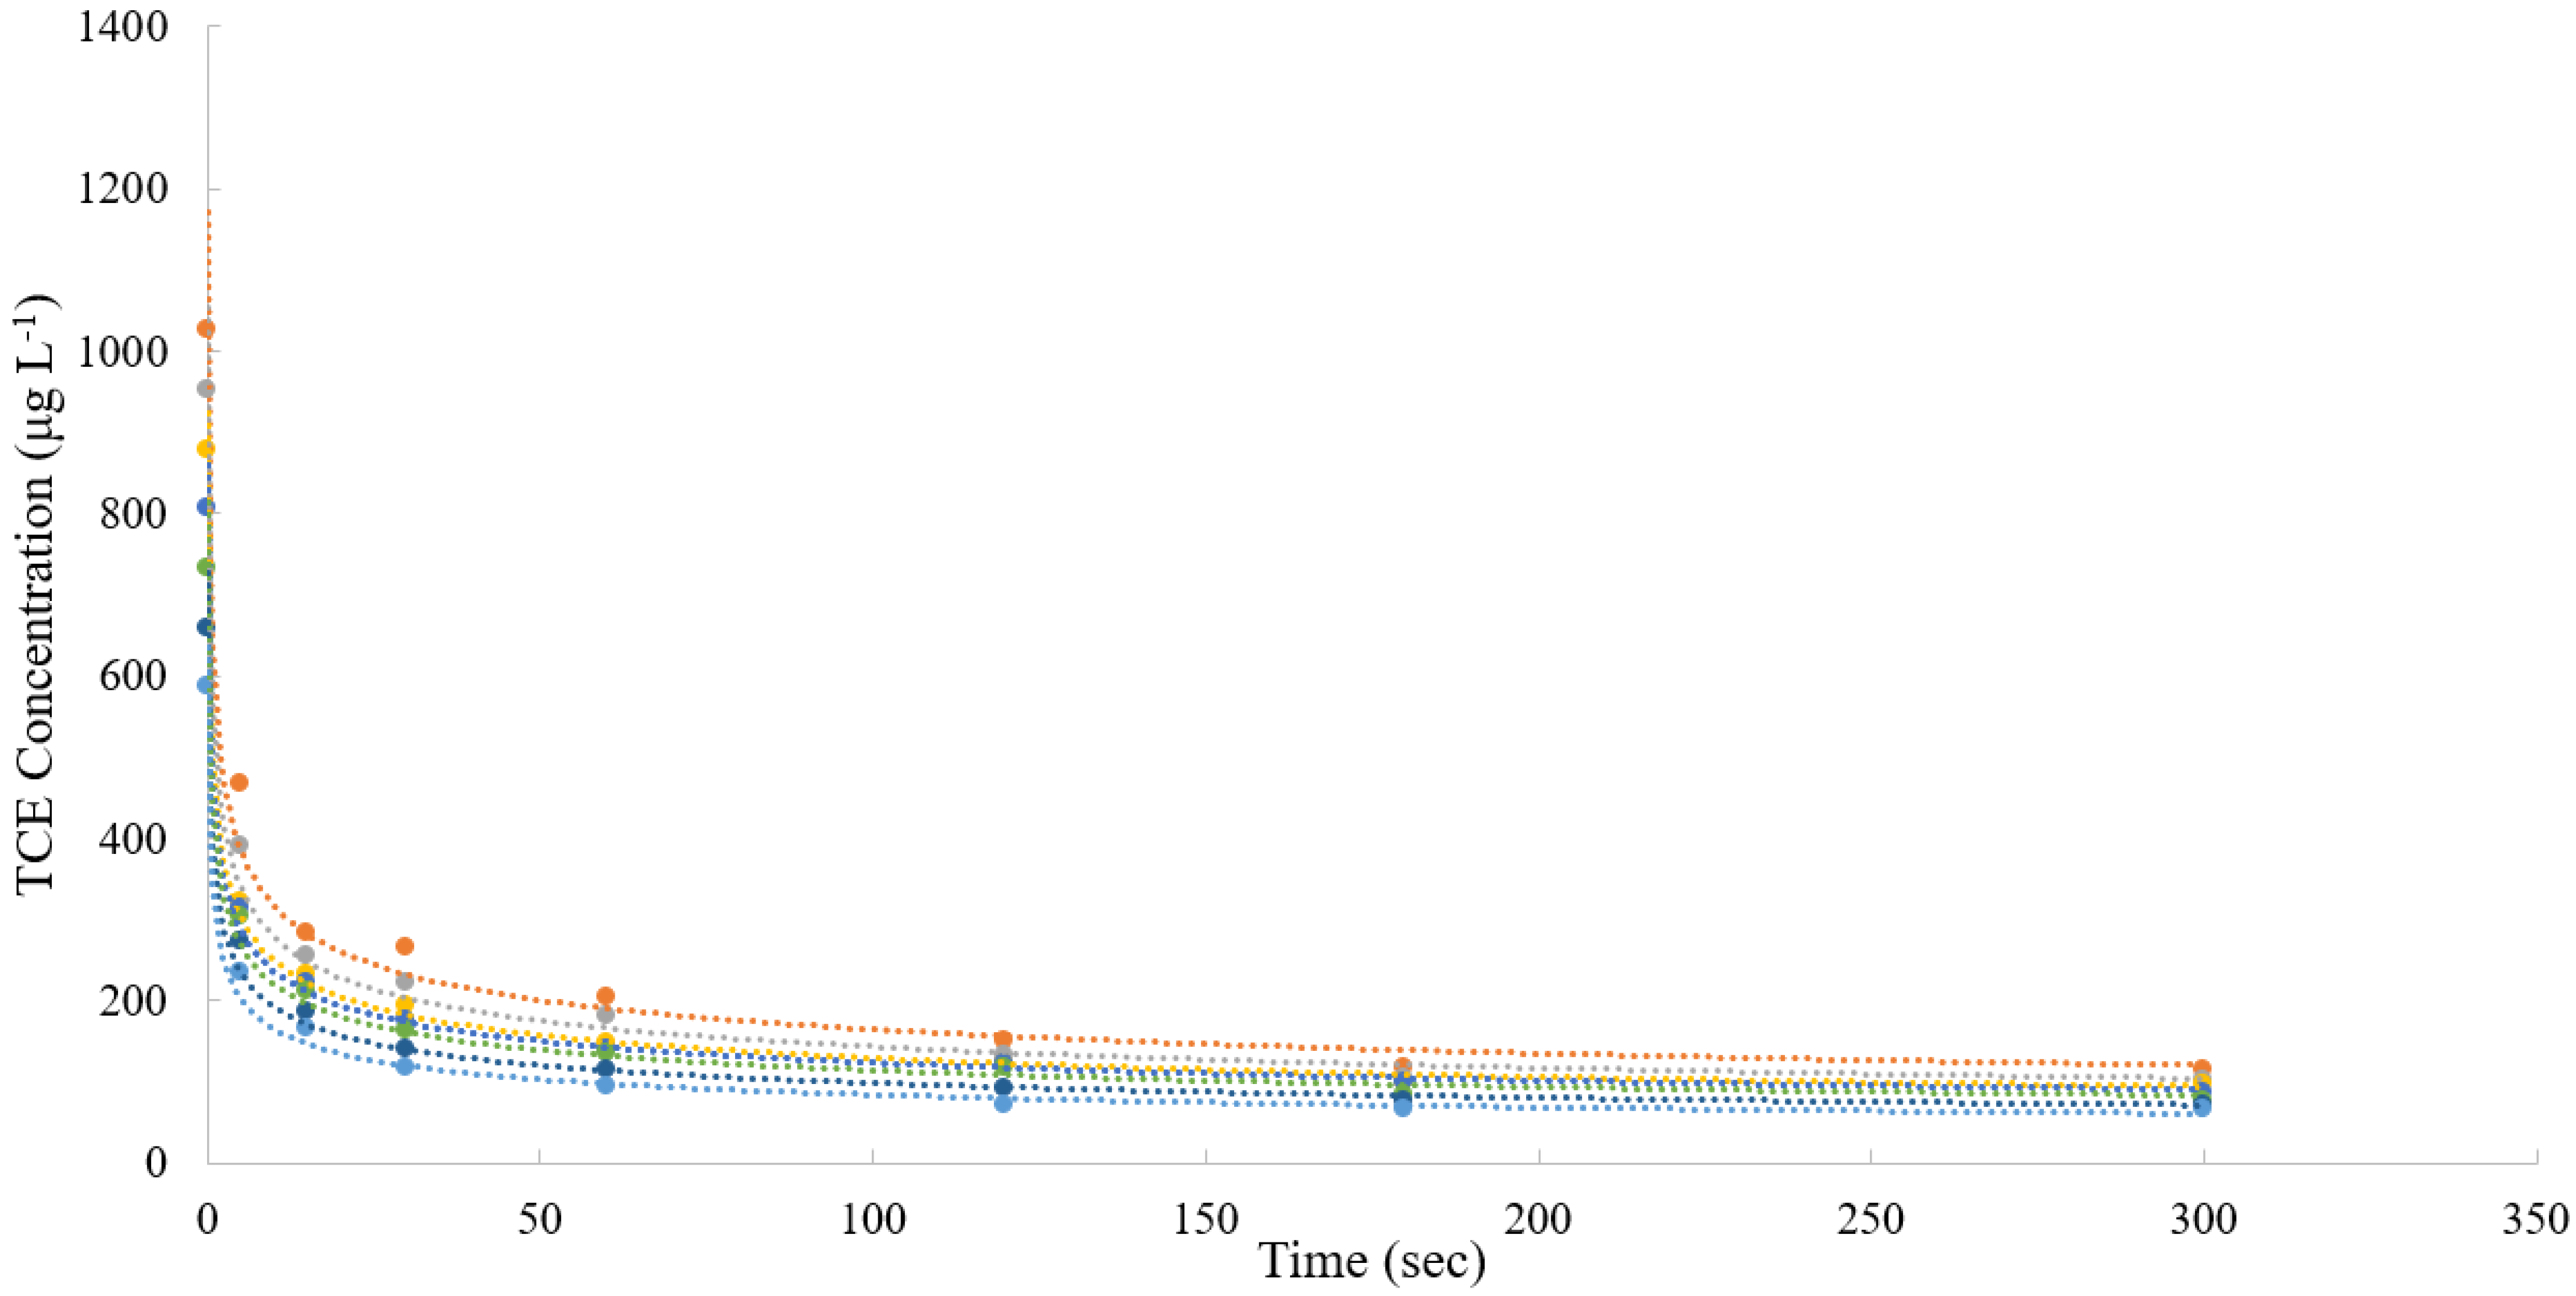
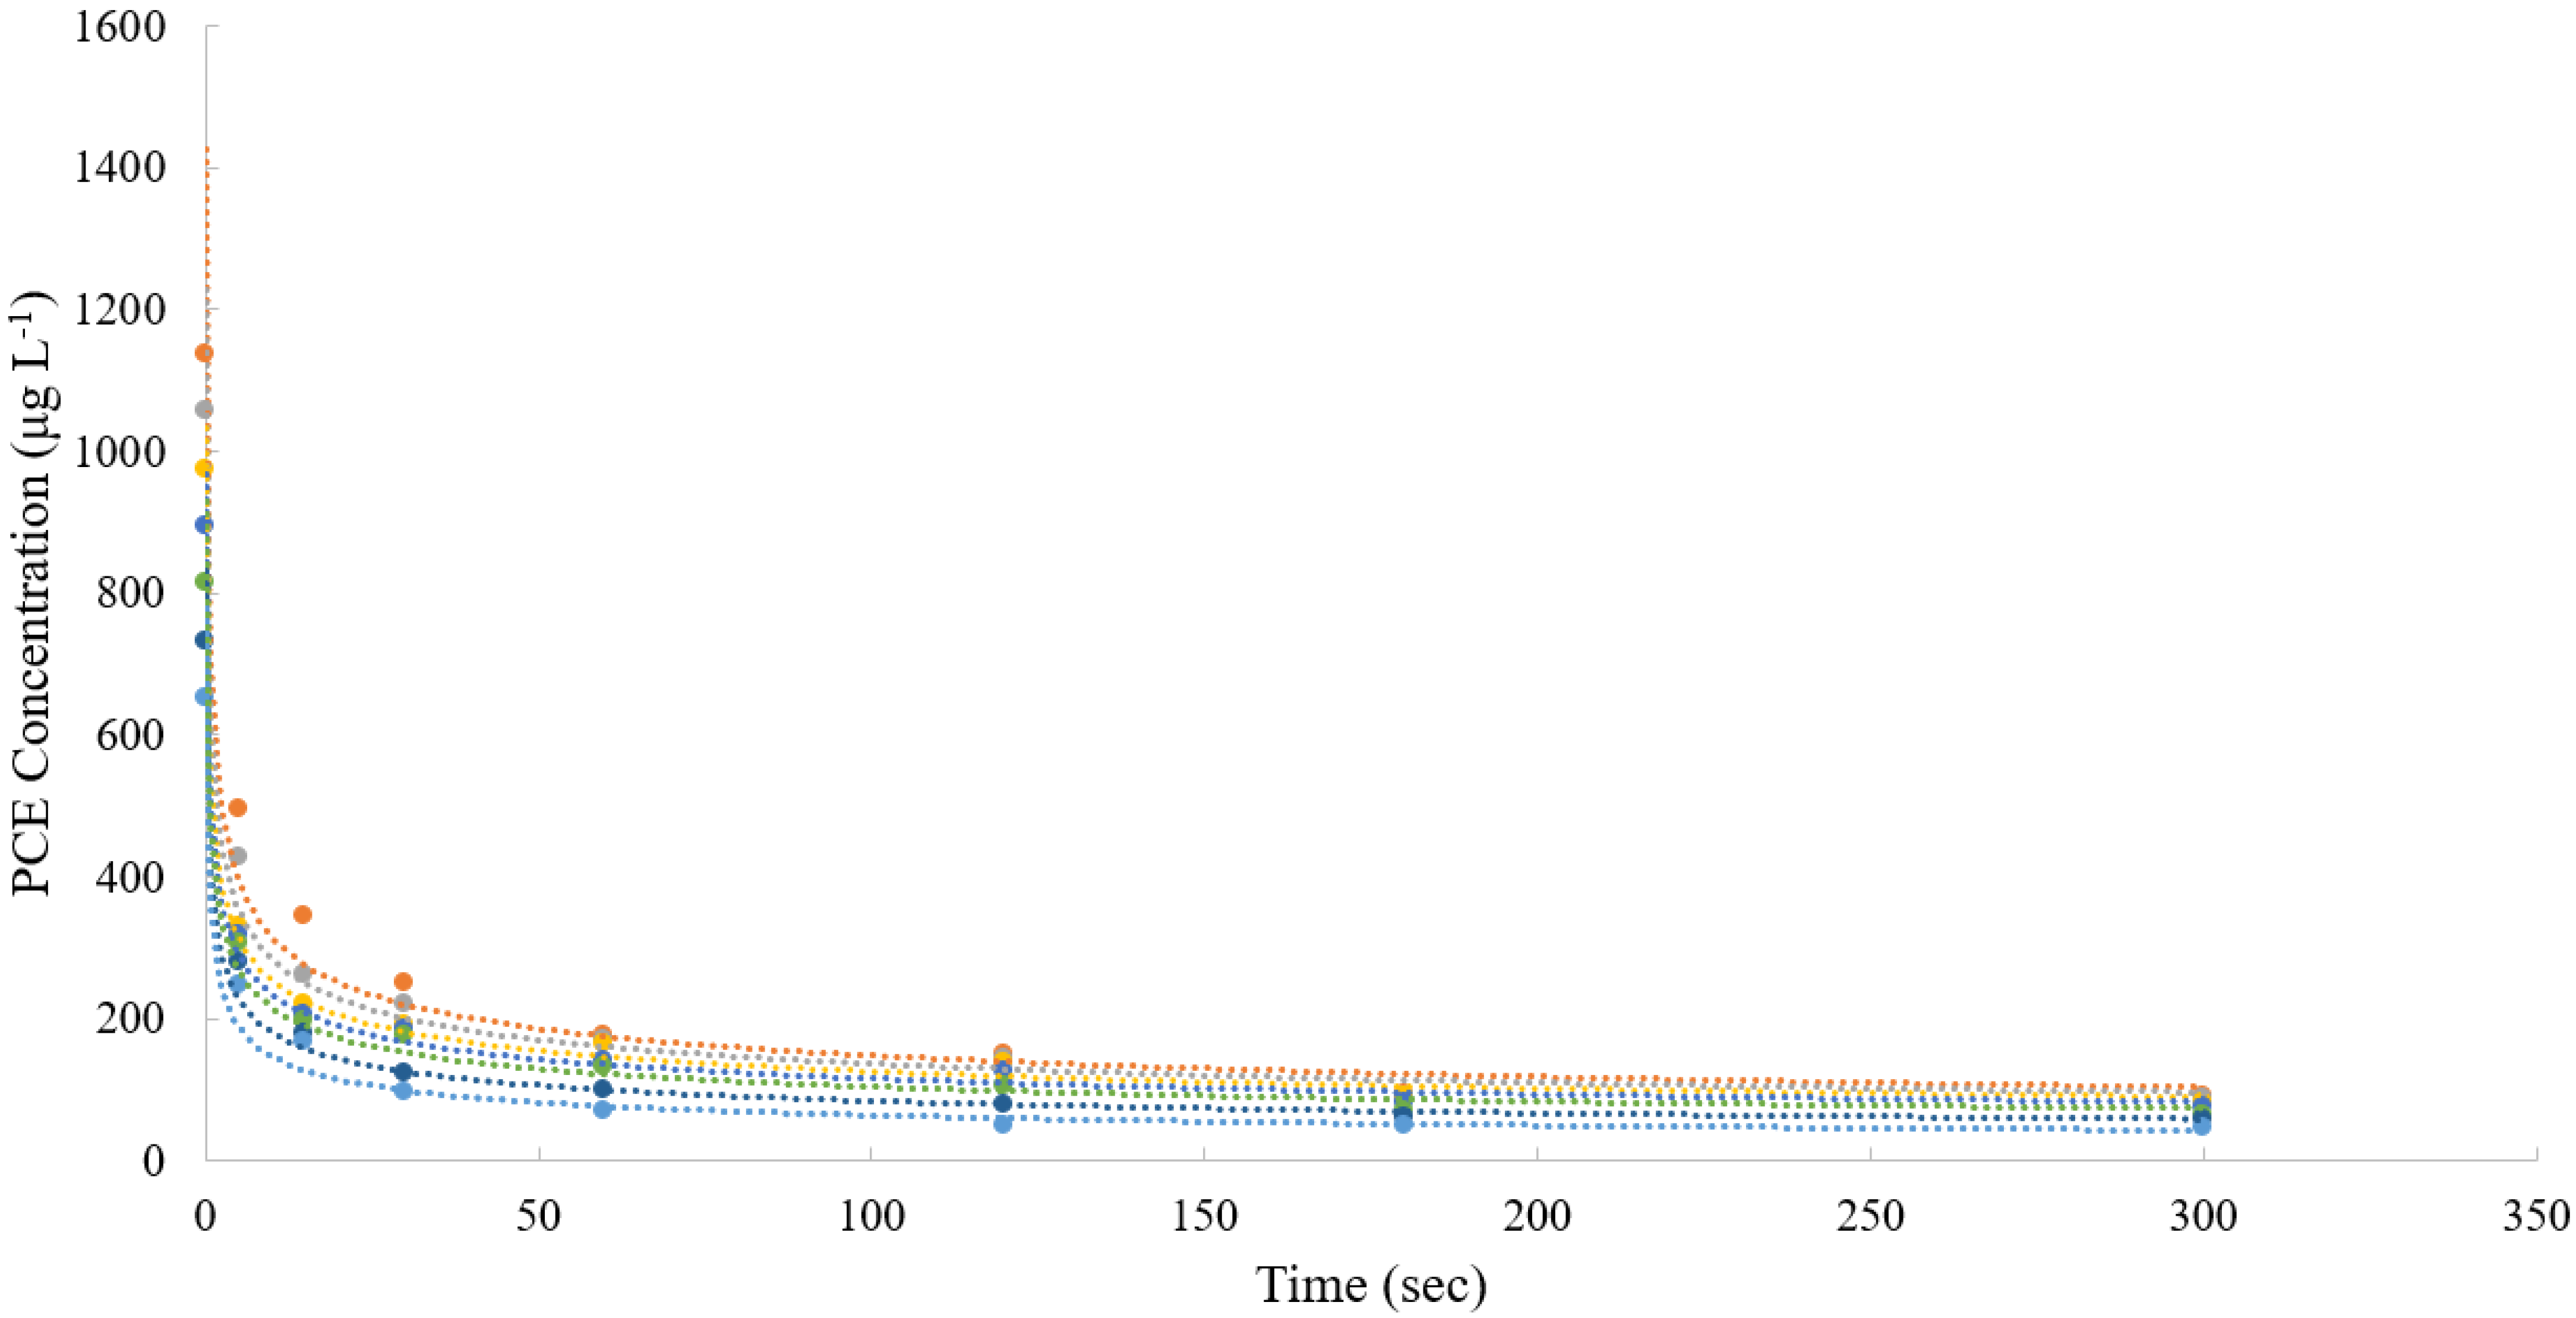
From the adsorption curves of the low-concentration TCE (
Figure 4) and PCE (
Figure 5) by the activated carbon, it can be seen that the adsorption of the low-concentration TCE and PCE by the activated carbon can reach equilibrium in approximately 180 s. The equilibrium adsorption capacity of the activated carbon at different concentrations of the TCE and PCE is 0.520~0.909 mg L
−1 and 0.604~1.048 mg L
−1, respectively (
Table 8). In addition, the removal percentages (R%) of activated carbon for the low-concentration TCE and PCE are approximately 88.72~89.50% and 91.54~92.92%, respectively, indicating that the removal efficiency of activated carbon for PCE is better than that for TCE.
Regardless of the high concentration or low concentration of the adsorbate, with the change in initial concentration, the adsorbate removal percentage has no obvious change trend, indicating that the initial solute concentration has no significant effect on the adsorbate removal percentage. Although the removal rate of activated carbon for TCE and PCE is higher than that of silica gel, activated carbon is expensive and difficult to recycle, and the adsorption rates of TCE and PCE are too fast, which makes the saturated adsorption capacity of the adsorbent lower [
42]. Therefore, if the pollutant has a high concentration, activated carbon is added for adsorption, and a large amount of activated carbon is needed to adsorb the pollutant to meet the maximum contaminant level (MCL), which leads to excessively high adsorbent usage and higher adsorption costs. Although silica gel is inexpensive and easy to obtain, the TCE and PCE removal percentages are lower than those of activated carbon. Therefore, if the pollutants from a high concentration relative to the MCL are all adsorbed by silica gel, a large amount of adsorbent needs to be added, which leads to excessively high adsorption costs.
In addition to the considerations of the above experimental results, coupled with the research results of Erto et al. [
43], activated carbon is an adsorbent with an irregular surface, suitable for the Freundlich model, which is prone to error at high concentrations. Therefore, in this study, the adsorption of TCE and PCE was carried out by using a relatively high equilibrium adsorption capacity and inexpensive silica gel at a high concentration, and, when the pollutant was adsorbed to a low concentration, the adsorbent was changed to activated carbon for adsorption to facilitate a better adsorbent addition method and lower adsorption cost.
3.2. Langmuir and Freundlich Isotherm Adsorption Modes
Adsorption isotherms are often used as a calculation tool for the interaction between adsorbed molecules and the surface of the adsorbent. In this study, Langmuir and Freundlich isotherm adsorption models were used to regress and predict the adsorption experimental data. From the linear regression of the data, all the parameters of the two modes can be derived. These equations can be used to explain the ability of different kinds of adsorbents (silica gel and activated carbon) to remove adsorbates (TCE and PCE).
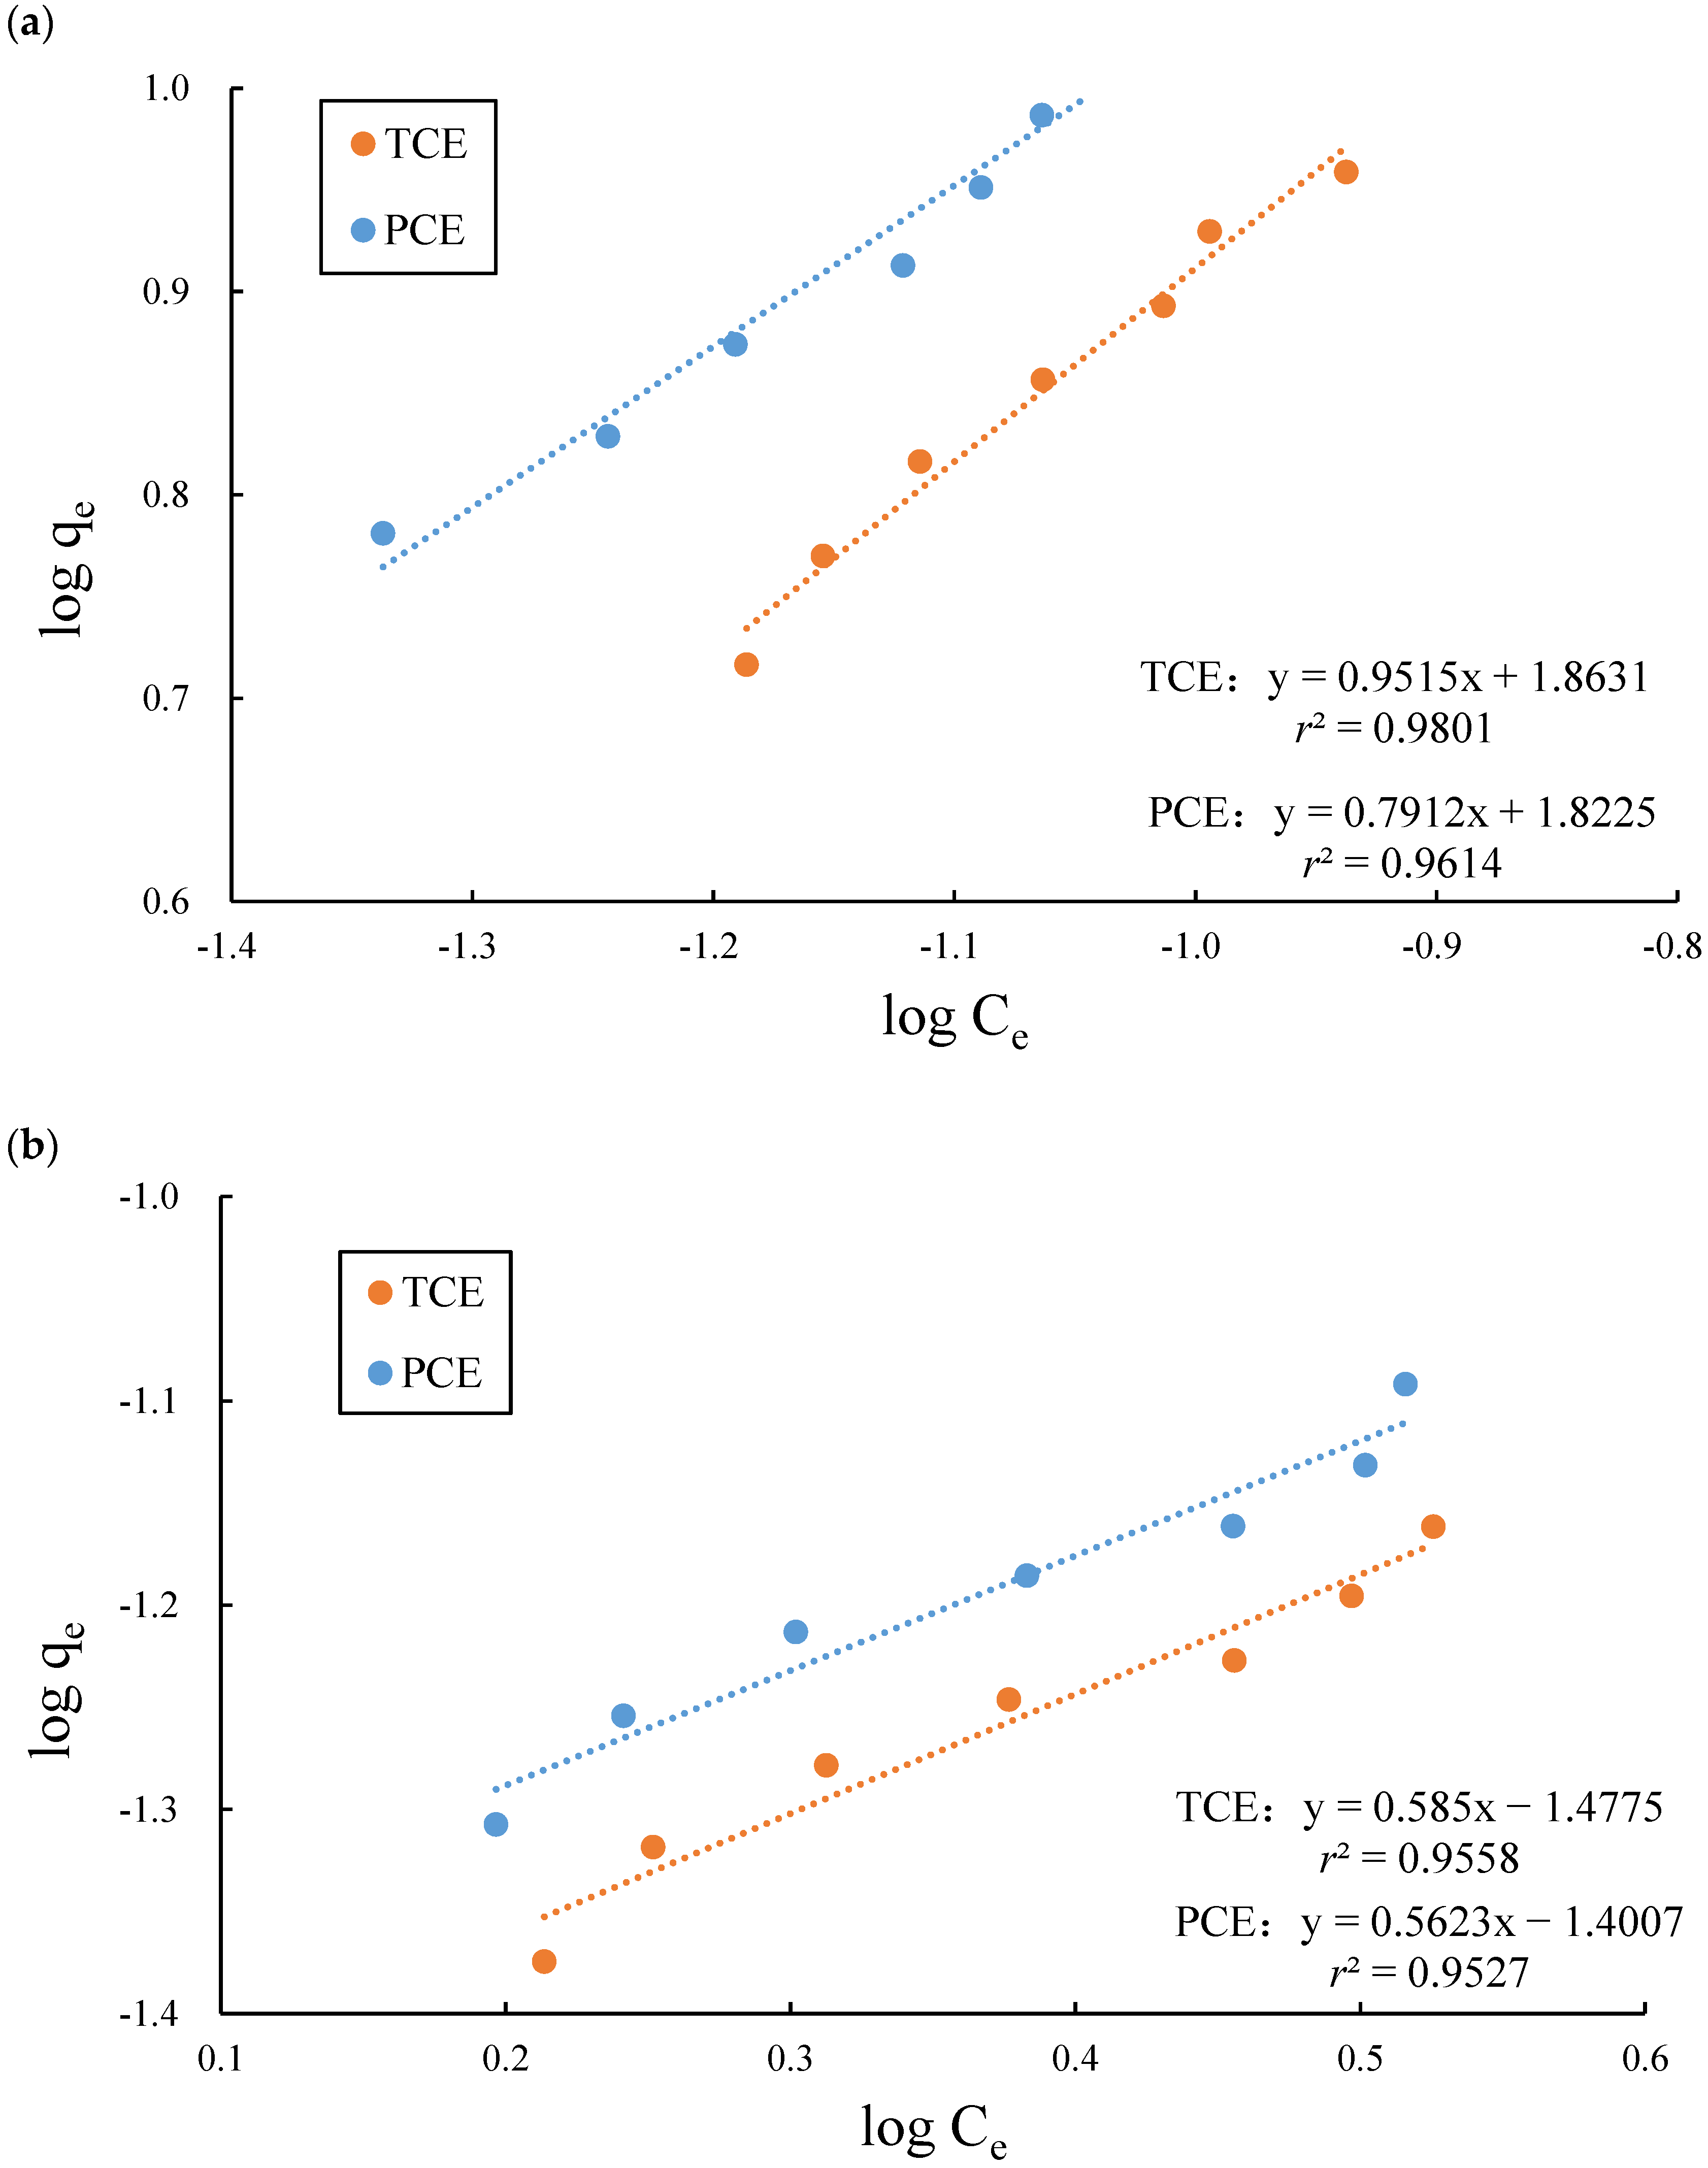
The adsorption data of the silica gel (
Figure 6) and the activated carbon (
Figure 7) for the TCE and PCE were substituted into Langmuir (Equation (2)) and Freundlich (Equation (10)) isotherm adsorption equations, and linear regression was performed with 1/q
e versus 1/C
e. According to the regression equations in
Figure 6 and
Figure 7, the parameters of the isotherm were calculated (
Table 9). The results show that the
r2 values of the linear regression of Langmuir and Freundlich isotherms are in good agreement, and both are greater than 0.95.
According to the RL value in the Langmuir adsorption model, it can be used to observe the type of adsorption isotherm curve (Equation (4)). In this study, the RL values of the adsorption of TCE and PCE by silica gel were 0.252 and 0.208, respectively, while the RL values of the adsorption of TCE and PCE by activated carbon were 0.034 and 0.032, respectively. This result shows that the RL values of both silica gel and activated carbon for the adsorption of TCE and PCE are between 0 and 1. Therefore, the adsorption of the two adsorbents on the surface of TCE and PCE is favorable.
The K
F value in the Freundlich adsorption model is an index used to measure the adsorption capacity, which means that the larger the constant is, the greater the adsorption capacity. It was calculated that the K
F values of the silica gel for TCE and PCE were 0.033 and 0.040, respectively, while the K
F values of the activated carbon for TCE and PCE were 7.296 and 6.645, respectively. Activated carbon has a higher K
F value for adsorbing TCE and PCE than silica gel, indicating that activated carbon has a higher adsorption capacity than silica gel. In addition, 1/n represents the adsorption intensity, and n can also be expressed as the type of adsorption that occurs. The adsorption of TCE and PCE by silica gel has n values of 1.71 and 1.78, respectively, while the adsorption of TCE and PCE by activated carbon has n values of 1.05 and 1.26, respectively. This result shows that, whether it is silica gel or activated carbon being used for the adsorption of TCE and PCE, the n value is greater than 1; that is, the two adsorbents are beneficial for the adsorption of TCE and PCE. Veloso et al. [
44] pointed out that this isotherm adsorption process may be affected by hydrogen bonding, and the adsorbate exhibits weak interactions, even for adsorption processes with higher adsorption energy.
3.3. Prediction of Adsorption Isotherm
Once all the constants of the adsorption isotherm are determined, they can be used to predict the equilibrium solute concentration, removal efficiency, and required adsorbent quality for any set of experimental conditions. After substituting the initial conditions of the experiment, calculations were performed using Equations (6) and (12) to obtain the removal efficiency predicted by the Langmuir and Freundlich models related to the adsorbent quality. In addition, calculations were performed using Equations (9) and (13) to obtain the adsorbent quality predicted by the Langmuir and Freundlich models related to the removal efficiency. Then, we compared the prediction results with the experimental data and verified whether the error range was reasonable.
Table 10 shows the prediction of the adsorbent removal efficiency for high- and low-concentration chlorine pollutants. For high-concentration chlorine pollutants, when the initial solution volume (V) of TCE is 0.1 L, the initial concentration of solute (C
0) is 10.248 mg L
−1, and the mass (M) of 10 g silica gel is used as the adsorbent. The removal percentages predicted by the Langmuir and Freundlich models are 66.49% and 66.67%, respectively. The TCE removal percentage obtained in the experiment was 67.26%, so the error between the experimental value and the predicted value is 1.15% and 0.88%, respectively. When the initial solution volume is 0.1 L and the initial concentration of PCE is 11.375 mg L
−1, the removal percentages predicted by the two models are 69.53% and 69.86%, respectively. The PCE removal percentage obtained in the experiment was 71.16%, so the errors are 2.29% and 1.83%, respectively.
The results of the removal percentage of the low-concentration adsorbate show that, when the initial solution volume (V) of TCE is 0.1 L, the initial concentration of solute (C0) is 1.0248 mg L−1, and the mass of activated carbon (M) is 10 mg. The removal percentages predicted by the Langmuir and Freundlich models are 89.06% and 89.03%, respectively. The TCE removal percentage obtained in the experiment was 88.73%, so the error between the experimental value and the predicted value is 0.38% and 0.34%, respectively. When the initial solution is 0.1 L, and the initial concentration of PCE is 1.1375 mg L−1, the removal percentages predicted by the two models are 91.31% and 92.57%, respectively. The PCE removal percentage obtained in the experiment was 92.10%, so the error between the experimental value and the predicted value is 2.91% and 4.34%, respectively.
The results show that, whether it is a high-concentration or low-concentration adsorbate, as long as the adsorption isotherm constant obtained by the adsorption experiment is used, the Langmuir and Freundlich models can be used to predict the removal efficiency of the adsorbent under different initial conditions. There will be no obvious errors in the results of the adsorption experiment [
39].
Table 11 is a prediction of the required mass of adsorbents for the removal of high and low concentrations of chlorine-containing pollutants. If the mass (M) of the silica gel is 10 g, the initial solution volume (V) is 0.1 L, and the initial concentration of the TCE solute (C
0) is 10.248 mg L
−1. When the removal percentage of the TCE by the silica gel reaches 67.26%, the mass of the silica gel predicted by Langmuir and Freundlich models is 10.24 and 10.20 g, respectively. Therefore, the error between the experimental value and the predicted value is 2.36% and 1.95%, respectively. Under the same conditions, if the initial concentration of PCE (C0) is 11.375 mg L
−1, when the removal percentage of the PCE by silica gel reaches 71.16%, the mass of silica gel predicted by the two models is 10.50 and 10.44 g, respectively. The error between the experimental value and the predicted value is 5.03% and 4.42%, respectively.
For the prediction and error of the activated carbon mass required for low-concentration adsorbates, when the mass of activated carbon is 10 mg, the initial solution volume is 0.1 L, and the initial concentration of TCE is 1.0248 mg L−1. When the activated carbon removal percentage of the TCE reaches 88.73%, the masses of activated carbon predicted by the Langmuir and Freundlich models are 9.67 and 9.72 mg, respectively. The error between the experimental value and the predicted value is 3.24% and 2.84%, respectively. Under the same conditions, if the initial PCE concentration is 1.1375 mg L−1, when the removal percentage of PCE by activated carbon reaches 92.1%, the masses of the activated carbon predicted by the two models are 10.76 and 10.61 mg, respectively. The error between the experimental value and the predicted value is 7.65% and 6.12%, respectively.
From the above experiments, it is found that, regardless of the adsorption of TCE and PCE by silica gel or activated carbon, the data obtained from the adsorption experiment or the removal efficiency predicted by the Langmuir and Freundlich models and the mass of the adsorbent have an error of less than 10%. Therefore, it can be speculated that both the Langmuir and Freundlich adsorption modes can effectively predict the removal efficiency and adsorbent mass.
3.4. In Situ Remediation with a Field-Scale Study
In this study, actual pollution cases in Taiwan (Taoyuan City) were simulated using laboratory adsorption experiments and the adsorption equations of the Langmuir and Freundlich models. This pollution incident is the RCA pollution case, which occurred in Taoyuan, Taiwan in 1994. Due to the long-term digging of wells by the manufacturer to dump organic solvents and other toxic wastes, the soil and groundwater in the factory area were seriously polluted. Therefore, the Taiwan Environmental Protection Agency announced in 2004 that the RCA plant is a groundwater pollution remediation site, and the main pollutants in this area are volatile chlorine-containing organic compounds.
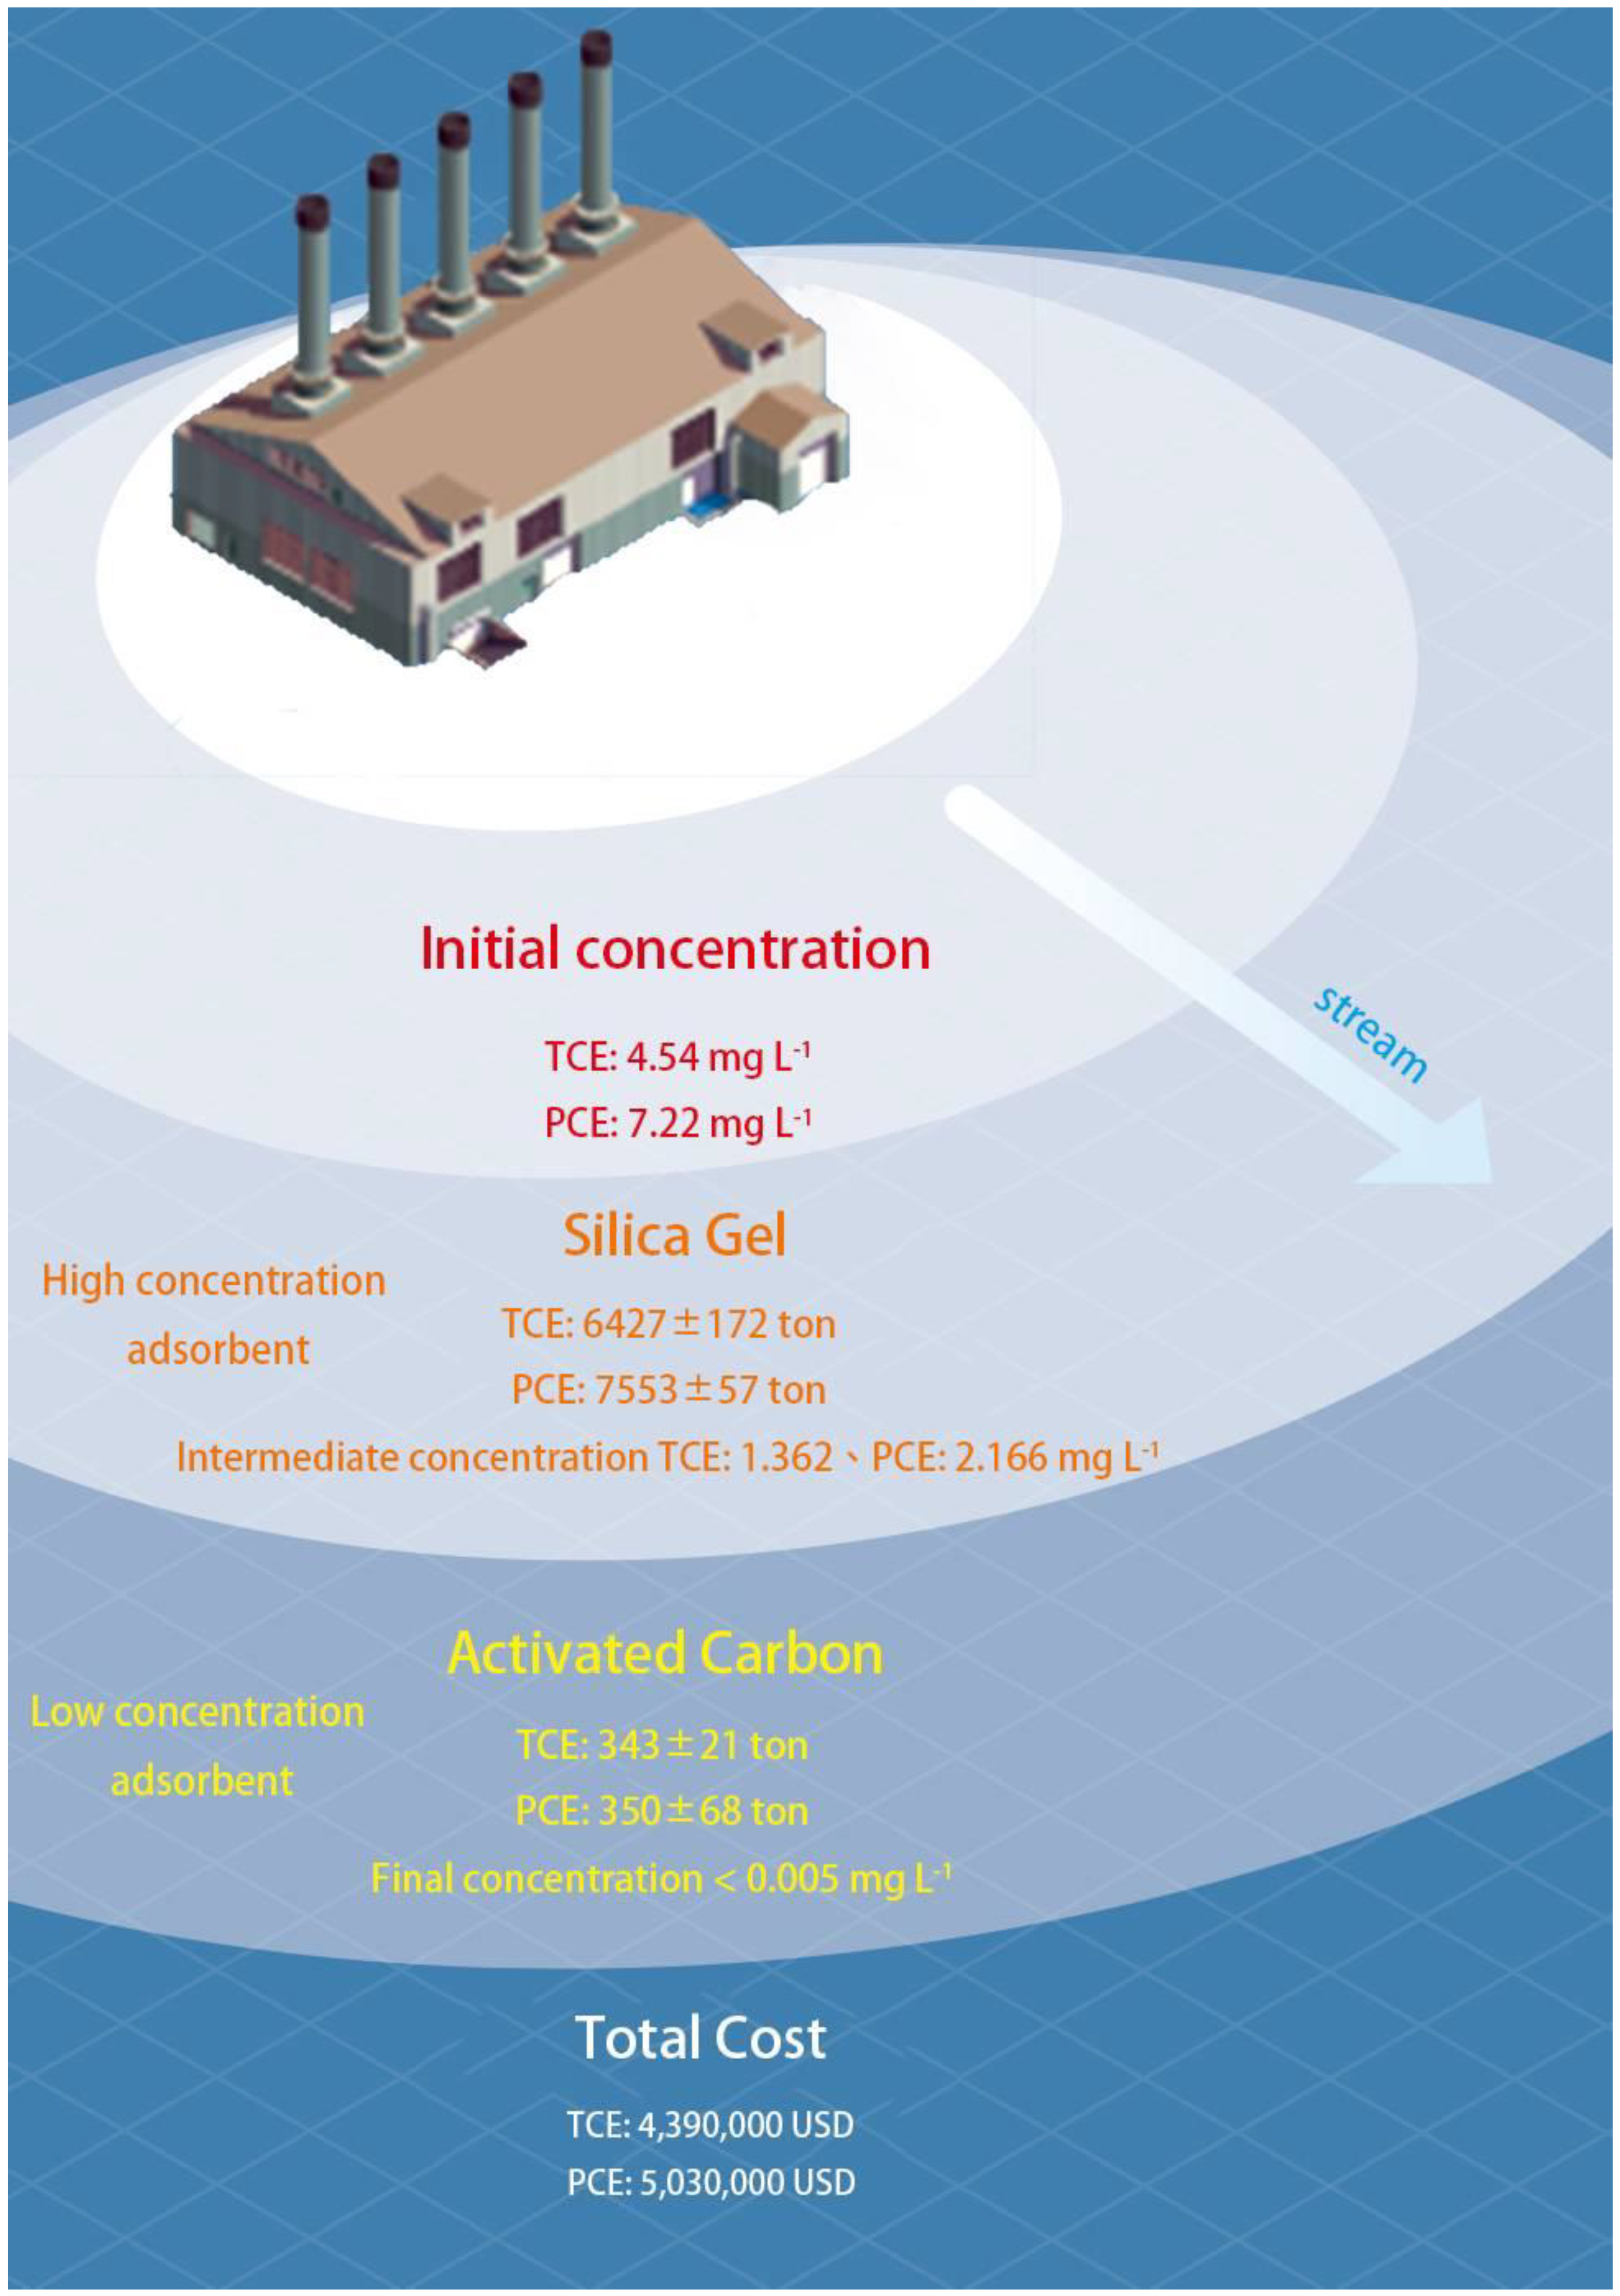
The pollution area of this pollution remediation site is approximately 7.2 hectares; the TCE concentration in groundwater is 4.54 mg L−1, which is 90.8 times the control standard; and the PCE concentration is 7.22 mg L−1, which is 144 times the control standard. After years of remediation treatment, the remediation agency pointed out that the pollution concentration exceeding the standard has been greatly improved. Therefore, the method of estimation in this study is based on when the situation where the pollution situation was relatively serious at the beginning.
The quality of the adsorbents (silica gel and activated carbon) required to remove the local organic pollutants and the required removal costs were predicted. The depth of the groundwater contaminated with organic matter is 15–30 m [
45]. The initial pollution concentration and water volume in the pollution case were substituted into the Langmuir and Freundlich models (Equations (9) and (13)) to calculate the mass and amount of silica gel and activated carbon required to use as the adsorbents. At present, the prices of industrial-grade activated carbon (high-carbon, powder, top grade, Huiheng Activated Carbon Co., Ltd., Ningxia, China) and silica gel (purity 99.99%, powder, Mantanghong Abrasives Co., Ltd., Zhengzhou City, China) on the market are 2.5 USD and 0.55 USD per kilogram, respectively, and the price of activated carbon is approximately 5 times higher than that of silica gel. Santonastaso [
46] used activated carbon as the adsorbent for the permeable adsorptive barrier, applied it to the remediation of groundwater, and obtained a good removal efficiency. Therefore, in this study, the TCE and PCE concentrations were reduced to low concentrations by silica gel, and then activated carbon was added.
In the process of adding silica gel for adsorption, it was found that, if the TCE concentration was lower than 1.362 mg L
−1, the adsorption effect of silica gel on the TCE would decrease from 0.408 mg L
−1 per kg to 0.280 mg L
−1. When the PCE concentration was lower than 2.166 mg L
−1, the adsorption effect decreased from 0.530 mg L
−1 to 0.366 mg L
−1 per kg. The best adsorption effect of the silica gel occurred when the TCE and PCE concentrations decreased from 4.54 and 7.22 mg L
−1 to 1.362 and 2.166 mg L
−1, respectively. Therefore, these two absorbent concentrations were used to convert from the silica gel to the concentration point of adding the activated carbon to achieve the best adsorption efficiency and adsorption cost for the TCE and PCE. If silica gel is used to adsorb TCE and PCE to a lower concentration, then activated carbon is added to adsorb to the maximum allowable concentration of TCE and PCE in drinking water established by the US Environmental Protection Agency (0.005 mg L
−1). The masses of silica gel and activated carbon required to adsorb the TCE were 6427 ± 172 tons and 343 ± 21 tons, respectively, and the total cost of the adsorbent was approximately 4,390,000 USD. The adsorption of PCE required 7553 ± 57 tons of silica gel and 350 ± 68 tons of activated carbon, and the total cost of the adsorbent was approximately 5,030,000 USD (
Figure 8). The estimates in this study are based on commercially available industrial silica gel and activated carbon, so the amount used will vary. However, the purpose of this study is to combine the theoretical adsorption model to provide a rapid evaluation method.
4. Conclusions
The results of this study show that the adsorption of chlorinated organic compounds by silica gel and activated carbon can reach adsorption equilibrium in a short time. With increasing pollutant concentration, the equilibrium adsorption capacity of the adsorbent also increases, and the PCE removal efficiencies of silica gel and activated carbon are better than those of the TCE. According to the isotherm adsorption constant, the RL value of the Langmuir constant is between 0 and 1 in the adsorption experiments of the two adsorbents on TCE and PCE. The values of n of the Freundlich constant are all greater than 1. Both results show that both adsorbents are favorable for the adsorption of TCE and PCE. In addition, the KF value of the Freundlich constant of the TCE and PCE adsorbed by activated carbon is higher than that of silica gel. This result may be related to the fact that activated carbon has a higher specific surface area than silica gel, so its adsorption capacity is better.
The data obtained from the actual adsorption experiments have less than 10% error between the removal efficiency and the adsorbent mass predicted by the Langmuir and Freundlich models. This means that both modes can be effectively used for the prediction of pollutant removal during the adsorption process. This result was substituted into the actual contaminated site for evaluation and then used to predict the required adsorbent quality and adsorption cost. Among them, the price of activated carbon is approximately 5–8 times higher than that of silica gel, and silica gel is inexpensive and easy to obtain. Therefore, in this study, silica gel was used to reduce the concentration of pollutants, and then activated carbon was added for adsorption to reduce the adsorption cost.
It is estimated that the masses of silica gel and activated carbon required for the on-site remediation of the TCE in the RCA pollution incident in Taiwan are 6427 ± 172 tons and 343 ± 21 tons, respectively, and the total cost of the adsorbent is approximately 4,390,000 USD. The PCE requires 7553 ± 57 tons of silica gel and 350 ± 68 tons of activated carbon, resulting in a total cost of the adsorbents of approximately 5,030,000 USD.


