Article

Evaluating the Potential Anticancer Properties of Salvia triloba in Human-Osteosarcoma U2OS Cell Line and Ovarian Adenocarcinoma SKOV3 Cell Line

by
Naela Adel Mohammed Saleh
1,
Rowan Bahaa El-din Abd El-bary
1,
Eric Zadok Mpingirika
1,
Hanaa L. Essa
2,3,
Mayyada M. H. El-Sayed
2,
Mirna Sarkis Sherbetjian
4,
Hanin Fadel Elfandi
4,
Muhammad Adel Abdel Wahed
4,
Rami Arafeh
5 and
Asma Amleh
1,4,*
1
Biotechnology Program, American University in Cairo, New Cairo 11835, Egypt
2
Department of Chemistry, American University in Cairo, New Cairo 11835, Egypt
3
Pesticides Phytotoxicity Department, CAPL, Agriculture Research Centre, Dokki, Giza 12627, Egypt
4
Department of Biology, American University in Cairo, New Cairo 11835, Egypt
5
Palestine-Korea Biotechnology Center, Palestine Polytechnic University, Hebron P.O. Box 198, Palestine
*
Author to whom correspondence should be addressed.
Appl. Sci. 2022, 12(22), 11545; https://doi.org/10.3390/app122211545
Submission received: 25 July 2022 / Revised: 27 October 2022 / Accepted: 3 November 2022 / Published: 15 November 2022
(This article belongs to the Special Issue Natural Products: Sources and Applications)

Abstract

:
Salvia triloba (S. triloba) is an herb inherently linked to traditional medicine systems in the Eastern Mediterranean region. There is minimal experimental evidence however, regarding the anticancer effects of S. triloba in both osteosarcoma and ovarian cancer. In this study, we investigated the effects of crude (macerated) S. triloba ethanol and acetone leaf extracts on viability, migratory ability, and the expression of genes regulating these activities in U2OS and SKOV3 cells using MTT assay, scratch-wound healing/trans-well migration assay, and RT-qPCR respectively. MTT assay results indicated that the acetone extract significantly reduced both U2OS and SKOV3 cell viability with half-maximal inhibitory concentrations (IC50) of 54.51 ± 1.10 µg/mL and 75.96 ± 1.0237 µg/mL respectively; these concentrations further displayed negligible hemolytic activity. The combination of acetone extract (19 µg/mL) and paclitaxel (0.787 µg/mL) displayed synergy and reduced SKOV3 cell viability by over 90%. Additionally, the trans-well migration assay illustrated that the acetone extract (IC50) inhibited both U2OS and SKOV3 cell migration by more than 50%. Moreover, S. triloba acetone extract significantly downregulated the steady-state mRNA expression of key genes involved in driving select cancer hallmarks. Four fractions were generated from the acetone extract by thin layer chromatography (TLC), and the obtained retention factors (Rf) (ranging from 0.2 to 0.8) suggested a mixture of high and moderately polar compounds whose bioactivities require further investigation. In addition, FTIR measurements of the extract revealed peaks corresponding to OH, aliphatic CH, and ester groups suggesting the presence of phenolic compounds, terpenes, and polysaccharides. Altogether, these results suggest that S. triloba possesses potential therapeutic compounds that inhibit cell proliferation and migration, and modulate several genes involved in osteosarcoma and ovarian carcinoma progression.

1. Introduction

Cancer ranks second among the leading causes of death worldwide and was responsible for approximately 10 million deaths globally in 2020 [1]. It is expected that cancer will become the leading cause of death in this century and that 1 in 5 males and 1 in 6 females will develop cancer during their life time, while 1 in 8 men and 1 in 11 women will die of cancer [2]. Osteosarcoma is the most common type of bone cancer [3], and is prevalent in children and young adults [4,5] where it accounts for approximately 2% of all juvenile cancers [6]. Furthermore due to its poor prognosis, osteosarcoma is considered the second-greatest contributor to cancer-related mortalities in children [7]. On the other hand, ovarian cancer is the seventh-most-common cancer among females, and one of the primary causes of mortality among gynecologic cancers [8]. Despite the advances made in cancer treatment, approximately 207,000 females die each year due to ovarian cancer [9]. This relatively high mortality rate could be attributed to the fact that ovarian cancer is often diagnosed during advanced stages, since it is usually asymptomatic during early stages [10].
This study utilized both U2OS and SKOV3 cell lines as models for human osteosarcoma and ovarian carcinoma respectively. The U2OS cell line, which was originally retrieved from the tibia of a 15 year old Caucasian female, is moderately differentiated [11], possesses epithelial and adherent morphology, and contains wild-type p53 [12]. In contrast, the SKOV3 cell line was initially isolated from the ovary of a 65-year old Caucasian woman with ovarian adenocarcinoma; the cell line is adherent and possesses epithelial morphology. SKOV3 cells are further reported to be resistant to several chemotherapeutic drugs including cisplatin and doxorubicin [13].
The most commonly employed treatment protocols for osteosarcoma include chemotherapy, radiotherapy, and surgery while ovarian adenocarcinoma is often treated using chemotherapy and surgery [6,14]. However, a major drawback to the utilization of these methods is the development of treatment resistance. It is therefore crucial to continuously develop novel and more effective anticancer therapies. Several plant derived compounds such as taxol, vinca alkaloids (vincristine and vinblastine), and podophyllotoxin analogues were previously approved by the U.S. Food and Drug Administration (FDA) as chemotherapeutic agents; herbal plants thus represent a rich source of various complex compounds such as flavonoids, phenols, alkaloids, lectins, and terpenes that possess potential anticancer effects [15].
Three-lobed sage, Salvia triloba L., syn. S. fruticosa Mill. (also known as East Mediterranean sage or Greek sage) is a herb native to the East Mediterranean region, ranging from the borders of Southern Italy to Western Syria. S. triloba belongs to the largest plant genus, Salvia, of the Lamiaceae family, and includes 900 different species distributed all over the world, including Egypt [16,17]. The aerial parts of the plant are commonly boiled and used as a tea infusion to ease stomach ache and other disorders including inflammation and microbial infection [18]. In addition, S. triloba was accepted as a natural remedy in both the European and British Pharmacopeia [19,20]. Plants in the genus Salvia are reported to contain a variety of potentially therapeutic complex compounds including phenolic acids (such as caffeic acid, rosmarinic acid, and salvianolic acid), and flavonoids (such as luteolin, kaempferol and quercetin). Additionally, the essential oils of this species were found to possess several terpenoids including α and β-thujone, camphor, α-humulene, β-caryophyllene, and 1,8-cineole [21,22]; 1,8-cineole is a major component (>50%) of S. triloba essential oils, making S. triloba a higher value medicinal plant when compared with other species such as Salvia officinalis (S. officinalis) [21,22]. These compounds have all been reported to possess a range of bioactivities including antioxidant, anti-inflammatory, anticholinesterase and anti-proliferative effects [21,22].
A limited number of studies have previously examined the anticancer activity of S. triloba. S. triloba induced both cytotoxicity and apoptosis in prostate cancer (PC-3 and DU-145 cells) [23] and breast cancer (MCF7 and T47D cells) [24,25]. S. triloba additionally exhibited potential antiangiogenic activity [26]. The paucity of evidence regarding S. triloba anticancer activity warrants further examination of its bioactivity in other cancer types. To the best of our knowledge, S. triloba bioactivity in both osteosarcoma and ovarian adenocarcinoma has not been previously tested.
In this study, we examined the potential anticancer effects of S. triloba acetone extract on U2OS osteosarcoma cells and SKOV3 ovarian adenocarcinoma cells.

2. Materials and Methods

2.1. Plant Material Harvest

S. triloba leaves were manually harvested from plantations located in Hebron city, Palestine (geographical coordinates: 31° 32′ 4.2216″ N, 35° 6′ 4.302″ E) in spring 2018 and the plant morphological identification was performed and confirmed by Dr. Rami Arafeh through referring to the flora of Syria, Palestine, and Sinai [27].

2.2. Crude Extract Preparation

The collected plant material was shade dried at room temperature, then cut into pieces of approximately 1 to 2 cm and ground with an electric grinder into a fine powder. After sieving, 1 g of the powder was mixed with 30.0 mL of either analytical grade ethanol (90%) or total acetone solvent. The mixture was shaken on an orbital shaker (120 rpm) for 24 h at room temperature (25 °C ± 2), filtered using a glass funnel plugged tightly with cotton, and evaporated in the fume hood (room temperature) until entirely dry. Our choice of extraction solvents was based on the fact that plants in the genus Salvia possess a variety of potentially therapeutic phenolic compounds [21] that require the use of moderately polar solvents such as ethanol and acetone to achieve high extraction efficiencies [28]. The obtained yields were 0.0939 g and 0.125 g for acetone and ethanol extracts respectively. The dry extracts were dissolved in dimethyl sulfoxide (DMSO) to make stock solutions of 150 mg/mL. From these stock solutions, a series of working concentrations were prepared by serial dilution using complete cell culture media. To efficiently extract such phenolic compounds, it is recommended to use moderately polar solvents such as ethanol and acetone.
Since the acetone extract showed higher biological activities than the ethanol extract, it was analyzed along with the crude S. triloba leaves for their functional groups using Fourier Transform Infrared (FTIR) Spectroscopy. The measurements were conducted on a TGA/FTIR Nicolet 380 spectrometer using 1-mm KBr pellets within the range of 500–4000 cm−1.

2.3. Cell Culture

The U2OS [29] and SKOV3 [30] cell lines used in this study were respectively provided as gifts from the labaratories of Dr. Andreas Kakarougkas’ Lab (Department of Biology, The American University in Cairo, Egypt) and Dr. Anwar Abd Elnaser (Department of Chemistry, The American University in Cairo, Egypt). HepG2 cells were obtained from Nawah Scientific Laboratories in Cairo, Egypt, while HEK-293 [31] cells were obtained as a gift from Dr. Laila Ziko (Department of Biology, The American University in Cairo, Egypt). U2OS and HEK-293 cells were cultured using Dulbecco’s Modified Eagle Medium (DMEM) (Invitrogen, USA), while SKOV3 and HepG2 cells were both cultured in Roswell Park Memorial Institute (RPMI) (Invitrogen, USA) basal media. Basal media was supplemented with 10% fetal bovine serum (FBS) (Invitrogen), and 5% Pen-Strep (100 units/mL) (Invitrogen). Cells were incubated in humidified incubators at 37 °C supplied with 5% carbondioxide (CO2).

2.4. MTT Viability Assay

The effect of S. triloba crude extracts on U2OS, SKOV3, and HepG2 cell viability was evaluated using the 3-(4, 5-dimethylthiazolyl-2)-2, 5-diphenyltetrazolium bromide (MTT) colorimetric assay. Viable cells reduce the yellow MTT reagent (Serva, Germany) reagent to a purple formazan salt, which can be quantified using a spectrophotometer [32]. Cells were seeded at a density of 5000 cells/well in a 96-well plate, and cultured overnight to facilitate attachment. Cell viability was measured after a fixed time point of 48 h. After incubation, the treatment was discarded and replaced by 100 μL of fresh DMEM supplemented with 20% MTT (5 mg/mL) per well and incubated for 4 h. The MTT solution was then discarded and replaced by 100 μL of DMSO (Sigma Aldrich, USA) to dissolve the formazan crystals and the color change quantified using the SPECTROstar-Nano microplate reader (BMG LABTECH), with wavelength parameters set to 570 nm. Cell viability was determined as a percentage of the absorbance of treated cells relative to the absorbance of untreated cells. HepG2 cells were eliminated from further analysis since treatment with S. triloba ethanol extract yielded negligible effect on cell viability. All dose-response curves were generated after transformation and normalization of MTT viability data in GraphPad Prism 6.01 software [33], using Equation (1) (log[inhibitor] vs. normalized response—Variable slope).
Y = 100 ( 1 + 10 ( ( Log   IC 50 X ) ×   Hill   slope ) )  
where X = log of the concentration of the treatment, Y = % viability.

2.5. Selectivity Index

The selectivity index (SI) of a cancer treatment is a measure of its cytotoxic selectivity for cancer cells over noncancerous ones, and is obtained by calculating the ratio of the toxic dose of a treatment to its therapeutic dose [34]. In order to calculate the SI of S. triloba, we compared the IC50 values of both U2OS and SKOV3 cells to that of HEK-293 cells. HEK-293 cells are reported to be derived from human embryonic kidney cells [31], and are frequently used as a normal human cell standard [35,36,37]. The IC50 of S. triloba against HEK-293 cells was determined using the MTT assay as previously described, and both cisplatin and paclitaxel were used as positive controls. SI of U2OS and SKOV3 cells were calculated using Equations (2) and (3) respectively.
SI   ( U 2 OS ) = IC 50   ( HEK 293 ) IC 50   ( U 2 OS )
SI   ( SKOV 3 ) = IC 50   ( HEK 293 ) IC 50   ( SKOV 3 )
where
SI (U2OS) is the selectivity index of U2OS cells.
SI (SKOV3) is the selectivity index of SKOV3 cells.
IC50 (HEK-293) is the IC50 of the drug against HEK-293 cells.
IC50 (U2OS) is the IC50 of the drug against U2OS cells.
IC50 (SKOV3) is the IC50 of the drug against U2OS cells.

2.6. Combination of S. triloba Acetone Extract and Paclitaxel in SKOV3 Cells

We employed the method of Chou and Talalay to explore the cytotoxic effect of S. triloba and paclitaxel in combination, and utilized the COMPUSYN software (version 1.0) for results analysis [38,39,40]. Serial dilutions for each drug, along with the combination were prepared according to the scheme in Table 1. The effect of these concentrations on SKOV3 cells was evaluated using MTT assay. The assay was performed with a seeding density of 5000 cells/well and results taken 48 h post treatment. The COMPUSYN software was utilized to generate combination index (CI) and dose reduction index (DRI) values of the combined treatment according to the median effect principle of Chou and Talalay [38,39,40].

2.7. Trypan Blue Exclusion Assay

The trypan blue exclusion assay was employed to provide insight regarding the percentage of non-viable cells after treatment with S. triloba extracts and the combination treatment. Cells were mixed with 0.4% w/v trypan blue dye (Serva, Heidelberg, Germany) in a ratio of 1:1 and counts for living (unstained) and dead (stained) cells were made using a hemocytometer (Hauser Scientific, USA) and the number of non-viable cells per mL determined using Equation (4) [41]:
N o n   v i a b l e   c e l l s   p e r   m L = n u m b e r   o f   n o n v i a b l e   c e l l s n u m b e r   o f   s q u a r e s   c o u n t e d × d i l u t i o n   f a c t o r × 10,000

2.8. Scratch-Wound Healing Assay

The scratch-wound healing assay was utilized to assess the effect of S. triloba on cell migration. Cells were seeded (200,000 cells/well) in a 6-well plate and cultured until they reached approximately 70% to 85% confluency. Two perpendicular scratches were made on the cell monolayer using a sterile 200 μL pipette tip and washed twice using 1× PBS. Cells were incubated with respective treatments adjusted to the IC50. Pictures of fixed points (22 h for U2OS cells and 20 h for SKOV3 cells) along the scratch were taken using the Olympus IX70 inverted microscope at a series of time points. Image J software (version 1.51j8) was used to measure the wound area, and percentage wound closure was calculated using Equation (5) [42]:
W C   % = W C   0   h W C   X   h W C   0   h   ×   100
where
WC % is the percentage wound closure.
WC 0 h is the wound area at zero hours.
WC X h is the wound area at a specified time point.

2.9. Transwell Migration Assay

The transwell migration assay was further used to examine the effect of S. triloba on both U2OS and SKOV3 cell migration. Cells were suspended in 100 µL of culture media supplemented with 1% FBS and applied to the top chamber of a 24-well cell culture insert (8 µm pore size/GBO), at a seeding density of 200,000 cells per well. The lower chamber of the 24-well plate contained 600 µL of culture media supplemented with 10% FBS. U2OS and SKOV3 cells were respectively incubated for 22 h and 10 h with treatments adjusted to IC50 values. After incubation, cells in the upper chamber were removed by scraping, while cells that migrated to the lower chamber were fixed using 4% formaldehyde, and stained with 4′,6-diamidino-2-phenylindole (DAPI) (KPL, 71-03-01) (1:1000 in PBS). Fluorescent microscopy was used for the visualization of the stained nuclei at 10× magnification. Pictures of 4 random fields were taken using the Olympus IX70 inverted microscope for all treatments and the number of nuclei per field determined using Image J 1.51j8 software.

2.10. Reverse Transcription Quantitative Polymerase Chain Reaction (RT-qPCR)

Reverse transcription quantitative polymerase chain reaction (RT-qPCR) was utilized to analyze differential gene expression between untreated and treated samples. Cells for total RNA extraction were cultured overnight in 6-well plates at a seeding density of 200,000 cells per well. Following overnight culture, the cells were incubated with respective treatments for 48 h. Total RNA was then obtained using Invitrogen™ TRIzol™ Reagent, according to the manufacture’s recommendations. After the cells were lysed and homogenized in TRIzol™ Reagent, the homogenate was shaken with chloroform to facilitate phase separation. Total RNA was precipitated from the aqueous layer using isopropanol, and purified by washing in 75% ethanol. Finally the purified RNA resuspended in nuclease free water. Reverse transcription was performed with 0.5 µg of total RNA using RevertAid First Strand cDNA Synthesis kit (Thermo Scientific, USA) according to the manufacturer’s instructions. 1 µL of cDNA (5 ng/µL) was used per reaction. qPCR was performed using PowerUp™ SYBR™ green master mix (ThermoFisher Scientific, Waltham, MA, USA) according to the manufacture’s recommendation. GAPDH was used as an endogenous control for all reactions; a list of all genes tested and primers used is summarized in Table S4. The final primer concentration per reaction was 500 nM while the thermo-cycling program used for all genes was 50 °C for 2 min, 95 °C for 2 min, 95 °C for 15 s, and 60 °C for 1 min, for a total of 40 cycles. Annealing temperature for all primers was set to 60 °C. A dissociation step was additionally performed using the following program: 95 °C for 15 s, 60 °C for 1 min, and 95 °C for 15 s. All reactions were performed using the 7500 Real-Time PCR system from Applied Bio-systems, USA, and expression fold changes determined using the 2−ΔΔCt method [43]. Statistical significance was measured using GraphPad Prism 6.01 software’s multiple T-tests [33].

2.11. Transcription Factor Binding Sites Annotation

Potential RUNX2 transcription factor binding sites (TFBS) were annotated using the MatchTM tool within the TRANSFAC® database. The tool searches DNA sequences stored in the library for potential TFBS using positional weight matrices (PWMs) [44]. The parameters used for determining potential transcription factors (TFs) are summarized in Table 2.

2.12. Hemolysis Assay

The hemolysis assay was utilized to determine S. triloba’s hemolytic effect. Institutional Review Board (IRB) approval was granted from the American University in Cairo to collect 2 mL blood samples from three healthy volunteers, after informed consent at the university clinic. Human erythrocytes were exposed to concentrations approximate to either IC50 or IC75 of S. triloba acetone extract. Blood was withdrawn into vials containing Ethylenediaminetetraacetic acid (EDTA) and centrifuged at 1000× g for 5 min, then washed twice using PBS. The Serum was discarded, and 2% erythrocytes were prepared using PBS. 50 µL of the 2% erythrocyte solution was added per well in a round bottom 96-well plate, in addition to 50 µL of each treatment; this resulted into a final erythrocyte concentration of 1% per well. As a negative control (0% hemolysis), 50 µL of PBS was used in place of extract treatment. Deionized water was, on the other hand, used as a positive control (100% hemolysis). Plates were incubated at 37 °C for 1 h, and then centrifuged for 10 min at 3000× g in a plate centrifuge. The resulting supernatant (80 µL) was transferred to a new 96-well plate and absorbance readings were taken at 570 nm. Percentage hemolysis was calculated using Equation (6) [45]:
H e m o l y s i s   ( % ) = ( A m a x A t ) ( A m a x A m i n )   ×   100
where Amax, Amin, and At represent the absorbance values for erythrocytes incubated with deionized water, PBS, and S. triloba acetone extract respectively.

2.13. TLC-UV Fractionation of Acetone Crude Extract

S. triloba acetone crude extract was fractionated using TLC and the separated compounds visualized by ultraviolet light [46]. For fractionation, ready-made TLC plates with silica gel (DC-Fertigfolien Alugram SIL G/UV 254, MACHEREY-NAGEL) were utilized, and the mobile phase was composed of: Ethyl acetate, formic acid, glacial acetic acid, and water in the ratio, 10:1.1:1.1:2.6, respectively. A short wavelength UV lamp (254 nm) was employed to visualize the separated bands/fractions. The RF value of each fraction was calculated by dividing the distance traveled by the fraction over that traveled by the solvent front.

2.14. Statistical Analysis

Generated data are presented as mean ± standard deviation of three independent experiments unless otherwise specified. Comparisons between means were performed using either the Student’s t-test, one-way analysis of variance (ANOVA) or two-way ANOVA and the Dunnett’s test was utilized for post hoc analysis. All statistical analysis was performed using GraphPad Prism 6.01 software [33].

3. Results

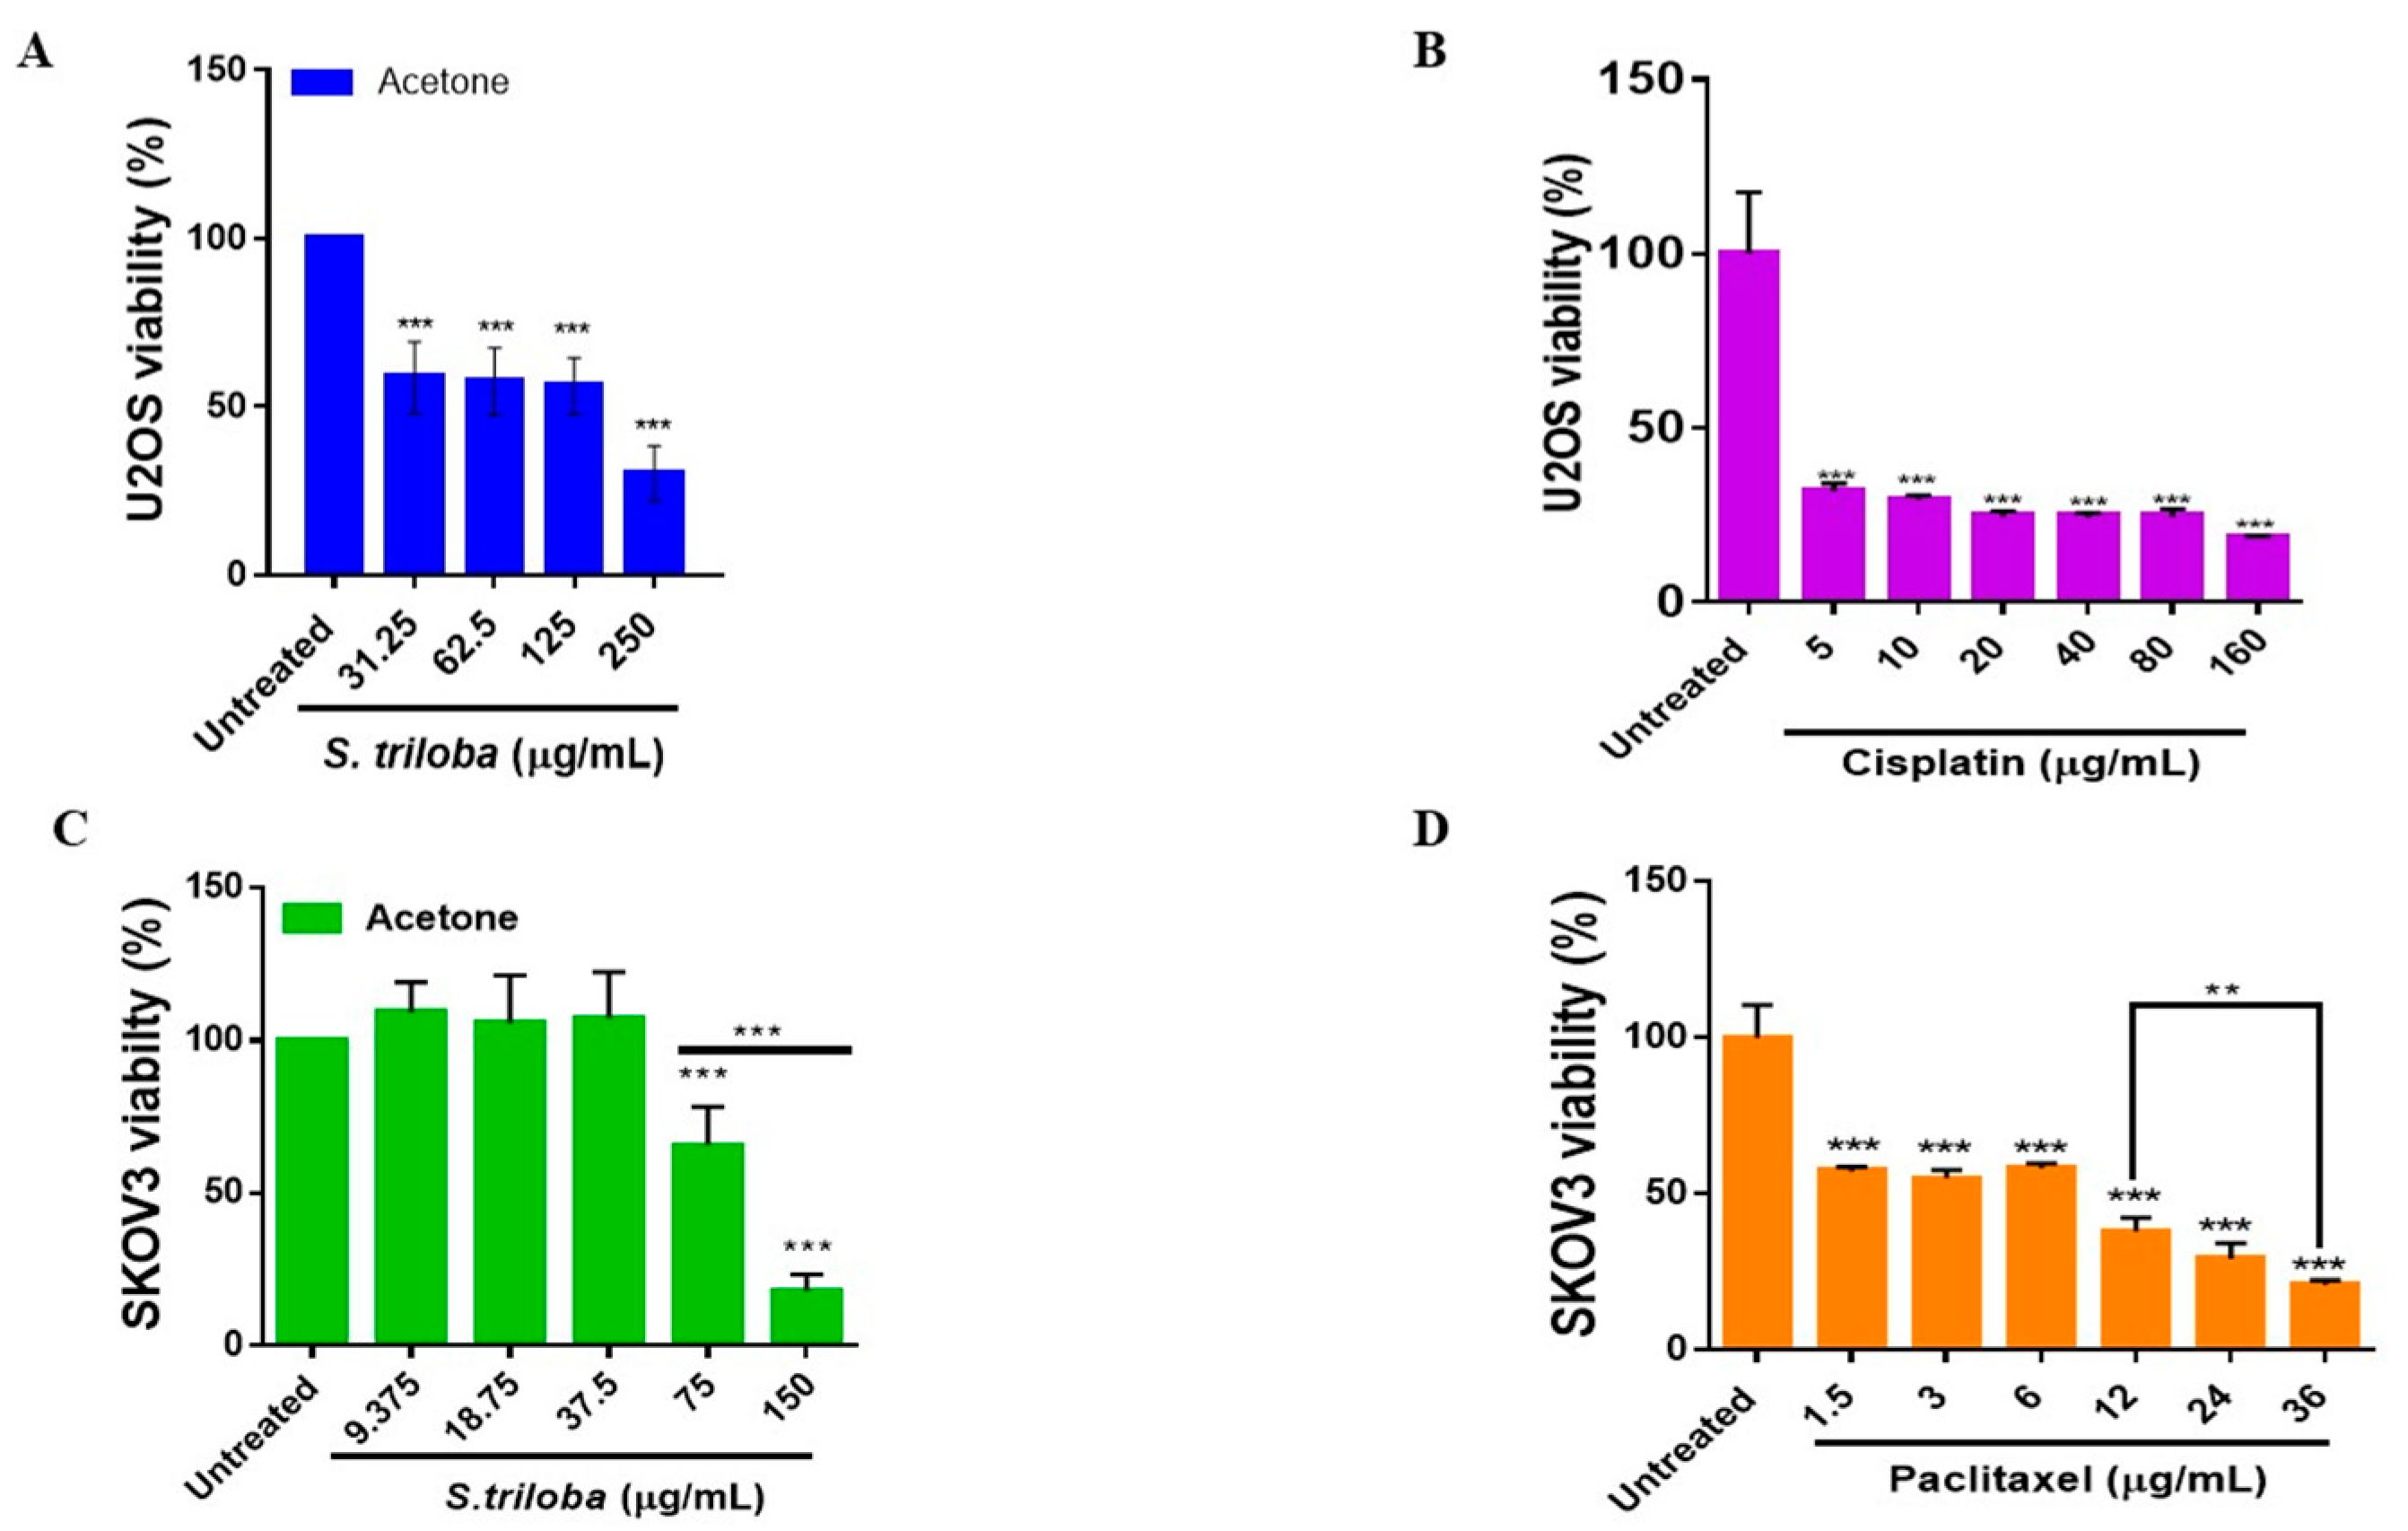
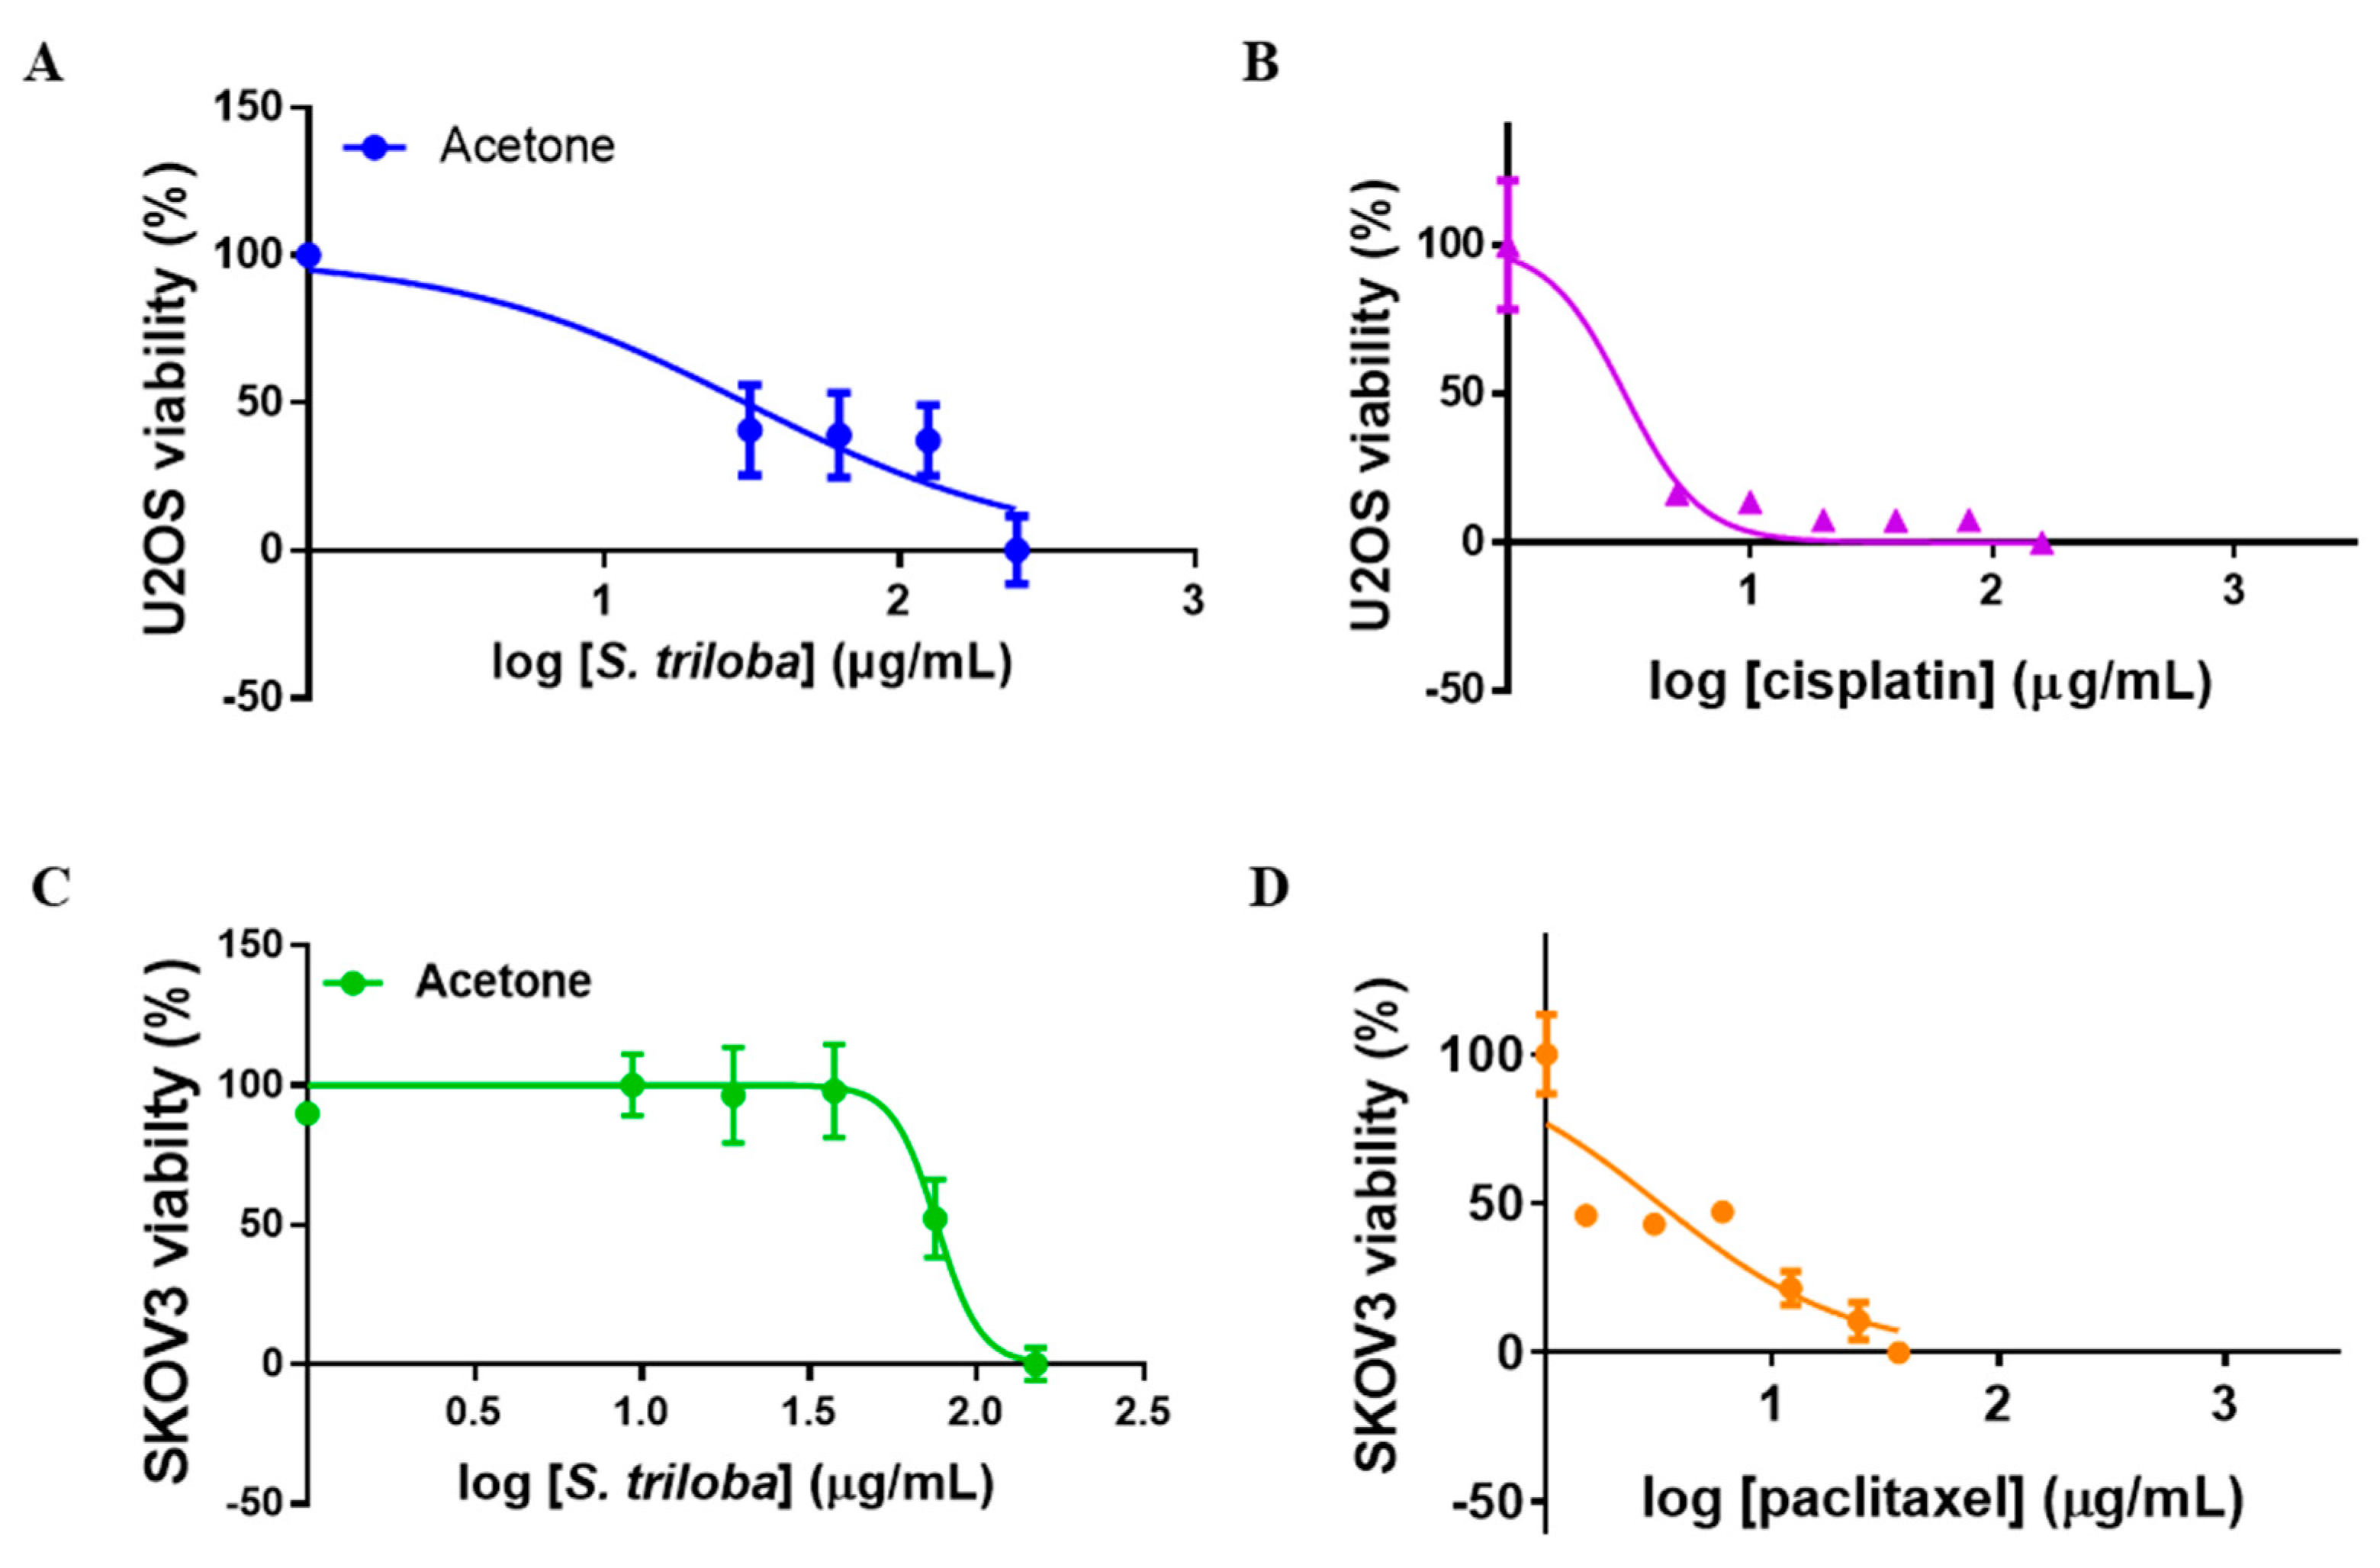
3.1. S. triloba Acetone Extract Significantly Reduces U2OS and SKOV3 Cell Viability

The viability of cells exposed to varying doses of S. triloba was determined based on absorbance readings obtained from the MTT assay. Readings obtained after 48 h of incubation were normalized to respective negative controls (untreated cells) and expressed as percentage viabilities. S. triloba acetone extract significantly reduced U2OS cell viability at all concentrations tested. The highest concentration (250 µg/mL) induced a reduction in viability of more than 50% (Figure 1A). Contrarily, the ethanol extract did not affect U2OS cell viability at all concentrations tested (Figure S1). Cisplatin, which was utilized as the positive control for U2OS cells, significantly inhibited cell viability by more than 50% at all concentrations tested (Figure 1B). SKOV3 cells on the other hand exhibited a reduction in cell viability at only the two highest concentrations tested (75 and 150 µg/mL) when treated with S. triloba acetone extract. A drastic decline in SKOV3 cell viability (approximately 82%) was observed when SKOV3 cells were exposed to 150 µg/mL of the acetone extract (Figure 1C). Paclitaxel (SKOV3 positive control) significantly inhibited cell viability at all concentrations tested; reductions in SKOV3 cell viability ranged from approximately 57% to 21% (Figure 1D). Additionally, S. triloba ethanol extract showed no effect on HepG2 cell viability when tested with concentrations ranging from 9.4 to 600 µg/mL for both MTT and trypan blue assays. Accordingly, the ethanol extract demonstrated no effect on HepG2 cell morphology at this concentration range (Figure S2). Since HepG2 cell viability displayed no reduction after S. triloba treatment, we excluded further testing of HepG2 cells in downstream assays. DMSO, which was the solvent used to reconstitute S. triloba extracts exhibted no effect on viability when tested on U2OS or SKOV3 cells at the highest working concentration (0.2% DMSO) (Figure S3).
MTT data were used to determine IC50 values by generating dose–response curves for respective treatments. All dose–response curves possessed a negative slope, indicating a reduction in cell viability as the extract concentration increased. IC50 values obtained for U2OS were 30.210 ± 1.180 µg/mL (R2 = 0.797) and 3.033 ± 1.189 µg/mL (R2 = 0.919) for S. triloba acetone extract and cisplatin treatments respectively (Figure 2A,B). In contrast, IC50 values obtained for SKOV3 cells were 75.960 ± 1.0237 µg/mL (R2 = 0.890) and 3.148 ± 1.197 µg/mL (R2 = 0.771) for S. triloba acetone extract and paclitaxel treatments respectively (Figure 2C,D). Additionally, with the exception of U2OS cells treated with the acetone extract, all other experiments possessed Hill Slope magnitudes greater than 1. The greatest Hill Slope magnitude (6.678 ± 3.928) was observed when SKOV3 cells were treated with S. triloba acetone extract while the least magnitude (0.8665 ± 0.137) was recorded for U2OS cells treated with S. triloba acetone extract (Table S1).

3.2. Selectivity Index of S. triloba Acetone Extract for U2OS and SKOV3 Cells

The selectivity index of S. triloba for U2OS and SKOV3 cells was calculated in order to assess the extent to which S. triloba selects for cancer cells over noncancerous ones. U2OS cells treated with S. triloba displayed the greatest SI (2.51) while SKOV3 cells treated with S. triloba had a SI of 1.00. When compared with respective positive controls, the SI (1.167) of U2OS cells treated with cisplatin was about 2-fold lower than the SI of those treated with S. triloba; on the other hand, SI (1.316) of cells treated with paclitaxel was slightly higher than the SI of those treated with S. triloba. The dose response curves of Hek-293 cells as well as the obtained IC50 values are presented in Figure S4 and Table S2 respectively. All calculated SI values are summarized in Table S3.

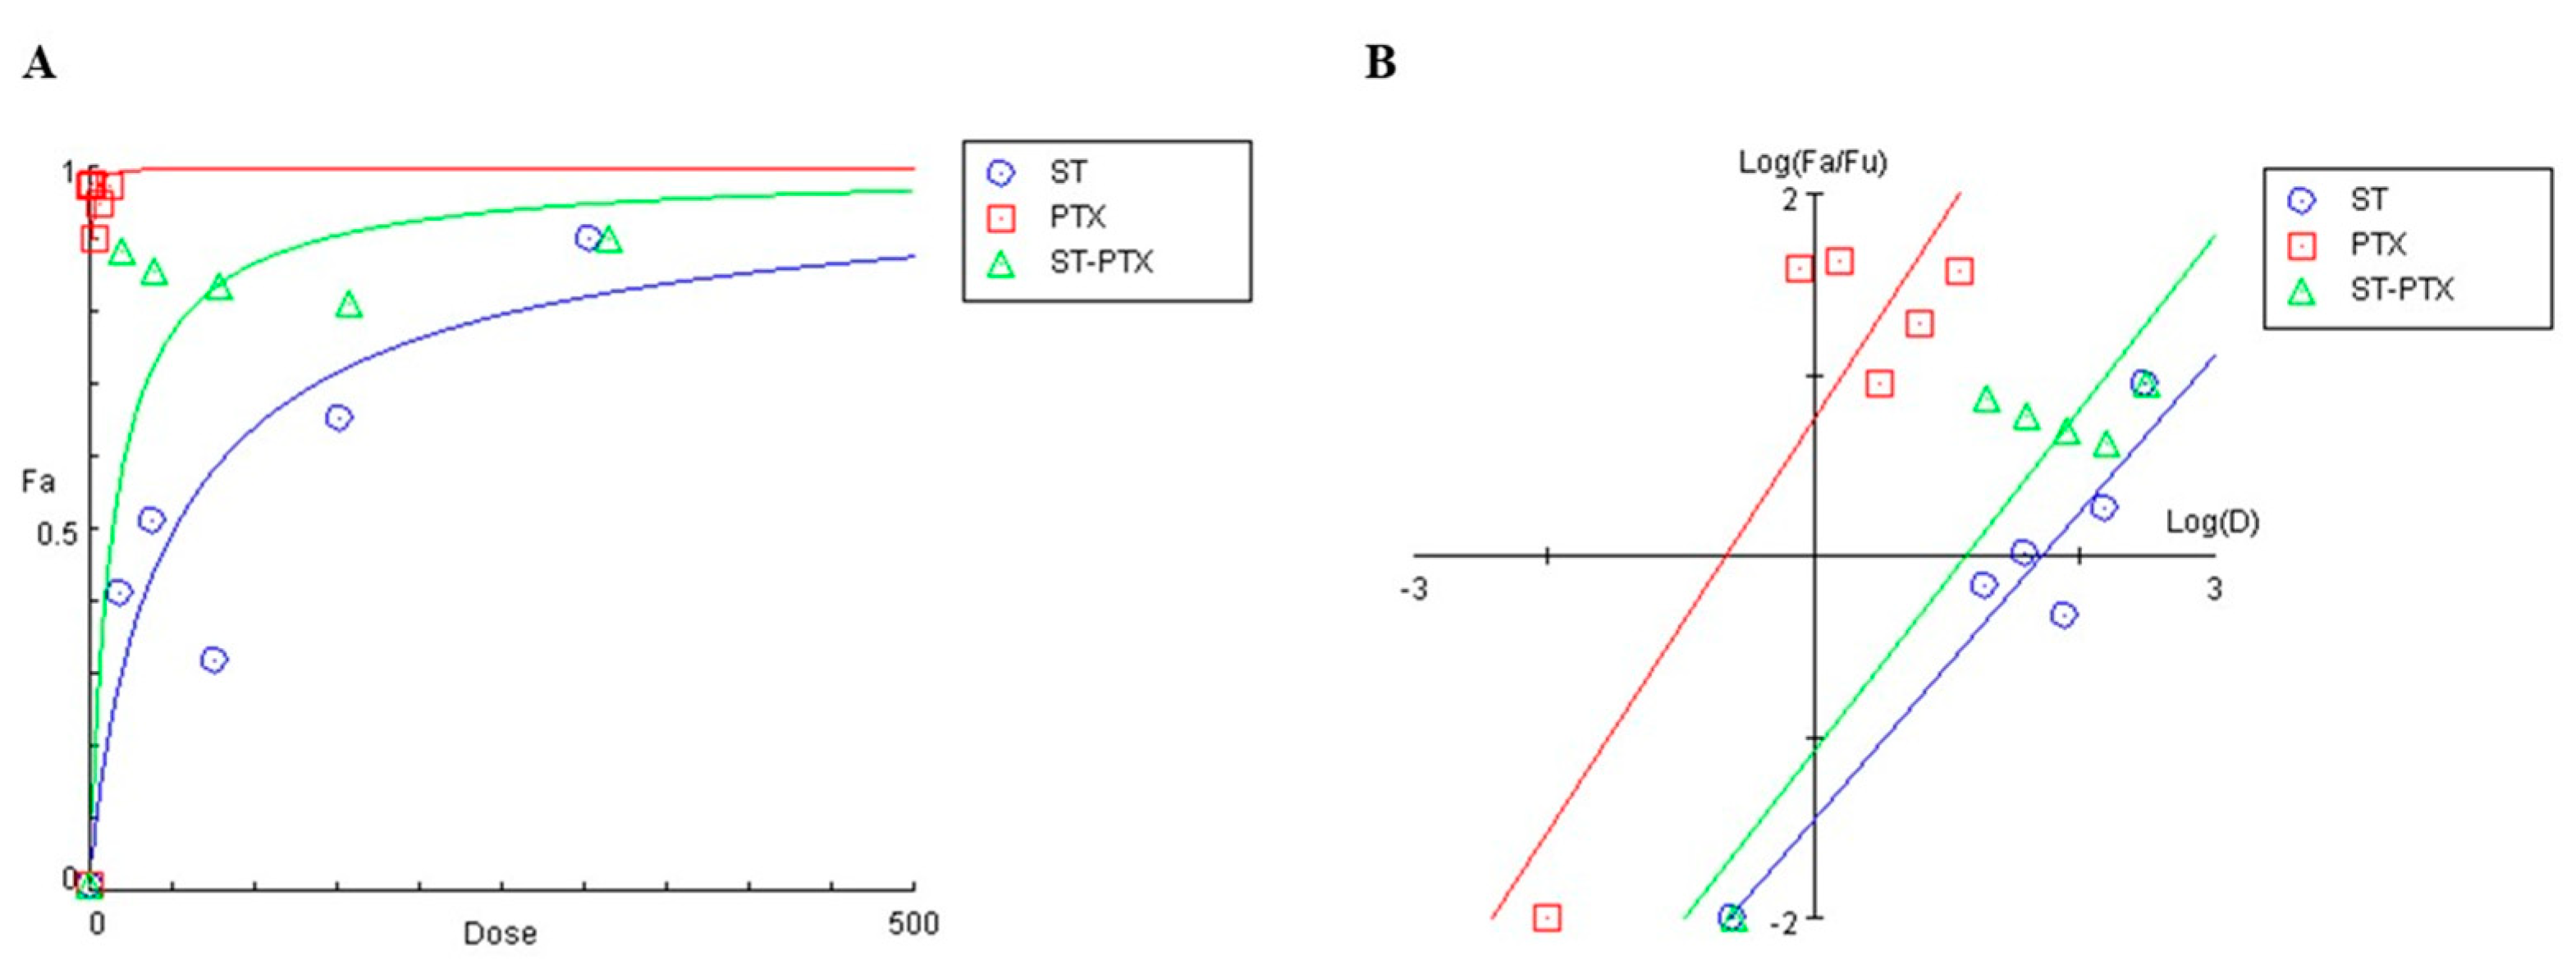
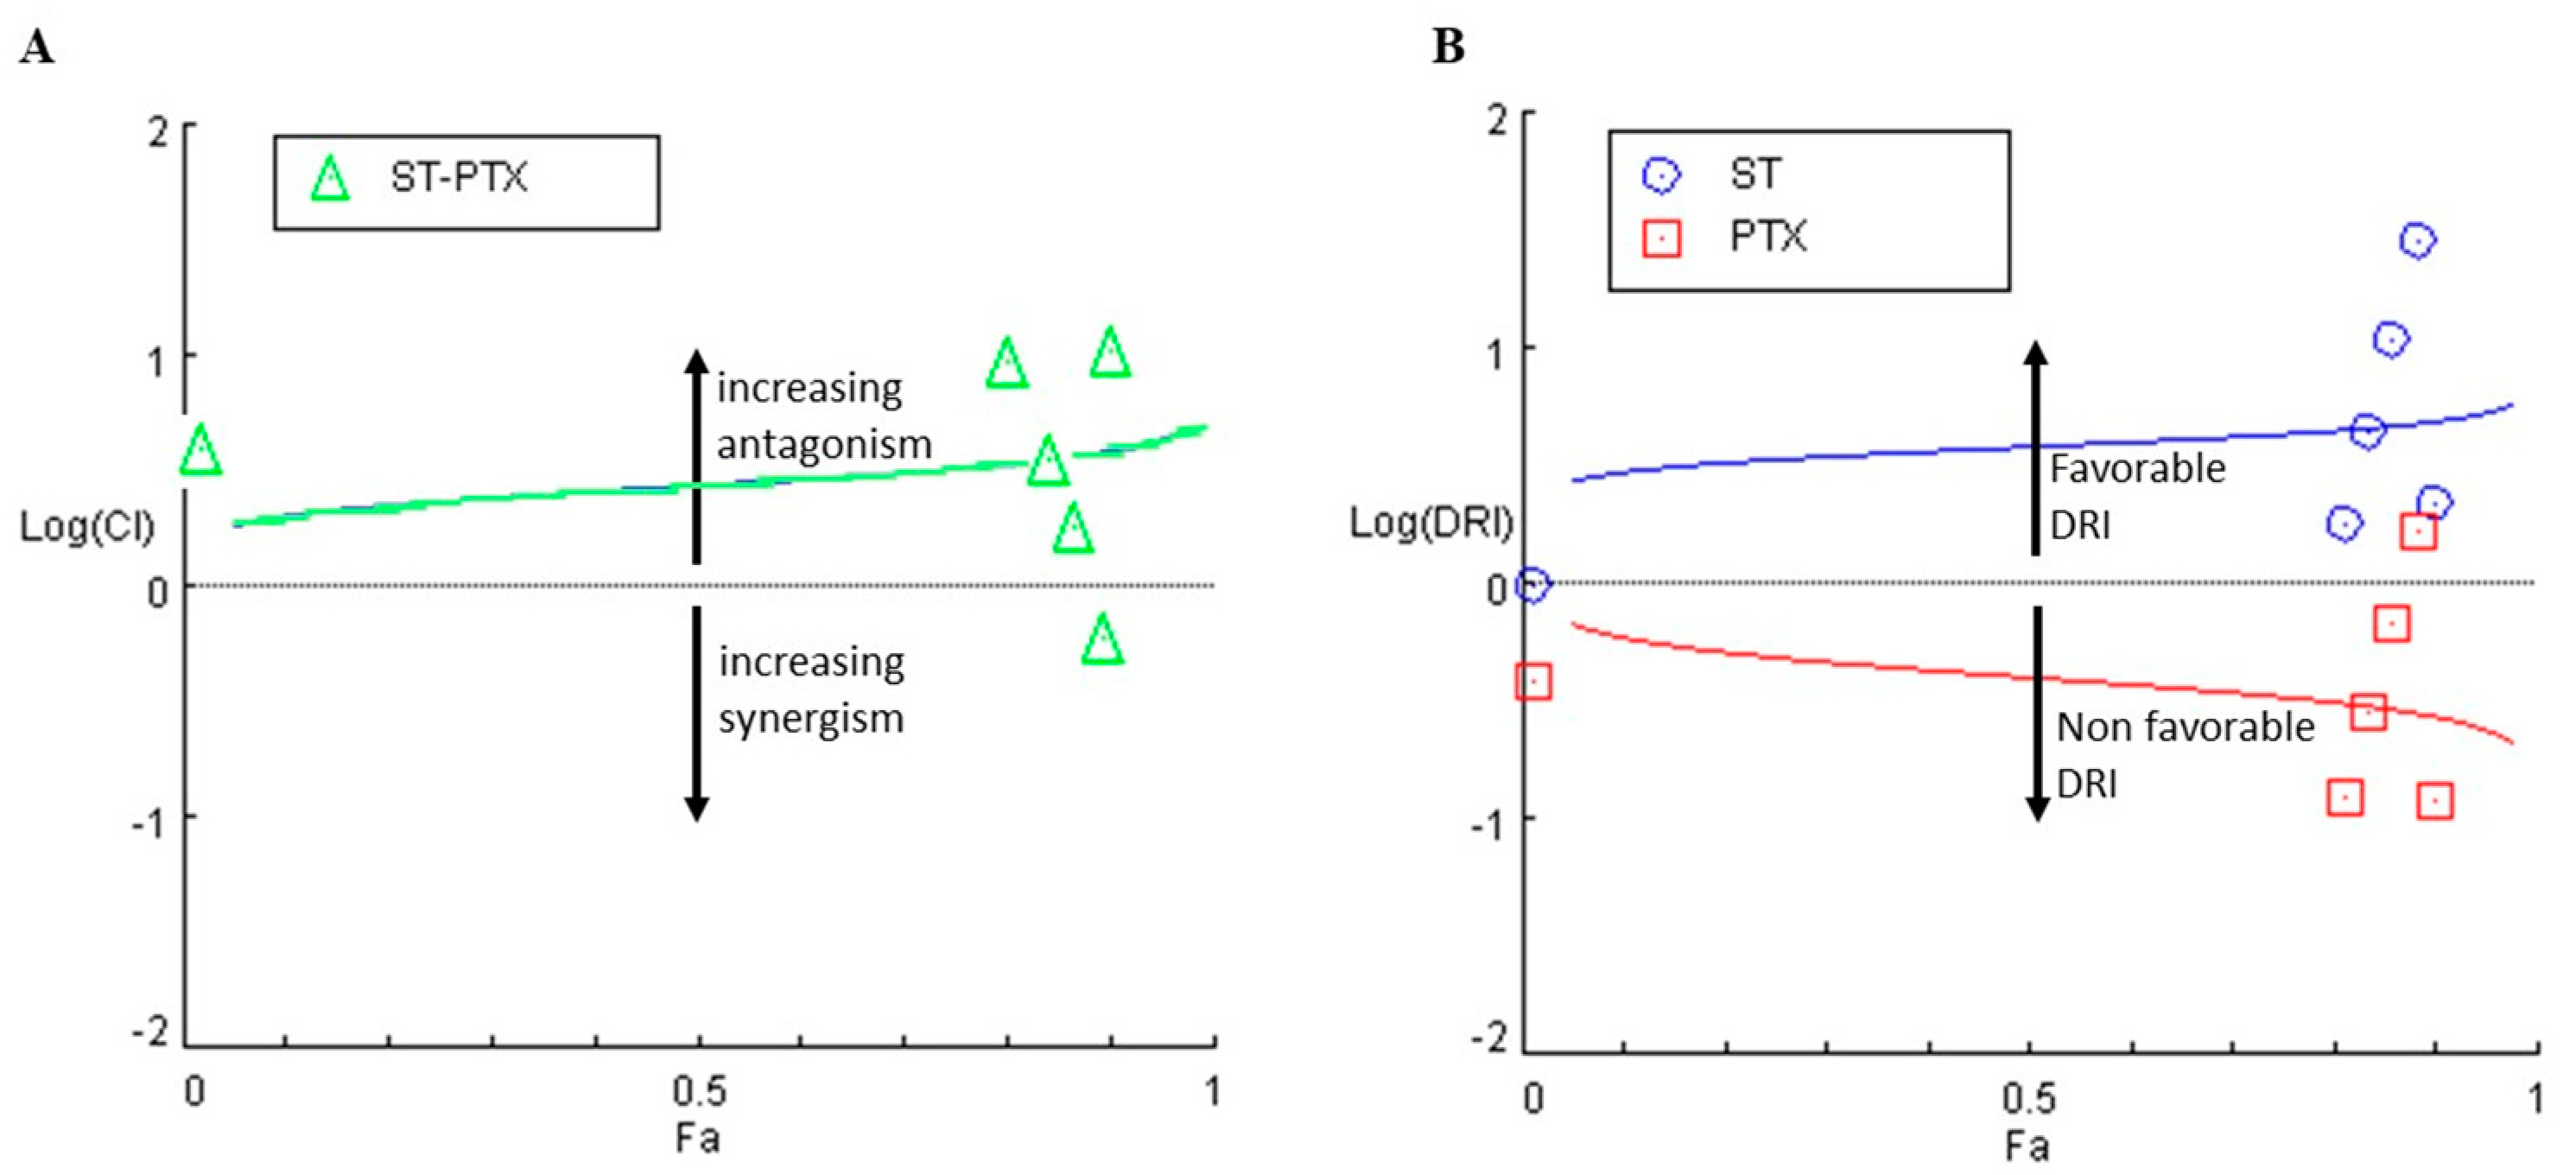
3.3. The Combination of S. triloba Acetone Extract and Paclitaxel Exhibits Strong Synergism in SKOV3 Cells

Drug combination analysis using CompuSyn software facilitated the determination of dose–effect relationships for both S. triloba acetone extract and paclitaxel independently, as well as in combination. This analysis aimed to determine whether the combined treatment produces synergistic, additive, or antagonistic effects. Dose–effect data for each treatment independently and in combination indicated a general reduction in SKOV3 cell viability with increasing treatment concentrations (Table 3). A dose-effect plot was generated and used to determine the potency of each treatment after linearization into the median effect plot. The least median effect dose (the dose that results in 50% effect) was observed for paclitaxel (0.221 µg/mL), followed by the combination treatment (13.8357µg/mL), and S. triloba (50.928 µg/mL) (Table 4 and Figure 3). By law of mass action, the median effect doses (Dm) were utilized to determine combination indices (CI) for the combined treatment. CI values less than, equal to, and greater than 1 are indicative of synergistic, additive, and antagonistic effects respectively [38,39]. Synergism was observed at only one of the tested combined concentrations (19 µg/mL of S. triloba + 0.787 µg/mL of paclitaxel), CI = 0.6415. An over 85% decrease in SKOV3 cell viability was observed for this combination (Table 5 and Figure 4A). The CompuSyn software further simulated dose reduction indices (DRI) at all experimental points tested. DRI values greater than 1 indicate that the dose of a specific drug can be reduced when used in combination. On the other hand, DRIs less than 1 are non-favourable for dose reduction [38,39]. The combination treatment that exhibited synergy had a DRI above 1 for each of the single drug concentrations involved (Table 6 and Figure 4B). The detailed CompySyn report can be accessed in the Supplementary Material (File S1).

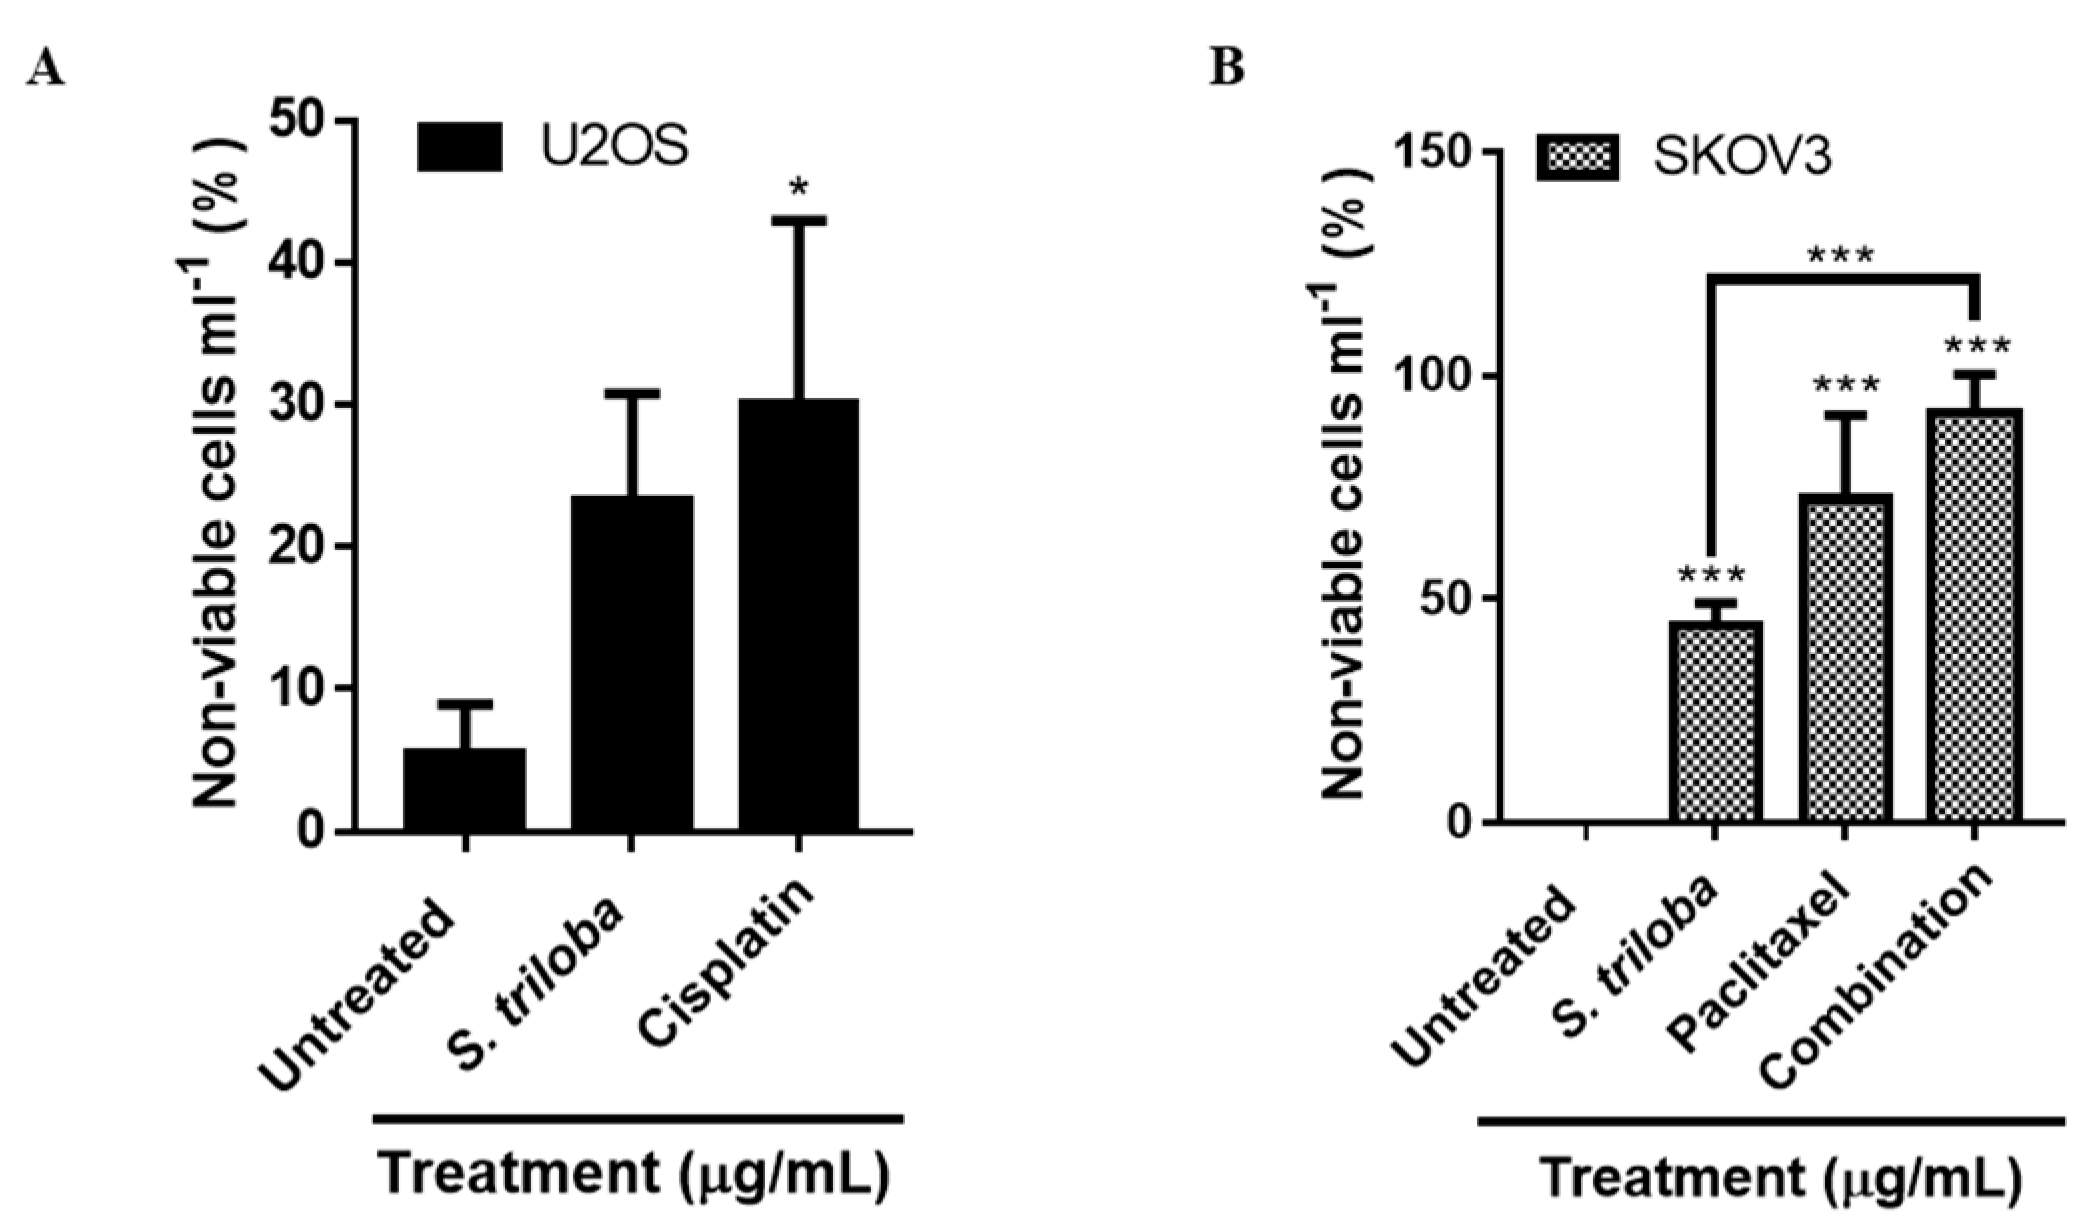
3.4. S. triloba Acetone Extract Increases the Percentage of Non-Viable Cells in Both U2OS and SKOV3 Cells

Trypan blue exclusion assay was utilized to determine the percentage of non-viable U2OS and SKOV3 cells upon exposure to S. triloba acetone extract adjusted to respective IC50 values. The percentage of non-viable cells after S. triloba treatment increased by (17.758%) and (44.367%) for U2OS and SKOV3 cells respectively; significant increases were, however, noted in SKOV3 cells only when compared with non-treated controls. Furthermore, the combination treatment that exhibited the greatest synergy induced a significantly higher increase (91.967%) in non-viable SKOV3 cells, and this surge was 19.48% greater than that induced by paclitaxel. Both cisplatin (IC50) and paclitaxel (IC50) served as positive controls for U2OS and SKOV3 cells respectively (Figure 5).

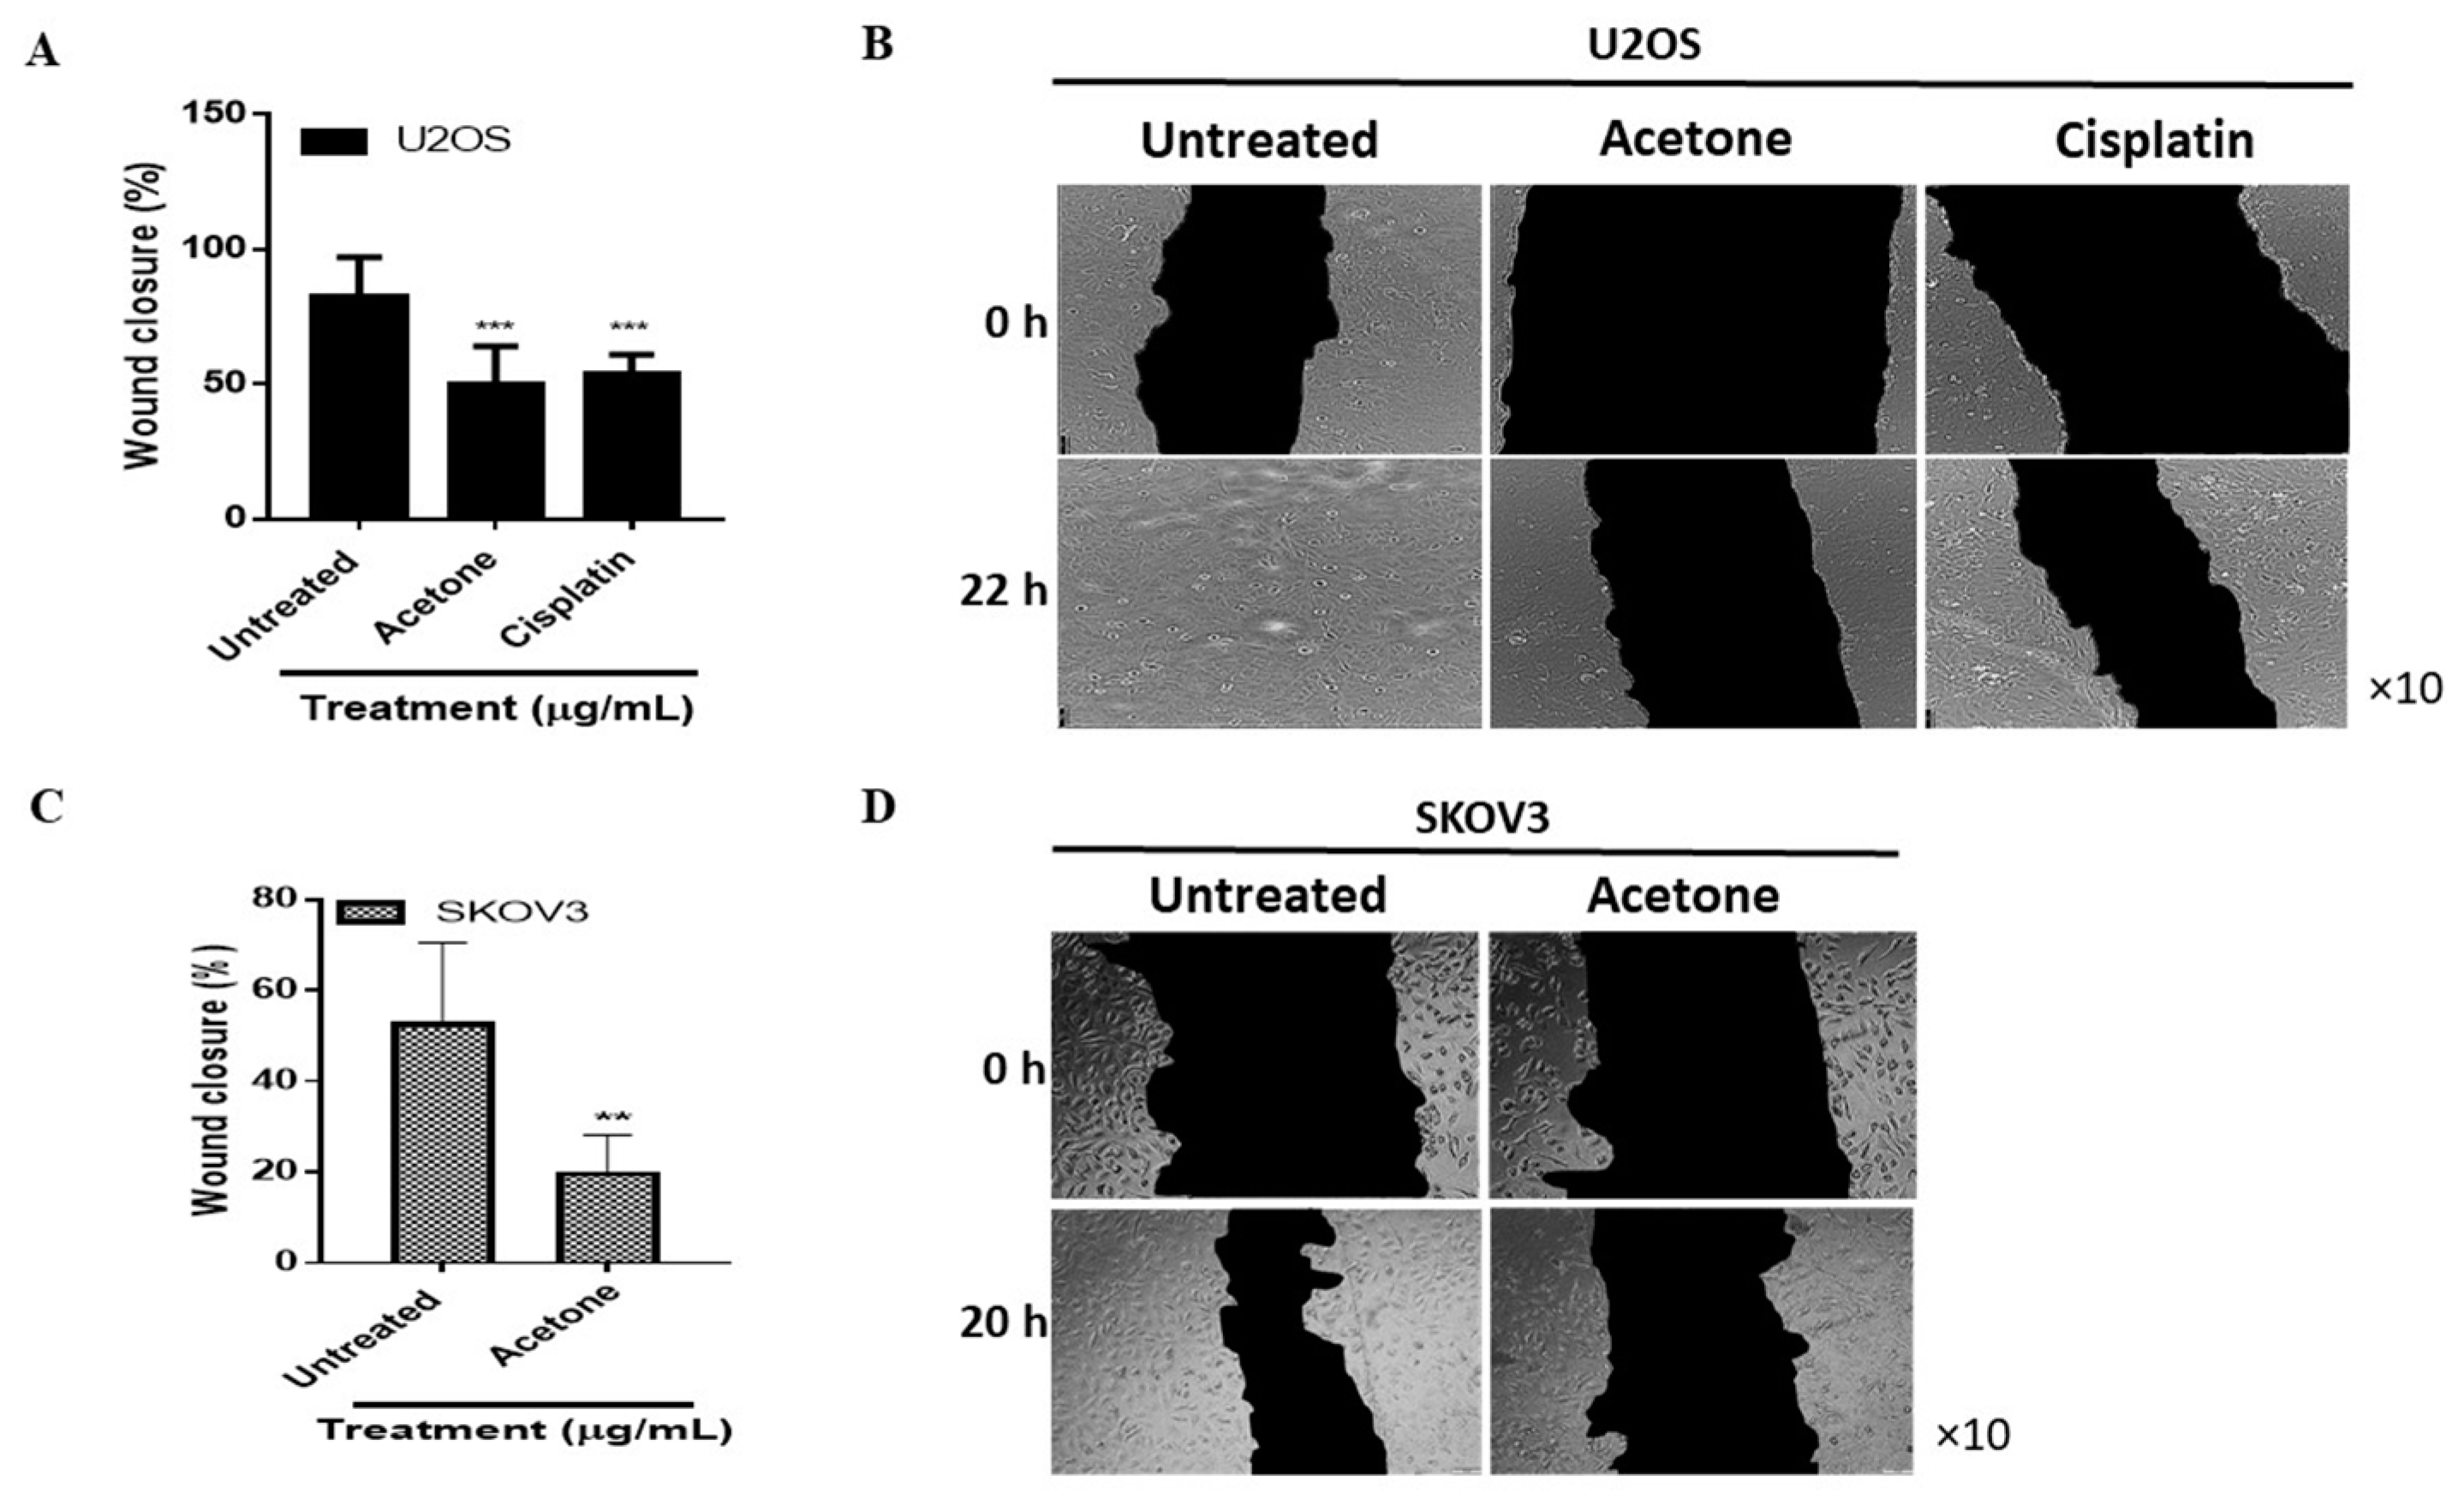
3.5. S. triloba Acetone Extract Decreases Wound Closure in Both U2OS and SKOV3 Cells

The effect of S. triloba acetone extract (IC50) on U2OS and SKOV3 cell migration was evaluated using the scratch-wound healing assay after incubation for 22 h and 20 h respectively. Wound closure was determined as a percentage of the wound area at either 22 h or 20 h, relative to the wound area at 0 h. Significant decreases in wound closure were noted in both U2OS (31.974%) and SKOV3 (32.881%) cells when compared with respective untreated controls. U2OS cells treated with cisplatin (IC50) displayed similar percentage wound closure to cells treated with S. triloba acetone extract. On the otherhand, wound closure for SKOV3 cells treated with paclitaxel could not be determined since the treatment caused the cells around the wound boundaries to detach and thus adversely affecting the results (Figure 6).

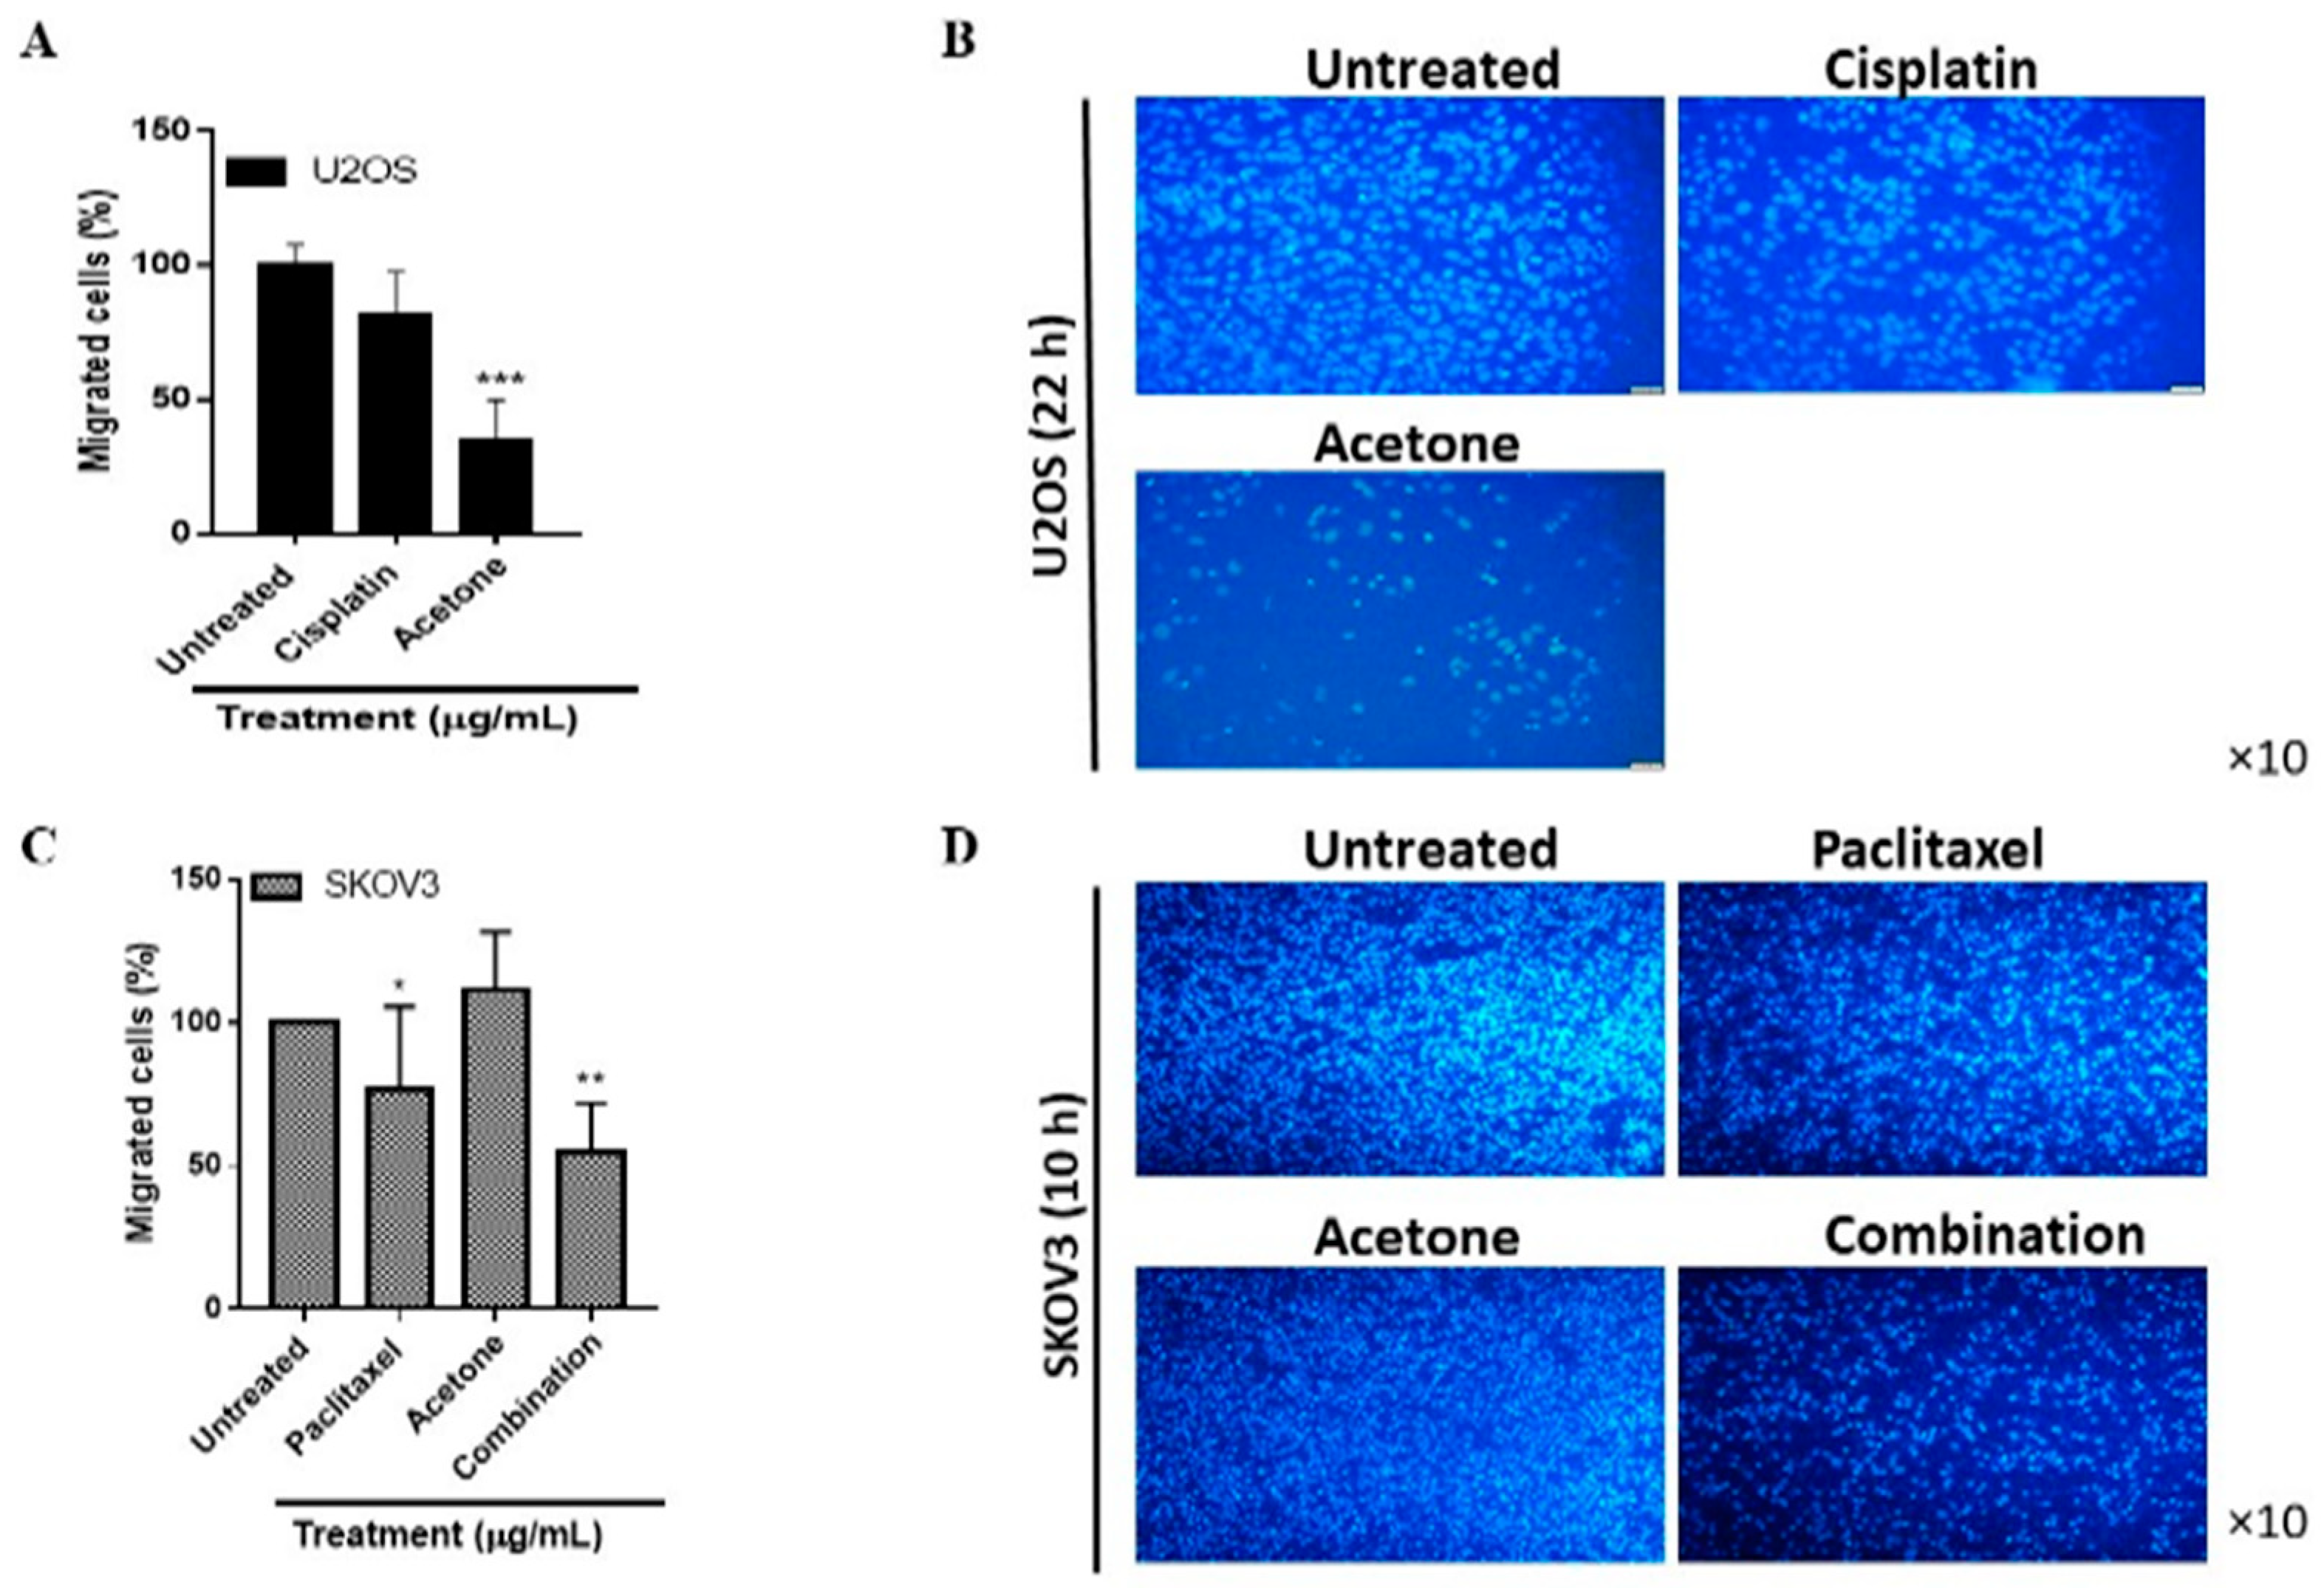
3.6. S. triloba Acetone Extract and the Combination Treatment Respectively Decrease U2OS and SKOV3 Cell Migration

The effect of S. triloba on U2OS and SKOV3 cell migration was further assessed using the transwell migration assay. Results from the assay indicated that although S. triloba acetone extract significantly decreased U2OS cell migration by 65.6%, SKOV3 cell migrartion was unaffected. Additionally, a 42% decline in SKOV3 cell migration was observed for the combination treatment of S. triloba acetone extract (19 µg/mL) and paclitaxel (0.787 µg/mL). The cisplatin (IC50) and paclitaxel (IC50) positive controls, respectively, displayed negligible effects on U2OS and SKOV3 cell migration (Figure 7).

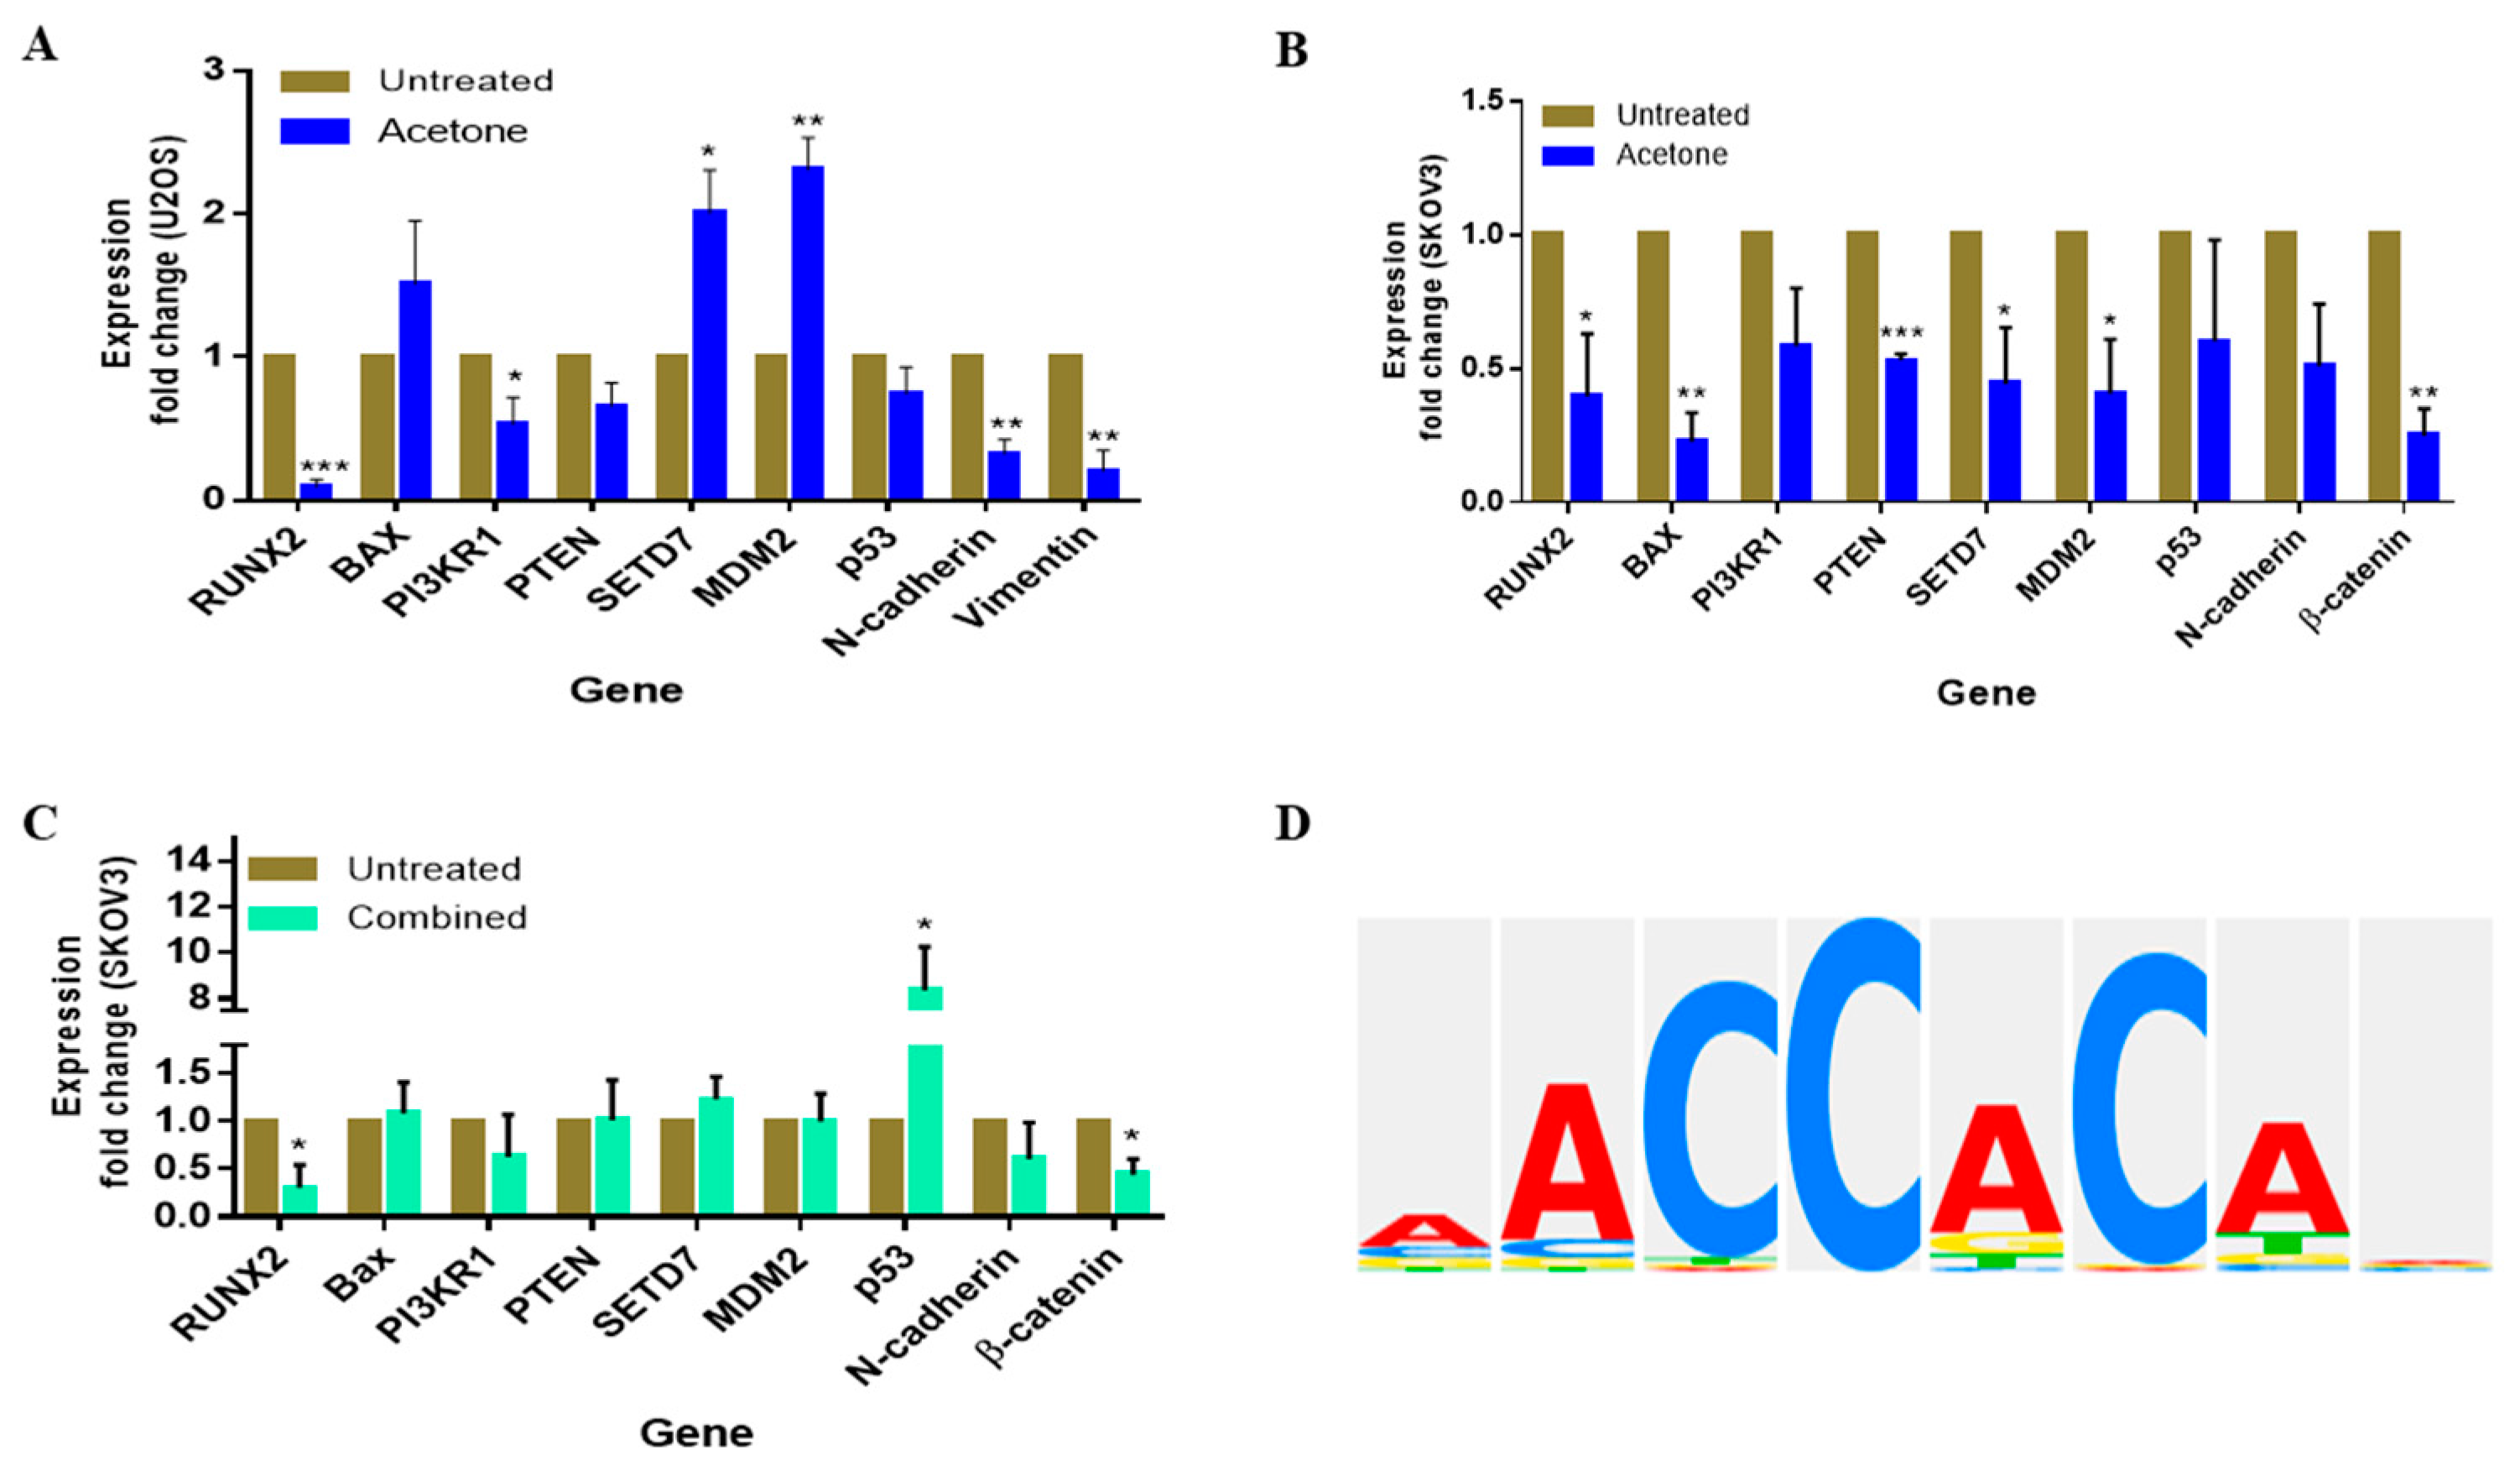
3.7. S. triloba Acetone Extract and Its Combination with Paclitaxel Affect the Steady-State mRNA Expression of Oncogenic Targets in Both U2OS and SKOV3 Cells

The steady-state mRNA expression of several genes involved in cell proliferation, migration, and apoptosis was examined in both U2OS and SKOV3 cells after treatment with either S. triloba acetone extract or the combination treatment (S. triloba (19 µg/mL) + paclitaxel (0.787 µg/mL)). Comparisons made between treated and untreated U2OS cells revealed significant declines in RUNX2 (p ≤ 0.001), vimentin (p ≤ 0.001), N-cadherin (p ≤ 0.001), and PI3KR1 (p = 0.013) expression after S. triloba treatment. On the other hand, both MDM2 (p ≤ 0.001) and SETD7 (p = 0.005) were significantly upregulated by approximately 1-fold. Expression fold changes in p53, BAX, and PTEN displayed no statistical significance (Figure 8A). Treatment of SKOV3 cells with S. triloba acetone extract resulted in a reduced expression of all genes tested; statistically significant reductions were observed for RUNX2 (p ≤ 0.05), BAX (p ≤ 0.01), PTEN (p ≤ 0.001), SETD7 (p ≤ 0.05), MDM2 (p ≤ 0.05), and β-catenin (p ≤ 0.01) (Figure 8B). In contrast, only 3 genes displayed significant changes in expression after testing the combination treatment on SKOV3 cells. Both RUNX2 (p ≤ 0.05) and β-catenin (p ≤ 0.05) were significantly downregulated while p53 (p ≤ 0.050) displayed an 8.3-fold increase (Figure 8C).

3.8. Identification of RUNX2 Transcription Factor Binding Sites within the MDM2 Gene

In silico examination of MDM2’s promoter region predicted a total of six RUNX2 TFBS with core similarity scores ranging from 0.894 to 1 and matrix similarity scores of approximately 0.9. A summary of TFBS start and end positions (relative to transcription start site), along with respective sequences is shown in Table 7. Five out of six of the predicted TFBS sequences possessed the RUNX2 TFBS consensus sequence (AACCACAN) (Figure 8D and Table 7).

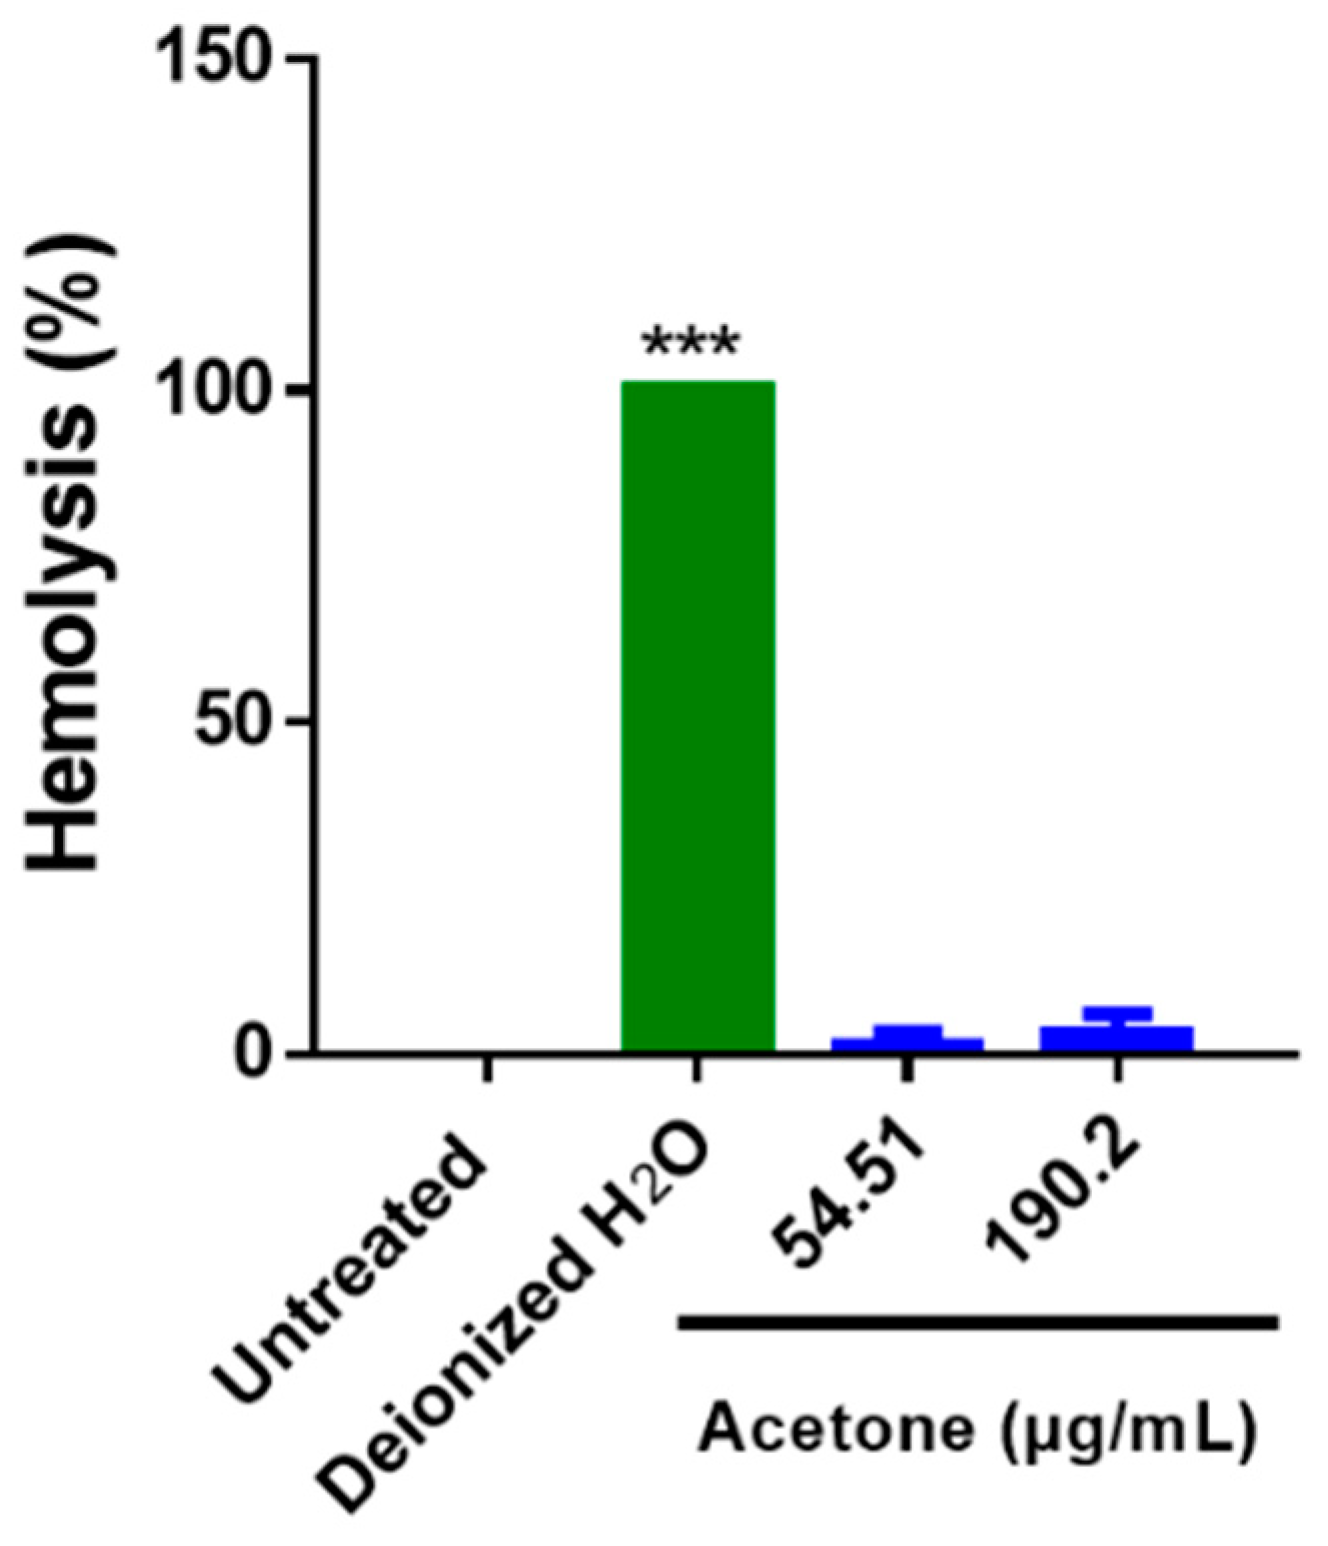
3.9. S. triloba Acetone Extract Does Not Induce Hemolysis in Human Erythrocytes

Human erythrocytes were subjected to concentrations approximate to either IC50 (54.51 µg/mL) or IC75 (190 µg/mL) of S. triloba acetone extract to examine its hemolytic effect. Deionized water was utilized as a positive control, while untreated erythrocytes were utilized as the negative control. All tested concentrations of the acetone extract induced a negligible hemolytic effect (1.282% and 3.157% respectively for 54.51 µg/mL and 190 µg/mL of the acetone extract) that showed no statistical significance when compared to untreated samples (Figure 9).

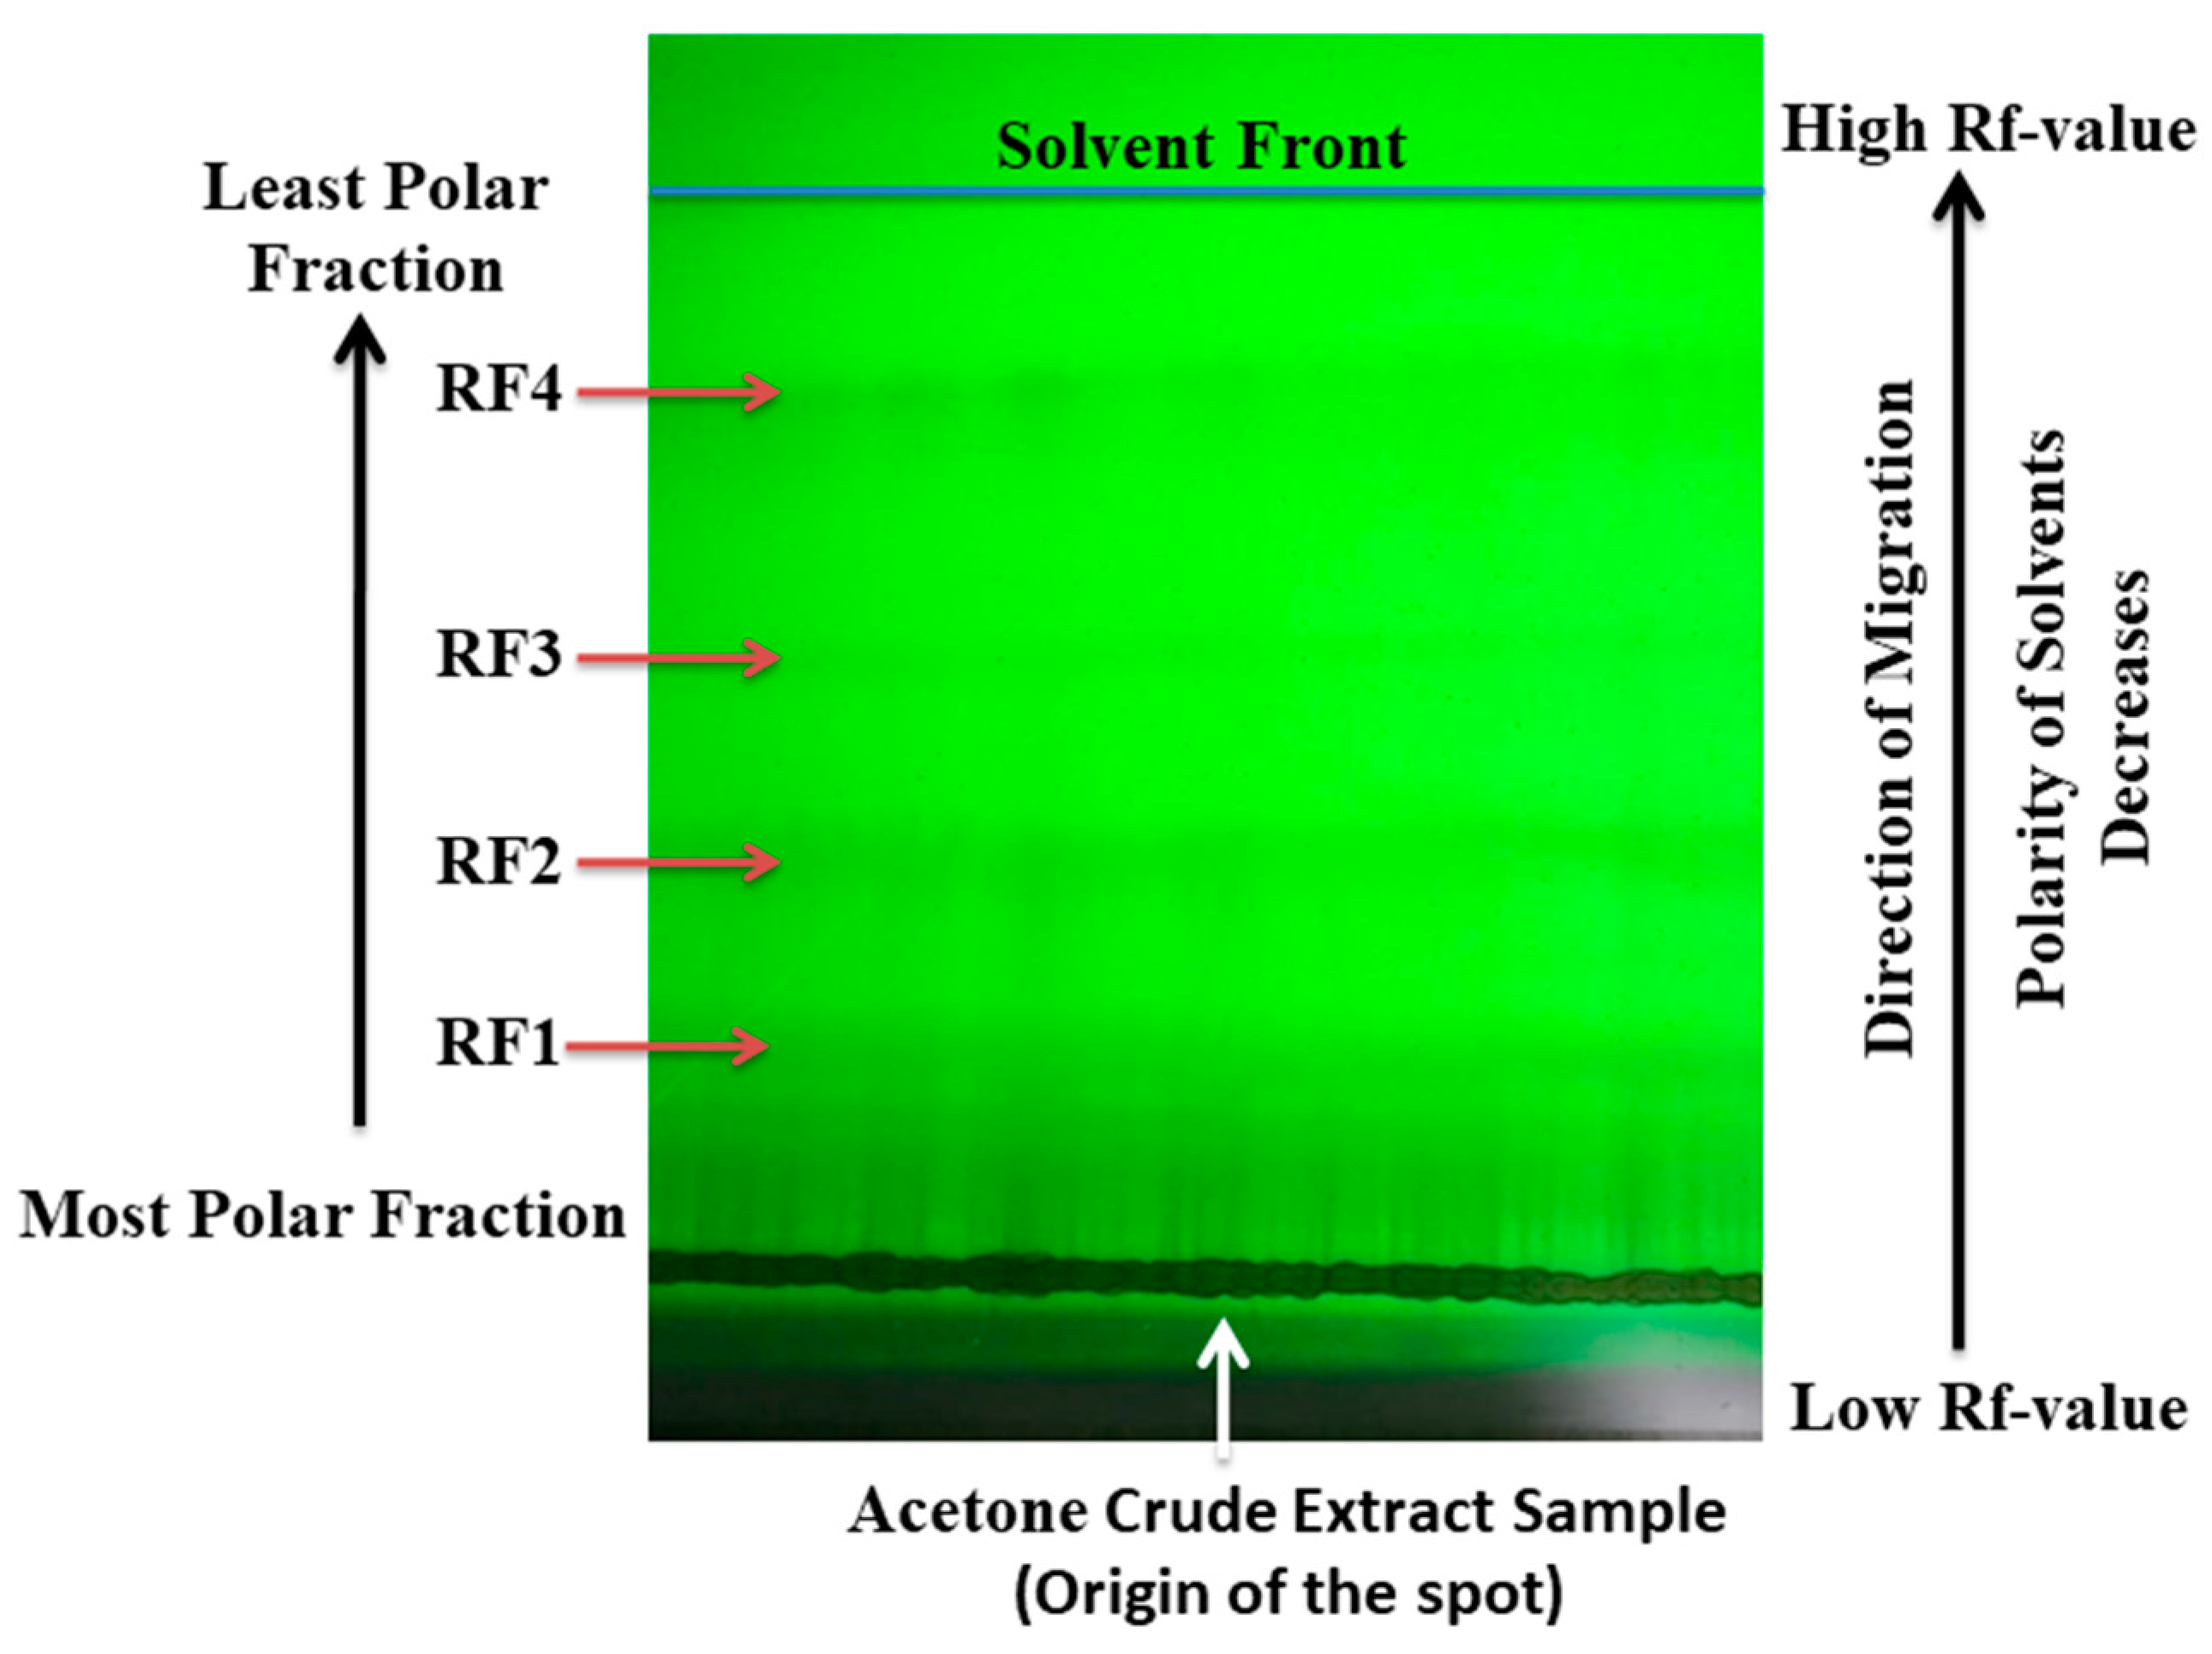
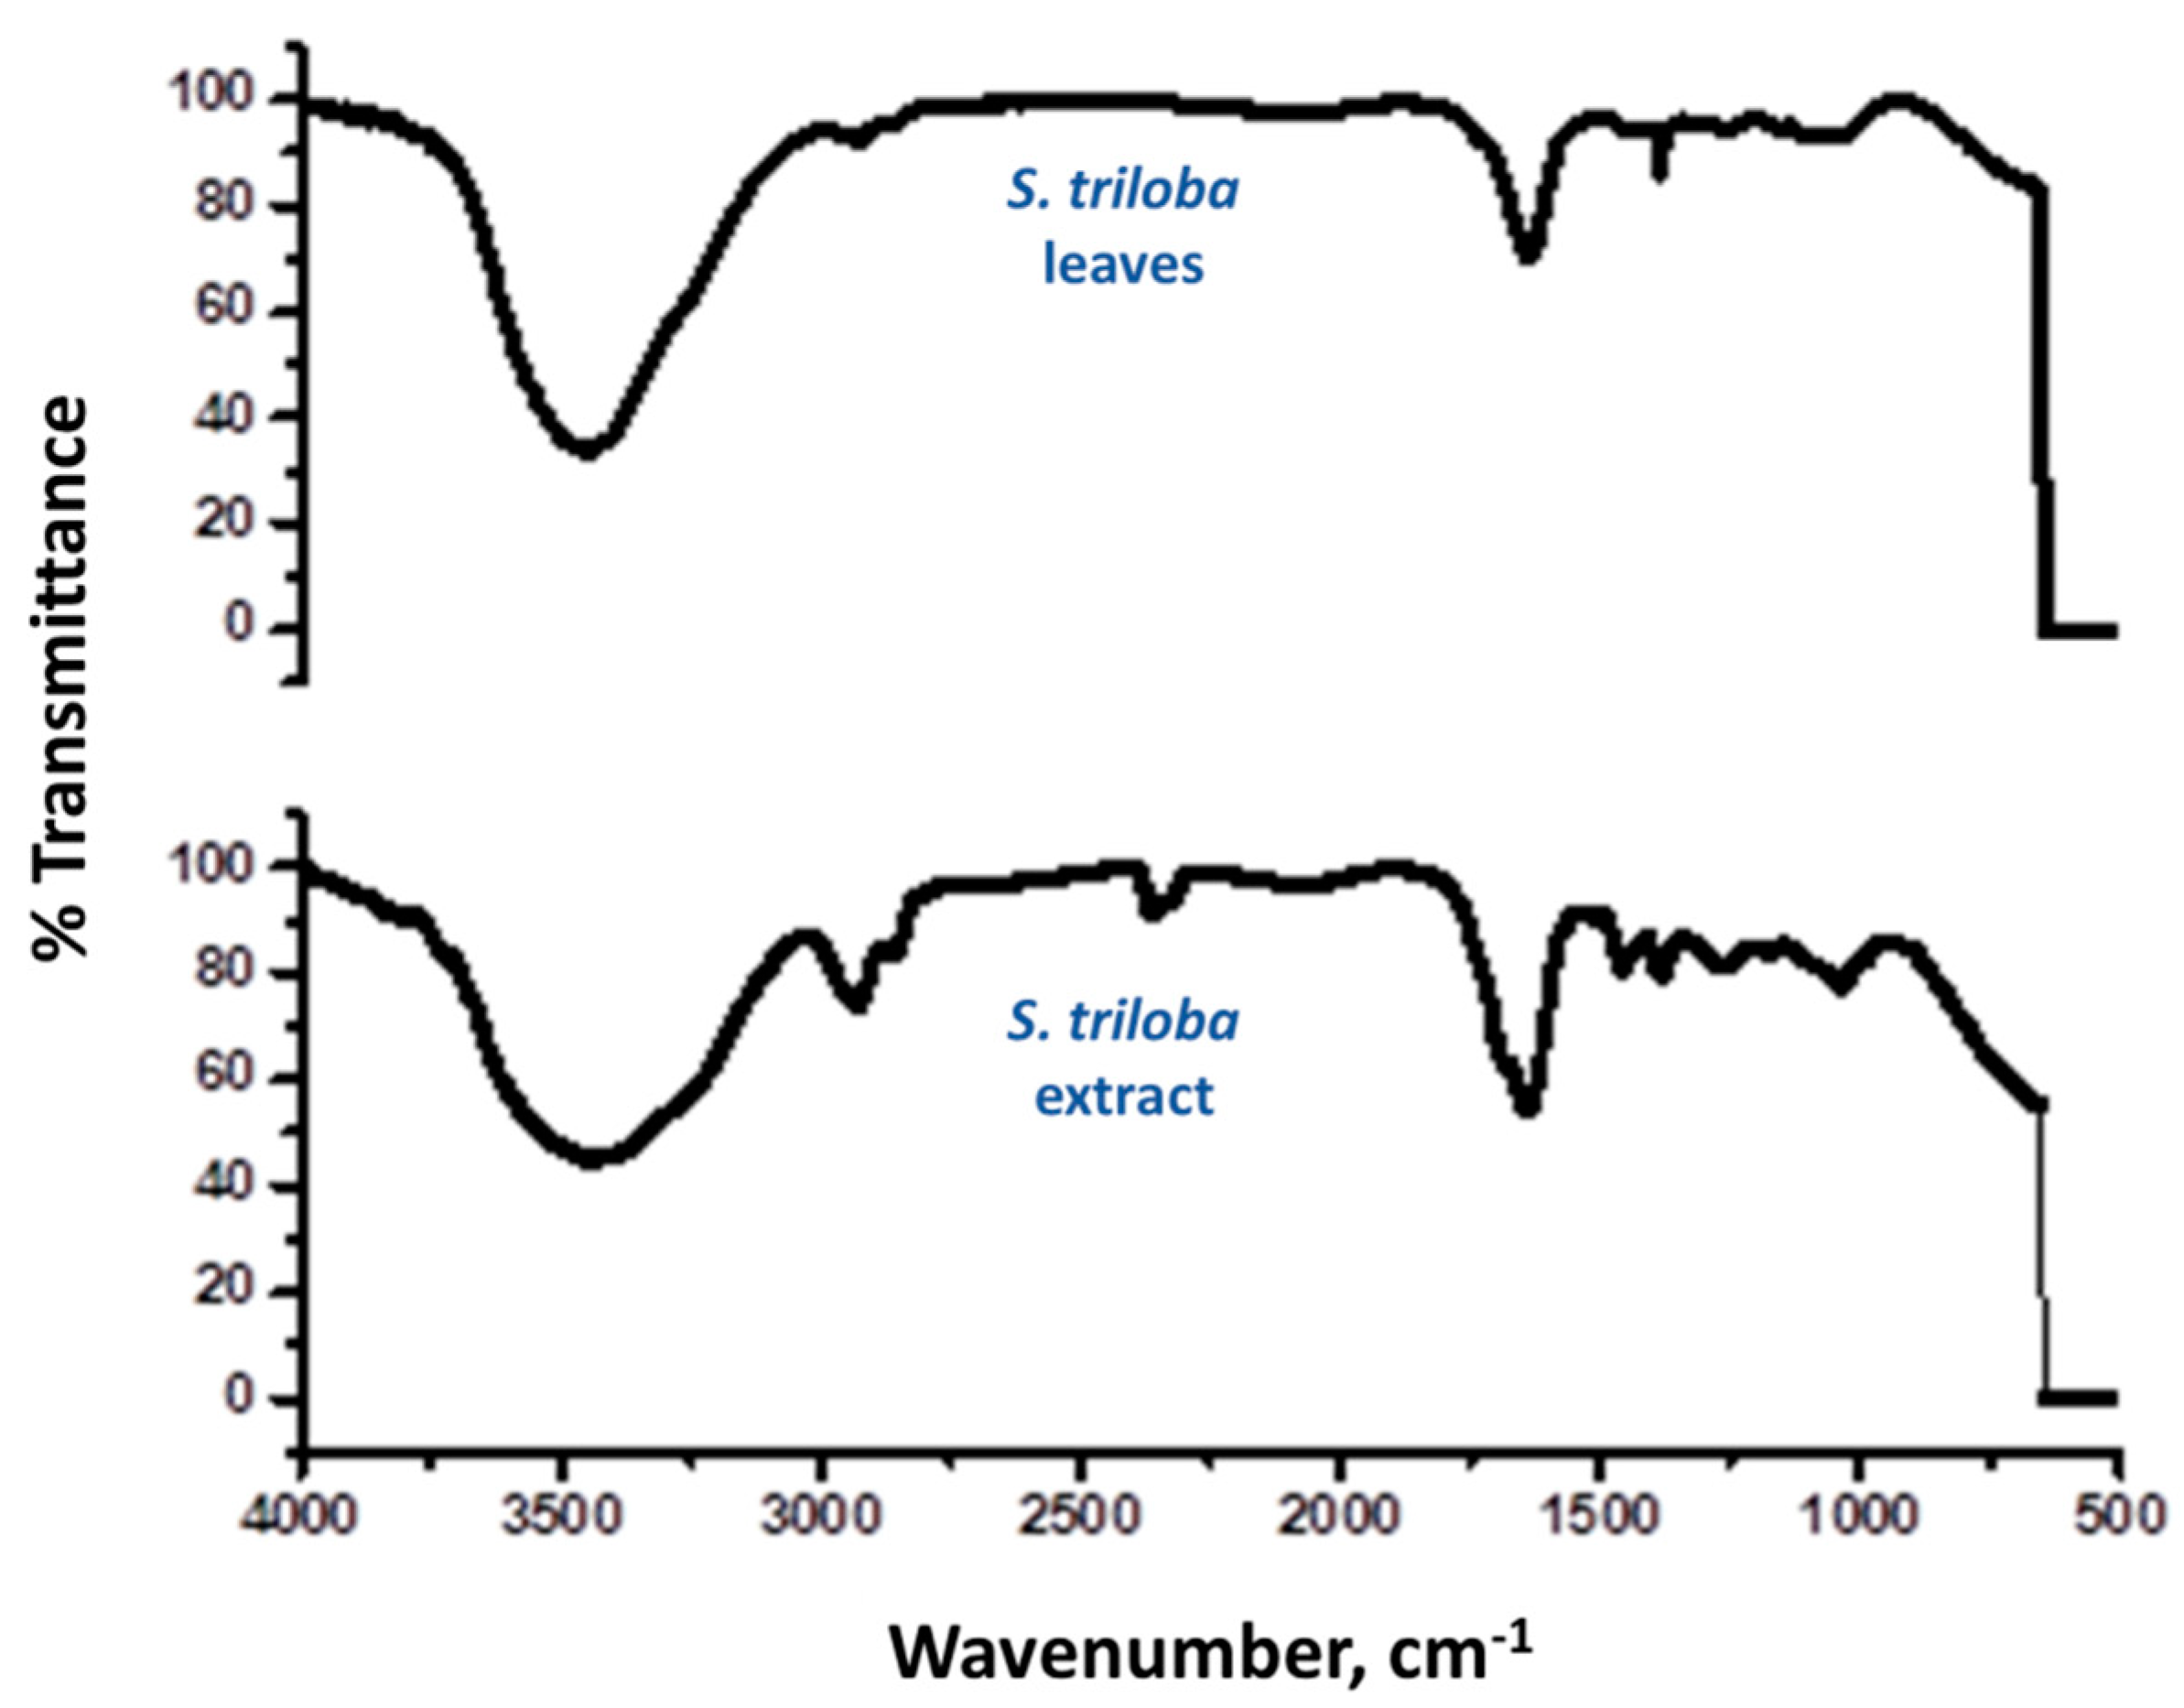
3.10. TLC-UV Fractionation and FTIR Measurements of Crude S. triloba Acetone Extract

TLC-UV fractionation of the acetone crude extract yielded four fractions (RF1, RF2, RF3, and RF4) with respective retention factors of 0.22, 0.39, 0.57, and 0.81. These varying retention factors indicated that the isolated fractions possessed a range of polarities, with RF1 displaying the least polarity, followed by RF2, RF3, and RF4 (Figure 10 and Table 8).
Furthermore, FTIR measurements were performed on the S. triliba leaves and their crude acetone extract, and the obtained spectra are shown in Figure 11. Similar peaks appear in both spectra which indicate that acetone extracted most of the major constituents of the leaves. Peaks at 3420 and 1383 cm−1 pertain to the respective stretching and bending of the OH phenolic groups [50,51]. The peaks at 2920 cm−1 can be attributed to the stretching vibration of the CH aliphatic groups that probably belong to terpenes [50]. In addition, the peaks corresponding to the carbonyl stretch of the carboxylic acid and ester groups appeared at 1728 and 1262 cm−1 [52], while the peaks appearing at 1650 and 1450 cm−1 can be ascribed to the vibrations of the uronic acid groups [53,54]. As for the 1109 cm−1 peak, it belongs to the acidic polysaccharides [51,55].

4. Discussion

4.1. S. triloba Acetone Extract Significantly Reduces U2OS and SKOV3 Cell Viability

In this study, we investigated the effects of crude S. triloba ethanol and acetone extracts on viability, migratory ability, and gene expression of various cancer cell lines. The effect of crude S. triloba extracts on the viability of U2OS, SKOV3, and HepG2 cells was variable. Although U2OS and SKOV3 cell viability declined significantly after treatment with S. triloba acetone extract, HepG2 viability was hardly affected by the S. triloba ethanol extract. As a result, HepG2 cells were excluded from further analyses. Although no prior studies have examined the cytotoxicity of S. triloba acetone extracts, bioactivities of both ethanolic, and methanolic extracts were previously reported [23,25,56,57]. S. triloba ethanolic extracts inhibited the proliferation of MCF7 and TD47 breast cancer cell lines with IC50 values of less than 30 µg/mL [57]. When tested on PC-3 and DU-145 prostate cancer cell lines, IC50 values of 287 μg/mL, and 456 μg/mL were respectively reported [23]. Our recorded IC50 values for S. triloba acetone extract against U2OS (30.210 μg/mL) and SKOV3 (75.960 μg/mL) cells were within the range of previously reported values (17.43 μg/mL to 456 μg/mL) for various cancer cell lines [23,25,56,57]. The observed variability in S. triloba IC50 can be attributed to differences in the type of cell line used per study. S. triloba further exhibited negligible cytotoxicity against the non-tumorigenic mammary cell line, MCF 10A, and such selective cytotoxicity against cancer cell lines supports its potential use in cancer therapy [23]. Treatment of SKOV3 cells with S. triloba yielded the greatest Hill Slope (6.678 ± 3.928) while U2OS cells displayed the least Hill Slope (0.8665 ± 0.137). The Hill Slope is equivalent to the Hill coefficient, which gives an idea of binding affinity between target macromolecules in U2OS and SKOV3 cells, and the ligands present in S. triloba extract [58]. A Hill coefficient equal to 1 indicates non-cooperative binding while a Hill coefficient either above or below 1, respectively, suggests positive and negative cooperative binding [59]. Our Hill coefficient results thus suggest that SKOV3 cells displayed a greater degree of cooperativity than U2OS cells when treated with S. triloba. This distinction could be attributed to differences in target macromolecules between U2OS and SKOV3 cells.

4.2. Selectivity Index of S. triloba for U2OS and SKOV3 Cells

Hek-293 cells (normal human embryonic kidney cells) were used to determine the SI of S. triloba treatment for both U2OS and SKOV3 cells. Between the two cell lines, S. triloba was 2.5 times more selective for U2OS cells than SKOV3 cells. Although S. triloba displayed moderate selectivity for U2OS cells, that of SKOV3 was relatively low. This difference in selectivity between U2OS and SKOV3 cell lines could be owed to the fact that the two cell lines are distinct and represent different type of cancer. It is suggested that SI values greater than one are favorable for treatment since they display greater therapeutic effect, with minimal toxicity to non-cancerous cells [60]. The relatively modest SI values observed for both U2OS and SKOV3 cells treated with S. triloba could be attributed to the fact that in addition to therapeutic compounds, the crude extract probably contains some toxic compounds, and chemical profiling to identify and remove such compounds is recommended [34]. Moreover, it is argued that selectivity indices can display significant variability due to their dependence on IC50 values which could in turn fluctuate based on differences in cell type, cell developmental stages, as well as initial cell densities [61]. Indeed, although Hek-293 cells used for SI calculation in this study are considered a common standard for normal human cells, they are reported to be tumorigenic [31]. Therefore, re-evaluation using a different biosystem(s) it is recommended for herbal drugs with selectivity indices between 1 and 10 [34].

4.3. The Combination of S. triloba Acetone Extract and Paclitaxel Exhibits Strong Synergism in SKOV3 Cells

Drug combinations are a foundational aspect of cancer therapy due to their ability to alleviate the toxicity of chemotherapy as well as prevent drug resistance. The use of two or more drugs in combination facilitates the targeting of multiple oncogenic pathways, eventually leading to either synergistic or additive responses. These responses ultimately permit the realization of high therapeutic effect at reduced dose [62,63,64]. A range of combination studies have examined the synergistic effect of combining plant secondary metabolites with clinical chemotherapeutics [65,66]. When combined with cisplatin, berberine induced both necroptotic and apoptotic cell death in OVCAR3 ovarian cancer cell lines [67]; similar observations were noted when the OV2008 human ovarian cancer cell line and their C13 variant (cisplatin resistant) were treated with a combination of curcumin and either cisplatin or oxaliplatin [68]. Furthermore, the green tea polyphenol derivative, epigallocatechin-3-gallate, re-sensitized 3 ovarian cancer cell lines (SKOV3, CAOV3, and C200 cells) to cisplatin by either 3 or more fold [69]. Since paclitaxel is a plant derived terpenoid [70], we thought it appropriate to have it tested in combination with S. triloba. Our expectation was that the combined structural complexity between paclitaxel and S. triloba would result in a synergistic effect when tested against SKOV3 cells. In this study, the combination of 19 µg/mL of acetone extract, and 0.787 µg/mL of paclitaxel displayed synergy (CI = 0.6415), and yielded an inhibition effect of 88.33%. We additionally determined the DRI values for each drug at this inhibition point. In a synergistic combination, the DRI provides a measure of the number of folds by which each drug dose can be reduced at a given effect level. DRI values above 1 indicate that the dose of a given drug can be reduced when used in combination. As such, DRI values less than 1 are unfavorable for dose reduction. Our obtained DRI values thus represented favorable dose reduction folds of approximately 28 and 1.6, for S. triloba and paclitaxel respectively [38,39]. These results imply that S. triloba contains secondary metabolites that could be utilized for adjuvant therapy [71], when combined with clinical chemotherapeutics.

4.4. S. triloba Acetone Extract and Its Combination with Paclitaxel Increase the Percentage of Non-Viable Cells in SKOV3 Cells

We employed the trypan blue assay to determine the percentage of non-viable (dead) U2OS and SKOV3 cells after treatment with either S. triloba acetone extract alone, or when in combination with paclitaxel. Although the percentage of non-viable U2OS cells increased by almost 18% after S. triloba treatment, the results displayed no statistical significance. Contrarily, the percentage of non-viable SKOV3 cells was significantly greater (44%) after S. triloba treatment. The greatest increase in non-viable cells (92%) was, however, observed when S. triloba acetone extract and paclitaxel were applied to SKOV3 cells in combination. Since trypan blue dye stains cells with disrupted membranes [41], it is probable that after S. triloba treatment, the observed reduction in SKOV3 cell viability in the MTT assay involves the induction of necrotic cell death pathways that induce a rapid loss in membrane integrity [72,73]. The activation of these pathways can be further amplified by the combination treatment. On the other hand, the decreased viability of U2OS cells in the MTT assay probably occur via other cell death pathways that do not lead to rapid losses in cell membrane integrity [72,73]. Besides this, S. triloba was reported to induce both apoptotic and necrotic cell death in T47D breast cancer cells through p21 [24].

4.5. S. triloba and Its Combination with Paclitaxel Respectively Display Anti-Migratory Properties in U2OS and SKOV3 Cells

Metastasis is the leading cause of cancer-related fatalities, and is a complex process involving cell- migration and invasion [74]. As such, we assessed the anti-migratory potential of S. triloba in both U2OS and SKOV3 cells using both the scratch-wound healing assay and the transwell migration assay. The wound healing assay displayed diminished migration of U2OS and SKOV3 cells after S. triloba treatment. On the other hand, after treatment with S. triloba, only U2OS cells displayed substantial declines in cell migration when the transwell assay was conducted. A significant decrease in SKOV3 cells was only observed for the combination treatment. Several plant derived phenolic compounds were shown to inhibit cancer cell migration by modulating a range of cellular process involved in epithelial-to-mesenchymal transition (EMT), cell invasion, and extravasation [75]. Carnosic acid, an abundant diterpene in S. triloba exhibited anti-migratory effects by down-regulating COX-2 in colorectal cancer [76,77,78]. Carnosic acid further blocked the migration of B16F10 melanoma cells through the inhibition of EMT [77,78]. Our results additionally suggest that the synergistic interaction between S. triloba and paclitaxel considerably improves the anti-migratory effect of either treatments. Xiaomeng and colleagues reported a marked increase in SKOV3 cell migration and invasion, along with a down regulation of E-cadherin and MTA3 after combined treatment with β-elemene and paclitaxel [79].

4.6. S. triloba and Its Combination with Paclitaxel Modulate the Steady-State mRNA Expression of Genes Involved in Cell Proliferation and Migration

The effect of S. triloba acetone extract on the steady-state mRNA expression of several markers implicated in both osteosarcoma and ovarian adenocarcinoma progression was further examined. Since the RUNX2, (PI3K)/AKT, p53, and β-catenin pathways are often abrogated in both osteosarcoma and ovarian adenocarcinoma, we evaluated how S. triloba affects the steady-state expression of key genes associated with these pathways.
The RUNX2 transcription factor is a regulator of both osteogenesis and osteogenic differentiation. Normally, RUNX2 acts as a suppressor or promotor of cell proliferation depending on either cell cycle stage or cell type. In osteosarcoma, RUNX2 expression is regularly elevated; moreover, evidence of increased RUNX2 DNA copy number, mRNA, and protein have been reported [80]. RUNX2 is also often upregulated in epithelial ovarian cancer tissue and this overexpression is generally associated with poor prognosis [81]. RUNX2 is further involved in regulating the transcription of multiple luteal related genes in murine ovaries, indicating that it likely plays vital roles in ovarian homeostasis [82]. Overall, RUNX2 is known to modulate diverse pathways such as those involved in cell proliferation, migration, and invasion [80].
p53, another key transcription factor implicated in cancer, serves to halt the proliferation of cells that either possess genetic alterations or are stressed [83]. One pathway by which p53 exerts its anti-proliferation effect is via induction of the intrinsic apoptotic pathway through the pro-apoptotic protein, BAX [84,85]. p53 mediates BAX expression either directly or indirectly through the Bcl-2 family protein Puma [86]. BAX mediates the principal event of the intrinsic apoptotic pathway, which is the release of cytochrome c from the mitochondria into the cytosol, ultimately leading to cell death [87,88]. Additionally, p53 activity is regulated by multiple posttranslational modifications that influence its stability. The principle antagonist of p53 is the E3 ubiquitin ligase, MDM2 that marks p53 for proteasomal degradation. MDM2 thus maintains low p53 levels through an autoregulatory negative feedback loop with p53. Conversely the methyl transferase, SETD7, is reported to regulate various genes including p53. SETD7 promotes p53 stabilization along with inhibiting its nuclear export via p53 methylation [89]. Several studies have suggested that SETD7 methylation is essential for p53 activity, however there is growing evidence that by itself, SETD7 could be insufficient for p53 activation, and that its absence is likely compensated for by other pathways that are yet to be discovered [90].
Similarly, the PI3K/AKT pathway is often over activated in several cancers, including both osteosarcoma and ovarian cancer. The PI3K/AKT pathway is reported to promote cell proliferation, migration, invasion, tumorigenesis, metastasis and chemo-resistance [91,92]. Aberrations in the PI3K/AKT pathway are most likely essential for the development and progression of both osteosarcoma and ovarian cancer, since alterations in the pathway were reported in 100% of advanced-stage osteosarcomas and 70% of ovarian cancer cases [91,92].
Finally, the β-catenin pathway plays a critical role in regulating various cellular processes such as cell fate, polarity, and migration, in addition to neural development, and organogenesis during embryonic development [93]. This pathway is regulated by Wnt glycoproteins which initiate a signaling cascade that eventually leads to phosphorylation of the β-catenin destruction complex and accumulation of unphosphorylated β-catenin. Unphosphorylated β-catenin functions as a coactivator of several downstream target genes when translocated to the nucleus [94,95]. Aberrant Wnt signaling is reported to either initiate or drive the progression of a variety of cancers including colorectal cancer [96], breast cancer [97], hepatocellular carcinoma (HCC) [98], as well as bone [99] and ovarian cancer [100]. β-catenin deregulation is further reported in SKOV3 cells, and mechanisms for deregulation include either mutations in the CTNNB1 gene that encode β-catenin, or mutational inactivation of the β-catenin destruction complex proteins (APC, AXIN1, and AXIN2) [101].
Several plant-based bioactive compounds have been reported to affect gene expression by modulating various interrelated oncogenic transcription factors including RUNX2, p53, and Wnt/B-catenin [102,103,104,105,106]. RUNX2 was implicated in p53 regulation after DNA damage by possibly interacting with HDAC6 to impede p53 mediated pro-apoptotic activity [107,108]. It was further suggested that RUNX2 neutralizes p53 activity through its ability to prevent p53 induced apoptosis [109]. Additionally, stabilization of p53 by inhibiting MDM2 decreased RUNX2 protein expression [110]. RUNX2 activation during osteoblast differentiation was also dependent on p53 inhibition by MDM2 [111]. Both RUNX2 and MDM2 were downregulated in SKOV3 cells after S. triloba treatment. In contrast, MDM2 expression was upregulated in U2OS cells despite RUNX2 downregulation. Our Transfac database [44] analysis predicted the presence of several RUNX2 transcription factor binding sites within the MDM2 promoter region. The predicted consensus sequence most likely acts as either positive or negative regulatory elements in different cellular contexts. When bound to the consensus AML site (TG[T/C]GGT), both RUNX1 and RUNX2 negatively regulated promoter activity of the human CLC gene [112,113]. However, Makita and colleagues noted that different RUNX2 isoforms can either up- or downregulate their target genes [114] when bound to the consensus RUNX2 site (5′-AACCAC-3′) [115]. Moreover, S. triloba did not significantly alter p53 expression in both SKOV3 and U2OS cells. Abu-Dahab and colleagues reported that S. triloba did not affect p53 protein levels in breast cancer cell lines [24]. Hence, it is likely that RUNX2 affects MDM2 activity independent of p53. On the other hand, no RUNX2 transcription factor binding sites were predicted for the SETD7 gene. SETD7 upregulation after S. triloba treatment suggests possible p53 stabilization [90] in U2OS cells. Nevertheless, SETD7 expression in SKOV3 cells declined after treatment with S. triloba. This disparity in SETD7 expression implies that the regulatory pathways modulating SETD7 differ from one cellular context to another. Besides, SETD7 was unessential for p53 activation in mouse models [90].
The expression of some genes involved with the RUNX2 and p53 pathways was also assessed after S. triloba treatment. Vimentin and N-cadherin expression was significantly decreased in U2OS cells after treatment with S. triloba. Conversely, although N-cadherin expression in SKOV3 cells declined, the result was not statistically significant. Vimentin and N-cadherin have been implicated as markers of epithelial–mesenchymal transition (EMT) by modulating cell migration and invasion [48,116]. Generally, N-cadherin promotes both cell migration and invasion in cancer [117], and its expression is correlated with poor survival in ovarian cancer [118]. A few studies however reported that N-cadherin displayed anti-oncogenic properties in both human osteosarcoma tumors and mouse osteosarcoma cell lines where it was downregulated [119]. The downregulation of N-cadherin in U2OS cells by S. triloba suggests an amelioration of osteosarcoma pathology; nevertheless, the exact role of N-cadherin in osteosarcoma progression remains to be elucidated. Similarly, although the exact role of vimentin in cancer progression and EMT remains unclear, its overexpression is correlated with increased tumor progression, metastasis, invasion and poor prognosis [120]. Finally, the reduced expression of BAX in SKOV3 cells infers that the observed decrease in cell viability after S. triloba treatment was independent of BAX mediated apoptosis [121,122].
There is growing evidence that both RUNX2 and the PI3K/AKT pathway interact either directly or indirectly to drive tumor progression [123]. On one hand, AKT activity most likely promotes RUNX2 mRNA upregulation, protein stabilization, and transcription activity; while on the other hand, RUNX2 activity stimulates the transcription of PI3K and AKT, along with components of the mTOR complex [123]. Since S. triloba treatment significantly reduced the expression of both RUNX2 and PI3K in U2OS cells, it is possible that S. triloba contains bioactive compounds such as phenolic acids, flavonoids, and terpenes [21,22], that either mutually or independently target both RUNX2 and PI3K/AKT signaling. Several isoflavones including genistein, linarin, and hesperetin promoted osteoblast differentiation through RUNX2 pathway activation [124,125,126], while sulfuretin did so via dual activation of both RUNX2 and AKT signaling [127]. Additionally when tested in osteoperotic rats, the total flavonoids of Rhizoma drynariae downregulated RUNX2, but upregulated PI3K, AKT and mTOR protein expression [128]. Intriguingly, S. triloba downregulated PTEN (inhibitor of PI3K/AKT pathway) expression in SKOV3 cells. As such, the effect of S. triloba on the PI3K/AKT pathway most likely varies from one cell line to another. β-catenin was also significantly downregulated by S. triloba. As observed in Salvia miltiorrhizae, S. triloba probably increases the ratio of phosphorylated GSK3β while decreasing that of phosphorylated β-catenin [129]. However, making a definitive conclusion necessitates assessing the relative amounts of phosphorylated GSK3β and β-catenin at the protein level.
The observed synergistic effect of the combination treatment could be attributed to its ability to notably upregulate p53 expression while downregulating RUNX2 and β-catenin. Nonetheless, mutations were reported in the p53 gene for SKOV3 cells, and both p53 transcripts and protein were undetectable [130,131,132]. Although we identified p53 mRNA in SKOV3 cells, the relatively high cycle threshold values (ranging from 29.791 to 35.983) suggest meager expression [133] in both treated and untreated SKOV3 cells. Additionally, in spite of the fact that paclitaxel induces elevated p53 expression [134], it can trigger p53-independent apoptosis as well [135,136,137]. Therefore, the combination of S. triloba and paclitaxel could have decreased SKOV3 cell viability and migration apart from p53.

4.7. S. triloba Acetone Extract Does Not Induce Hemolysis in Human Erythrocytes

Lysis of the erythrocyte membrane is a regular side effect of chemotherapeutic drugs. One of the potential strategies to alleviate chemotherapeutic-induced hemolysis is co-administration of plant derived agents [138]. Several plant based metabolites are potent antioxidants that protect the lipid-rich erythrocyte cell membrane from drug-induced oxidation, and eventual lysis. Phenolics such as caffeic, rosmarinic, and carnosic acids, along with flavonoids such as kaempferol and quercetin possess effective antioxidant potential [138,139]. The abundance of these phytochemicals among Salvia species [21] could explain why our extract exhibited negligible hemolytic effect.

4.8. TLC-UV Fractionation of Crude S. triloba Acetone Extract

TLC can be used to separate a mixture of compounds based on relative polarity. Compounds that possess lower polarities with respect to the mobile phase will travel much further along the stationary phase than those with higher polarities. Consequently, highly polar compounds display greater Rf values than their moderately polar counterparts [140]. Rf values for the four fractions generated by the S. triloba acetone extract ranged from approximately 0.2 to 0.8. This indicates that the extract contained a mixture of both high and moderately polar compounds whose bioactivities and composition require further investigation.

4.9. FTIR of S. triloba Leaves and Its Crude Acetone Extract

The similarity in the FTIR spectra of the leaves and its crude acetone extract suggests that they both have the same main functional groups which likely belong to the phenolic compounds, terpenes and polysaccharides. Previous work on S. triloba aerial parts collected from El-Sheikh Zoaid in Sinai, Egypt reported the presence of triterpenes, phenolic acids and flavonoids [141]. Several reports on Salvia species such as S. nemorosa L., S. fruticosa, S. verticillata, S. trichoclada, S. suffruticosa, S. miltiorrhiza and S. officinalis, and their extracts identified terpenoids, flavonoids and phenolic acids as the major constituents responsible for their potent biological activities [142,143,144,145,146,147]. Acidic polysaccharides were also obtained from Salvia officinalis L. by aqueous extraction followed by ion-exchange chromatography fractionation, and they showed immunomodulatory activity. Prior to fractionation, the polysaccharide extract was confirmed to contain uronic acids along with a mixture of monosaccharides such as arabinose, galactose, and glucose [148].

5. Conclusions

As a whole, our results indicate that the crude acetone extract of S. triloba posesses anti-proliferative and migratory effects against U2OS and SKOV3 cells, which respectively represent models of osteosarcoma and ovarian carcinoma. These anti-oncogenic effects could be further potentiated by the extract’s ability to modulate the steady-state mRNA expession of key targets, such as RUNX2, that promote the progression of both bone and ovarian cancers. Furthermore, co-administering S. triloba with paclitaxel may permit appropriate dose reduction of paclitaxel, while potentially alleviating chemotherapy induced hemolysis. The potent biological activity of the extract could be owed to their phenolic, terpenoid, flavonoid, and polysaccharide contents as suggested by the FTIR measurements along with previous literature reports. To fully elucidate the structure–activity relationships, we recommend further chemical profiling and identification of the bioactive constituents of S. triloba extracts, in addition to testing their activity in vivo.

Supplementary Materials

The following supporting information can be downloaded at: https://www.mdpi.com/article/10.3390/app122211545/s1, Table S1: Summary of S. triloba acetone extract IC50 values in U2OS and SKOV3 cells; Table S2: IC50 of treatments on Hek-293 cell viability; Table S3: Summary of U2OS and SKOV3 selectivity index values; Table S4: qPCR primer sequences; Figure S1: Effect of S. triloba ethanol extract on U2OS cell viability. (A) The S. triloba ethanol extract exhibited negligible effect on U2OS cell viability after 48 h exposure. (B) U2OS cell viability was significantly reduced by more than 50% after incubation with cisplatin (48 h) at all examined concentrations; cisplatin served as a positive control for U2OS cells. Figure S2: Effect of S. triloba ethanol extract on HepG2 cell viability and morphology; Figure S3: DMSO solvent does not affect U2OS and SKOV3 cell viability; Figure S4: Hek-293 dose–response curves (A) Dose response curve for S. triloba acetone extract on Hek293 cells. The percentage viability was normalized to a scale from 0 to 150 and S. triloba IC50 value was 75.8 ± 1.060. (B) Dose–response curve of paclitaxel on Hek-293 cells. The percentage viability was normalized to a scale from 0 to 150 and paclitaxel IC50 value was 4.142 ± 1.132 µg/mL. (C) Dose–response curve of cisplatin on Hek-293 cells The percentage viability was normalized to a scale from 0 to 150 and cisplatin IC50 value was 1.69 ± 0.868 µg/mL; File S1: CompySyn report.

Author Contributions

Conceptualization, A.A.; formal analysis, N.A.M.S., R.B.E.-d.A.E.-b., E.Z.M., H.L.E., M.M.H.E.-S., M.S.S., H.F.E., M.A.A.W., R.A. and A.A.; funding acquisition, N.A.M.S., R.B.E.-d.A.E.-b., E.Z.M., M.S.S., H.F.E., M.A.A.W. and A.A.; investigation, N.A.M.S., R.B.E.-d.A.E.-b., E.Z.M., H.L.E., M.M.H.E.-S., M.S.S., H.F.E. and M.A.A.W.; methodology, N.A.M.S., R.B.E.-d.A.E.-b., E.Z.M., H.L.E., M.M.H.E.-S., M.S.S., H.F.E., M.A.A.W., R.A. and A.A.; project administration, A.A.; resources, R.A. and A.A.; supervision, A.A.; validation, N.A.M.S., R.B.E.-d.A.E.-b., E.Z.M., H.L.E., M.M.H.E.-S., H.F.E., M.A.A.W., R.A. and A.A.; visualization, N.A.M.S., R.B.E.-d.A.E.-b., E.Z.M., H.L.E., M.M.H.E.-S., M.S.S., H.F.E. and M.A.A.W.; writing—original draft, N.A.M.S., R.B.E.-d.A.E.-b. and E.Z.M.; writing—review and editing, N.A.M.S., R.B.E.-d.A.E.-b., E.Z.M., H.L.E., M.M.H.E.-S., M.S.S., H.F.E., M.A.A.W., R.A. and A.A. All authors have read and agreed to the published version of the manuscript.

Funding

This research was funded by Bartlett Foundation Fund for Critical Challenges Grant (grant no. SSE-Bio-A.A-FY19-FY20) for AA and Student Research Grants for N.A.M.S., R.B.E.-d.A.E.-b., M.S.S., H.F.E. and M.A.A.W. from The American University in Cairo.

Institutional Review Board Statement

The study was conducted in accordance with the Declaration of Helsinki, and approved by the Institutional Review Board of The American University in Cairo (protocol code 2018-2019-129 and approved on 11 May 2019).

Informed Consent Statement

Informed consent was obtained from all subjects involved in the study.

Data Availability Statement

The data presented in this study are available both in this article and respective Supplementary Material.

Acknowledgments

We thank Ahmed Abdellatif for his critical reading of the manuscript. The graphical abstract was created with BioRender.com.

Conflicts of Interest

The authors declare no conflict of interest. The funders had no role in the design of the study; in the collection, analyses, or interpretation of data; in the writing of the manuscript, or in the decision to publish the results.

References

  1. Sung, H.; Ferlay, J.; Siegel, R.L.; Laversanne, M.; Soerjomataram, I.; Jemal, A.; Bray, F. Global Cancer Statistics 2020: GLOBOCAN Estimates of Incidence and Mortality Worldwide for 36 Cancers in 185 Countries. CA Cancer J. Clin. 2021, 71, 209–249. [Google Scholar] [CrossRef] [PubMed]
  2. IARC, T.I.A. for R. on C. Latest Global Cancer Data: Cancer Burden Rises to 19.3 Million New Cases. Available online: https://www.iarc.who.int/wp-content/uploads/2020/12/pr292_E.pdf (accessed on 9 September 2021).
  3. Jaffe, N.; Bruland, O.S.; Bielack, S.S. (Eds.) Pediatric and Adolescent Osteosarcoma; Cancer treatment and research; Springer: New York, NY, USA, 2009; ISBN 978-1-4419-0283-2. [Google Scholar]
  4. Eleutério, S.J.P.; Senerchia, A.A.; Almeida, M.T.; Costa, C.M.D.; Lustosa, D.; Calheiros, L.M.; Barreto, J.H.S.; Brunetto, A.L.; Macedo, C.R.P.D.; Petrilli, A.S. Osteosarcoma in Patients Younger than 12 Years Old without Metastases Have Similar Prognosis as Adolescent and Young Adults: Osteosarcoma in Children and AYA. Pediatr. Blood Cancer 2015, 62, 1209–1213. [Google Scholar] [CrossRef] [PubMed]
  5. American Cancer Society Key Statistics for Osteosarcoma. Available online: https://www.cancer.org/cancer/osteosarcoma/about/key-statistics.html (accessed on 19 May 2020).
  6. Taran, S.; Taran, R.; Malipatil, N. Pediatric Osteosarcoma: An Updated Review. Indian J. Med. Paediatr. Oncol. 2017, 38, 33. [Google Scholar] [CrossRef] [PubMed] [Green Version]
  7. Lauvrak, S.U.; Munthe, E.; Kresse, S.H.; Stratford, E.W.; Namløs, H.M.; Meza-Zepeda, L.A.; Myklebost, O. Functional Characterisation of Osteosarcoma Cell Lines and Identification of MRNAs and MiRNAs Associated with Aggressive Cancer Phenotypes. Br. J. Cancer 2013, 109, 2228–2236. [Google Scholar] [CrossRef] [PubMed]
  8. Momenimovahed, Z.; Tiznobaik, A.; Taheri, S.; Salehiniya, H. Ovarian Cancer in the World: Epidemiology and Risk Factors. Int. J. Womens Health 2019, 11, 287–299. [Google Scholar] [CrossRef] [PubMed] [Green Version]
  9. WOCC World Ovarian Cancer Coalition. Available online: https://worldovariancancercoalition.org/about-ovarian-cancer/key-stats/ (accessed on 1 September 2020).
  10. Shaw, T.J.; Senterman, M.K.; Dawson, K.; Crane, C.A.; Vanderhyden, B.C. Characterization of Intraperitoneal, Orthotopic, and Metastatic Xenograft Models of Human Ovarian Cancer. Mol. Ther. 2004, 10, 1032–1042. [Google Scholar] [CrossRef]
  11. ATCC U-2 OS (ATCC® HTB-96TM). Available online: https://www.lgcstandards-atcc.org/Products/All/HTB-96.aspx?geo_country=eg#characteristics (accessed on 16 April 2020).
  12. Allan, L.A.; Fried, M. P53-Dependent Apoptosis or Growth Arrest Induced by Different Forms of Radiation in U2OS Cells: P21WAF1/CIP1 Repression in UV Induced Apoptosis. Oncogene 1999, 18, 5403–5412. [Google Scholar] [CrossRef] [Green Version]
  13. ATCC, A.T.C.C. SK-OV-3 [SKOV-3; SKOV3]. Available online: https://www.atcc.org/products/htb-77 (accessed on 24 August 2021).
  14. Jelovac, D.; Armstrong, D.K. Recent Progress in the Diagnosis and Treatment of Ovarian Cancer. CA. Cancer J. Clin. 2011, 61, 183–203. [Google Scholar] [CrossRef]
  15. Cragg, G.M.; Newman, D.J. Plants as a Source of Anti-Cancer Agents. J. Ethnopharmacol. 2005, 100, 72–79. [Google Scholar] [CrossRef] [Green Version]
  16. Ahl, H.S.-A.; Hussein, M.S.; Gendy, A.S.H.; Tkachenko, K.G. Quality of Sage (Salvia officinalis L.) Essential Oil Grown in Egypt. Int. J. Plant Sci. Ecol. 2015, 1, 119–123. [Google Scholar]
  17. Shahidi, F. (Ed.) Handbook of Antioxidants for Food Preservation; Woodhead Publishing series in food science, technology and nutrition; Elsevier: Cambridge, UK; Waltham, MA, USA, 2015; ISBN 978-1-78242-089-7. [Google Scholar]
  18. Gali-Muhtasib, H. Anticancer and Medicinal Properties of Essential Oil and Extracts of East Mediterranean Sage (Salvia triloba). In Advances in Phytomedicine; Elsevier: Amsterdam, The Netherlands; Boston, MA, USA, 2006; Volume 2, pp. 169–180. ISBN 978-0-444-51619-0. [Google Scholar]
  19. The British Pharmaceutical Codex, 1923: An Imperial Dispensatory for the Use of Medical Practitioners and Pharmacists. Nature 1923, 112, 859. [CrossRef]
  20. Council of Europe; European Pharmacopoeia Commission; European Directorate for the Quality of Medicines & Healthcare. European Pharmacopoeia, 7th ed.; Council of Europe, European Directorate for the Quality of Medicines and Healthcare: Strasbourg, France, 2010; ISBN 978-92-871-6700-2. [Google Scholar]
  21. Lopresti, A.L. Salvia (Sage): A Review of Its Potential Cognitive-Enhancing and Protective Effects. Drugs RD 2017, 17, 53–64. [Google Scholar] [CrossRef] [PubMed] [Green Version]
  22. Topçu, G.; Öztürk, M.; Kuşman, T. Terpenoids, essential oil composition, fatty acid profile, and biological activities of Anatolian Salvia fruticosa Mill. Turk. J. Chem. 2013, 37, 619–632. [Google Scholar] [CrossRef]
  23. Atmaca, H.; Bozkurt, E. Apoptotic and Anti-Angiogenic Effects of Salvia Triloba Extract in Prostate Cancer Cell Lines. Tumor Biol. 2016, 37, 3639–3646. [Google Scholar] [CrossRef]
  24. Abu-Dahab, R.; Abdallah, M.R.; Kasabri, V.; Mhaidat, N.M.; Afifi, F.U. Mechanistic Studies of Antiproliferative Effects of Salvia Triloba and Salvia Dominica (Lamiaceae) on Breast Cancer Cell Lines (MCF7 and T47D). Z. Fur Nat. C 2014, 69, 443–451. [Google Scholar] [CrossRef]
  25. Al-Kalaldeh, J.Z.; Abu-Dahab, R.; Afifi, F.U. Volatile Oil Composition and Antiproliferative Activity of Laurus Nobilis, Origanum Syriacum, Origanum Vulgare, and Salvia Triloba against Human Breast Adenocarcinoma Cells. Nutr. Res. 2010, 30, 271–278. [Google Scholar] [CrossRef]
  26. Zihlif, M.; Afifi, F.; Abu-Dahab, R.; Abdul Majid, A.M.S.; Somrain, H.; Saleh, M.M.; Nassar, Z.D.; Naffa, R. The Antiangiogenic Activities of Ethanolic Crude Extracts of Four Salvia Species. BMC Complement. Altern. Med. 2013, 13, 358. [Google Scholar] [CrossRef] [Green Version]
  27. Danin, A.; Fragman-Sapir, O. Flora of Israel Online. Available online: https://flora.org.il/en/plants/salfru/ (accessed on 2 September 2021).
  28. Kim, D.; Lee, C.Y. Extraction and Isolation of Polyphenolics. Curr. Protoc. Food Anal. Chem. 2002, 6, I1.2.1–I1.2.12. [Google Scholar] [CrossRef]
  29. Ponten, J.; Saksela, E. Two Established in Vitro Cell Lines from Human Mesenchymal Tumours. Int. J. Cancer 1967, 2, 434–447. [Google Scholar] [CrossRef]
  30. Fogh, J.; Fogh, J.M.; Orfeo, T. One Hundred and Twenty-Seven Cultured Human Tumor Cell Lines Producing Tumors in Nude Mice23. JNCI J. Natl. Cancer Inst. 1977, 59, 221–226. [Google Scholar] [CrossRef]
  31. ATCC 293 [HEK-293]. Available online: https://www.atcc.org/products/crl-1573 (accessed on 25 October 2022).
  32. Riss, T.L.; Moravec, R.A.; Niles, A.L.; Duellman, S.; Benink, H.A.; Worzella, T.J.; Minor, L. Cell Viability Assays. In Assay Guidance Manual; Sittampalam, G.S., Coussens, N.P., Brimacombe, K., Grossman, A., Arkin, M., Auld, D., Austin, C., Baell, J., Bejcek, B., Caaveiro, J.M.M., et al., Eds.; Eli Lilly & Company and the National Center for Advancing Translational Sciences: Bethesda, MD, USA, 2004. [Google Scholar]
  33. Graphpad Software Inc. GraphPad Prism Version 6.01 for Windows, GraphPad Software, La Jolla California USA. Available online: www.Graphpad.com (accessed on 24 July 2020).
  34. Indrayanto, G.; Putra, G.S.; Suhud, F. Validation of In-Vitro Bioassay Methods: Application in Herbal Drug Research. Profiles Drug Subst. Excip. Relat. Methodol. 2021, 46, 273–307. [Google Scholar]
  35. Sahu, S.C.; Hayes, A.W. Toxicity of Nanomaterials Found in Human Environment: A Literature Review. Toxicol. Res. Appl. 2017, 1, 2397847317726352. [Google Scholar] [CrossRef]
  36. Peng, H.; Zhang, X.; Wei, Y.; Liu, W.; Li, S.; Yu, G.; Fu, X.; Cao, T.; Deng, X. Cytotoxicity of Silver Nanoparticles in Human Embryonic Stem Cell-Derived Fibroblasts and an L-929 Cell Line. J. Nanomater. 2012, 2012, 160145. [Google Scholar] [CrossRef] [Green Version]
  37. Sooklert, K.; Chattong, S.; Manotham, K.; Boonwong, C.; Klaharn, I.; Jindatip, D.; Sereemaspun, A. Cytoprotective Effect of Glutaraldehyde Erythropoietin on HEK293 Kidney Cells after Silver Nanoparticle Exposure. Int. J. Nanomed. 2016, 11, 597. [Google Scholar]
  38. Chou, T.-C. Drug Combination Studies and Their Synergy Quantification Using the Chou-Talalay Method. Cancer Res. 2010, 70, 440–446. [Google Scholar] [CrossRef] [PubMed] [Green Version]
  39. Chou, T.-C. Theoretical Basis, Experimental Design, and Computerized Simulation of Synergism and Antagonism in Drug Combination Studies. Pharmacol. Rev. 2006, 58, 621–681. [Google Scholar] [CrossRef]
  40. Chou, T.-C.; Martin, N. CompuSyn for Drug Combinations User’s Guide; ComboSyn, Inc.: Paramus, NJ, USA, 2005. [Google Scholar]
  41. Strober, W. Trypan Blue Exclusion Test of Cell Viability. In Current Protocols in Immunology; Coligan, J.E., Bierer, B.E., Margulies, D.H., Shevach, E.M., Strober, W., Eds.; John Wiley & Sons, Inc.: Hoboken, NJ, USA, 2001; ISBN 978-0-471-14273-7. [Google Scholar]
  42. Boleman, A.I.; Tănasie, G.; Găluşcan, A.; Cristea, M.I.; Bojin, F.M.; Panaitescu, C.; Păunescu, V. Studies Regarding the In Vitro Wound Healing Potential of Mouse Dental Pulp Stem-Like Progenitor Cells. Biotechnol. Biotechnol. Equip. 2012, 26, 2781–2785. [Google Scholar] [CrossRef] [Green Version]
  43. Ganger, M.T.; Dietz, G.D.; Ewing, S.J. A Common Base Method for Analysis of QPCR Data and the Application of Simple Blocking in QPCR Experiments. BMC Bioinform. 2017, 18, 534. [Google Scholar] [CrossRef]
  44. Matys, V. TRANSFAC(R) and Its Module TRANSCompel(R): Transcriptional Gene Regulation in Eukaryotes. Nucleic Acids Res. 2006, 34, D108–D110. [Google Scholar] [CrossRef] [Green Version]
  45. Malagoli, D. A Full-Length Protocol to Test Hemolytic Activity of Palytoxin on Human Erythrocytes. Invertebr. Surviv. J. 2007, 4, 92–94. [Google Scholar]
  46. Nichols, L. Visualizing TLC Plates. Available online: https://chem.libretexts.org/Bookshelves/Organic_Chemistry/Book%3A_Organic_Chemistry_Lab_Techniques_(Nichols)/02%3A_Chromatography/2.03%3A_Thin_Layer_Chromatography_(TLC)/2.3F%3A_Visualizing_TLC_Plates (accessed on 8 September 2021).
  47. Bryne, J.C. E-MTAB-1828-ChIP-Seq of Human (Un)Differentiated Mesenchymal Stem Cells and Normal Osteoblasts with Antibodies against Various Histone H3 Modifications and RUNX2 to Study the Regulatory Landscape of Osteogenic Differentiation. Available online: https://www.ebi.ac.uk/arrayexpress/experiments/E-MTAB-1828/ (accessed on 1 September 2020).
  48. Liu, Z.; Merkurjev, D.; Rosenfeld, M. Enhancer Activation Requires Trans-Recruitment of a Mega Transcription Factor Complex (ChIP-Seq). Available online: https://www.ncbi.nlm.nih.gov/geo/query/acc.cgi?acc=GSE60270 (accessed on 1 September 2020).
  49. Little, G.; Noushmehr, H.; Baniwal, S.; Berman, B.; Coetzee, G.; Frenkel, B. Genome-Wide Runx2 Occupancy in Prostate Cancer Cells Suggests a Role in Regulating Secretion. Available online: https://www.ncbi.nlm.nih.gov/geo/query/acc.cgi?acc=GSE33889 (accessed on 1 September 2020).
  50. Naziruddin, M.A.; Kian, L.K.; Jawaid, M.; Fouad, H.; Sanny, M.; Braganca, R.M. Sage Biomass Powders by Supercritical Fluid Extraction and Hydro-Distillation Techniques: A Comparative Study of Biological and Chemical Properties. Biomass Convers. Biorefin. 2021. [Google Scholar] [CrossRef]
  51. Essa, H.L.; Abdelfattah, M.S.; Marzouk, A.S.; Guirguis, H.A.; El-Sayed, M.M.H. Nano-Formulations of Copper Species Coated with Sulfated Polysaccharide Extracts and Assessment of Their Phytotoxicity on Wheat (Triticum aestivum L.) Seedlings in Seed Germination, Foliar and Soil Applications. Appl. Sci. 2020, 10, 6302. [Google Scholar] [CrossRef]
  52. Abou El Azm, N.; Fleita, D.; Rifaat, D.; Mpingirika, E.Z.; Amleh, A.; El-Sayed, M.M.H. Production of Bioactive Compounds from the Sulfated Polysaccharides Extracts of Ulva Lactuca: Post-Extraction Enzymatic Hydrolysis Followed by Ion-Exchange Chromatographic Fractionation. Molecules 2019, 24, 2132. [Google Scholar] [CrossRef] [PubMed] [Green Version]
  53. Fleita, D.; El-Sayed, M.; Rifaat, D. Evaluation of the Antioxidant Activity of Enzymatically-Hydrolyzed Sulfated Polysaccharides Extracted from Red Algae; Pterocladia capillacea. LWT Food Sci. Technol. 2015, 63, 1236–1244. [Google Scholar] [CrossRef]
  54. Essa, H.L.; Guirguis, H.A.; El-Sayed, M.M.H.; Rifaat, D.; Abdelfattah, M.S. Ultrasonically-Extracted Marine Polysaccharides as Potential Green Antioxidant Alternatives. In Proceedings of the 1st International Electronic Conference on Applied Sciences, Basel, Switzerland, 10–30 November 2020; p. 23. [Google Scholar]
  55. Essa, H.L.; Abdelfattah, M.S.; Marzouk, A.S.; Shedeed, Z.; Guirguis, H.A.; El-Sayed, M.M.H. Biogenic Copper Nanoparticles from Avicennia Marina Leaves: Impact on Seed Germination, Detoxification Enzymes, Chlorophyll Content and Uptake by Wheat Seedlings. PLoS ONE 2021, 16, e0249764. [Google Scholar] [CrossRef] [PubMed]
  56. Abu-Dahab, R.; Afifi, F.; Kasabri, V.; Majdalawi, L.; Naffa, R. Comparison of the Antiproliferative Activity of Crude Ethanol Extracts of Nine Salvia Species Grown in Jordan against Breast Cancer Cell Line Models. Pharmacogn. Mag. 2012, 8, 319. [Google Scholar] [CrossRef] [PubMed] [Green Version]
  57. Georgiev, V.; Pavlov, A. (Eds.) Salvia Biotechnology, 1st ed.; Springer International Publishing: Cham, Switzerland, 2017; ISBN 978-3-319-73900-7. [Google Scholar]
  58. Prinz, H. Hill Coefficients, Dose–Response Curves and Allosteric Mechanisms. J. Chem. Biol. 2010, 3, 37–44. [Google Scholar] [CrossRef] [PubMed] [Green Version]
  59. Weiss, J.N. The Hill Equation Revisited: Uses and Misuses. FASEB J. 1997, 11, 835–841. [Google Scholar] [CrossRef]
  60. Krzywik, J.; Mozga, W.; Aminpour, M.; Janczak, J.; Maj, E.; Wietrzyk, J.; Tuszyński, J.A.; Huczyński, A. Synthesis, Antiproliferative Activity and Molecular Docking Studies of Novel Doubly Modified Colchicine Amides and Sulfonamides as Anticancer Agents. Molecules 2020, 25, 1789. [Google Scholar] [CrossRef] [Green Version]
  61. Lica, J.J.; Wieczór, M.; Grabe, G.J.; Heldt, M.; Jancz, M.; Misiak, M.; Gucwa, K.; Brankiewicz, W.; Maciejewska, N.; Stupak, A.; et al. Effective Drug Concentration and Selectivity Depends on Fraction of Primitive Cells. Int. J. Mol. Sci. 2021, 22, 4931. [Google Scholar] [CrossRef]
  62. Yap, T.A.; Omlin, A.; de Bono, J.S. Development of Therapeutic Combinations Targeting Major Cancer Signaling Pathways. J. Clin. Oncol. 2013, 31, 1592–1605. [Google Scholar] [CrossRef]
  63. Albain, K.S.; Nag, S.M.; Calderillo-Ruiz, G.; Jordaan, J.P.; Llombart, A.C.; Pluzanska, A.; Rolski, J.; Melemed, A.S.; Reyes-Vidal, J.M.; Sekhon, J.S.; et al. Gemcitabine plus Paclitaxel versus Paclitaxel Monotherapy in Patients with Metastatic Breast Cancer and Prior Anthracycline Treatment. J. Clin. Oncol. 2008, 26, 3950–3957. [Google Scholar] [CrossRef] [PubMed]
  64. Bayat Mokhtari, R.; Homayouni, T.S.; Baluch, N.; Morgatskaya, E.; Kumar, S.; Das, B.; Yeger, H. Combination Therapy in Combating Cancer. Oncotarget 2017, 8, 38022–38043. [Google Scholar] [CrossRef] [PubMed] [Green Version]
  65. Mohan, L. Plant-Based Drugs as an Adjuvant to Cancer Chemotherapy. In Alternative Medicine [Working Title]; IntechOpen: London, UK, 2020. [Google Scholar]
  66. Tayeh, Z.; Ofir, R. Asteriscus Graveolens Extract in Combination with Cisplatin/Etoposide/Doxorubicin Suppresses Lymphoma Cell Growth through Induction of Caspase-3 Dependent Apoptosis. Int. J. Mol. Sci. 2018, 19, 2219. [Google Scholar] [CrossRef]
  67. Liu, L.; Fan, J.; Ai, G.; Liu, J.; Luo, N.; Li, C.; Cheng, Z. Berberine in Combination with Cisplatin Induces Necroptosis and Apoptosis in Ovarian Cancer Cells. Biol. Res. 2019, 52, 37. [Google Scholar] [CrossRef] [PubMed] [Green Version]
  68. Montopoli, M.; Ragazzi, E.; Froldi, G.; Caparrotta, L. Cell-Cycle Inhibition and Apoptosis Induced by Curcumin and Cisplatin or Oxaliplatin in Human Ovarian Carcinoma Cells. Cell Prolif. 2009, 42, 195–206. [Google Scholar] [CrossRef] [PubMed] [Green Version]
  69. Chan, M.M.; Soprano, K.J.; Weinstein, K.; Fong, D. Epigallocatechin-3-Gallate Delivers Hydrogen Peroxide to Induce Death of Ovarian Cancer Cells and Enhances Their Cisplatin Susceptibility. J. Cell. Physiol. 2006, 207, 389–396. [Google Scholar] [CrossRef] [PubMed]
  70. Cui, Q.; Bian, R.; Xu, F.; Li, Q.; Wang, W.; Bian, Q. New Molecular Entities and Structure–Activity Relationships of Drugs Designed by the Natural Product Derivatization Method from 2010 to 2018. In Studies in Natural Products Chemistry; Elsevier: Amsterdam, The Netherlands, 2021; Volume 69, pp. 371–415. ISBN 978-0-12-819487-4. [Google Scholar]
  71. Lin, S.-R.; Chang, C.-H.; Hsu, C.-F.; Tsai, M.-J.; Cheng, H.; Leong, M.K.; Sung, P.-J.; Chen, J.-C.; Weng, C.-F. Natural Compounds as Potential Adjuvants to Cancer Therapy: Preclinical Evidence. Br. J. Pharmacol. 2020, 177, 1409–1423. [Google Scholar] [CrossRef] [Green Version]
  72. Zhang, Y.; Chen, X.; Gueydan, C.; Han, J. Plasma Membrane Changes during Programmed Cell Deaths. Cell Res. 2018, 28, 9–21. [Google Scholar] [CrossRef] [Green Version]
  73. Green, D.R.; Llambi, F. Cell Death Signaling. Cold Spring Harb. Perspect. Biol. 2015, 7, a006080. [Google Scholar] [CrossRef] [Green Version]
  74. Tahtamouni, L.; Ahram, M.; Koblinski, J.; Rolfo, C. Molecular Regulation of Cancer Cell Migration, Invasion, and Metastasis. Anal. Cell. Pathol. 2019, 2019, 1356508. [Google Scholar] [CrossRef] [Green Version]
  75. Anantharaju, P.G.; Gowda, P.C.; Vimalambike, M.G.; Madhunapantula, S.V. An Overview on the Role of Dietary Phenolics for the Treatment of Cancers. Nutr. J. 2016, 15, 99. [Google Scholar] [CrossRef] [PubMed] [Green Version]
  76. Abreu, M.E.; Müller, M.; Alegre, L.; Munné-Bosch, S. Phenolic Diterpene and α-Tocopherol Contents in Leaf Extracts of 60 Salvia Species. J. Sci. Food Agric. 2008, 88, 2648–2653. [Google Scholar] [CrossRef]
  77. Barni, M.V.; Carlini, M.J.; Cafferata, E.G.; Puricelli, L.; Moreno, S. Carnosic Acid Inhibits the Proliferation and Migration Capacity of Human Colorectal Cancer Cells. Oncol. Rep. 2012, 27, 1041–1048. [Google Scholar] [CrossRef] [PubMed]
  78. Koutsoulas, A.; Čarnecká, M.; Slanina, J.; Tóth, J.; Slaninová, I. Characterization of Phenolic Compounds and Antiproliferative Effects of Salvia Pomifera and Salvia Fruticosa Extracts. Molecules 2019, 24, 2921. [Google Scholar] [CrossRef] [Green Version]
  79. Xiaomeng, F.; Lei, L.; Jinghong, A.; Juan, J.; Qi, Y.; Dandan, Y. Treatment with β-Elemene Combined with Paclitaxel Inhibits Growth, Migration, and Invasion and Induces Apoptosis of Ovarian Cancer Cells by Activation of STAT-NF-ΚB Pathway. Braz. J. Med. Biol. Res. 2020, 53, e8885. [Google Scholar] [CrossRef]
  80. Martin, J.W.; Zielenska, M.; Stein, G.S.; Wijnen, A.J.; Squire, J.A. The Role of RUNX2 in Osteosarcoma Oncogenesis. Sarcoma 2011, 2011, 282745. [Google Scholar] [CrossRef] [Green Version]
  81. Li, W.; Xu, S.; Lin, S.; Zhao, W. Overexpression of Runt-Related Transcription Factor-2 Is Associated with Advanced Tumor Progression and Poor Prognosis in Epithelial Ovarian Cancer. J. Biomed. Biotechnol. 2012, 2012, 456534. [Google Scholar] [CrossRef] [Green Version]
  82. Park, E.-S.; Lind, A.-K.; Dahm-Kähler, P.; Brännström, M.; Carletti, M.Z.; Christenson, L.K.; Curry, T.E.; Jo, M. RUNX2 Transcription Factor Regulates Gene Expression in Luteinizing Granulosa Cells of Rat Ovaries. Mol. Endocrinol. 2010, 24, 846–858. [Google Scholar] [CrossRef] [Green Version]
  83. Sionov, R.V.; Hayon, I.L.; Haupt, Y. The Regulation of P53 Growth Suppression. In Madame Curie Bioscience Database [Internet]; Landes Bioscience: Austin, TX, USA, 2000. [Google Scholar]
  84. Basu, A. The Relationship between BcI2, Bax and P53: Consequences for Cell Cycle Progression and Cell Death. Mol. Hum. Reprod. 1998, 4, 1099–1109. [Google Scholar] [CrossRef]
  85. Chipuk, J.E. Direct Activation of Bax by P53 Mediates Mitochondrial Membrane Permeabilization and Apoptosis. Science 2004, 303, 1010–1014. [Google Scholar] [CrossRef] [Green Version]
  86. Yu, J.; Zhang, L. PUMA, a Potent Killer with or without P53. Oncogene 2008, 27, S71–S83. [Google Scholar] [CrossRef] [PubMed] [Green Version]
  87. Zhang, M.; Zheng, J.; Nussinov, R.; Ma, B. Release of Cytochrome C from Bax Pores at the Mitochondrial Membrane. Sci. Rep. 2017, 7, 2635. [Google Scholar] [CrossRef] [PubMed] [Green Version]
  88. Schuler, M.; Bossy-Wetzel, E.; Goldstein, J.C.; Fitzgerald, P.; Green, D.R. P53 Induces Apoptosis by Caspase Activation through Mitochondrial Cytochrome c Release. J. Biol. Chem. 2000, 275, 7337–7342. [Google Scholar] [CrossRef] [PubMed]
  89. Batista, I.A.A.; Helguero, L.A. Biological Processes and Signal Transduction Pathways Regulated by the Protein Methyltransferase SETD7 and Their Significance in Cancer. Signal Transduct. Target. Ther. 2018, 3, 19. [Google Scholar] [CrossRef] [PubMed] [Green Version]
  90. Campaner, S.; Spreafico, F.; Burgold, T.; Doni, M.; Rosato, U.; Amati, B.; Testa, G. The Methyltransferase Set7/9 (Setd7) Is Dispensable for the P53-Mediated DNA Damage Response In Vivo. Mol. Cell 2011, 43, 681–688. [Google Scholar] [CrossRef] [PubMed]
  91. Zhang, J.; Yu, X.-H.; Yan, Y.-G.; Wang, C.; Wang, W.-J. PI3K/Akt Signaling in Osteosarcoma. Clin. Chim. Acta 2015, 444, 182–192. [Google Scholar] [CrossRef] [PubMed]
  92. Gasparri, M.L.; Bardhi, E.; Ruscito, I.; Papadia, A.; Farooqi, A.A.; Marchetti, C.; Bogani, G.; Ceccacci, I.; Mueller, M.D.; Benedetti Panici, P. PI3K/AKT/MTOR Pathway in Ovarian Cancer Treatment: Are We on the Right Track? Geburtshilfe Frauenheilkd. 2017, 77, 1095–1103. [Google Scholar] [CrossRef] [Green Version]
  93. Valenta, T.; Hausmann, G.; Basler, K. The Many Faces and Functions of β-Catenin: β-Catenin: A Life by, beyond, and against the Wnt Canon. EMBO J. 2012, 31, 2714–2736. [Google Scholar] [CrossRef] [Green Version]
  94. Lustig, B.; Behrens, J. The Wnt Signaling Pathway and Its Role in Tumor Development. J. Cancer Res. Clin. Oncol. 2003, 129, 199–221. [Google Scholar] [CrossRef]
  95. MacDonald, B.T.; Tamai, K.; He, X. Wnt/β-Catenin Signaling: Components, Mechanisms, and Diseases. Dev. Cell 2009, 17, 9–26. [Google Scholar] [CrossRef] [Green Version]
  96. Hadjihannas, M.V.; Bruckner, M.; Jerchow, B.; Birchmeier, W.; Dietmaier, W.; Behrens, J. Aberrant Wnt/Beta-Catenin Signaling Can Induce Chromosomal Instability in Colon Cancer. Proc. Natl. Acad. Sci. USA 2006, 103, 10747–10752. [Google Scholar] [CrossRef] [PubMed] [Green Version]
  97. Mohinta, S. Wnt Pathway and Breast Cancer. Front. Biosci. 2007, 12, 4020. [Google Scholar] [CrossRef] [Green Version]
  98. Khalaf, A.M.; Fuentes, D.; Morshid, A.I.; Burke, M.R.; Kaseb, A.O.; Hassan, M.; Hazle, J.D.; Elsayes, K.M. Role of Wnt/β-Catenin Signaling in Hepatocellular Carcinoma, Pathogenesis, and Clinical Significance. J. Hepatocell. Carcinoma 2018, 5, 61–73. [Google Scholar] [CrossRef] [PubMed]
  99. Kleinerman, E.S. Current Advances in Osteosarcoma; Springer: New York, NY, USA, 2014; ISBN 978-3-319-04842-0. [Google Scholar]
  100. Arend, R.C.; Londoño-Joshi, A.I.; Straughn, J.M.; Buchsbaum, D.J. The Wnt/β-Catenin Pathway in Ovarian Cancer: A Review. Gynecol. Oncol. 2013, 131, 772–779. [Google Scholar] [CrossRef] [PubMed]
  101. Wu, R.; Zhai, Y.; Fearon, E.R.; Cho, K.R. Diverse Mechanisms of Beta-Catenin Deregulation in Ovarian Endometrioid Adenocarcinomas. Cancer Res. 2001, 61, 8247–8255. [Google Scholar] [PubMed]
  102. Blagodatski, A.; Klimenko, A.; Jia, L.; Katanaev, V.L. Small Molecule Wnt Pathway Modulators from Natural Sources: History, State of the Art and Perspectives. Cells 2020, 9, 589. [Google Scholar] [CrossRef] [Green Version]
  103. Fu, J.; Wang, S.; Lu, H.; Ma, J.; Ke, X.; Liu, T.; Luo, Y. In Vitro Inhibitory Effects of Terpenoids from Chloranthus Multistachys on Epithelial–Mesenchymal Transition via down-Regulation of Runx2 Activation in Human Breast Cancer. Phytomedicine 2015, 22, 165–172. [Google Scholar] [CrossRef]
  104. Ma, J.; Lu, H.; Wang, S.; Chen, B.; Liu, Z.; Ke, X.; Liu, T.; Fu, J. The Anthraquinone Derivative Emodin Inhibits Angiogenesis and Metastasis through Downregulating Runx2 Activity in Breast Cancer. Int. J. Oncol. 2015, 46, 1619–1628. [Google Scholar] [CrossRef] [Green Version]
  105. Riaz, M.; Ashfaq, U.A.; Qasim, M.; Yasmeen, E.; Ul Qamar, M.T.; Anwar, F. Screening of Medicinal Plant Phytochemicals as Natural Antagonists of P53–MDM2 Interaction to Reactivate P53 Functioning. Anti-Cancer Drugs 2017, 28, 1032–1038. [Google Scholar] [CrossRef]
  106. Sukumari-Ramesh, S.; Bentley, J.N.; Laird, M.D.; Singh, N.; Vender, J.R.; Dhandapani, K.M. Dietary Phytochemicals Induce P53- and Caspase-independent Cell Death in Human Neuroblastoma Cells. Int. J. Dev. Neurosci. 2011, 29, 701–710. [Google Scholar] [CrossRef] [Green Version]
  107. Ozaki, T.; Wu, D.; Sugimoto, H.; Nagase, H.; Nakagawara, A. Runt-Related Transcription Factor 2 (RUNX2) Inhibits P53-Dependent Apoptosis through the Collaboration with HDAC6 in Response to DNA Damage. Cell Death Dis. 2013, 4, e610. [Google Scholar] [CrossRef] [PubMed] [Green Version]
  108. Ozaki, T.; Nakagawara, A.; Nagase, H. RUNX Family Participates in the Regulation of P53-Dependent DNA Damage Response. Int. J. Genom. 2013, 2013, 271347. [Google Scholar] [CrossRef] [PubMed] [Green Version]
  109. Blyth, K.; Vaillant, F.; Hanlon, L.; Mackay, N.; Bell, M.; Jenkins, A.; Neil, J.C.; Cameron, E.R. Runx2 and MYC Collaborate in Lymphoma Development by Suppressing Apoptotic and Growth Arrest Pathways In Vivo. Cancer Res. 2006, 66, 2195–2201. [Google Scholar] [CrossRef] [PubMed]
  110. van der Deen, M.; Taipaleenmäki, H.; Zhang, Y.; Teplyuk, N.M.; Gupta, A.; Cinghu, S.; Shogren, K.; Maran, A.; Yaszemski, M.J.; Ling, L.; et al. MicroRNA-34c Inversely Couples the Biological Functions of the Runt-Related Transcription Factor RUNX2 and the Tumor Suppressor P53 in Osteosarcoma. J. Biol. Chem. 2013, 288, 21307–21319. [Google Scholar] [CrossRef] [PubMed] [Green Version]
  111. Lengner, C.J.; Steinman, H.A.; Gagnon, J.; Smith, T.W.; Henderson, J.E.; Kream, B.E.; Stein, G.S.; Lian, J.B.; Jones, S.N. Osteoblast Differentiation and Skeletal Development Are Regulated by Mdm2–P53 Signaling. J. Cell Biol. 2006, 172, 909–921. [Google Scholar] [CrossRef]
  112. Dyer, K.D.; Rosenberg, H.F. Shared Features of Transcription: Mutational Analysis of the Eosinophil/Basophil Charcot-Leyden Crystal Protein Gene Promoter. J. Leukoc. Biol. 2000, 67, 691–698. [Google Scholar] [CrossRef]
  113. Dyer, K.D.; Rosenberg, H.F. Transcriptional Regulation of Galectin-10 (Eosinophil Charcot-Leyden Crystal Protein). Life Sci. 2001, 69, 201–212. [Google Scholar] [CrossRef]
  114. Makita, N.; Suzuki, M.; Asami, S.; Takahata, R.; Kohzaki, D.; Kobayashi, S.; Hakamazuka, T.; Hozumi, N. Two of Four Alternatively Spliced Isoforms of RUNX2 Control Osteocalcin Gene Expression in Human Osteoblast Cells. Gene 2008, 413, 8–17. [Google Scholar] [CrossRef]
  115. Ducy, P.; Zhang, R.; Geoffroy, V.; Ridall, A.L.; Karsenty, G. Osf2/Cbfa1: A Transcriptional Activator of Osteoblast Differentiation. Cell 1997, 89, 747–754. [Google Scholar] [CrossRef] [Green Version]
  116. Nakajima, S. N-Cadherin Expression and Epithelial-Mesenchymal Transition in Pancreatic Carcinoma. Clin. Cancer Res. 2004, 10, 4125–4133. [Google Scholar] [CrossRef] [Green Version]
  117. Mrozik, K.M.; Blaschuk, O.W.; Cheong, C.M.; Zannettino, A.C.W.; Vandyke, K. N-Cadherin in Cancer Metastasis, Its Emerging Role in Haematological Malignancies and Potential as a Therapeutic Target in Cancer. BMC Cancer 2018, 18, 939. [Google Scholar] [CrossRef] [PubMed] [Green Version]
  118. Davidson, B.; Tropé, C.G.; Reich, R. Epithelial–Mesenchymal Transition in Ovarian Carcinoma. Front. Oncol. 2012, 2, 33. [Google Scholar] [CrossRef] [PubMed] [Green Version]
  119. Derycke, L.D.M.; Bracke, M.E. N-Cadherin in the Spotlight of Cell-Cell Adhesion, Differentiation, Embryogenesis, Invasion and Signalling. Int. J. Dev. Biol. 2004, 48, 463–476. [Google Scholar] [CrossRef] [PubMed]
  120. Satelli, A.; Li, S. Vimentin in Cancer and Its Potential as a Molecular Target for Cancer Therapy. Cell. Mol. Life Sci. 2011, 68, 3033–3046. [Google Scholar] [CrossRef] [Green Version]
  121. Lomonosova, E.; Ryerse, J.; Chinnadurai, G. BAX/BAK–Independent Mitoptosis during Cell Death Induced by Proteasome Inhibition? Mol. Cancer Res. 2009, 7, 1268–1284. [Google Scholar] [CrossRef] [PubMed] [Green Version]
  122. Mizuta, T.; Shimizu, S.; Matsuoka, Y.; Nakagawa, T.; Tsujimoto, Y. A Bax/Bak-Independent Mechanism of Cytochrome c Release. J. Biol. Chem. 2007, 282, 16623–16630. [Google Scholar] [CrossRef] [PubMed] [Green Version]
  123. Cohen-Solal, K.A.; Boregowda, R.K.; Lasfar, A. RUNX2 and the PI3K/AKT Axis Reciprocal Activation as a Driving Force for Tumor Progression. Mol. Cancer 2015, 14, 137. [Google Scholar] [CrossRef] [Green Version]
  124. Trzeciakiewicz, A.; Habauzit, V.; Mercier, S.; Lebecque, P.; Davicco, M.-J.; Coxam, V.; Demigne, C.; Horcajada, M.-N. Hesperetin Stimulates Differentiation of Primary Rat Osteoblasts Involving the BMP Signalling Pathway. J. Nutr. Biochem. 2010, 21, 424–431. [Google Scholar] [CrossRef]
  125. Dai, J.; Li, Y.; Zhou, H.; Chen, J.; Chen, M.; Xiao, Z. Genistein Promotion of Osteogenic Differentiation through BMP2/SMAD5/RUNX2 Signaling. Int. J. Biol. Sci. 2013, 9, 1089–1098. [Google Scholar] [CrossRef]
  126. Li, J.; Hao, L.; Wu, J.; Zhang, J.; Su, J. Linarin Promotes Osteogenic Differentiation by Activating the BMP-2/RUNX2 Pathway via Protein Kinase A Signaling. Int. J. Mol. Med. 2016, 37, 901–910. [Google Scholar] [CrossRef] [Green Version]
  127. Auh, Q.-S.; Park, K.-R.; Yun, H.-M.; Lim, H.-C.; Kim, G.-H.; Lee, D.-S.; Kim, Y.-C.; Oh, H.; Kim, E.-C. Sulfuretin Promotes Osteoblastic Differentiation in Primary Cultured Osteoblasts and in Vivo Bone Healing. Oncotarget 2016, 7, 78320–78330. [Google Scholar] [CrossRef] [PubMed] [Green Version]
  128. Mu, P.; Hu, Y.; Ma, X.; Shi, J.; Zhong, Z.; Huang, L. Total Flavonoids of Rhizoma Drynariae Combined with Calcium Attenuate Osteoporosis by Reducing Reactive Oxygen Species Generation. Exp. Ther. Med. 2021, 21, 618. [Google Scholar] [CrossRef] [PubMed]
  129. Liu, H.; Zhu, R.; Wang, L.; Liu, C.; Ma, R.; Qi, B.; Chen, B.; Li, L.; Guo, Y.; Shi, S.; et al. Radix Salviae miltiorrhizae Improves Bone Microstructure and Strength through Wnt/β-Catenin and Osteoprotegerin/Receptor Activator for Nuclear Factor-ΚB Ligand/Cathepsin K Signaling in Ovariectomized Rats: Radix Salvia Miltiorrhizae Improves Bone Quality in OVX Rats. Phytother. Res. 2018, 32, 2487–2500. [Google Scholar] [CrossRef]
  130. Ahn, J.-H.; Kim, T.J.; Lee, J.H.; Choi, J.-H. Mutant P53 Stimulates Cell Invasion through an Interaction with Rad21 in Human Ovarian Cancer Cells. Sci. Rep. 2017, 7, 9076. [Google Scholar] [CrossRef] [PubMed] [Green Version]
  131. Son, D.-S.; Kabir, S.M.; Dong, Y.-L.; Lee, E.; Adunyah, S.E. Inhibitory Effect of Tumor Suppressor P53 on Proinflammatory Chemokine Expression in Ovarian Cancer Cells by Reducing Proteasomal Degradation of IκB. PLoS ONE 2012, 7, e51116. [Google Scholar] [CrossRef] [PubMed]
  132. Yaginuma, Y.; Westphal, H. Abnormal Structure and Expression of the p53 Gene in Human Ovarian Carcinoma Cell Lines. Cancer Res. 1992, 52, 4196. [Google Scholar] [PubMed]
  133. Thermo Fisher Scientific. Real-Time PCR Handbook; Thermo Fisher Scientific Inc.: Waltham, MA, USA, 2014. [Google Scholar]
  134. Tan, G.; Heqing, L.; Jiangbo, C.; Ming, J.; Yanhong, M.; Xianghe, L.; Hong, S.; Li, G. Apoptosis Induced by Low-Dose Paclitaxel Is Associated with P53 Upregulation in Nasopharyngeal Carcinoma Cells. Int. J. Cancer 2002, 97, 168–172. [Google Scholar] [CrossRef]
  135. Lanni, J.S.; Lowe, S.W.; Licitra, E.J.; Liu, J.O.; Jacks, T. P53-Independent Apoptosis Induced by Paclitaxel through an Indirect Mechanism. Proc. Natl. Acad. Sci. USA 1997, 94, 9679–9683. [Google Scholar] [CrossRef] [Green Version]
  136. Wahl, A.F.; Donaldson, K.L.; Faircnild, C.; Lee, F.Y.F.; Foster, S.A.; Demers, G.W.; Galloway, D.A. Loss of Normal P53 Function Confers Sensitization to Taxol by Increasing G2/M Arrest and Apoptosis. Nat. Med. 1996, 2, 72–79. [Google Scholar] [CrossRef]
  137. Lavarino, C.; Pilotti, S.; Oggionni, M.; Gatti, L.; Perego, P.; Bresciani, G.; Pierotti, M.A.; Scambia, G.; Ferrandina, G.; Fagotti, A.; et al. P53 Gene Status and Response to Platinum/Paclitaxel-Based Chemotherapy in Advanced Ovarian Carcinoma. J. Clin. Oncol. 2000, 18, 3936–3945. [Google Scholar] [CrossRef]
  138. Jeswani, G.; Alexander, A.; Saraf, S.; Saraf, S.; Qureshi, A. Ajazuddin Recent Approaches for Reducing Hemolytic Activity of Chemotherapeutic Agents. J. Control. Release 2015, 211, 10–21. [Google Scholar] [CrossRef] [PubMed]
  139. Brewer, M.S. Natural Antioxidants: Sources, Compounds, Mechanisms of Action, and Potential Applications. Compr. Rev. Food Sci. Food Saf. 2011, 10, 221–247. [Google Scholar] [CrossRef]
  140. Waksmundzka-Hajnos, M.; Sherma, J.; Kowalska, T. Thin Layer Chromatography in Phytochemistry; CRC Press: Boca Raton, FL, USA, 2008; ISBN 978-1-4200-4677-9. [Google Scholar]
  141. El-Sayed, N.H.; Khalifa, T.I.; Ibrahim, M.T.; Mabry, T.J. Constituents from Salvia triloba. Fitoterapia 2001, 72, 850–853. [Google Scholar] [CrossRef]
  142. Tabei, S.M.; Alizadeh, A. Phytochemical Constituents and Antimicrobial Activity of Salvia. Bangladesh J. Bot. 2018, 47, 847–854. [Google Scholar] [CrossRef]
  143. Çadirci, E.; Süleyman, H.; Gürbüz, P.; Uz, A.K.; Güvenalp, Z.; DemïRezer, L.Ö. Anti-Inflammatory Effects of Different Extracts from Three Salvia Species. Turk. J. Biol. 2012, 36, 59–64. [Google Scholar] [CrossRef]
  144. Afonso, A.F.; Pereira, O.R.; Cardoso, S.M. Salvia Species as Nutraceuticals: Focus on Antioxidant, Antidiabetic and Anti-Obesity Properties. Appl. Sci. 2021, 11, 9365. [Google Scholar] [CrossRef]
  145. Rustaie, A.; Hadjiakhoondi, A.; Akbarzadeh, T.; Safavi, M.; Samadi, N.; Sabourian, R.; Khanavi*, M. Phytochemical Constituents and Biological Activities of Salvia Suffruticosa. Res. J. Pharmacogn. 2018, 5, 25–32. [Google Scholar] [CrossRef]
  146. Rupasinghe, V.; Jiang, Y.; Zhang, L. The Anticancer Properties of Phytochemical Extracts from Salvia Plants. Bot. Targets Ther. 2016, 6, 25–44. [Google Scholar] [CrossRef] [Green Version]
  147. Sajewicz, M.; Staszek, D.; Wróbel, M.S.; Waksmundzka-Hajnos, M.; Kowalska, T. The HPLC/DAD Fingerprints and Chemometric Analysis of Flavonoid Extracts from the Selected Sage (Salvia) Species. Chromatogr. Res. Int. 2012, 2012, 230903. [Google Scholar] [CrossRef] [Green Version]
  148. Capek, P.; Hříbalová, V. Water-Soluble Polysaccharides from Salvia officinalis L. Possessing Immunomodulatory Activity. Phytochemistry 2004, 65, 1983–1992. [Google Scholar] [CrossRef]
Figure 1. S. triloba acetone extract significantly reduces U2OS and SKOV3 cell viability. (A) U2OS cell viability after 48 h exposure to S. triloba acetone. The acetone extract significantly reduced U2OS cell viability at all tested concentrations. (B) U2OS cell viability was significantly reduced by more than 50% after incubation with cisplatin (48 h) at all examined concentrations; cisplatin served as a positive control for U2OS cells. (C) SKOV3 cell viability was significantly reduced when incubated (48 h) with S. triloba acetone extract at both 75 µg/mL and 150 µg/mL concentrations. A sharp decline in SKOV3 cell viability (>50%) was observed at the 150 µg/mL concentration, and this reduction showed statistical significance when compared to the 75 µg/mL concentration. (D) Paclitaxel (PTX) served as a positive control for SKOV3 cells; significant reductions in SKOV3 cell viability at all tested concentrations were observed after incubation with PTX (48 h). Comparisons were made between the treated samples and respective untreated controls; results are representative of three independent experiments (*** p ≤ 0.001, ** p ≤ 0.01, * p ≤ 0.05).
Applsci 12 11545 g001
Figure 2. U2OS and SKOV3 dose–response curves. All generated dose–response curves had a negative slope, indicating a decrease in cell viability with increasing treatment concentration. The resultant IC50 values were (A) 30.210 ± 1.180 µg/mL (R2 = 0.797) for U2OS cells treated with S. triloba acetone extract, (B) 3.033 ± 1.189 µg/mL (R2 = 0.919) for U2OS cells treated with cisplatin, (C) 75.960 ± 1.0237 µg/mL (R2 = 0.890) for SKOV3 cells treated with S. triloba acetone extract, and (D) 3.148 ± 1.197 µg/mL (R2 = 0.771) for SKOV3 cells treated with paclitaxel. Cisplatin and paclitaxel respectively served as positive controls for U2OS and SKOV3 cells; results are representative of three independent experiments.
Applsci 12 11545 g002
Figure 3. Dose–effect curve and median effect plot of the combination experiment in SKOV3 cells. Using dose and effect data obtained from the MTT assay, the CompuSyn software was used to plot the dose–effect curve (A); as a prerequisite for determining synergism or antagonism, the dose effect curve is utilized to determine the potency of each drug individually along with the drug combination. The dose–effect plots can be better visualized by linearization in the median effect plot (B); the antilog of the x-intercept of the median effect plot gives the median effect dose (Dm) which signifies the potency of each drug (the dose that results in 50% effect). By the law of mass action, the Dm is used to determine the combination index (CI) values. S. triloba (ST); paclitaxel (PTX); S. triloba + paclitaxel (ST-PTX); fraction of cells inhibited by treatment (Fa); fraction of cells uninhibited by treatment (Fu); dose (D).
Applsci 12 11545 g003
Figure 4. Logarithmic combination index plot and Log(DRI) plot for the drug combination experiment in SKOV3 cells. (A) A plot of Log(CI) against Fa was used to determine which concentrations of the drug combination exhibited synergy; a CI < 1, CI = 1 and CI > 1 indicates synergism, additive effect and antagonism, respectively. Only one out of six combinations exhibited synergy, all others were antagonistic. (B) A plot of Log(DRI) against Fa was used to calculate dose reduction indices (DRI) for the drugs used in the combined treatment. A DRI > 1 indicates that the dose of a given drug is reduced when used in combination than if it were used without combination. DRI values < 1 are not favorable for dose reduction. S. triloba (ST); paclitaxel (PTX); S. triloba + paclitaxel (ST-PTX); fraction of cells inhibited by treatment (Fa); combination index (CI), dose reduction index (DRI).
Applsci 12 11545 g004
Figure 5. S. triloba acetone extract increases the percentage of non-viable U2OS and SKOV3 cells. (A) When compared with non-treated controls, the number of non-viable U2OS cells increased by 17.8% with no statistical significance. (B) Statistically significant results were, however, observed for SKOV3 cells, where the S. triloba acetone extract (IC50) along with the combination treatment (S. triloba (19 µg/mL) + paclitaxel (0.787 µg/mL)) induced an increase in non-viable cells of about 44% and 92% respectively. Both cisplatin (IC50) and paclitaxel (IC50) served as positive controls for U2OS and SKOV3 cells, respectively, and cells were incubated for 48 h post treatment. Results are a representation of three independent experiments (*** p ≤ 0.001, ** p ≤ 0.01, * p ≤ 0.05).
Applsci 12 11545 g005
Figure 6. S. triloba acetone extract decreases wound closure in both U2OS and SKOV3 cells. Percentage wound closure was determined for both U2OS and SKOV3 cells after incubation with S. triloba acetone extract (IC50) for 22 h and 20 h respectively using the scratch-wound healing assay. Wound closure was determined as a percentage of the wound area at the respective time point relative to the wound area at 0 h. (A) S. triloba acetone extract significantly decreased U2OS percentage wound closure by about 30% when compared with untreated controls; this decrease was similar to the one observed in the cisplatin control (IC50). (B) Representative images depicting wound closure progression of U2OS cells. (C) Similarly, SKOV3 cells percentage wound closure was significantly decreased by about 32% after S. triloba acetone extract treatment. The paclitaxel control (IC50) caused the SKOV3 cells around the wound boundaries to detach and percentage wound closure could not be accurately determined for these samples. (D) Representative images depicting wound closure progression of SKOV3 cells. Results are a representation of three independent experiments (*** p ≤ 0.001, ** p ≤ 0.01, * p ≤ 0.05).
Applsci 12 11545 g006
Figure 7. S. triloba acetone extract decreases U2OS cell migration. The effect of S. triloba acetone extract (IC50) on U2OS and SKOV3 cell migration was determined using the transwell migration assay and images taken at 22 h and 9 h respectively. (A) S. triloba acetone extract significantly decreased the percentage of migrated U2OS cells by approximately 70% when compared to untreated controls; nevertheless, the cisplatin (IC50) control did not significantly affect U2OS cell migration. (B) Representative images displaying DAPI-stained nuclei of U2OS cells that migrated to the lower chamber of the transwell insert. (C) On the other hand, SKOV3 cell migration was relatively unaffected after treatment with S. triloba acetone extract. However, when the acetone extract was combined with paclitaxel, SKOV3 cell migration was reduced by 42%. (D) Representative images displaying DAPI-stained nuclei of SKOV3 cells that migrated to the lower chamber of the transwell insert. Results are a representation of three independent experiments (*** p ≤ 0.001, ** p ≤ 0.01, * p ≤ 0.05).
Applsci 12 11545 g007
Figure 8. S. triloba acetone extract and its combination with paclitaxel affect the steady-state mRNA expression of both U2OS and SKOV3 cells. The steady-state mRNA expression of genes involved in cell proliferation and migration was examined using qPCR after cells were treated with S. triloba acetone extract (IC50) for 48 h. (A) Significant decreases in U2OS gene expression were observed for RUNX2, PI3KR1, N-cadherin and vimentin genes, while SETD7 and MDM2 were significantly upregulated. The greatest increase (approx. 2 fold) in expression was observed for both SETD7 and MDM2 genes while RUNX2 exhibited the highest decline (91%) in expression. (B) Statistically significant declines in gene expression were observed for RUNX2, BAX, PTEN, SETD7, MDM2, and β-catenin in SKOV3 cells; none of the tested genes were upregulated after S. triloba treatment. (C) When SKOV3 cells were treated with the combination treatment (19 µg/mL S. triloba + 0.787 µg/mL paclitaxel), RUNX2 and β-catenin expression was significantly downregulated, while p53 expression was significantly upregulated; p53 exhibited notable upregulation with an expression fold change of approx. 8. Results are a representation of three independent experiments (*** p ≤ 0.001, ** p ≤ 0.01, * p ≤ 0.05). (D) Consensus sequence of RUNX2 transcription factor binding site (TFBS) within the MDM2 promoter region obtained from the TRANSFAC® database.
Applsci 12 11545 g008
Figure 9. S. triloba acetone extract does not induce hemolysis in human erythrocytes. Hemolytic activity of S. triloba acetone extract at concentrations approximate to either IC50 (54.51 µg/mL) or IC75 (190 µg/mL) was about 1.282% and 3.157% respectively. When compared to untreated samples, the hemolytic activity of S. triloba acetone extract was negligible and the differences were not statistically significant. Deionized water served as a positive control that induced 100% hemolysis. Results are a representation of three independent experiments (*** p ≤ 0.001, ** p ≤ 0.01, * p ≤ 0.05).
Applsci 12 11545 g009
Figure 10. TLC-UV fractionation of crude S. triloba acetone extract. Four fractions were generated from the acetone extract by thin layer chromatography (TLC); the calculated retention factors (Rf) ranging from 0.2 to 0.8 suggested a mixture of compounds with varying polarities whose bioactivities require further investigation.
Applsci 12 11545 g010
Figure 11. FTIR spectra of S. triloba leaves (Top panel) and its crude acetone extract (Bottom panel).
Applsci 12 11545 g011
Table 1. Serial dilution scheme for the combination treatment.
S. triloba Acetone Extract
Paclitaxel IC50 × 4IC50 × 2IC50IC50 × 0.5IC50 × 0.25
IC50 × 4Combination 1
IC50 × 2 Combination 2
IC50 Combination 3
IC50 × 0.5 Combination 4
IC50 × 0.25 Combination 5
Table 2. Parameters used for TFBS annotation.
ParameterValue
Matrix libraryTRANSFAC MATRIX TABLE, Release 2020.2
Sequence fileMTBP_PM000918140
Profilevertebrate_non_redundant_minFP.prf
Only high-quality matricesYes
Cut-offsMinimize false positives
Table 3. Summary of dose and effect values generated from the combination experiment (SKOV3 cells).
S. trilobaPaclitaxelCombination **
Dose (µg/mL)Effect *Dose (µg/mL)Effect *Total Dose (µg/mL)Effect *
0.250.010.010.010.25370.01
190.410770.7870.9753619.7870.88325
380.511151.5740.9775239.5740.85706
760.31873.1480.979.1480.83451
1520.651966.2960.95046158.2960.81048
3040.912.5920.97428316.5920.9
* Fraction of cells inhibited by treatment; ** S. triloba + Paclitaxel.
Table 4. Median effect dose for SKOV3 cells.
DrugDm * (µg/mL)m **r ***
S. triloba50.92820.858540.9587
Paclitaxel0.220621.14170.89187
S. triloba + Paclitaxel13.83570.950520.91799
* median effect dose; ** slope of the median-effect (ME) plot; *** linear correlation coefficient of the ME-plot.
Table 5. Summary of combination index (CI) values for SKOV3 cells.
Combination Total Dose (µg/mL)Effect *CI ValueCI Description **
0.25370.013.5694Strong antagonism
19.7870.88330.6415Synergism
39.5740.85711.5787Antagonism
79.1480.83453.6856Strong antagonism
158.2960.81058.5413Strong antagonism
316.5920.98.7917Strong antagonism
* Fraction of cells inhibited by treatment; ** CI descriptions retrieved from Chou (2006) [39].
Table 6. Dose reduction index (DRI) values calculated at experimental points for SKOV3 cells.
Effect *DRI S. trilobaDRI Paclitaxel
0.010.99040.3907
0.883328.30341.6498
0.857110.79450.6729
0.83454.41150.2891
0.81051.82050.1251
0.92.16550.1201
* Fraction of cells inhibited by treatment.
Table 7. RUNX2 transcription factor binding sites within MDM2 promoter.
Factor NameRUNX2
TFBS *123456
Core similarity score1.001.000.8951.001.001.00
Matrix similarity score0.9980.9180.9060.8940.8930.913
Start position **687992456879993468806888688074526880806368809252
End position **687992546879994368806897688074616880807268809261
SequenceCAACCACAAGGAACCACTTAAAGCCACATACCACCACGCCGAGGTGGTGCTAACCACCTC
ReferenceArrayExpress [47]ArrayExpress [47]GEO [48] GEO [49]ArrayExpress [47]ArrayExpress [47]
* Transcription factor binding sites; ** Relative to transcription start site.
Table 8. Retention factors of S. triloba acetone extract fractionations.
Distance Traveled by Fraction (cm)Distance Traveled by Solvent Front (cm)Retention Factor
2.5411.430.2222
4.44511.430.3889
6.502411.430.5689
9.220211.430.8067
Publisher’s Note: MDPI stays neutral with regard to jurisdictional claims in published maps and institutional affiliations.

