Article

Automatic Pressure Gelation Analysis for Insulating Spacer of Gas Insulated Switchgear Manufactured by Bio-Based Epoxy Composite

1
Department of Electrical and Computer Engineering, Sungkyunkwan University, Suwon 16419, Gyeonggi-do, Korea
2
R&D Center, Dongwoo Electric Corp., 34, Oseongseo-ro, Anjung-eup, Pyeongtaek-si 17928, Gyeonggi-do, Korea
*
Authors to whom correspondence should be addressed.
Appl. Sci. 2022, 12(20), 10202; https://doi.org/10.3390/app122010202
Submission received: 8 September 2022 / Revised: 29 September 2022 / Accepted: 8 October 2022 / Published: 11 October 2022

Abstract

:
In the case of the existing power equipment business, a variety of insulation and accessories is manufactured with petroleum-based epoxy resins. However, as petrochemical resources are gradually limited and concerns about the environment and economy grow, the power equipment industry has recently studied many insulating materials using bio-based epoxy to replace petroleum feedstock-based products in order to produce insulators using eco-friendly materials. In this paper, the simulation of the automatic pressure gelation process was performed by obtaining parameter values of curing kinetics and chemical rheology through physical properties analysis of bio-based epoxy complexes and applying them to Moldflow software. The simulation results were compared and analyzed according to the temperature control of each heater in the mold, while considering the total curing time, epoxy flow, and curing condition. A temperature condition of 140 °C/140 °C/135 °C/135 °C/130 °C/130 °C/120 °C/120 °C provided the optimal curing conditions. Based on the temperature conditions of the simulation results, the actual GIS spacer was manufactured, and x-ray inspection was performed to check the moldability.

1. Introduction

Recently, with the rapid progress of the information society, the dependence of social functions on electricity is increasing. Because of the surge in power demand, the power system is also becoming large-capacity and ultra-high voltage, and accordingly, stabilization and reliability of power facilities has become very important. Therefore, substation facilities are changing, in particular conventional air- or oil-insulated substations are changing to gas-insulated substations [1,2,3].
A gas-insulated switchgear (GIS) was introduced in the 1960s in substations, and it offers high power transmission and switching capability in very limited installation space with delivery of high power and reliability [4]. The GIS tank is filled with sulfur hexafluoride (SF6) gas, which has excellent insulation and extinguishing ability as an insulating medium, and the filling part of the GIS is supported by a solid insulating epoxy spacer [5,6]. Because of its good characteristics, epoxy resin is used for the spacer, and by using an automatic pressure gelation (APG) molding process, complex structures, such as home appliances, automobile parts, and electronic equipment parts [7,8,9,10,11,12,13] can be manufactured.
Recently, due to concerns about environmental pollution and gradually depleting petrochemical resources, interest in bio-based epoxy resin to replace petroleum-based epoxy resin has been growing [14,15,16]. The bio-based epoxy resin is cost-effective and can reduce the stress, lower the viscosity, and strengthen the solidity of epoxy resins [17,18,19,20,21,22,23]. Normally, in the APG process, the resin mixture in a relatively low temperature state is supplied using pressure in a high temperature sealed mold, and the curing accelerator contained in the resin mixture reacts rapidly due to the temperature difference. Then, the mixture is changed to a gel form within a short time until the curing is completed, and this method can compensate for reaction contraction by continuously supplying the liquid mixture under pressure [24]. However, because the APG process relies on empirical predictions, the use of new materials can lead to unexpected results, so it is difficult to find an optimized process condition. Especially, in the case of bulky injection moldings, it is necessary to optimize according to each heater temperature of the mold in consideration of mechanical characteristics and stability of the product due to the temperature difference of the lower mold near the injection hole when injecting resin. However, empirical prediction is not appropriate in such complex conditions; therefore, to effectively optimize the temperature and APG process conditions of each part of the mold, accurate simulation and analysis should be performed to consider all variables, such as epoxy resin, heat temperature, etc. [25].
In this research, the process of the bio-epoxy-based GIS spacer was simulated and analyzed to find the optimized process conditions before manufacturing. The spacer was 3D-modeled first by Moldflow, and then, the APG process was simulated using thermosetting resin bio-based epoxy composite. Based on the measured data, the simulation was conducted considering temperature, mold temperature, heater temperature, injection time, and injection pressure. The optimized process conditions were presented to suggest optimized APG process conditions, and the GIS spacer was manufactured based on the optimal conditions.

2. Materials and Methods

To prepare bio-based epoxy composite, diglycidyl ether of bisphenol-A (DGEBA)-based YD-127 (Kukdo Chemical, Seoul, Korea) and the bio-oil were mixed followed by adding methyl hexahydrophthalic anhydride (MHHPA; 4-methyl-1,2-cyclohexanedicarboxylic anhydride) as the curing agent. The percentage of the bio-oil in the epoxy composite was 18%. In addition, since the cured epoxy is brittle and has weak impact resistance, core shell rubber with size of 4 μm and 12 μm alumina were added to improve impact characteristics. In order to simulate the APG process of an insulating spacer for GIS, it was necessary to analyze the characteristics of the bio-based epoxy composite, and measured values were converted into the database in the Moldflow program. Preferentially, differential scanning calorimeter (DSC) equipment was used to measure the curing behavior of bio-based epoxy complexes, and in the case of measurement conditions, it was measured at a temperature range of 30 °C to 300 °C at a heating rate of 5, 10, 20, and 40 °C/min. Additionally, analysis was conducted on specific heat capacity of the bio-based epoxy composite. In the case of specific heat capacity, measurement was carried out at a rate of 20 °C/min in a nitrogen atmosphere between 0 and 250 °C. For the parallel plate rheology, a STRESSTECH HR rheometer (ASTM-D4440-15, Reologica instruments, Lund, Sweden) was used to measure dynamic viscosity depending on the resin temperature. Prior to each test, strain was set to 1.0%, and the temperature range was set to 30 to 200 °C. Measurement was carried out at three frequencies, 1 rad/s, 5 rad/s, and 10 rad/s, and each frequency was carried out at 2 °C/min, 5 °C/min, and 10 °C/min rates, respectively, so measurement proceeded for nine conditions. However, if the epoxy complex is cured during Rheology measurement, measurement is no longer possible, so measurement was carried out at a slow heating rate (2 °C/min and 5 °C/min). Thermal conductivity was measured by producing a disk-shaped sample with a diameter of about 50 mm using equipment from Fox 50 Heat Flow Meter (TA Instruments, New Castle, US), and the measurement was performed at a temperature of 80 °C. The weight of the sample was 17.5 g with a thickness of 4.03 mm. Pressure, volume, and temperature (PvT) measurements were performed through Gammadot (Rheology and Material Characterisation Services, Bomere Heath, United Kingdom) Rheology, and in the case of the measurement conditions, a specific volume was measured in the range of temperature (23 to 420 °C) and pressure (5.0 × 10⁶ to 2.0 × 10⁸ pa).
α   Conversion = Δ H t Δ H Total = 1 Δ H Total 0 t dH dt dt
where ∆Ht is the area of the change amount up to t sec, and ∆HTotal is the total area of the change amount, that is, the entire reaction heat. In addition, the epoxy–amine system used a kamal-sourour kinetics model that can adequately explain curing dynamics as a self-catalyzed model for curing reactions. The curing rate according to the curing degree is as shown in the following Equations (2) and (3) [26,27,28,29,30,31,32,33,34].
d α dt = k 1 + k 2 α m 1 α n
k i = k 0 e E ai / RT
In the formula above, dα/dt is the isothermal curing rate, k 1 is the reaction rate constant primary epoxy–amine reaction rate, k 2 is the reaction rate constant secondary epoxy–amine reaction rate, k 0 is the exponential front factor, α is the conversion rate, m, n is the order of reaction, R is the gas constant, and E a is the activation energy. For the rheometer measurement results, Cross Castro–Macosko Model Equation (4) [35,36], a reactive viscosity model frequently used in epoxy resins that explains the occurrence of chemical reactions and changes in viscosity, was used. Equation (4) shows that viscosity depends only on temperature and curing and does not depend on shear rate. Therefore, it was converted into a reactive visibility variable through the improved Equation (5) [37,38,39] of the Castro–Macosko model, which has a dependence on shear rate, and applied to the Moldflow process [40,41,42]. In the equation below, n is viscosity, T is temperature, α g is curing at gelation point, α is curing, C 1 ,   C 2 is experimental constant, τ* is critical shear stress, and γ is shear rate.
n α ,   T ,   γ =   n 0 T α g α g α C 1 + C 2 α   where   n 0 T = Bexp T b T
n α ,   T ,   γ = n 0 T 1 + n 0 T γ τ * 1 n α g α g α C 1 + C 2 α  
In this paper, Moldflow software (Autodesk, San Rafael, CA, USA) was used to simulate the APG process of an insulating spacer for GIS. Figure 1 shows a 3D modeled spacer for GIS and a 3D mesh image. Because changes in heater temperature do not affect the mold shape, we only showed one figure although we have 4 different conditions. As a component of the GIS spacer, there are 16 inserts in the outer shell and 3 inserts in the center. The spacer drawings were modified by creating a mesh in dual domain type, and then converted it to a solid 3D type mesh. About 5.6 million meshes were used for 3D modeling, and about 4.4 million meshes were used for the spacer mold. A contact surface mesh between the insert and the spacer was integrated to prevent a calculation error caused by mesh. In addition, a total of 16 heaters were arranged with 8 heaters each on the front and rear sides for heating the mold. The heater size was designated as 16 mm in the same size as the actual mold, and the inlet size was designated as 20 mm.
The designed heater was simulated by tying each heater together as shown in Figure 2 to derive optimal curing conditions by dividing each heater into subdivisions in consideration of heater position and mold thickness.
The thermal characteristics of the mold were simulated by applying tool steel P-1 material. Table 1 shows the thermal characteristics of the mold used in the Moldflow simulation. In the case of inserting parts into spacers, aluminum attributes of the set value of the Moldflow program were given, and the initial temperature of each insert was set to 140 °C. In the simulation, the temperature of the resin was set to 63 °C provided by the manufacturer, and the injection time was set to 350 s. Each heater temperature condition of the mold is shown in Table 2 and Table 3. After that, the internal temperature, curing degree, and viscosity over time were compared and analyzed through simulation analysis of optimal curing conditions using bio-based epoxy complexes and curing conditions of petroleum-based epoxy.

3. Results and Discussion

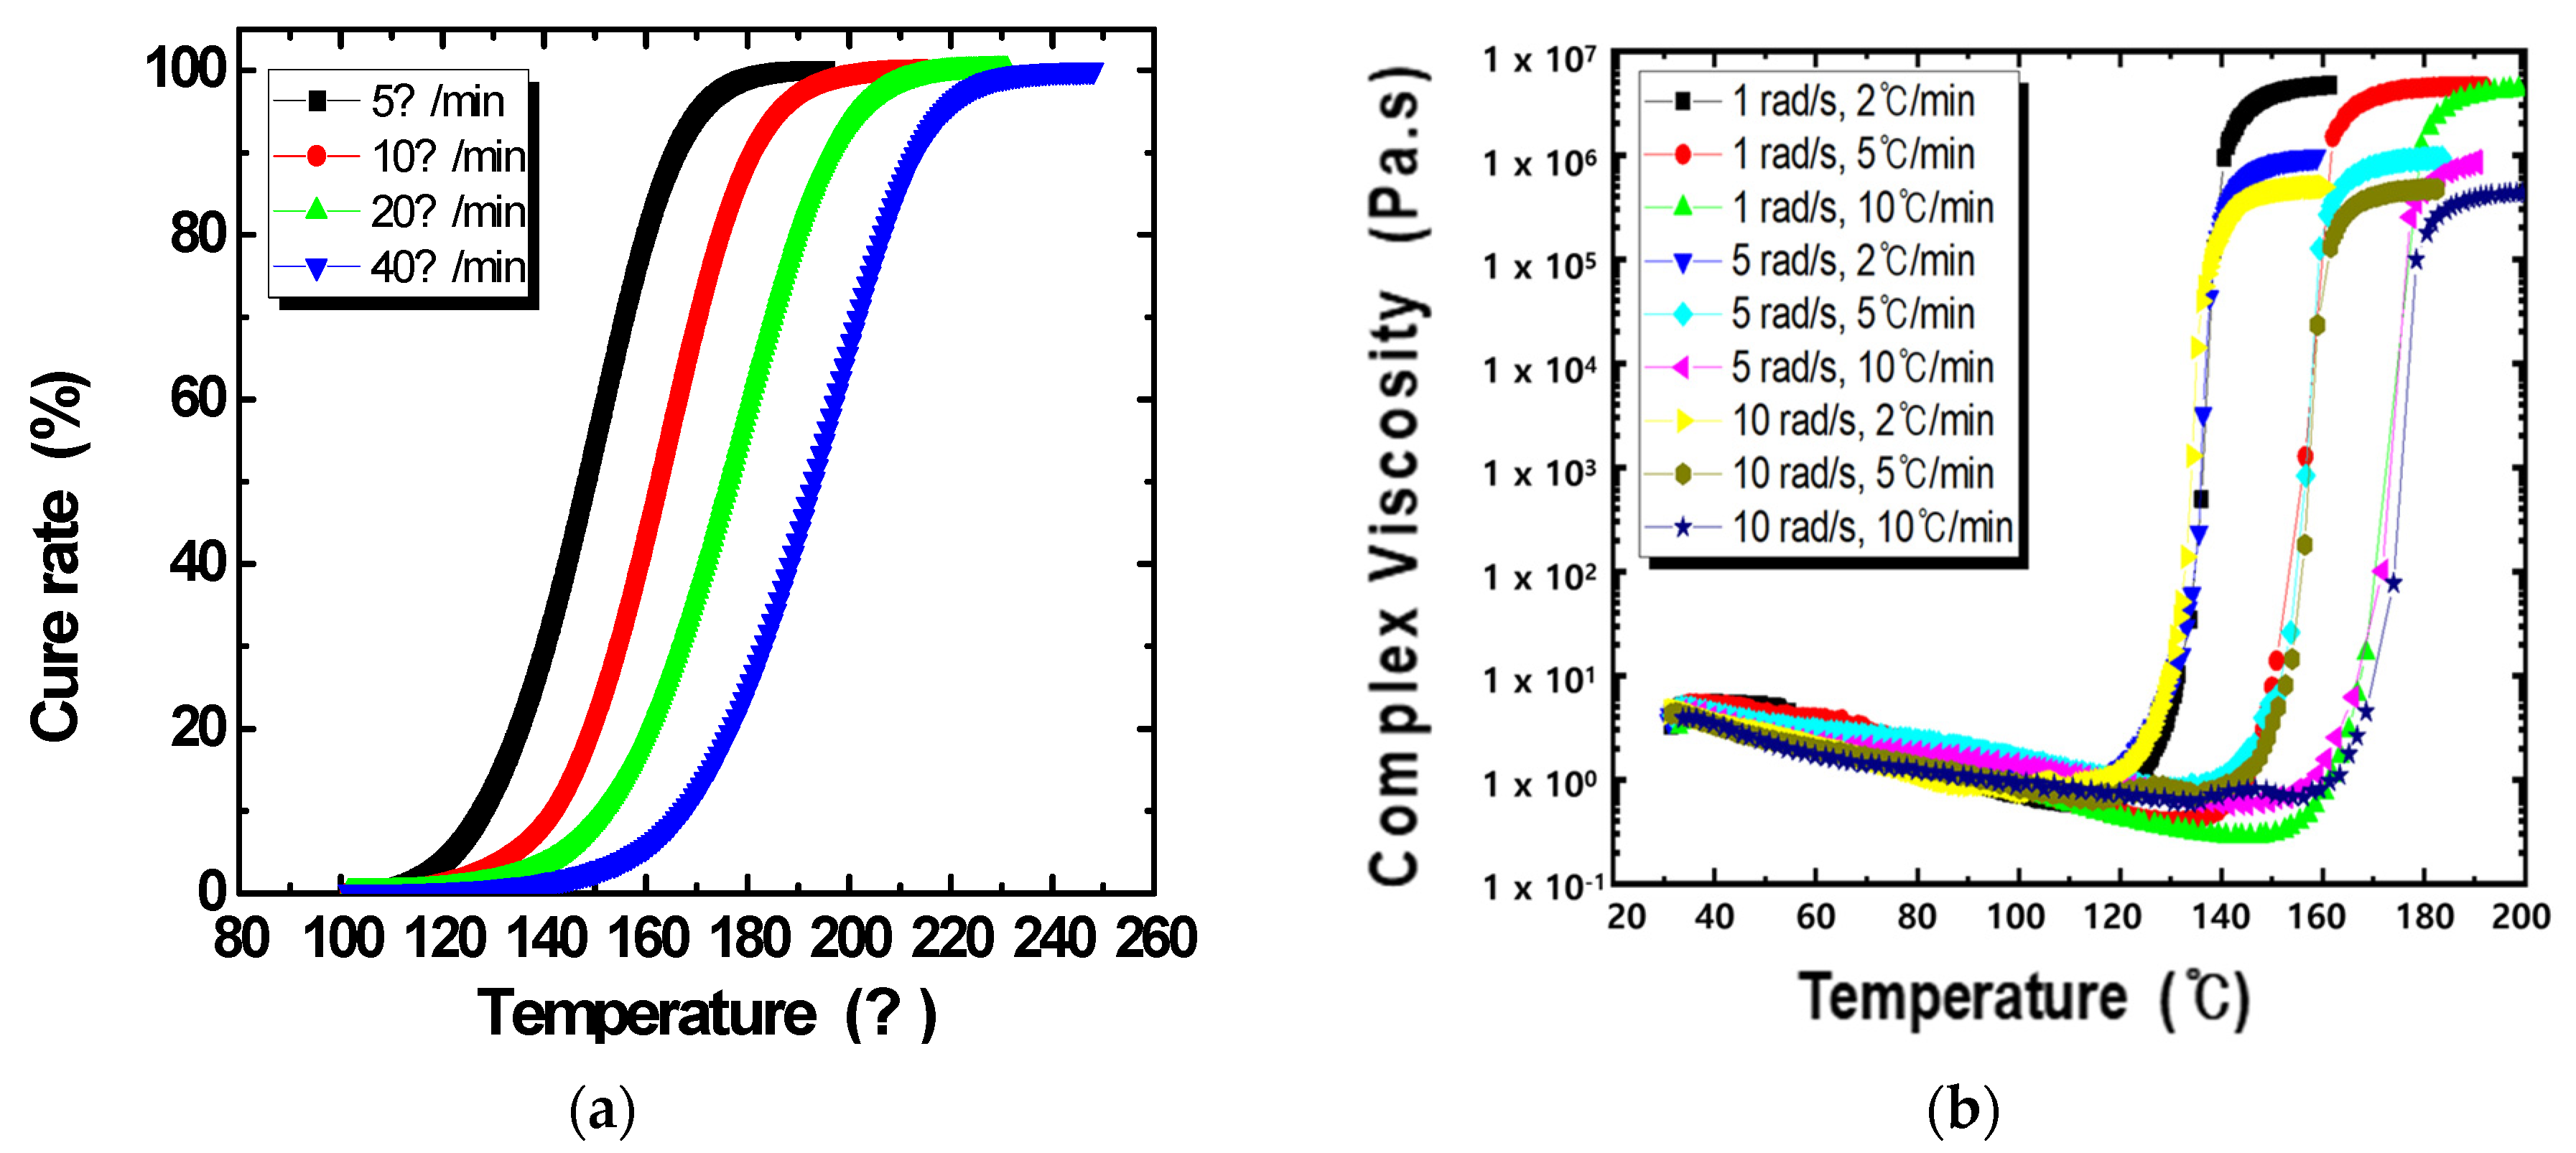
3.1. Measurement of Bio-Based Epoxy Composite Properties

Figure 3 shows DSC and rheometer measurement graphs of the bio-based epoxy in the cure rate and viscosity. The heating conditions were varied to accurately analyze changes in physical properties according to heating rate [43]. As shown, the cure rate started to change from 120 °C to 140 °C. Similar trends were also shown in the rheometer. It can be seen that curing begins with a rapid increase in the viscosity value of the resin between 115 °C and 140 °C. Simulation analysis was performed by specifying the heater value range set in the Moldflow simulation to be between 120 °C and 140 °C.

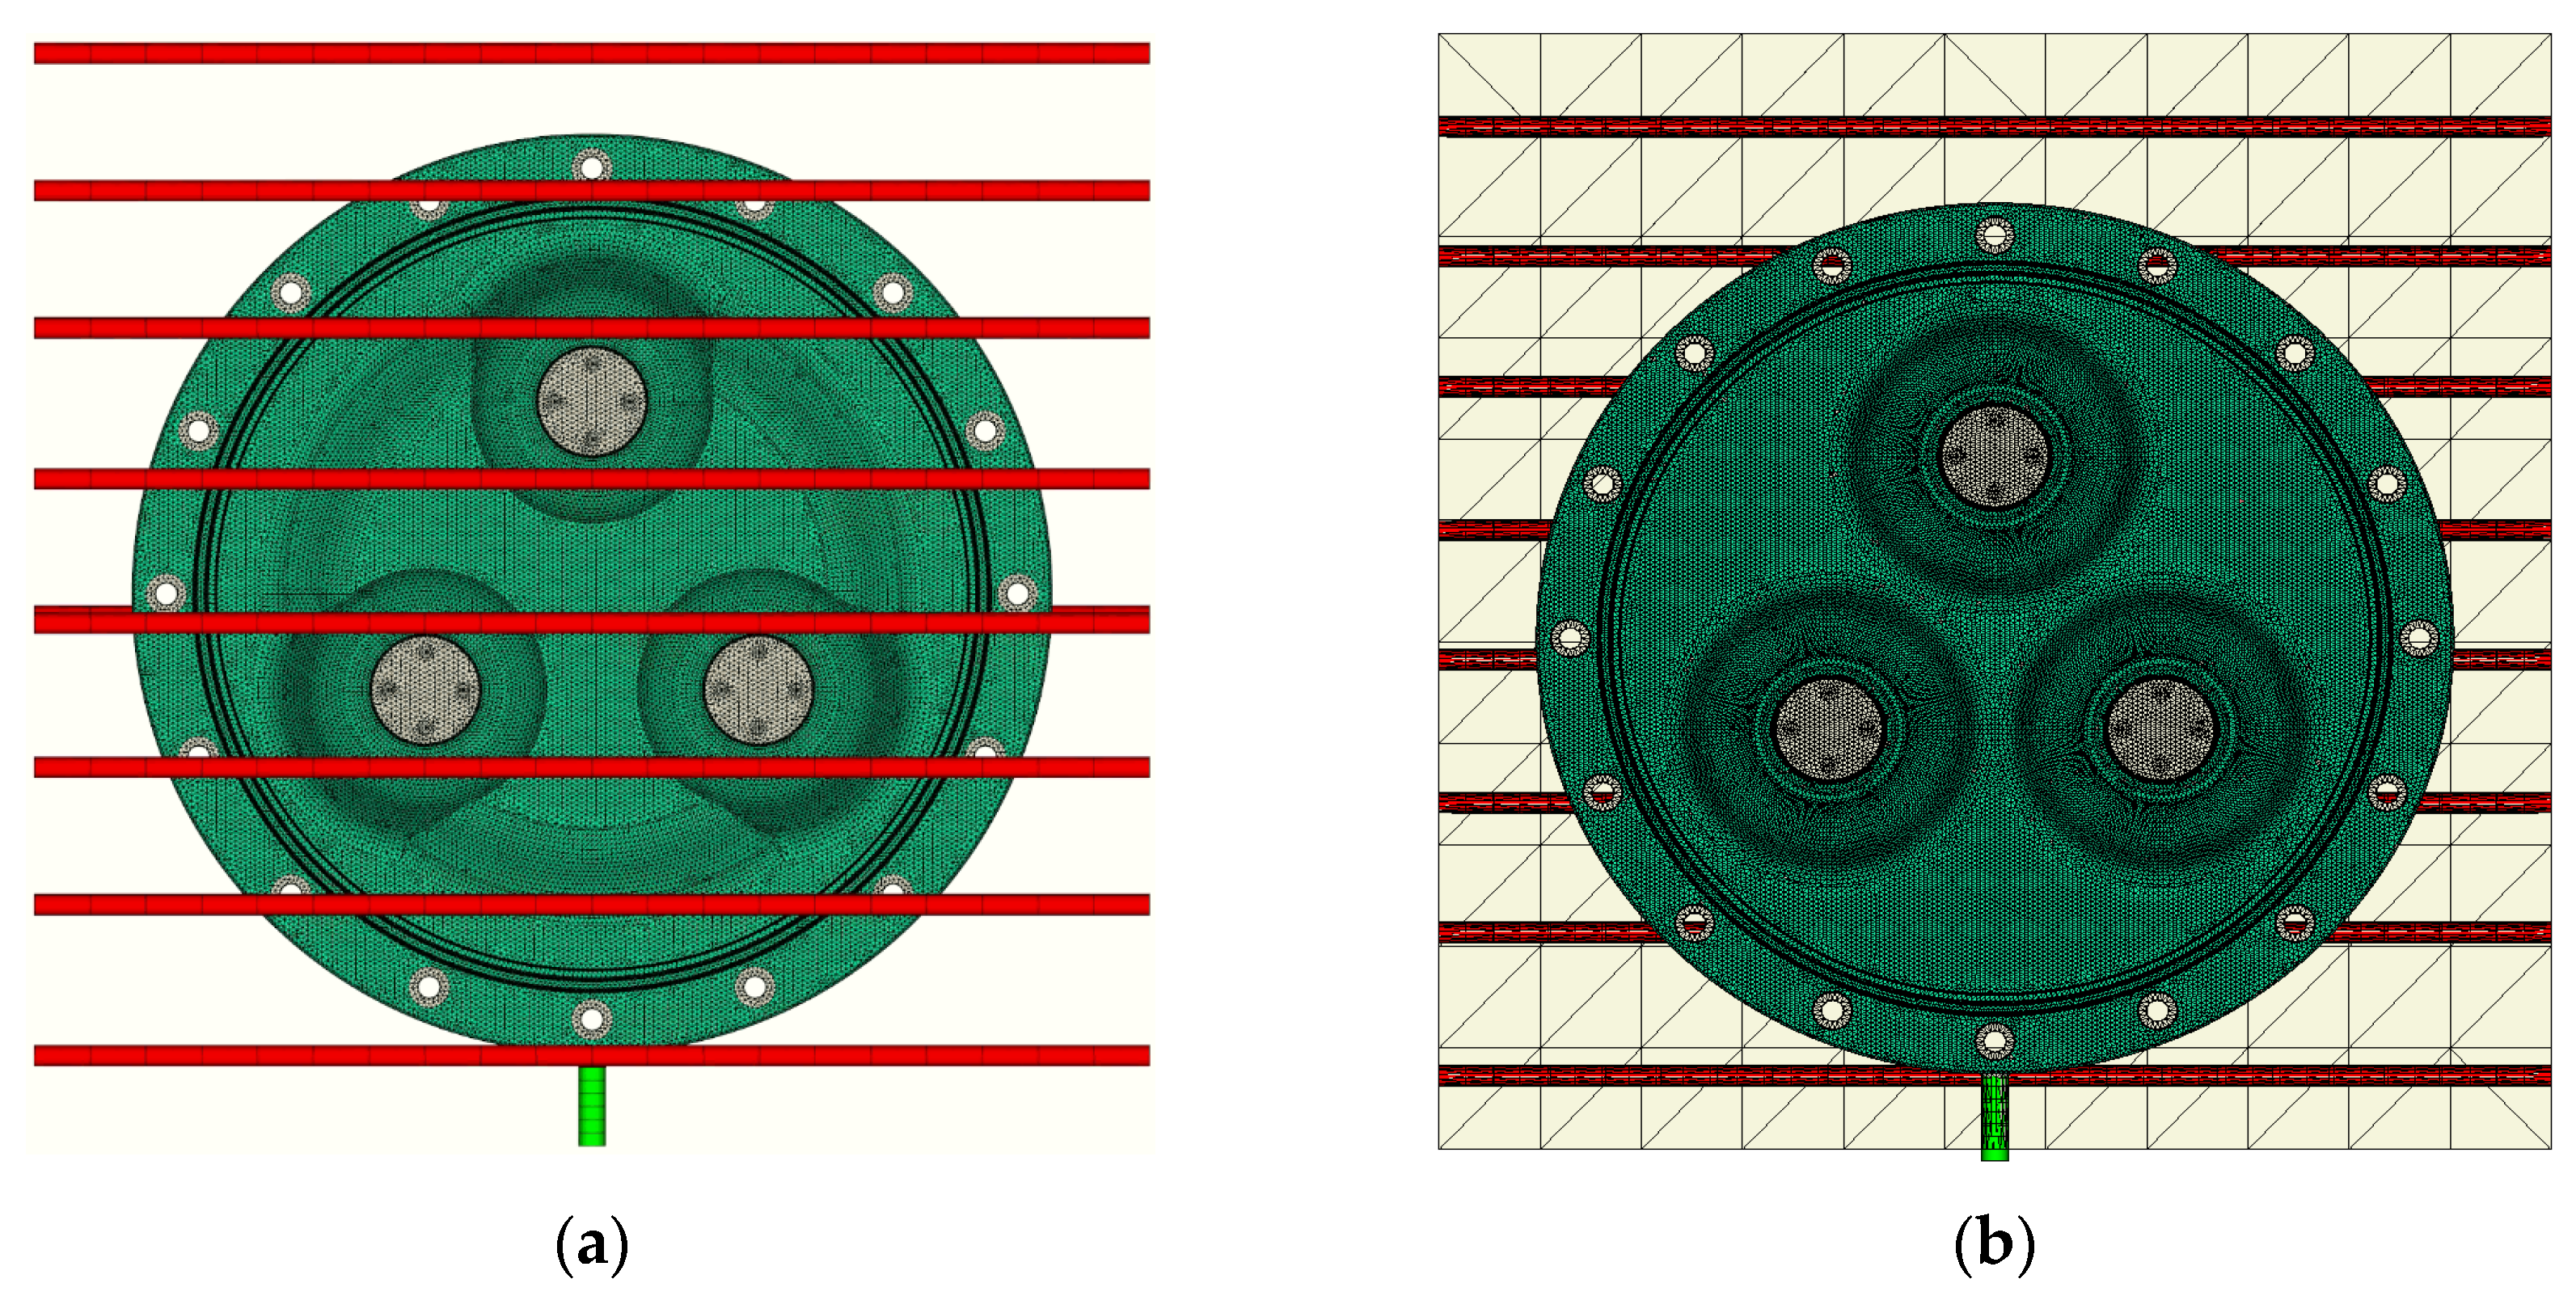
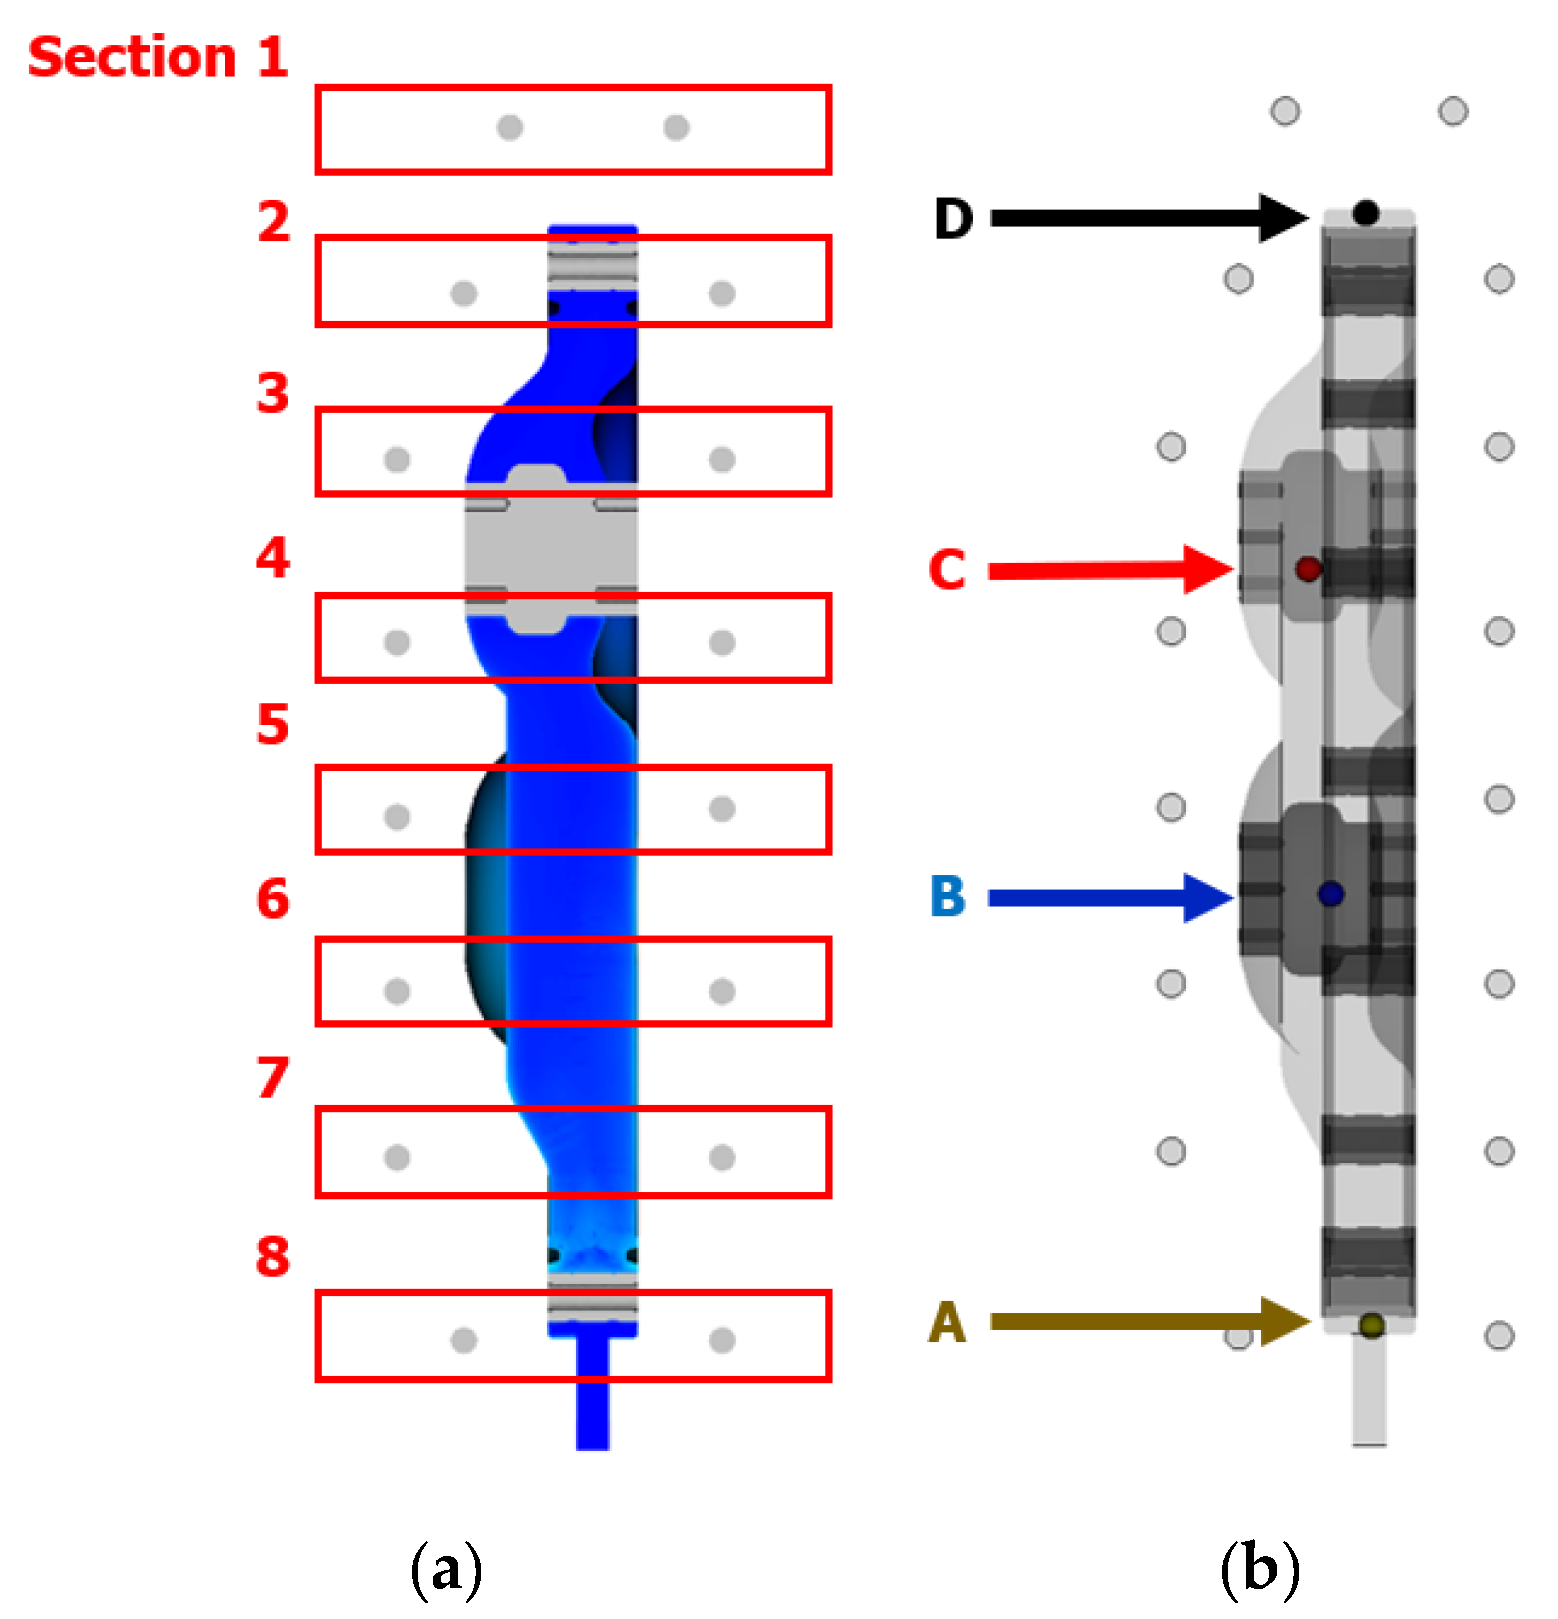
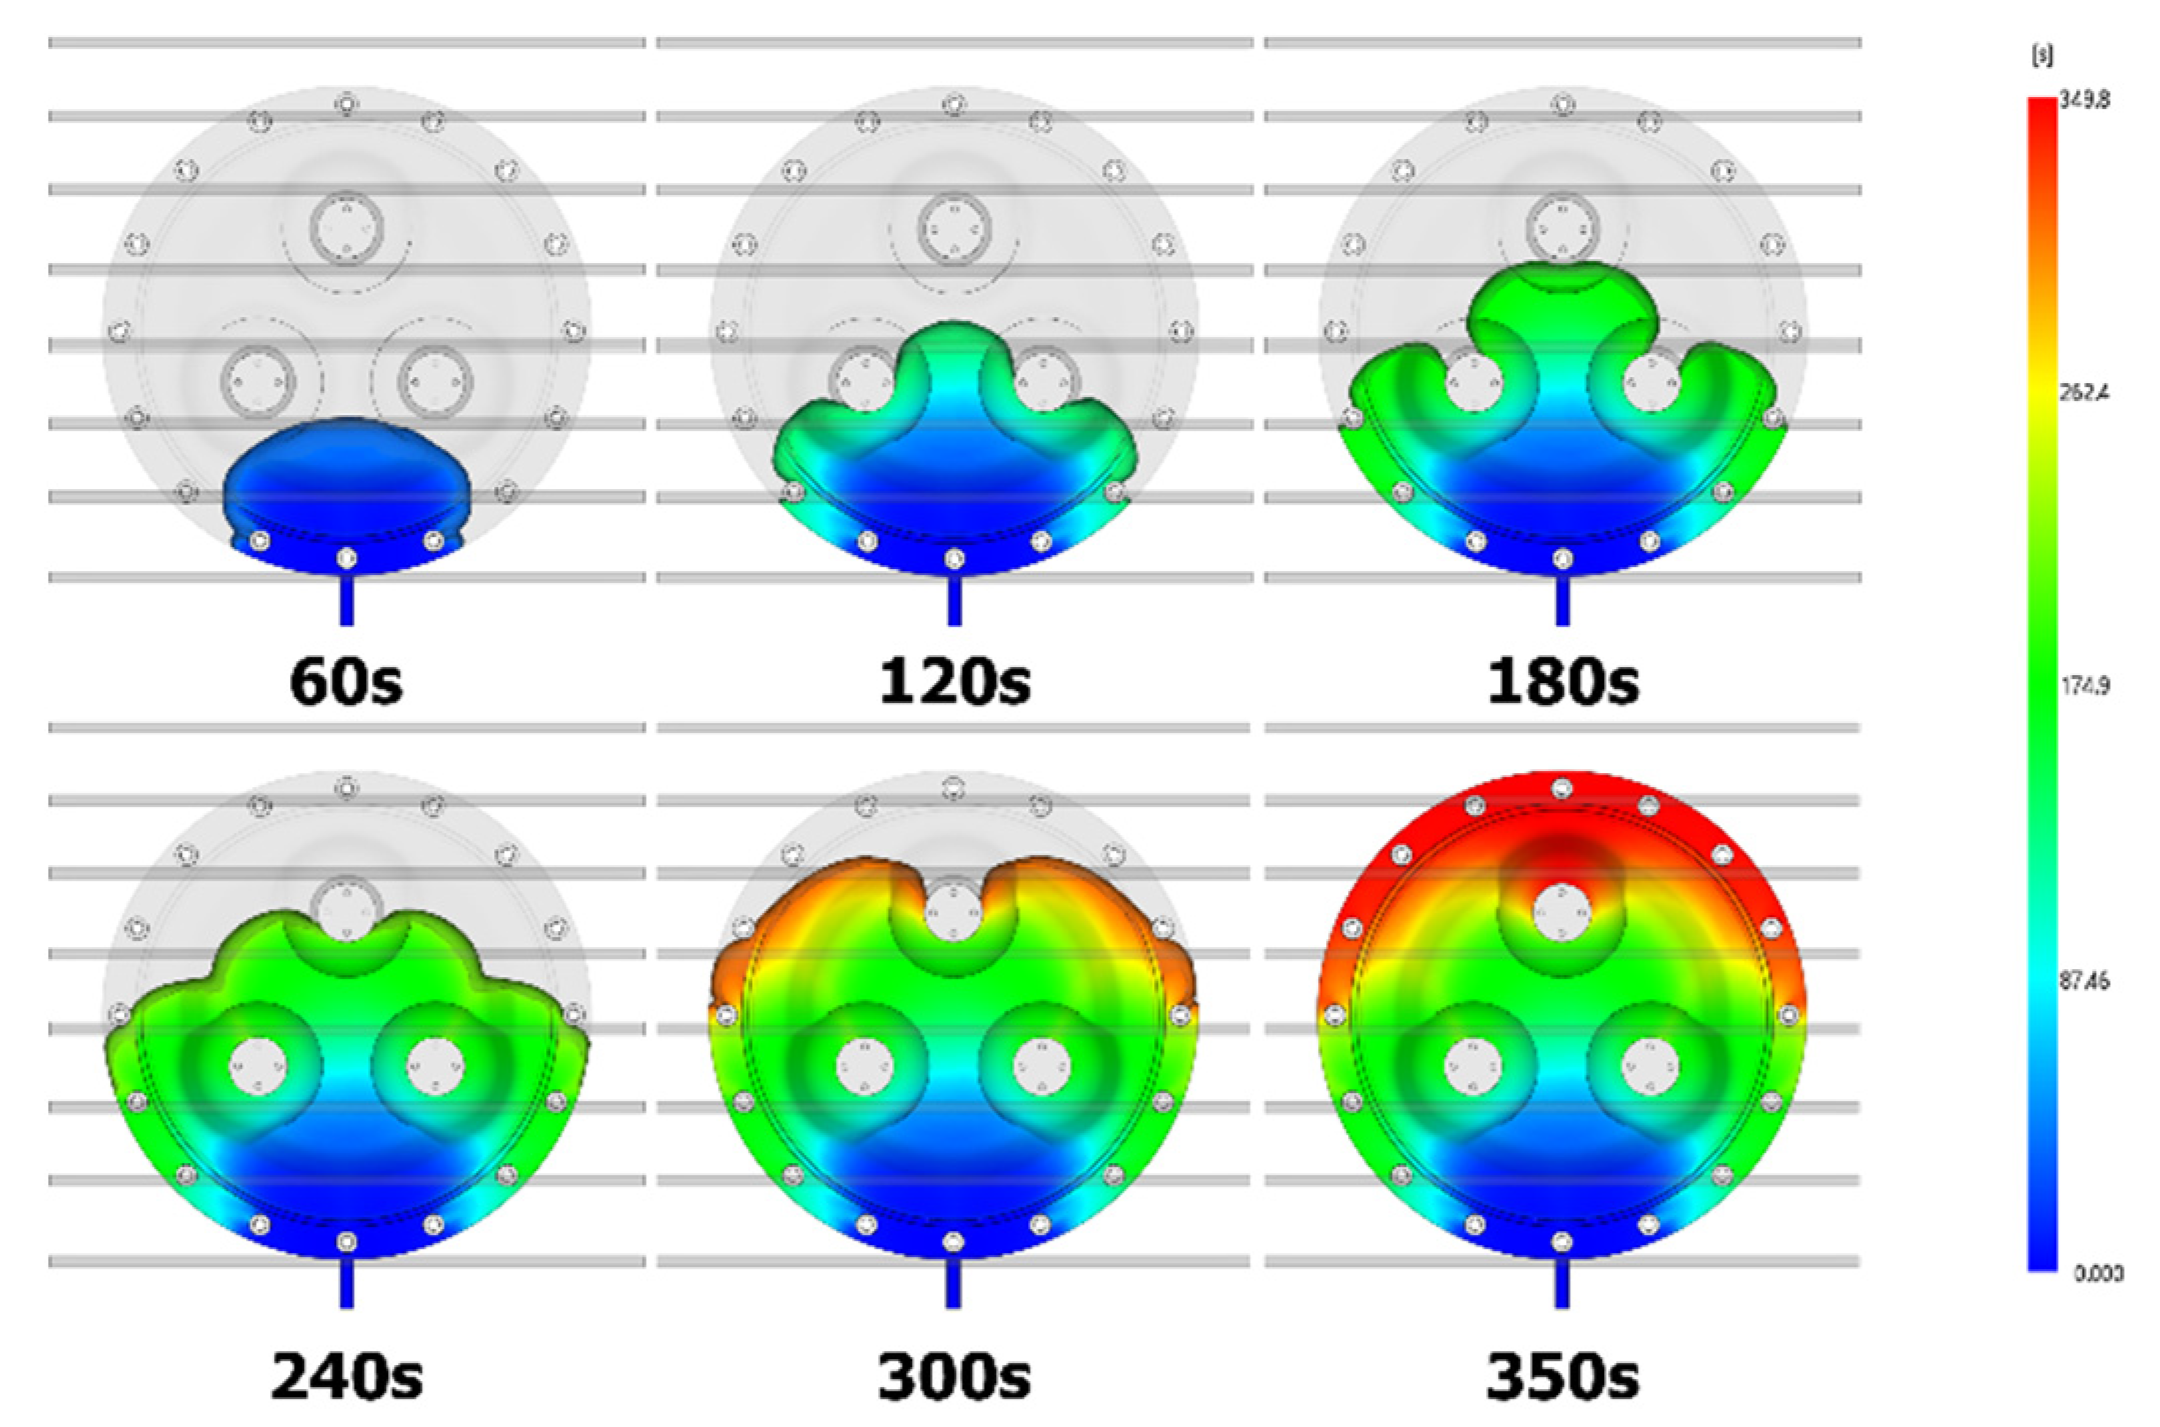
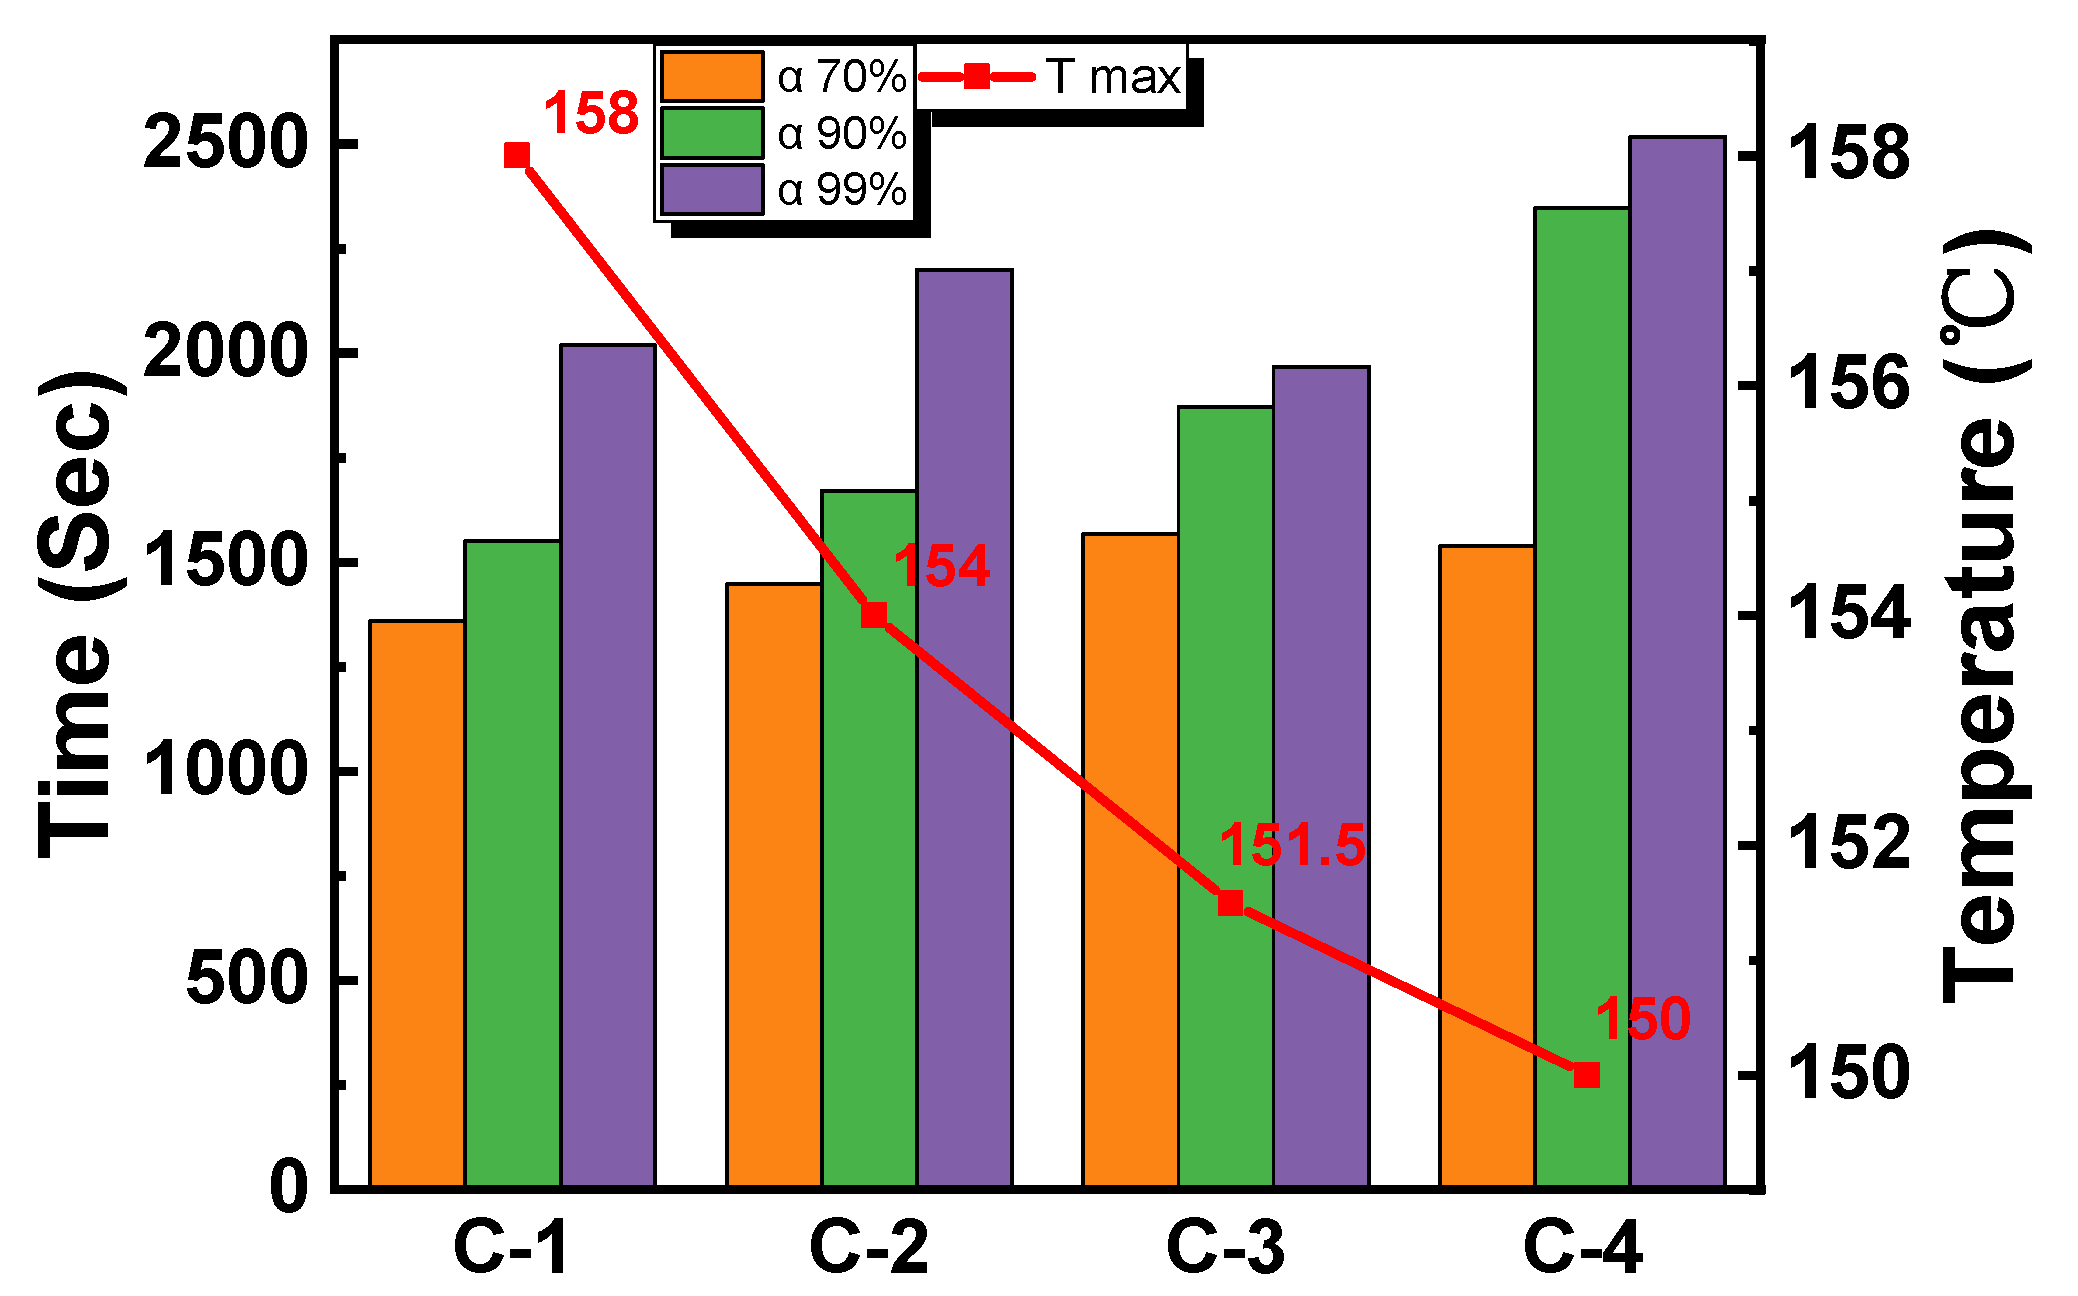
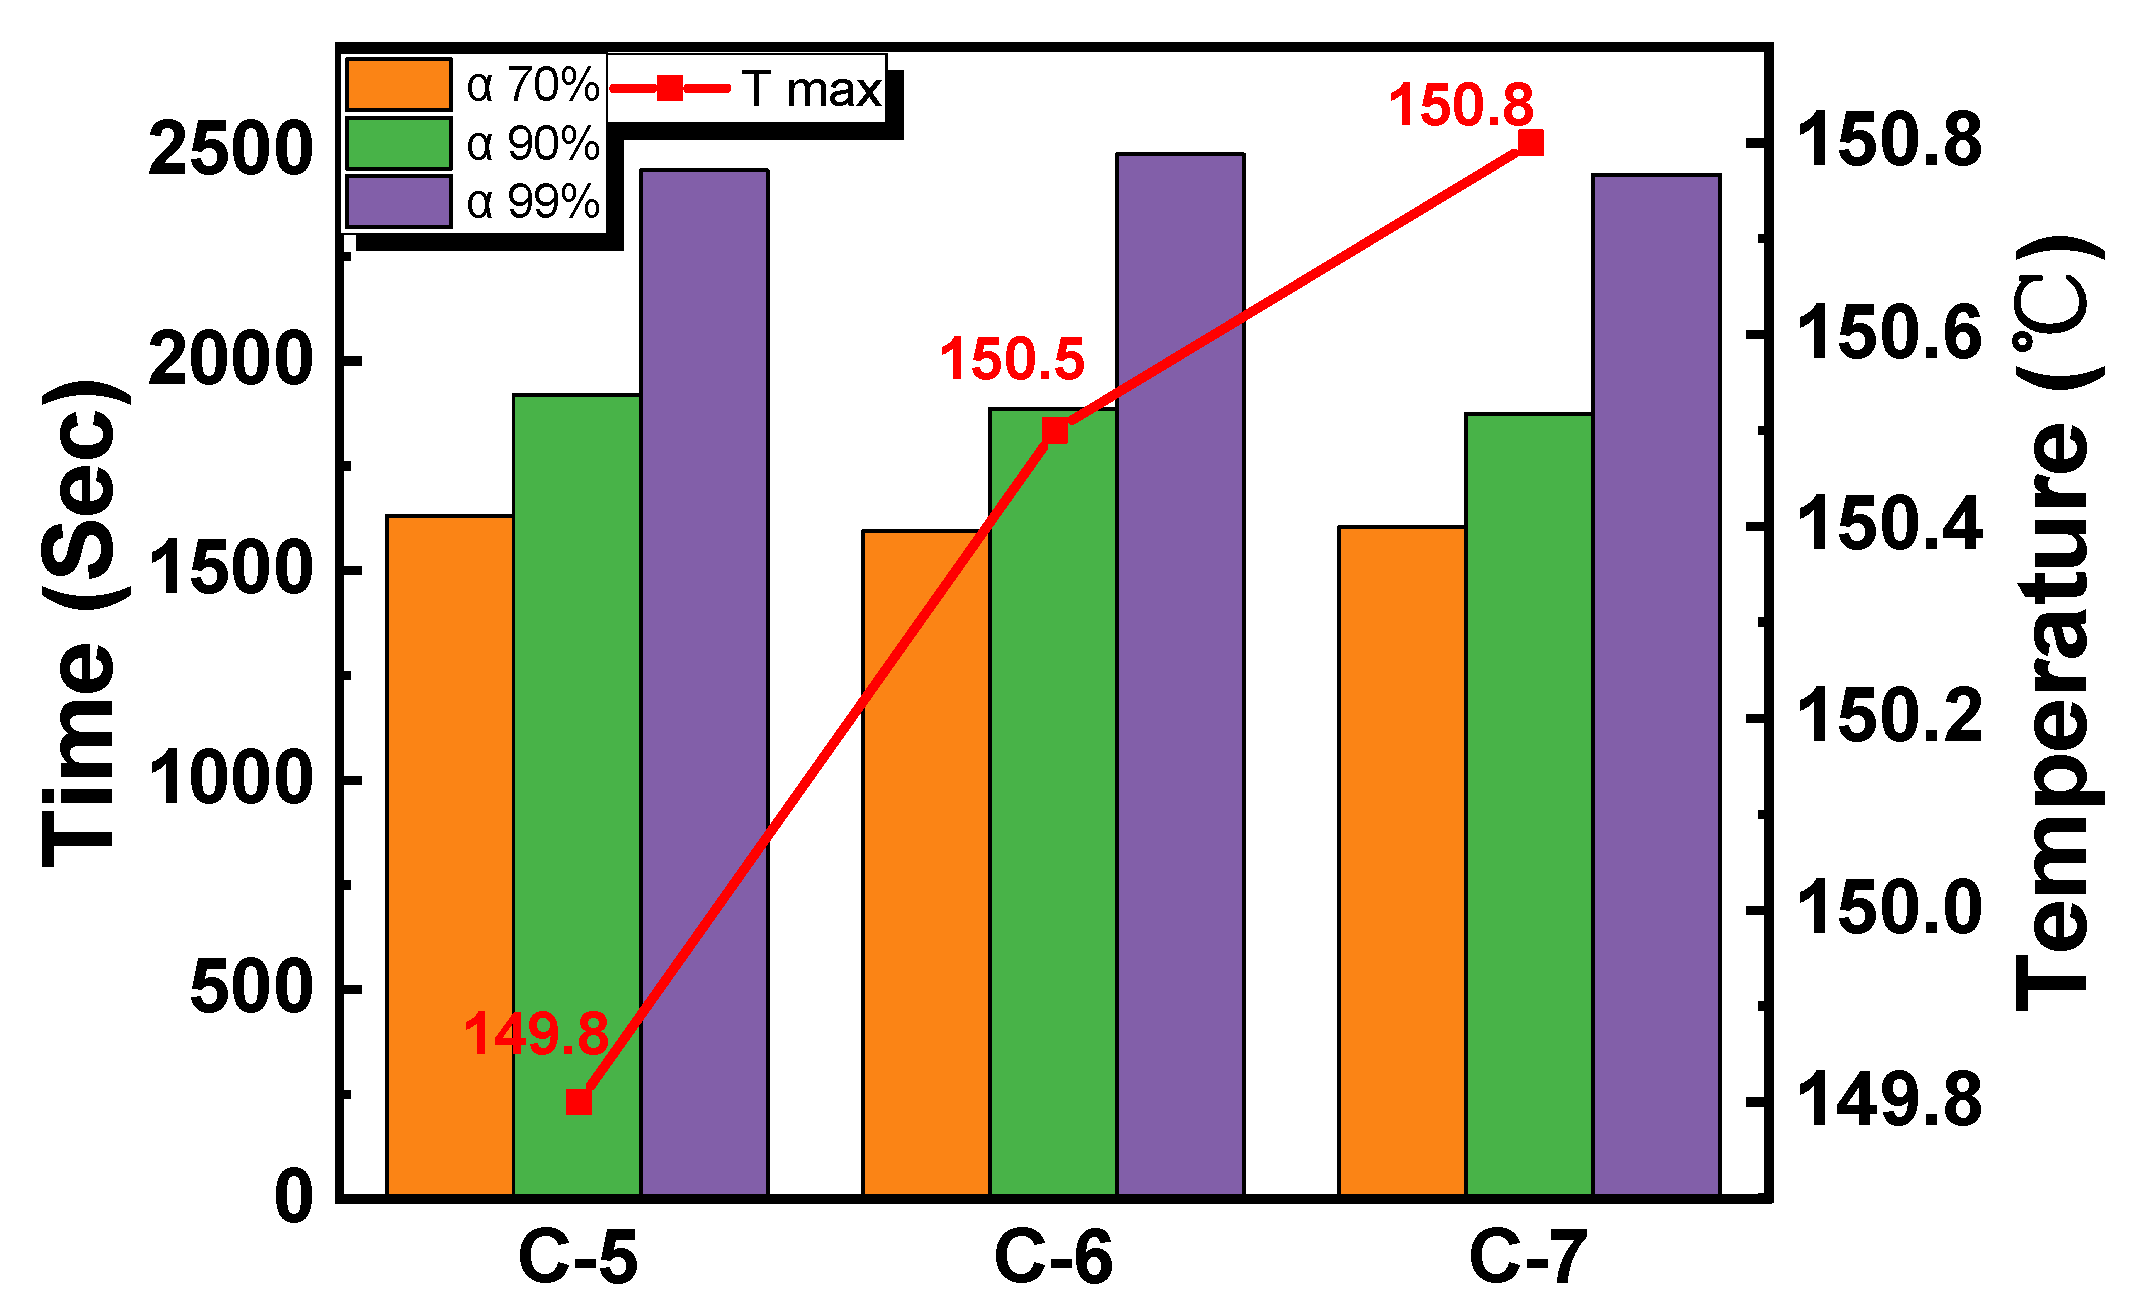
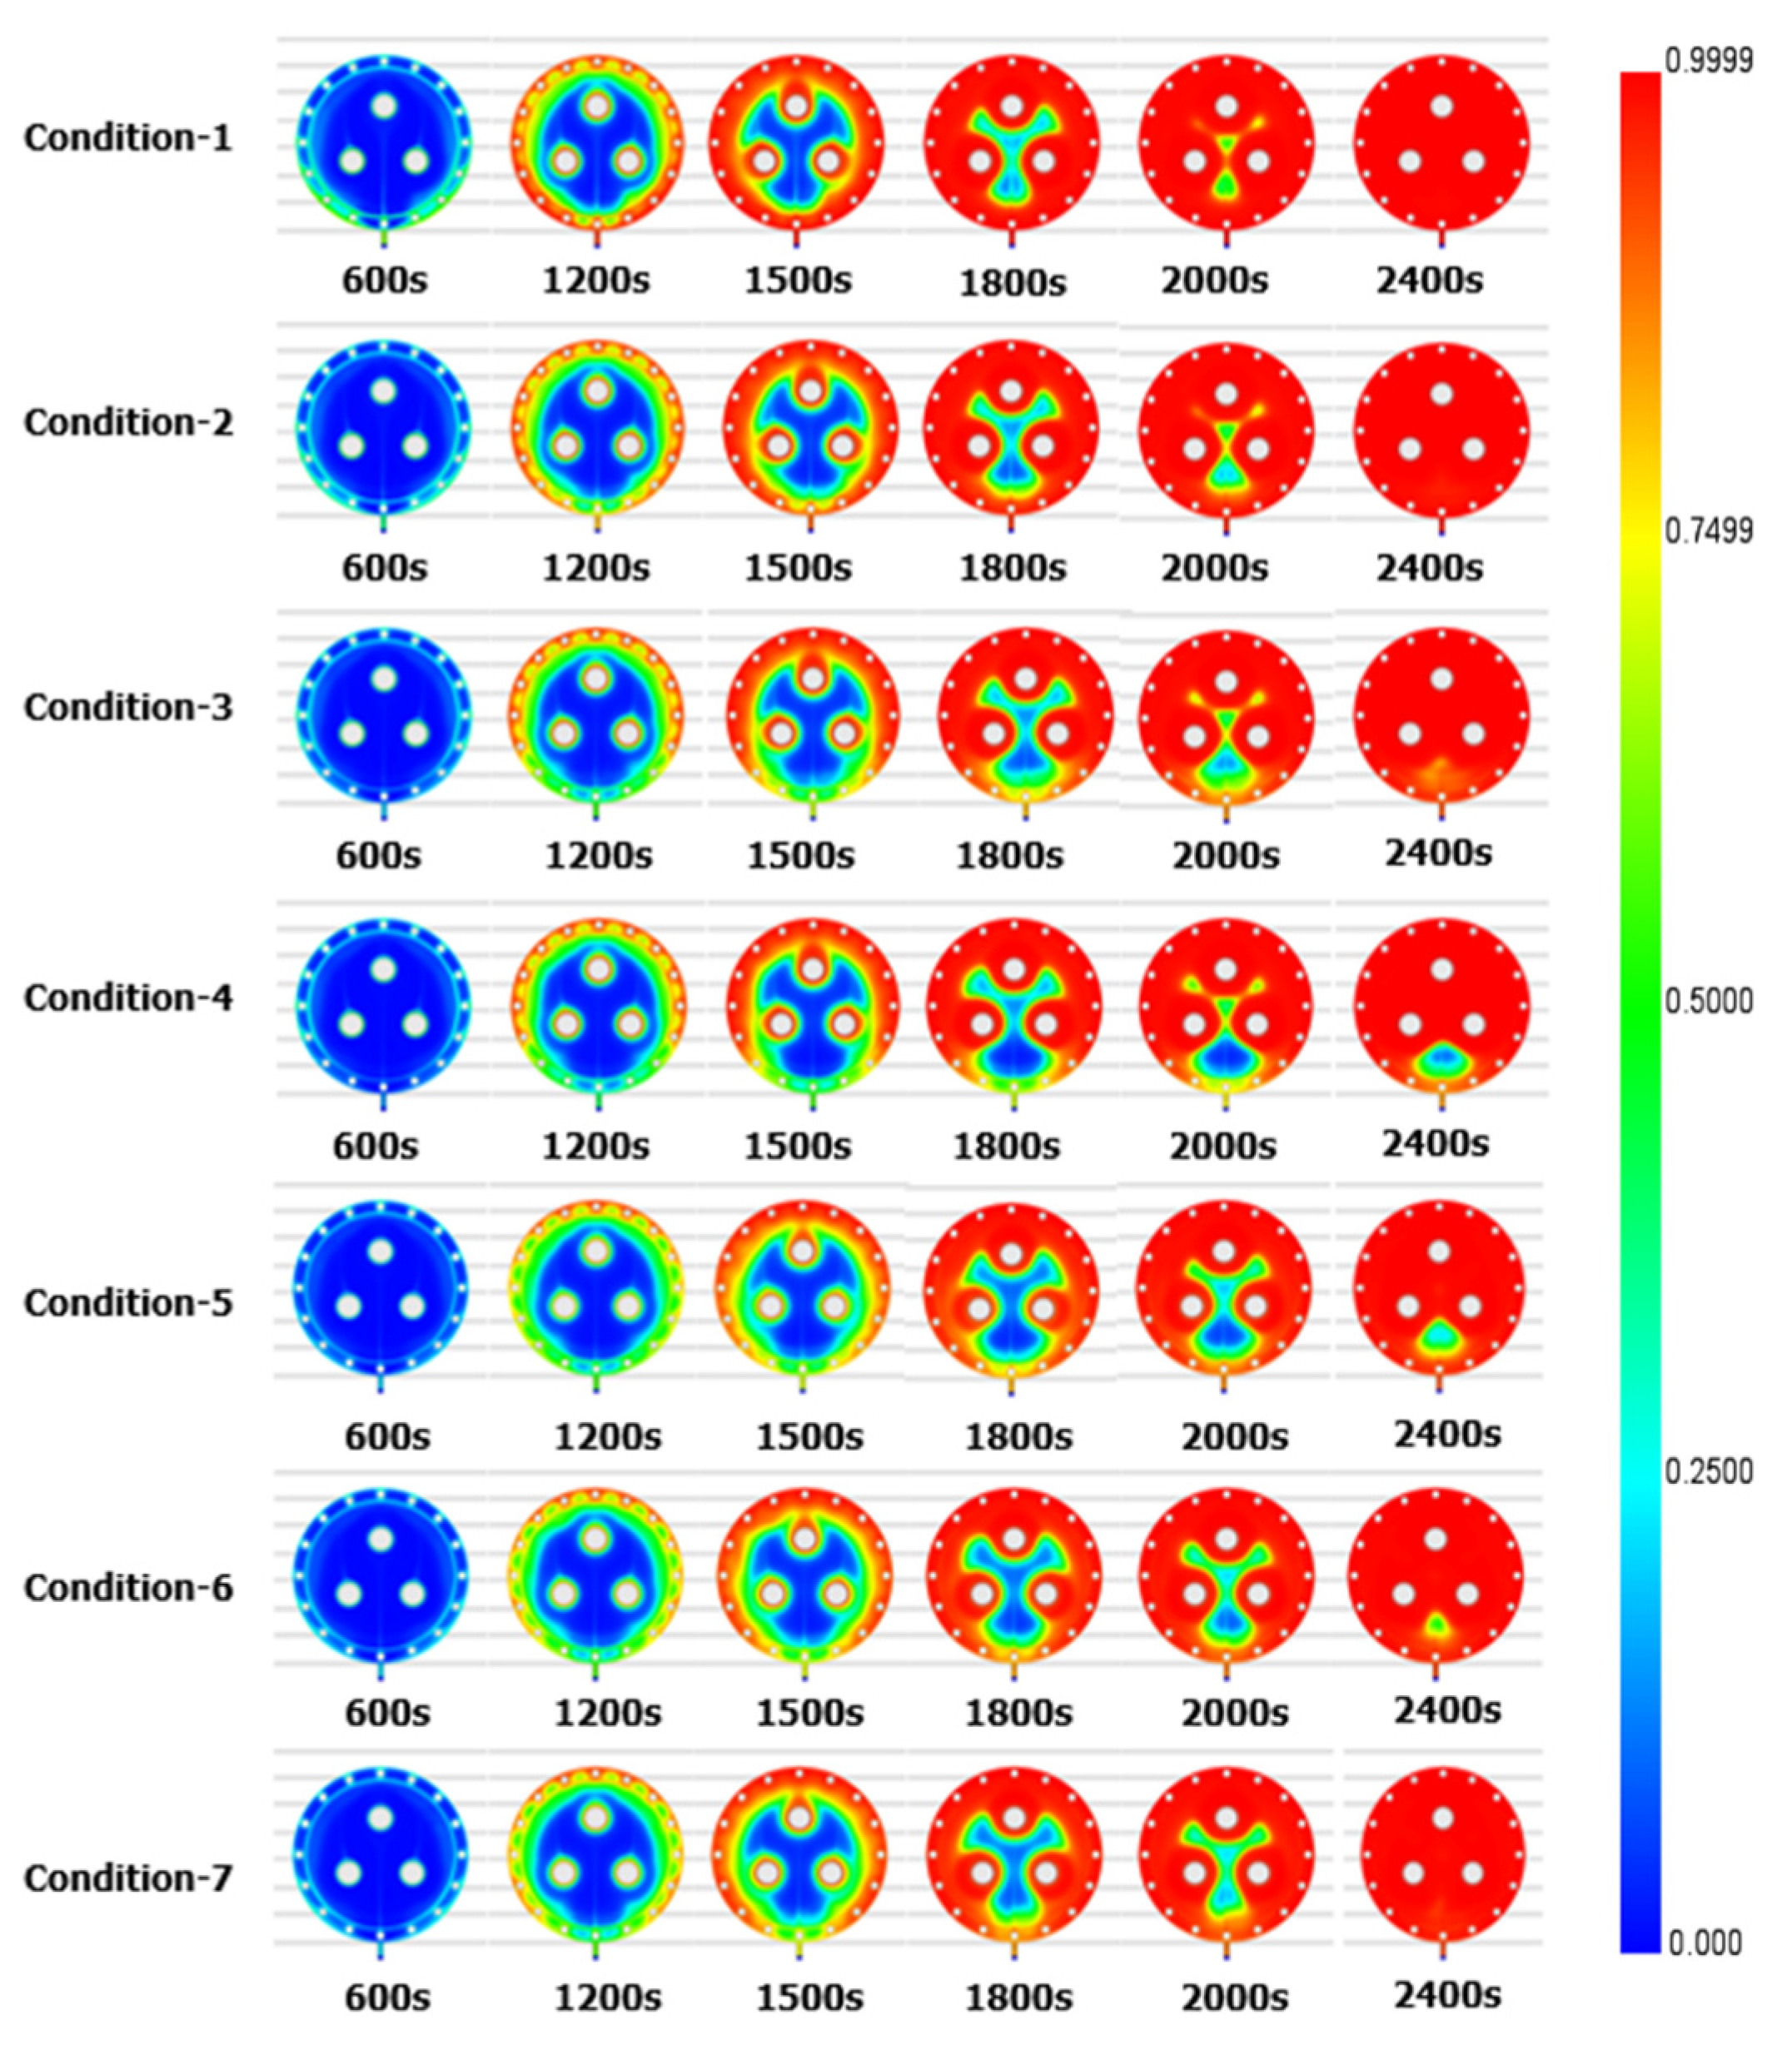
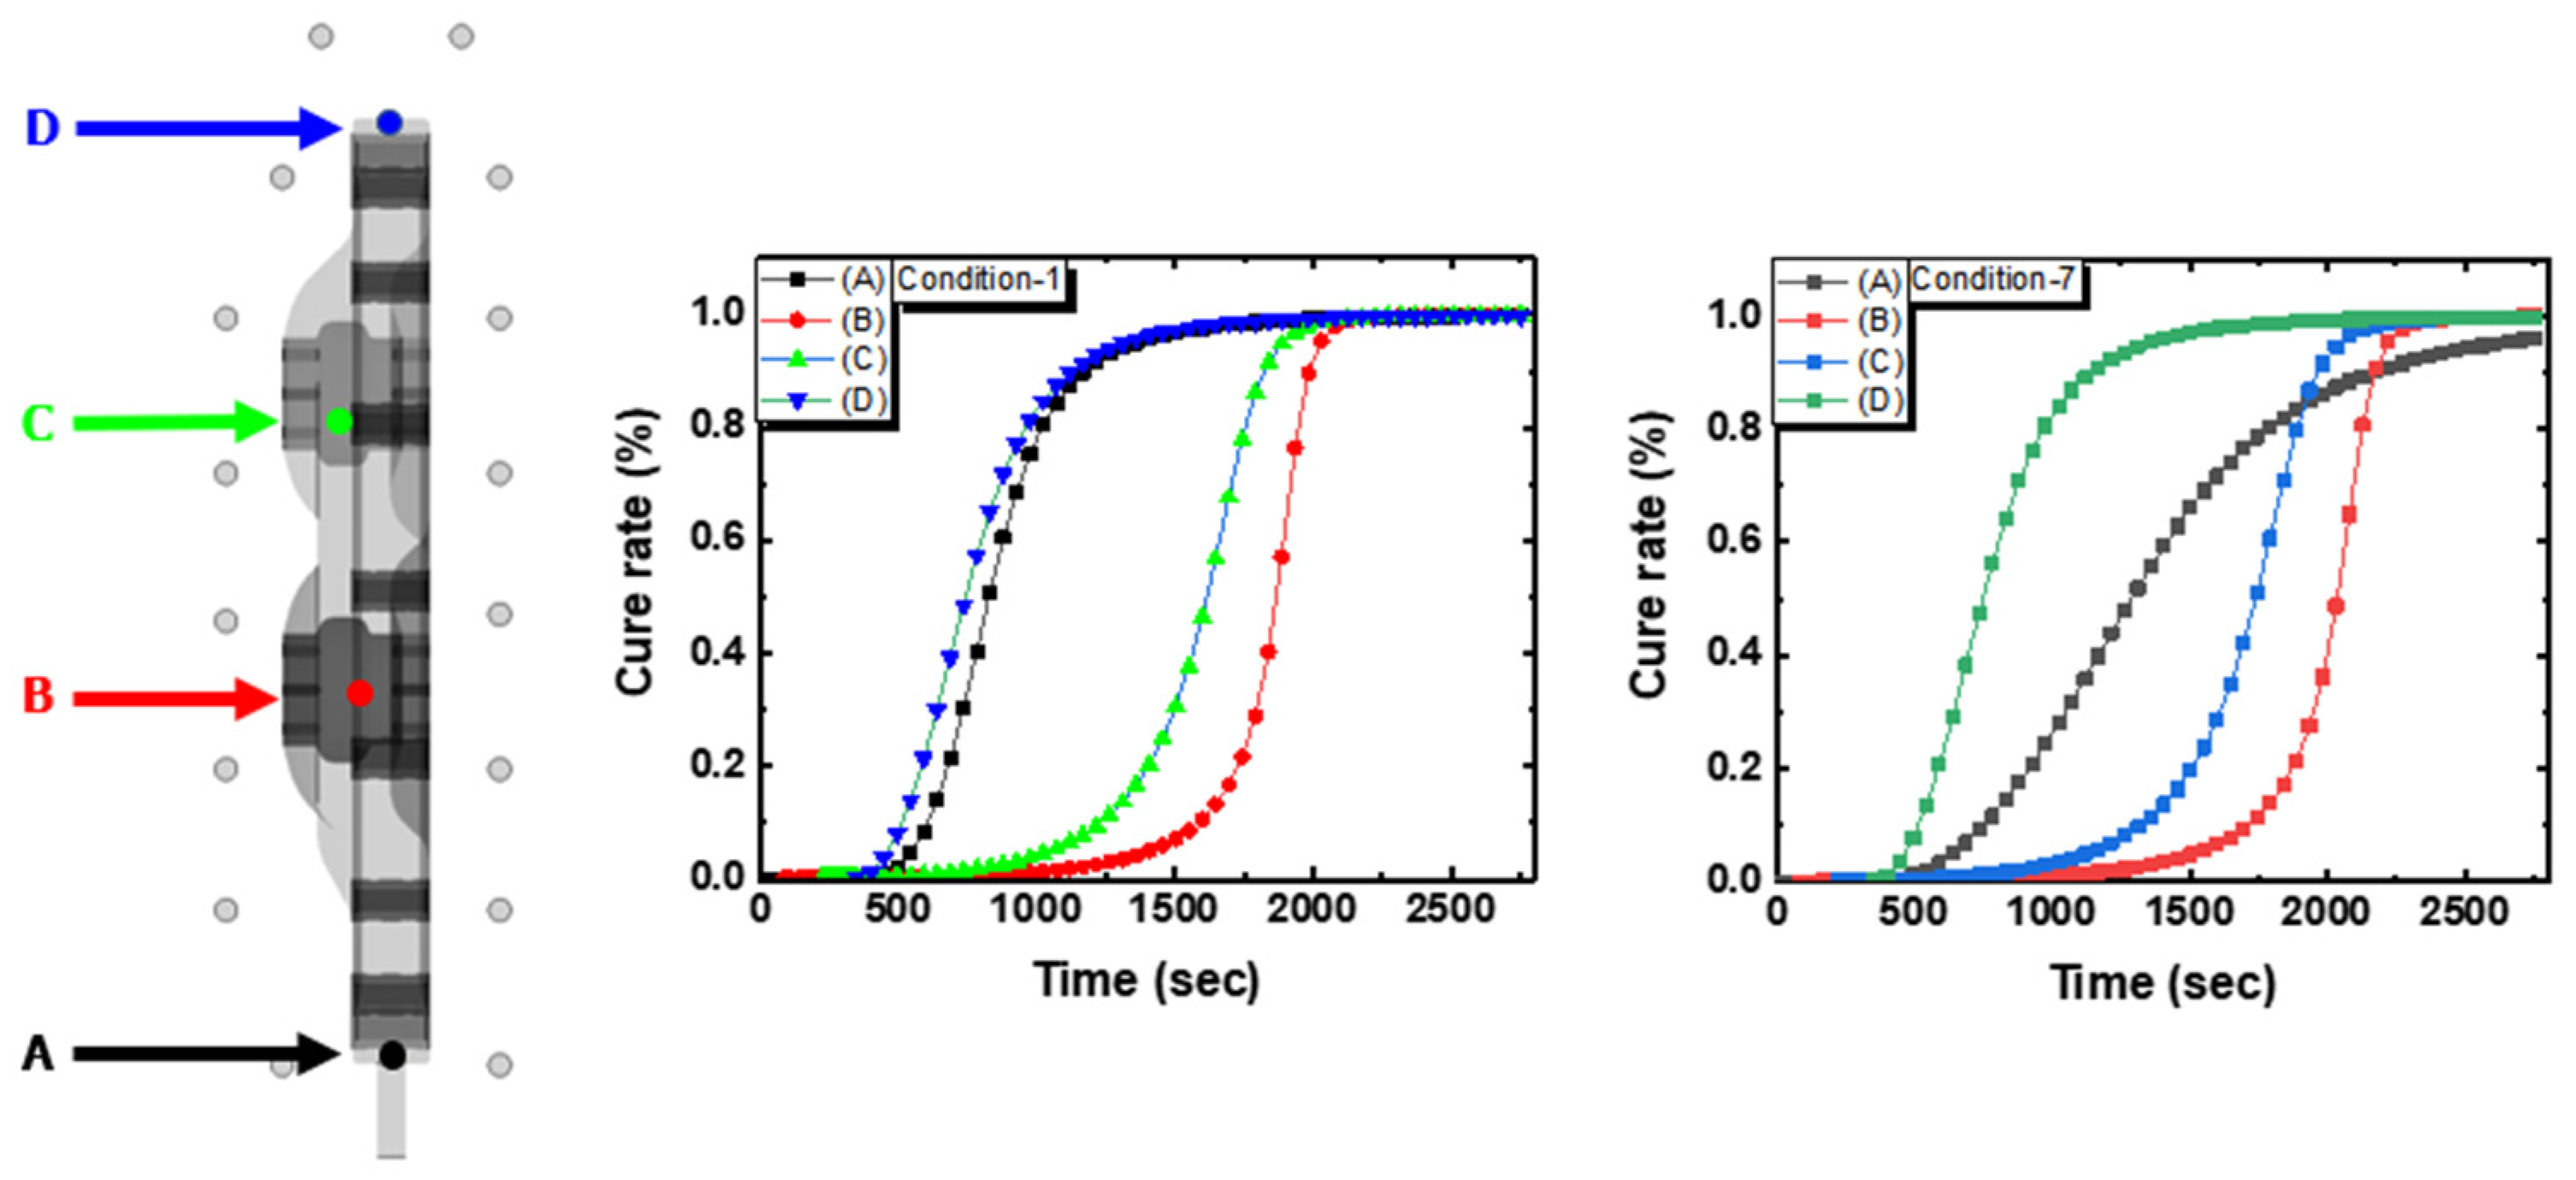
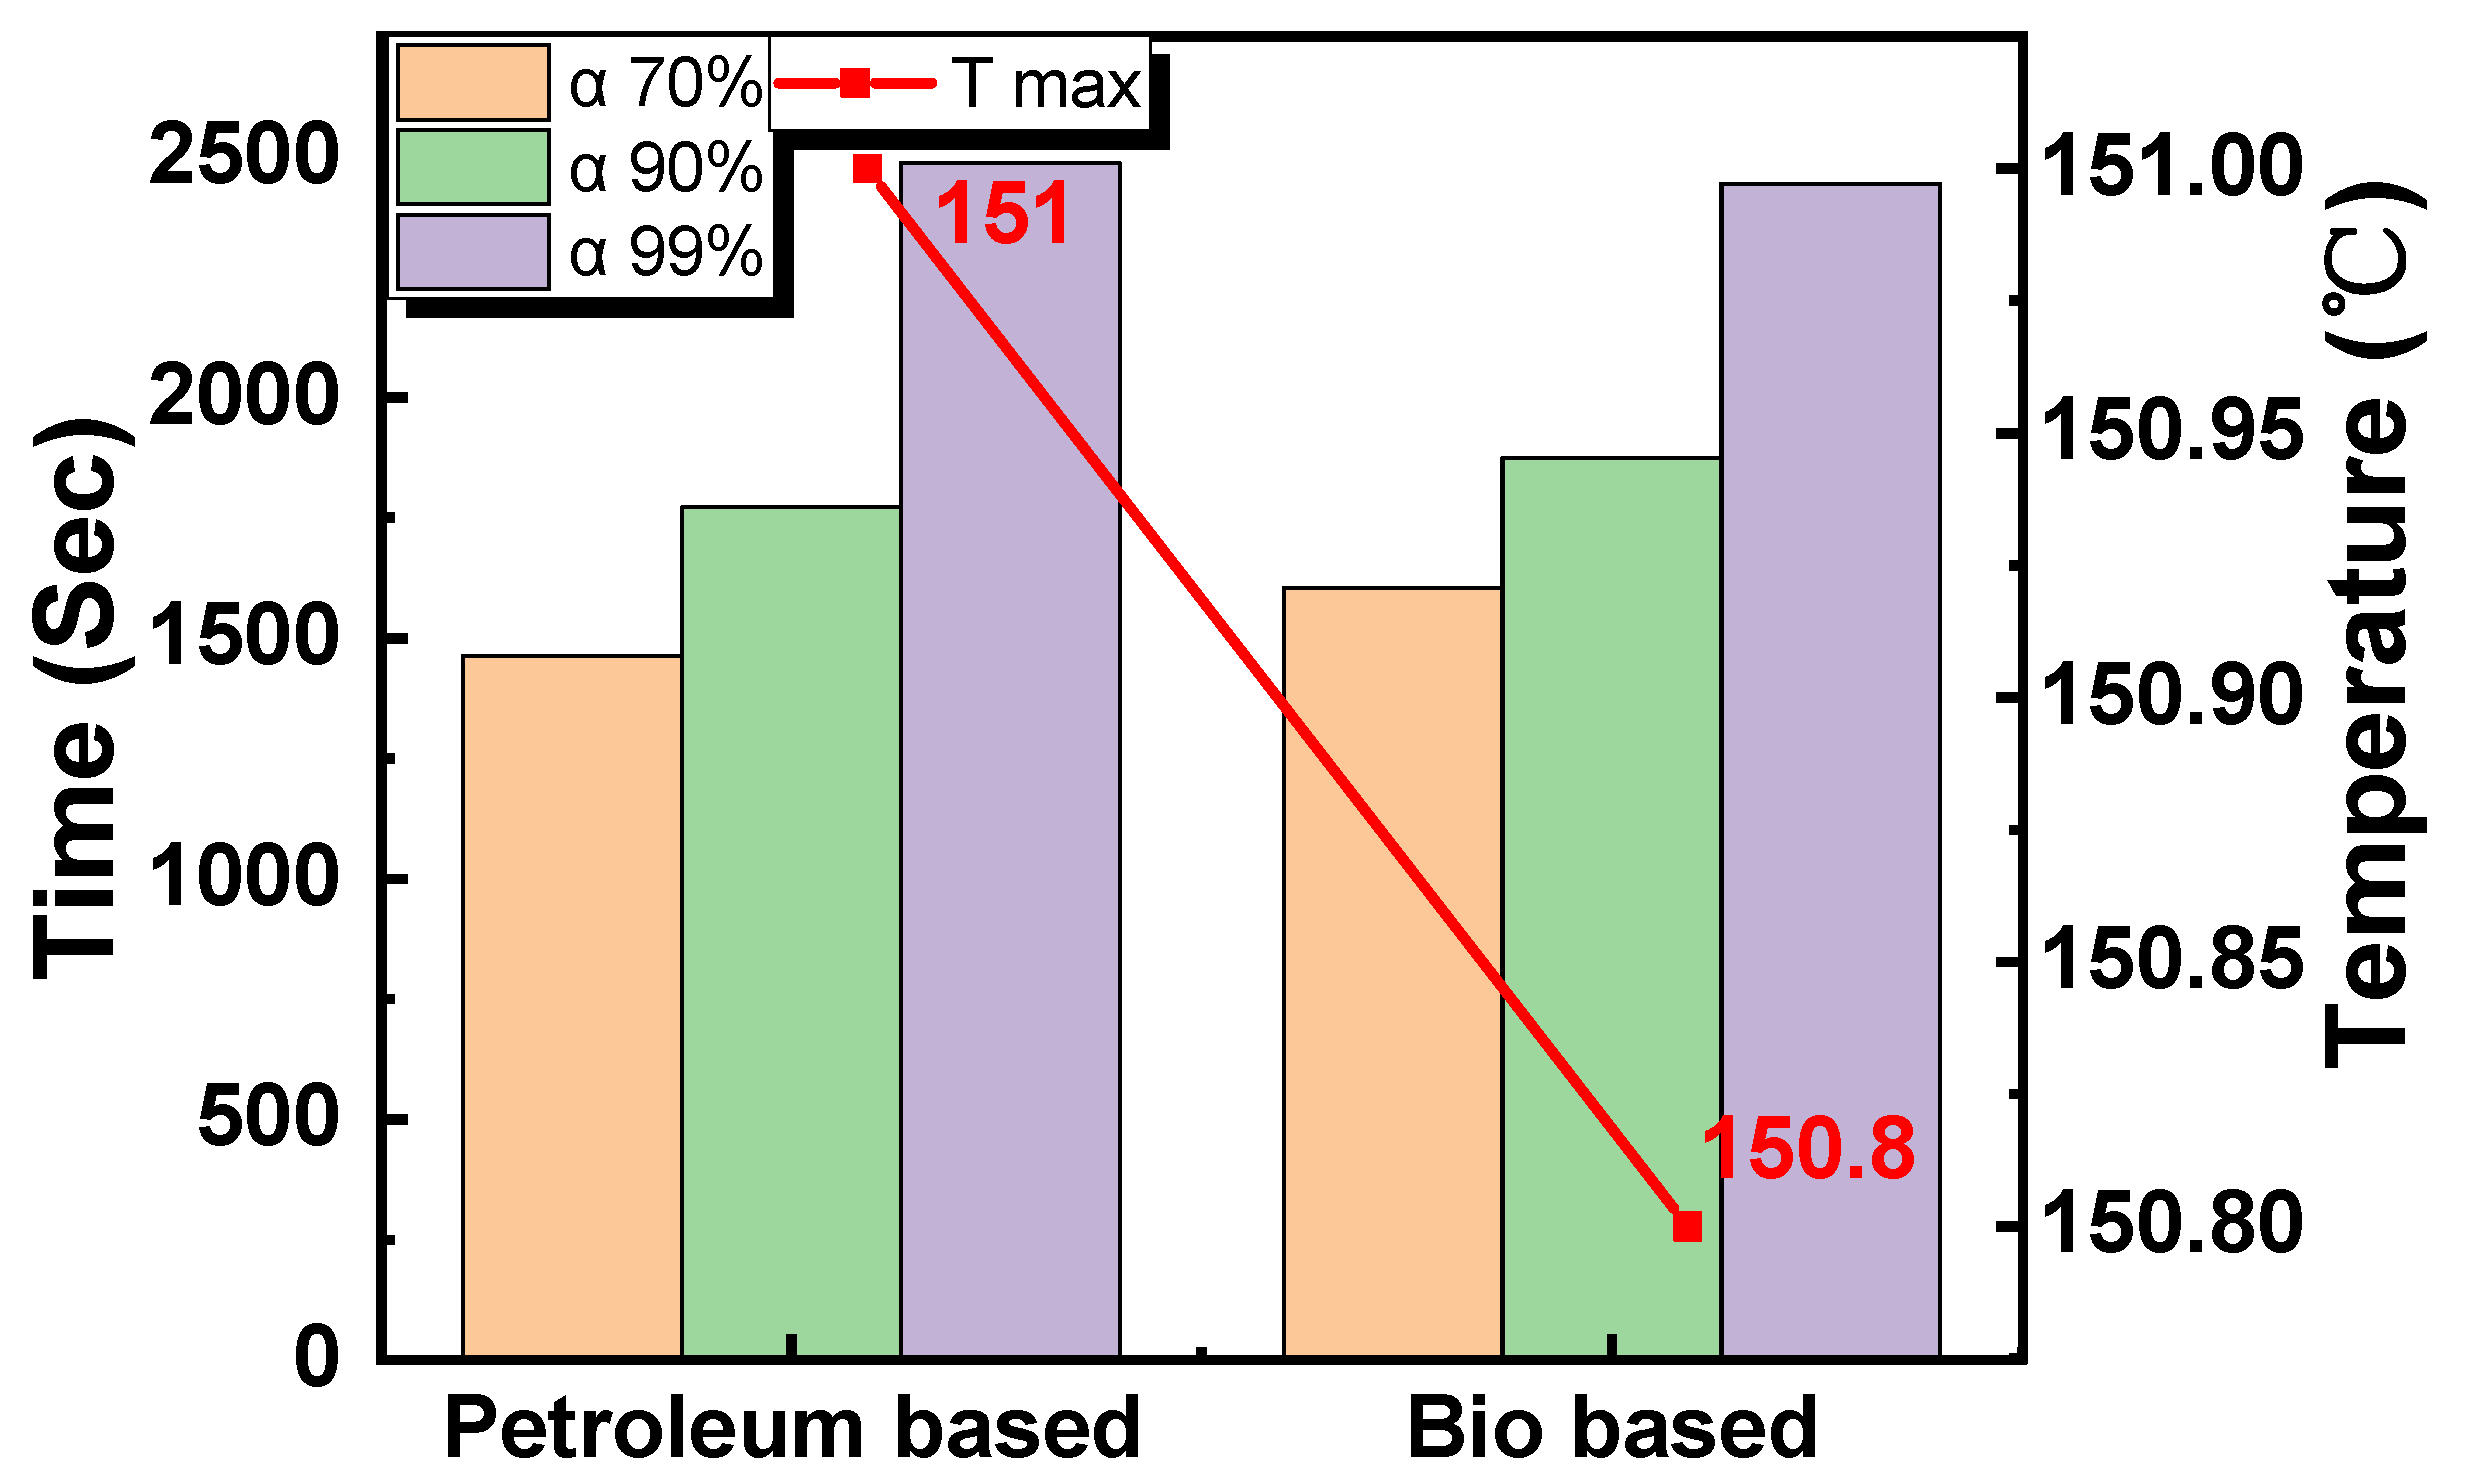
3.2. Moldflow Simulation

The spacer filling process is shown according to time in Figure 4. Note that the result of the simulation achieved by changing the resin injection time to Condition-1 (shown in Table 3), did not change the tendency of the overall curing characteristics significantly and the injection was performed in the same pattern. It was concluded that the curing reaction did not occur because sufficient heat was not transferred during the resin injection process.
The maximum heat generation temperature and average degree of hardening are shown in Figure 5 and Figure 6 by entering a node for each part in each process condition. For the node at each point, the entire mold was cut in YZ plane, and the node was input by location as shown in Figure 3. On average, the temperature at which an epoxy resin burns from heat is about 270 °C, and as illustrated below, the maximum heat generation temperature in the simulation was 158 °C. It was therefore expected that cracks or external structural shape would not change due to the temperature effect. In addition, it was considered that the error between the heater temperature and the maximum exothermic temperature in each process condition occurs because the surface temperature of the mold increases as the curing time increases. In conclusion, since the degree of curing varies according to temperature, it was decided that it was better to set uniform temperature considering the temperature error of each heater and considering the quality of the final product.
Figure 7 shows the results of the degree of curing inside the spacer, which was simulated by varying the temperature conditions of each heater. As a result of the simulation of Condition-1, it was found that the degree of curing inside the spacer reached 90% or more in about 40 min. It was found that the primary curing time of the spacer took about 40 min, and through this, the simulation cure time was set to about 40 min, and an additional simulation was performed. Although it was possible to determine the approximate curing time of the spacer molding through Condition-1, there was a problem in that the inlet portion was preferentially cured to the degree of curing. This phenomenon is expected to be a problem caused not only by the mold thickness of the injection hole part being relatively thin compared to other parts, but also the heater temperature near the lower end part is high. In addition, considering the resin hardening phenomenon as the inlet part is preferentially cured, the central part may be deformed and contracted during the curing stage. The degree of hardening around the central conductor over time must be cured at the same rate regardless of the location, so that residual stress is less likely to exist inside the manufactured spacer. Epoxy should be injected to prevent bubbles and cracks inside the manufactured spacer. To solve this problem, the simulation was conducted by changing the bottom heater (No. 7 and 8) from 115 °C to 130 °C to slow the curing of the bottom.
As a result of the simulation, as in Condition-1, in Condition-2, curing proceeded first near the inlet, and in Condition-3, curing proceeded slowly from the vicinity of the inlet. However, the internal curing rate of the spacer at the location of heater 7 at 40 min was about 85%, and the surface was stably cured, but there was a concern that cracks may occur due to non-curing inside the spacer after deforming. As a result of the Condition-4 simulation in which heater No. 8 was set to 115 °C, curing at the lower end may be delayed, and thus the overall production rate may be reduced. For this reason, it was determined that Conditions-2, 3, and 4 were not suitable, and 120 °C was selected as the optimal temperature for the bottom heater. In the case of Conditions 5 and 6, as a result of setting the heater temperature sequentially from the upper part to the lower part, curing progressed more slowly compared to the previous conditions overall, and the curing of the lower part was delayed so that sufficient holding pressure could proceed.
As a result of the Condition-7 simulation, the curing rate near the injection hole was about 95% at 40 min, and it was expected that the reaction would proceed further due to the latent heat inside the spacer and be completed even after curing was finished. In addition, it was confirmed that the curing progressed without any problems in the uncured areas that appeared in Conditions 5 and 6. Figure 8 shows the curing time and curing degree according to the mold position under the heater temperature conditions of Conditions 1 and 7. In the case of position A (black-line) with an injection hole, it is ideal for curing to occur last as the pressure for bonding is continuously maintained. In the case of Condition-1, since the curing of position A was the second fastest completed, pressurization for restoration was not applied. In the case of Condition-7, since the curing of position A occurred last compared to other positions, the possibility of bubbles and cracks occurring inside the manufactured spacer was greatly reduced by applying pressurization for maintenance.
Figure 9 shows a graph of Condition-7, which is the optimal curing condition using bio-based epoxy and curing condition using petroleum-based epoxy. The curing speed of the bio-based epoxy is slightly different than that of conventional petroleum-based epoxy. However, since the overall curing tendency is very similar, it is thought that it will not be a big problem in manufacturing the GIS spacer.
Figure 10 shows the experimental setup for manufacturing a GIS spacer. Based on the optimal process conditions acquired by Moldflow simulation, the bio-based epoxy resin-based GIS spacer manufactured under optimal process conditions through Moldflow simulation analysis is shown in Figure 11, and the X-ray test result of the spacer is shown in Figure 12.
As may be seen from the X-ray test results, no cracks, bubbles, or metallic substances were found inside the resin, and no problematic parts were found on the contact surface between the center conductor, the insert, and the resin. It is determined that there is no problem in the flow of resin from the spacer injection port to the vicinity of the vent by reducing the error in the spacer heater temperature and keeping the heater temperature uniform.

4. Conclusions

In this research, optimal curing conditions of an insulating spacer for a GIS are proposed through Moldflow software simulation using a bio-based epoxy composite and curing agent made of a thermosetting resin. Considering the curing temperature range, the heater temperature of the mold was applied at a maximum of 140 °C, and eight heater temperatures were set for the simulation. When the temperature at the bottom was set to 115 °C or lower, the composite could be cured slower than the existing simulation, so the optimum condition for the lower end, where curing starts slowly from the lower end to the upper end, was selected as 120 °C. As a result, when comparing the degree of internal curing and internal temperature of the insulating spacer according to the molding conditions, Condition-7 showed relatively good results for optimal curing, so it was selected as an optimal condition. Based on the optimal molding conditions, the spacer was manufactured using bio-based epoxy derived through Moldflow simulation, and internal defects, air bubbles, or metallic foreign matter were not found as shown in the X-ray test. Therefore, we conclude that the secured conditions are suitable for the manufacturing of the GIS spacer standard.

Author Contributions

Conceptualization, C.L. and H.J.; methodology, C.L. and J.B.; formal analysis, Y.N. and H.-G.C.; investigation, Y.N. and Y.-G.H.; data curation, C.L. and J.B.; writing—original draft preparation, C.L. and H.J.; writing—review and editing, H.J. and J.L.; visualization, C.L.; supervision, J.L. All authors have read and agreed to the published version of the manuscript.

Funding

This work was supported by the Technology Innovation Program (No. 20010965, Development of Electronic Current Voltage Transformer and Spacer based on Ecofriendly Solid Insulation) funded By the Ministry of Trade, Industry & Energy (MOTIE, Korea).

Institutional Review Board Statement

Not applicable.

Informed Consent Statement

Not applicable.

Data Availability Statement

The data that support the findings of this study are available upon reasonable request.

Conflicts of Interest

The authors declare no conflict of interest.

References

  1. Riechert, U.; Holaus, W. Ultra high-voltage gas-insulated switchgear—A technology milestone. Eur. Trans. Electr. Power 2012, 22, 60–82. [Google Scholar] [CrossRef]
  2. Purnomoadi, A.P.; Mor, A.R.; Smit, J.J. Spacer flashover in Gas Insulated Switchgear (GIS) with humid SF6 under different electrical stresses. Electr. Power Energy Syst. 2020, 116, 105559. [Google Scholar] [CrossRef]
  3. Szewczyk, M.; Kuniewski, M. Controlled Voltage Breakdown in Disconnector Contact System for VFTO Mitigation in Gas-Insulated Switchgear (GIS). IEEE Trans. Power Deliv. 2017, 32, 2360–2366. [Google Scholar] [CrossRef]
  4. Bolin, P.; Koch, H. Gas Insulated Switchgear GIS—State of the Art. In Proceedings of the 2007 IEEE Power Engineering Society General Meeting, Tampa, FL, USA, 24–28 June 2007. [Google Scholar]
  5. Park, J. A Study on the Partial Discharge Resistance Characteristic for Optimizing the Mixing Ratio of Heterogeneous Inorganic Insulated Materials for Environmentally Friendly GIS Spacer. Trans. Korean Inst. Electr. Eng. 2018, 29, 1189–1196. [Google Scholar]
  6. Hidayat, S.; Damanik, F.; Khayam, U. Electric field optimization on 150 kV GIS spacer by modification of spacer shape and conductor configuration. In Proceedings of the 3rd Conference on Power Engineering and Renewable Energy, Yogyakarta, Indonesia, 29–30 November 2016. [Google Scholar]
  7. Xue, B.; Tang, R.; Xue, D.; Zhao, W.; Jiaojun, T.; Li, X.; Guan, Y.; Sun, Y. Sustainable alternative for bisphenol a epoxy resin high-performance and recyclable lignin-based epoxy vitrimers. Ind. Crops Prod. 2021, 168, 113583. [Google Scholar] [CrossRef]
  8. Shin, P.; Kim, J.; Park, H.; Beak, Y.; Kwon, D.; Park, J. Manufacturing and Mechanical Properties of Epoxy Fibers Spinning using Anhydride and Amine Hardeners. Compos. Res. 2016, 29, 408–413. [Google Scholar] [CrossRef]
  9. Ma, C.; Sanchez-Rodriguez, D.; Kamo, T. A comprehensive study on the oxidative pyrolysis of epoxy resin from fiber/epoxy composites: Product characteristics and kinetics. J. Hazard. Mater. 2021, 412, 125329. [Google Scholar] [CrossRef] [PubMed]
  10. Hussain, M.; Nakahira, A.; Nishijima, S.; Niihara, K. Fracture behavior and fracture toughness of particulate filled epoxy composites. Mater. Lett. 1996, 27, 21–25. [Google Scholar] [CrossRef]
  11. Won, S.; Kim, J.; Kim, D.; Kim, G.; Yoon, G. Trends of Injection Molding Technology. Trans. Mater. Process 2014, 23, 392–396. [Google Scholar]
  12. Baroncini, E.A.; Yadav, S.K.; Palmese, G.R.; Stanzione, J.F., III. Recent advances in bio-based epoxy resins and bio-based epoxy curing agents. J. Appl. Polym. Sci. 2016, 133, 44103. [Google Scholar] [CrossRef] [Green Version]
  13. Li, Z.; Okamoto, K.; Ohki, Y.; Tanaka, T. Effects of nano-filler addition on partial discharge resistance and dielectric breakdown strength of Micro-Al 2 O 3 Epoxy composite. IEEE Trans. Dielectr. Electr. Insul. 2010, 17, 653–661. [Google Scholar] [CrossRef]
  14. Kumar, S.; Krishnan, S.; Samal, S.K.; Mohanty, S.; Nayak, S.K. Toughening of petroleum based (DGEBA) epoxy resins with various renewable resources based flexible chains for high performance applications: A review. Ind. Eng. Chem. Res. 2018, 57, 2711–2726. [Google Scholar] [CrossRef]
  15. Park, S.; Jin, F.; Lee, J. Thermal and mechanical properties of tetrafunctional epoxy resin toughened with epoxidized soybean oil. Mater. Sci. Eng. A 2004, 374, 109–114. [Google Scholar] [CrossRef]
  16. Li, F.; Larock, R. New soybean oil–styrene–divinylbenzene thermosetting copolymers. V. shape memory effect. J. Appl. Polym. Sci. 2002, 84, 1533–1543. [Google Scholar] [CrossRef]
  17. Woo, Y.; Kim, D. Cure and thermal decomposition kinetics of a DGEBA/amine system modified with epoxidized soybean oil. J. Therm. Anal. Calorim. 2021, 144, 119–126. [Google Scholar] [CrossRef]
  18. Kumar, S.; Samal, S.K.; Mohanty, S.; Nayak, S.K. Epoxidized soybean oil-based epoxy blend cured with anhydride-based cross-linker: Thermal and mechanical characterization. Ind. Eng. Chem. Res. 2017, 56, 687–698. [Google Scholar] [CrossRef]
  19. Ozkur, S.; Sezgin, H.; Akay, E.; Yalcin-Enis, I. Hybrid bio-based composites from blends of epoxy and soybean oil resins reinforced with jute woven fabrics. Mater. Res. Express 2020, 7, 015335. [Google Scholar] [CrossRef]
  20. Anusic, A.; Resch-Fauster, K.; Mahendran, A.R.; Wuzella, G. Anhydride Cured Bio-Based Epoxy Resin: Effect of Moisture on Thermal and Mechanical Properties. Macromol. Mater. Eng. 2019, 304, 1900031. [Google Scholar] [CrossRef] [Green Version]
  21. Güner, F.S.; Yağcı, Y.; Erciyes, A.T. Polymers from triglyceride oils. Prog. Polym. Sci. 2006, 31, 633–670. [Google Scholar] [CrossRef]
  22. Islam, M.R.; Beg, M.D.H.; Jamari, S.S. Development of vegetable-oil-based polymers. J. Appl. Polym. Sci. 2014, 131, 40787. [Google Scholar]
  23. Quirino, R.L.; Monroe, K.; Fleischer, C.H., III; Biswas, E.; Kessler, M.R. Thermosetting polymers from renewable sources. Polym. Int. 2021, 70, 167–180. [Google Scholar] [CrossRef]
  24. Mais, G.; Hedrich, W. New develolpments for vacuum preparation and casting according to the automatic pressure gelation process at elevated temperatures. In Proceedings of the Electrical Insulation Conference and Electrical Manufacturing and Coil Winding Conference, Rosemont, IL, USA, 25 September 1997. [Google Scholar]
  25. Longzhi, Z.; Binghui, C.; Min, Y.; Shangbing, Z. Application of Moldflow software in design of injection mold. In Proceedings of the 2010 International Conference on Mechanic Automation and Control Engineering, Wuhan, China, 26–28 June 2010. [Google Scholar]
  26. Li, Y.; Zhong, C.; Li, C.; Jiang, R.; Lu, J.; Sun, R. Mold Flow Simulation Analysis of Molded Underfill in an Ultra-thin High-Density Package. In Proceedings of the 2022 IEEE 5th International Conference on Electronics Technology (ICET), Chengdu, China, 13–16 May 2022. [Google Scholar]
  27. Sinapius, M.; Ziegmann, G. (Eds.) Acting Principles of Nano-Scaled Matrix Additives for Composite Structures; Springer International Publishing: New York, NY, USA, 2021. [Google Scholar]
  28. Leistner, C.; Hartmann, S.; Abliz, D.; Ziegmann, G. Modeling and Simulation of the Curing Process of Epoxy Resins using Finite Elements. Contin. Mech. Thermodyn. 2020, 32, 327–350. [Google Scholar] [CrossRef]
  29. Hernandez-Ortiz, J.P.; Osswald, T.A. A novel cure reaction model fitting technique based on DSC scans. J. Polym. Eng. 2005, 25, 23–38. [Google Scholar] [CrossRef]
  30. Nawab, Y.; Tardif, X.; Boyard, N.; Sobotka, V.; Casari, P.; Jacquemin, F. Determination and modelling of the cure shrinkage of epoxy vinyl ester resin and associated composites by considering thermal gradients. Compos. Sci. Technol. 2012, 73, 81–87. [Google Scholar] [CrossRef] [Green Version]
  31. Kong, Y.; Hay, J.N. The measurement of the crystallinity of polymers by DSC. Polymer 2002, 43, 3873–3878. [Google Scholar] [CrossRef]
  32. Cruz-Cruz, I.; Ramírez-Herrera, C.A.; Martínez-Romero, O.; Olvera-Trejo, D.; Elías-Zúñiga, A.; Castillo-Márquez, S.A.; Jiménez-Cedeño, I.H. Influence of Epoxy Resin Curing Kinetics on the Mechanical Properties of Carbon Fiber Composites. Polymers 2022, 14, 1100. [Google Scholar] [CrossRef]
  33. Gholinezhad, F.; Golhosseini, R.; Jazani, O.M. Non-isothermal DSC curing kinetics study of silicone-modified epoxy/ABS/GO nanocomposite. Polym. Compos. 2022, 43, 3794–3808. [Google Scholar] [CrossRef]
  34. Zhang, Y.; Fang, R.; Xue, H.; Xia, J.; Lin, Q. Investigation of DSC curing kinetic model fitting and rheological behavior of urushiol/IPDI system. Thermochim. Acta 2022, 711, 179210. [Google Scholar] [CrossRef]
  35. Garschke, C.; Parlevliet, P.P.; Weimer, C.; Fox, B.L. Cure kinetics and viscosity modelling of a high-performance epoxy resin film. Polym. Test. 2013, 32, 150–157. [Google Scholar] [CrossRef]
  36. Zeng, Y.-J.; Hwang, S.-J.; Liu, Y.-D.; Huang, C.-S. Mold Flow Analysis of Motor Core Gluing with Viscous Flow Channels and Dipping Module. Polymers 2021, 13, 2186. [Google Scholar] [CrossRef]
  37. Li, T.; Luyé, J.-F. Flow-Fiber Coupled Viscosity in Injection Molding Simulations of Short Fiber Reinforced Thermoplastics. Int. Polymer. Process 2019, 34, 158–171. [Google Scholar] [CrossRef] [Green Version]
  38. Kim, S.; Park, S. Identification of Cross-WLF Viscosity Model Parameters Using Optimization Technique. J. Korea Acad. Coop. Soc. 2018, 19, 623–632. [Google Scholar]
  39. Tran, N.T.; Gehde, M. Creating Material Data for Thermoset Injection Molding Simulation Process. Polym. Test. 2019, 73, 284–292. [Google Scholar] [CrossRef]
  40. Parente, J.M.; Simoes, R.; Reis, P.N.B. Effect of graphene nanoparticles on suspension viscosity and mechanical properties of epoxy-based nanocomposites. Procedia Struct. Integr. 2022, 37, 820–825. [Google Scholar] [CrossRef]
  41. Fu, Y.; Wang, C.; Li, W.; Zhang, G. Research on Rheological Properties of Epoxy Casting Dielectric Functionally Graded Insulating Slurries and Thermal Expansion Characteristics of Composite Materials. In Proceedings of the 16th Annual Conference of China Electrotechnical Society, Beijing, China, 24–26 September 2021; Volume 890, pp. 785–793. [Google Scholar]
  42. Heng, Z.; Wang, L.; Chen, F.; Zhou, J.; Zhang, H.; Zhang, X.; Sun, T.; Ling, Y.; Xia, S.; Liang, M.; et al. In-situ constructing ultra-high-aspect-ratio core–shell nanostructures to achieve high-performance epoxy thermosets and their carbon fiber reinforced epoxy composites. Chem. Eng. Sci. 2022, 448, 137707. [Google Scholar] [CrossRef]
  43. Wang, G.; Harrison, I.R. Polymer melting: Heating rate effects on DSC melting peaks. Thermochim. Acta 1994, 231, 203–213. [Google Scholar] [CrossRef]
Figure 1. 3D mesh image of the spacer (a); and cross-sectional view of the mold for spacer (b).
Applsci 12 10202 g001
Figure 2. Temperature section (1–8) of the mold heater (a); and analysis point (A–D) for the measurement of the curing rate (b).
Applsci 12 10202 g002
Figure 3. Cure rate vs. temperature, measured by DSC (a); and complex viscosity vs. temperature, measured by the rheometer (b).
Applsci 12 10202 g003
Figure 4. Injected amount of the resin according to time change (for Condition-1).
Applsci 12 10202 g004
Figure 5. Conversion properties for Condition-1, 2, 3, 4 (α 70%: the curing rate of the entire spacer reaches 70%, T max: the maximum temperature inside the spacer).
Applsci 12 10202 g005
Figure 6. Conversion properties for Condition-5, 6, 7.
Applsci 12 10202 g006
Figure 7. The degree of cure under different conditions (from Condition-1 to Condition-7).
Applsci 12 10202 g007
Figure 8. Percentage of the cure rate of inside of the spacer according to time change. (from Condition-1 to Condition-7).
Applsci 12 10202 g008
Figure 9. Optimal curing conditions of bio-based epoxy and petroleum-based epoxy.
Applsci 12 10202 g009
Figure 10. The overall APG system (a); and the mold for GIS spacer (b).
Applsci 12 10202 g010
Figure 11. Manufactured GIS spacer, front side (a); and rear side (b).
Applsci 12 10202 g011
Figure 12. X-ray of the bio-based epoxy resin spacer, near central conductor (a); and near inlet side (b).
Applsci 12 10202 g012
Table 1. Thermal properties of spacer mold.
Parameter
Mold density (g/cm3)7.85
Mold specific heat (J/Kg*C)485.34
Mold thermal conductivity (W/m*C)50.242
Mold coefficient of thermal expansion (1/C)1.376 × 10−5
Table 2. Heater conditions for temperature sections (Condition-1 to Condition-4).
Temperature SectionHeater Temperature (°C)
Condition-1Condition-2Condition-3Condition-4
1140140140140
2140140140140
3140140140140
4140140140140
5140140140140
6140140140140
7140130120120
8140130120115
Table 3. Heater conditions for temperature sections (Condition-5 to Condition-7).
Temperature SectionHeater Temperature (°C)
Condition-5Condition-6Condition-7
1140140140
2140140140
3135135135
4135135135
5130130130
6130135130
7125130120
8120120120
Publisher’s Note: MDPI stays neutral with regard to jurisdictional claims in published maps and institutional affiliations.

