1. Introduction
The advancement of information technology and sharing economy business models is changing traditional models of ownership and transport services. New modes of travel are emerging in urban areas, such as transport network company services, bike-sharing and scooter-sharing, etc. Shared micro-mobility (SMM, the shared utilization of an e-/bicycle, e-/scooter, or other low-speed modes) is a newly developed transportation mode [
1]. SMM provides users with a short-term access to a transportation service over an as-needed basis [
2].
Early documented impacts of SMM include increased mobility [
3], decreased greenhouse gas emissions [
4], and decreased automobile use [
5,
6]. Since 2017, over USD 5.7 billion have been devoted to SMM start-up companies, mostly in China. A steady customer pool has been established in the SMM market, which is two to three times faster than ride-hailing or car-sharing services. The combined value of SMM start-ups is estimated to exceed USD 1 billion [
7].
Shared Free-Floating Electric Scooters (SFFESs) have been altering travel in cities and on university campuses. Though SFFESs have swiftly obtained popularity and approval over the past couple of years, limited studies have been reported on their use. The analysis of Berg Insight shows that the COVID-19 crisis lead to a lower shared-scooter ridership in 2021. However, in the long term, ridership is projected to reach over 4.6 million people in 2024 worldwide, with a base of 774,000 people in 2019 [
8].
New mobility services, such as Uber/Lyft, have been changing the landscape of urban mobility. SFFESs have become increasingly popular and utilized by communities given their acceptable cost, zero-emission power and minimal environmental footprint. In addition, given the present pandemic, city planners are looking for new methods, such as SFFESs, to reconcile urban mobility need and social distance requirements. While SFFESs offer promising opportunities, they also bring negative externalities, including safety and equity issues for pedestrians, cyclists and disabled/elder citizens [
6,
9]. Many cities proscribed SFFES services, particularly in the initial boom of SMM, due to vital vandalism and street clutter, including Austin, Nantes, Amsterdam, Bordeaux, and recently Kuala Lumpur. These cities revisited their decisions afterwards and devised novel regulation provisions to optimize SFFES benefits while limiting their drawbacks. Some cities banned the usage of SFFESs due to regulation requirements; for example, the New York State Department of Motor Vehicles legislation requires the registration of any electric vehicle, which makes SFFES service impossible.
Effective regulation faces two major setbacks emanating from the organizational culture/climate mismatch between local authorities and service operators. The operators need a high vehicle density to guarantee a high service quality and ultimately foster their market [
10,
11]. However, local authorities are wary of street clutter and intend to limit the fleet size. While technology and investments are essential for service implementation, equally important is to signify the impact of shared micro-mobility on the urban mobility ecosystem and its evolution trend over time, in order to better design and integrate it into sustainable mobility as a whole [
12]. However, very few studies examined SFFESs, and in addition the existing studies were limited in the analysis approaches used, which may fail to capture the complex nonlinear relationship between variables. In addition, most studies on SFFES services were conducted in the United States, China and, most recently, European cities, but are yet very limited in developing countries. It is presumed that this study will be the first step taken to assess the adoption of SFFESs and usage behavior with respect to a Malaysian context. The paper identifies public concerns, SFFES benefits and barriers, and the choice and usage behavior of the university population (students and non-/academic staff).
Choice behavior in new mobility services is usually assessed and modeled using traditional statistical models, such as regression, mixed logit, multinomial and binary logit models [
13,
14]. Recently, [
15] used the Chi
2 and Kruskal–Wallis tests to analyze the frequency of e-scooter use. Given the strict assumptions of statistical models, they have limited capabilities to capture the complex relationships between factors and choices, nonlinear correlations among factors, and to deal with factors with various categories [
16]. Machine learning (ML) methods have been widely utilized in civil engineering [
17,
18,
19,
20,
21,
22,
23] and transportation studies [
24,
25]. They can model the nonlinear associations between independent and target variables as well as among independent variables [
26,
27]. Therefore, it can be argued that the current study is one of the first attempts to predict SFFES usage frequency and identify significant factors impacting its use by adopting ML techniques.
Malaysian universities are currently adopting new sustainable strategies in moving their campuses towards becoming green campuses. Specifically, the management of the University of Malaya is planning to launch SFFES service in the near future. This paper aims to predict the usage frequency of SFFESs among the students and staff on the campus. As a summary of above discussion, the main contributions are:
1. This research study is one of the first efforts made to scrutinize the usage of SFFESs on a large university campus. In addition, this is perhaps the first study on SFFES services in “developing countries” such as Malaysia.
2. This research is one of the first studies which aims to predict the usage frequency of SFFESs and pinpoint significant attributes affecting the use of SFFESs by adopting various supervised and unsupervised machine learning techniques.
The remaining of the article is organized as follows:
Section 2 concerns a literature review on related works, followed by the survey design and data collection in
Section 3.
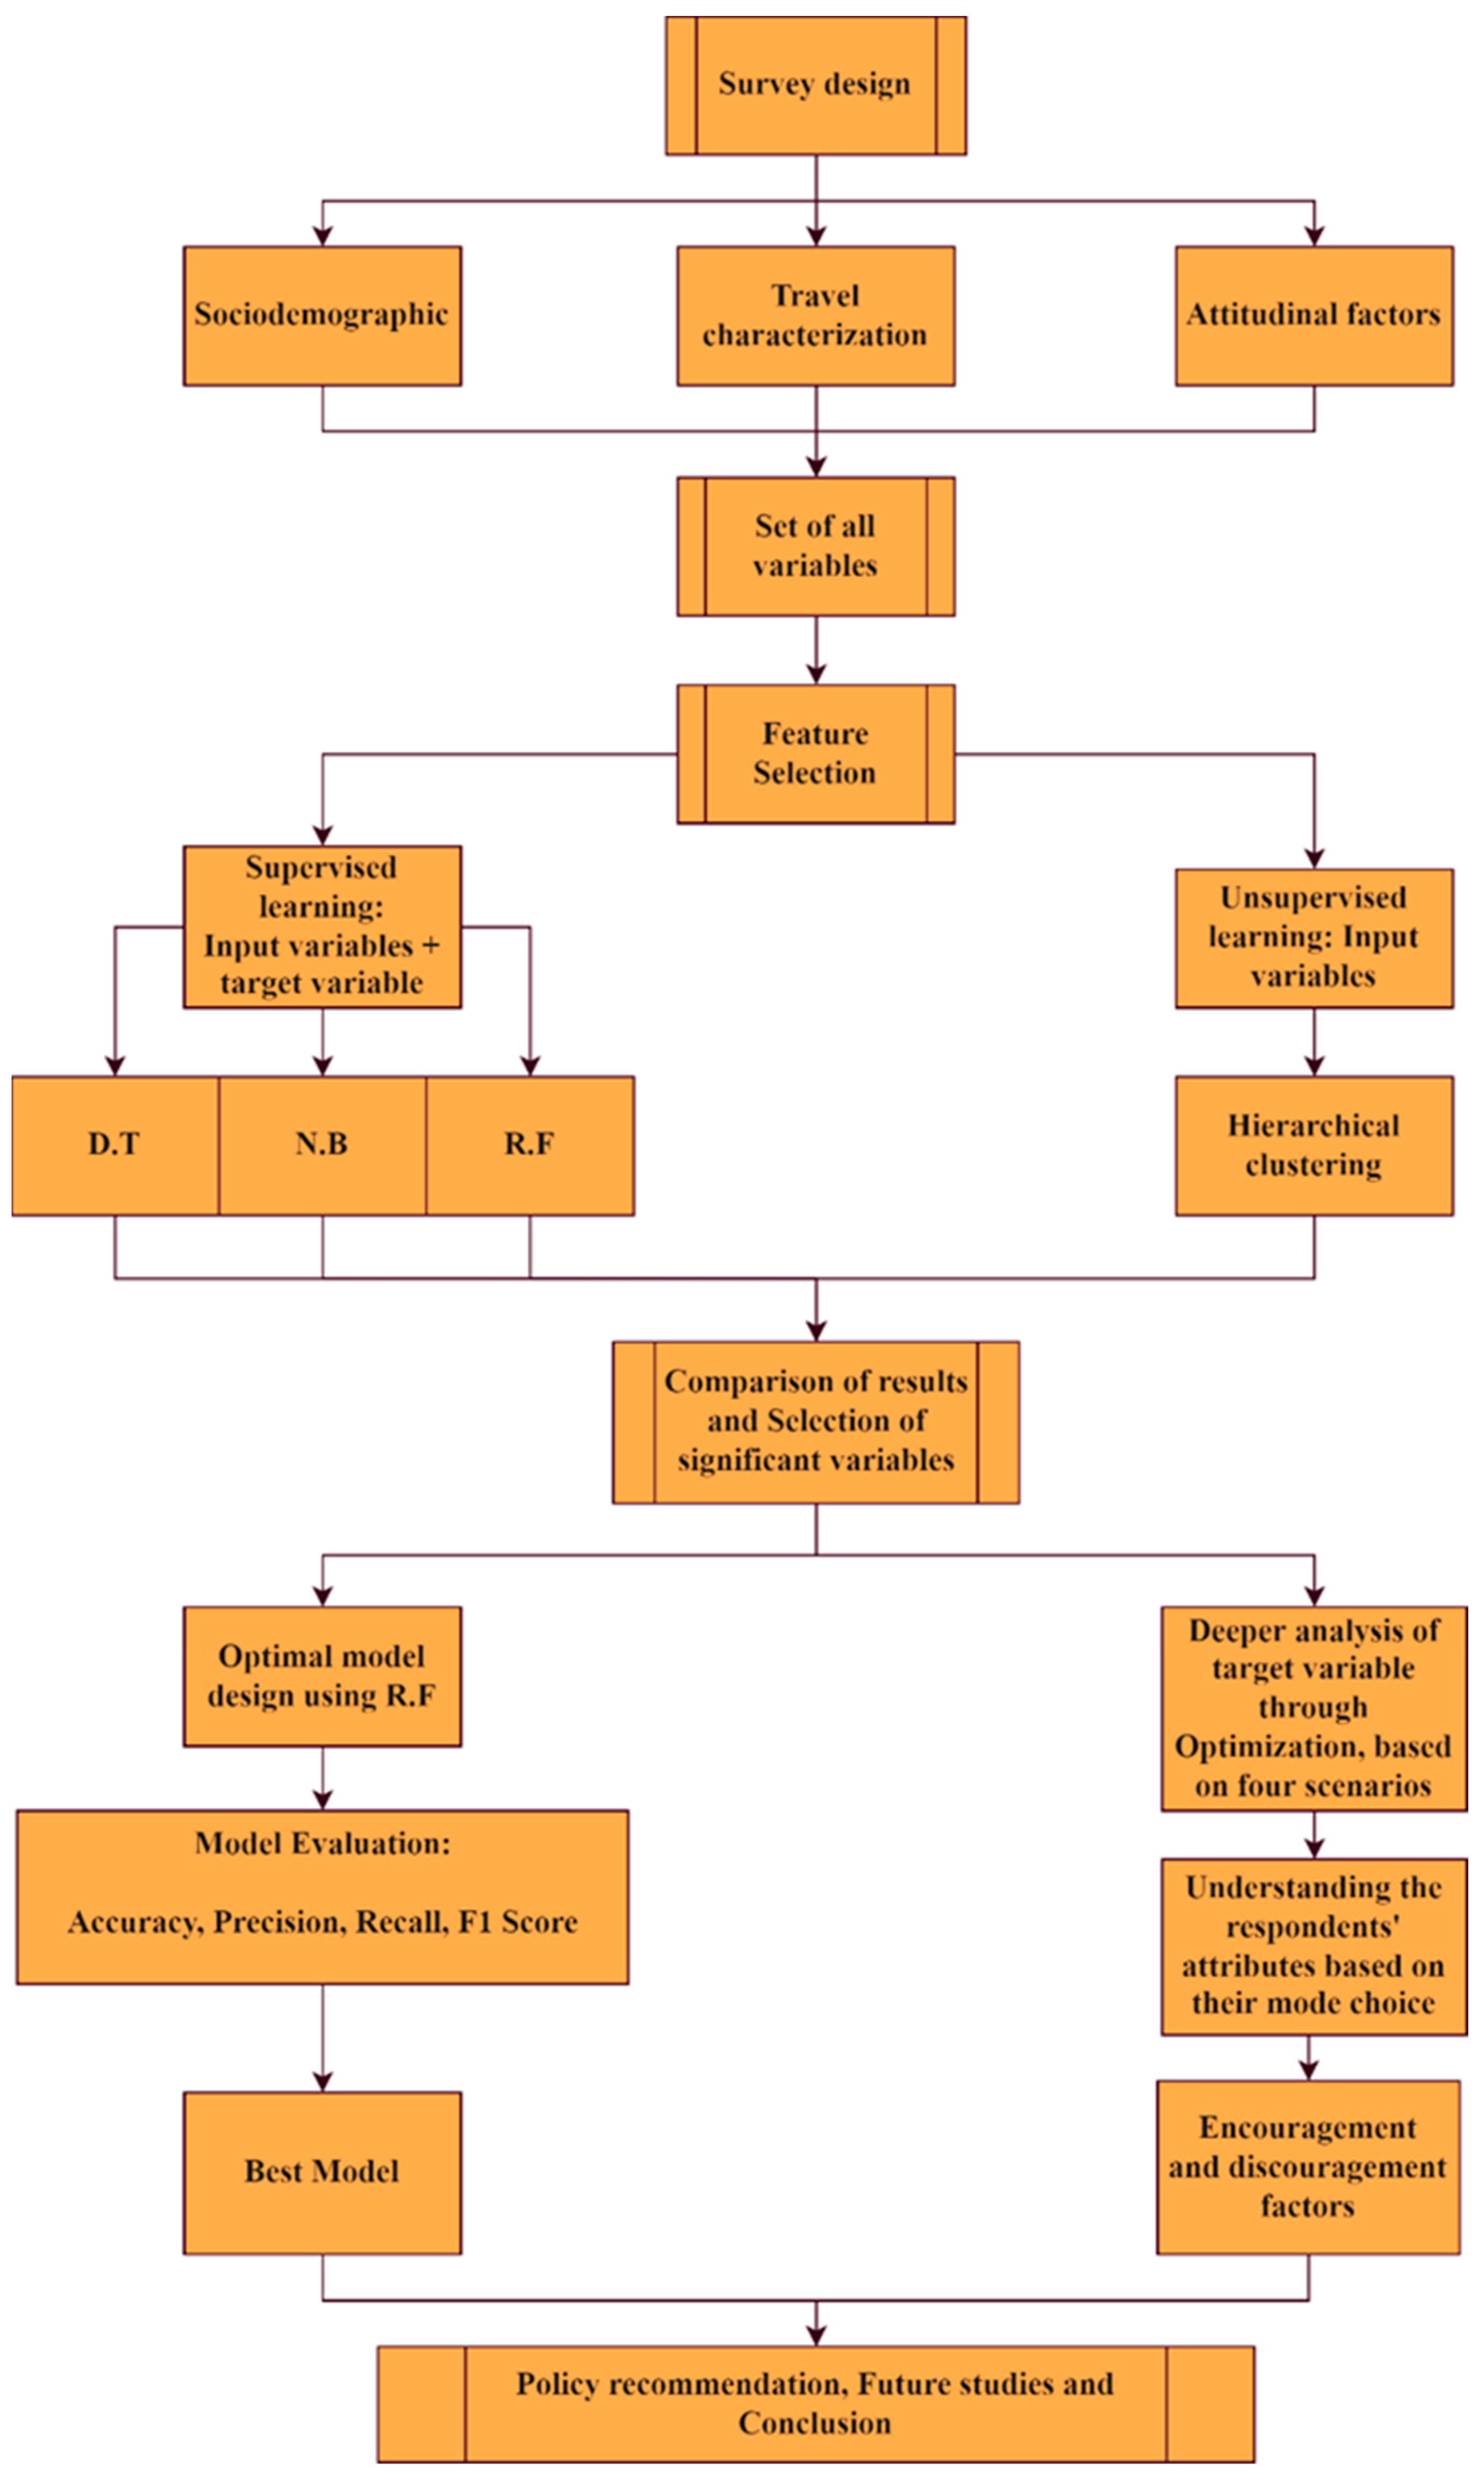
Section 4 proposes the analysis methodology, including feature selection and model development.
Section 5 and
Section 6 present the model output, analysis results and simulation-based optimization and discussion. The final part offers the obtained findings of the study and suggests future directions.
2. Related Works
It is believed that, in terms of urban features and population, higher education organizations mirror smaller cities [
28]. Moreover, there exist many activities occurring on university campuses that exert both direct and indirect effects on the natural milieu [
29]. Therefore, practitioners in these academic contexts need to apply green practices and provide support in offering multidisciplinary green technical solutions to achieve sustainable development on campuses [
30]. The United States Green Building Council [
31] revealed that a green campus is a higher education community seeking to enhance its resource conservation, energy efficiency, and ecological quality via training on healthy living, sustainability, and convenience learning environments for all.
In the context of higher education, green practices are rising rapidly. However, achieving sustainability in Malaysian universities in this regard has yet remained an issue [
32]. Malaysia has committed itself to buttress sustainability on university campuses after signing the Talloires Declaration. Thereafter, enthusiasm for focusing more on sustainable development has increased in Malaysia. Nevertheless, many universities yet lag behind in green practices in order to attain sustainability as an institutional policy. This runs counter to the outline of higher education institutions since the 1992 Earth Summit in Rio. Universities are facing pressure from non-/governmental organizations to incorporate green practices in their activities following several sustainability declarations.
Shared micro-mobility (SMM)—the short-term rent of micro-mobility vehicles such as (e-)scooters and (e-)bicycles—is regarded as a mobility (sub)system that can alter the present transport system in terms of cars [
2,
33]. This technology was first presented in 2017 and has now become an important mode of transport emerging in more than 1000 cities and college campuses worldwide. Such web-based SFFES services are managed by rental networks and operated using smartphones.
Academic studies on SFFESs have been emerging. For example, ref. [
34] examined anonymized SFFES trip data and concluded that users ride SFFESs for about 8 min for 0.7 miles, with an average speed of 5.23 miles per hour. The SFFES service could be used as an appropriate travel model for last-mile transport or short-distance trips. Ref. [
35] found considerable differences in temporal and spatial usage patterns between SFFESs and docked bike-sharing ridership [
36]. Ref. [
37] assessed the behavioral determinants of travelers’ purpose for using SFFESs and found that the perceived compatibility of SFFESs significantly affected usage intention. Ref. [
15] performed Kruskal–Wallis and Chi
2 test with e-scooter-associated survey data and pointed to the importance of sociodemographic characteristics in affecting SFFES usage. Ref. [
38] evaluated the API data of SFFES vendors and found significant SFFES ridership variations between weekends and weekdays, but not between morning and afternoon trips.
As mentioned before, most of the academic studies in this field were conducted in the US. Surveys were conducted by a few cities to complement assessing the e-scooter pilot programs. It was found that e-scooters were popular or generally considered to present a respected service, even among non-users [
15]. For example, the Portland report stated that over 30% of people had tried e-scooters. Over 70% of Portlanders riding an e-scooter stated that they utilized e-scooters most commonly for transportation, but not recreation. The reasons for use included reliability, speed, cost, convenience and fun [
39]. Unequal adoptions between population groups were suggested by surveys. The gender (female/male) splits were 64/34 and 70/30 for Portland and Denver. In total, 69% of e-scooter users were aged 20–39 in Portland, while the figure was over 50% in Denver [
39,
40].
An online survey was performed by the [
41] on 1250 individuals in the five largest cities of Germany (Hamburg, Berlin, Frankfurt, Cologne, and Munich) in September 2019. It explored their overall mobility behavior and utilization of SFFES systems. It revealed that 42.7% of e-scooter users were aged between 18–25, and 28.8% between 26–35. The SFFES service substituted 49.1% of walking trips and 64.5% of public transport trips. A quantitative study was performed by the French [
42]. They gathered 4382 user responses after various semi-structured and exploratory interviews. It reported that e-scooter renters were young (52% younger than 34), male (66%), highly educated (19% students, 53% work executives), and with a significant share of non-locals (42%). For the modal shift, users substituted walking (44%), public transport (30%), and bike trips (3% owned a bike; 9% shared a bike).
Supervised learning algorithms learn correlation patterns from data (independent and target variables) and make decisions/predictions based on a specific objective. Decision trees (DT) are widely used in data-driven prediction analysis [
43,
44,
45,
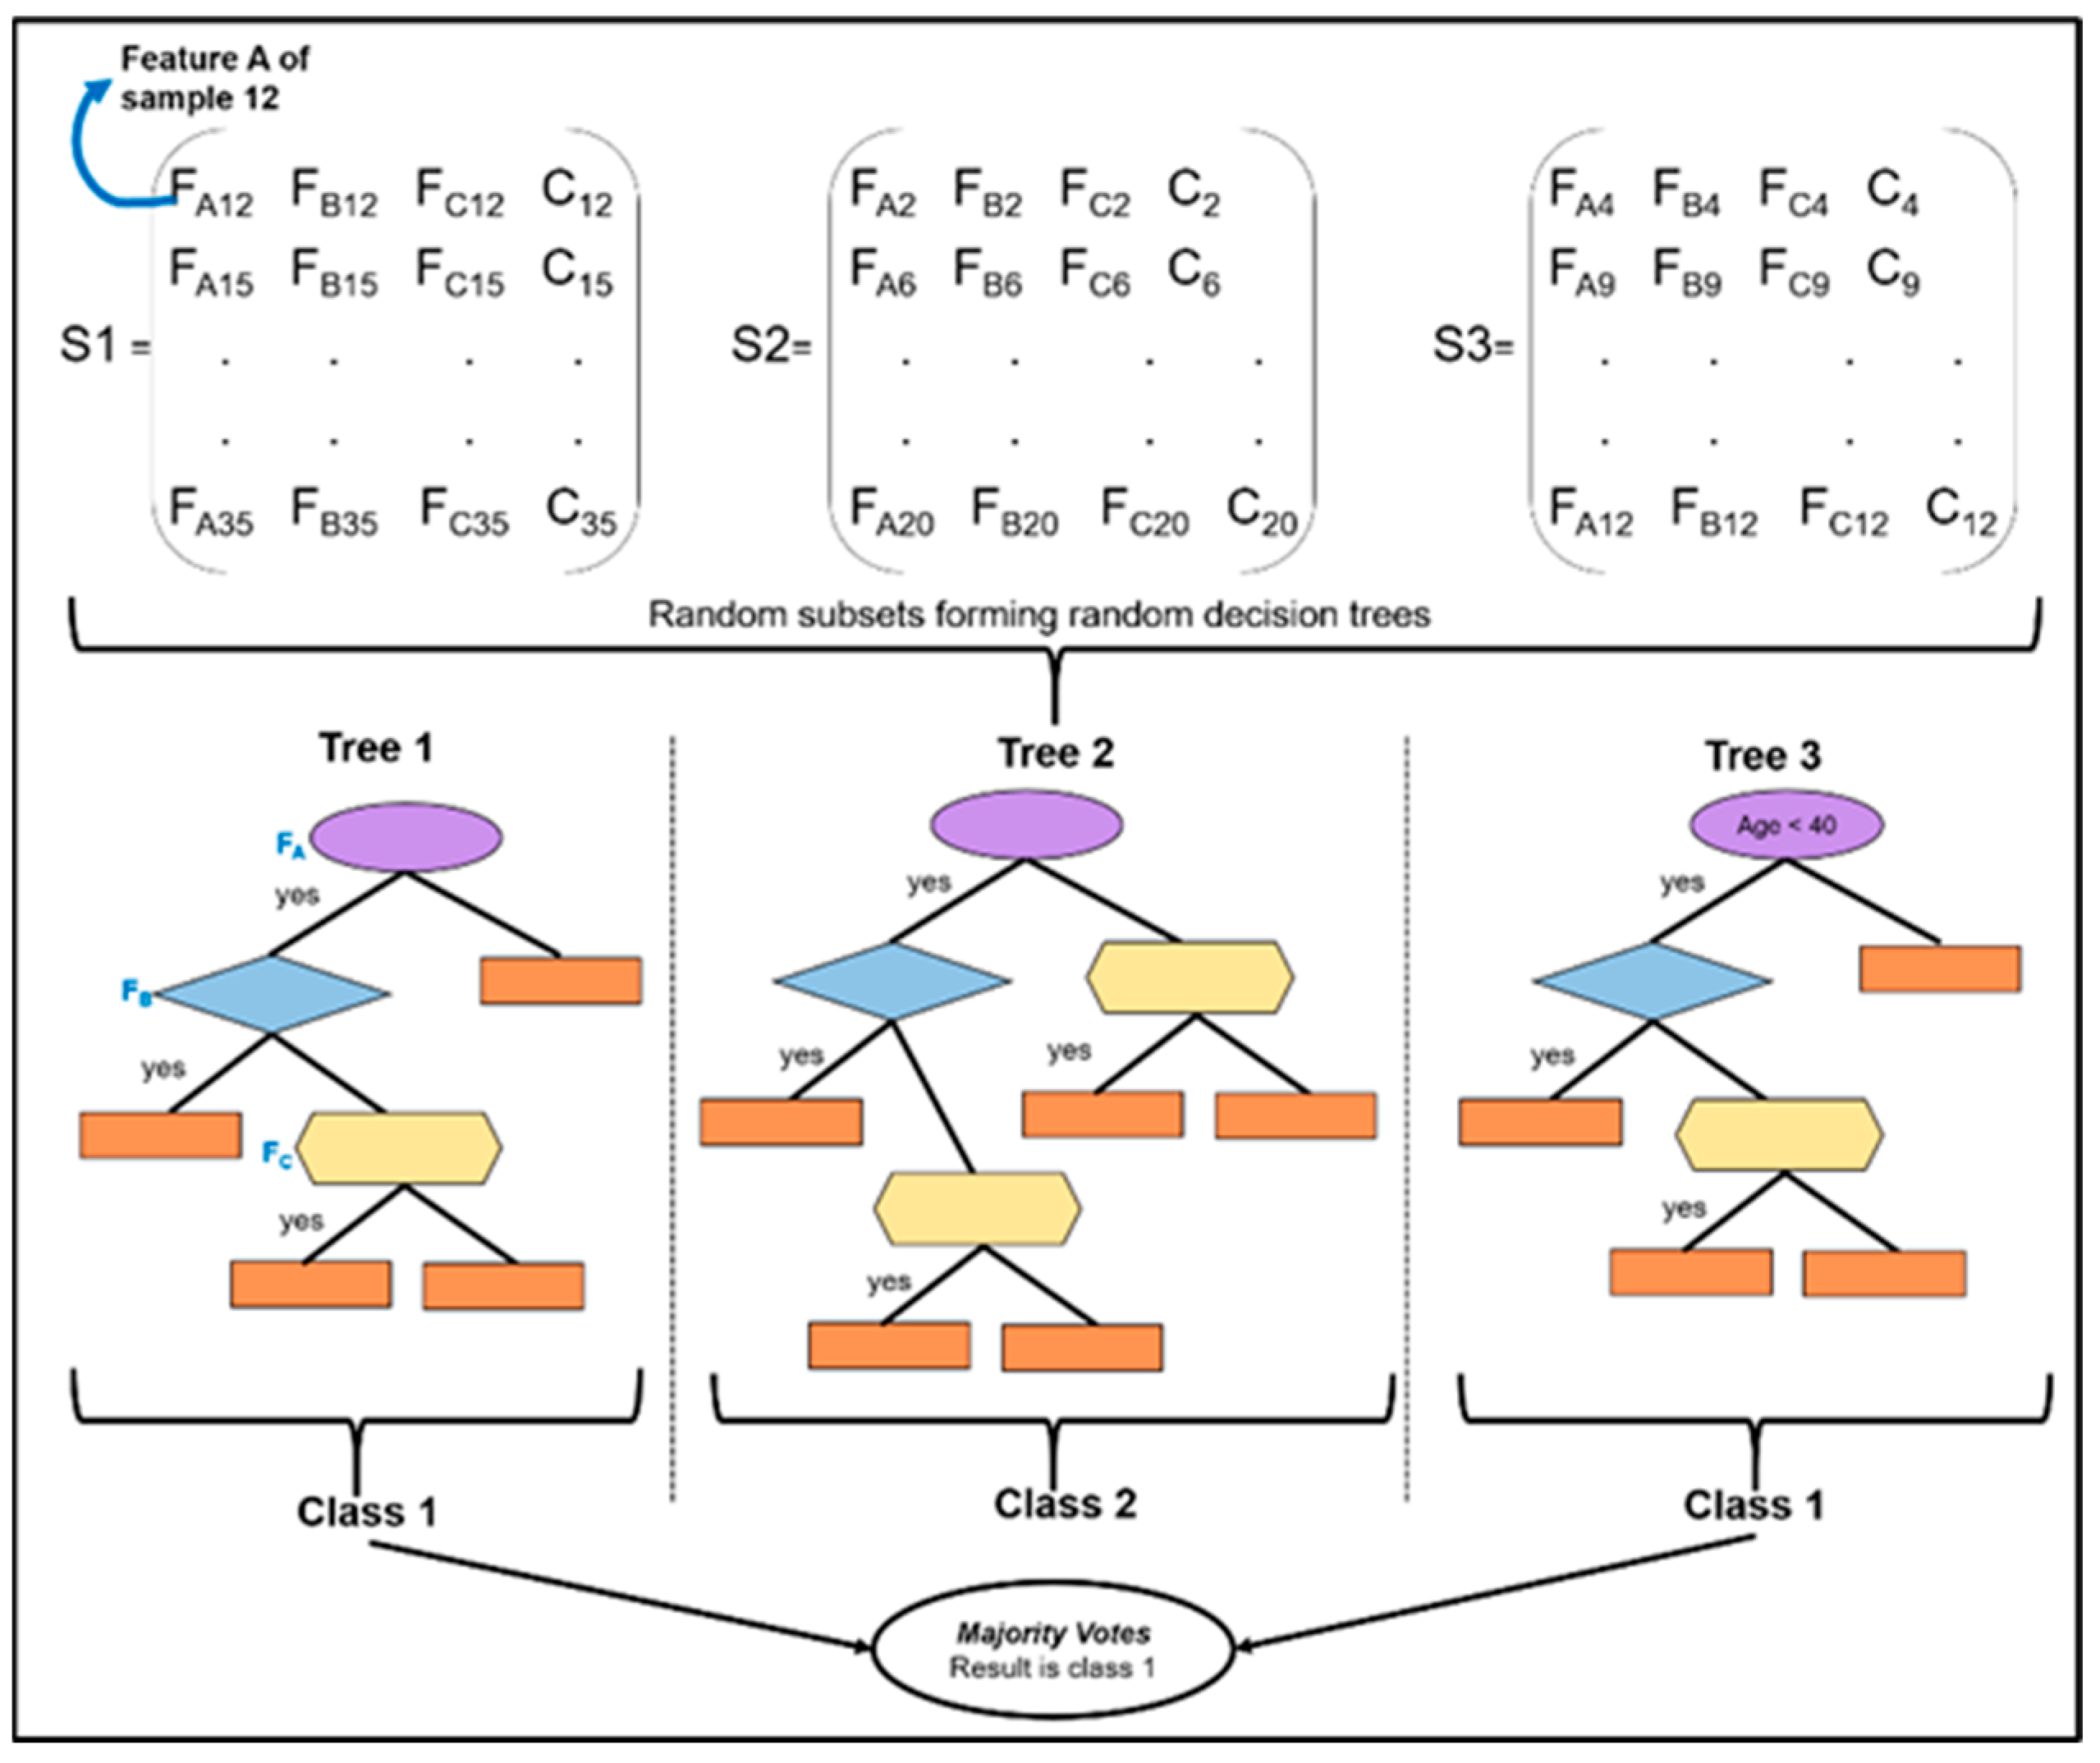
46]. Decision trees have been used for model evaluation and identifying important variables. Random forests (RF), a derivation of decision trees, can work in both supervised and unsupervised modes. It can handle continuous as well as categorical data in classification or regression tasks [
47,
48]. Random forests are prioritized over other techniques, as it can manage highly non-linear data, and demonstrates many features, such as agility in locating noise in data and adjustability to parameters [
49]. It has three main features: (i) estimating missing values automatically, (ii) Weighted Random Forest (WRF) for balancing errors in imbalanced data, and (iii) estimation of the significance of variables utilized for categorization [
50]. Naïve Bayes (NB) classifiers are also able to handle continuous and categorical variables and quickly make real-time predictions [
51].
Unsupervised learning is designed to analyze unlabeled data [
52]. As the amount of unlabeled data is exponentially rising, it is essential to explore unsupervised learning to perform feature selection. Data clustering (feature selection) is an important problem in knowledge discovery to improve the understandability, scalability and accuracy of resulting models. The clusters correspond to hidden models and the resulting outcomes represent data notions. In the context of supervised learning, feature selection refers to predictions based on provided outputs, while in unsupervised learning the features are clustered without any prior knowledge of the expected output. The importance of feature clustering is to improve prediction performance and provide a deeper understanding of the underlying process that produces the data. Examples of clustering algorithms are k-means, partitioning around medoids (PAM) and hierarchical clustering. This paper uses both supervised and unsupervised learning techniques for feature selections and predicting the usage frequency of SFFESs on campus.
4. Results
4.1. Descriptive Analysis (Encouragement and Discouragement Factors)
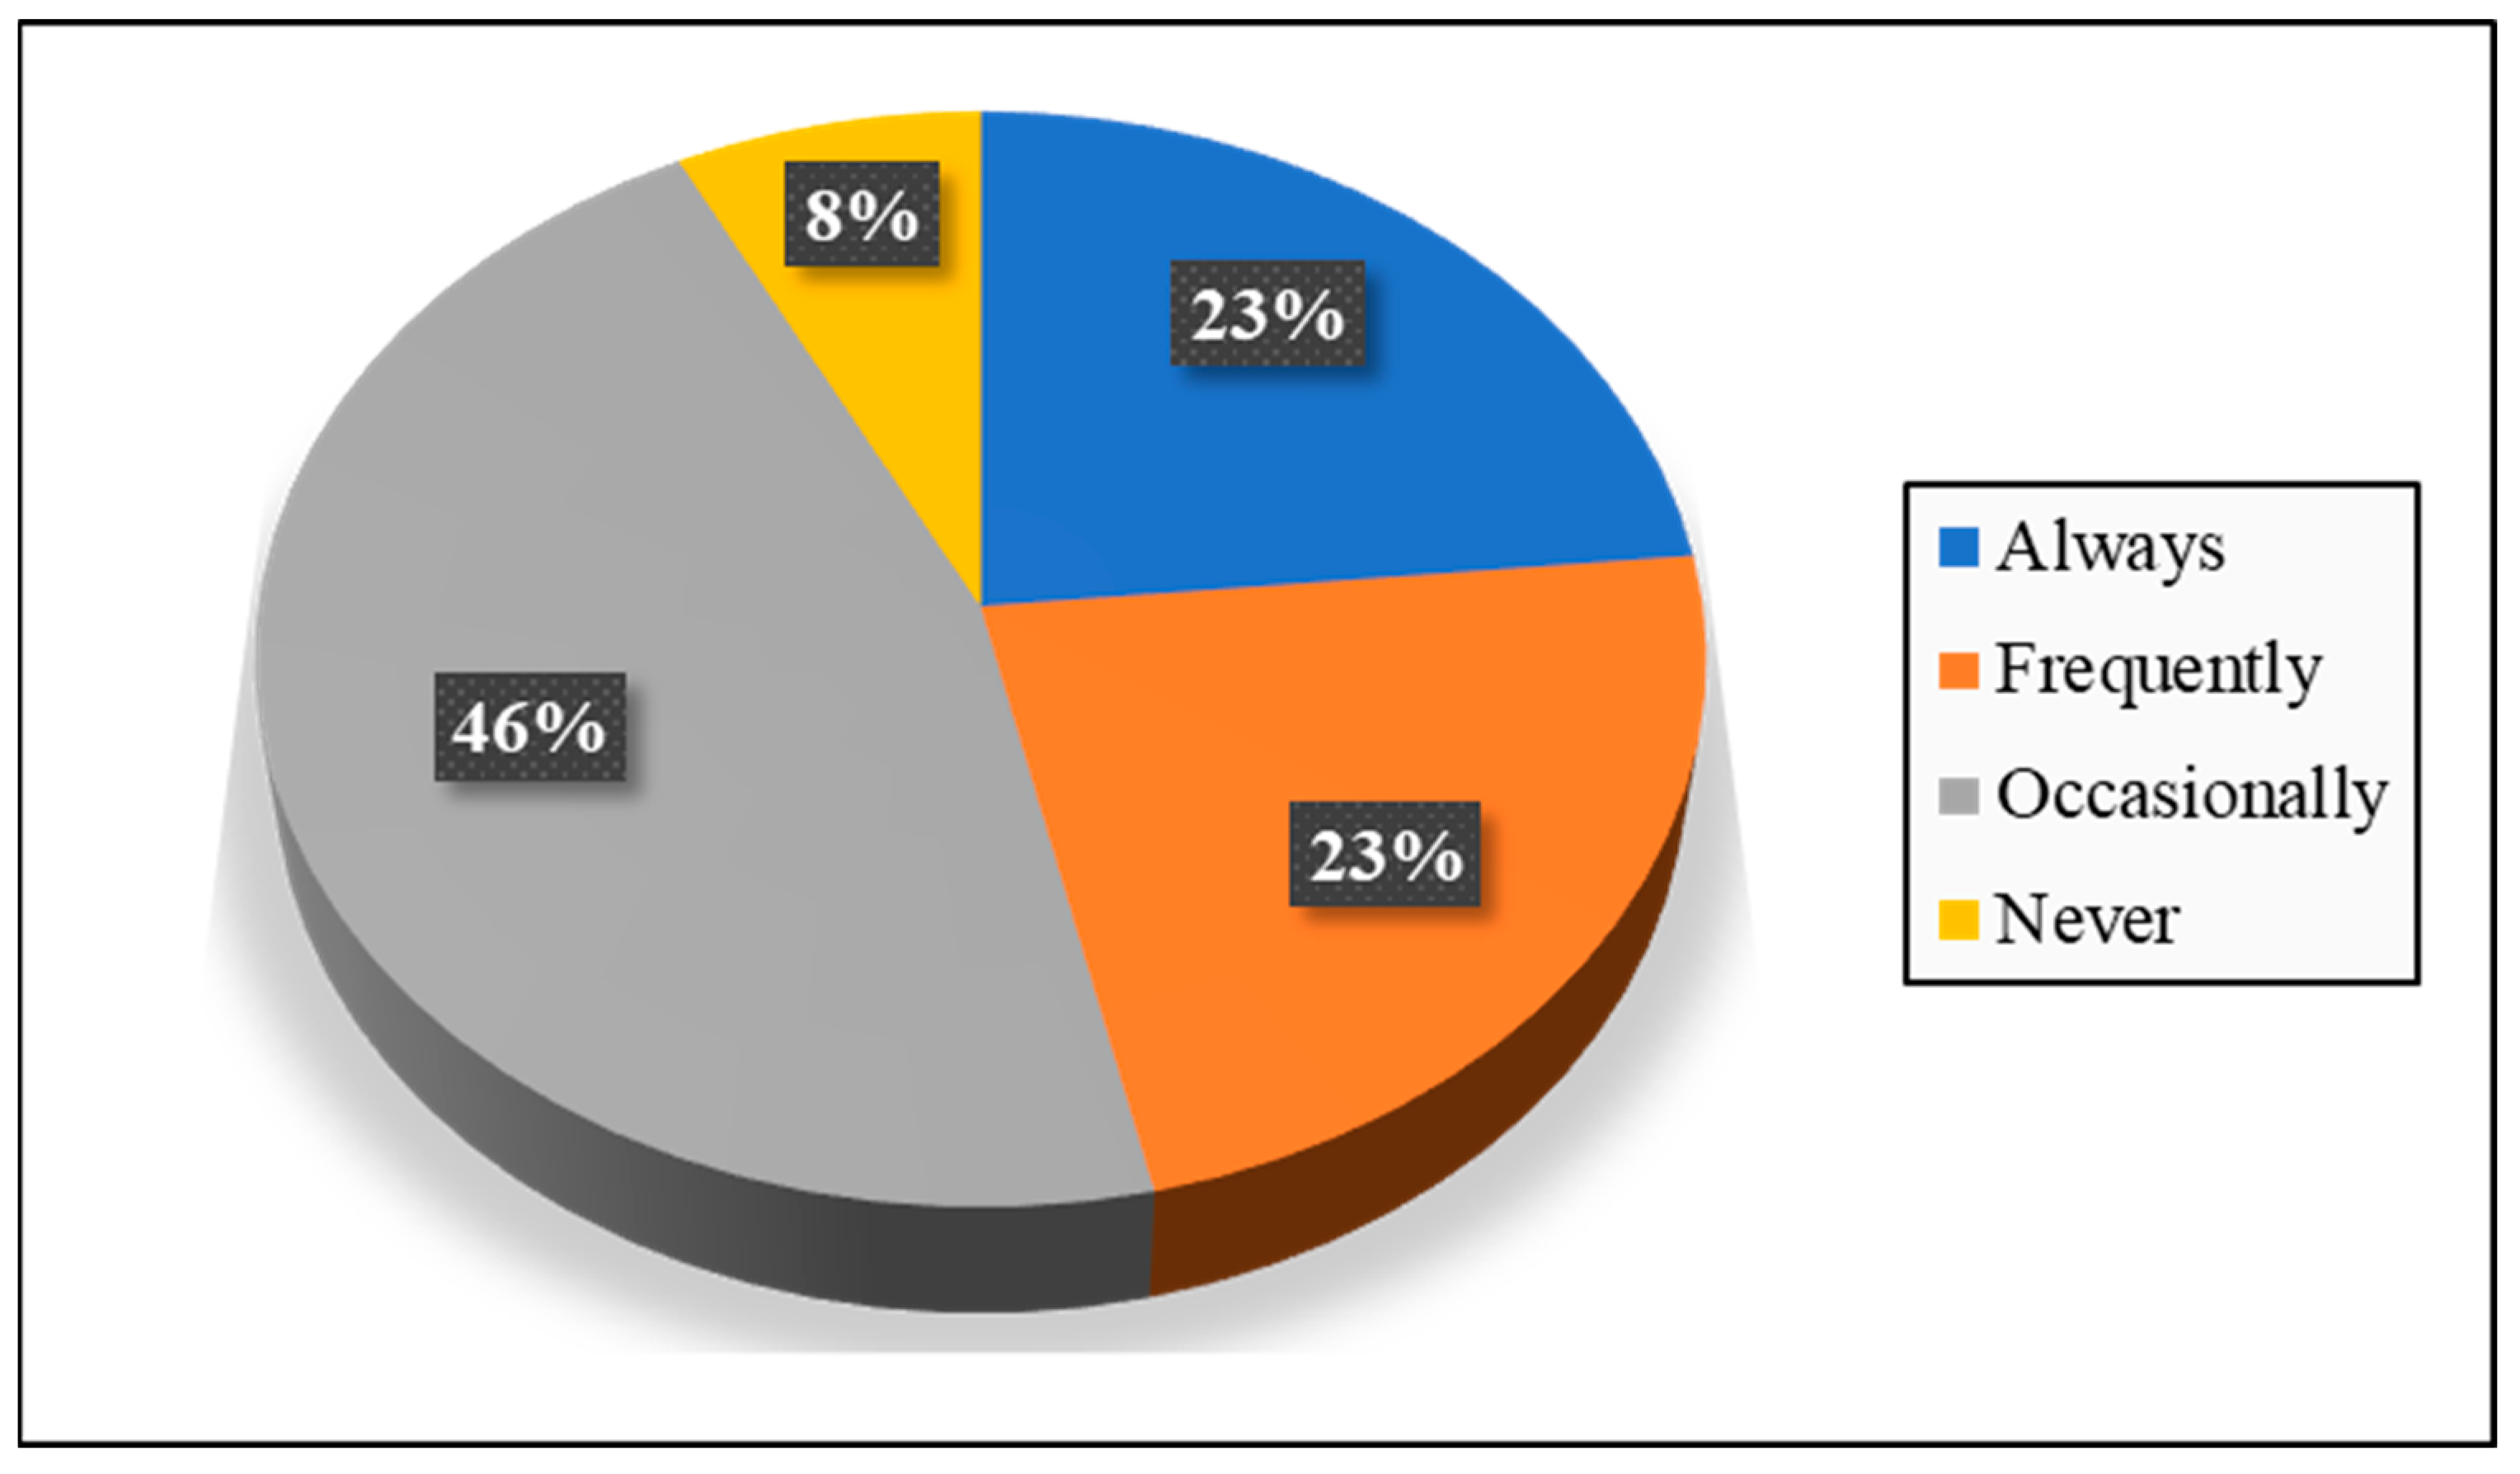
This section presents the results of the last part of the survey, which measured encouragement and discouragement factors for using SFFESs. In other words, after predictions of SFFES usage, important factors and levels of acceptance between different groups of respondents, this section was designed to answer the following questions: 1—Why will certain respondents never use SFFESs (8% of total respondents according to
Figure 4)? 2—What are their main concerns? 3—What are the benefits of the SFFES service from our respondents’ point of view?
Survey participants were asked to express their perceptions and feelings regarding the encouragement and discouragement factors of using SFFES services. In the first part, we asked the participants about the benefits and advantages of SFFESs.
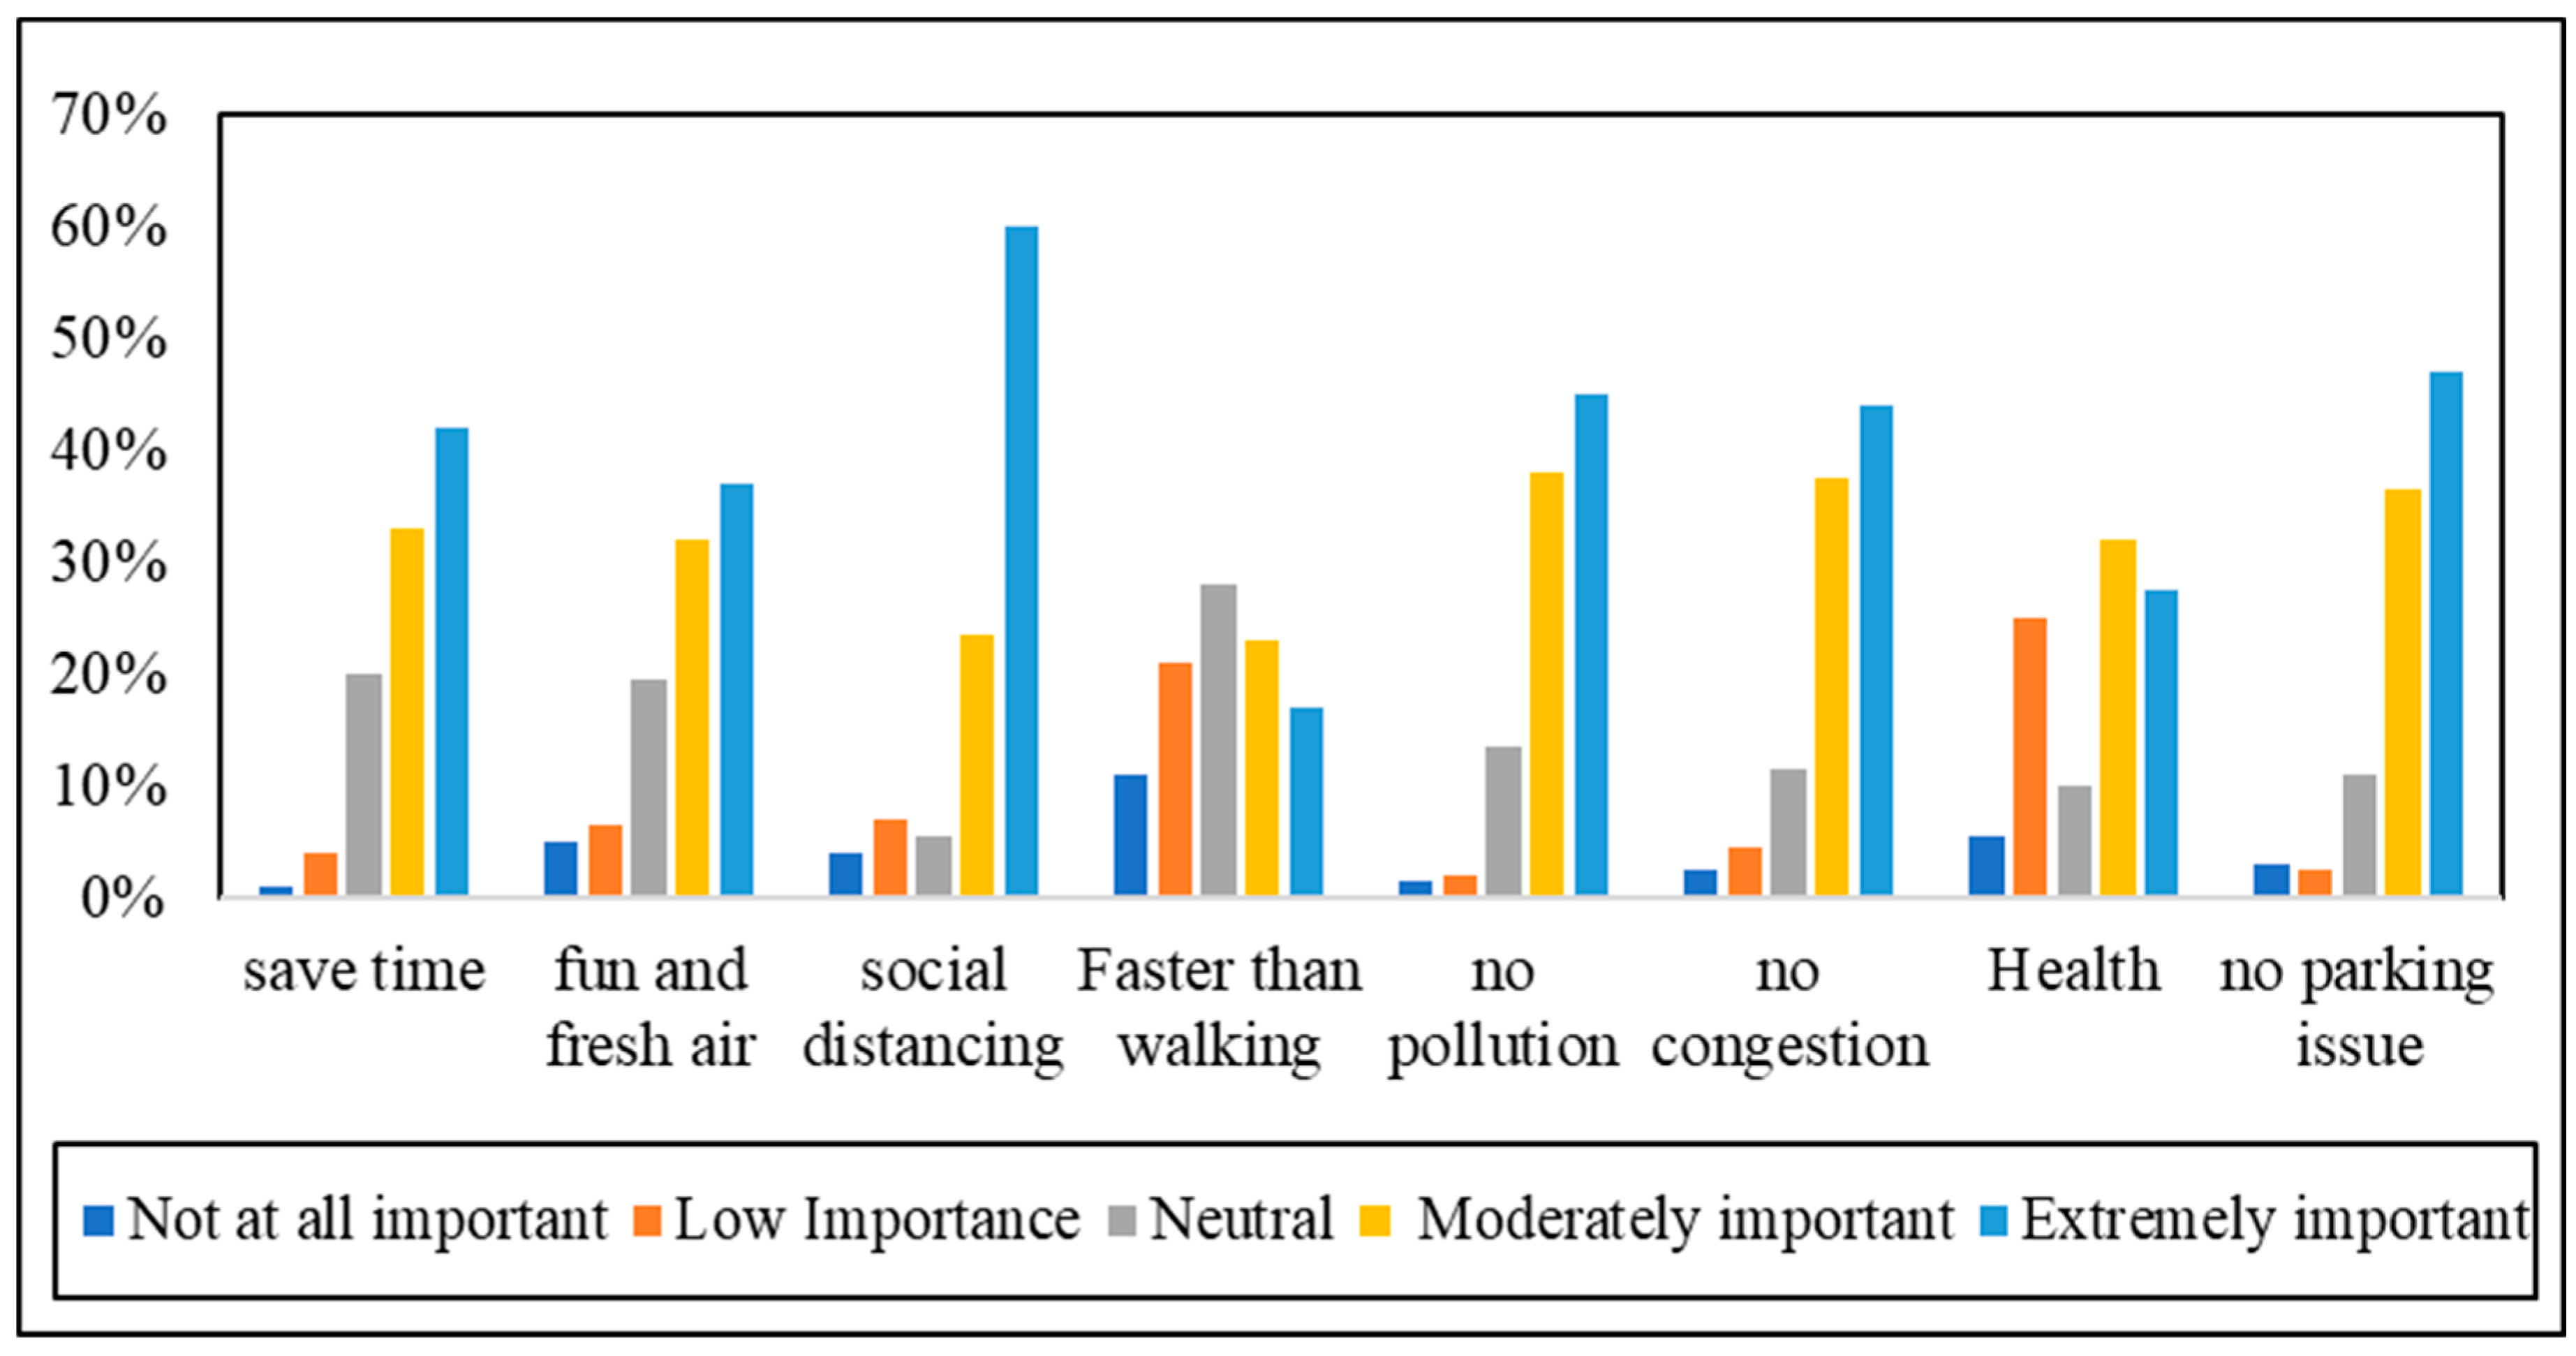
Figure 5 presents the overall responses to questions about the benefits/advantages of using SFFESs.
According to
Figure 5, most of the respondents were almost agreed on all mentioned benefits of SFFESs, except for “speed” and “physical/mental health”. A considerable number of participants used a private vehicle as their main mode of transport on the campus. This could be one of the reasons why most of the participants selected a neutral option about the speed. The second, less-important advantage of the SFFES was health benefits, based on participants’ responses. Indeed, the physical and mental benefits of e-scooters are not well investigated. However, using an e-scooter obviously requires less physical activity comparing to walking and cycling. Interestingly, social distancing during the pandemic was selected as the most important benefit of SFFESs. Recently, the COVID-19 virus hit Malaysia badly, and the number of new positive cases reached 4500 per day. This was the main concern of the current situation and people were seeking safe ways to go about their daily activities. 47% of survey participants indicated that they would not have car park issues by using SFFESs, and 45% believed that the environmental benefits (no pollution) of SFFESs were extremely important. In addition, “saving time” and “no traffic congestion” were indicated as extremely important benefits of SFFESs by 42% and 44% of participants, respectively.
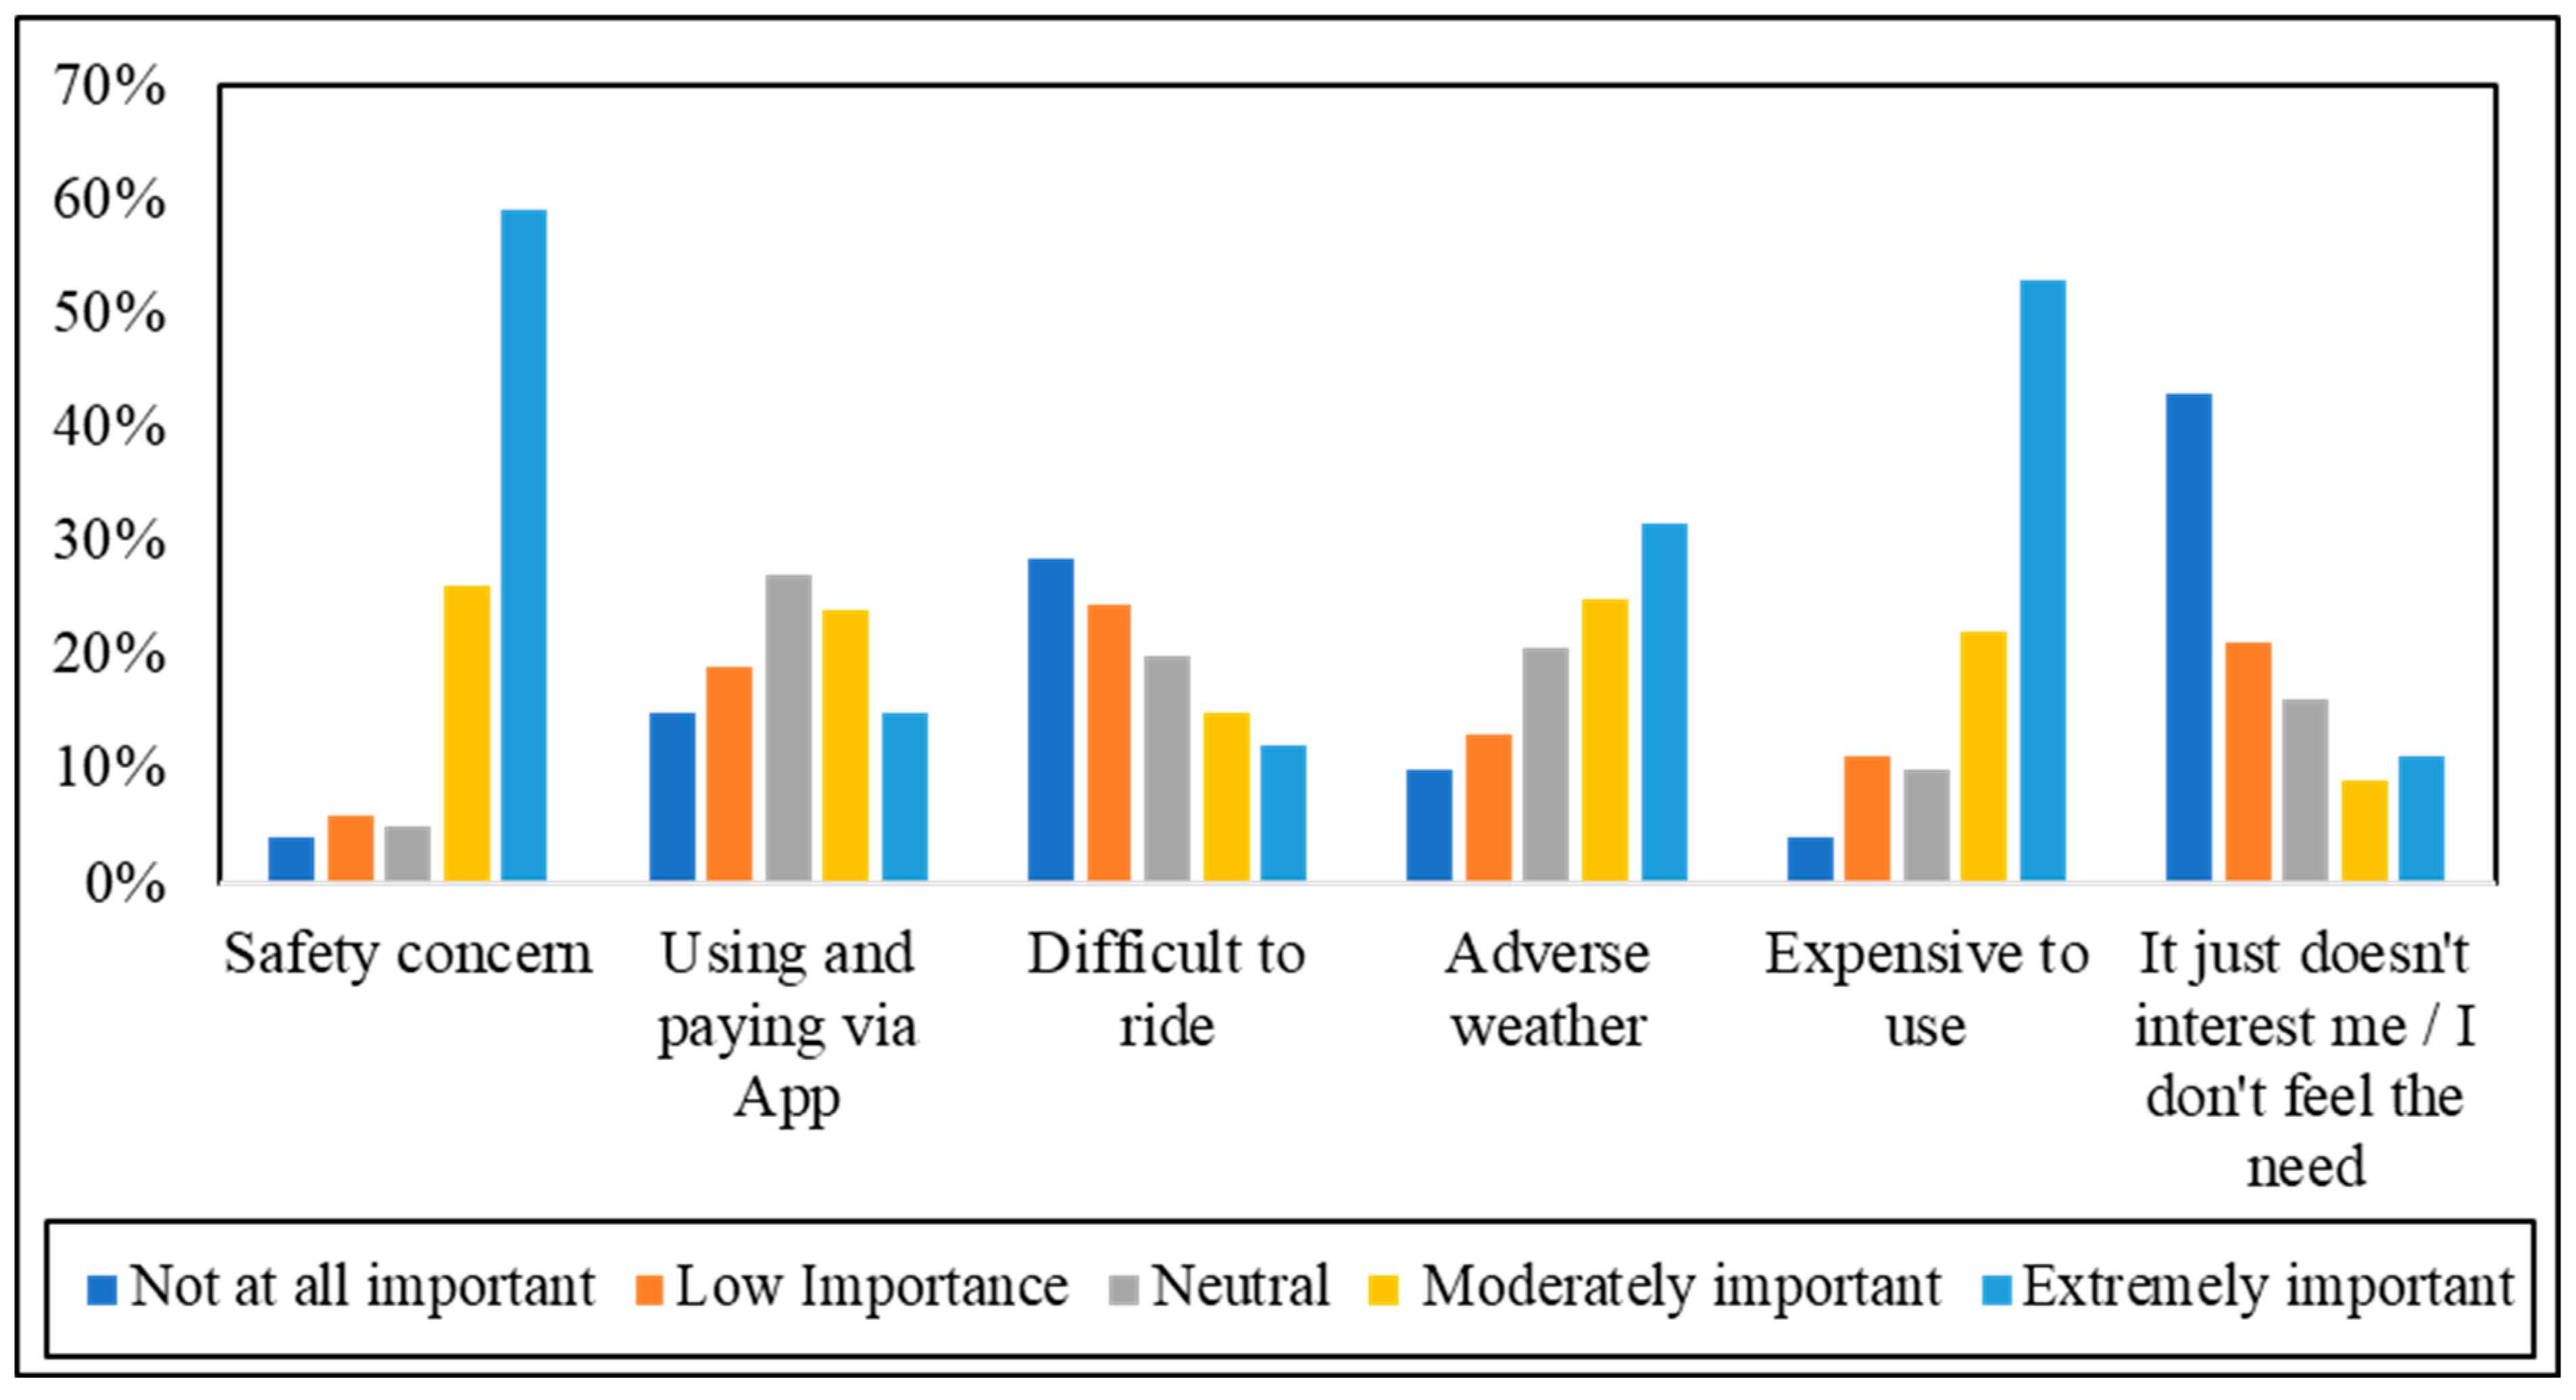
The next series of questions were designed to ask respondents about their concerns about SFFESs, and what factors would prevent them from using this service, as presented in
Figure 6. Safety was indicated as an extremely important concern of using SFFESs by 59% of respondents, moderately important by 26% of respondents, and not at all an important concern by only 4% of respondents. Surprisingly, the cost of riding SFFESs was selected as the second most important concern by 75% of respondents. In total, 53% and 22% of respondents indicated the “cost” as an extremely important and moderately important preventative factor, respectively. Due to the hot and humid tropical weather of Malaysia throughout the year, which is also interspersed with tropical rain showers, “adverse weather” is always a significant concern. Accordingly, almost 55% of respondents indicated the weather as an important preventative factor.
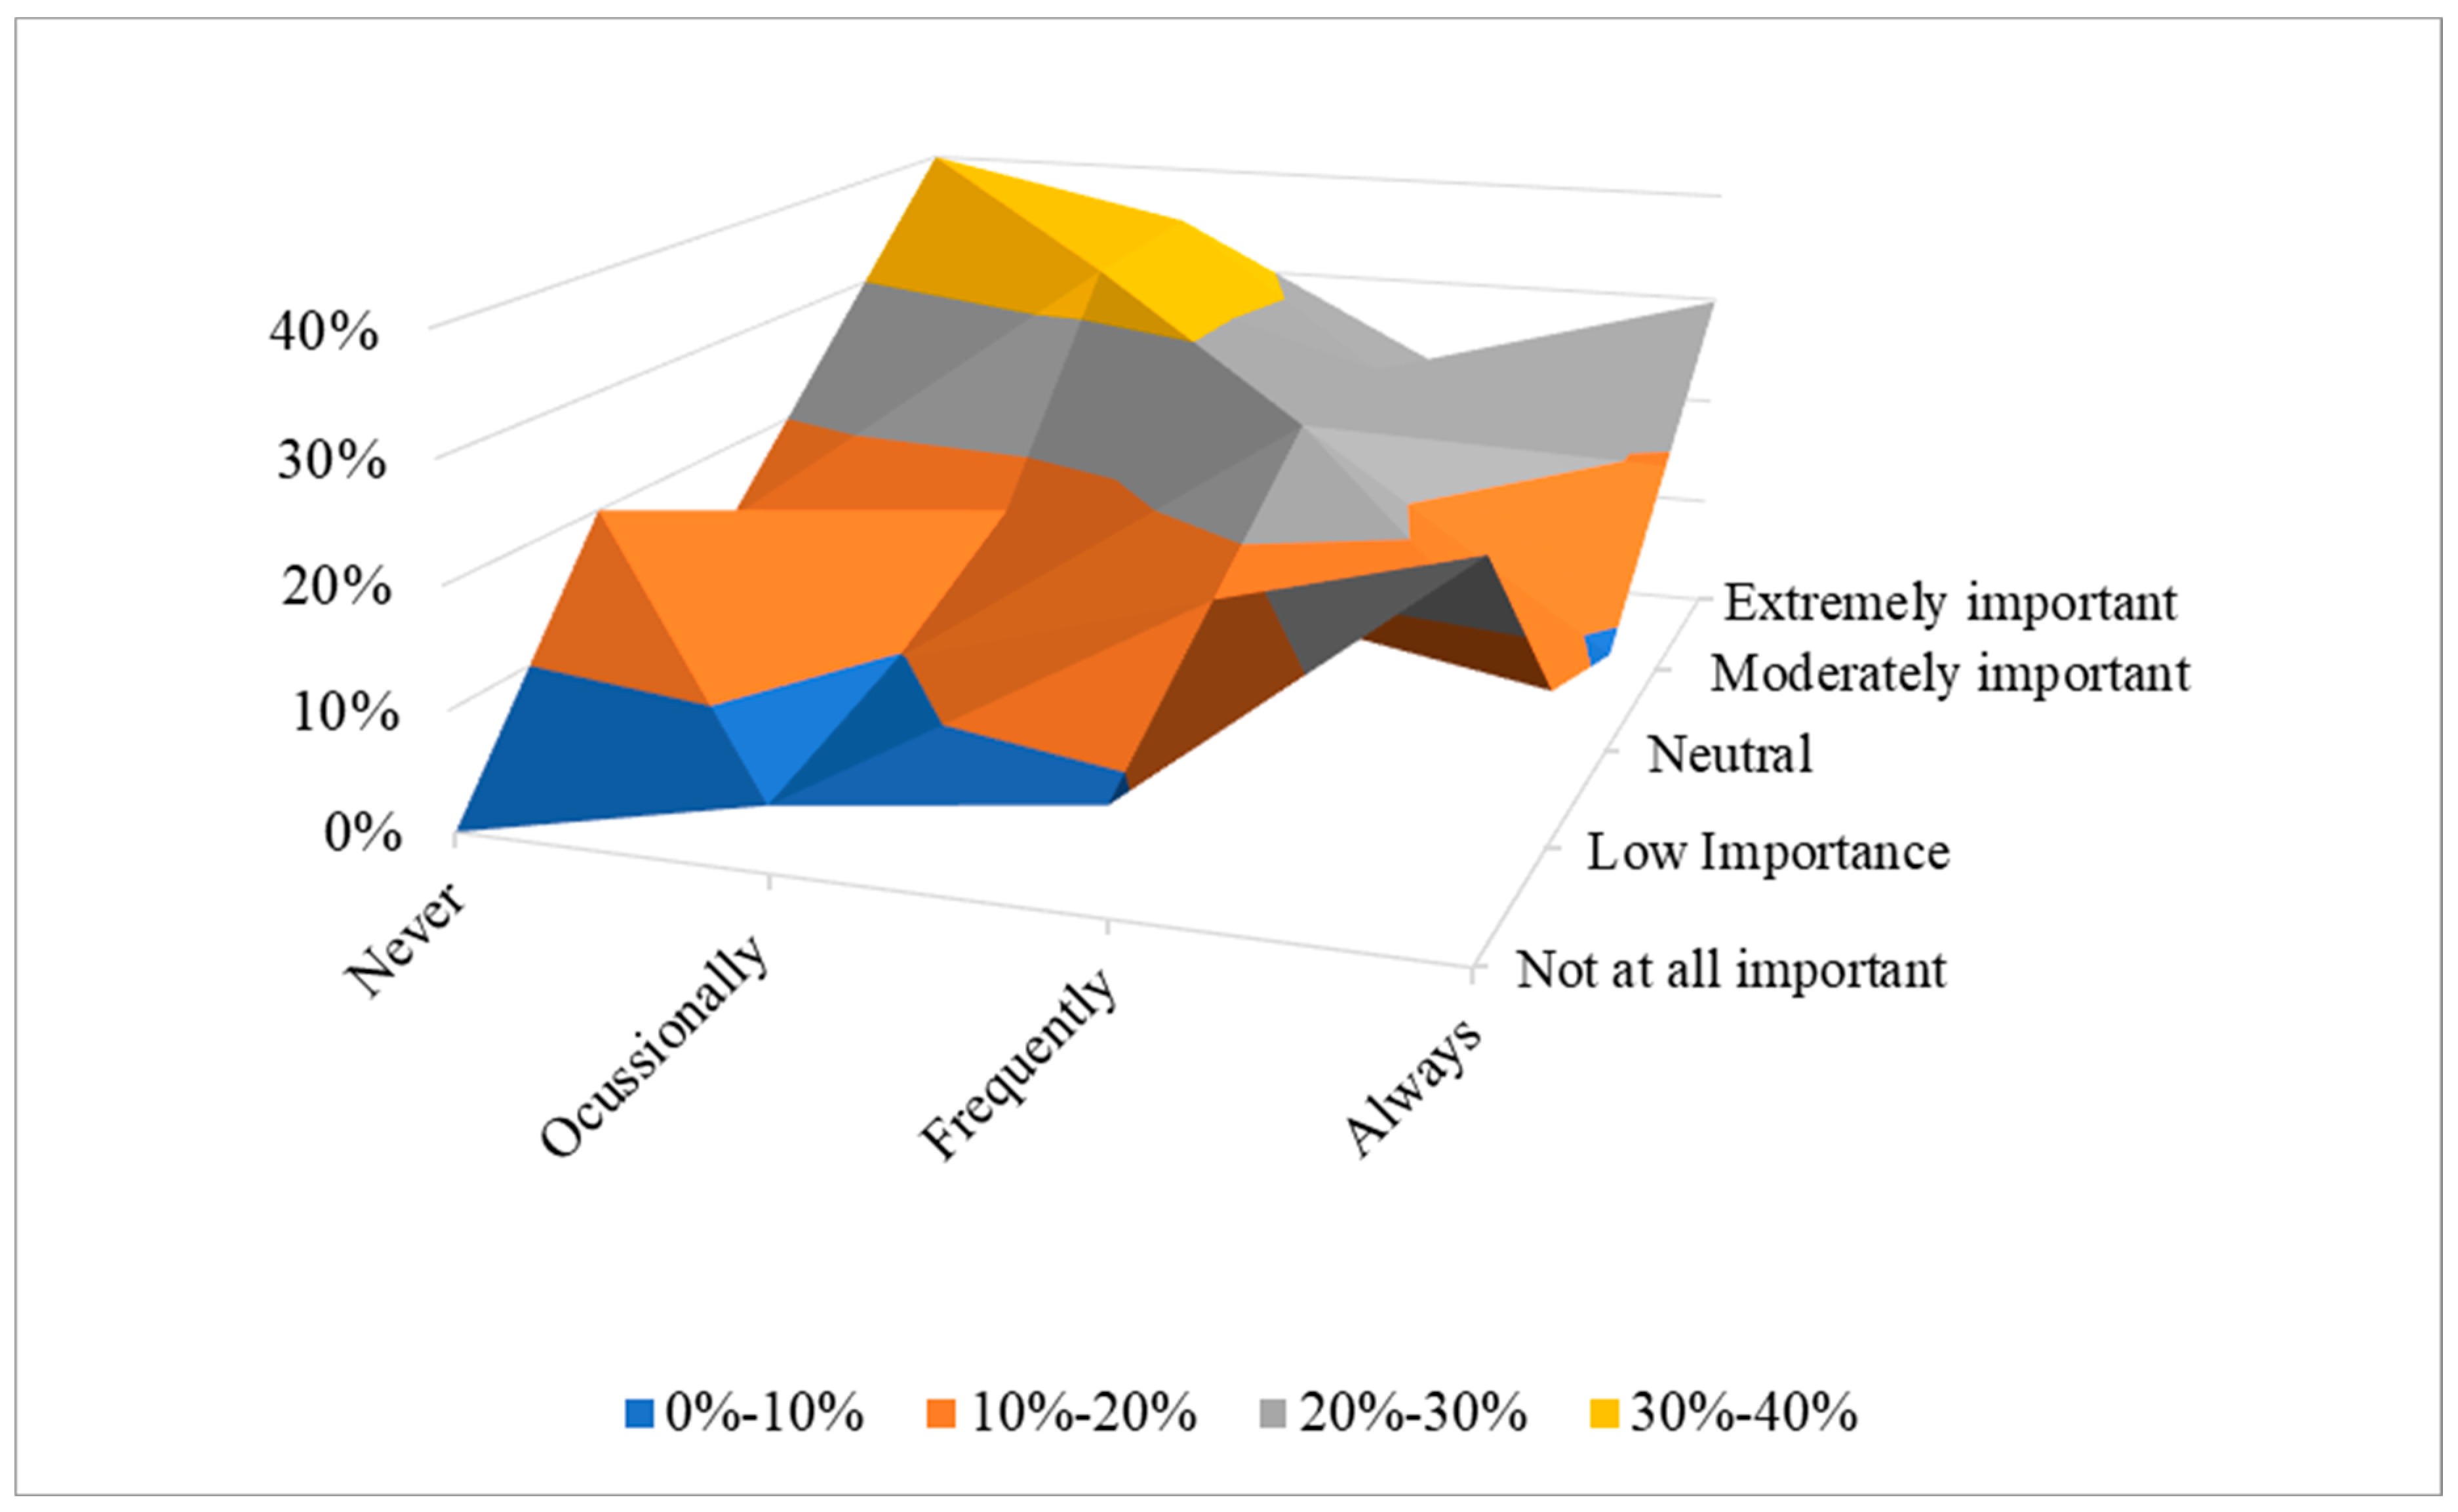
As explained above, safety was indicated as the most important concern by almost 85% of the survey participants. Therefore, we decided to further explore this concern to gain better insights for policy making discussions and recommendations.
Figure 7 illustrates SFFES users’ perception of safety concerns based on their willingness to use the service in future. Respondents who would never ride e-scooters had the highest level of safety concern. Almost 40% of participants who belonged to this category specified that safety was an extremely important preventative factor to riding an e-scooter on campus, and 30% stated that it was moderately important.
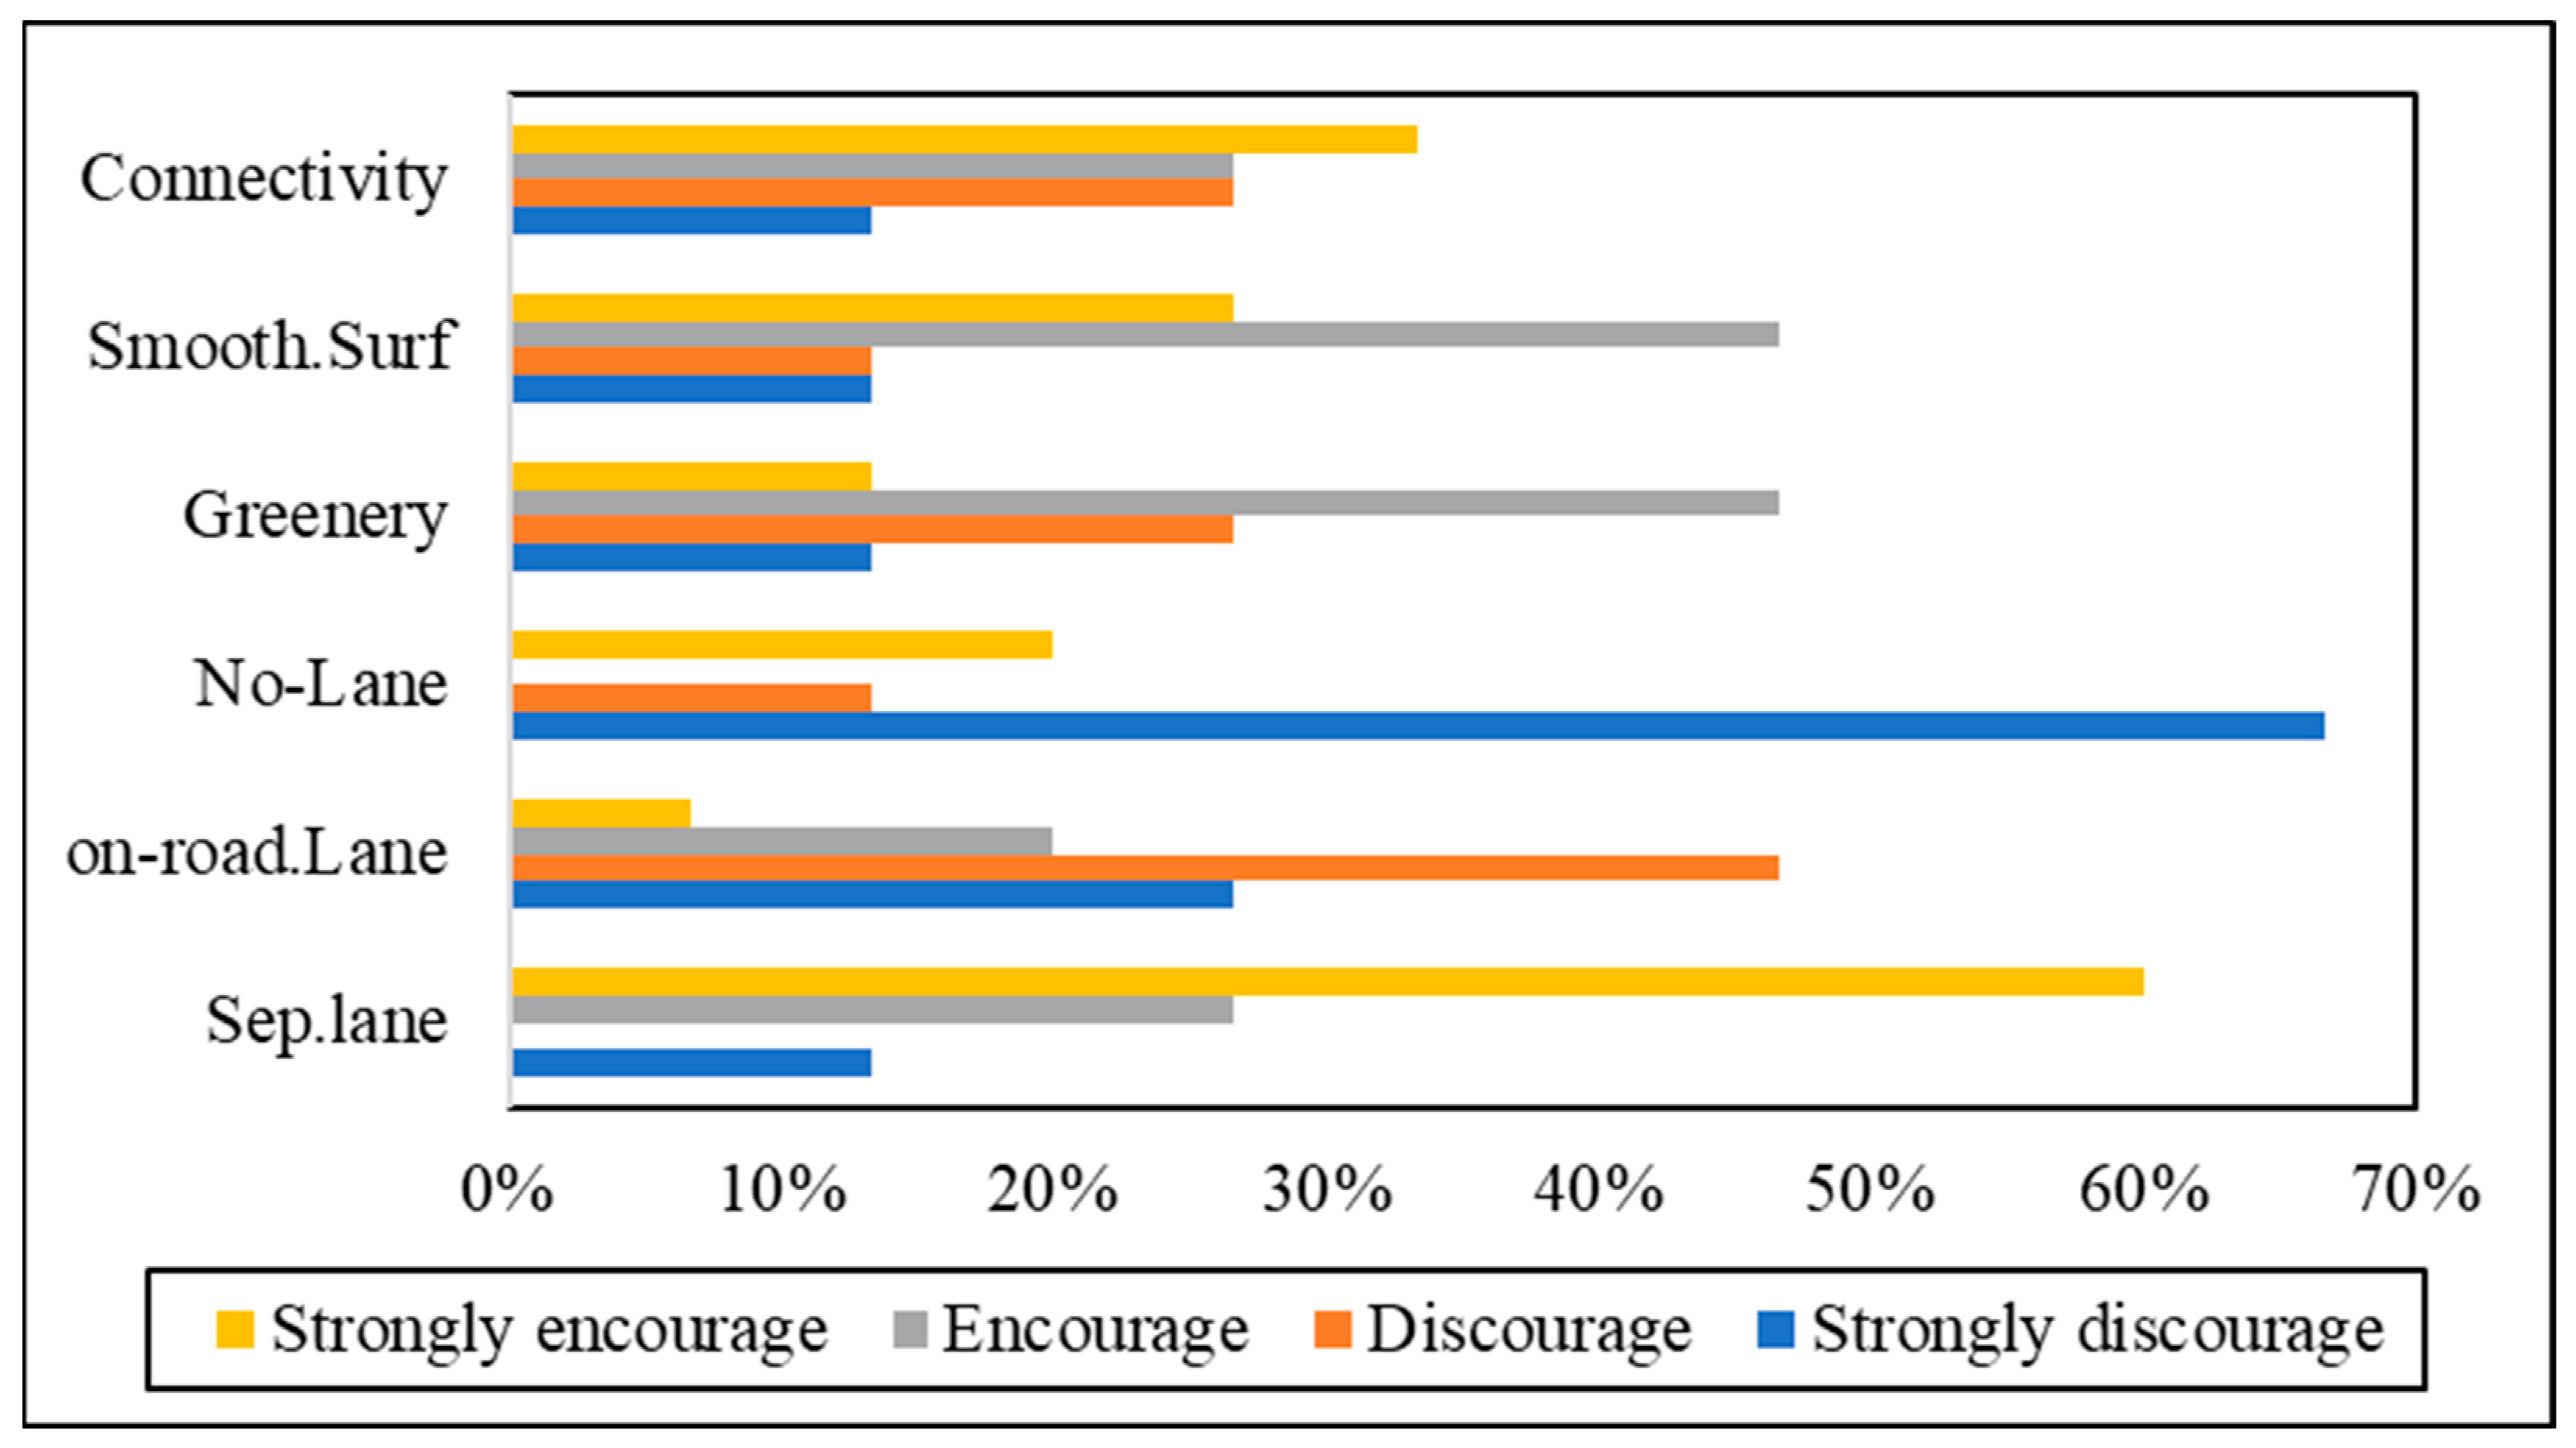
In addition, over 80% of respondents who indicated safety as an extremely preventative concern also stated that they were extremely afraid of hitting somebody or being hit while riding an e-scooter. One of the chief causes of worry about accidents was the road features. Almost 60% of respondents who were extremely worried about safety indicated that separated scooter/bicycle lanes would strongly encourage them to ride an e-scooter. In addition, almost 67% of them specified that no separated lanes for e-scooters would strongly discourage them from riding an e-scooter. The impact of other road features such as road connectivity, the quality of the surface and the availability of water and green spaces on their willingness to ride an e-scooter is shown in
Figure 8.
4.2. Policy Recommendation
In line with the intentions of the Malaysian government to develop green university campuses in the country, a number of universities in Malaysia have begun carrying out different green practices in an effort to improve sustainability. Accordingly, Malaysian academic centers, especially those at the higher education level, are dedicated to supporting the 40% reduction of carbon dioxide (CO
2) emissions vowed by the government at the 1992 Earth Summit in Rio [
57]. Nevertheless, scholars such as [
58] argue that, in Malaysian university management, practitioners and stakeholders are oblivious to green campus paradigms, which has caused most universities to ignore green practices. Currently, research on sustainability is initiated and socially certified by experts in higher education institutions [
59]. However, there is still a lack of a proper method for interdisciplinary communication and cooperation among these sustainability practitioners to compile integrated data gleaned based on green indicators, which should be considered when achieving sustainability within Malaysian university campuses [
60,
61].
Nowadays, various sustainability practitioners in different areas of expertise work collaboratively to reach sustainability in the context of universities. However, interdisciplinary communication and collaboration is still absent among sustainability practitioners at higher education levels [
62,
63]. As [
64] put, there is an urgent need for an interdisciplinary approach that is able to provide higher education institutions with a green campus paradigm toward accomplishing socio-economic and environmental sustainability. This is echoed by [
65], who declared that there was insufficient harmonization and cooperation among practitioners from dissimilar domains that work jointly to obtain sustainability. The green campus concept aims to introduce engineering features including waste treatment, water treatment, and air pollution control, alongside personal aspects, such as promoting a laissez-faire outlook.
To develop a green campus, it is essential to assess the present data, information, and reports while focusing on enhancement. Generally, the aspects assessed in terms of green campus valuation instruments for higher education covers site and planning management, waste management, energy efficiency, sustainable transportation, water efficiency and conservation, indoor environmental quality, material and resource management, green education, and green innovation. In this regard, electricity, waste generation, and transportation were chosen as targets considering their higher influences on CO2 emission. Promoting active and novel modes of transportation can be an effective approach to reduce carbon emissions, as future transport will probably be dominated by electric vehicles (EVs). These vehicles offer several environmental benefits, which can lead to sustainability in urban transportation. More specifically, battery electric vehicles (BEVs) are gaining worldwide popularity. With their light weight, they could be well integrated into urban transport systems.
Electric scooters are emergent vehicles that could be used as an alternate transportation mode in campus and urban areas. These scooters have the potential to improve mobility and can be used in place of short car and ride-hail journeys. On the other hand, scooters have introduced some new challenges, which include safety, negative effects on disabled people, walkway clutter, etc. It is important for cities to evaluate the benefits that may be gained by using Shared Free-Floating Electric Scooter (SFFES) systems. SFFES services have the potential to introduce a number of environmental/social benefits, e.g., saving expenses and time (since they are generally faster than walking and even driving on crowded roads), lessening traffic blocking, enhancing multimodal transport connections, and decreasing the emissions of greenhouse gas (GHG). However, all these benefits are deeply dependent on adopted policies. For instance, based on our study results, most of the respondents specified the SFFES as an expensive transportation mode for campus usage. Making reliable decisions on this issue can be of great support to the expansion of e-scooter share programs in both campuses and cities.
4.3. Selection of Significant Variables through Unsupervised Clustering
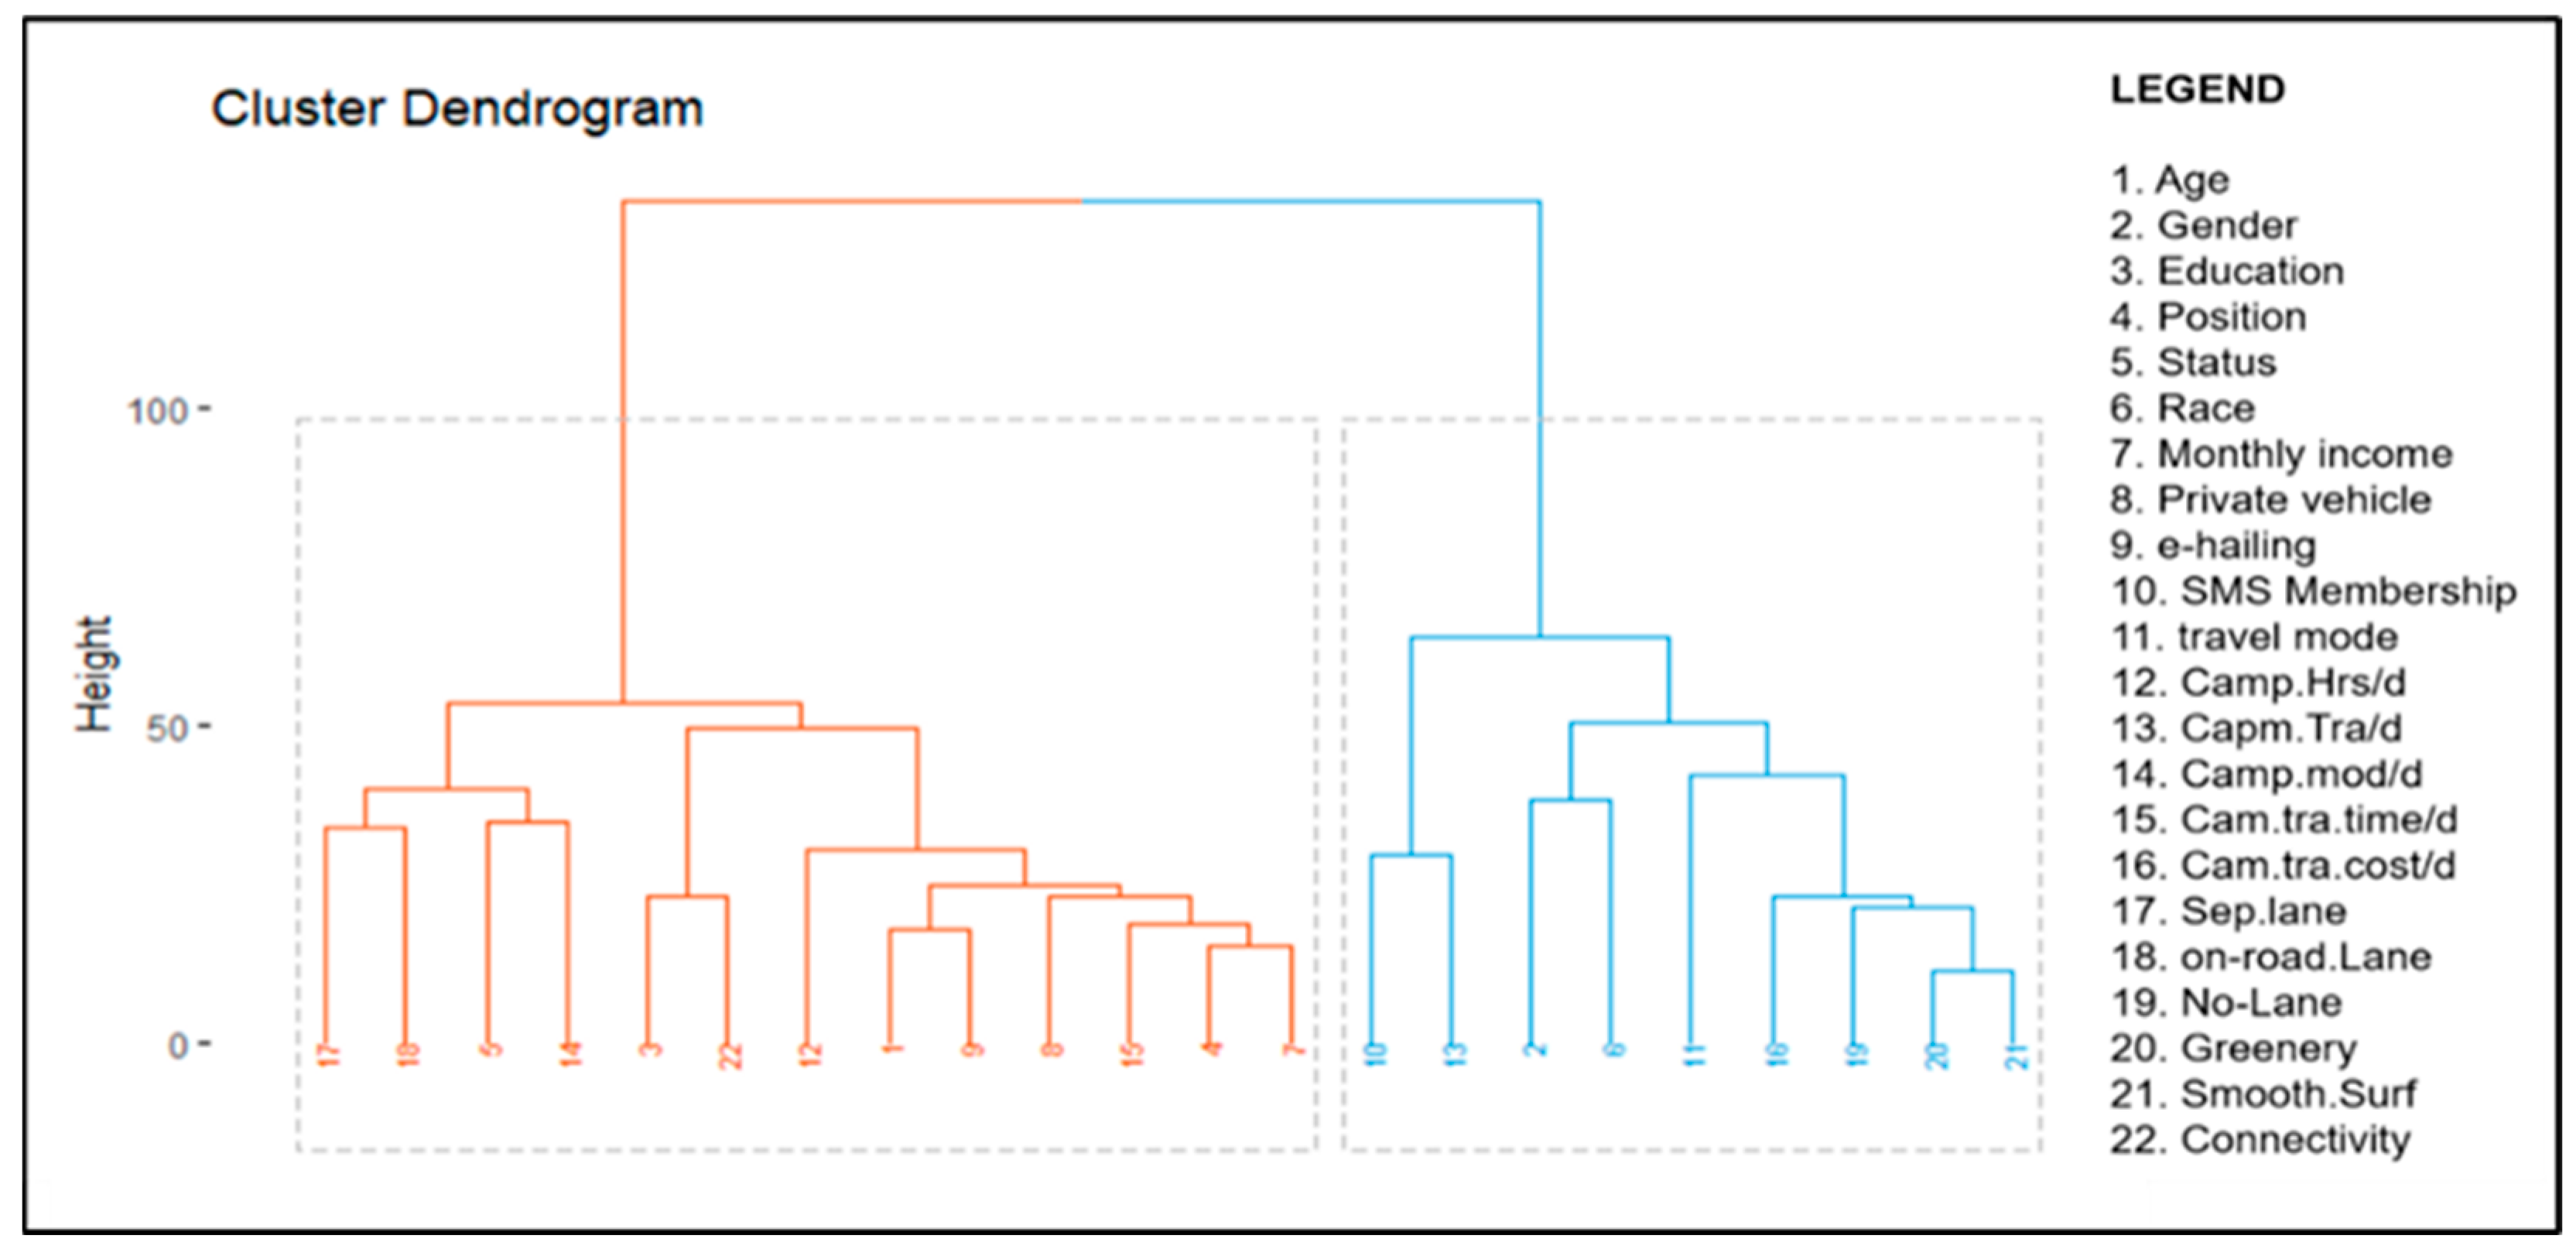
Hierarchical clustering produced a dendrogram, which divided the 22 variables into 2 different clusters—13 variables in cluster one and 9 variables in cluster two. The variables in each cluster are shown in
Figure 9.
The correlation between the variables was assessed using the dissimilarity matrix. The y-axis in the dendrogram in
Figure 9 can be explained using the terms clade and leaves. The clusters were formed at a particular cluster cutoff value based on the number of clusters specified. As the analysis on determining optimal number of clusters regarding the dataset used in this study produced the result k = 2, the number of clusters was set as two. The specified number of clusters returned vectors containing features in each cluster. The lines showing the variables (number 1–22) are the leaves, whereas clusters 1 and 2 are clades 1 and 2 respectively. Leaves 17, 18, 5 and 14 are more similar to each other than they are to other leaves in clade 1. Leaves 3 and 22 are more similar to each other than they are to other leaves in clade 1. Leaves 12, 1, 9, 8, 15, 4 and 7 are more similar to each other than they are to other leaves in clade 1. The x-axis in the dendrogram represents the clusters. The y-axis in the dendrogram represents the closeness of the leaves/variables. For example, leaves 4 and 7 were correlated before they joined 15, 8, and the following leaves together in one clade.
The distance between two clusters was measured using the linkage method. The complete linkage method used in this study displayed the distance between clusters 1 and 2 using the longest distance between two points in each cluster. The point refers to the line height in the dendrogram (
Figure 9). The similarity between the features were assessed using the dissimilarity matrix index, whereas the important variables were determined using the line height. The heights of the lines in each leaf represent the importance score of the variables. In cluster 1, the most important features were Sep.lane, On-road.Lane, Status and Camp.mod/d with similar line heights. In cluster 2, the most important features were Gender, Race and Travel mode. To further assess the correlation between the independent variables, correlation analysis was performed.
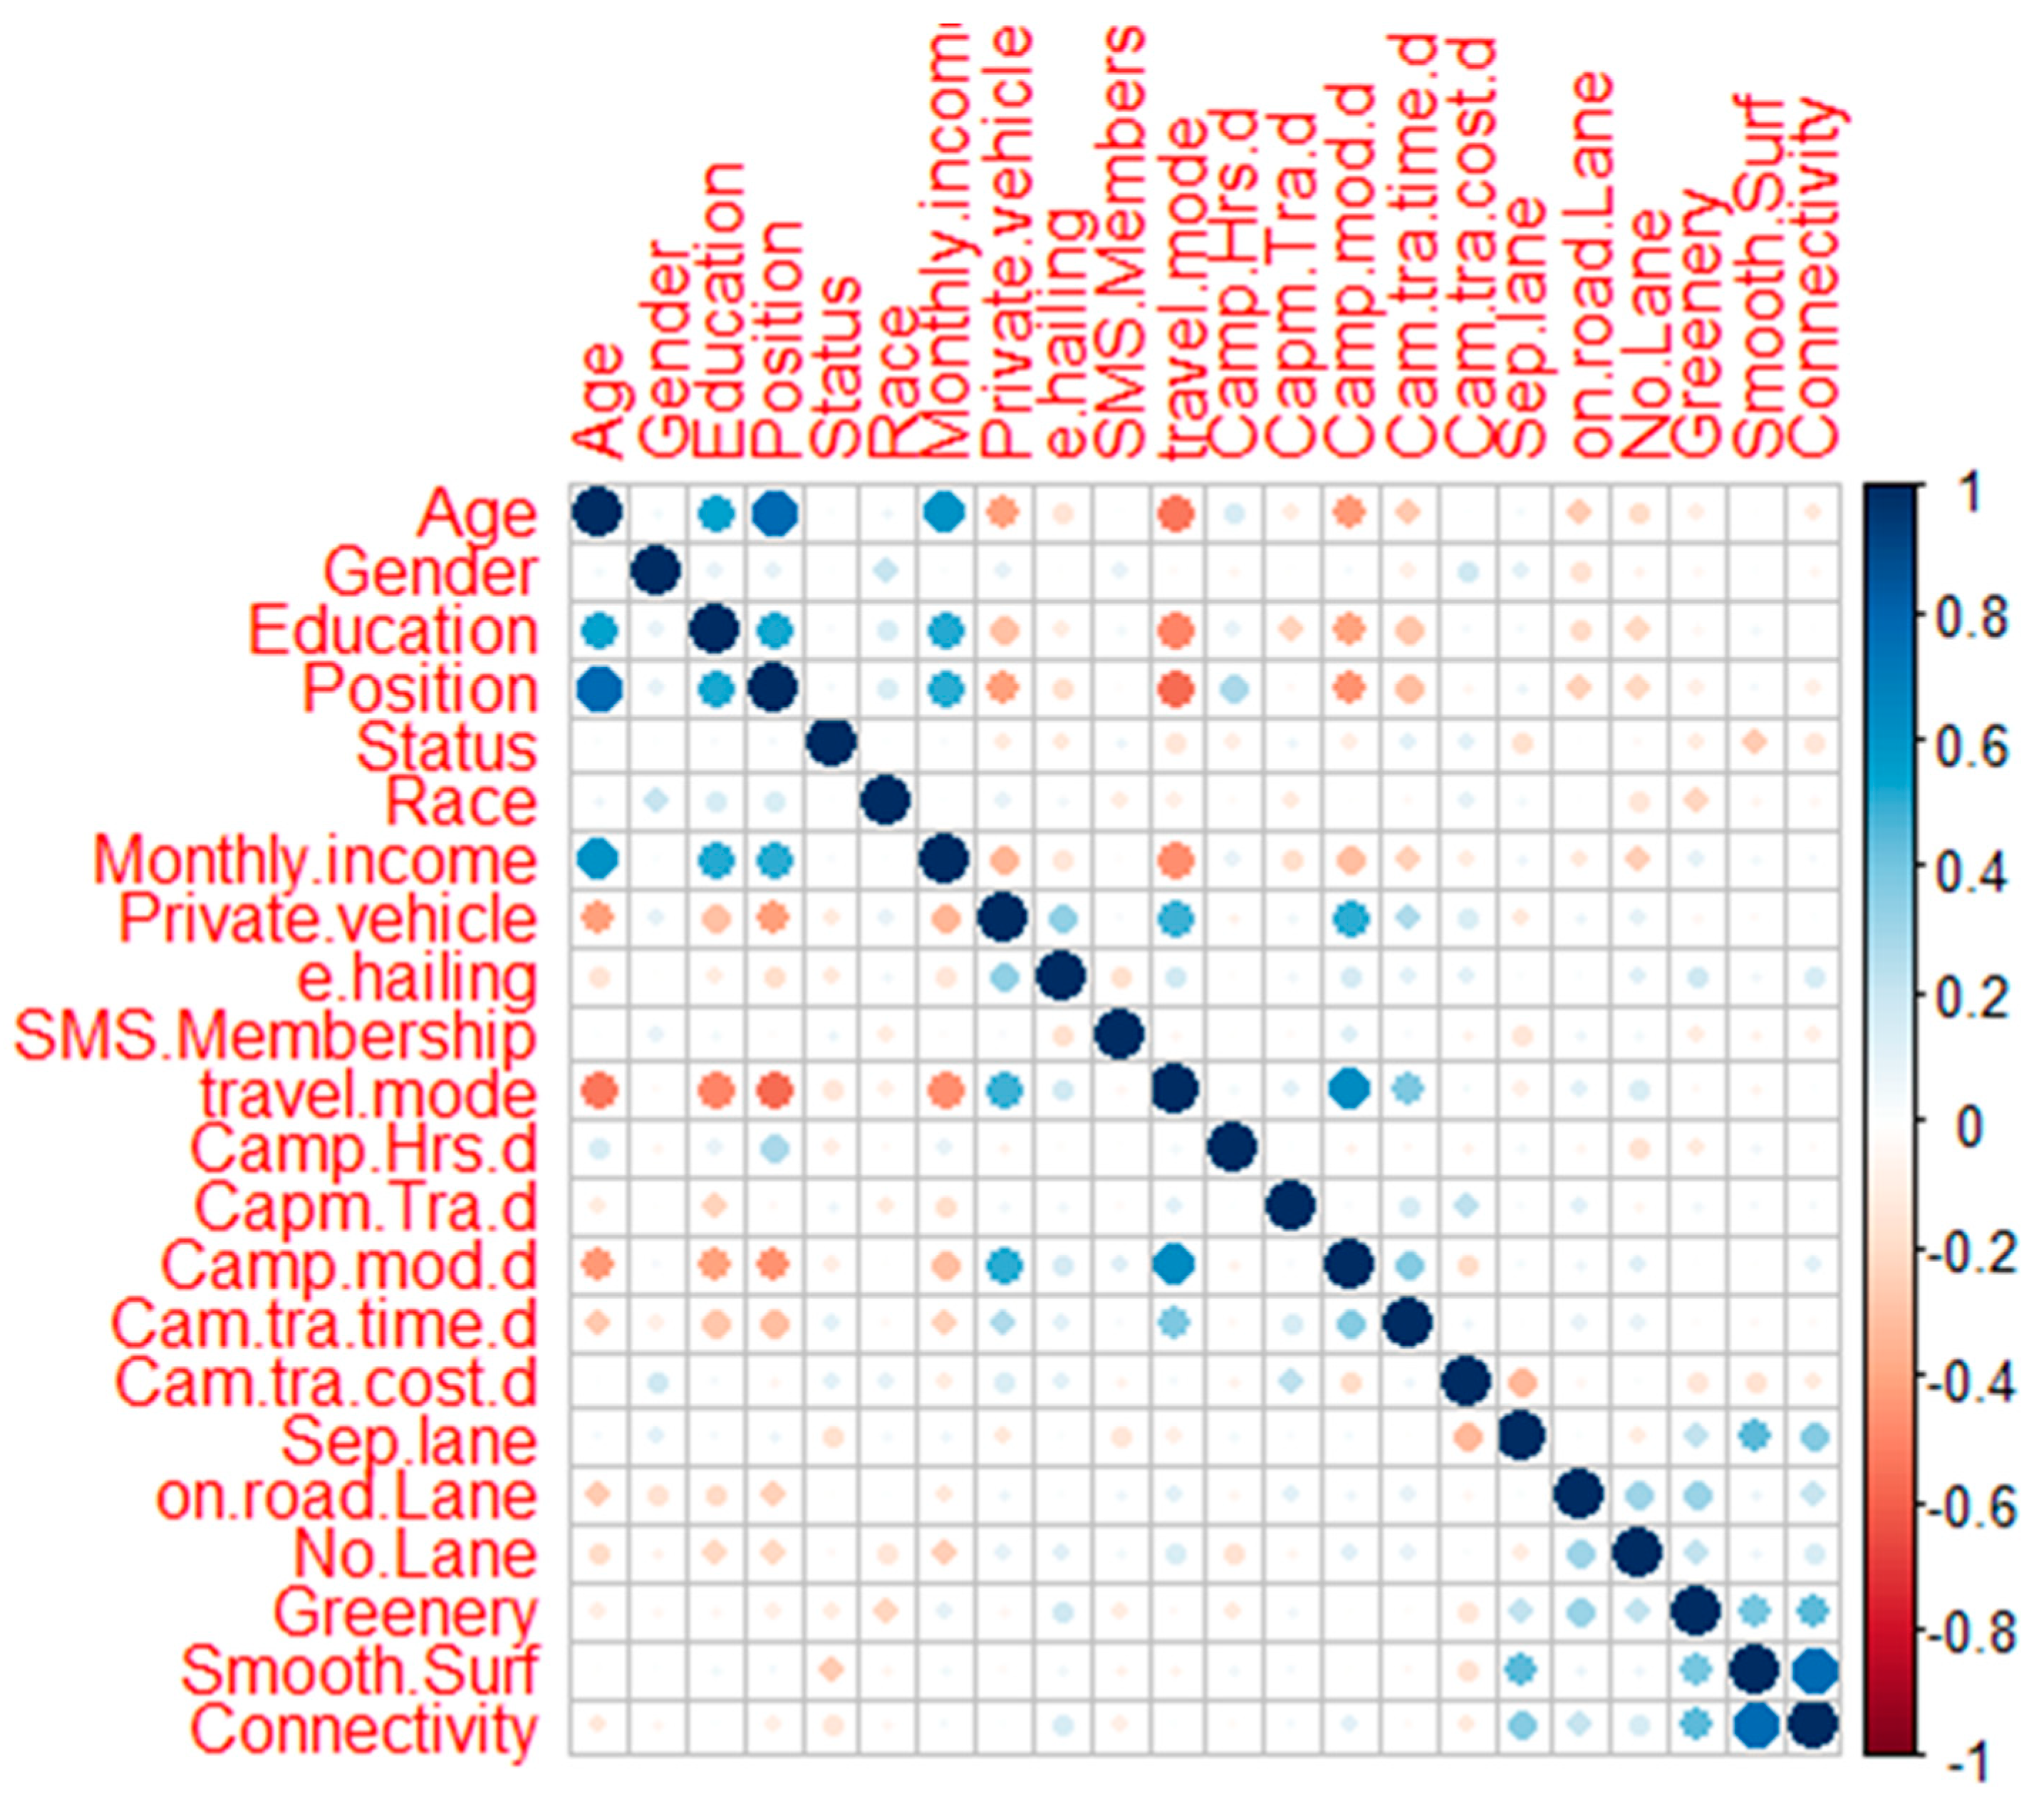
Figure 10 shows the correlation between the 22 independent variables.
The blue color represents positive correlation and the red color displays negative correlation. Based on the correlation analysis, two combinations are highly positively correlated, which are Position and Age and Connectivity and Smooth Surf. Moderately positively correlated combinations are Monthly Income and Age, and Camp.mod.d and travel.mode. Next, the lowly positively correlated combinations are Education and Age, Position and Education, Position and Monthly income, Monthly Income and Education, Private Vehicle and travel.mode, and Private Vehicle and Camp.mod.d.
4.4. Selection of Significant Variables Using Supervised Learning Models
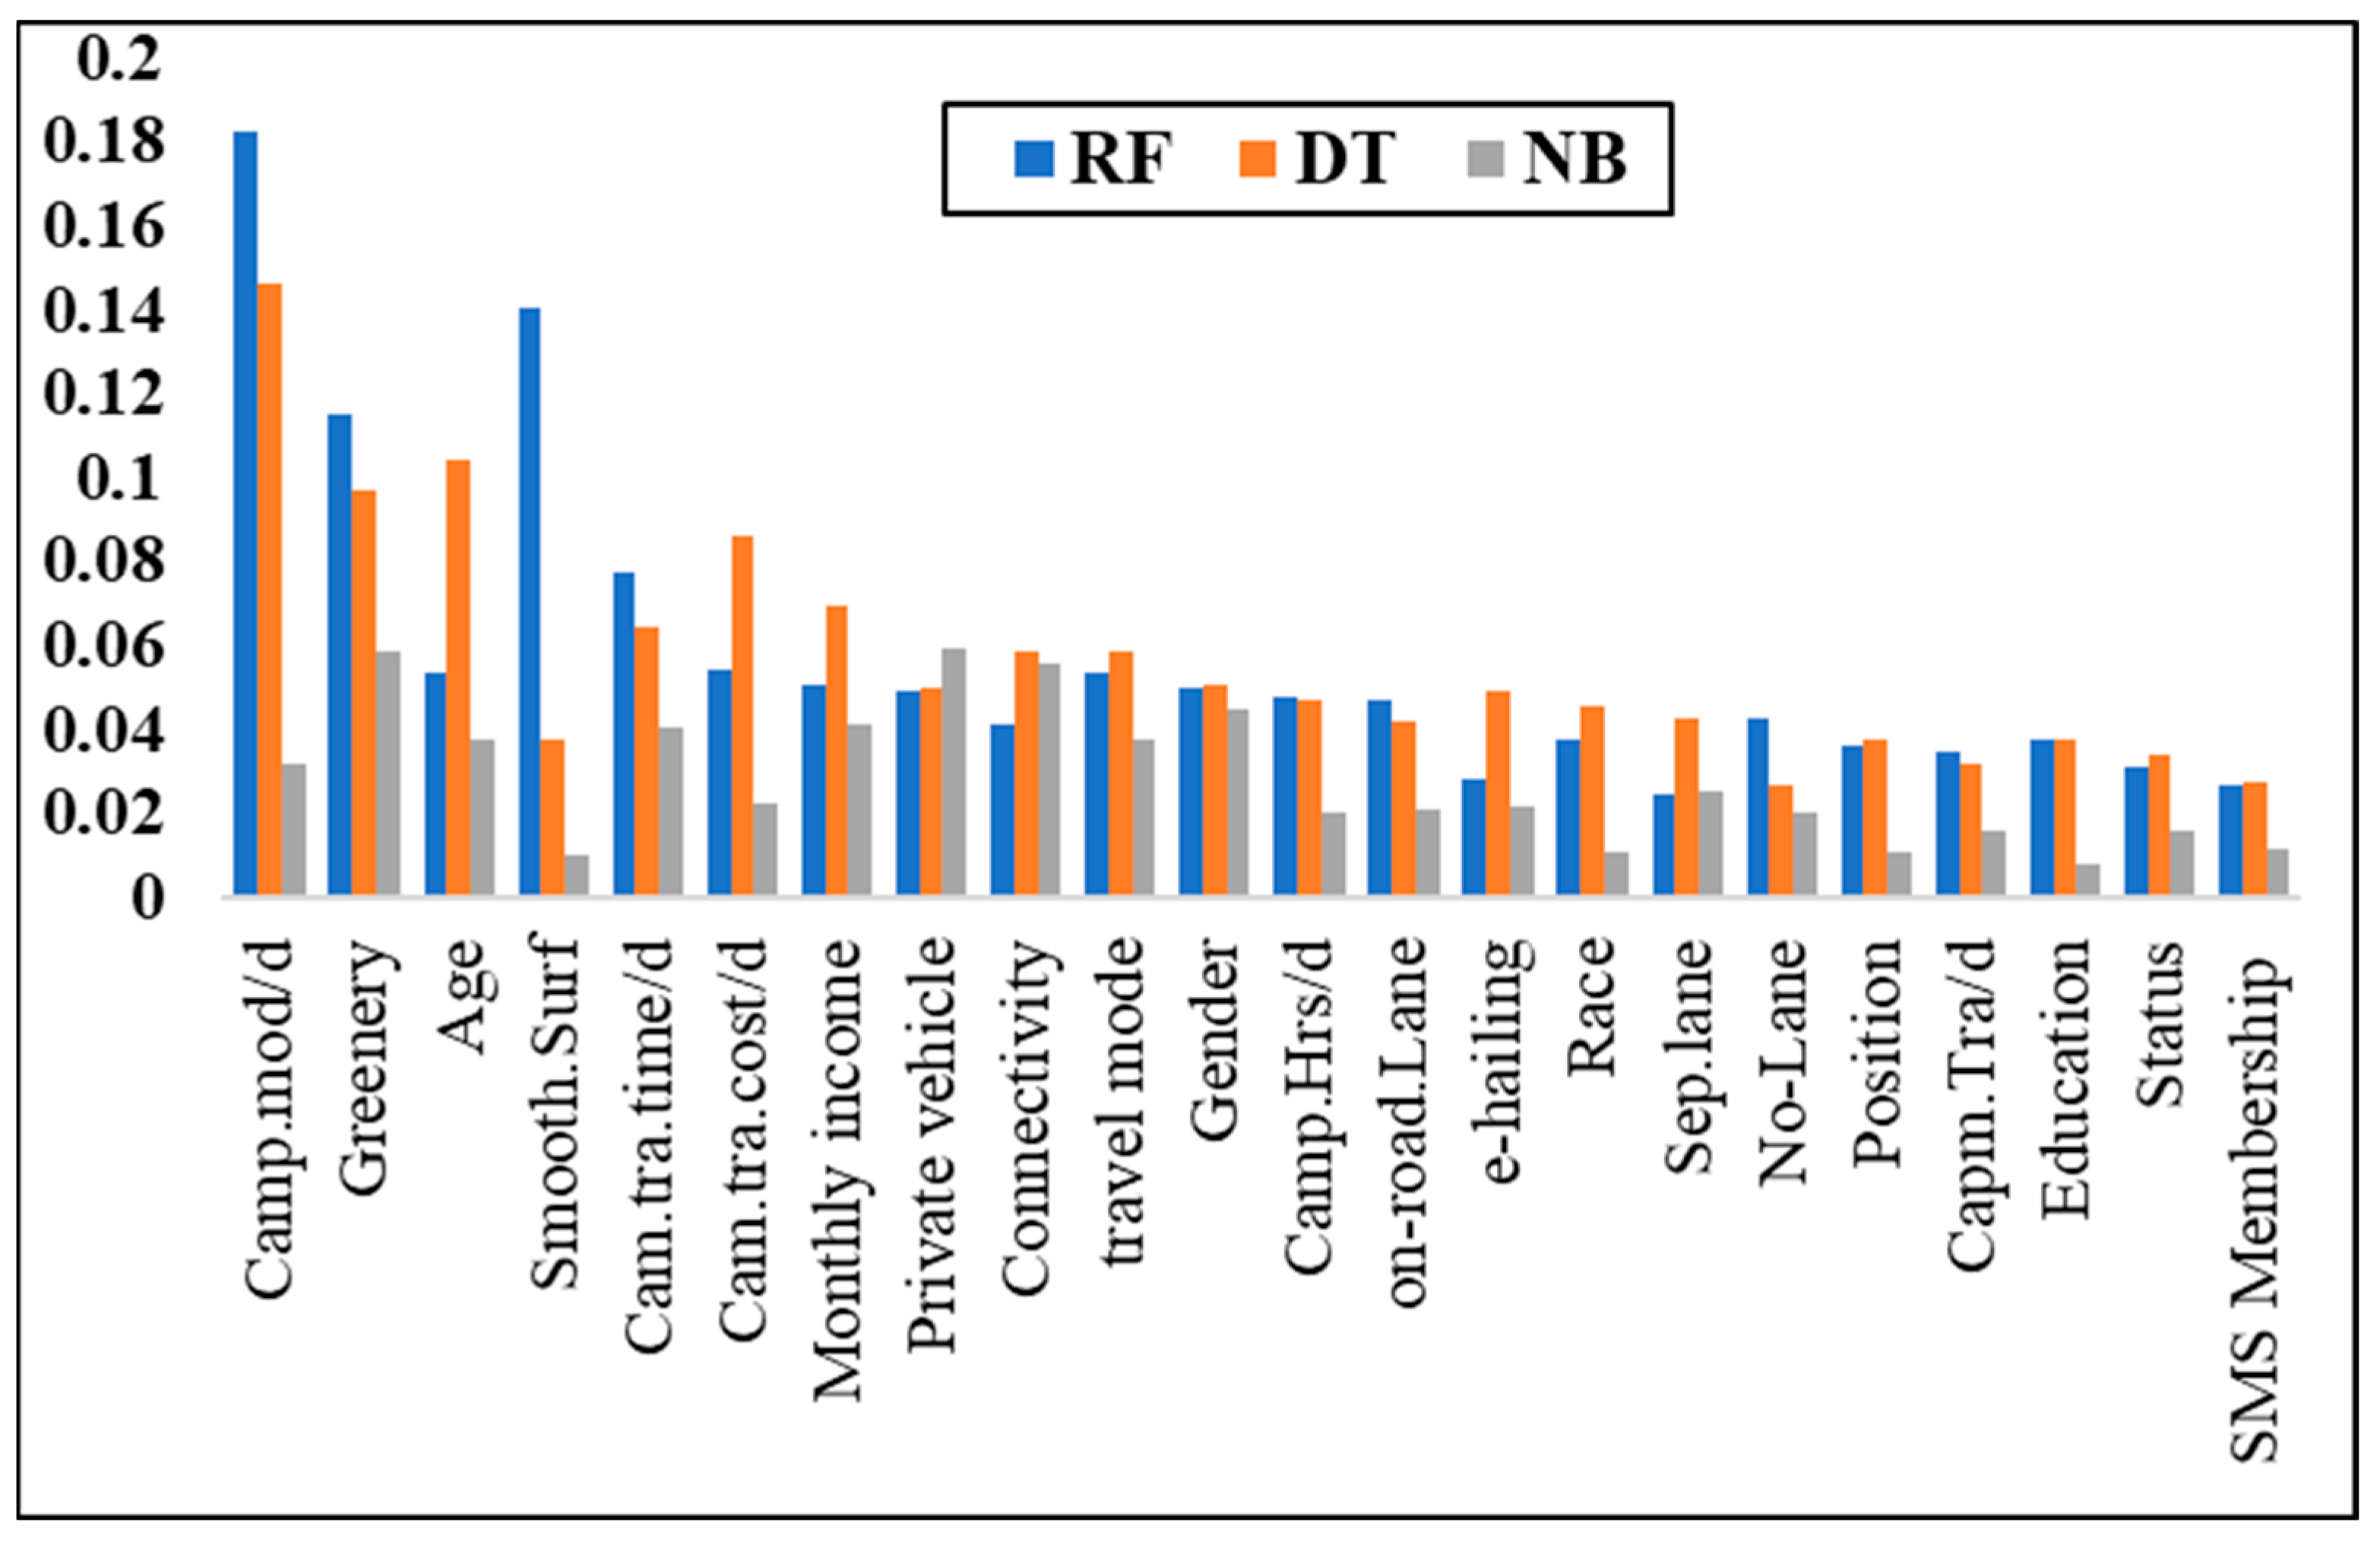
The variables’ importance rank of the 22 independent variables based on RF, DT and NB techniques are shown and compared in
Figure 11. The present study takes advantage of various feature selection methods to pick only the important variables and design the prediction model according to selected variables. The core motive behind decreasing the number of variables (based on their level of importance and correlations) is to diminish the complexity and promote the applicability of our final model. Therefore, after implementing unsupervised clustering and identifying the correlation of the variables, we also compared the variables’ importance based on three different tree-based supervised machine learning techniques.
Table 3 presents the variable weights using outputs of RF, DT and NB. The mutually important variables were detected. For example, monthly income, age and private vehicle ownership were variables with high weights in all three methods.
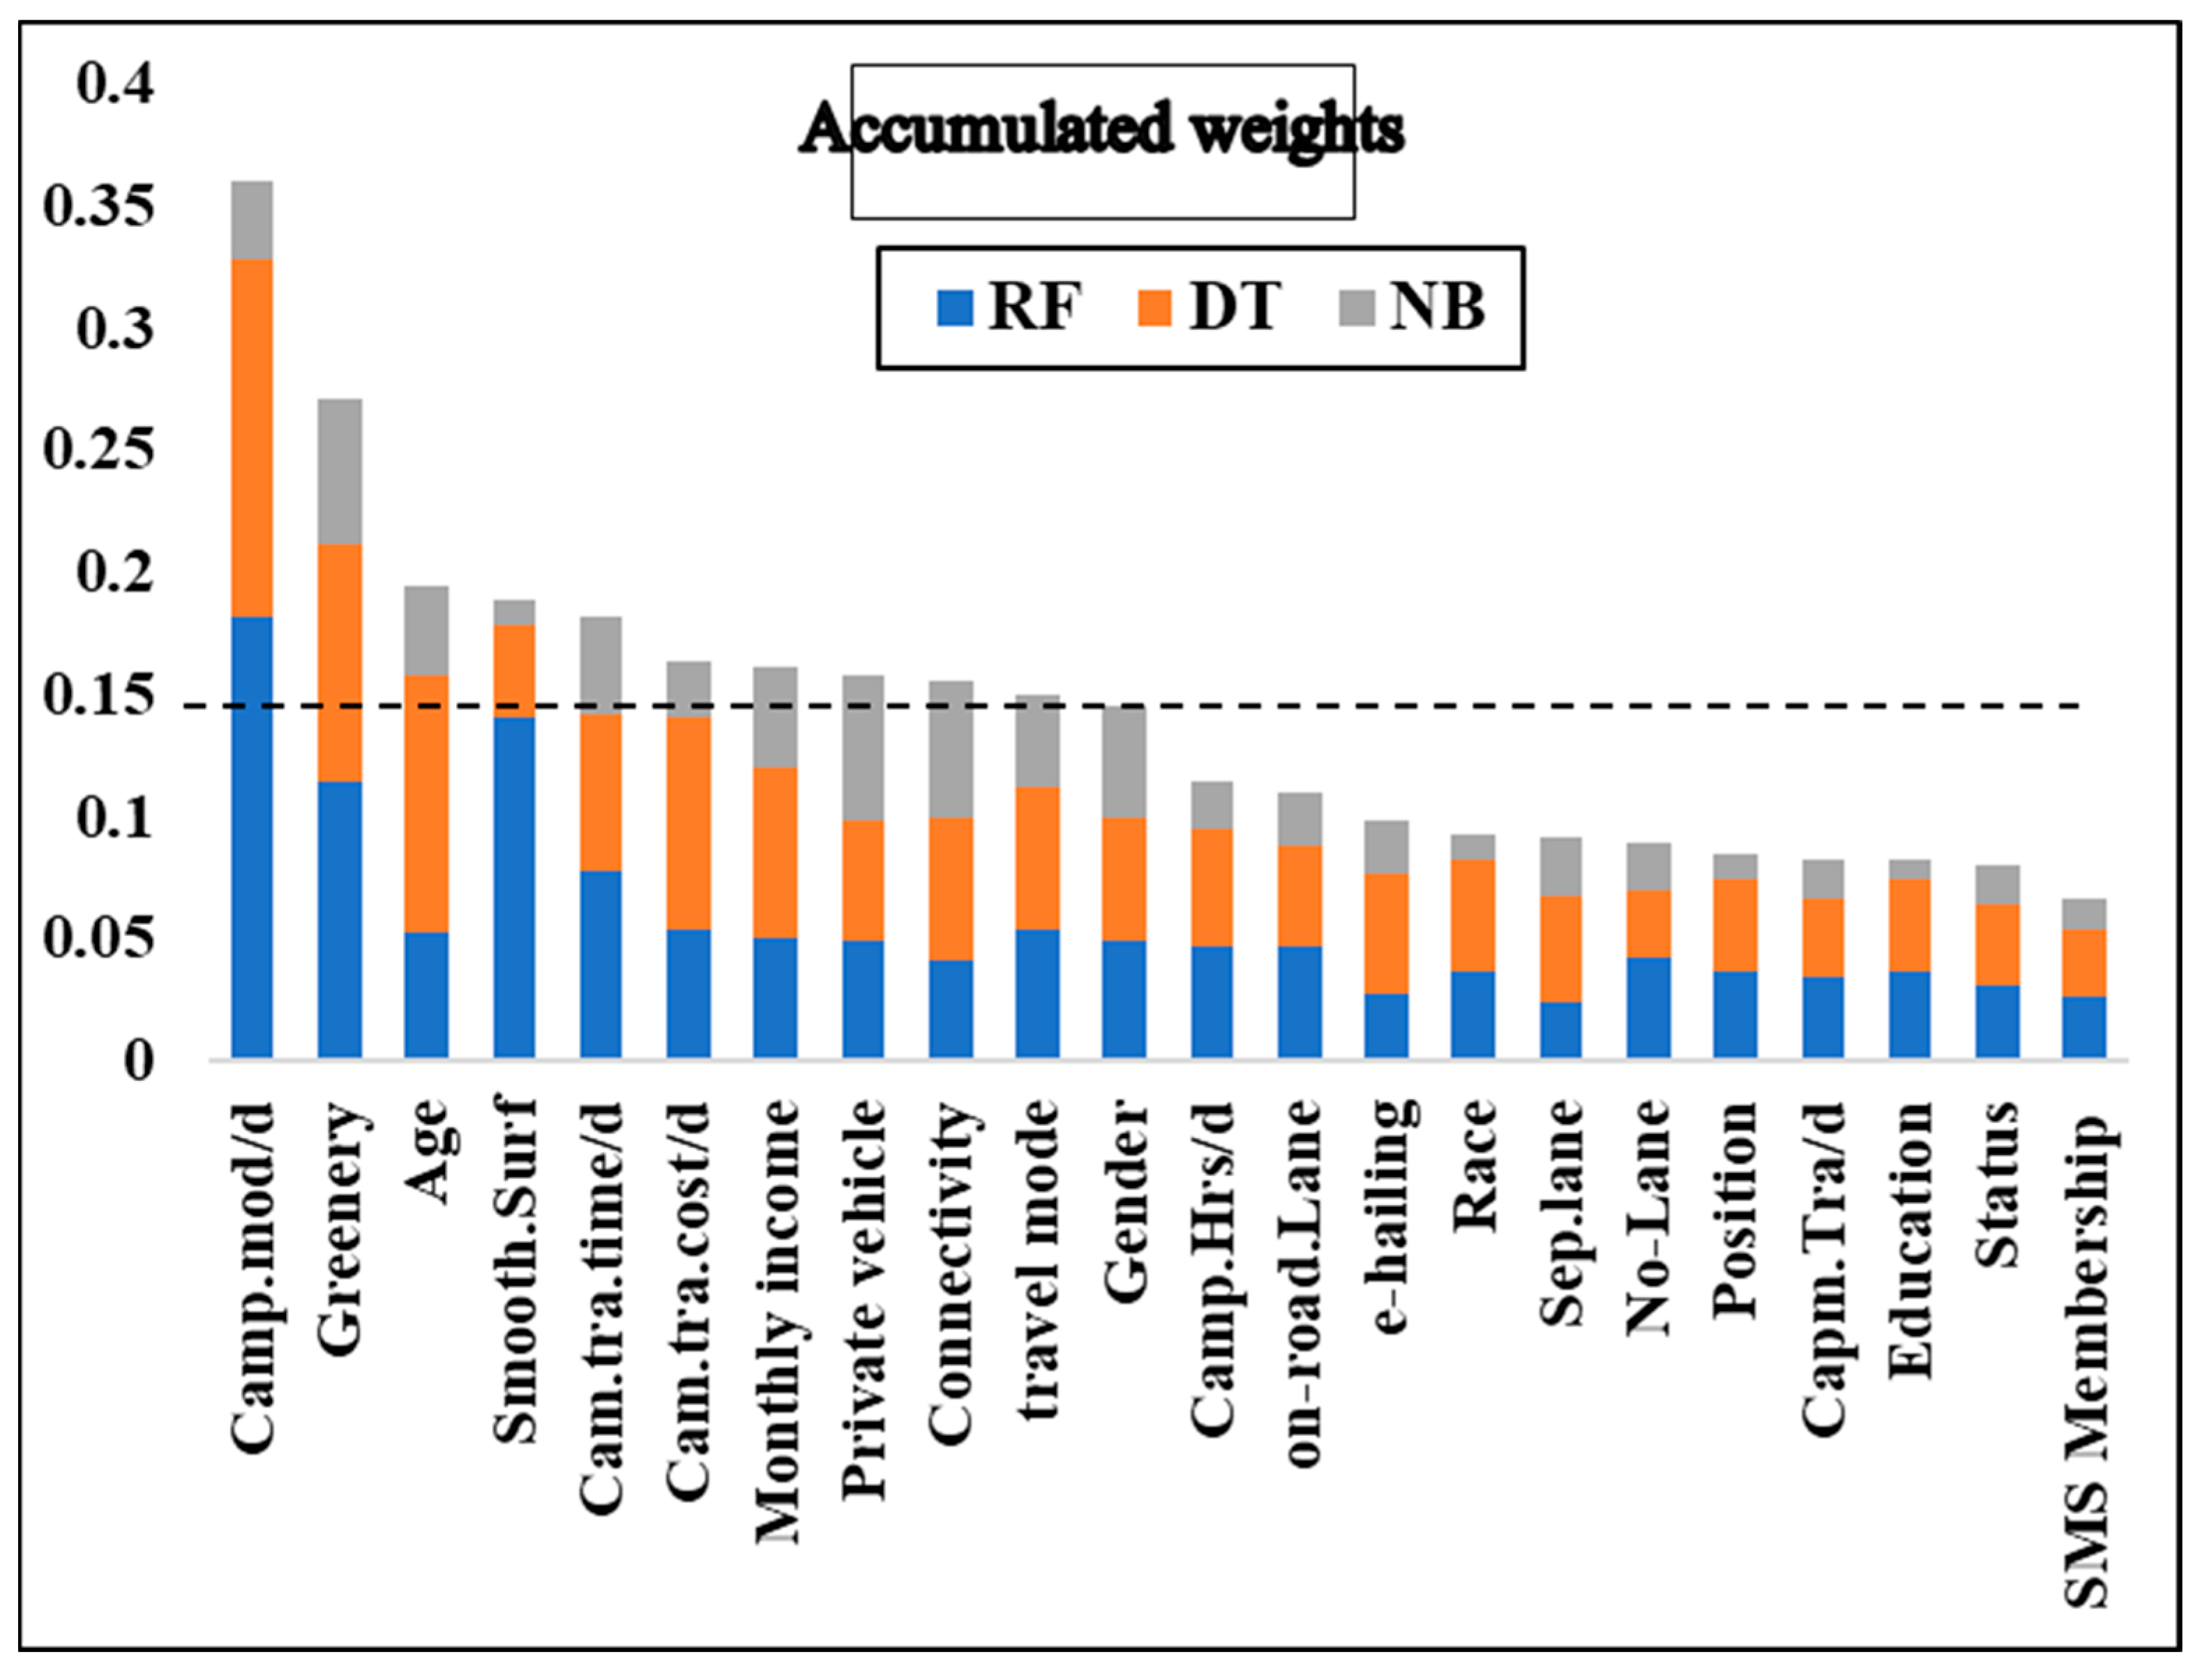
Furthermore, to make a more vivid conclusion from the three feature selection methods, the weight values of each variable were summarized and compared, as shown in
Figure 12. Next, the amassed weight values were ranked from highest to lowest. According to
Figure 12, there was a significant drop in weight values after the “Gender” variable. Therefore, we drew a line and deselected variables whose weights were below the line. The results of the selected most important variables based on three different ML techniques is summarized in
Table 4.
Further random forest modelling was performed using these 11 variables. Moreover, all these variables have a threshold of MeanDecreaseGini higher than 30.
4.5. Model Assessment and Evaluation
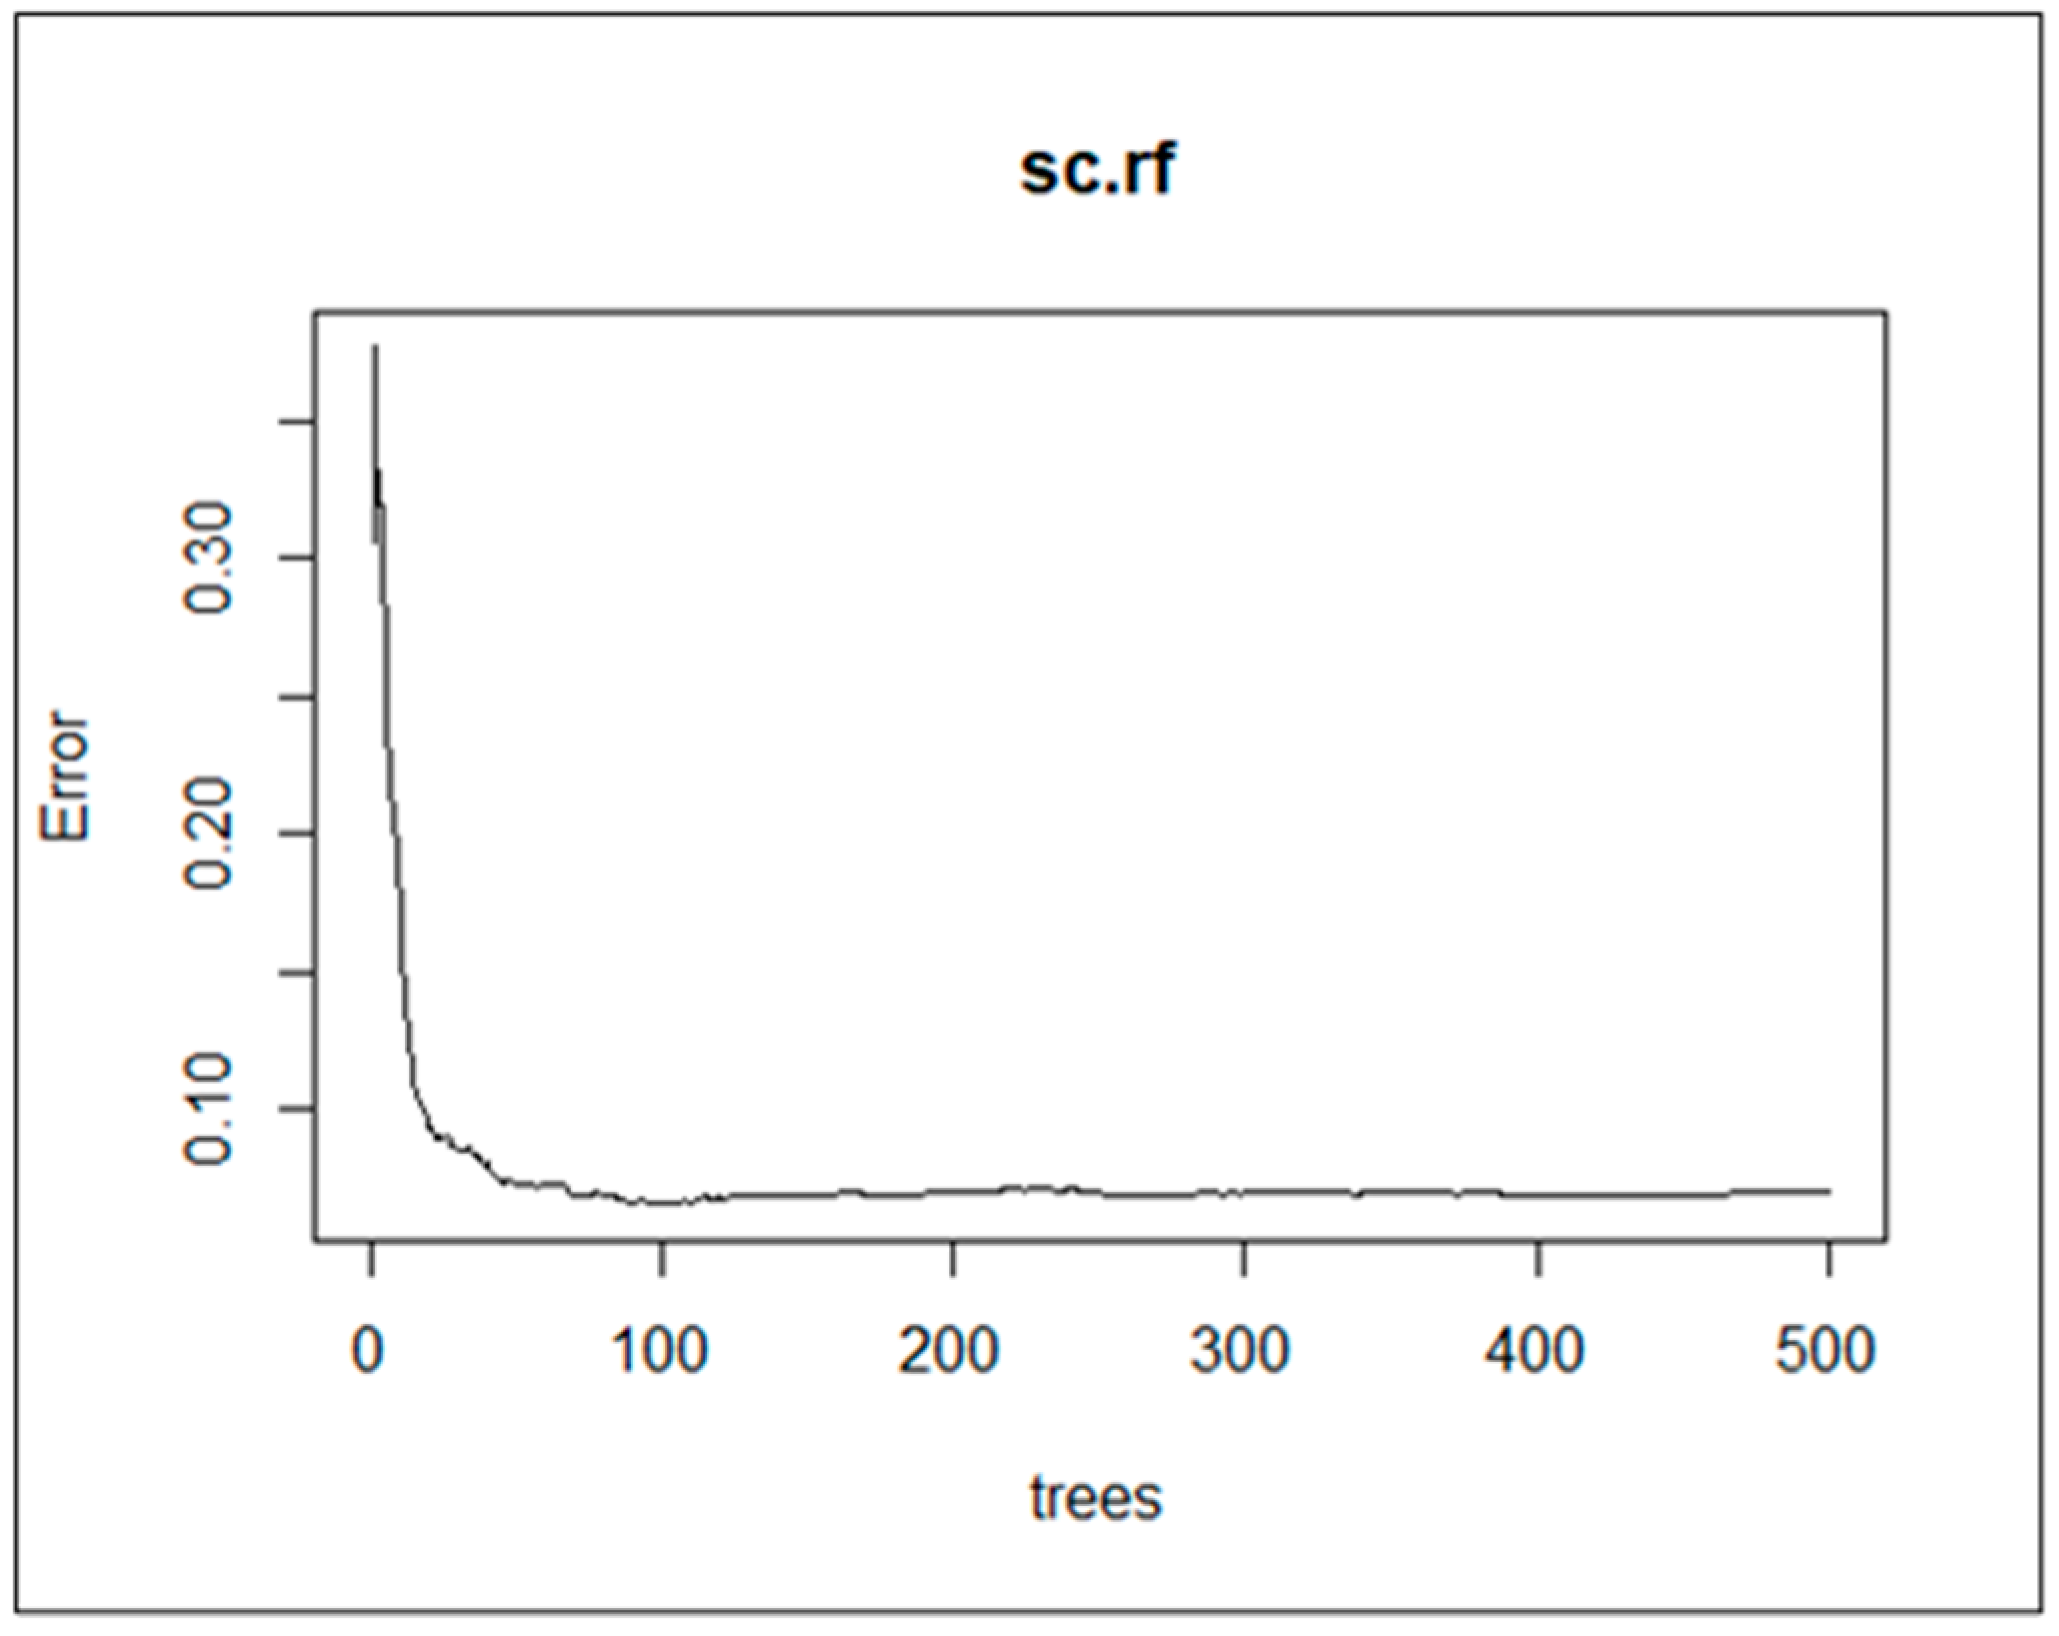
Having reduced the number of variables by a comprehensive feature selection method (through both unsupervised clustering and supervised models), the random forest algorithms were conducted using eleven selected variables. The model performance of random forest is reported as below:
The default
ntree used was 500 and mtry was 3. The accuracy was 93.02% and the Mean of squared residuals was 0.07049505. The error vs number of tree graphs in
Figure 13 shows that the error rate remained constant from 390 to 470. Model assessment was repeated nine times using a different number of trees from 390 to 470, and the results are presented in
Table 5.
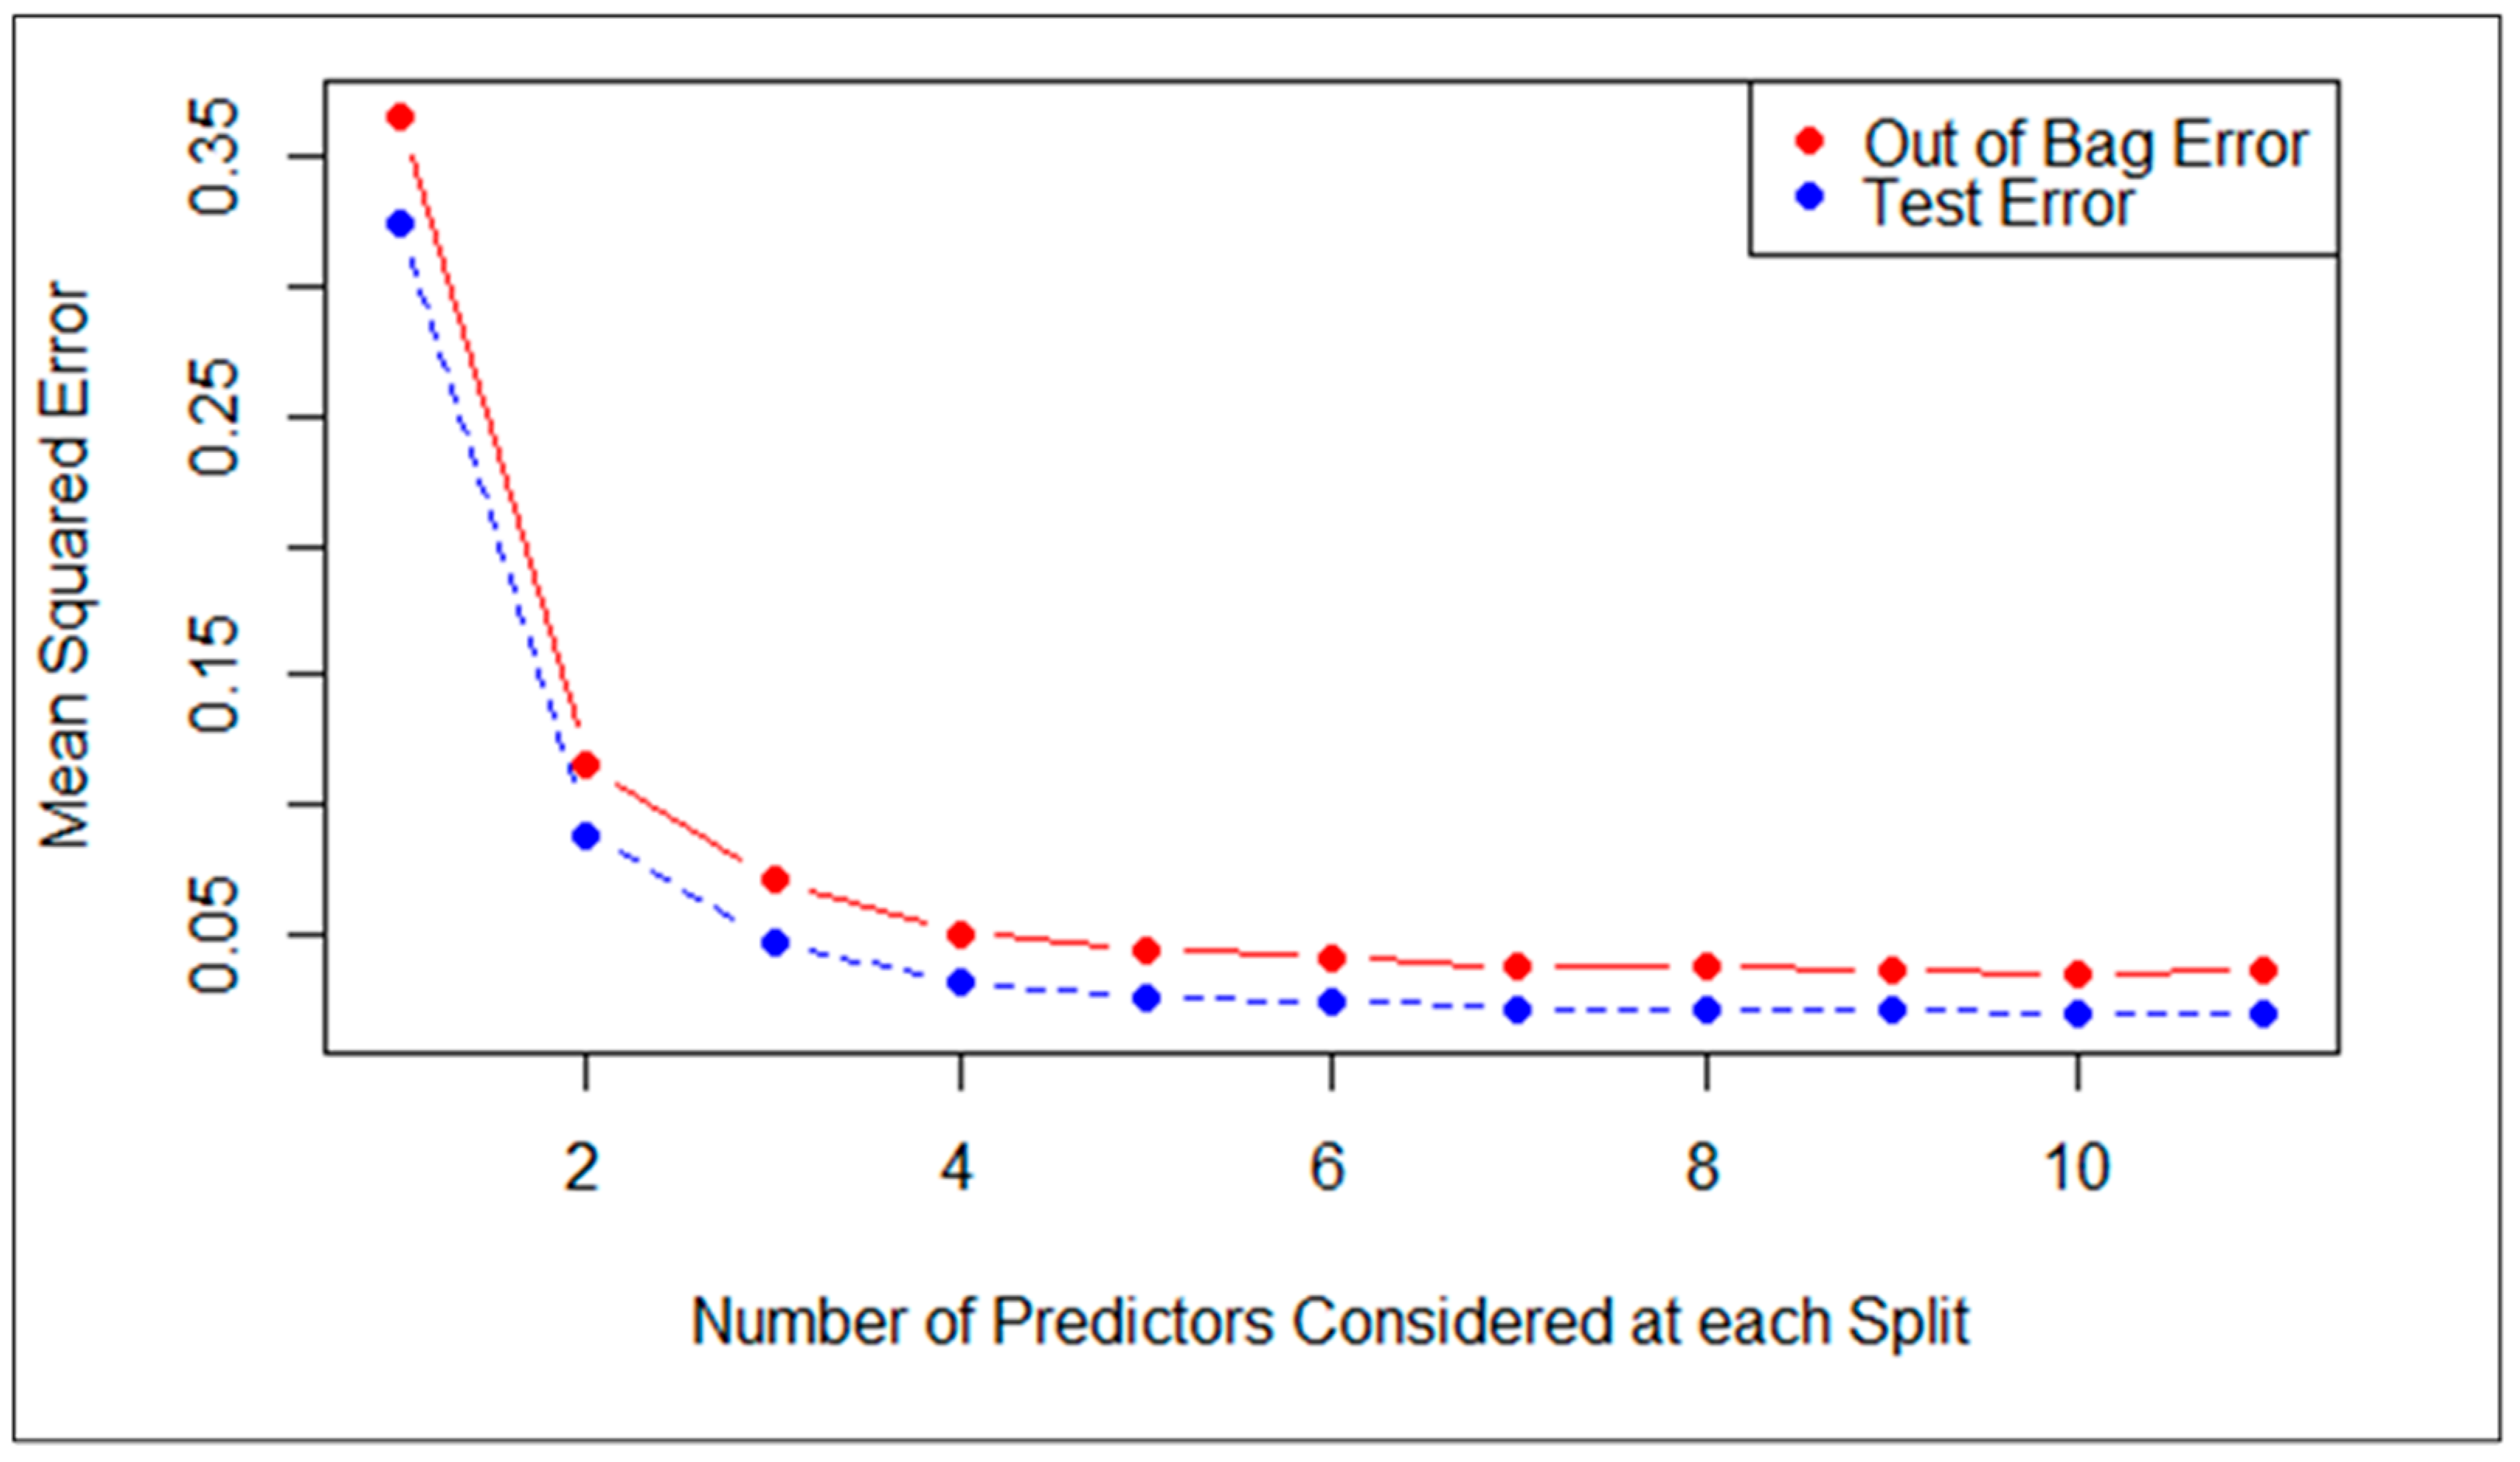
The best
ntree was 440 as shown in
Table 6, since it produced the highest accuracy compared to other values. The ntree = 440 was used to assess the test error and OOB error, as shown in
Figure 14.
The red line represents the out-of-bag error estimates, and the blue line represents the error calculated on test set. Both curves are relatively smooth, and the error estimates are also correlated. The error inclines are reduced at around mtry = 3. Hence, the final model with the 11 most important variables produced an accuracy of 93.51%, with ntree = 440 and mtry = 3. The model performance comparison among the random forest, decision tree and Naïve Bayes methods are shown in
Table 6 for both models with 22 variables and 11 variables.
4.6. Simulation-Based Optimization Analysis
To obtain deeper insights into the factors influencing SFFES usage, optimization analysis was carried out based on four different scenarios: a group of respondents who are: (1) most likely to “always” use SFFESs, (2) most likely to “frequently” use SFFESs, (3) most likely to “occasionally” use SFFESs, and (4) less likely to, or “never”, use SFFESs. The scenarios were based on the target variables’ response categories, as described in
Table 1. The simulation-based optimization analysis was conducted on 11 significant variables (as described in the feature selection section) using RapidMiner Studio Educational Software version 9.8.001. All the figures in this section are outputs of the RapidMiner Software. The optimization was carried out and determined the best input factors to fit with our targets under the specified constraints. Additionally, the simulation-based sensitivity analysis was considered appropriate for evaluating and responding “What if” questions. For example, what if our target group is male youngsters who are between 18 to 23 years old and who use public transportation as their mode of transport on the campus (how frequently they will use SFFESs)?
Table 7 presents the optimized value of attributes based on four scenarios.
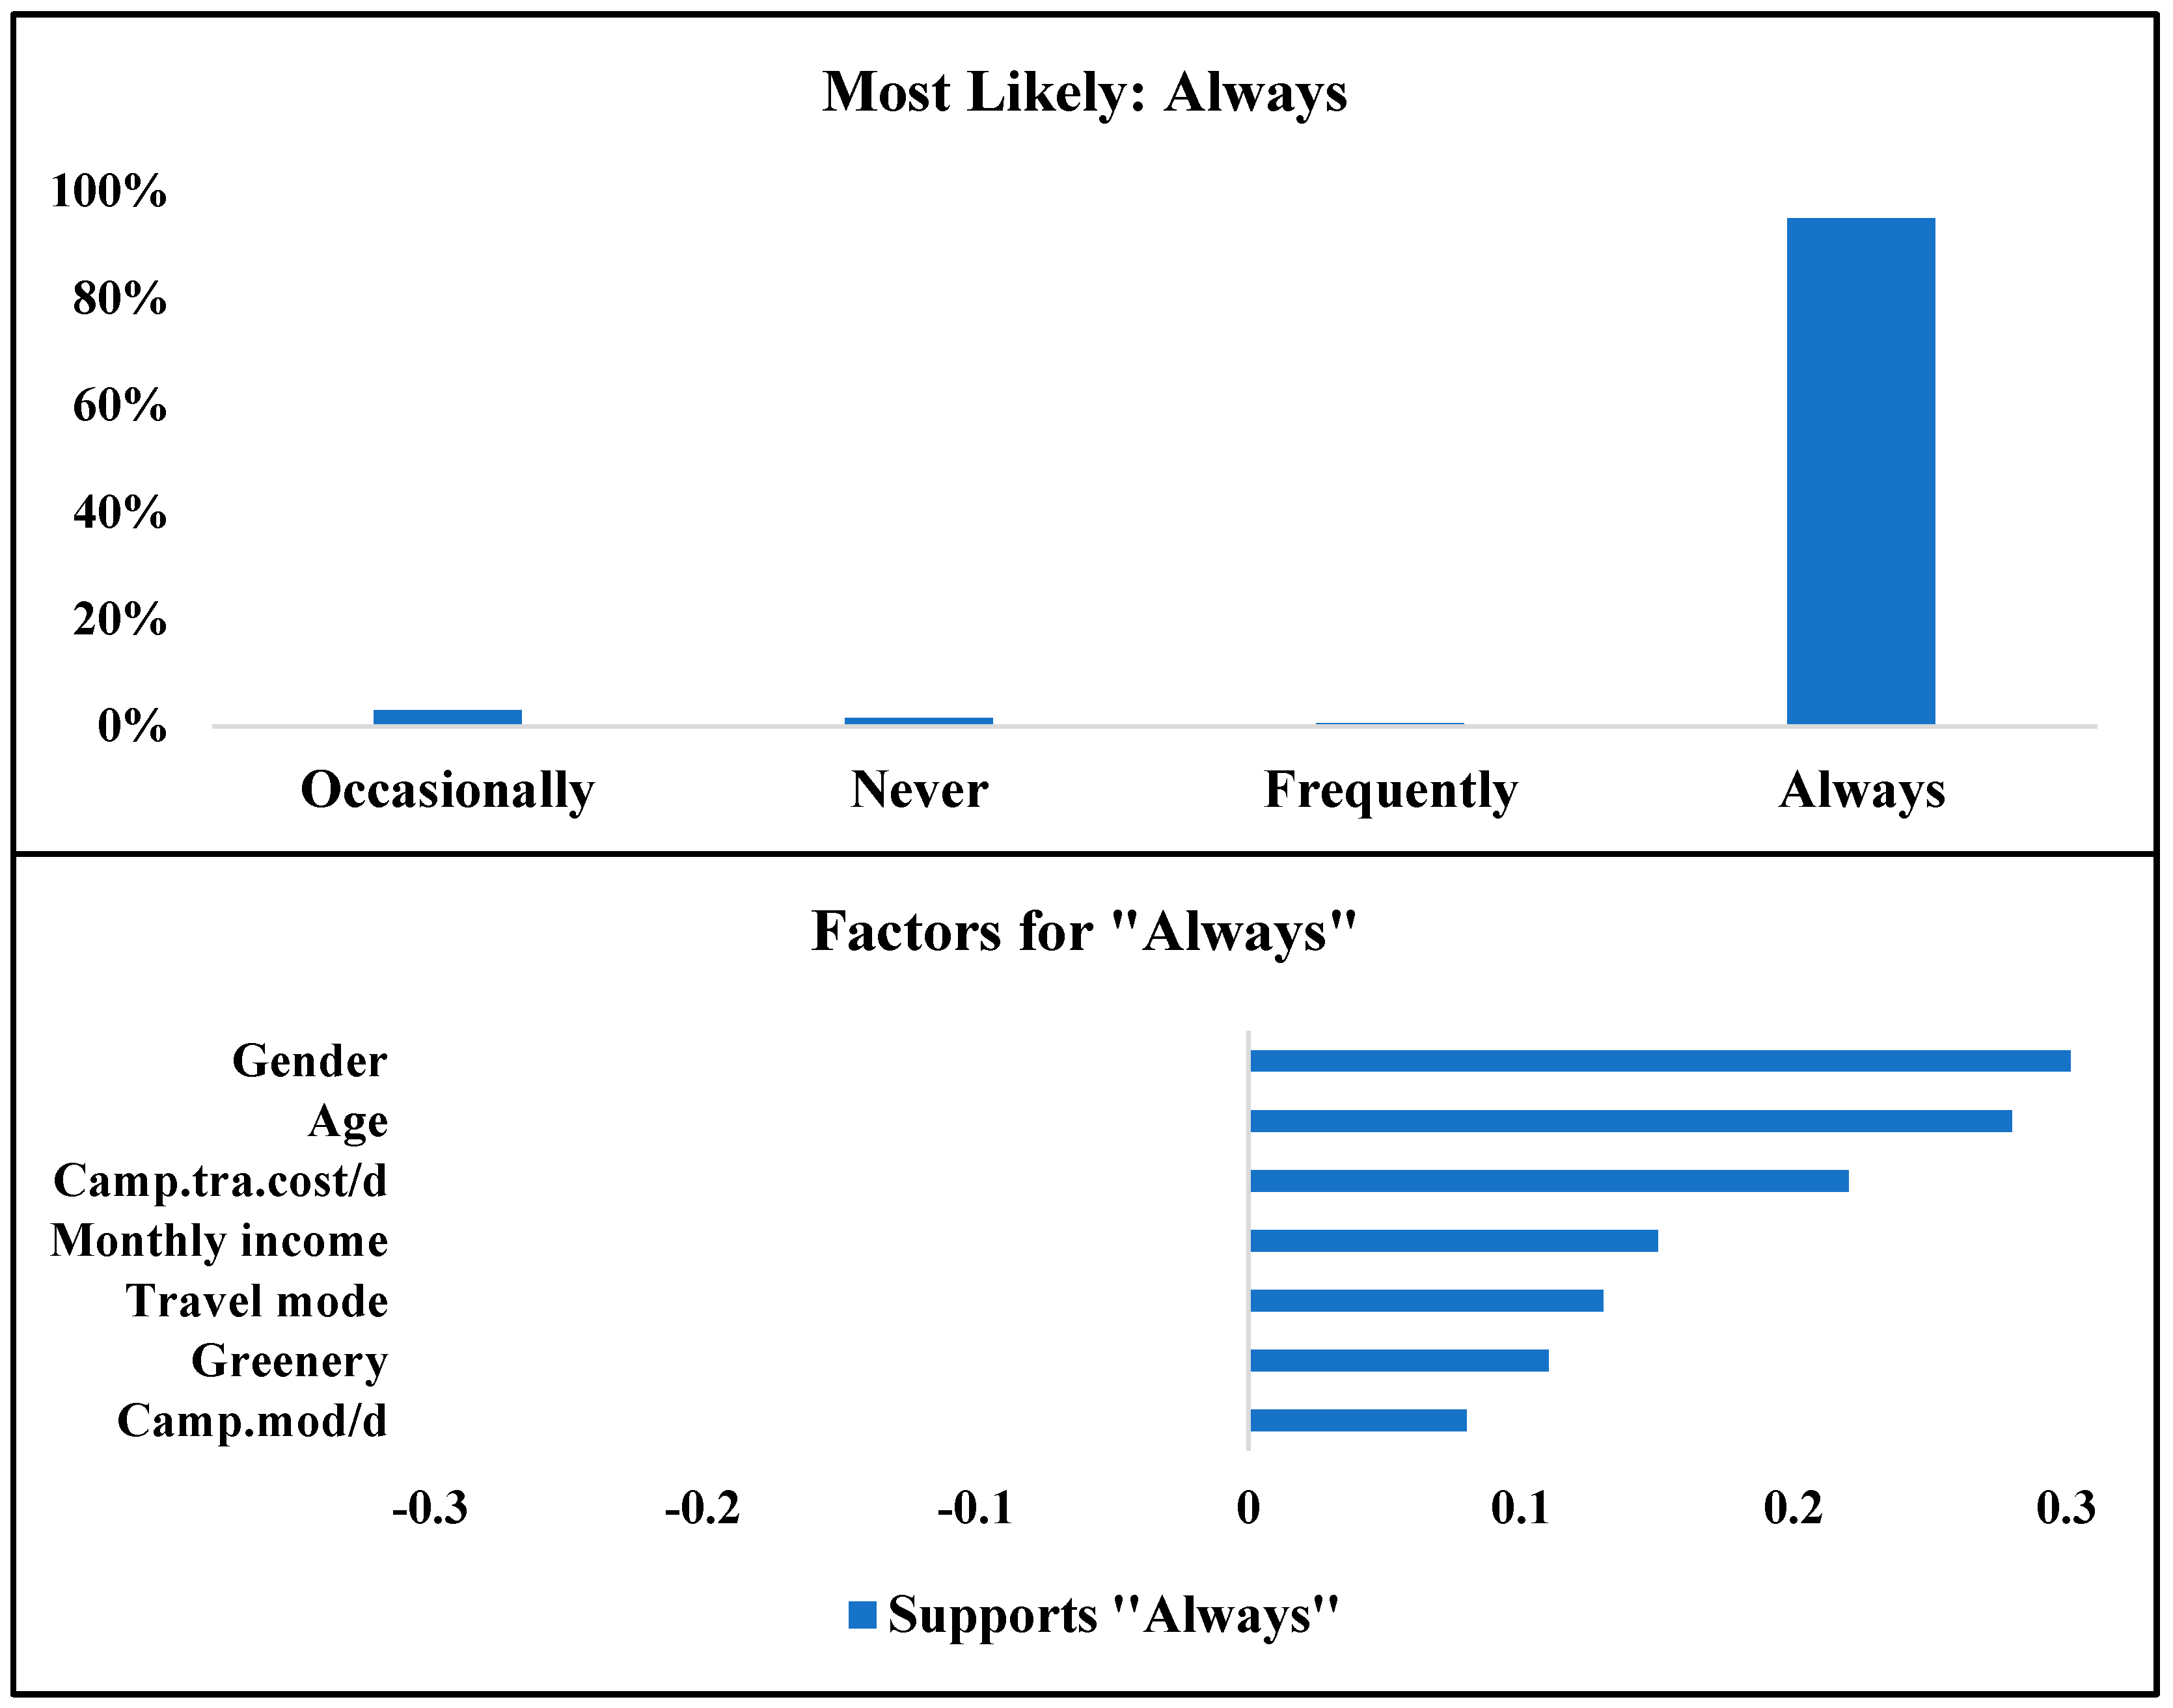
In the first scenario, the simulation model was adjusted to optimize the target variables on respondents who are most likely to always use SFFESs. According to the results, females between 18 and 29 years old with a monthly income between RM 4000 and RM 6000 (which is a higher-than-average income in Malaysia), whose primary mode of transport is walking or cycling, are the most likely to change their mode of transport to SFFESs. This group of respondents does not own a private vehicle and they spend RM 5 to RM 15 for their travels around the campus per day.
According to
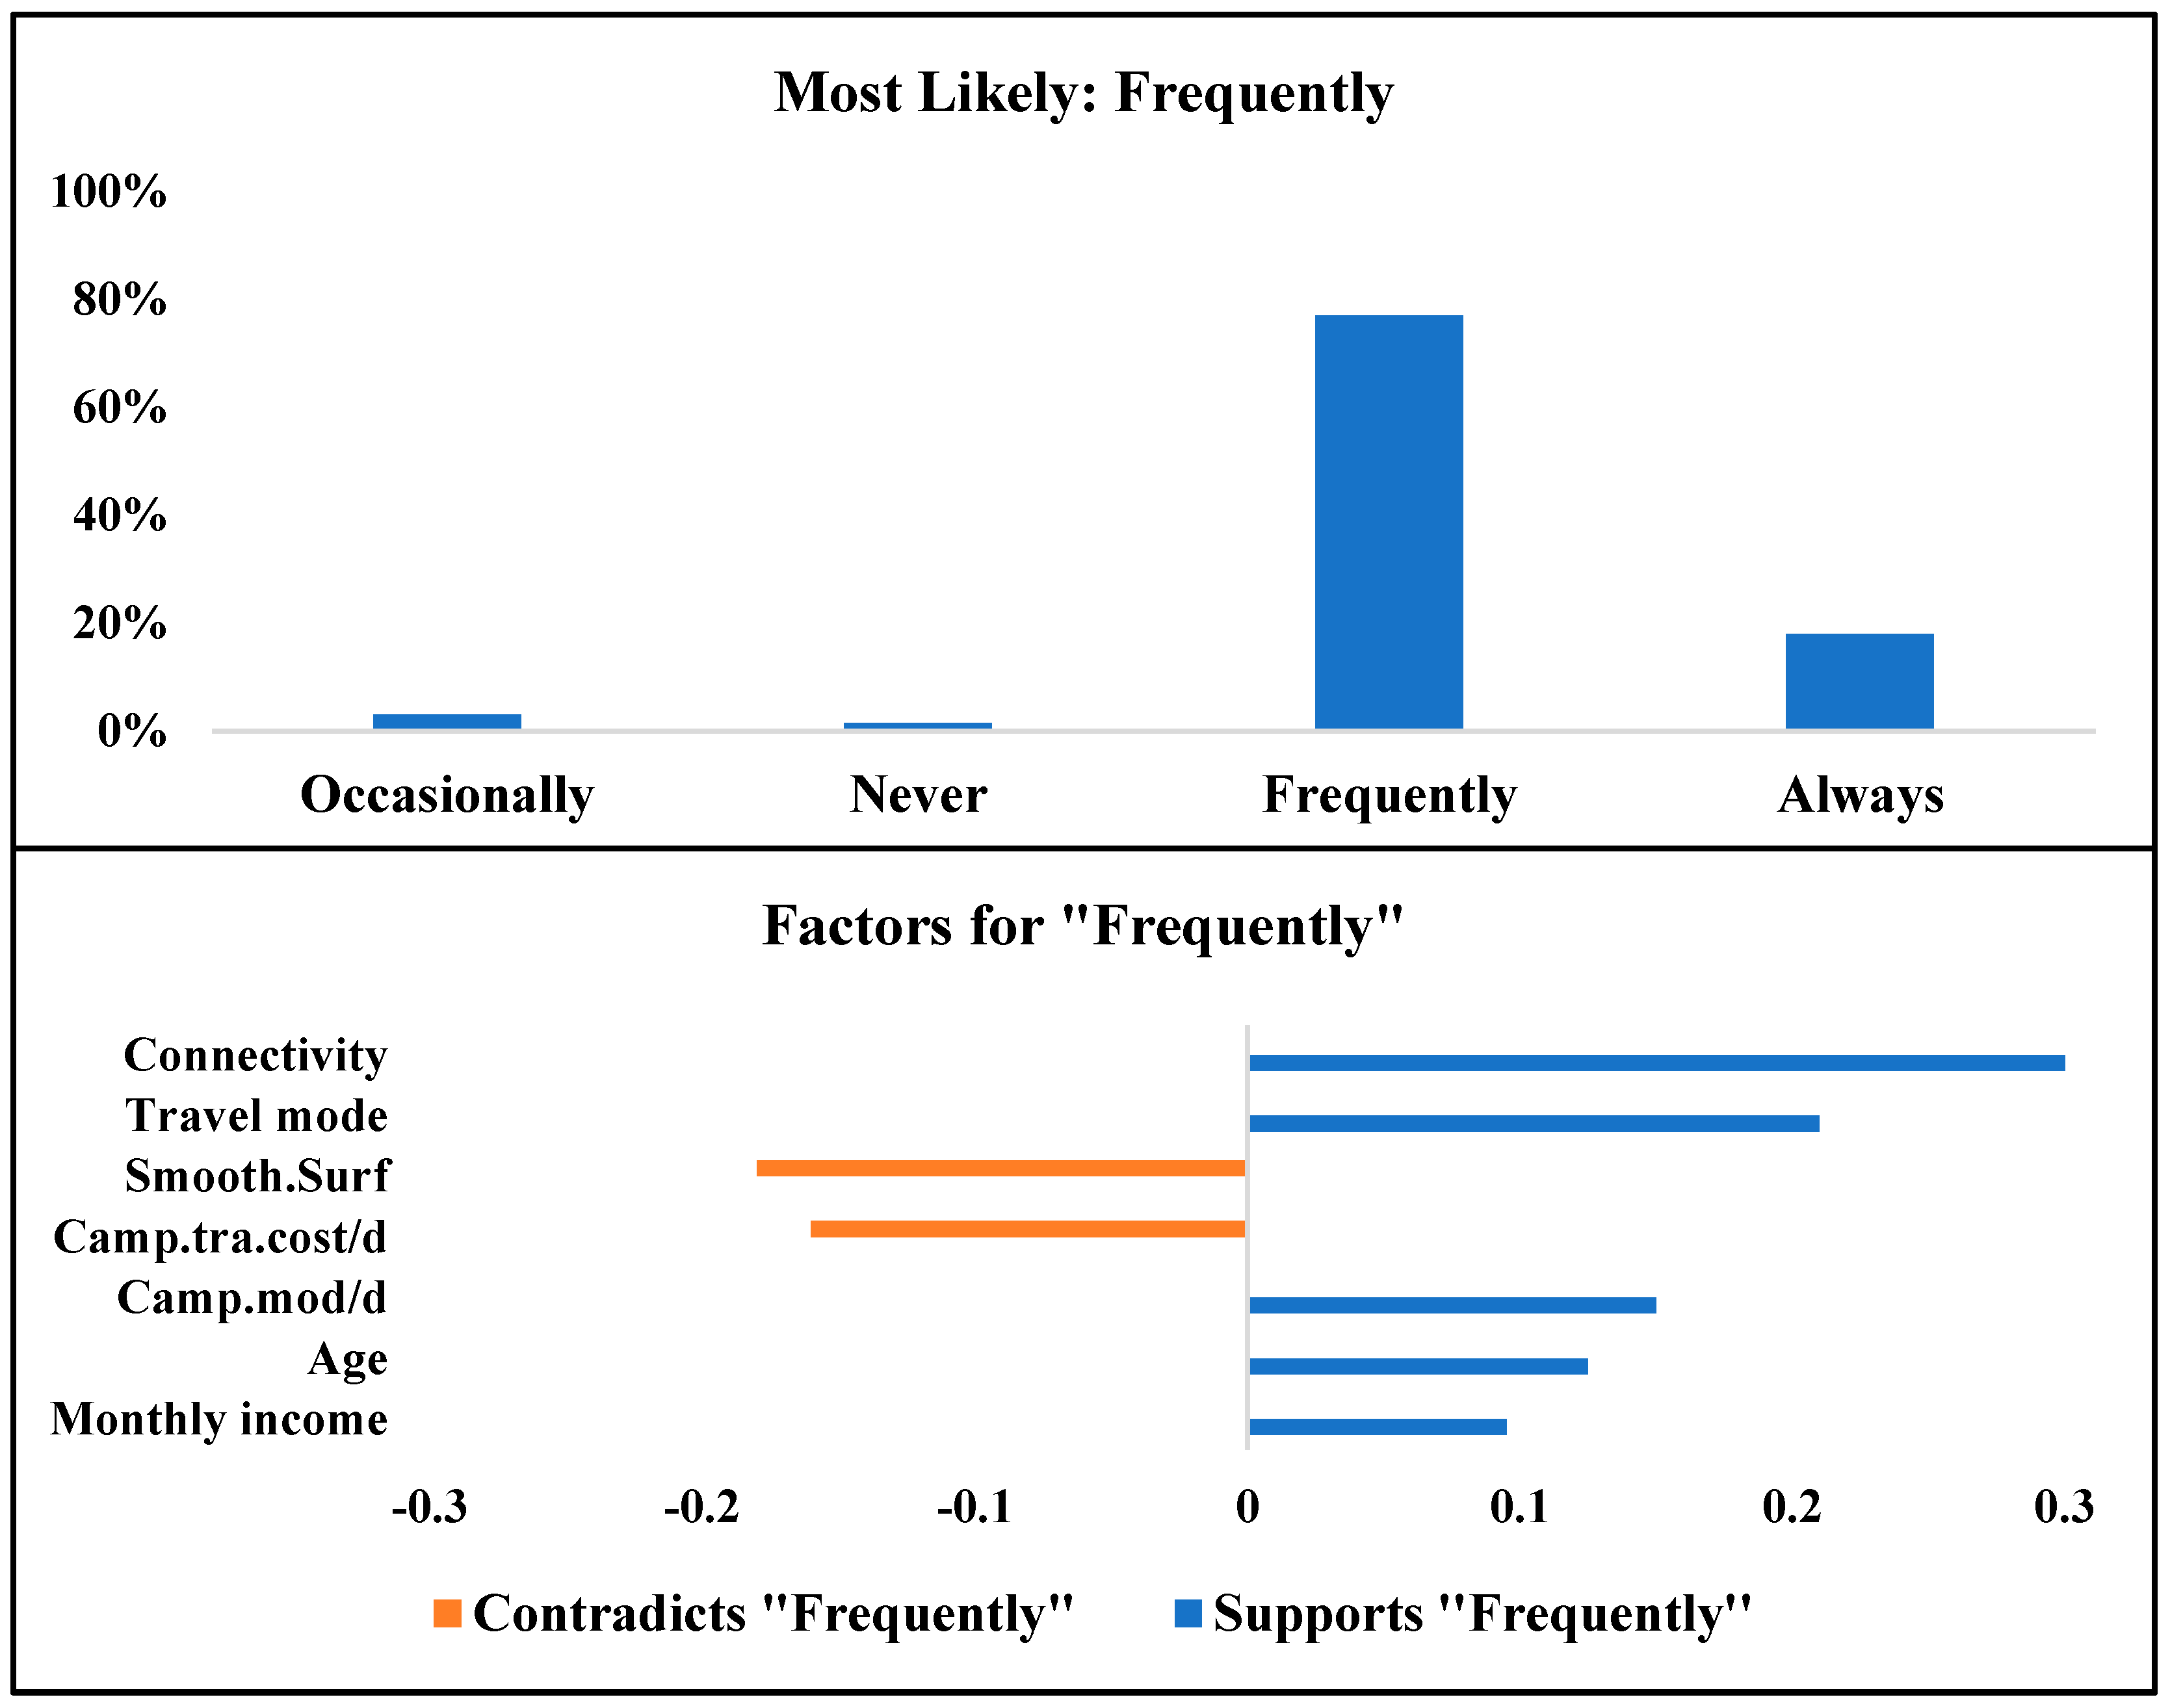
Figure 15, 95% of respondents described above will always use SFFESs as their main mode of transport on the campus, 3% will use SFFESs occasionally, 1.5% will never use it, and less than 1% will use it frequently. In addition, gender, age, and cost of travel per day are the most important factors affecting SFFESs choice and usage. The simulation model was adjusted to optimize the attributes based on the second scenario and determine the characterization of the SFFES service’s frequent users. Frequent usage of the SFFES service has been defined as usage between two and five times per week, or replacing at least half of the user’s current mode of transport with the SFFES service. According to
Table 7, most of the frequent users of SFFESs will be women, as in the previous scenario. However, frequent users are most likely to be older users (30 to 40 years old) with a higher monthly income. While they most likely own private vehicles, they mostly use public transportation for arriving on campus and use e-hailing services to travel around the campus. According to
Figure 16, 77% of described students/staff are willing to use the SFFES service frequently. In addition, road features such as connectivity and quality of road surface can strongly impact their usage. Travel mode and travel costs are other important factors for this group, according to
Figure 16.
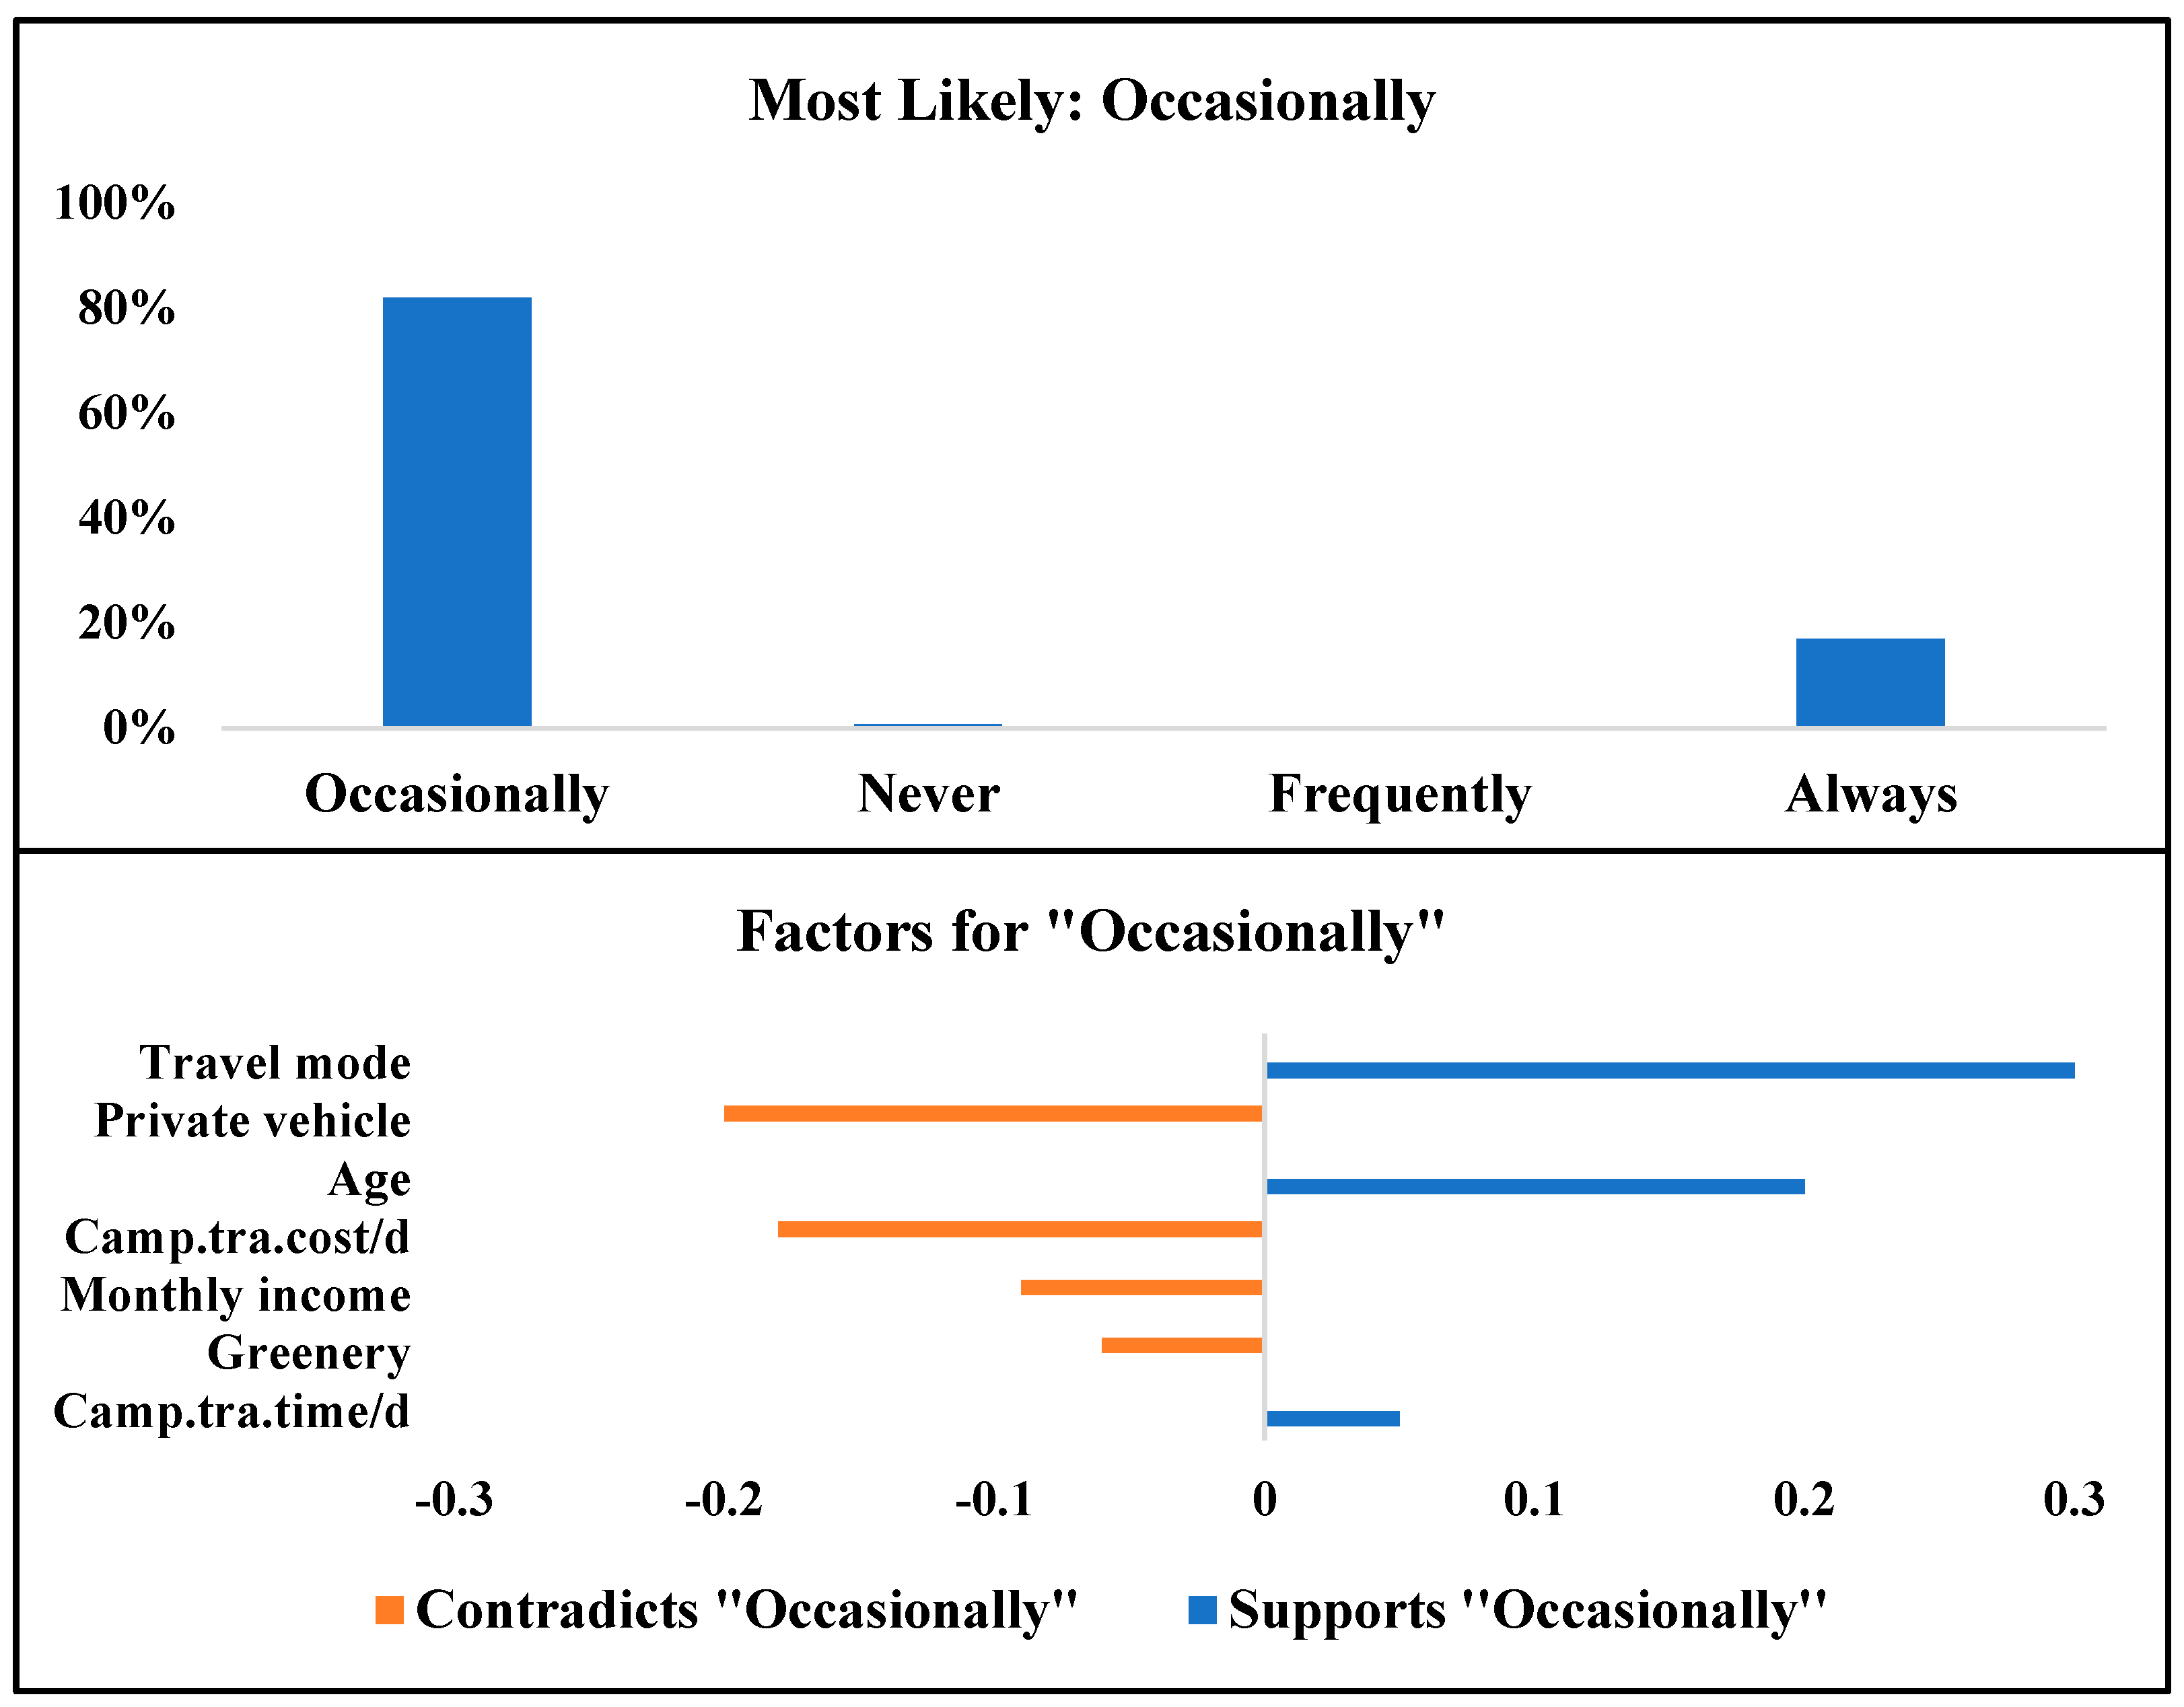
In the third scenario, the simulation model optimized target variables on the group of users who will most likely use SFFESs occasionally (less than three times per week). Interestingly, men between 45 and 60 years old with an average monthly salary (RM 2000 to RM 4000 is considered an average monthly income in Malaysia) are most likely to use SFFESs occasionally. In addition, they own private vehicles and mostly use public transportation for their daily travels around the campus. According to
Figure 17, 82% of users who are described in the third scenario will use SFFES services occasionally or less than three times per week. Moreover, travel mode, age and daily travel time are important factors which support their SFFES mode choice.
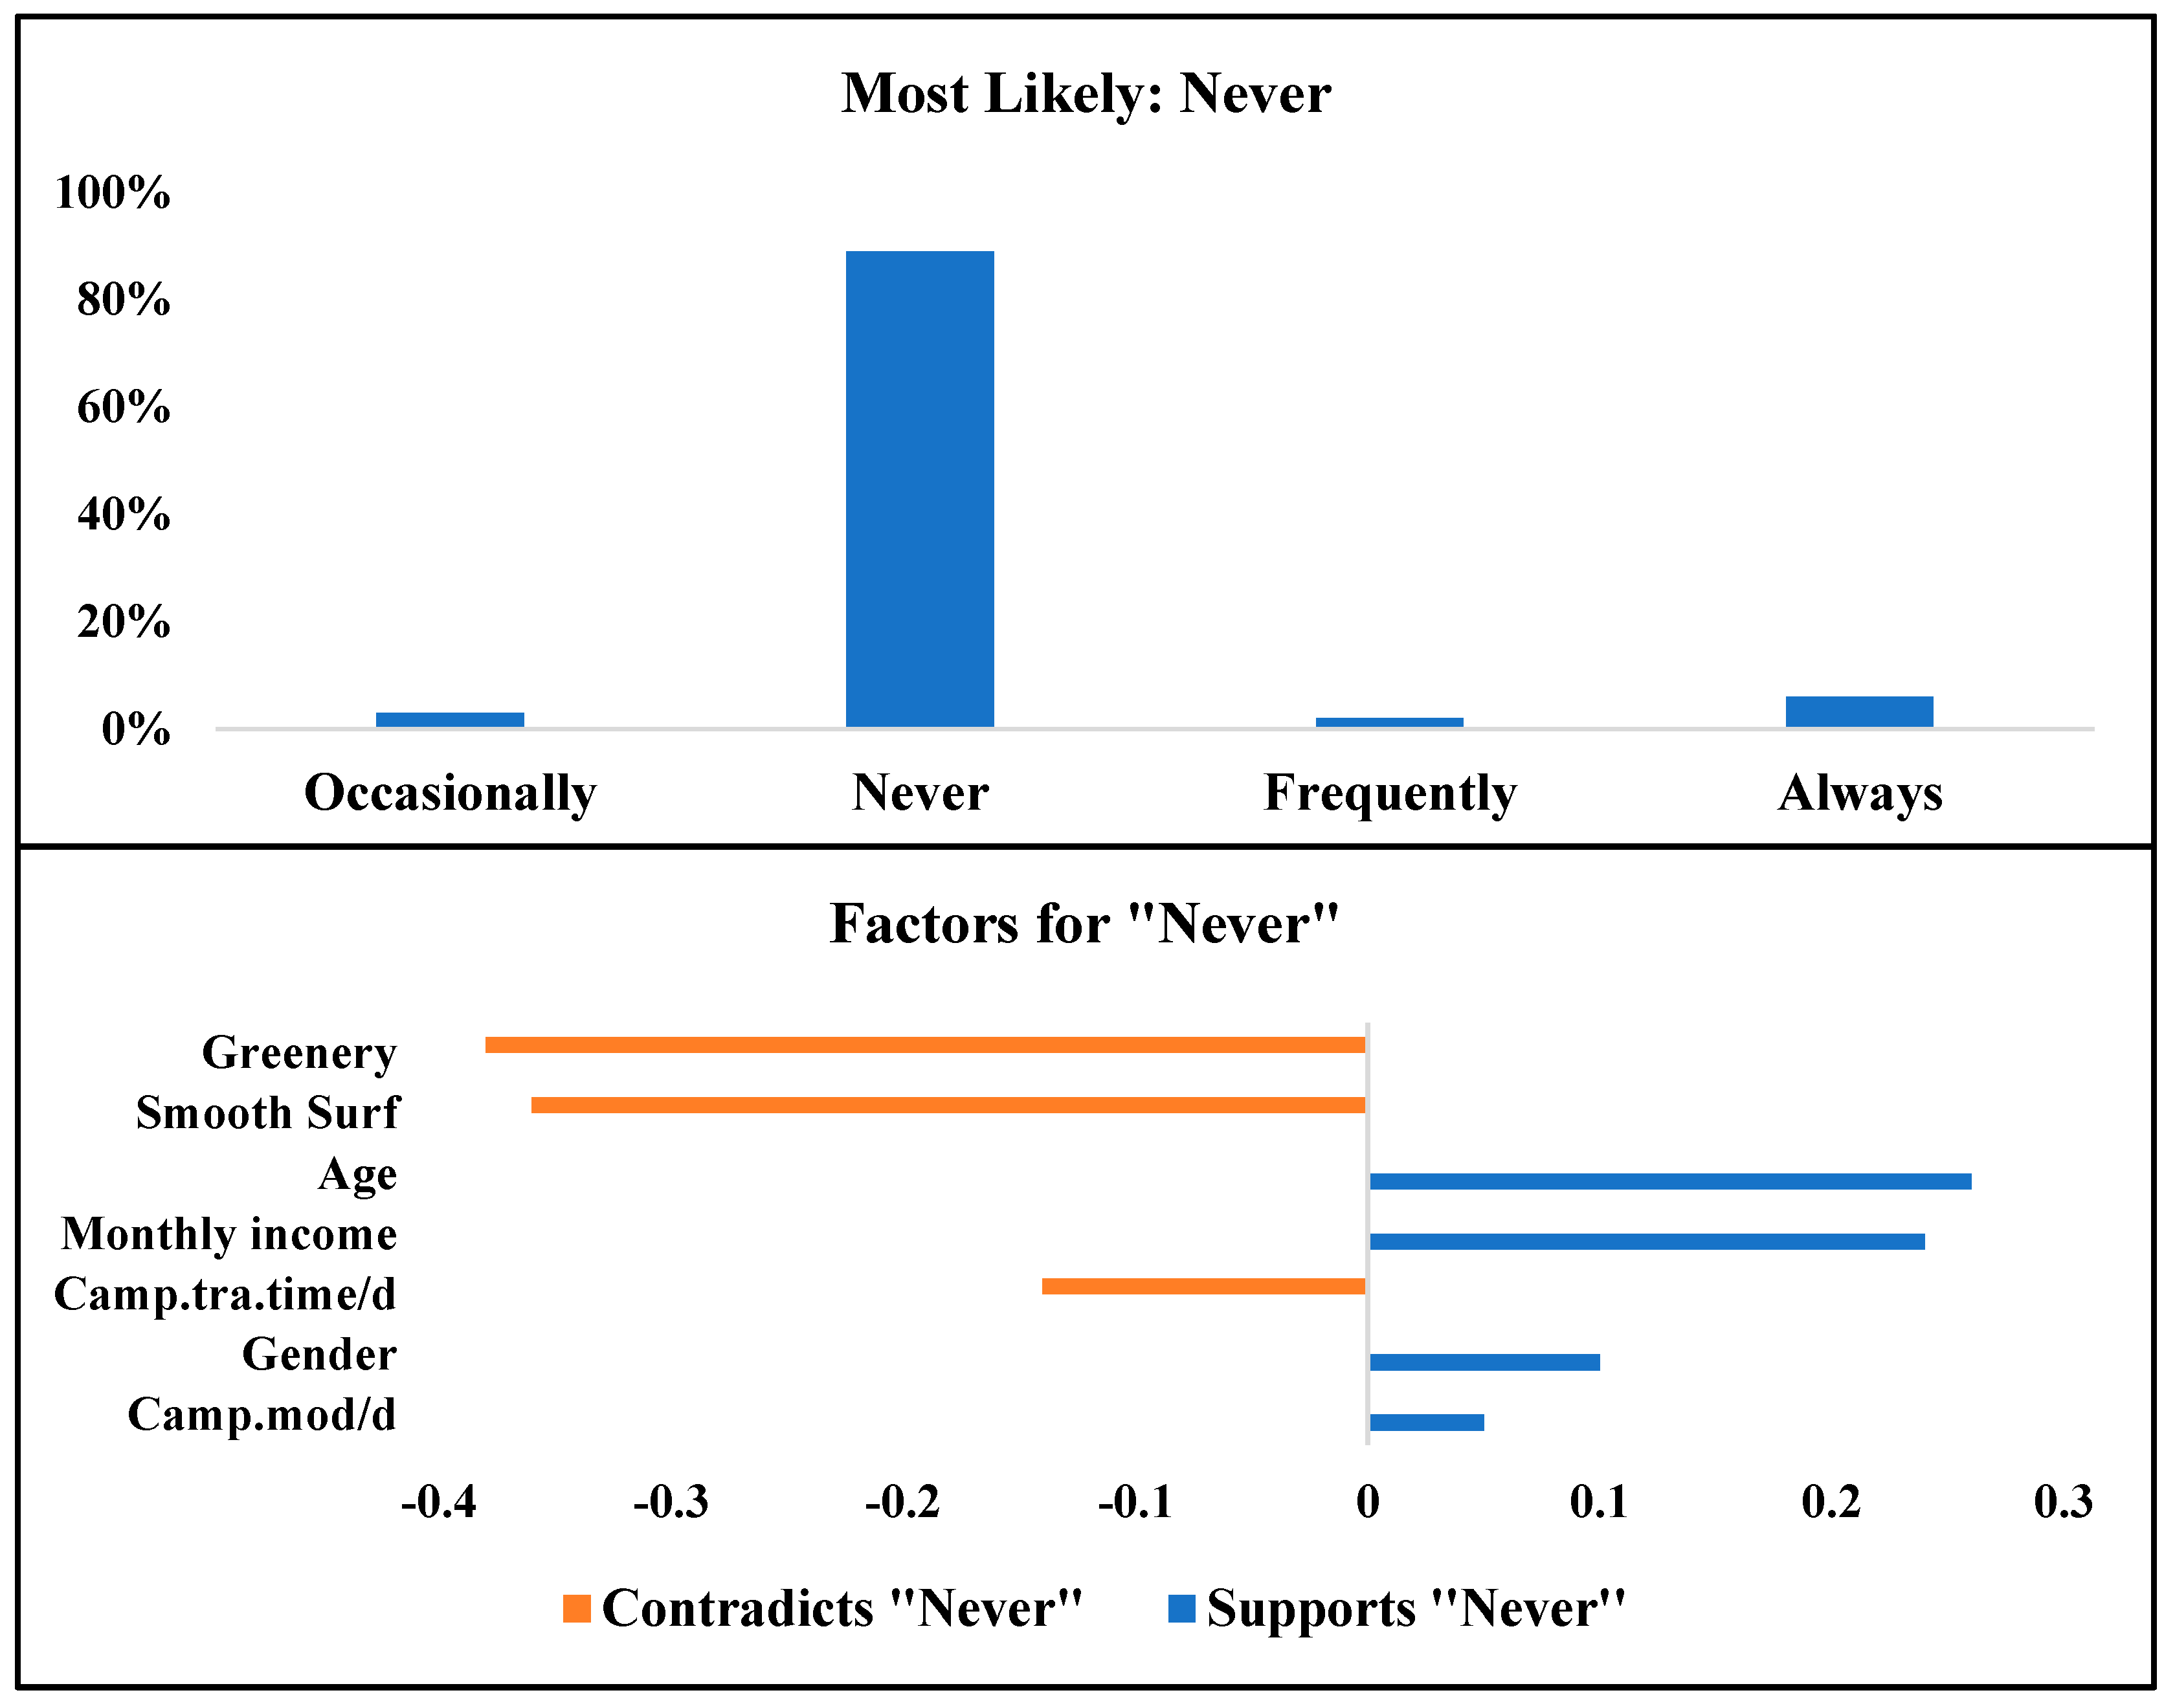
Respondents who are not interested in SFFESs and will never use the service were our target in the fourth scenario. According to the last column of
Table 7, the sociodemographic characterization of respondents in this scenario is almost the same as the third scenario (users who will use SFFESs occasionally), with the difference being that their monthly income is much higher. In addition, their average daily travel time is significantly shorter, and they prefer to use their own car. As shown in
Figure 18, 89% of users described in the fourth scenario are most likely to never use SFFESs. Moreover, road features such as green roads and smooth surfaces are the most important factors which are in contrast with the “Never” usage scenario. In other words, road features are significantly important factors that may encourage them to consider SFFES services for their future travels around the campus (as shown in
Figure 18).
5. Discussion
This study is designed to deeply explore the attitudes and perceptions of students and staff towards SFFES usage on campus. Various attributes were considered for this propose, such as the sociodemographic information of respondents, characterization of trips, road features, concerns/barriers, and benefits of riding SFFESs. In addition, this study is one of the first to predict the likelihood of usage frequency of SFFESs by employing various machine learning techniques and the first study on SFFESs in Malaysia. Previous studies have been mostly conducted in the US, China, and recently European cities. Moreover, for the first time we have employed different feature selection methods and machine learning algorithms to deeply evaluate the weight of important factors that affect the mode choice and usage of SFFESs between university students and staff. The campus of University of Malaya (UM) was selected for conducting this study because:
Shared micromobility is new in Malaysia, and most people have limited knowledge about it. The university community is a natural laboratory to test new mobility services.
The shared e-scooter companies such as BEAM, TRYKE and Myscooter are very interested in providing their services to university campuses in this initial stage.
UM is the biggest university in Malaysia, with more than 30,000 students and staff. In addition, more than 5000 international students and staff are on UM campus of different races, ethics, nations and generations. The diversity of the population fits the study requirements well.
A comprehensive feature selection was conducted before developing machine learning predictive models. The main propose of this step was to accurately recognize the significant factors and importance by adopting supervised and unsupervised machine learning techniques. In addition, it decreased the complication of the final model by decreasing the number of variables based on their significance. Although decreasing the number of variables may reduce the accuracy of the final model, this reduction can be minimized by adopting proper and accurate feature selection techniques. In other words, adopting accurate feature selection methods will promote the complexity and practicality of the final model, while the accuracy remains adequately high. In this study, the initial models were developed using all 22 variables. After implementing feature selection methods, the number of variables reduced to 11.
According to the feature selection results, daily travel mode inside the campus (Camp.mod/d) was the most effective factor in determining SFFES usage frequency. Other travel characterizations, such as daily travel cost and time/duration, were among the most influential factors. Sociodemographic attributes such as age, gender, monthly income and private vehicle ownership, played significantly important roles in mode choice and SFFES usage, as also proved by previous studies [
33,
66]. In addition, based on the outputs of all three supervised feature selection models, road features such as greenery and the connectivity of roads influenced the mode choice significantly. The initial RF model (with 22 variables) outperformed DT and NB models with 99.45% accuracy. Therefore, we selected the RF model for further analysis and developing the final model using the 11 most important variables. As expected, reducing the number of variables caused a reduction in accuracy by 6%. However, the authors believe that the final model is a much more valuable model with acceptable accuracy and less complexity.
To unpack and shed light on the attitudes of the survey participants towards SFFES usage, a simulation-based optimization was developed. Interesting results have been gained which could be useful for future works, recommendations and policy-making. Four optimization scenarios were defined based on the four categories of possible SFFES users: always, frequently, occasionally and never. According to the optimization results, there was a strong relationship between gender and the frequency of usage of SFFESs. Surprisingly, respondents who were more likely to ride e-scooters always and frequently were mostly young to middle-aged females. This result is in contrast with previous studies [
15,
67] and further exploration is needed to discover the reasons for this gender gap in SFFES usage. However, this result may be biased by our survey participants’ characterization, who were mostly young and highly educated.
Indeed, many interesting facts can be unveiled by adopting simulation-based optimization analysis. According to
Table 6, respondents who would change their travel mode to SFFESs were mostly daily cyclists or pedestrians. The same result was observed by previous studies [
15,
33,
68]. On the other hand, respondents who used their own private vehicle for daily trips were not interested in riding an e-scooter. These two facts can be considered as significant disadvantages of SFFES services. Undoubtedly, walking and cycling are more desirable and sustainable modes of transportation in several different aspects. Walking and cycling are healthier modes, since they require much more physical activity [
69]. Moreover, while walking and cycling are the greenest possible modes of transport, the environmental impact of e-scooters is still not well-investigated [
70].
Strength, Limitations and Next Steps
Before indicating the limitations, the authors would like to mention the significant strengths of this study. To the authors’ knowledge, this is the first study of SFFESs on a university campus. A large number of students and staff with various sociodemographic backgrounds and undertaking different types of activities on the campus helped to shed some light on the future of SFFESs launches on other university campuses and even urban areas. Furthermore, this was the first study on SFFESs undertaken in Malaysia and one the first to employ various machine learning algorithms to predict the use frequency of SFFESs. There are also a number of limitations. One of the key limitations of this study was sample size. We forwarded the Google Form (the survey) to more than 30,000 university students and staff, and only 1.7% responded completely. The number of respondents was limited, and there must also be principal differences between respondents and non-respondents. In addition, the method of survey distribution and focus group was limited to academic and highly educated people. Undoubtedly, further studies should consider larger sample sizes which are more random and representative of potential SFFES riders. Moreover, we have not provided some specific scenarios for using SFFESs on the campus, such as estimated travel time, costs, proposals and external factors like weather. Therefore, the answers to some questions were based on the experience of respondents, which would influence the results.
Future studies should consider larger sample sizes to predict a better model with higher accuracy, which also represents all SFFES users in Malaysia. Moreover, future studies should incorporate the available information from SFFES companies, such as travel distance, travel time and proposals for travel. In this study, we have only focused on tree-based machine learning algorithms (RF, DT and NB) for predicting SFFES usage frequency. We propose that future studies should consider other types of machine learning techniques, such as neural networks and support vector machines, to clarify which technique has the best performance. Finally, off-campus and on-campus students have different requirements, and in turn, travel behaviors. Future studies can consider these differences.
6. Conclusions
This study predicts SFFES use on a university campus using supervised and unsupervised machine learning techniques. A comprehensive feature selection analysis was conducted using k-means and hierarchical clustering, decision tree, random forest and Naïve Bayes techniques. The 11 most important attributes were identified, including daily travel modes around the campus, the presence of green spaces and water, age, quality of the road surface, daily travel time and cost around the campus, monthly income, private vehicle ownership, connectivity between roads, modes of transport to/from campus, and gender.
The random forest algorithm was developed to predict the usage frequency of SFFES using the identified important attributes. Simulation-based sensitivity analysis was conducted to gain deeper insights into the characterization and specification of SFFES users. Young females between 18 and 29 years old with an average monthly income were the most likely to always use SFFESs for their travels on campus. Males between 45 and 60 years with a high monthly salary were less likely to use SFFESs. The safety concerns and cost of renting e-scooters were the most important discouragement factors, while road features and suitable infrastructure, such as green spaces and separated lanes for scooters, were the most important encouragement factors. In addition, social distancing during the pandemic and no parking issues were the most considerable benefits of riding e-scooters from the respondents’ perspective.
The responsibility of the service providers and authorities is to provide all residents (especially people with limited transportation access) with accessible, equitable, safe, affordable, and sustainable transportation options. SFFES services are capable of helping to fill transportation gaps through providing an efficient, affordable alternative to cars for urban journeys. Scooters can have several benefits such as health, safety, and congestion opening, as well as some social/environmental equity benefits. To make an effective decision regarding whether and how SFFESs should be implemented in transportation systems of future cities, decision makers must first determine the definite role of these vehicles in the city. This can be determined through finding out the involved actors’ visions of the future urban transport. As a result, to guarantee sustainable mobility, there is a need for not only technology and investment, but also fundamental research into related issues.

 ,
, 


