
The Use of Ultrasound in Shaping the Properties of Ice Cream with Oleogel Based on Oil Extracted from Tomato Seeds
 , , , , , , and
Abstract
:Featured Application
Abstract
1. Introduction
2. Materials and Methods
2.1. Ingredients
2.2. Obtaining and Analyzing Oleogel
2.3. Recipe and Preparation of Ice Cream
2.4. Analysis of Oil
2.5. Analysis of Chemical Composition
2.6. Physical Properties of Ice Cream
3. Statistical Analysis
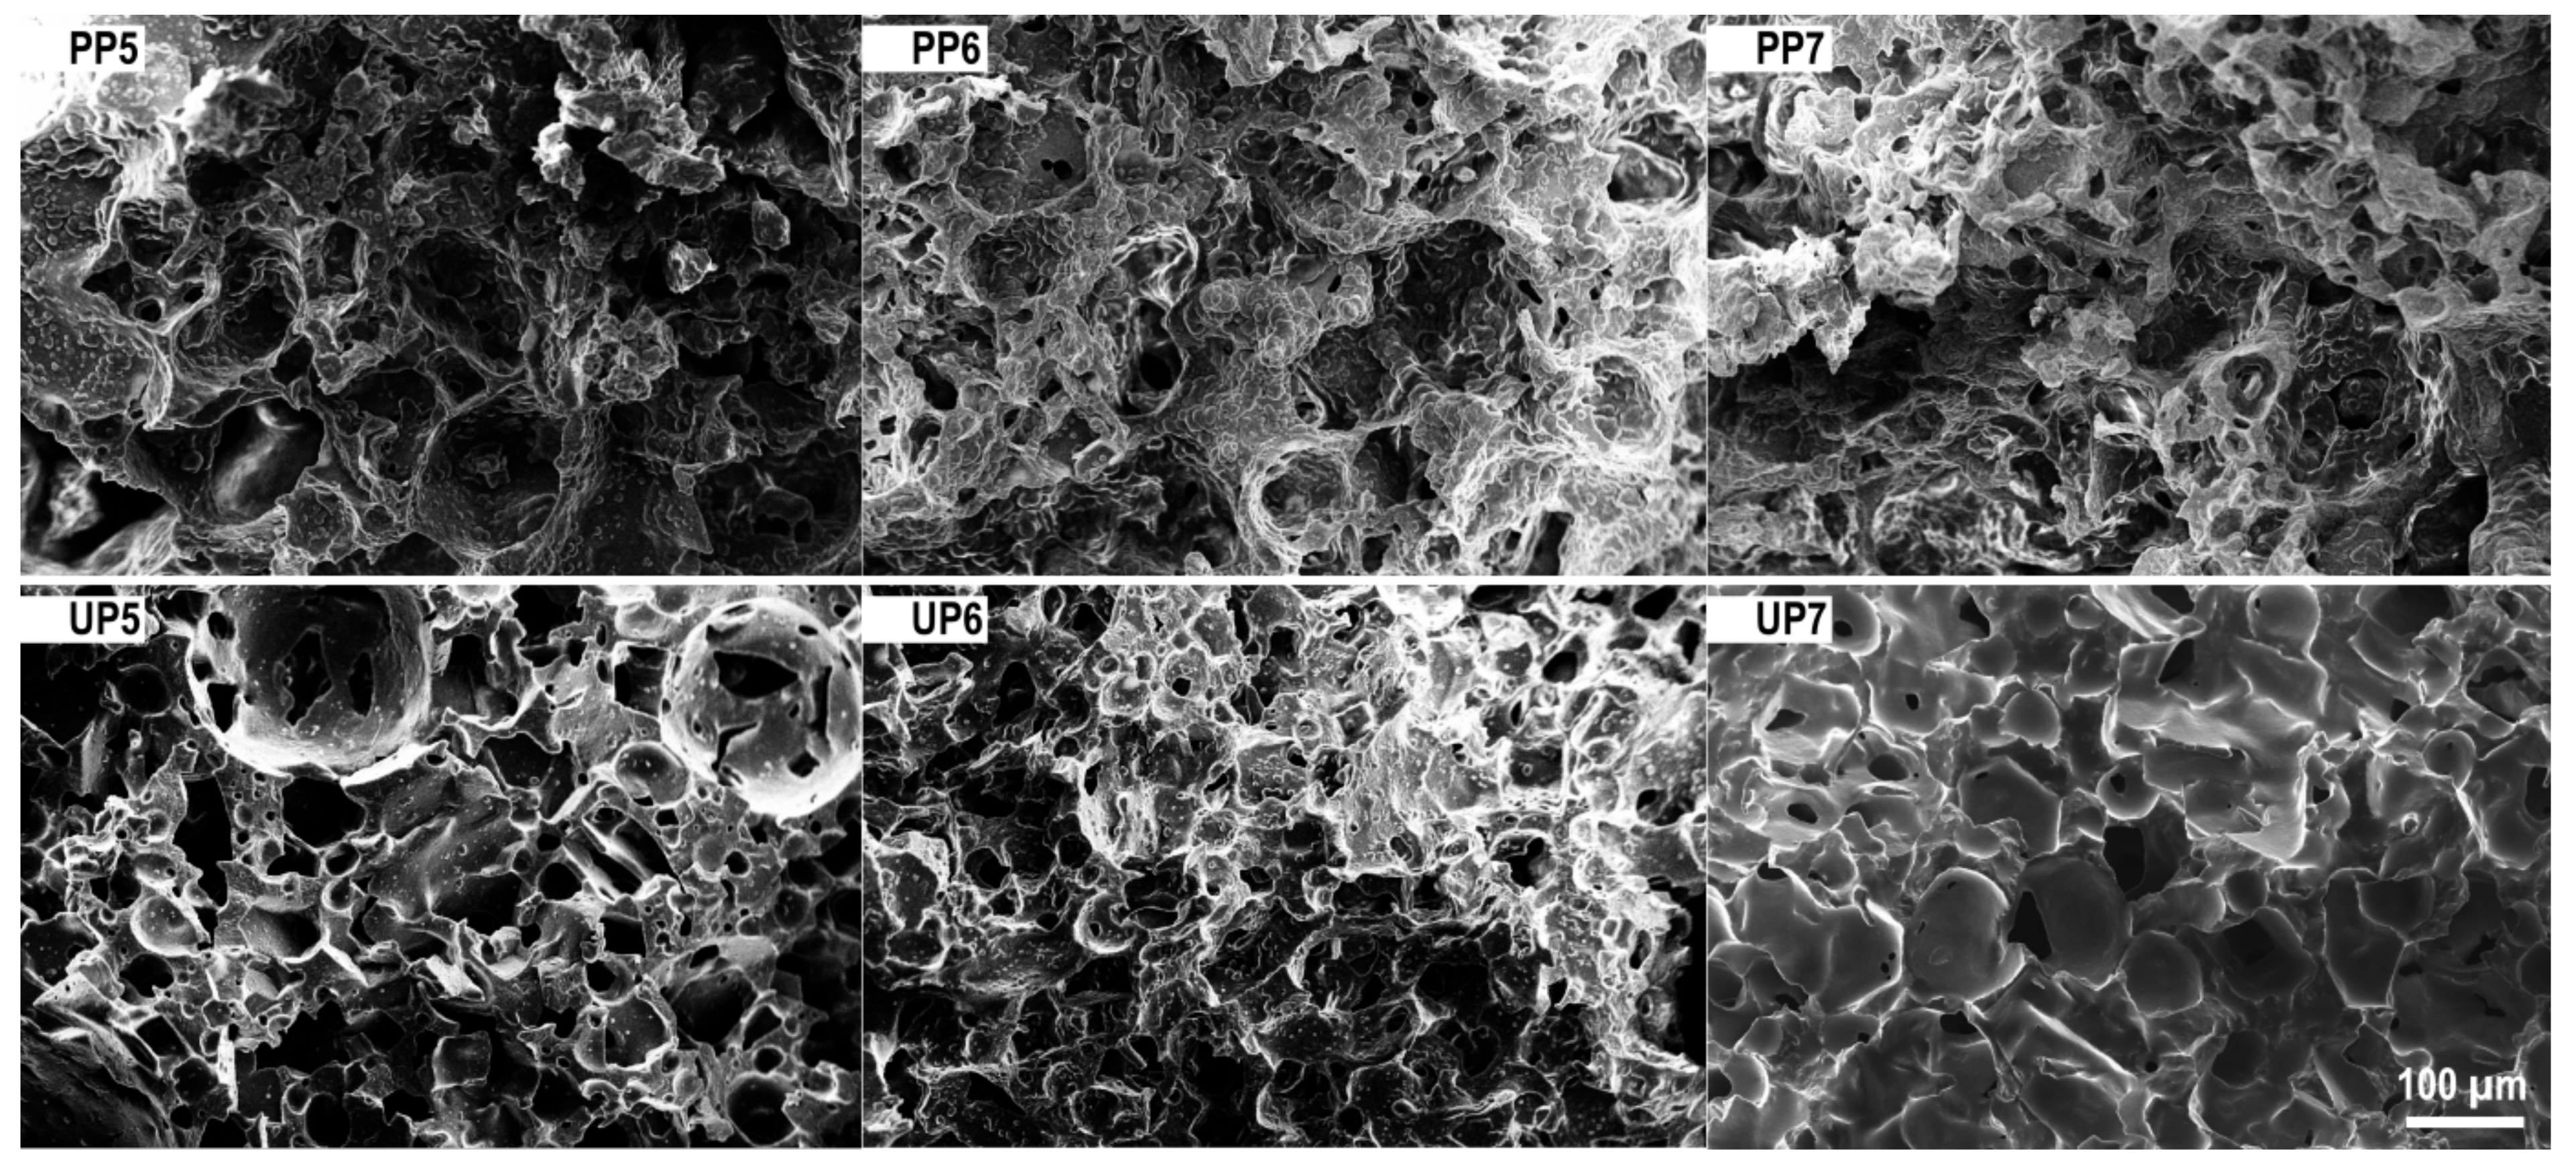
4. Results and Discussion
5. Conclusions
Author Contributions
Funding
Institutional Review Board Statement
Informed Consent Statement
Data Availability Statement
Conflicts of Interest
References
- Clarke, C. The Science of Ice Cream, 2nd ed.; Unilever R&D Colworth: Bedford, UK; The Royal Society of Chemistry: Cambridge, UK, 2012; pp. 15–200. [Google Scholar]
- Muse, M.R.; Hartel, R.W. Ice Cream Structural Elements that Affect Melting Rate and Hardness, American Dairy Science Association. J. Dairy Sci. 2004, 87, 1–10. [Google Scholar] [CrossRef]
- Goff, H.D. Formation and stabilisation of structure in ice-cream and related products. Curr. Opin. Colloid Interface Sci. 2002, 7, 432–437. [Google Scholar] [CrossRef]
- Ranjan, S.; Baer, R.J. Effect of milk fat and homogenization on texture of ice cream. Milchwissenschaft 2005, 60, 189–192. [Google Scholar]
- Chávez-Martínez, A.; Reyes-Villagrana, R.A.; Rentería-Monterrubio, A.L.; Sánchez-Vega, R.; Tirado-Gallegos, J.M.; Bolivar-Jacobo, N.A. Low and High-Intensity Ultrasound in Dairy Products: Applications and Effects on Physicochemical and Microbiological Quality. Foods 2020, 9, 1688. [Google Scholar] [CrossRef]
- Mortazavi, A.; Tabatabaie, F. Study of Ice Cream Freezing Process after Treatment with Ultrasound. World Appl. Sci. J. 2008, 4, 188–190. [Google Scholar]
- Kot, A.; Kamińska-Dwórznicka, A.; Jakubczyk, E. Study on the Influence of Ultrasound Homogenisation on the Physical Properties of Vegan Ice Cream Mixes. Appl. Sci. 2022, 12, 8492. [Google Scholar] [CrossRef]
- Kilara, A.; Chandan, R.C. Ice Cream and Frozen Desserts. In Handbook of Food Products Manufacturing; Hui, Y.H., Ed.; John Wiley & Sons, Inc.: Hoboken, NJ, USA, 2006; Chapter 74; pp. 595–633. [Google Scholar] [CrossRef]
- Pehlivanoğlu, H.; Demirci, M.; Toker, O.S.; Konar, N.; Karasu, S.; Sagdic, O. Oleogels, a promising structured oil for decreasing saturated fatty acid concentrations: Production and food-based applications. Crit. Rev. Food Sci. Nutr. 2018, 58, 1330–1341. [Google Scholar] [CrossRef]
- Davidovich-Pinhas, M. Oil structuring using polysaccharides. Curr. Opin. Food Sci. 2019, 27, 29–35. [Google Scholar] [CrossRef]
- Moriano, M.E.; Alamprese, C. Organogels as novel ingredients for low saturated fat ice creams. LWT 2017, 86, 371–376. [Google Scholar] [CrossRef]
- Lazos, E.S.; Tsaknis, J.; Lalas, S. Characteristics and composition of tomato seed oil. Grasas Aceites 1998, 49, 440–445. [Google Scholar] [CrossRef]
- Giannelos, P.N.; Sxizas, S.; Lois, E.; Zannikos, F.; Anastopoulos, G. Physical, Chemical and Fuel Related Properties of Tomato Seed Oil for Evaluating its Direct Use in Diesel Engines. Ind. Crops Prod. 2005, 22, 193–199. [Google Scholar] [CrossRef]
- Shao, D.; Atungulu, G.G.; Pan, Z.; Yue, T.; Zhang, A.; Chen, X. Separation Methods and Chemical and Nutritional Characteristics of Tomato Pomace. Trans. ASABE 2013, 56, 261–268. [Google Scholar] [CrossRef]
- Da Pieve, S.; Calligaris, S.; Co, E.; Nicoli, M.C.; Marangoni, A.G. Shear nanostructuring of monoglyceride organogels. Food Biophys. 2010, 5, 211–217. [Google Scholar] [CrossRef]
- Yılmaz, E.; Öğütcü, M. Properties and stability of hazelnut oil organogels with beeswax and monoglyceride. J. Am. Oil Chem. Soc. 2014, 91, 1007–1017. [Google Scholar] [CrossRef]
- Żbikowska, A.; Kupiec, M.; Onacik-Gür, S. Wpływ karagenu na teksturę i stabilność oleożeli hydroksypropylometylocelulozowych. Acta Agrophysica 2017, 24, 553–561. [Google Scholar]
- ISO Standard 12966-2:2017; Animal and Vegetable Fats and Oils Gas Chromatography of Fatty acid Methyl esters—Part 2: Preparation of Methyl Esters of Fatty Acids. ISO International Organization for Standardization: Geneva, Switzerland, 2017.
- AOAC International. Official Methods of Analysis of AOAC International, 17th ed.; Association of Analytical Communities: Gaithersburg, MD, USA, 2000. [Google Scholar]
- Novotny, J.; Gebauer, S.; Baer, D. Discrepancy between the Atwater factor predicted and empirically measured energy values of almonds in human diets. Am. J. Clin. Nutr. 2012, 92, 296–301. [Google Scholar] [CrossRef]
- Aboulfazli, F.; Baba, A.S.; Misran, M. Effect of vegetable milks on the physical and rheological properties of ice cream. Food Sci. Technol. Res. 2014, 20, 987–996. [Google Scholar] [CrossRef]
- Savanović, D.M.; Grujić, R.D.; Savanović, J.M.; Mandić, S.U.; Rakita, S.M. Analysis of frozen chicken meat using differential scanning calorimetry. Food Feed. Res. 2018, 45, 129–137. [Google Scholar] [CrossRef]
- Akbari, M.; Eskandari, M.H.; Niakosari, M.; Bedeltavana, A. The effect of inulin on the physicochemical properties and sensory attributes of low-fat ice cream. Int. Dairy J. 2016, 57, 52–55. [Google Scholar] [CrossRef]
- Güven, M.; Karaca, O.B. The effect of varying sugar content and fruit concentration on the physical properties of vanilla and fruit ice-cream-type frozen yogurts. Int. J. Dairy Technol. 2002, 55, 27–31. [Google Scholar] [CrossRef]
- Tiwari, A.; Sharma, H.K.; Kumar, N.; Kaur, M. The effect of inulin as a fat replacer on the quality of low-fat ice cream. Int. J. Dairy Technol. 2015, 68, 374–380. [Google Scholar] [CrossRef]
- Mechmeche, M.; Ksontini, H.; Hamdi, M.; Kachouri, F. Impact of the addition of tomato seed oil on physicochemical characteristics, antioxidant activity and microbiological quality of dried tomato slices. J. Food Meas. Charact. 2018, 12, 1378–1390. [Google Scholar] [CrossRef]
- Ozyurt, V.H.; Çakaloğlu, B.; Otles, S. Optimization of cold press and enzymatic-assisted aqueous oil extraction from tomato seed by response surface methodology: Effect on quality characteristics. J. Food Process. Preserv. 2021, 45, e15471. [Google Scholar] [CrossRef]
- Yilmaz, E.; Aydeniz, B.; Günes, O.; Arsunar, E.S. Sensory and Physico-Chemical Properties of Cold Press-Produced Tomato (Lycopersicon esculentum L.) Seed Oils. J Am. Oil Chem. Soc. 2015, 92, 833–842. [Google Scholar] [CrossRef]
- Hassanien, M.M.M.; Abdel-Razek, A.G.; Rudzińska, M.; Siger, A.; Ratusz, K.; Przybylski, R. Phytochemical contents and oxidative stability of oils from non-traditional sources. Eur. J. Lipid Sci. Technol. 2014, 116, 1563–1571. [Google Scholar] [CrossRef]
- Kamińska-Dwórznicka, A.; Janczewska-Dupczyk, A.; Kot, A.; Łaba, S.; Samborska, K. The impact of ι- and κ-carrageenan addition on freezing process and ice crystals structure of strawberry sorbet frozen by various methods. J. Food Sci. 2020, 85, 50–56. [Google Scholar] [CrossRef]
- Jambrak, A.R.; Mason, T.J.; Lelas, V.; Herceg, Z.; Herceg, I.L. Effect of ultrasound treatment on solubility and foaming properties of whey protein suspensions. J. Food Eng. 2008, 86, 281–287. [Google Scholar] [CrossRef]
- Akdeniz, V.; Akalın, A.S. New approach for yoghurt and ice cream production: High-intensity ultrasound. Trends Food Sci. Technol. 2019, 86, 392–398. [Google Scholar] [CrossRef]
- Kenari, R.E.; Razavi, R. Effect of sonication conditions: Time, temperature and amplitude on physicochemical, textural and sensory properties of yoghurt. Int. J. Dairy Technol. 2012, 74, 332–343. [Google Scholar] [CrossRef]
- Asres, A.M.; Woldemariam, H.; Gemechu, F.G. Physicochemical and sensory properties of ice cream prepared using sweet lupin and soymilk as alternatives to cow milk. Int. J. Food Prop. 2022, 25, 278–287. [Google Scholar] [CrossRef]
- Lim, C.W.; Norziah, M.H.; Lu, H.F.S. Effect of flaxseed oil towards physicochemical and sensory characteristic of reduced fat ice creams and its stability in ice creams upon storage. Int. Food Res. J. 2010, 17, 393–403. [Google Scholar]
- Kozłowicz, K.; Góral, M.; Góral, D.; Pankiewicz, U.; Bronowicka-Mielniczuk, U. Effect of ice cream storage on the physicochemical properties and survival of probiotic bacteria supplemented with zinc ions. LWT 2019, 116, 108562. [Google Scholar] [CrossRef]
- Góral, M.; Kozłowicz, K.; Pankiewicz, U.; Góral, D. Magnesium enriched lactic acid bacteria as a carrier for probiotic ice cream production. Food Chem. 2018, 15, 1151–1159. [Google Scholar] [CrossRef] [PubMed]
- Polischuk, G.Y.; Bass, O.; Osmak, T.; Breus, N.M. Cryoprotective ability of starch syrup in the composition of aromatic and fruit-berry ice cream. Ukr. Food J. 2019, 8, 239–248. [Google Scholar] [CrossRef]
- Adapa, S.; Dingeldein, H.; Schmidt, A.; Herald, T.J. Rheological Properties of Ice Cream Mixes and Frozen Ice Creams Containing Fat and Fat Replacers. J. Dairy Sci. 2000, 83, 2224–2229. [Google Scholar] [CrossRef]
- Pulungan, M.H.; Santoso, E.S.M. Ice Cream Cup Production Using Purple Sweet Potato (Ipomoea batatas L. Poir) as a Substitute Ingredient. Ind. J. Teknol. Dan Manaj. Agroindustri 2020, 9, 184–194. [Google Scholar] [CrossRef]
- Shukri, W.H.Z.; Hamzah, E.N.H.; Halim, N.R.A.; Isa, M.I.N.; Sarbon, N.M. Effect of different types of hydrocolloids on the physical and sensory properties of ice cream with fermented glutinous rice (tapai pulut). Int. Food Res. J. 2014, 21, 1777–1787. [Google Scholar]
- Kurt, A.; Atalar, I. Effects of quince seed on the rheological, structural and sensory characteristics of ice cream. Food Hydrocoll. 2018, 82, 186–195. [Google Scholar] [CrossRef]
- Zaeim, D.; Sarabi-Jamab, M.; Ghorani, B.; Kadkhodaee, R.; Liu, W.; Tromp, R.H. Microencapsulation of probiotics in multi-polysaccharide microcapsules by electro-hydrodynamic atomization and incorporation into ice-cream formulation. Food Struct. 2020, 25, 100147. [Google Scholar] [CrossRef]
- Dertli, E.; Toker, O.S.; Durak, M.Z.; Yilmaz, M.T.; Tatlısu, N.B.; Sagdic, O.; Cankurt, H. Development of a fermented ice-cream as influenced by in situ exopolysaccharide production: Rheological, molecular, microstructural and sensory characterization. Carbohydr. Polym. 2016, 136, 427–440. [Google Scholar] [CrossRef]
- Kozłowicz, K.; Różyło, R.; Gładyszewska, B.; Matwijczuk, A.; Gładyszewski, G.; Chocyk, D.; Samborska, K.; Piekut, J.; Smolewska, M. Identification of sugars and phenolic compounds in honey powders with the use of GC–MS, FTIR spectroscopy, and X-ray diffraction. Sci. Rep. 2020, 10, 16269. [Google Scholar] [CrossRef]
- Jiang, X.; Li, S.; Xiang, G.; Li, Q.; Fan, L.; He, L.; Gu, K. Determination of the acid values of edible oils via FTIR spectroscopy based on the OH stretching band. Food Chem. 2016, 212, 585–589. [Google Scholar] [CrossRef]
- Jamwal, R.; Kumari, S.; Sharma, S.; Kelly, S.; Cannavan, A.; Singh, D.K. Recent trends in the use of FTIR spectroscopy integrated with chemometrics for the detection of edible oil adulteration. Vib. Spectrosc. 2021, 113, 103222. [Google Scholar] [CrossRef]
- Chandrapala, J.; Martin, G.J.O.; Zisu, B.; Kentish, S.E.; Ashokkumar, M. The effect of ultrasound on casein micelle integrity. J. Dairy Sci. 2012, 95, 6882–6890. [Google Scholar] [CrossRef] [Green Version]
- Bermúdez-Aguirre, D.; Mawson, R.; Barbosa-Cánovas, G.V. Microstructure of fat globules in whole milk after thermosonication treatment. J. Food Sci. 2008, 73, E325–E332. [Google Scholar] [CrossRef]
- Yang, K.; Lin, R.; Zhang, S.; Zhao, X.; Jiang, J.; Liu, Y. Ultrasound-modified interfacial properties and crystallization behavior of aerated emulsions fabricated with pH-shifting treated pea protein. Food Chem. 2022, 367, 130536. [Google Scholar] [CrossRef]
- Ashokkumar, M.; Bhaskaracharya, R.; Kentish, S.; Lee, J.; Palmer, M.; Zisu, B. The ultrasonic processing of dairy products—An overview. Dairy Sci. Technol. 2010, 90, 147–168. [Google Scholar] [CrossRef]
- Scudino, H.; Silva, E.K.; Gomes, A.; Guimarães, J.T.; Cunha, R.L.; Sant’Ana, A.S.; Meireles, M.A.A.; Cruzd, A.G. Ultrasound stabilization of raw milk: Microbial and enzymatic inactivation, physicochemical properties and kinetic stability. Ultrason. Sonochem. 2020, 67, 105185. [Google Scholar] [CrossRef]


| Fatty Acid | Content [%] | |
|---|---|---|
| Saturated fatty acid | Myristic acid C14:0 | 0.08 |
| Palmitic acid C16:0 | 6.48 | |
| Margaric (heptadecanoic) acid C17:0 | 0.03 | |
| Stearic acid C18:0 | 3.30 | |
| Arachidic (eicosanoic) acid C20:0 | 0.23 | |
| Unsaturated fatty acid | Linoleic acid (n-6) C18:2 | 60.58 |
| Linolenic acid (n-3) C18:3 | 0.10 | |
| Palmitoleic acid C16:1 | 0.10 | |
| Oleic acid (n-9) C18:1 | 26.74 | |
| cis-5 Eicosenoic acid C20:1 | 0.14 |
| Properties | PP5 | PP6 | PP7 | UP5 | UP6 | UP7 |
|---|---|---|---|---|---|---|
| Total solid [%] | 36.48 a ± 0.11 | 36.69 a ± 0.16 | 36.50 a ± 0.38 | 36.49 a ± 0.28 | 36.86 a ± 0.27 | 36.53 a ± 0.18 |
| pH | 6.43 a ± 0.01 | 6.44 a ± 0.01 | 6.46 a ± 0.01 | 6.37 b ± 0.01 | 6.43 a ± 0.01 | 6.45 a ± 0.01 |
| Protein [g·(100 g)−1] | 13.80 c ± 0.05 | 12.76 b ± 0.08 | 12.34 a ± 0.05 | 13.77 c ± 0.09 | 12.80 b ± 0.07 | 12.31 a ± 0.06 |
| Fat [g·(100 g)−1] | 11.25 c ± 0.08 | 12.65 a ± 0.08 | 13.80 e ± 0.07 | 10.15 b ± 0.09 | 11.93 d ± 0.07 | 12.55 a ± 0.05 |
| Ash [g·(100 g)−1] | 3.06 c ± 0.03 | 2.83 b ± 0.01 | 2.70 a ± 0.02 | 3.01 c ± 0.02 | 2.84 b ± 0.04 | 2.70 a ± 0.01 |
| Carbohydrate [g·(100 g)−1] | 34.57 a ± 0.03 | 35.51 b ± 0.03 | 40.88 c ± 0.04 | 57.07 f ± 0.07 | 49.78 e ± 0.04 | 45.86 d ± 0.05 |
| Dietary Fibre [g·(100 g)−1] | 21.97 f ± 0.05 | 18.62 e ± 0.04 | 13.17 a ± 0.04 | 15.47 b ± 0.05 | 17.74 c ± 0.02 | 18.35 d ± 0.04 |
| Caloric value [kcal·(100 g)−1] | 339 a ± 0.40 | 344 b ± 0.27 | 363 c ± 0.57 | 406 f ± 0.79 | 393 e ± 0.51 | 382 d ± 0.35 |
| Properties | PP5 | PP6 | PP7 | UP5 | UP6 | UP7 |
|---|---|---|---|---|---|---|
| Freezing point [°C] | −5.23 a ± 0.22 | −5.02 a ± 0.15 | −4.82 a ± 0.13 | −5.16 a ± 0.14 | −4.74 a ± 0.37 | −4.70 a ± 0.24 |
| Freezable water [%] | 34.70 b ± 0.74 | 39.15 c ± 0.38 | 41.81 a ± 0.36 | 42.19 a ± 0.79 | 41.93 a ± 0.47 | 41.60 a ± 0.47 |
| Enthalpy of fusion [J·g−1] | 115.91 b ± 2.46 | 130.77 c ± 1.28 | 139.64 a ± 1.21 | 140.93 a ± 2.65 | 140.05 a ± 1.56 | 138.95 a ± 1.58 |
| Overrun [%] | 44.62 d ± 0.25 | 48.32 f ± 0.33 | 46.75 e ± 0.20 | 31.29 b ± 0.11 | 29.52 a ± 0.05 | 35.17 c ± 0.11 |
| First drop time [min] | 9.51 b ± 0.06 | 9.45 b ± 0.08 | 8.53 a ± 0.01 | 8.46 a ± 0.05 | 8.30 d ± 0.04 | 8.08 c ± 0.05 |
| Complete melting time [min] | 29.34 a ± 0.05 | 30.01 d ± 0.08 | 31.36 e ± 0.02 | 27.56 b ± 0.05 | 28.50 c ± 0.04 | 29.39 a ± 0.04 |
| Hardness [N] | 3.88 ab ± 1.23 | 3.58 ab ± 0.42 | 1.59 b ± 0.09 | 9.33 c ± 1.22 | 6.30 a ± 1.79 | 4.57 a ± 0.52 |
| Adhesiveness [N·s] | −6.45 ab ± 1.54 | −5.77 a ± 0.74 | −3.05 a ± 0.13 | −19.66 c ± 2.20 | −10.38 b ± 2.44 | −6.60 ab ± 0.67 |
| Viscosity [mPa·s] | 371.67 f ± 0.58 | 365.67 e ± 1,53 | 326.97 d ± 0.95 | 287.63 c ± 1.10 | 257.63 b ± 1.48 | 218.97 a ± 0.06 |
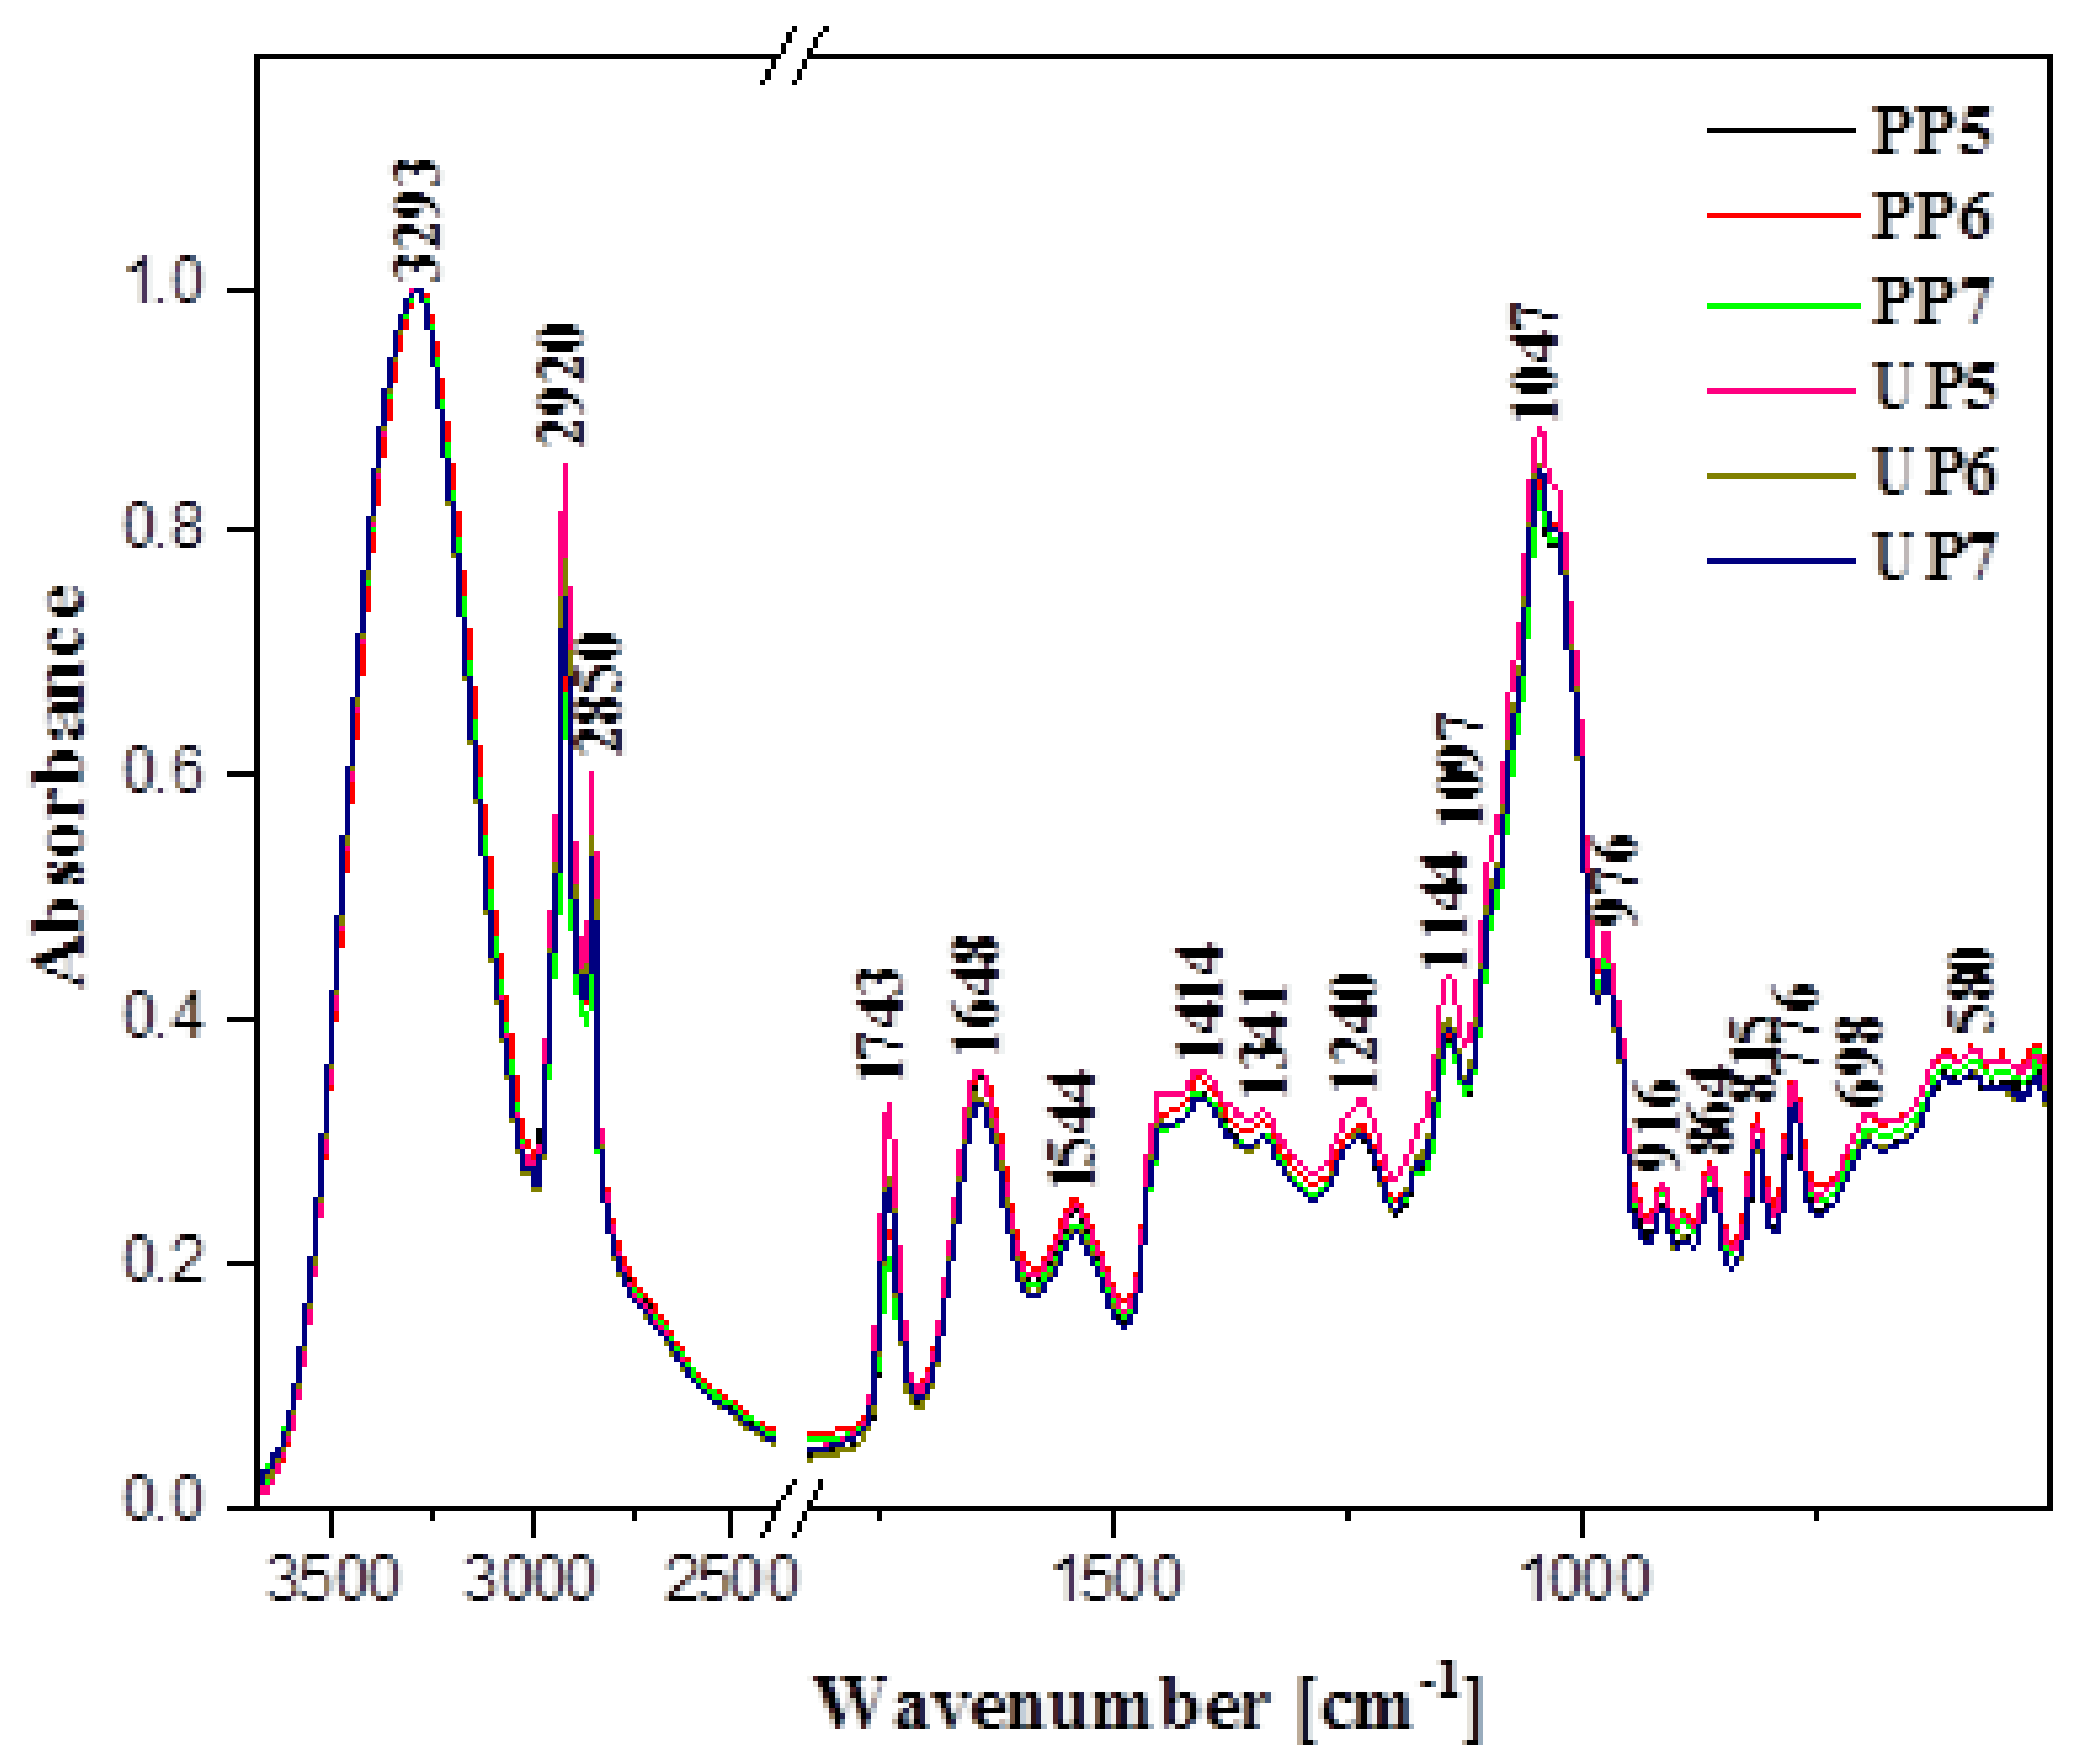
| FTIR | Type and Origin of Vibrations | |||||
|---|---|---|---|---|---|---|
| Positioning of Band [cm−1] | ||||||
| PP5 | PP6 | PP7 | UP5 | UP6 | UP7 | |
| 3285 | 3285 | 3289 | 3293 | 3293 | 3293 | νst (O-H) in H2O |
| 2953 | 2953 | 2952 | 2953 | 2951 | 2951 | νs+as (C-H) in CH2 and CH3 groups in both carbohydrates and fatty acids |
| 2918 | 2918 | 2918 | 2920 | 2920 | 2920 | |
| 2870 | 2870 | 2872 | 2869 | 2870 | 2870 | |
| 2849 | 2850 | 2850 | 2850 | 2850 | 2850 | |
| 1742 | 1742 | 1742 | 1743 | 1743 | 1743 | ν (C=O) |
| 1728 | 1728 | 1728 | 1727 | 1727 | 1727 | ν (C=O)…OH |
| 1649 | 1649 | 1649 | 1648 | 1649 | 1648 | δvw(-OH) and νvw(-C=C-) |
| 1544 | 1544 | 1544 | 1544 | 1544 | 1544 | νvw(-C=C-) |
| 1452 | 1452 | 1452 | 1452 | 1452 | 1452 | δ (-O-CH) and δ (-C-C-H) |
| 1414 | 1414 | 1414 | 1414 | 1414 | 1414 | δst (O-H) in C-OH group + δ (C-H) |
| 1376 | 1376 | 1376 | 1376 | 1376 | 1376 | δ (-OH) in C-OH group and ν(-C-H, -CH3) and deformation |
| 1340 | 1340 | 1340 | 1341 | 1341 | 1341 | |
| 1241 | 1241 | 1241 | 1238 | 1241 | 1238 | νm(-C-O) or δm(-CH2-) ν (C-H) in carbohydrates |
| 1144 | 1144 | 1144 | 1144 | 1144 | 1144 | ν (C-H) in carbohydrates and ν (C-O) in C-O-C group and νst (C-C) in the carbohydrate structure |
| 1097 | 1097 | 1097 | 1097 | 1097 | 1097 | |
| 1047 | 1047 | 1047 | 1048 | 1048 | 1048 | |
| 1028 | 1028 | 1028 | 1030 | 1030 | 1030 | |
| 976 | 976 | 976 | 976 | 976 | 976 | νst (C-C) in the carbohydrate structure, δ (C-H) |
| 963 | 963 | 963 | 964 | 964 | 964 | |
| 916 | 916 | 916 | 916 | 916 | 916 | |
| 892 | 892 | 892 | 892 | 892 | 892 | ν (C-C) in the carbohydrate structure, δ (C-H) |
| 864 | 864 | 864 | 864 | 864 | 864 | |
| 815 | 815 | 815 | 815 | 815 | 815 | |
| 776 | 776 | 776 | 776 | 776 | 776 | |
| 698 | 698 | 698 | 698 | 698 | 698 | |
Publisher’s Note: MDPI stays neutral with regard to jurisdictional claims in published maps and institutional affiliations. |
© 2022 by the authors. Licensee MDPI, Basel, Switzerland. This article is an open access article distributed under the terms and conditions of the Creative Commons Attribution (CC BY) license (https://creativecommons.org/licenses/by/4.0/).
Share and Cite
Nazarewicz, S.; Kozłowicz, K.; Kobus, Z.; Gładyszewska, B.; Matwijczuk, A.; Ślusarczyk, L.; Skrzypek, T.; Sujka, M.; Kozłowicz, N. The Use of Ultrasound in Shaping the Properties of Ice Cream with Oleogel Based on Oil Extracted from Tomato Seeds. Appl. Sci. 2022, 12, 9165. https://doi.org/10.3390/app12189165
Nazarewicz S, Kozłowicz K, Kobus Z, Gładyszewska B, Matwijczuk A, Ślusarczyk L, Skrzypek T, Sujka M, Kozłowicz N. The Use of Ultrasound in Shaping the Properties of Ice Cream with Oleogel Based on Oil Extracted from Tomato Seeds. Applied Sciences. 2022; 12(18):9165. https://doi.org/10.3390/app12189165
Chicago/Turabian StyleNazarewicz, Sybilla, Katarzyna Kozłowicz, Zbigniew Kobus, Bożena Gładyszewska, Arkadiusz Matwijczuk, Lidia Ślusarczyk, Tomasz Skrzypek, Monika Sujka, and Natalia Kozłowicz. 2022. "The Use of Ultrasound in Shaping the Properties of Ice Cream with Oleogel Based on Oil Extracted from Tomato Seeds" Applied Sciences 12, no. 18: 9165. https://doi.org/10.3390/app12189165