
Influence of Refractive Index Differences on the Signal Strength for Raman-Spectroscopic Measurements of Double Emulsion Droplets


1
CeMOS—Center for Mass Spectrometry and Optical Spectroscopy, Mannheim University of Applied Science, Paul-Wittsack-Straße 10, 68163 Mannheim, Germany
2
Institute of Process Engineering in Life Science, Chair I: Food Process Engineering, Karlsruhe Institute of Technology, Kaiserstraße 12, 76131 Karlsruhe, Germany
*
Authors to whom correspondence should be addressed.
Appl. Sci. 2022, 12(18), 9056; https://doi.org/10.3390/app12189056
Submission received: 21 July 2022
/
Revised: 2 September 2022
/
Accepted: 4 September 2022
/
Published: 8 September 2022
Abstract
:Double emulsions show great potential for encapsulating active substances and protecting them against external influences. However, they tend to become unstable during storage. Research on double emulsions, therefore, focuses on maintaining their microstructure during their shelf life. Optical measurement methods, such as Raman spectroscopy, have hardly been used to date to analyze the microstructure of double emulsions, mainly due to multiple scattering effects. This study investigates the influence of refractive index matching of double emulsion phases by measuring the Raman signal strength of the inner water phase for different refractive index combinations. Ammonium nitrate and glycerol are added to the inner and outer water phase, respectively, to change the refractive indices of both phases. Additionally, polyvinyl alcohol serves as an emulsifier in the outer water phase. The oil phase consists of silicone oil and Dowsil Resin XR 0497 as the emulsifier. The refractive index of the oil phase is kept constant. For individual phase boundaries of single droplets, the refractive index matching plays a minor role. However, if there are many droplets with correspondingly numerous phase boundaries, which leads to multiple scattering during the measurement, the matching has a significant influence on the signal strength of the inner phase. When measuring double emulsions, the phases should always be matched, as this results in higher signals and improves the sensitivity of the measurement.
1. Introduction
Emulsions are widely used in food, pharmaceutical, and chemical industry [1]. Compared to homogeneous systems, emulsions are more complex regarding their structure and resulting properties [2]. Their higher complexity arises from various parameters, such as the size distribution of the inner droplet phase and the interfacial properties, as well as the compositions of each phase [3]. The requirements for the measurement techniques used are therefore high. The interfaces between the phases can be especially challenging [4,5].
To monitor chemical reactions, optical measurement technologies are a widely used tool [6]. Raman spectroscopy has started to play a more important role during recent years [7]. In industry, Raman spectroscopy is used to monitor emulsion polymerization processes [8], to ensure food quality [9,10] and for the development of new pharmaceuticals [11].
One major advantage of Raman spectroscopy is its high selectivity for molecular bonds [12]. Furthermore, the intensity of the Raman signal correlates with the concentration of the sample [12]. Both characteristics suggest that Raman spectroscopy is ideally suited for measuring heterogeneous systems such as emulsions.
However, a special problem arises when measuring emulsions [13]. The interface between the continuous phase and the dispersed phase leads to elastic scattering of the incident light [14]. This is because the refractive indices of the disperse and continuous phases differ. This results in refraction and reflection at the interfaces [15]. Due to these effects, the light does not enter the emulsion droplets unhindered, but is scattered away from the primary direction. Depending on the measuring device, this effect leads to strong disturbances in the measurement process and makes interpretation of the results more difficult.
The strength of the reflections can be quantified using the reflectance R [15]. To calculate the reflectance, two cases, the reflectance of perpendicular polarized light Rper and parallel polarized light Rpar, need to be considered. The equations for both parameters can be derived from the Fresnel’s formula. In the following, the case of the same magnetic permeability of the emulsion phases, which is generally valid for emulsions, is shown
To determine the reflectance for non-polarized light, the mean value [15] of the perpendicular and parallel polarization needs to be calculated.
For the special case of perpendicular polarized light, α = β = 0°, which results in cosine functions of 1 and simplifies the formula [15] as follows:
Due to the high disperse phase fractions of more than 70% commonly found in emulsions [16], multiple scattering occurs caused by the numerous phase interfaces [13]. An important role is played by the refractive index difference: the phase ratio and the droplet size distribution; and also by the geometry of the incident light, its focusing at the focal point and other imaging conditions.
This challenge is increased further when the microstructure of double emulsions has to be evaluated. Double emulsions are emulsions within emulsions, i.e., complex multiphase systems in which both water-in-oil (W/O) and oil-in-water (O/W) emulsions exist simultaneously [17]. The most common case is a water-in-oil-in-water (W/O/W) emulsion, where one to innumerable water (W1) droplets are dispersed within oil (O) droplets, which form an emulsion themselves by being dispersed within the second water (W2) phase [18].
One key advantage of the double emulsion structure is the ability to encapsulate active or sensitive substances [19], as e.g., enzymes, vitamins or crop protection agents. The middle phase can be solidified and used as a protective shell [20]. In addition, the release of encapsulated substances can be controlled precisely, which is particularly beneficial for encapsulated active ingredients in drugs [21]. Furthermore, WOW double emulsions are used to reduce the fat content in foods [22].
On an industrial scale, double emulsions are produced using classical methods, such as rotor-stator machines [18]. Here, the inner emulsion is produced under high energy input, resulting in very small W1 droplets [23]. The second emulsification step is carried out at lower energy input so that the inner emulsion is affected as little as possible [24]. Industrial emulsification methods have the disadvantage of producing wide droplet size distributions [25].
Microfluidic systems offer the chance to provide nearly monodisperse droplet size distributions [26]. It uses miniscule channels to produce emulsions in laminar flow profiles [27]. For double emulsions, glass capillary devices have proven to be very useful [28]. However, the fabrication of a single device is costly and difficult to reproduce [29]. Therefore, an optimized glass capillary device has recently been developed [30]. It follows the same emulsification principle but is much easier to manufacture and can also be modified during operation [31]. It offers the possibility of producing double emulsions, having a wide range of internal and external droplets in terms of size and degree of filling, both parameters being independently variable [10].
Due to their complex structure, double emulsions tend to undergo various instability mechanisms [32]. Besides diffusional losses of encapsulated water or actives, inner as well as outer droplets may coalesce with each other, or inner droplets may coalesce with the outer water phase.
Improving the stability of double emulsions is the focus of many research groups today [18]. However, research is limited as e.g., real-time measurement of structure-related parameters, as inner and outer droplet size distributions, and their filling degree, is extremely challenging. Usually, to measure those parameters, non-real-time measurement methods, such as dynamic and static scattered light methods [18], differential scanning calometry [33], or nuclear magnetic resonance NMR spectroscopy [34], are used. Those methods are usually performed offline and require sample preparation. Furthermore, the measured emulsion sample is usually unusable for other measurements.
Therefore, there is a need for a new measurement method suitable for double emulsions, which can be performed in- or online to deliver real-time results without sample preparation and which does not affect the double emulsion [35].
Raman spectroscopy fulfils these requirements. Furthermore, because of its high selectivity and its suitability for water [36], it is expected that each double emulsion phase can be detected individually. The only challenge for Raman measurements of double emulsion, will be multiple light scattering, caused by different refractive indices of the three double emulsion phases.
Thus, the scope of this work is to investigate whether the method of refractive index matching creates the possibility to suppress the cross-influences resulting from phase boundaries in Raman measurements of double emulsions and the effect of refractive index differences between the three double emulsion phases on the Raman signal strength. Therefore, the signal of the inner water phase is measured using Raman spectroscopy, while the refractive indices of the inner and outer water phases are varied. It is expected that the signal strength of the inner water phase increases as the differences between the refractive indices of the inner water phase, the oil phase and the outer water phase, decrease.
Furthermore, the work investigates the possibility to compensate refractive index differences by mathematical corrections via simple functional relationships.
We found one publication with a similar scope, which is about the molecular mapping of multiple emulsions using coherent anti-Stokes Raman scattering (CARS) microscopy [37].
2. Materials and Methods
2.1. Emulsions System
With a view to Raman spectroscopy, ammonium nitrate (CarlRoth, Karlsruhe, Germany) is additionally used as a tracer in the inner water phase. M10 silicone oil (CarlRoth, Karlsruhe, Germany) serves as the oil phase. As the emulsifier, 2% Dowsil Resin XR 0497 (DowCorning, Midland, MI, USA) is added therein. The outer water phase consists of 2% polyvinyl alcohol Kuraray Poval 26–80 (Kovayal, Hattersheim am Main, Germany) and glycerol.
In total, forty different W/O/W double emulsions are investigated. All of the different emulsions phases are listed in Table 1. To achieve this, all eight outer water phases are combined with all five inner water phases.
Table 1 lists the refractive indices of all emulsion phases. They were determined in triplicate with a digital refractometer (Type: ORF 1RS, KERN Optics, Bahlingen, Germany). The refractive index of the oil phase serves as a reference for the water phases. The smallest deviation between all refractive indices is found for the combination of 49% ammonium nitrate and 49% glycerol.
2.2. Raman Measurement
The RNX1-532 Raman spectrometer (Kaiser Optical Systems, INC., Ann Arbor, MI, USA) is used for the Raman measurements. It is equipped with a laser at a wavelength of 532 nm and a laser power of 150 mW. The associated backscatter probe (Kaiser NCO-0.5-VIS) irradiates the sample with a half-inch lens, producing a focal diameter of 55 µm with a focal length of 500 µm.
Spectra of all phases have been measured, see Figure 1. These were measured at 1s integration time with 3 accumulations in a standard spectroscopy cuvette (Type: 100-10-40, Hellma Analytics, Müllheim, Germany), allowing the spectra to be quantitatively compared. Ammonium nitrate shows one dominating peak in the fingerprint region [38] at 1047 cm−1 [39], which is the highest peak of all phases in this area. The oil phase has only minor peaks in the shorter shifted fingerprint region at 489 cm−1 and 707 cm−1 [40], while the outer water phase shows multiple smaller peaks in the range between 800 cm−1 to 1200 cm−1 which are attributable to glycerol [41]. Specifically, there is a peak at 1060 cm−1, which overlaps significantly with the ammonium nitrate peak at 1047 cm−1. Therefore, a baseline correction is applied in the evaluation to reduce the influence of glycerol.
For the different concentrations of both water phases, the linearity of the peak height at 1047 cm−1 (ammonium nitrate) and 1060 cm−1 (glycerol) is investigated. The respective Pearson coefficients are R2 = 0.992 (ammonium nitrate) and R2 = 0.983 (glycerol).
For the baseline correction, the two endpoints are determined from a spectrum of ammonium nitrate solution. These are located at 1030 cm−1 and 1060 cm−1. First, the total integral is calculated in this range. Subsequently, the slope of the baseline is determined using the measured values at 1030 cm−1 and 1060 cm−1 and the integral between the x-axis and the baseline is calculated. The difference of the two integrals gives the integral of the baseline corrected ammonium nitrate peak.
To measure a significant number of droplets per experiment, each experimental set is measured for 400 s in total. This time is divided into five individual measurements of 80 s, which in turn are divided into 4 accumulations of 20 s. In the end, five spectra are obtained of each experimental set, which are combined into one data point.
2.3. Emulsification
The double emulsion was produced in a two-step process, using different emulsification techniques. First, five different W1/O emulsion were produced with the rotor-stator system “Megatron MT3000” (Kinematica AG, Malters, Switzerland) using a two row gear ring at a rotational speed of 20,000 min−1 (circumferential speed = 27.2 m/s) for 90 s. These emulsions serve as the inner emulsion in the subsequently produced double emulsions.
The droplet size distribution of the emulsions with 16%, 24%, 33% and 61% ammonium nitrate was measured by static laser light scattering using a particle analyzer HORIBA LA-950 (Microtrac Retsch GmbH, Haan, Germany). The Sauter mean diameter of the inner emulsions are in the range of 2.07 µm (33% ammonium nitrate) to 2.67 µm (16% ammonium nitrate). The respective droplet size distributions are shown in Figure 2. The emulsion containing 49% ammonium nitrate in the water phase could not be measured as a result of the similar refractive indices. Since all other emulsions show similar droplet size distributions, it is assumed that the droplet sizes do not deviate in this set.
Figure 3 shows the five different inner emulsions. The emulsions become more and more transparent with the increasing concentration of dissolved ammonium nitrate. At the best matching (ΔN = 0.002 at 49% ammonium nitrate), the emulsion is optically clear. At 61% ammonium nitrate, the optimum is exceeded, and the emulsion appears milky.
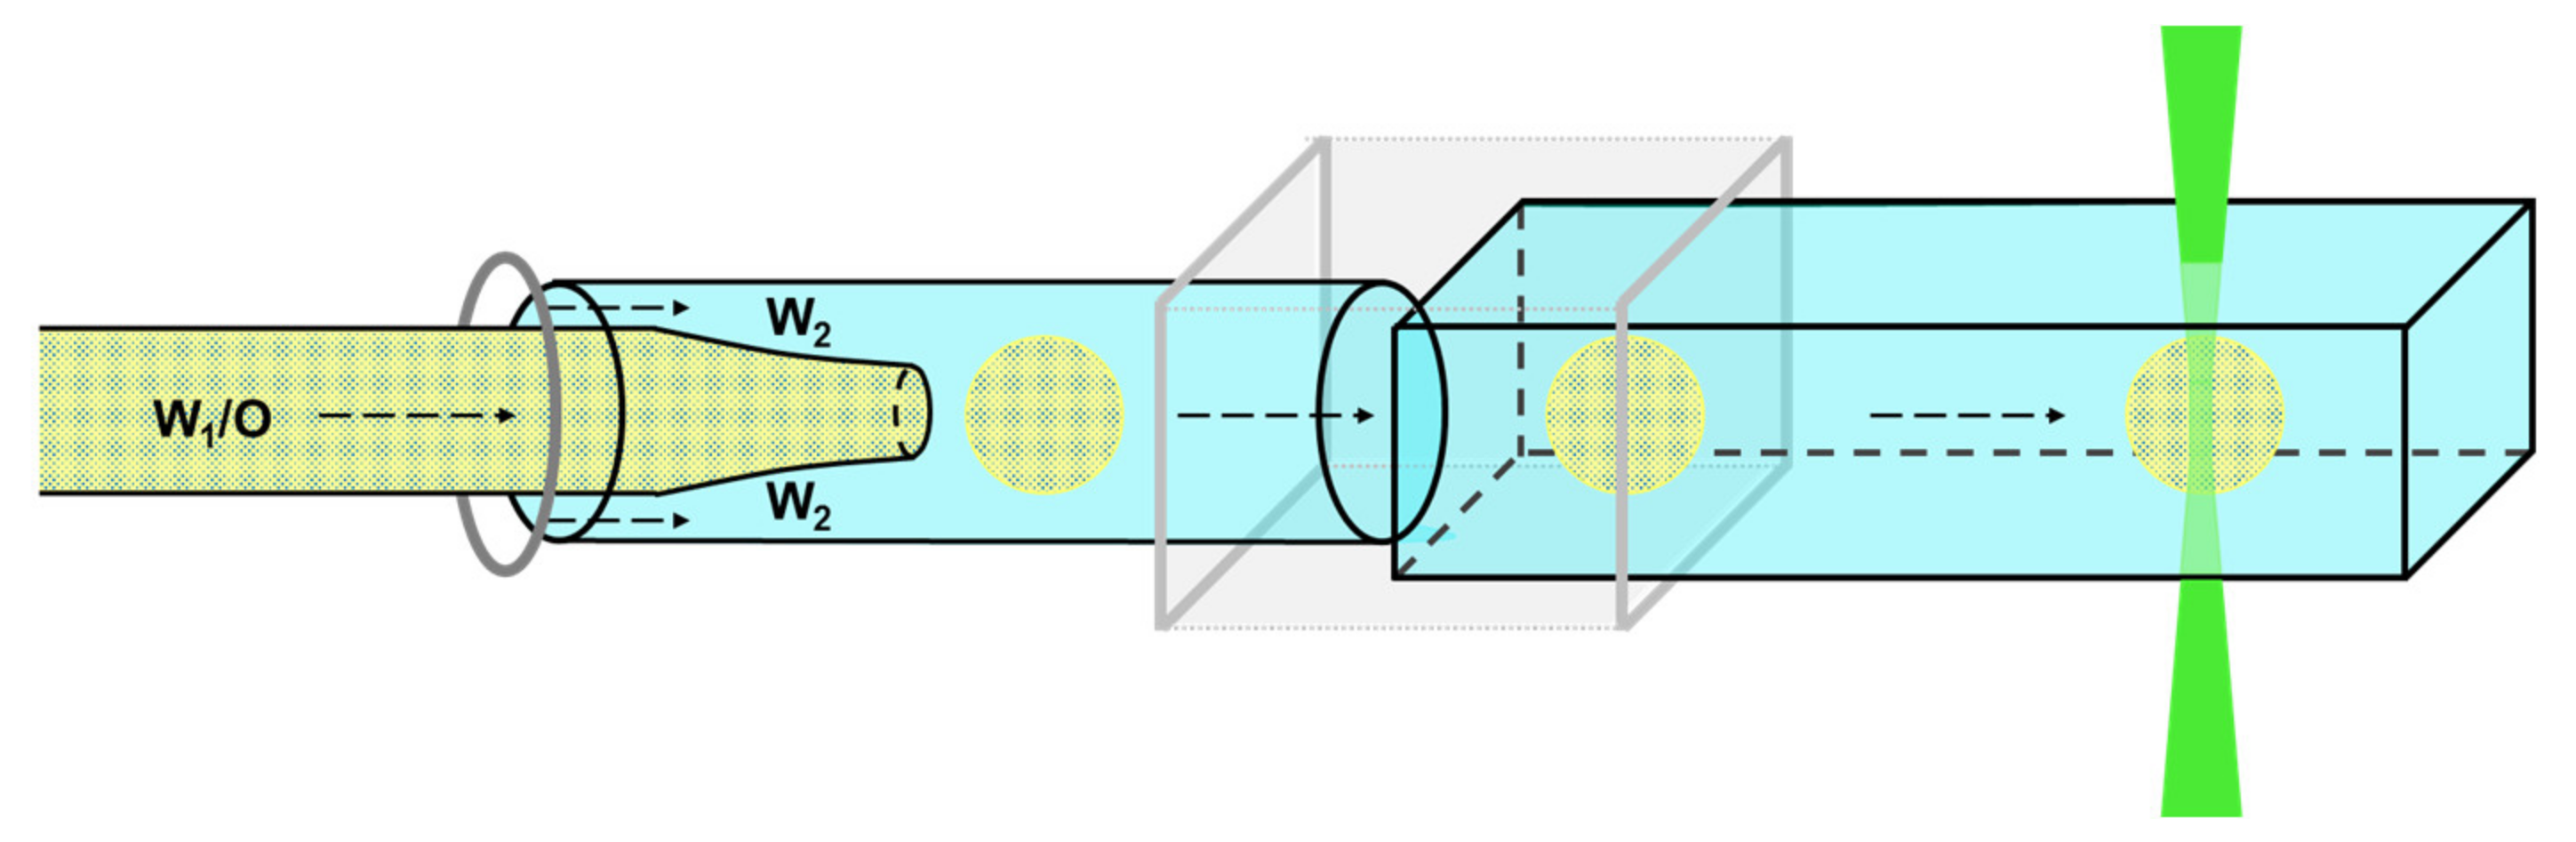
In order to obtain monodispersed W1/O droplets in a double emulsion, these inner emulsions were then emulsified in the outer water phase using a microfluidic glass capillary system [30]. The glass capillaries used are placed in two Teflon blocks, which are connected to each other by a plug-in connection. Syringe pumps (Legato 100, kdScientific Inc., Holliston, MA, USA) were used to inject the inner W1/O emulsions and the outer water phases into the microfluidic device. The inner emulsion was pumped at 2 mL/h and the outer water phase at 10 mL/h. This leads to a droplet breakup rate of 3 Hz to 5 Hz with a droplet diameter of 1.15 mm. Figure 4 shows a double emulsion droplet flowing through the larger squared capillary.
The microfluidic device is designed in a co-flow system, i.e., the inner emulsion and the outer phase flow parallel to each other. When both phases come into contact, the inner emulsion breaks up into droplets in the outer phase. Since the breakup to the double emulsion takes place in a round borosilicate glass capillary (ID: 1.12 mm, WPI, Sarasota, FL, USA), a square quartz capillary (ID: 1.00 mm, CM Scientific Ltd., Silsden, UK) is connected to the round capillary via an internally designed 3D-printed nylon adapter. For online Raman measurements, a square quartz capillary was mounted. Thus, neither the capillary material nor its curvature has a negative influence on the Raman measurement. A schematic of this setup is shown in Figure 5. On the right side, the conical, green, vertical bar indicates the laser beam for Raman excitation. It is emitted by the backscatter probe, which also detects the Raman signal.
2.4. Set of Experiments
Five sets of experiments have been carried out. In each set, a different inner emulsion was investigated. The inner emulsions differ in their ammonium nitrate concentration and filling degree. Both parameters are calculated to ensure that the same mass of ammonium nitrate is present in the inner emulsion in all sets. The oil phase remains identical in its composition during all measurements. Only its amount is adjusted depending on the filling degree. The outer phase is varied during the test series by adjusting the glycerol content between 0% and 70%.
Table 2 shows the individual experiments with the respective concentrations of ammonium nitrate and filling degrees. In addition, the amounts of the inner phase, which are emulsified in the Megatron, and the resulting mass of ammonium nitrate in the individual inner emulsions are listed. Each emulsion contains almost exactly 6 g of ammonium nitrate, thus fulfilling the fundamental idea of this set of experiments.
3. Results
3.1. Influence of the Refractive Index Matching on the Raman Signal
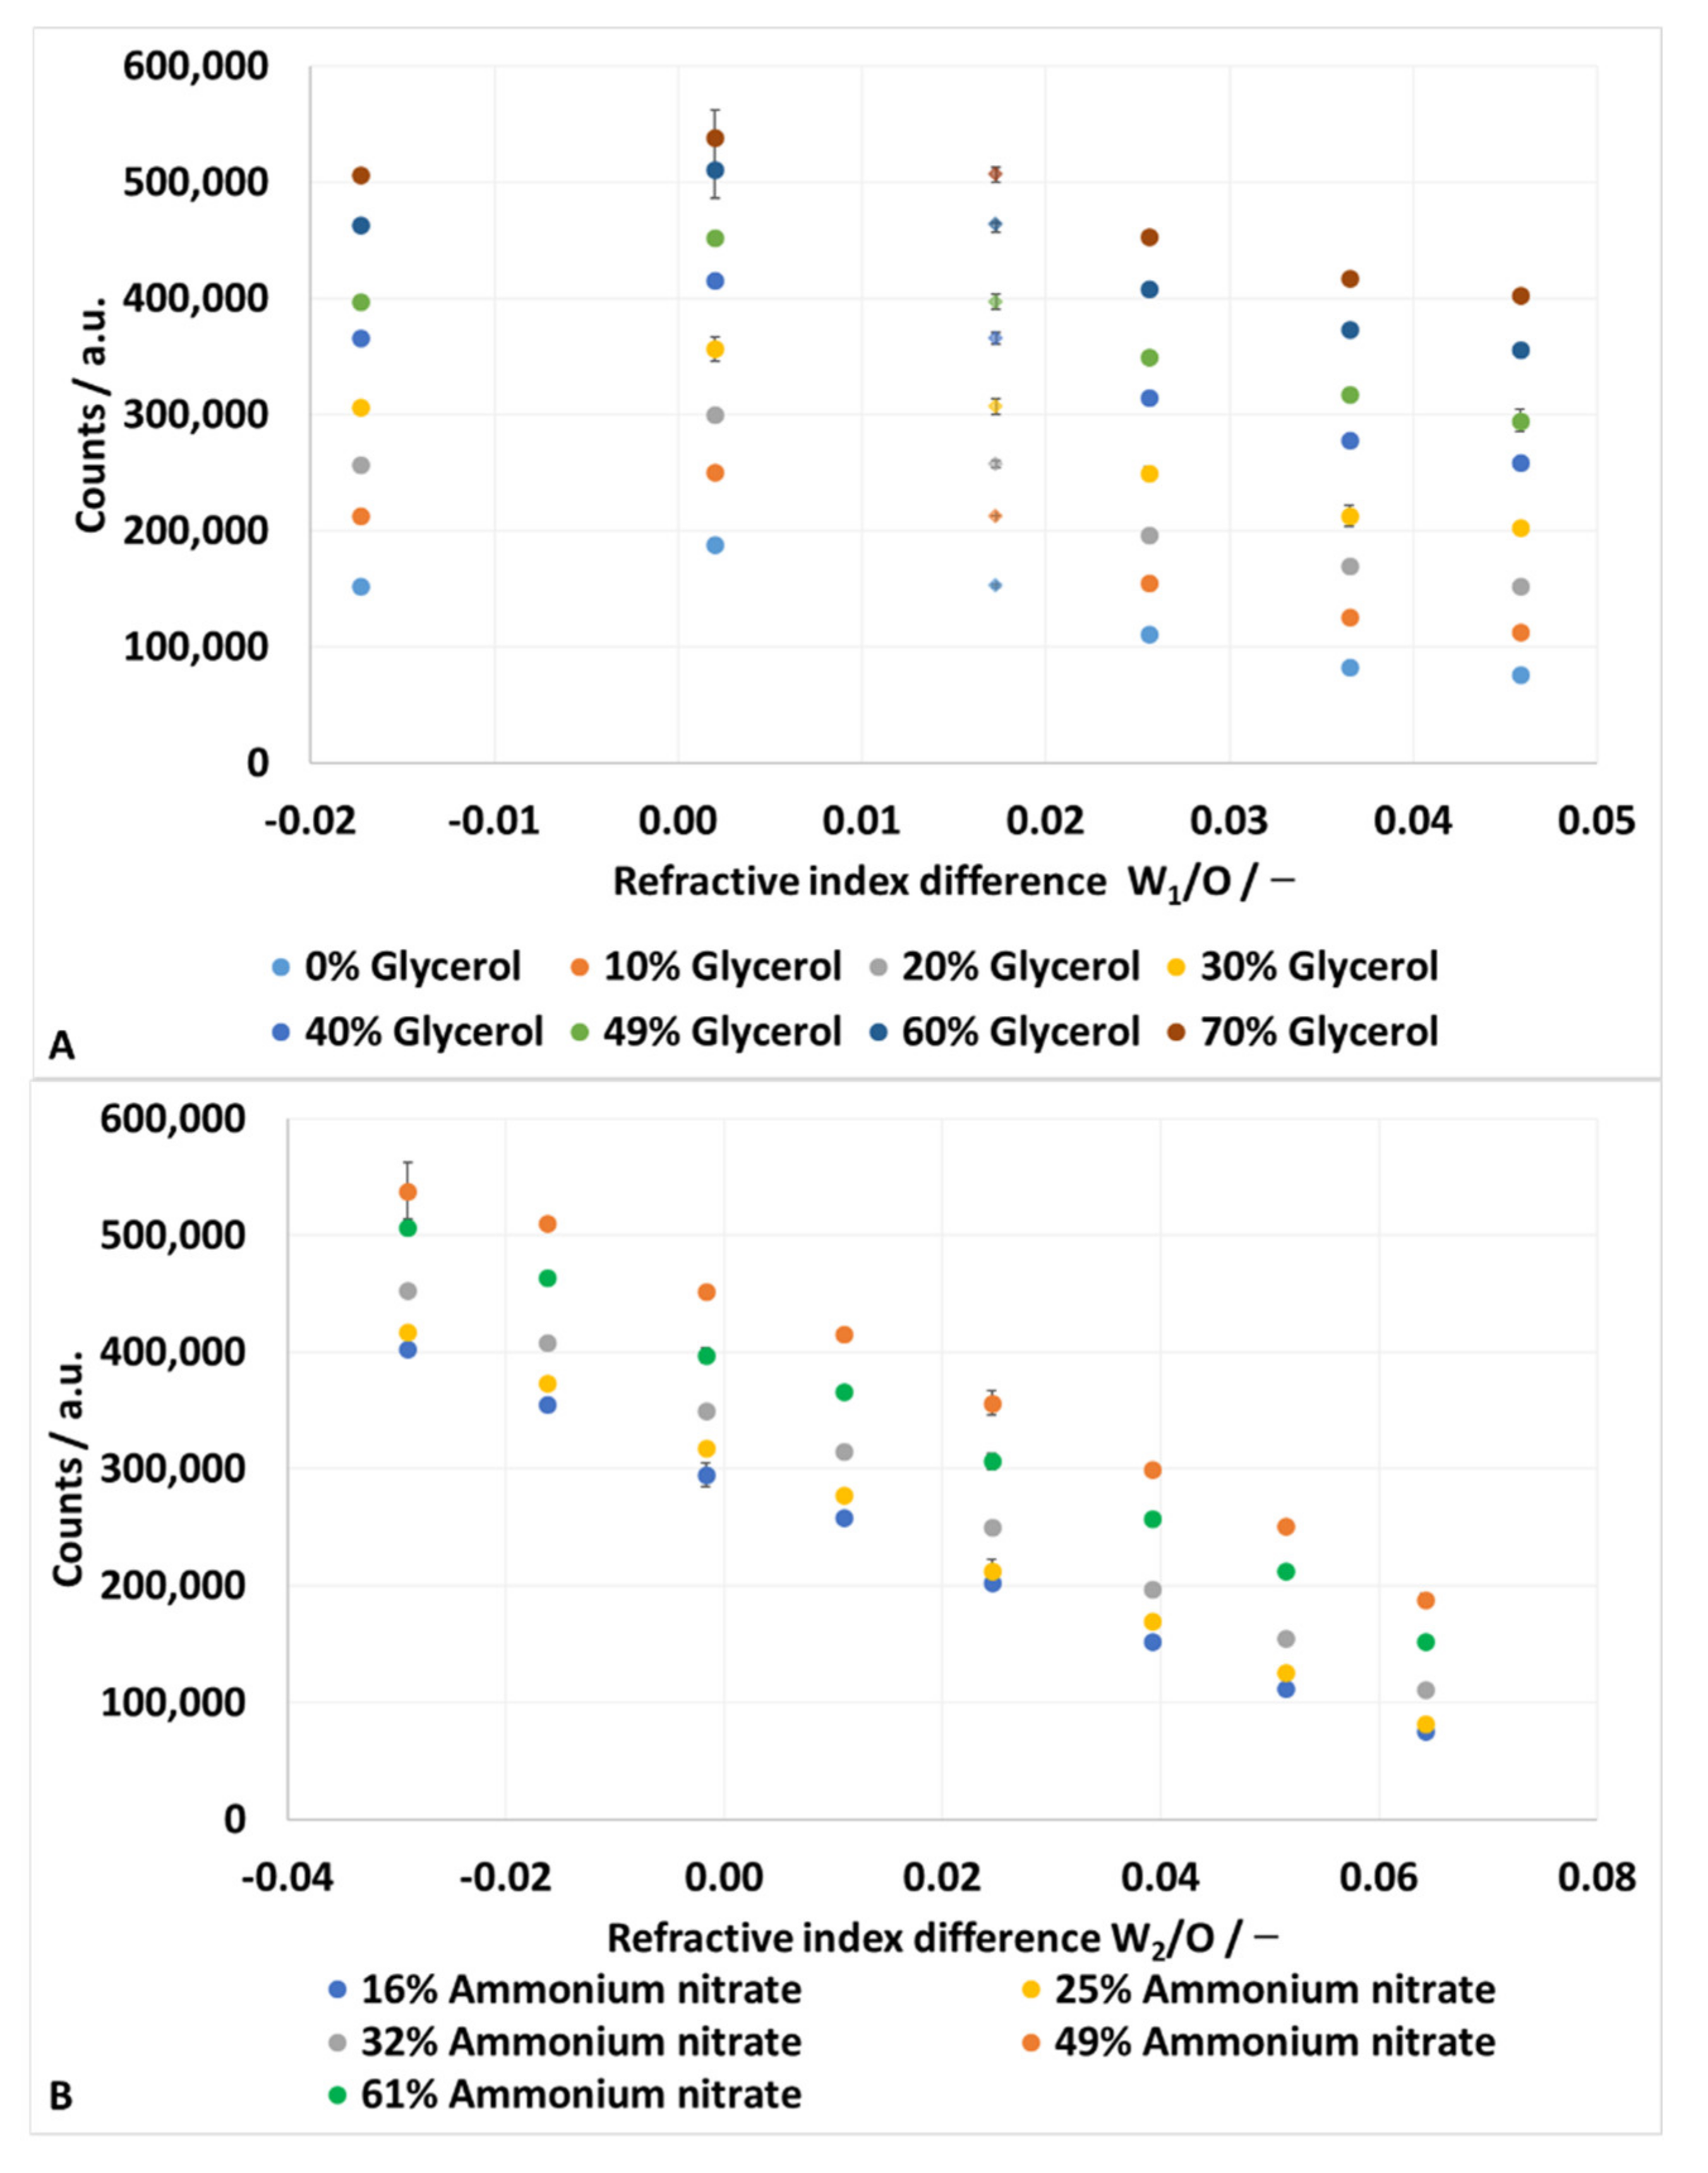
Figure 6 show the results of the set of experiments, each as a function of the refractive index differences between the inner water and oil phase and the outer water and oil phase, respectively.
In Figure 6A, each column of data points represents one ammonium nitrate concentration. Thereby, the ammonium nitrate concentration decreases from left (61%) to right (16%). The only exemption is the column at ΔN = 0.0173 (diamonds instead of circles). The ammonium nitrate concentration of this column is 61%. For this column, the signals are plotted over the absolute refractive index difference to illustrate the linear dependency between the signal and the refractive index difference. The linear trend lines for each glycerol concentration have Pearson coefficients of more than R2 = 0.95.
The emulsions with 49% ammonium nitrate, respectively the smallest refractive index difference, show the highest signals within a constant glycerol concentration. When the refractive index difference increases, in both positive and negative directions, the signal gets weaker. Within one column, the signal increases with increasing glycerol concentration.
In Figure 6B, each column of data points represents one glycerol concentration, and the concentration decreases from left (70%) to right (0%). The signals decrease with decreasing glycerol concentration. Within one column, the signal increases with increasing ammonium nitrate concentration. The exception is the ammonium nitrate concentration of 61% (green dots). It is past the point of best matching and the values are below the maximum. The maximum is at 49% ammonium nitrate (orange dots) and is the best matching.
Furthermore, the measured values show a linear dependence on the glycerol concentration. The Pearson coefficients of the linear trend lines of all glycerol concentrations are all above R2 = 0.99.
3.2. Linear Multiple Regression
For emulsions whose refractive indices cannot be adjusted, a simple 2-parametric function is computed to provide correction results. Therefore, a multiple linear regression was performed using a spreadsheet. All measured data points, 200 in total, are included in this regression. The result is the following equation:
The Pearson coefficient of this equation is R2 = 0.99, with a standard error of 12,568.54. Using Equation (6), the calculated results for the signal strengths of the inner water phases are in the range of 51,947.13 (0% glycerol and 16% ammonium nitrate) to 548,373.31 (70% glycerol and 49% ammonium nitrate), with most of the calculated signal strength being above 100,000. That means, compared to the calculated signal strengths, the relative standard error is between 24% and 2%, but mostly less than 10%. This, in turn, means the discrepancy between the regression and measured values are mostly less than 10%, which indicates a good correlation between the regression and measured values. Therefore, the regression is suitable to compensate for refractive index differences, mathematically.
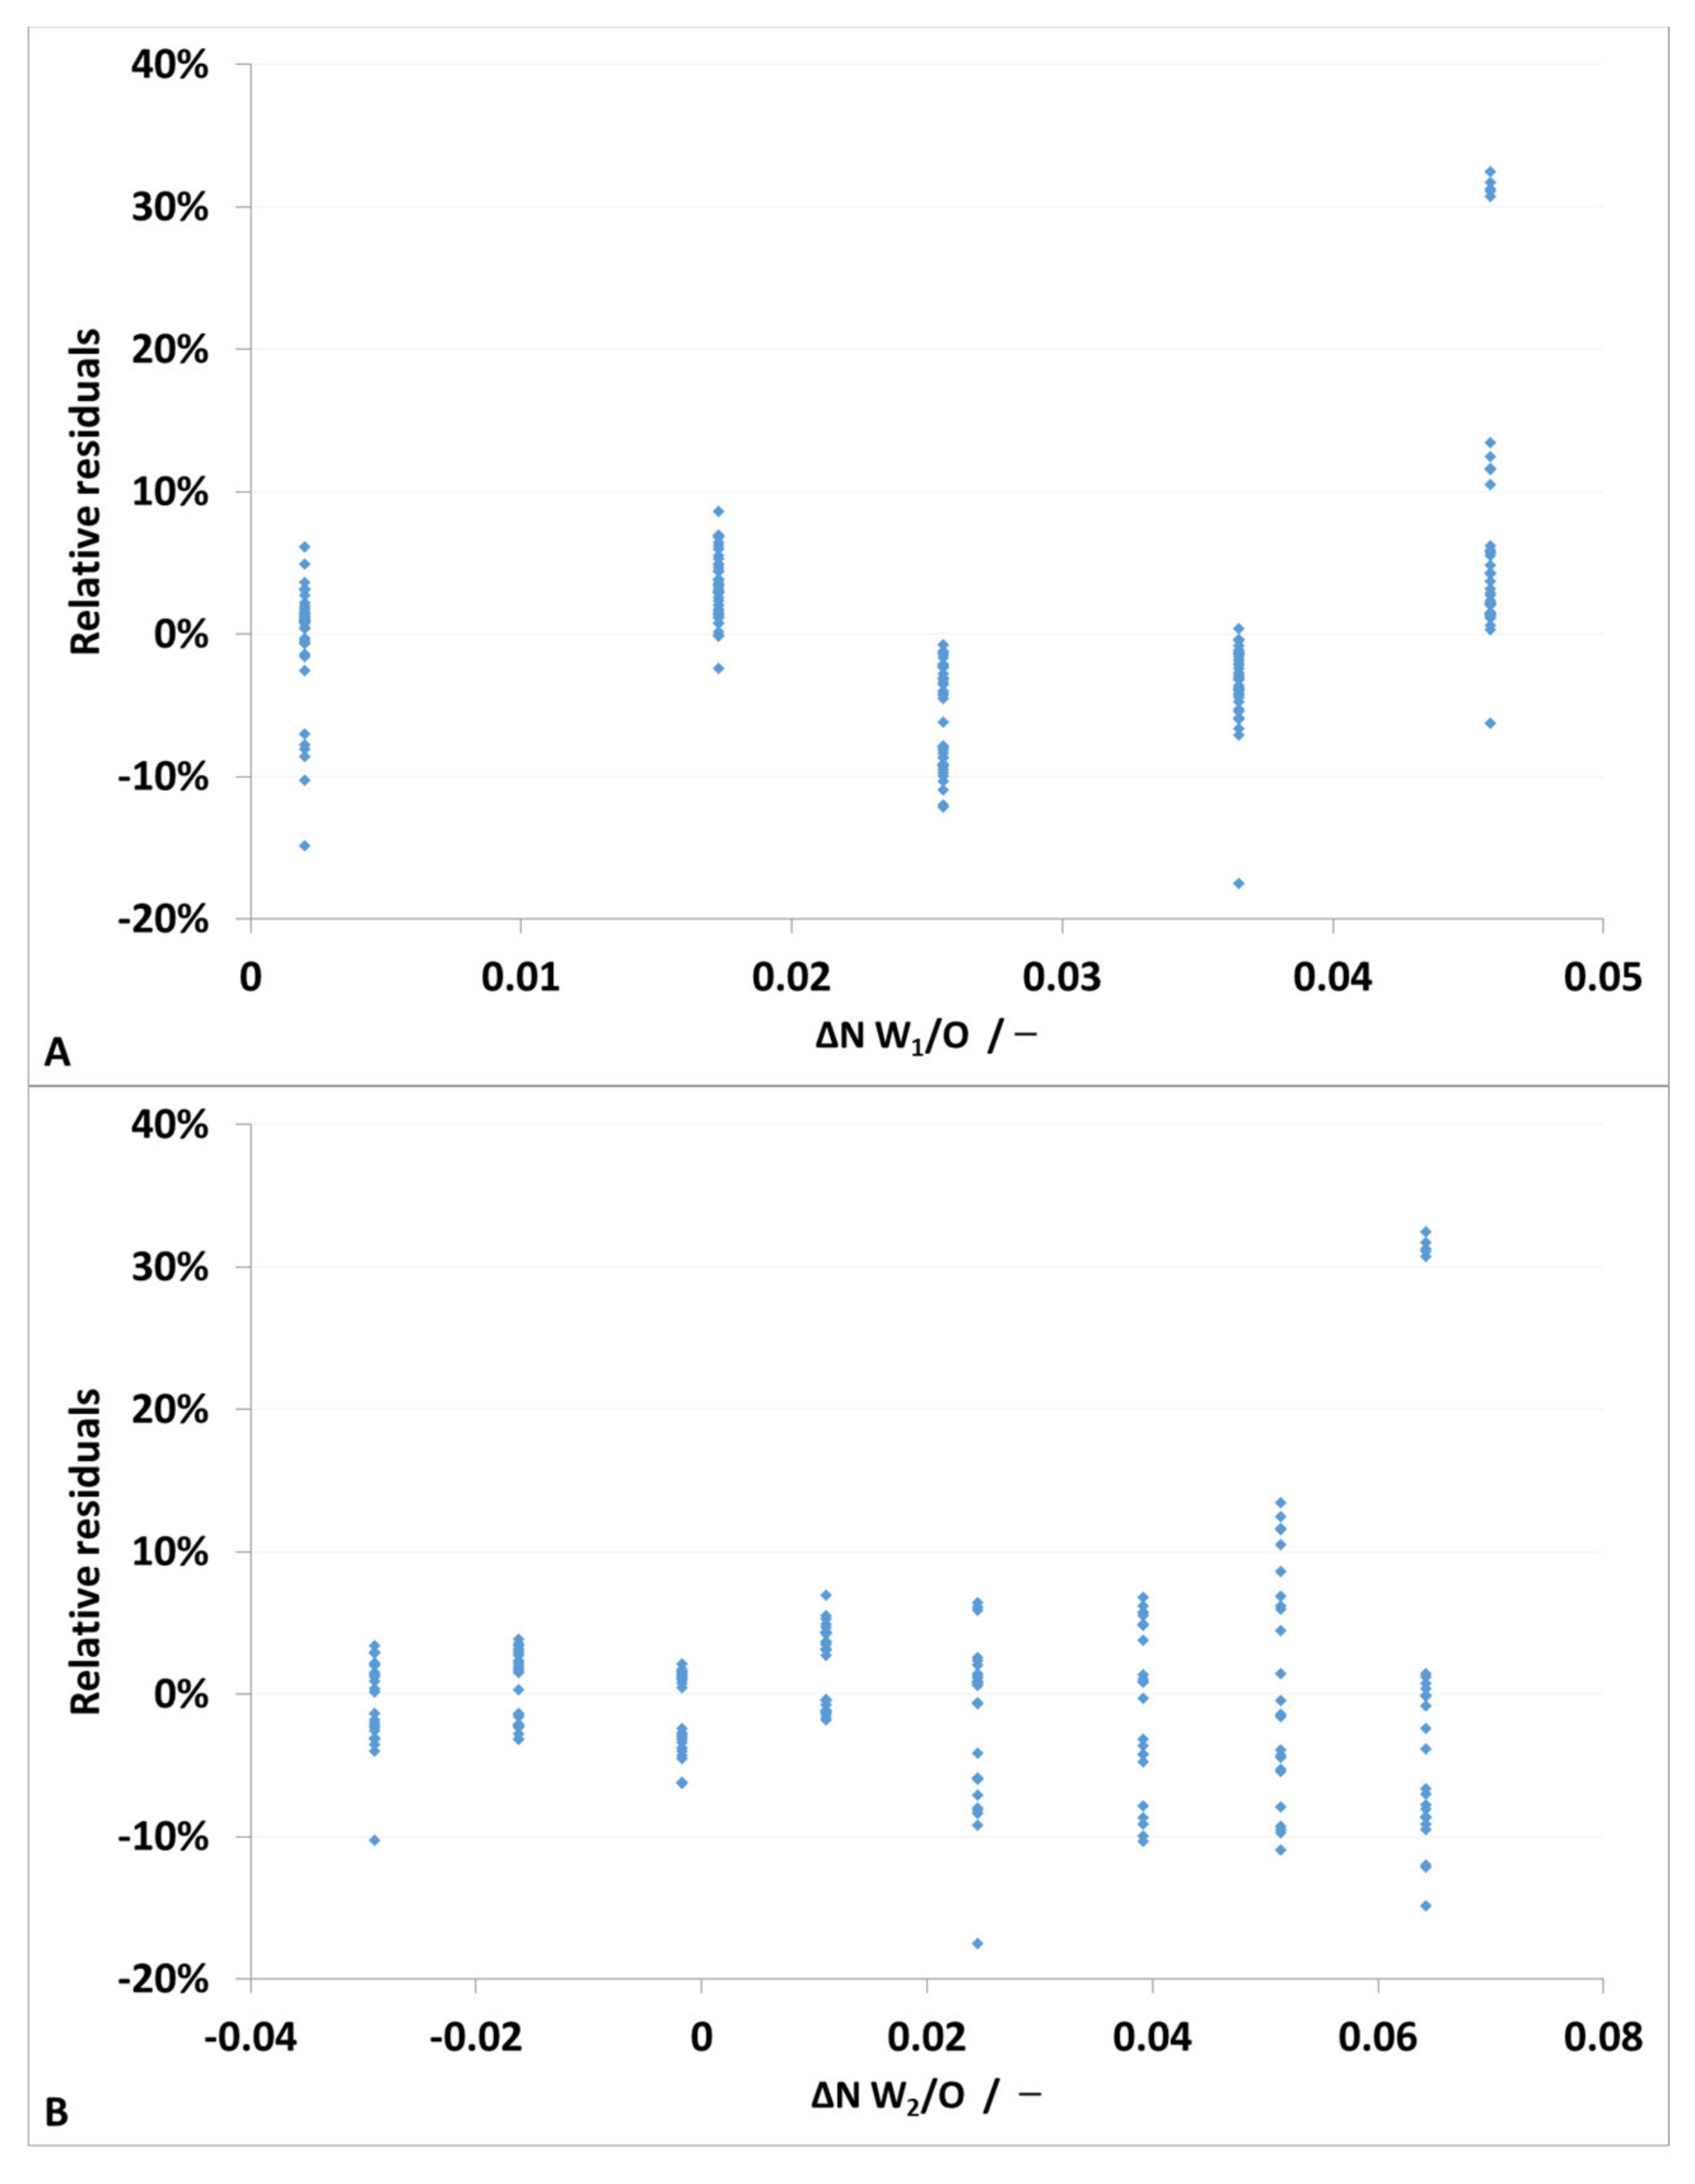
To further test the goodness of correlation, the relative residuals were considered in relation to the corresponding measured values, see Figure 7.
In general, the residuals show larger values at low concentrations of ammonium nitrate and glycerol. By far the largest deviation is found at 0% glycerol (ΔN W2/O = 0.0642) and 16% ammonium nitrate (ΔN W1/O = 0.0458). In Figure 6B, this data point is the lowest one in the right column. In this column, the data point of 16% ammonium nitrate is too high and overlaps with the data point of 25% ammonium nitrate. This means, the spread of the ammonium nitrate concentration in this column is smaller compared to the other columns. The correlation, in turn, assumes an approximately equal spread within the individual ammonium nitrate concentrations. However, there is no justification for this deviation from the raw data. The five individual measurements of this concentration combination have a variance of 0.96%.
Overall, 80% of the relative residuals are in the range of −8% to +6%. The average relative deviation of the individual residuals is 0.16% with a standard deviation of 7.15%. Both underline the high accuracy of the correlation.
4. Discussion
The experiment is designed to measure the double emulsion droplets individually. This means, one after another the double emulsion droplets pass through the laser, which runs constantly during the measurement. This ensures that the measurement of one droplet is not influenced by another one.
When light is irradiated into highly filled double emulsions, multiple scattering occurs at the interfaces. This results in a weak signal of the inner phase. Figure 6 shows that the light’s ability to reach the inner water phase, represented by the signal of ammonium nitrate, depends on the refractive index matching.
To interpret the results, we start from a single droplet. The light enters the drop, which acts as a converging lens when the refractive index of the outer phase is low. The more the refractive index of the outer phase increases, and thus the refractive index difference becomes smaller, the lower the reflectance at the phase interface. This can be calculated using Equations (1)–(4).
In the case of a double emulsion, the incident light is somewhat focused by the first phase boundary. In the oil droplet, it strikes the inner phase, whose refractive index relative to the oil phase was varied in the experiments. The experiments are designed so that the total amount of ammonium nitrate is constant. If the inner phase always allows all of the light to pass, the displayed ammonium nitrate signal should remain constant for all measurements.
As expected, the ammonium nitrate signal increases with increasing ammonium nitrate concentration, respectively lowering the refractive index difference and reaching its maximum at 49% ammonium nitrate; the best matching. At 61% ammonium nitrate, the refractive index difference is larger, and respectively, the signal is smaller.
A similar behavior is seen with the variation of the glycerol concentration. The measured values increase with increasing glycerol content, respectively decreasing the refractive index difference. However, they continue to increase above the best matching at 49% glycerol.
To explain both observations, the reflectance during each experiment are considered. These are shown in Table 3. The reflectance at an incidence angle of 0° is calculated using Equation (4), and for 45° using Equation (3).
To estimate the reflectance in the case of multiple scattering, the following equation, derived by the authors, is used. It is assumed that reflected radiation is lost and one phase interface is passed after the other.
Each oil droplet contains numerous inner water droplets. Therefore, a correspondingly large number of phase passes of the incident light occur here. With only 1000 water droplets, the reflectance increases significantly. Table 3 shows that for 16% ammonium nitrate and 1000 phase passes, the reflectance is 24.08% (0°) and 44.64% (45°), respectively. In contrast, for 49% ammonium nitrate, the reflectance is 0.09% (0°) and 0.10% (45°). In other words, matching the refractive indices of the inner water and oil phases reduces the reflectance by a factor of 279.95 (0°) and 437.50 (45°). Therefore, the matching of the inner phase boundaries has a significant effect on the measurement signal.
There is only one phase boundary between the outer water phase and the oil droplet. Accordingly, the reflectance is calculated for one phase transition. In the worst case, for 0% glycerol and a 45° angle of incidence, the reflectance is 0.12%. At 49%, practically no light is reflected at the phase interface. This indicates a negligible influence of the external matching. In addition, Figure 6 shows that there is always approximately 100,000 counts difference between 16% and 49% ammonium nitrate, regardless of the glycerol concentration. Accordingly, there is no influence of the external matching here either. Furthermore, the signal increases linearly with increasing glycerol concentration. This can most likely be explained by the overlap of the ammonium nitrate and glycerol peaks, which cannot be completely separated using a baseline correction.
5. Conclusions
The presented results indicate that it is advantageous for the application of optical spectroscopic measurement methods to match the refractive indices of the inner phase, thus creating a beam of light of maximum power that enters the inner phase.
It should be noted that the conclusion on the matching of the outer phase is valid for single drop measurements. If several double emulsion drops are measured simultaneously, e.g., in a beaker, it can be assumed that the matching of the outer phase has a similar influence as that of the inner phase.
This work shows that Raman spectroscopy offers an opportunity to determine microstructural parameters in double emulsions in situ. With the aid of this measurement technology, the influences of formulation or process parameters on the structure and stability of emulsions, for example, can be investigated quickly and easily in future.
Author Contributions
Conceptualization, T.H., M.R. and H.P.K.; methodology, T.H.; validation, T.H. and M.R.; investigation, T.H.; resources, M.R. and H.P.K.; data curation, T.H.; writing—original draft preparation, T.H. and M.R.; writing—review and editing, T.H. and H.P.K.; visualization, T.H.; supervision, M.R. and H.P.K.; project administration, T.H; funding acquisition, T.H. All authors have read and agreed to the published version of the manuscript.
Funding
The article processing charge was funded by the Baden-Württemberg Ministry of Science, Research and Culture and the Hochschule Mannheim in the funding program Open Access Publishing.
Institutional Review Board Statement
Not applicable.
Informed Consent Statement
Not applicable.
Data Availability Statement
The data presented in this study are openly available in KITopen at 10.5445/IR/1000148866, reference number [1]. The following link can be used to access the data: https://publikationen.bibliothek.kit.edu/1000148866 (accessed on 3 September 2022).
Acknowledgments
The authors thank Goran Vladisavljevic from Loughborough University for the kind donation of the microfluidic device.
Conflicts of Interest
The authors declare no conflict of interest.
References
- Vladisavljević, G.; Al Nuumani, R.; Nabavi, S. Microfluidic Production of Multiple Emulsions. Micromachines 2017, 8, 75. [Google Scholar] [CrossRef]
- Bai, L.; Huan, S.; Rojas, O.J.; McClements, D.J. Recent Innovations in Emulsion Science and Technology for Food Applications. J. Agric. Food Chem. 2021, 69, 8944–8963. [Google Scholar] [CrossRef] [PubMed]
- Schuster, S.; Bernewitz, R.; Guthausen, G.; Zapp, J.; Greiner, A.M.; Köhler, K.; Schuchmann, H.P. Analysis of W1/O/W2 double emulsions with CLSM: Statistical image processing for droplet size distribution. Chem. Eng. Sci. 2012, 81, 84–90. [Google Scholar] [CrossRef]
- Budwig, R. Refractive index matching methods for liquid flow investigations. Exp. Fluids 1994, 17, 350–355. [Google Scholar] [CrossRef]
- Wiederseiner, S.; Andreini, N.; Epely-Chauvin, G.; Ancey, C. Refractive-index and density matching in concentrated particle suspensions: A review. Exp. Fluids 2011, 50, 1183–1206. [Google Scholar] [CrossRef]
- Schalk, R.; Heintz, A.; Braun, F.; Iacono, G.; Rädle, M.; Gretz, N.; Methner, F.-J.; Beuermann, T. Comparison of Raman and Mid-Infrared Spectroscopy for Real-Time Monitoring of Yeast Fermentations: A Proof-of-Concept for Multi-Channel Photometric Sensors. Appl. Sci. 2019, 9, 2472. [Google Scholar] [CrossRef]
- Kudelski, A. Analytical applications of Raman spectroscopy. Talanta 2008, 76, 1–8. [Google Scholar] [CrossRef]
- Elizalde, O.; Leiza, J.R.; Asua, J.M. On-line monitoring of all-acrylic emulsion polymerization reactors by Raman spectroscopy. Macromol. Symp. 2004, 206, 135–148. [Google Scholar] [CrossRef]
- He, H.; Sun, D.-W.; Pu, H.; Chen, L.; Lin, L. Applications of Raman spectroscopic techniques for quality and safety evaluation of milk: A review of recent developments. Crit. Rev. Food Sci. Nutr. 2019, 59, 770–793. [Google Scholar] [CrossRef]
- Zhang, W.; Ma, J.; Sun, D.-W. Raman spectroscopic techniques for detecting structure and quality of frozen foods: Principles and applications. Crit. Rev. Food Sci. Nutr. 2021, 61, 2623–2639. [Google Scholar] [CrossRef]
- Löbenberg, R.; Bou-Chacra, N.A. Raman Spectroscopy for Quantitative Analysis in the Pharmaceutical Industry. J. Pharm. Pharm. Sci. 2020, 23, 24–46. [Google Scholar] [CrossRef]
- Petersen, M.; Yu, Z.; Lu, X. Application of Raman Spectroscopic Methods in Food Safety: A Review. Biosensors 2021, 11, 187. [Google Scholar] [CrossRef]
- Kollhoff, R.T.; Kelemen, K.; Schuchmann, H.P. Local Multiphase Flow Characterization with Micro Particle Image Velocimetry Using Refractive Index Matching. Chem. Eng. Technol. 2015, 38, 1774–1782. [Google Scholar] [CrossRef]
- Schalk, R.; Braun, F.; Frank, R.; Rädle, M.; Gretz, N.; Methner, F.-J.; Beuermann, T. Non-contact Raman spectroscopy for in-line monitoring of glucose and ethanol during yeast fermentations. Bioprocess. Biosyst. Eng. 2017, 40, 1519–1527. [Google Scholar] [CrossRef] [PubMed]
- Kortüm, G. Reflectance Spectroscopy: Principles, Methods, Applications; Springer International Publishing: Cham, Switzerland, 2020. [Google Scholar]
- Tan, C.; McClements, D.J. Application of Advanced Emulsion Technology in the Food Industry: A Review and Critical Evaluation. Foods 2021, 10, 812. [Google Scholar] [CrossRef]
- Khan, A.Y.; Talegaonkar, S.; Iqbal, Z.; Ahmed, F.J.; Khar, R.K. Multiple emulsions: An overview. Curr. Drug Deliv. 2006, 3, 429–443. [Google Scholar] [CrossRef]
- Muschiolik, G.; Dickinson, E. Double Emulsions Relevant to Food Systems: Preparation, Stability, and Applications. Compr. Rev. Food Sci. Food Saf. 2017, 16, 532–555. [Google Scholar] [CrossRef]
- Wang, W.; Zhang, M.-J.; Chu, L.-Y. Microfluidic approach for encapsulation via double emulsions. Curr. Opin. Pharmacol. 2014, 18, 35–41. [Google Scholar] [CrossRef]
- Datta, S.S.; Abbaspourrad, A.; Amstad, E.; Fan, J.; Kim, S.-H.; Romanowsky, M.; Shum, H.C.; Sun, B.; Utada, A.S.; Windbergs, M.; et al. 25th anniversary article: Double emulsion templated solid microcapsules: Mechanics and controlled release. Adv. Mater. 2014, 26, 2205–2218. [Google Scholar] [CrossRef]
- Iqbal, M.; Zafar, N.; Fessi, H.; Elaissari, A. Double emulsion solvent evaporation techniques used for drug encapsulation. Int. J. Pharm. 2015, 496, 173–190. [Google Scholar] [CrossRef]
- Muschiolik, G. Multiple emulsions for food use. Curr. Opin. Colloid Interface Sci. 2007, 12, 213–220. [Google Scholar] [CrossRef]
- Schuch, A.; Wrenger, J.; Schuchmann, H.P. Production of W/O/W double emulsions. Part II: Influence of emulsification device on release of water by coalescence. Colloids Surf. A Physicochem. Eng. Asp. 2014, 461, 344–351. [Google Scholar] [CrossRef]
- Schuch, A.; Tonay, A.N.; Köhler, K.; Schuchmann, H.P. Influence of the second emulsification step during production of W/O/W multiple emulsions: Comparison of different methods to determine encapsulation efficiency in W/O/W emulsions. Can. J. Chem. Eng. 2014, 92, 203–209. [Google Scholar] [CrossRef]
- Leister, N.; Vladisavljević, G.T.; Karbstein, H.P. Novel glass capillary microfluidic devices for the flexible and simple production of multi-cored double emulsions. J. Colloid Interface Sci. 2022, 611, 451–461. [Google Scholar] [CrossRef] [PubMed]
- Theberge, A.B.; Courtois, F.; Schaerli, Y.; Fischlechner, M.; Abell, C.; Hollfelder, F.; Huck, W.T.S. Microdroplets in microfluidics: An evolving platform for discoveries in chemistry and biology. Angew. Chem. Int. Ed. Engl. 2010, 49, 5846–5868. [Google Scholar] [CrossRef]
- Teh, S.-Y.; Lin, R.; Hung, L.-H.; Lee, A.P. Droplet microfluidics. Lab Chip 2008, 8, 198–220. [Google Scholar] [CrossRef]
- Utada, A.S.; Lorenceau, E.; Link, D.R.; Kaplan, P.D.; Stone, H.A.; Weitz, D.A. Monodisperse double emulsions generated from a microcapillary device. Science 2005, 308, 537–541. [Google Scholar] [CrossRef]
- Nabavi, S.A.; Vladisavljević, G.T.; Gu, S.; Ekanem, E.E. Double emulsion production in glass capillary microfluidic device: Parametric investigation of droplet generation behaviour. Chem. Eng. Sci. 2015, 130, 183–196. [Google Scholar] [CrossRef]
- Bandulasena, M.V.; Vladisavljević, G.T.; Benyahia, B. Versatile reconfigurable glass capillary microfluidic devices with Lego® inspired blocks for drop generation and micromixing. J. Colloid Interface Sci. 2019, 542, 23–32. [Google Scholar] [CrossRef]
- Nabavi, S.A.; Vladisavljević, G.T.; Bandulasena, M.V.; Arjmandi-Tash, O.; Manović, V. Prediction and control of drop formation modes in microfluidic generation of double emulsions by single-step emulsification. J. Colloid Interface Sci. 2017, 505, 315–324. [Google Scholar] [CrossRef] [Green Version]
- Leister, N.; Karbstein, H.P. Evaluating the Stability of Double Emulsions—A Review of the Measurement Techniques for the Systematic Investigation of Instability Mechanisms. Colloids Interfaces 2020, 4, 8. [Google Scholar] [CrossRef]
- Schuch, A.; Köhler, K.; Schuchmann, H.P. Differential scanning calorimetry (DSC) in multiple W/O/W emulsions. J. Therm. Anal. Calorim. 2013, 111, 1881–1890. [Google Scholar] [CrossRef]
- Bernewitz, R.; Dalitz, F.; Köhler, K.; Schuchmann, H.P.; Guthausen, G. Characterisation of multiple emulsions by NMR spectroscopy and diffusometry. Microporous Mesoporous Mater. 2013, 178, 69–73. [Google Scholar] [CrossRef]
- Goldrick, S.; Lovett, D.; Montague, G.; Lennox, B. Influence of Incident Wavelength and Detector Material Selection on Fluorescence in the Application of Raman Spectroscopy to a Fungal Fermentation Process. Bioengineering 2018, 5, 79. [Google Scholar] [CrossRef] [PubMed]
- Nachtmann, M.; Deuerling, J.; Rädle, M. Molecule Sensitive Optical Imaging and Monitoring Techniques-A Review of Applications in Micro-Process Engineering. Micromachines 2020, 11, 353. [Google Scholar] [CrossRef] [PubMed]
- Meyer, T.; Akimov, D.; Tarcea, N.; Chatzipapadopoulos, S.; Muschiolik, G.; Kobow, J.; Schmitt, M.; Popp, J. Three-dimensional molecular mapping of a multiple emulsion by means of CARS microscopy. J. Phys. Chem. B 2008, 112, 1420–1426. [Google Scholar] [CrossRef]
- Saletnik, A.; Saletnik, B.; Puchalski, C. Overview of Popular Techniques of Raman Spectroscopy and Their Potential in the Study of Plant Tissues. Molecules 2021, 26, 1537. [Google Scholar] [CrossRef]
- Diaz, D.; Hahn, D.W. Raman spectroscopy for detection of ammonium nitrate as an explosive precursor used in improvised explosive devices. Spectrochim. Acta A Mol. Biomol. Spectrosc. 2020, 233, 118204. [Google Scholar] [CrossRef]
- Erckens, R.J.; Hosseini, K.; March, W.F.; Jongsma, F.H.M.; Wicksted, J.P.; Li, H.K.; Hendrikse, F. Raman spectroscopy: Noninvasive determination of silicone oil in the eye: Potential applications for intraocular determination of biomaterials. Retina 2002, 22, 796–799. [Google Scholar] [CrossRef]
- Mendelovici, E.; Frost, R.L.; Kloprogge, T. Cryogenic Raman spectroscopy of glycerol. J. Raman Spectrosc. 2000, 31, 1121–1126. [Google Scholar] [CrossRef]
Figure 1.
Raman spectra of all phases. For the inner and outer water phase, only the lowest and highest concentrations of ammonium nitrate and glycerol are shown.
Figure 1.
Raman spectra of all phases. For the inner and outer water phase, only the lowest and highest concentrations of ammonium nitrate and glycerol are shown.

Figure 2.
Droplet size distribution of the inner emulsions.

Figure 3.
The investigated W1/O emulsions with the respective ammonium nitrate (AN) concentrations.

Figure 4.
An individual double emulsion droplet flowing through the squared capillary. The scale bar is equal to 1 mm.
Figure 4.
An individual double emulsion droplet flowing through the squared capillary. The scale bar is equal to 1 mm.

Figure 5.
Scheme of the capillary system including the measuring point.

Figure 6.
Results of the experiments presented as a function of refractive index differences between the oil phase and the inner water phase (A) and the outer water phase (B).
Figure 6.
Results of the experiments presented as a function of refractive index differences between the oil phase and the inner water phase (A) and the outer water phase (B).

Figure 7.
Residues as a function of refractive index difference between the inner water and oil phase (A) and the outer water and oil phase (B).
Figure 7.
Residues as a function of refractive index difference between the inner water and oil phase (A) and the outer water and oil phase (B).


Table 1.
Summary of the refractive indices for each phase. Each mean value is based on three measurements. Each set of measurements has a standard deviation of less than 0.0001. ΔN is the difference between the refractive index of the oil phase compared to the water phases.
Table 1.
Summary of the refractive indices for each phase. Each mean value is based on three measurements. Each set of measurements has a standard deviation of less than 0.0001. ΔN is the difference between the refractive index of the oil phase compared to the water phases.
| Phase | Mean Value | ΔN | |
|---|---|---|---|
| W2 | 00.00% Glycerin | 1.3385 | 0.0642 |
| 10.00% Glycerin | 1.3513 | 0.0514 | |
| 20.01% Glycerin | 1.3635 | 0.0392 | |
| 30.01% Glycerin | 1.3782 | 00245 | |
| 40.00% Glycerin | 1.3917 | 0.0110 | |
| 49.04% Glycerin | 1.4044 | −0.0017 | |
| 60.00% Glycerin | 1.4189 | −0.0162 | |
| 70.00% Glycerin | 1.4317 | −0.0290 | |
| O | 2.02% Dowsil Resin XR 0497 | 1.4027 | |
| W1 | 16.33% Ammonium nitrate | 1.3569 | 0.0458 |
| 24.50% Ammonium nitrate | 1.3662 | 0.0365 | |
| 32.46% Ammonium nitrate | 1.3771 | 0.0256 | |
| 48.91% Ammonium nitrate | 1.4007 | 0.0020 | |
| 61.25% Ammonium nitrate | 1.4200 | −0.0173 | |
Table 2.
Survey of the test series with corresponding weights and concentrations.
| Set of Experiment | |||||
|---|---|---|---|---|---|
| #1 | #2 | #3 | #4 | #5 | |
| Filling degree/w-% | 8.17 | 10.21 | 15.31 | 20.40 | 30.61 |
| Ammonium nitrate concentration/w-% | 61.25 | 48.91 | 32.46 | 24.50 | 16.33 |
| Amount W1/g | 36.731 | 24.482 | 18.366 | 12.257 | 9.811 |
| Amount ammonium nitrate/g | 6.01 | 6.00 | 5.96 | 6.00 | 6.00 |
Table 3.
Reflectance between the water phases and the oil phase. For the inner phases, the reflectance for multiple scattering of 1000 phase transitions is calculated.
Table 3.
Reflectance between the water phases and the oil phase. For the inner phases, the reflectance for multiple scattering of 1000 phase transitions is calculated.
| Glycerol/w-% | Single Interface Transition | Multiple Scattering | ||
|---|---|---|---|---|
| 0° | 45° | 0° | 45° | |
| 0% | 0.05% | 0.12% | ||
| 10% | 0.03% | 0.08% | ||
| 20% | 0.02% | 0.04% | ||
| 30% | 0.01% | 0.02% | ||
| 40% | 0.00% | 0.00% | ||
| 50% | 0.00% | 0.00% | ||
| 60% | 0.00% | 0.01% | ||
| 70% | 0.01% | 0.02% | ||
| Ammonium nitrate/w-% | ||||
| 16% | 0.03% | 0.06% | 24.08% | 44.64% |
| 24% | 0.02% | 0.04% | 15.95% | 30.74% |
| 32% | 0.01% | 0.02% | 8.13% | 16.16% |
| 49% | 0.00% | 0.00% | 0.09% | 0.10% |
| 61% | 0.00% | 0.01% | 3.69% | 7.07% |
Publisher’s Note: MDPI stays neutral with regard to jurisdictional claims in published maps and institutional affiliations. |
© 2022 by the authors. Licensee MDPI, Basel, Switzerland. This article is an open access article distributed under the terms and conditions of the Creative Commons Attribution (CC BY) license (https://creativecommons.org/licenses/by/4.0/).
Share and Cite
MDPI and ACS Style
Hufnagel, T.; Rädle, M.; Karbstein, H.P. Influence of Refractive Index Differences on the Signal Strength for Raman-Spectroscopic Measurements of Double Emulsion Droplets. Appl. Sci. 2022, 12, 9056. https://doi.org/10.3390/app12189056
AMA Style
Hufnagel T, Rädle M, Karbstein HP. Influence of Refractive Index Differences on the Signal Strength for Raman-Spectroscopic Measurements of Double Emulsion Droplets. Applied Sciences. 2022; 12(18):9056. https://doi.org/10.3390/app12189056
Chicago/Turabian StyleHufnagel, Thomas, Matthias Rädle, and Heike P. Karbstein. 2022. "Influence of Refractive Index Differences on the Signal Strength for Raman-Spectroscopic Measurements of Double Emulsion Droplets" Applied Sciences 12, no. 18: 9056. https://doi.org/10.3390/app12189056
Note that from the first issue of 2016, this journal uses article numbers instead of page numbers. See further details here.