
Spin Probes as Scavengers of Free Radicals in Cells
by
 , , , and
Bernadeta Dobosz
1,* ,
,
Ryszard Krzyminiewski
1,
Małgorzata Kucińska
2,
Marek Murias
2 ,
,
Grzegorz Schroeder
3 and
Joanna Kurczewska
3 1
Medical Physics and Radiospectroscopy Division, Faculty of Physics, Adam Mickiewicz University, Uniwersytetu Poznańskiego 2, 61-614 Poznan, Poland
2
Department of Toxicology, Poznan University of Medical Sciences, Dojazd 30, 60-631 Poznan, Poland
3
Faculty of Chemistry, Adam Mickiewicz University, Uniwersytetu Poznańskiego 8, 61-614 Poznan, Poland
*
Author to whom correspondence should be addressed.
Appl. Sci. 2022, 12(16), 7999; https://doi.org/10.3390/app12167999
Submission received: 23 June 2022
/
Revised: 4 August 2022
/
Accepted: 5 August 2022
/
Published: 10 August 2022
(This article belongs to the Special Issue Advances in Electron Spin Resonance (ESR) Spectroscopy)
Abstract
:Spin probes can be used to monitor biological membranes, including the penetration of different molecules into cells. The aim of the present studies was an investigation of the endocytosis process of two spin labels—2,2,6,6-Tetramethylpiperidine-1-oxyl (TEMPO) and 4-hydroxy-TEMPO (TEMPOL)—into yeast cells and a leukemia cell line (HL-60, ATCC CCL-240) by Electron Spin Resonance (ESR). The ESR method is helpful for the direct detection of free radicals. The cell incubation and endocytosis of spin probes were carried out at 310 K. In contrast, the ESR measurements of yeast cells and a leukemia cell line with spin probes were at 240 K. Spectral differentiation was observed; hence, the spin probes present in suspension and attached to the cell membrane could be distinguished. The ESR signal changes of spin probes depended on spin probe concentration, cell number, and type of cell (healthy/cancerous). Additionally, the effect of external factors (oxygen and vitamin C) on the ESR signal decay of spin markers in the cell solution was established. The experimental results prove that the spin probes (TEMPO and TEMPOL) could scavenge free radicals inside the cell. At the same time, the mechanism of spin probe interaction in suspension was determined based on the measurements at low temperatures.
1. Introduction
Reactive oxygen (ROS) and nitrogen (RNS) species in cells are produced as a consequence of exogenous and/or endogenous stimuli [1,2]. The amounts of those species inside cells determine their harmful or beneficial effects [3]. The mitochondrial electron transport chain (ETC) is their primary source in the cell, and ongoing cellular processes are the mitochondrial electron transport chain (ETC) [2,4,5]. The antioxidant defense system controls generating free radicals in a healthy cell [1,6]. The balance between free radicals and their scavengers is critical because free radicals are involved in numerous processes resulting in diseases [4]. Excessive production of free radicals causes the progression of cardiovascular diseases and multiple cancers, including leukemia [2,7,8]. In cells, reactive oxygen species (ROS) are neutralized by antioxidant enzymes–superoxide dismutase, ferritin, and ceruloplasmin—occurring in the cytoplasm and produced by mitochondria catalase—produced by peroxisomes, glutathione peroxidase—produced by mitochondria and present in the cytoplasm. These enzymes are supported by other molecules such as vitamin C, active forms of iron and copper in the cytoplasm, vitamins E, A, and β carotene in organelles’ plasma membrane and cell membrane. An imbalance between free-radical-generating and radical-scavenging systems results in “oxidative stress”. In other words, under physiological conditions, the cell antioxidant defense system guarantees an equilibrium state of reactive oxygen species. In addition, they are also crucial in several physiological functions. However, when the balance between the oxidants and antioxidants is shifted in favor of oxidants, then oxidative stress arises. It can be involved in developing and progressing several serious diseases [9].
Electron spin resonance (ESR) is now the only method for detecting and studying free radicals directly. It is based on the interaction of unpaired electrons (free radicals) with a magnetic field [10,11]. ESR measurement provides information about the concentration of free radicals (quantitative data) and the type of free radicals (qualitative data) [12,13,14]. Free radical concentration is derived from ESR signal intensity, proportional to double integral. A free radical is determined based on a given radical’s hyperfine pattern and g-factor value. The decrease in free radical concentration monitored by ESR spectroscopy proves their decay caused by cell redox processes. This process can be multistep, e.g., through reduction, oxidation, or other reactions. Several nitroxyl radicals were examined as in vivo redox status probes and for radioprotection in biological samples [15,16]. Free radicals are characterized by a very short lifetime. For this reason, spin traps and spin probes are used for their detection [17,18]. The unpaired electrons of the spin probes must pair with the unpaired electrons because only then the ESR signal disappears. Spin probes are a group of substances particularly useful in biological research [19,20,21]. The most used probes are stable nitroxyl radicals, such as 2,2,6,6-Tetramethylpiperidine-1-oxyl (TEMPO) and 4-hydroxy-TEMPO (TEMPOL) [22,23]. Spin probes can be used to investigate biological membranes and the penetration (endocytosis) of different molecules from the external environment into cells [24,25,26,27].
The properties of stable free radical nitroxides are extensively studied. Suy et al. [28] examined the effects of TEMPO and TEMPOL on components of the mitogen-activated protein kinase signal transduction cascade. The compounds caused tyrosine phosphorylation and activation of Raf-1 protein kinase. Their toxicity was different—TEMPO induced apoptotic cell death, while TEMPOL was noncytotoxic. The genotoxicity of structurally similar nitroxides, TEMPO, and its derivatives (4-hydroxy-TEMPO, 4-oxo-TEMPO, and 4-methoxy-TEMPO) were investigated and quantified by Guo et al. [29] using the mouse lymphoma assay (MLA) and Comet assay in L5178Y Tk+/− cells. The results show that all tested nitroxides were cytotoxic and mutagenic in the MLA. In addition, nitroxides can cause DNA-strand breakage. Moreover, Rocha et al. [30] and Ni et al. [31] proved that antioxidant Mito-TEMPO targeting mitochondria might be protective against doxorubicin cardiotoxicity. Interestingly, Akakuru et al. [32] used chitosan-TEMPO-folic acid as a potential alternative to metal-based contrast agents (CAs) as well as an active folate-targeted metal-free CA for long-term longitudinal tumor magnetic resonance imaging (MRI). In addition, TEMPO studies in animal disease models should improve understanding of the cellular mechanisms and origins of abnormalities [33].
In the present research, ESR spectroscopy was used to monitor the endocytosis of selected spin probes (TEMPO and TEMPOL) in yeast and leukemia cells. Moreover, a series of experiments were carried out to investigate the disappearance of free radicals inside cells. The main objective of this study was to compare the effect of spin probe concentration, cell number, time of cell incubation, type of cell, presence of external factors, and the affinity of the compounds studied for aqueous solutions on the endocytosis process manifested by ESR spectra differentiation.
2. Materials and Methods
2.1. Materials
2,2,6,6-Tetramethylpiperidine 1-oxyl (TEMPO), 4-Hydroxy-2,2,6,6-tetramethylpiperidine 1-oxyl (TEMPOL) spin probes (Figure 1), Fluorescein isothiocyanate (FITC), 4-Amino-2,2,6,6-tetramethylpiperidine 1-oxyl (4-amino-TEMPO), and L-Ascorbic acid (Vitamin C) were purchased from Sigma-Aldrich. The powders of spin probes and vitamin C were diluted in distilled water (25 mg in 50 mL) and added appropriately to the cell culture.
A fluorescent spin-probe reagent (TEMPO–Fluorescein, Figure 1) was obtained using the following synthesis procedure. Two methylene chloride solutions (10 mL) of FITC (7.72 mg) and 4-amino-TEMPO (3.48 mg) were prepared separately. Afterward, the solutions were combined and magnetically stirred for 12 h at room temperature. Then, the solvent was evaporated, and the product TEMPO–Fluorescein was obtained. The structure was confirmed using UV-VIS spectroscopy and mass spectrometry.
Bakery yeast (Saccharomyces cerevisiae) (1 g) was diluted in distilled water (50 mL) with the addition of sucrose (0.3 g) and incubated at 37 °C for one hour. Vitamin C was used as a model antioxidant to study its effect on the process of TEMPO entering the cells and its subsequent disappearance. After 1 h, the solutions of the spin probe (3.2 mM TEMPO/2.9 mM TEMPOL) and vitamin C were added to yeast cells, and the incubation was continued. At specific time intervals (15 min), aliquots of the solution were withdrawn for ESR measurements.
The cancer cell research was carried out using the human acute promyelocytic leukemia cell line (HL-60, ATCC CCL-240). Cells were grown in Dulbecco’s Modified Eagle Medium (DMEM) supplemented with 10% (v/v) fetal bovine serum (FBS), 1% (v/v) penicillin (100 U/mL)/streptomycin (100 mg/mL), and 1% (v/v) glutamine (200 mM) at 37 °C in a humidified atmosphere consisting of 5% CO2. All reagents for cell culture were obtained from Sigma Aldrich (St. Louis, MO, USA).
Cells were counted using a hemocytometer, and the viability of cells was assessed by trypan blue exclusion assay. Aliquots of 9 × 10⁶ cells were washed with phosphate buffer saline (PBS), centrifuged, and resuspended in 10 mL of PBS. Then, 10 mL of 3.2 mM TEMPO (2.9 mM TEMPOL) solution was added. The molar concentration of the spin probes did not affect cell multiplication. The cells were kept in an incubator (37 °C, 5% CO2), and the aliquots (1 mL containing 2.4 × 10⁵ cells) were taken every 10 min and immediately frozen in liquid nitrogen.
2.2. Methods
ESR measurements were performed using an X-band Bruker EMX-10 spectrometer with a magnetic field modulation frequency of 100 kHz. The samples were transferred from cells suspension into Pasteur pipettes and measured at 295 K (modulation amplitude 0.01 mT) and 240 K (modulation amplitude 0.1 mT). The ones transferred into the tubes for the measurements at 240 K were frozen without cryoprotectant addition already in the spectrometer using a cryogenic system. The temperature of measurements was controlled using a Bruker temperature controller unit ER 4131VT. The magnetic sweep field range of 8 mT was applied for the sample measurements at 295 K, while for those carried out at 240 K—the magnetic sweep range of 13 and 15 mT was used. The microwave power (MW) was 7.97 mW. Some saturation of the frozen samples, manifested by a small increase in spectrum width, was observed for the microwave power above 50 mW, while for all the samples studied with MW 7.97 mW there were no such effects. The number of averages for each spectrum was nine, while the average time to record each scan was 41.9 s, conversion time was 40.96 ms, and the time constant was 40.96 ms. The concentration of the spin probes studied was calculated from the integrated intensity of appropriate ESR signals with an accuracy of 10%.
To improve ESR spectra resolution and obtain a more detailed analysis, selected ESR spectra were subjected to increasing their resolution by the computer resolution enhancement method (CREM). The method can also improve the signal-to-noise ratio and eliminate high-frequency noise [34]. CREM method was successfully applied in our previous papers [35,36,37,38] and was confirmed by the Electron Nuclear Double Resonance ENDOR method [39]. It is a linear transformation method, and its mathematical fundamentals were described by Hedberg and Ehrenberg [40], Koper and Krzyminiewski [41], and Madisetti and Williams [42]. The details of the CREM procedure were previously described [43]. Briefly, an ESR signal F(x) is treated as a convolution of two functions. One of them informs about the number of lines in the ESR spectrum and their positions and intensities ψ(x′), and the second one K(x−x′), the so-called core, describes the shape of an individual line (Equation (1)):
The correctness and effectiveness of the CREM procedure were confirmed by independent researchers, e.g., in a study where the ENDOR spectroscopy method was used to verify hyperfine interactions [34,39]. Currently, the procedure that is a modification of so-called linear transformations is commonly used in MRI and CT imaging and ESR imaging as deconvolution. The beneficial effect of spectra postprocessing by CREM procedure for the samples studied is presented in the supplementary material. The spectra of TEMPO and TEMPOL detected at 295 K before and after the CREM method are shown in Figures S1–S4, respectively. The resolution of the spectra was increased significantly.
In the case of spectra shown in Section 3.5, we subtracted the baseline recorded for clear cells without a spin probe.
A confocal microscope Olympus FV1200 with an excitation laser (a wavelength of 488 nm) was used to confirm the endocytosis process. The pictures were taken after two hours of incubation of TEMPO–Fluorescein with yeast cells at 37 °C. The influence of the breathing cycle in a cell on free radical disappearance was studied by cell culture measurements performed in the air (aerobic atmosphere) and the nitrogen (anaerobic atmosphere).
3. Results and Discussion
The studies concerning the structure and dynamics of biomolecules in cellular solution or inside cells are crucial for understanding molecular-level processes. The biological systems and processes inside cells were described using different experimental methods, i.e., mass spectrometry [44,45], fluorescence spectroscopy [46,47], or magnetic resonance spectroscopy [48,49]. However, the application of Site-Directed Spin Labeling (SDSL) coupled with EPR spectroscopy was found to be suitable for describing biological macromolecules (proteins and nucleic acids) in cellular conditions [50]. The use of spin probes as structural, redox or oxygen probes in the SDSL-EPR method enables detailed studies of interactions in biological systems. On the other hand, the technique requires further improvement to develop a standard procedure for various biomolecules. The present studies demonstrate the effect of cumulative interaction of various components in biological systems reflected by ESR spectra changes.
Biological studies using spin probes and ESR are generally carried out at room temperature (RT). It should guarantee significant changes in signal intensities and dynamics. However, in the present studies, the differentiation of ESR signal parameters in such conditions was negligible, which could be explained by significant dynamics in the system studied that exclude observation of substantial changes. The interaction anisotropy of the spin probes with a diverse environment is averaged, and the differences in spectroscopic parameter values are insignificant or within the measurement accuracy. The ESR spectra of TEMPO and TEMPOL with yeast cells recorded at RT are shown in Figure 2a,c, respectively. The spectra differ only in a superhyperfine structure that did not change significantly during cell incubation. Therefore, ESR measurements were carried out at room and lower temperatures to observe the differences in dynamics, hyperfine structure, and the anisotropy of ESR spectra. Based on many years of ESR research experience using spin probes and biological samples and previous results, a temperature of 240 K was chosen as an optimal for differentiating the properties and dynamics of the spin probes during incubation [26,27]. We noticed that at this temperature (240 K), the best differentiation of the signal and its parameters is observed (Figure 2b,d). After sample freezing, the dynamics are reduced significantly, and the differentiation can be observed.
The spin probes studied are very stable in aqueous solutions. However, combining their solution with cells results in rapid recombination at 310 K (incubation temperature). The effect of several factors, including spin probe concentration, presence of oxygen and vitamin C, and the type of cells, affecting the time of a selected spin-probe signal disappearance was successively analyzed. The nitroxide radicals studied (TEMPO and TEMPOL) differ in structure, as the latter has a hydroxyl group, which can affect the compounds’ biological activity. According to the literature reports [29], TEMPO with lipophilic nature is more cytotoxic than hydrophilic TEMPOL, as it tends to accumulate in the cell membrane. Therefore, the nitroxide radicals studied could be responsible for activating different cellular signaling pathways. It can be assumed that their other behavior in biological systems should be manifested in ESR spectra.
3.1. Experiments with Yeast Cells
The spectra of yeast cells without spin probes were initially detected in different temperatures to define the baseline for the data obtained. The exemplary ESR spectrum of yeast cells is shown in Figure S5 (supplementary material) and is characterized by the absence of signals in the measuring range of TEMPO and TEMPOL. The subsequent studies concerned the mixture of the spin probes with yeast cells. The preliminary ESR measurements were carried out at 295 K. However, the possible location of the spin probes could not be determined based on the results obtained. The differentiation in ESR spectra was only observed for measurements carried out at 240 K, while the spectroscopic parameters were very similar for those recorded at 295 K (Figure 2). Different possible locations of the spin probes in yeast cell solution could be identified based on varied parameters of the ESR spectrum.
Figure 3 demonstrates the schematic diagram of several different locations of spin probes in yeast cells and the corresponding ESR spectra of TEMPO and TEMPOL recorded at 240 K that reflect the possible presence of a spin probe in a given location. As yeast cells’ incubation progresses over time, the structure of ESR spectra changes as a result of different environments. Thus, we can assume that the spin probes studied are mobile in cellular solution, and the corresponding spectra reflect subsequent steps of their movement into and within cells. ESR spectra should be different for spin probes outside cells, attached to the cell membrane, or inside a cell—probably near the mitochondria or between the outer and inner membranes where radicals (ROS) initially appear, originating, e.g., from the respiratory chain [2,4,5], as well as those inside cells undergoing intense disappearance. ESR spectra can also reflect the mixture of three different locations of the spin probe inside cells. It depends on the ratio of cells to spin-probe molecules, the rate of endocytosis, and the number of free radicals/ROS inside cells.
The ESR spectra of TEMPO and TEMPOL reflect the different rates of penetration into cells but show an analogous relationship between the spectral shape and the possible location. A spin probe in a water environment has a single line in the ESR spectrum after freezing the samples to 240 K (Figure 3, spectrum 1). It is the effect of sample freezing, and thus decreasing the dynamics of the molecules and inhibiting rotation. However, the interactions between molecules are still manifested by a small spectrum width (1.24 mT). The single line is observed for both spin probes studied after mixing with yeast cells. A similar situation can be observed at room temperature when the concentration of the spin probe is very high [51]. The following possible spin-label location is much more easily determined for the samples containing TEMPOL. In contrast to the measurements at 295 K, the spin probe attached to the cell membrane has no such freedom of movement [52,53,54], and a wide triplet is observed (Figure 3, spectrum 2). Spectrum 2 was obtained for TEMPOL with yeast cells after 3 min of incubation. In contrast, the samples with TEMPO were characterized by a spectrum with different structures simultaneously (spectrum 3). Therefore, a lower penetration rate of TEMPOL into cells enables a more detailed analysis of spin probe location using the ESR method. A narrow triplet (Figure 3, spectrum 3) is attributed to a spin probe inside the cell characterized by high mobility. It is observed for TEMPO with yeast cells after only 3 min of incubation, while for TEMPOL after 2 h. Spectrum 4 in Figure 3 is characterized by a much lower concentration of spin probes. The differences observed result from the effect of yeast cell incubation time on spin-probe signal disappearance. Spectrum 3 was recorded earlier, while spectrum 4 after 1 h for samples with TEMPO. Additionally, the difference observed could also be a consequence of spin-probe penetration into cell organelles (e.g., mitochondria).
The proof that we realistically monitored the process of TEMPO entering the cell was described in our previous work [27], presenting an experiment with sample filtering. When we filtered the incubated sample in which there was endocytosis (a narrow triplet at 240 K), we did not see any signal in the filtrate. However, the ESR signal was visible in the material left on the filter. It confirms that the signal observed by us at 240 K results from changes in the sample during incubation (endocytosis) and not of low temperature. If we kept the sample with the cells and the spin probe at the temperature of 273 K (this is the temperature at which endocytosis does not occur), after filtering the sample, we recorded a single line at the temperature of 240 K, such as in Figure 3, spectrum 1, confirming the presence of TEMPO in the solution and not attached whether present in the cell. The study on the spin probes’ endocytosis process will be continued.
The location of spin probes was also analyzed by analogous experiments carried out in the presence of a fluorescent spin-probe reagent (TEMPO–Fluorescein). TEMPO–Fluorescein was added to the yeast cell suspension, and the process was monitored by the ESR method and confocal microscope (Figure 4). As can be seen in the pictures taken under the confocal microscope, the fluorescence from TEMPO–Fluorescein located in the cell membranes is visible as a delicate envelope around the yeast cells. If we compare Figure 4a,b, it can be seen that this fluorescence comes from only a few cells. The reference sample of TEMPO–Fluorescein without cells measured at 240 K was characterized by the single line in the ESR spectrum (data not shown), while the one combined with cell suspension was by a wide triplet. Unfortunately, the signal intensity and the spectrum structure did not change during incubation, even after 24 h. It can be assumed that the modified TEMPO–Fluorescein molecules are only attached to a cell membrane and cannot penetrate cells. The endocytosis process is prolonged or does not occur (Figure 4). The same signal intensity indicates no redox reaction in the system. In contrast, the same spectrum structure (wide triplet) suggests that the environment of the molecules studied at different incubation times remains unchanged.
This was confirmed by the water–organic liquids boundary-crossing experiment for TEMPO and TEMPO–Fluorescein. The partition coefficient (P) is the term used to define the ratio of the concentrations of substances, TEMPO or TEMPO–Fluorescein spin probe, in two immiscible solvents at equilibrium. Therefore, this ratio is a comparison of the solubility of the solute in these two liquids. The study of TEMPO or TEMPO–Fluorescein spin probes’ diffusion through the water–ethyl acetate (w/ea) or water–hexane (w/h) phase boundaries was carried out in a glass vessel. A total of 150 µL of an aqueous solution of spin probes containing 0.06 mg of TEMPO or 0.03 mg of TEMPO–Fluorescein and 150 µL of organic solvent was placed. The contact area of the water–organic solvent phases in the measuring vessel was 154 mm2. The concentration of spin probes in both phases was measured by the ESR method by collecting samples of solutions to capillary, with a capacity of 16 µL, after the equilibrium was established (2.5 h). The partition coefficients for TEMPO were 1.68 (h/w) and 2.14 (ea/w), while for TEMPO–Fluorescein only 5.9 × 10⁻³ (h/w) and 1.5 × 10⁻² (ea/w). According to the values obtained, a significant transfer of the TEMPO spin probe into the nonpolar organic phase is observed while TEMPO–Fluorescein remains in the water. Very large fluorescein substituent in the TEMPO structure limits diffusion of the spin probe from an aqueous layer into the organic phase. A limited possibility of penetration characterizes TEMPO–Fluorescein into the cells through the nonpolar cell membrane. Research studies on the distribution of spin probes in cells by fluorescence spectroscopy confirm that TEMPO–Fluorescein does not penetrate the cell structure. At the same time, TEMPO crosses the nonpolar cell membrane barrier.
3.2. The Effect of the Ratio of Spin Probe Concentration in Solution to Cell Amount on the ESR Spectrum
The parameters of ESR spectra recorded at 240 K, reflecting endocytosis, were analyzed depending on the ratio of the spin probe amount in the solution to the number of yeast cells. The initial studies were conducted to determine the appropriate ratio of TEMPO (TEMPOL) concentration to cell amount to observe differences in ESR spectra. The solutions studied were prepared for the ratio: TEMPO/TEMPOL molecule amount/yeast cell number ranging from 0.7 × 10⁹ to 1.7 × 10⁹. The differences in endocytosis cannot be observed by ESR measurements for ratios below 1.7 × 10⁹. The concentration of spin probes used in current studies (0.5 g/L, which corresponds to 3.2 mM for TEMPO and 2.9 mM for TEMPOL) does not affect the multiplication of yeast cells and even slightly stimulates proliferation [27]. The volume of yeast cell suspension (162 × 109/mL) was varied to obtain a specific ratio of the spin probe amount to cell number.
If the ratio is about 1.7 × 10⁹, endocytosis occurs very quickly. Only 30 s after injection of TEMPO solution with incubated yeast cells (310 K), the ESR spectrum at 240 K was recorded as a narrow triplet, NT (Figure 3, spectrum 3 and Figure 5a). It confirmed the penetration of all TEMPO molecules into the cells.
However, TEMPOL molecules are characterized by a slower penetration rate into yeast cells. Therefore, endocytosis proceeds relatively slowly. Complex ESR spectra are recorded, i.e., wide WT and narrow NT triplets (Figure 5b), if their concentration is significantly larger than the number of cells. Additionally, further spectrum modifications depend on endocytosis rate and/or recombination processes over incubation time. The spectrum turns into a narrow NT triplet (Figure 3, spectrum 3), or a narrow triplet disappears, and only/mostly a broad WT remains (Figure 3, spectrum 4). The latter is observed when the recombination process is faster than endocytosis. There are evidently some differences in spectroscopic parameters for observed spectra. For Figure 5a—narrow triplet (NT)—a total hyperfine splitting is 3.3 mT and line widths are ΔH1 = 0.6 mT, ΔH2 = 0.6 mT, and ΔH3 = 0.8 mT. For Figure 5b, it is difficult to calculate the line widths. However, the total hyperfine splitting for a wide triplet (WT) is 7.5 mT, and for a narrow one (NT) it is also 3.3 mT.
3.3. Processes of Changing the Concentration of TEMPO and TEMPOL in Cells
After analyzing endocytosis dynamics, the spin probe concentration changes inside cells were studied. TEMPO is an excellent scavenger of free radicals in cells. It quickly penetrates cells, manifested by the presence of a narrow triplet in the ESR spectrum (Figure 5a). After mixing yeast cell solution with TEMPO for 1 min, a narrow triplet dominates in the ESR spectrum, and its rapid disappearance occurs after 60 min of incubation (Figure 3, spectrum 4 and Figure 6).
TEMPO hydroxyl derivative—TEMPOL—is also a spin probe that penetrates cells and recombines. However, its rate of penetration is much lower than that of TEMPO. In contrast to the TEMPO spectrum, the complex TEMPOL one (Figure 6a) comprises two overlapping spectra—wide triplet WT and narrow triplet NT. Therefore, the resolution of TEMPOL spectra was increased using the linear transformation method [34,35,36,37,38,39,40,41]. The wide triplet dominates in the TEMPOL spectrum and prevents observation of other signals with lower intensity. Thus, the CREM procedure was adapted to expose the original spectrum’s invisible components (narrow triplet) with the exact resolution. The signal overlapping results from the relatively slow process of TEMPOL endocytosis. As incubation time increases, NT signal disappears, while WT signal intensity decreases as endocytosis progresses. However, the ESR signal was recorded even after 200 min. The rate of the spin probe changes studied in solutions with yeast cells is presented in Figure 6 and Figure 7. The disappearance of TEMPO/TEMPOL under biological conditions results from redox reactions. In general, nitroxides are reduced to stable hydroxylamines (Figure 8). They can also be transformed into oxoammonium derivatives [55].
3.4. The Influence of Oxygen in the Atmosphere and Vitamin C on Spin Probes in Cell Culture
A reduced amount of oxygen can influence the formation of free radicals in a breathing cycle and the dynamics of endocytosis. Therefore, the measurements were performed for incubation in a nitrogen and oxygen atmosphere (Figure 7). Yeast cells are adapted to growth under aerobic and anaerobic conditions. The anaerobic atmosphere does not affect the reproduction process, but the number of reactive oxygen species and intracellular antioxidants in cells is significantly reduced [56]. The disappearance of spin probes is slower in the nitrogen atmosphere. It could be explained by the deactivation of aerobic respiration and thus lower production of radicals by mitochondria into the cytoplasm. The difference is particularly significant for TEMPOL molecules with slower endocytosis than TEMPO. The presence of strong antioxidants can also influence endocytosis. Therefore, vitamin C was applied as a model-reducing agent and added to TEMPO solutions (Figure 9). The effect of vitamin C presence was studied for solutions of three different compositions: TEMPO with vit. C, TEMPO with yeast cells, as well as TEMPO with vit. C and yeast cells. In the absence of yeast cells, TEMPO recombination occurs as an effect of the redox process (Figure 10), while the signal fades much more slowly in the presence of yeast cells.
According to our results, endocytosis of vitamin C is much slower than that of TEMPO. Therefore, its participation in free radicals scavenging inside cells is invisible in the presence of TEMPO. Hence, applying TEMPO as a free radicals scavenger should be more effective than vitamin C. Additionally, the analogous experiments were applied to the samples with TEMPOL. However, this spin probe penetrates much more slowly in cellular solution, and no significant changes were observed using the same incubation time range.
The experimental data from Figure 10 were further used to create a mathematical model for describing individual endocytosis steps. The differences in signal intensity of TEMPO penetration and disappearance during incubation time can be estimated using Equation (2):
where:
I(t) = Aout(t) + Am(t) + Ain(t)
Aout(t) = C × exp(−(t − 1)/τ1)
Am(t) = Aout(t) − (C-C × exp(−(t − 1)/τ1))
Ain(t) = Am(t) − K1 × Am(t) + K1 × Am(t) × exp(−(t − 1)/τ2)
The I(t) function describes changes in TEMPO concentration over time measured in a suspension of cells with the spin probe. I(t) is the integral intensity of the ESR spectrum, and its value is directly proportional to the concentration of TEMPO particles in the cell suspension. Aout(t) describes the number of spin-probe molecules in suspension not associated with the cells. Am(t) is the number of TEMPO molecules attached to the cells, while Ain(t) is the number that entered cells during endocytosis and is recombined with free radicals inside the cells. The amounts of spin probes Aout(t), Am(t), and Ain(t) were calculated using Equations (3)–(5), respectively.
The parameter C is the total amount of TEMPO molecules in a cell suspension. It is normalized to 100 a.u. (Figure 11). In most experiments, its absolute value was about 3 × 10 3 mol/L. K1 concerns the part of spin probes attached to the cell membrane that penetrates a cell per unit of time. The values τ1 and τ2 have the dimension of the relaxation time, i.e., indicating the time at which the values of Aout(t), Am(t), and Ain(t) decrease or increase (e ≈ 2.7 times).
Changes in the intensity of the spin probes in the incubation process of yeast cells were approximated (Figure 11) according to Equation (2).
The values of K1, τ1, and τ2 indicate the most significant dynamics of the spin probe disappearance inside cells (τ2 = 0.005 min). After 75 min of incubation of TEMPO and yeast cell suspension, approximately 80% of the spin-probe molecules entered the cells. The relaxation time τ1 (2 min) indicates a very effective attachment of TEMPO to cells, while K1 (0.8 a.u./min) confirms the high efficiency of endocytosis in the experiment discussed.
3.5. Experiments with Cancer Cells
Next, the endocytosis of the leukemia cell line (HL-60, ATCC CCL-240) was analyzed and compared with the results for breast cancer cells [27]. Previously, we compared ESR spectra of magnetic iron(II, III) oxide functionalized with organic units bearing TEMPO or TEMPOL in different environments. The ESR measurements were carried out in the presence of human microvascular endothelial, breast cancer, and yeast cells. The measurement at room temperature resulted in very similar ESR spectra for the samples with and without cells. After temperature reduction, a wide triplet was observed for all cells studied. The spectra differed only in peak-to-peak line width. Therefore, in the present studies, the leukemia HL60 cells were used. These cells do not adhere to the bottom of the culture bottle, which distinguishes them from other solid tumor-derived ones. They can be used without trypsinization, which is stressful for the cells and may change their properties. Consequently, their standard physiological properties can be maintained. On this basis, we expected this might affect the structure of the EPR spectrum. The decrease in the spin probe concentration in leukemia cancer cells was swift, comparable to data obtained for breast cancer cells. It resulted from a high concentration of free radicals inside these cells. However, endocytosis in leukemia cells and breast cancer cells is of a different temporal nature. The ESR spectrum recorded immediately after mixing TEMPO with leukemia cells (240 K) is binary (Figure 12), consisting of a wide and narrow triplet.
The disappearance of both spin probes studied (TEMPO and TEMPOL) in leukemia cells was very fast; thus, after 15 min of incubation at 310 K, a wide triplet is observed in the ESR spectrum (Figure 13). The disappearance rate of the spin-probe signal inside the leukemia cells can be interpreted as the complete recombination of the spin probes with free radicals present in the cells. It is confirmed by an absence of a narrow triplet in the ESR spectrum for the sample of leukemia cells incubated for 2 h at 310 K (Figure 14). Moreover, it shows many free radicals outside the system controlling their contents in cells. Similar effects were observed for breast cancer cells [27].
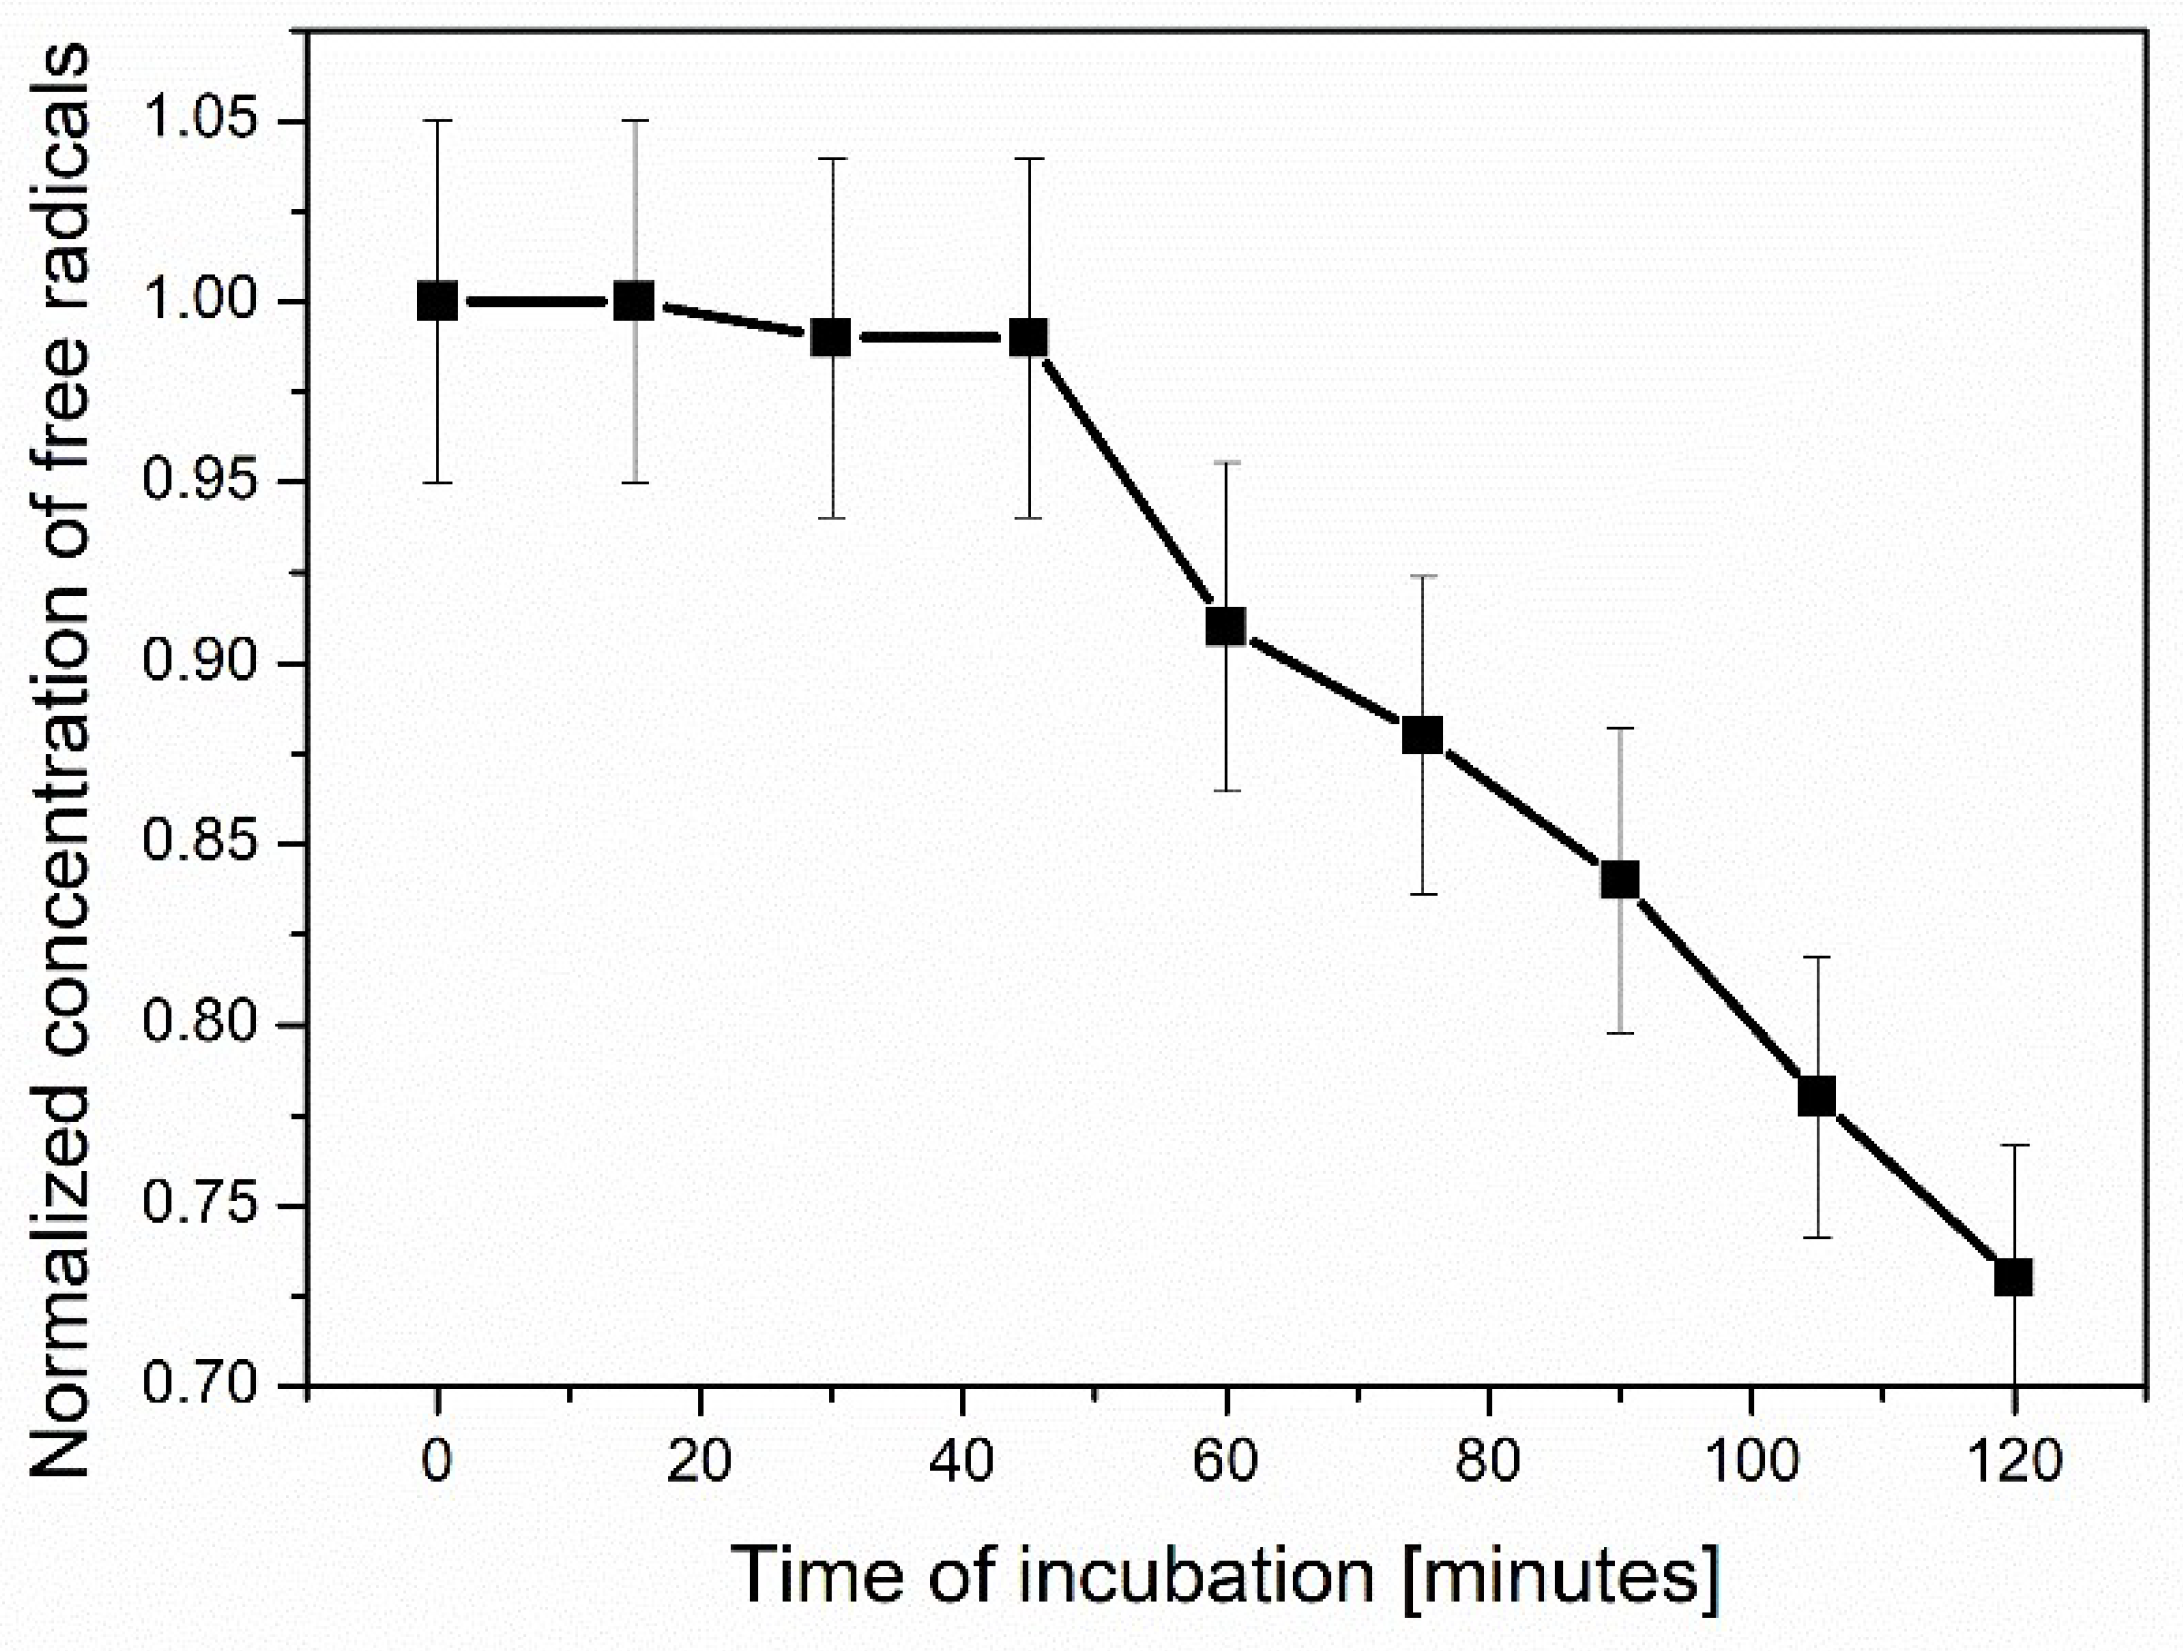
Figure 15 shows the changes in spin probe concentration over time. It can be observed when the ratio of TEMPO molecule amount/yeast cell number is above 1.7 × 10⁹ and penetration inside a cell is relatively slow.
4. Conclusions
The ESR method enables monitoring of spin-probe penetration into cells and differentiation of ESR spectra of spin probes inside and outside cells. The measurements carried out at 240 K result in different spectra of spin probes inside and outside cells. The rate/efficiency of the process observed depends on the ratio of spin-probe molecule amount/yeast cell number and the type of cells (healthy/cancerous). Additionally, external factors (oxygen and vitamin C) can affect the decay of spin-probe ESR signals. The results indicate that swift (within minutes) reduction in spin probe concentration inside cells makes them promising candidates for potential application as scavengers of free radicals in cells.
Supplementary Materials
The following supporting information can be downloaded at: https://www.mdpi.com/article/10.3390/app12167999/s1.
Author Contributions
Conceptualization, B.D. and R.K.; methodology, B.D., R.K., M.K. and M.M.; software, R.K.; validation, B.D. and M.K.; formal analysis, B.D., R.K., G.S. and J.K.; investigation, B.D., R.K. and M.K.; resources, R.K. and M.M.; data curation, R.K. and M.K.; writing—original draft preparation, B.D., R.K., M.K., M.M., G.S. and J.K.; writing—review and editing, B.D., R.K., G.S. and J.K.; visualization, B.D. and R.K.; supervision, R.K.; project administration, R.K.; funding acquisition, B.D., M.M. and J.K. All authors have read and agreed to the published version of the manuscript.
Funding
B. Dobosz and J. Kurczewska are thankful to Adam Mickiewicz University in Poznan (AMU) for the financial support with the interfaculty project in AMU School of Exact Sciences. The cell line experiments were supported by the project from Polish National Science Center UMO2014/15/B/NZ5/01488 granted for Marek Murias.
Institutional Review Board Statement
Not applicable.
Informed Consent Statement
Not applicable.
Data Availability Statement
Data supporting the result of our study are available from the corresponding author upon request.
Conflicts of Interest
The authors declare no conflict of interest.
References
- Bil, P.; Ciesielska, S.; Jaksik, R.; Rzeszowska-Wolny, J. Circuits Regulating Superoxide and Nitric Oxide Production and Neutralisation in Dierent Cell Types: Expression of Participating Genes and Changes Induced by Ionizing Radiation. Antioxidants 2000, 9, 701. [Google Scholar] [CrossRef] [PubMed]
- Georgieva, E.; Ivanova, D.; Zhelev, Z.; Bakalova, R.; Gulubova, M.; Aoki, I. Mitochondrial dysfunction and redox imbalance as a diagnostic marker of free radical diseases. Anticancer Res. 2017, 37, 5373–5381. [Google Scholar] [CrossRef] [PubMed] [Green Version]
- Silva, J.P.; Coutinho, O.P. Free radicals in the regulation of damage and cell death—Basic mechanisms and prevention. Drug Discov. Ther. 2010, 4, 144–167. [Google Scholar] [PubMed]
- Mittal, M.; Siddiqui, M.R.; Tran, K.; Reddy, S.P.; Malik, A.B. Reactive Oxygen Species in Inflammation and Tissue Injury. Antioxid. Redox Signal. 2014, 20, 1126–1167. [Google Scholar] [CrossRef] [Green Version]
- Biswas, S.; Das, R.; Banerjee, E.R. Role of free radicals in human inflammatory diseases. AIMS Biophys. 2017, 4, 596–614. [Google Scholar] [CrossRef]
- Ribeiro, T.P.; Fernandes, C.; Melo, K.V.; Ferreira, S.S.; Lessa, J.A.; Franco, R.W.A.; Schenk, G.; Pereira, M.D.; Horn, A., Jr. Iron, copper, and manganese complexes with in vitro superoxide dismutase and/or catalase activities that keep Saccharomyces cerevisiae cells alive under severe oxidative stress. Free Radic. Biol. Med. 2015, 80, 67–76. [Google Scholar] [CrossRef] [Green Version]
- Phaniendra, A.; Jestadi, D.B.; Periyasamy, L. Free Radicals: Properties, Sources, Targets, and their Implication in Various Diseases. Indian J. Clin. Biochem. 2015, 30, 11–26. [Google Scholar] [CrossRef] [Green Version]
- Peoples, J.N.; Saraf, A.; Ghazal, N.; Pham, T.T.; Kwong, J.Q. Mitochondrial dysfunction and oxidative stress in heart disease. Exp. Mol. Med. 2019, 51, 162. [Google Scholar] [CrossRef]
- Liu, Y.; Zhu, M.; Xu, J.; Zhang, H.; Tian, M. Using a TEMPO-based fluorescent probe for monitoring oxidative stress in living cells. Analyst 2011, 136, 4316–4320. [Google Scholar] [CrossRef]
- Weil, J.A.; Bolton, J.R. Electron Paramagnetic Resonance: Elementary Theory and Practical Applications, 2nd ed.; Wiley Interscience: Hoboken, NJ, USA, 2006. [Google Scholar]
- Kempe, S.; Metz, H.; Mäder, K. Application of Electron Paramagnetic Resonance (EPR) spectroscopy and imaging in drug delivery research—Chances and challenges. Eur. J. Pharm. Biopharm. 2010, 74, 55–66. [Google Scholar] [CrossRef]
- Krzyminiewski, R.; Kruczyński, Z.; Dobosz, B.; Zając, A.; Mackiewicz, A.; Leporowska, E.; Folwaczna, S. EPR Study of Iron Ion Complexes in Human Blood. Appl. Magn. Reson. 2011, 40, 321–330. [Google Scholar] [CrossRef] [PubMed] [Green Version]
- Zalewska, A.; Krzyminiewski, R.; Dobosz, B.; Mrozińska, J.; Kruczyński, Z. The effect of copper ions on interaction of UV radiation with methacrylic matrix—EPR study. Mater. Chem. Phys. 2013, 43, 440–445. [Google Scholar] [CrossRef]
- Krzyminiewski, R.; Dobosz, B.; Kubiak, T. The influence of radiotherapy on ceruloplasmin and transferrin in whole blood of breast cancer patients. Radiat. Environ. Biophys. 2017, 56, 345–352. [Google Scholar] [CrossRef] [PubMed] [Green Version]
- Natsumoto, K.; Krishna, M.C.; Mitchell, J.B. Novel pharmacokinetic measurement using electron paramagnetic resonance spectroscopy and simulation of in vivo decay of various nitroxyl spin probes in mouse blood. J. Pharmacol. Exp. Ther. 2004, 310, 1076–1083. [Google Scholar] [CrossRef] [PubMed]
- Yamada, K.I.; Kuppusamy, P.; English, S.; Yoo, J.; Irie, A.; Subramanian, S.; Mitchell, J.B.; Krishna, M.C. Feasibility and assessment of non-invasive in vivo redox status using electron paramagnetic resonance imaging. Acta Radiol. 2002, 43, 433–440. [Google Scholar] [CrossRef]
- Villamena, F.A. EPR Spin Trapping. In Reactive Species Detection in Biology: From Fluorescence to Electron Paramagnetic Resonance Spectroscopy, 1st ed.; Elsevier: Amsterdam, The Netherlands, 2016; pp. 163–202. [Google Scholar]
- Headley, C.A.; Hoffman, C.N.; Freisen, J.M.; Han, Y.; Macklin, J.M.; Zweier, J.L.; Rockenbauer, A.; Kuret, J.; Villamena, F.A. Membrane-specific spin trap, 5–dodecylcarbamoyl–5–N–dodecylacetamide–1–pyroline–N–oxide (diC12PO): Theoretical, bioorthogonal fluorescence imaging and EPR studies. Org. Biomol. Chem. 2019, 17, 7694–7705. [Google Scholar] [CrossRef]
- Lewandowski, M.; Gwozdzinski, K. Nitroxides as antioxidants and anticancer drugs. Int. J. Mol. Sci. 2017, 18, 2490. [Google Scholar] [CrossRef] [Green Version]
- Nagasaki, Y. Design and application of redox polymers for nanomedicine. Polym. J. 2018, 50, 821–836. [Google Scholar] [CrossRef]
- Feliciano, C.P.; Nagasaki, Y. Antioxidant Nanomedicine Protects against Ionizing Radiation-Induced Life-Shortening in C57BL/6J Mice. ACS Biomater. Sci. Eng. 2019, 5, 5631–5636. [Google Scholar] [CrossRef]
- Wilcox, C.S. Effects of tempol and redox-cycling nitroxides in models of oxidative stress. Pharmacol. Ther. 2010, 126, 119–145. [Google Scholar] [CrossRef] [Green Version]
- Neil, S.; Huh, J.; Baronas, V.; Li, X.; McFarland, H.F.; Cherukuri, M.; Mitchell, J.B.; Quandt, J.A. Oral administration of the nitroxide radical TEMPOL exhibits immunomodulatory and therapeutic properties in multiple sclerosis models. Brain Behav. Immun. 2017, 62, 332–343. [Google Scholar] [CrossRef]
- Smirnova, T.I.; Smirnov, A.I. Peptide-membrane Interactions by Spin-labeling EPR. Methods Enzymol. 2015, 564, 219–258. [Google Scholar] [PubMed] [Green Version]
- Pavićević, A.; Luo, J.; Popović-Bijelić, A.; Mojović, M. Maleimido-proxyl as an EPR spin label for the evaluation of conformational changes of albumin. Eur. Biophys. J. 2017, 46, 773–787. [Google Scholar] [CrossRef] [PubMed]
- Krzyminiewski, R.; Dobosz, B.; Schroeder, G.; Kurczewska, J. ESR as a monitoring method of the interactions between TEMPO-functionalized magnetic nanoparticles and yeast cells. Sci. Rep. 2019, 9, 18733. [Google Scholar] [CrossRef] [PubMed]
- Krzyminiewski, R.; Dobosz, B.; Krist, B.; Schroeder, G.; Kurczewska, J.; Bluyssen, H.A.R. ESR Method in Monitoring of Nanoparticle Endocytosis in Cancer Cells. Int. J. Mol. Sci. 2020, 21, 4388. [Google Scholar] [CrossRef]
- Suy, S.; Mitchell, J.B.; Ehleiter, D.; Haimovitz-Friedman, A.; Kasid, U. Nitroxides Tempol and Tempo Induce Divergent Signal Transduction Pathways in MDA-MB 231 Breast Cancer Cells. J. Biol. Chem. 1998, 273, 17871–17878. [Google Scholar] [CrossRef] [Green Version]
- Guo, X.; Seo, J.E.; Bryce, S.M.; Tan, J.A.; Wu, Q.; Dial, S.L.; Moore, M.M.; Mei, N. Comparative Genotoxicity of TEMPO and 3 of Its Derivatives in Mouse Lymphoma Cells. Toxicol. Sci. 2018, 163, 214–225. [Google Scholar] [CrossRef] [Green Version]
- Rocha, V.C.J.; de Aragão França, L.S.; de Araújo, C.F.; Ng, A.M.; de Andrade, C.M.; Cronemberger Andrade, A.; de Souza Santos, E.; da Cruz Borges-Silva, M.; Garcia Macambira, S.; Noronha-Dutra, A.A.; et al. Protective effects of mito-TEMPO against doxorubicin cardiotoxicity in mice. Cancer Chemother. Pharmacol. 2016, 77, 659–662. [Google Scholar] [CrossRef]
- Ni, R.; Cao, T.; Xiong, S.; Ma, J.; Fan, G.C.; Lacefield, J.C.; Lu, Y.; Le Tissier, S.; Peng, T. Therapeutic inhibition of mitochondrial reactive oxygen species with mito-TEMPO reduces diabetic cardiomyopathy. Free Radic. Biol. Med. 2016, 90, 12–23. [Google Scholar] [CrossRef] [Green Version]
- Akakuru, O.U.; Iqbal, M.Z.; Liu, C.; Xing, J.; Wei, Z.; Jiang, Z.; Fang, Q.; Yuan, B.; Nosike, E.I.; Xia, J.; et al. Self-assembled, biocompatible and biodegradable TEMPO-conjugated nanoparticles enable folate-targeted tumor magnetic resonance imaging. Appl. Mater. Today 2020, 18, 100524. [Google Scholar] [CrossRef]
- Marshall, J.D.; Li, J.Z.; Zhang, Y.; Gong, Y.; St-Pierre, F.; Lin, M.Z.; Schnitzer, M.J. Cell-Type-Specific Optical Recording of Membrane Voltage Dynamics in Freely Moving Mice. Cell 2016, 167, 1650–1662. [Google Scholar] [CrossRef] [PubMed] [Green Version]
- Krzyminiewski, R. Computer enhancement of complex spectroscopic spectra resolution. Mol. Phys. Rep. 1994, 6, 174–179. [Google Scholar]
- Jezierska, K.; Macała, A.; Krzyminiewski, R.; Woźniak, P.; Łikowiak, M.; Sękowska-Namiotko, A.; Podraza, W. High Signal Resolution Pulse Oximetry as a Prognostic Indicator of Radiotherapy Toxicity: A Pilot Study. Pulse 2021, 9, 83–88. [Google Scholar] [CrossRef] [PubMed]
- Bednarowicz, M.; Dobosz, B.; Krzyminiewski, R.; Hałupka-Bryl, M.; Deptuła, T.; Nagasaki, Y. ESR studies of redox-active PMNT-PEG-PMNT polymer. Mater. Chem. Phys. 2015, 161, 250–255. [Google Scholar] [CrossRef]
- Dobosz, B.; Krzyminiewski, R.; Koralewski, M.; Hałupka-Bryl, M. Computer enhancement of ESR spectra of magnetite nanoparticles. J. Magn. Magn. Mater. 2016, 407, 114–121. [Google Scholar] [CrossRef]
- Dobosz, B.R.; Krzyminiewski, J.; Kurczewska, G.S. The influence of surface modification, coating agents and pH value of aqueous solutions on physical properties of magnetite nanoparticles investigated by ESR method. J. Magn. Magn. Mater. 2017, 429, 203–210. [Google Scholar] [CrossRef]
- Atherton, M.; Crossland, W.A. A Single-crystal ENDOR Study of y-Irradiated Pyridoxine Hydrochloride. J. Chem. Soc. Faraday Trans. 1987, 83, 37–42. [Google Scholar] [CrossRef]
- Hedberg, A.; Ehrenberg, A. Resolution enhancement of ESR spectra from irradiated single crystals of glycine. J. Chem. Phys. 1968, 48, 4822–4828. [Google Scholar] [CrossRef] [PubMed]
- Koper, A.; Krzyminiewski, R. Analysis of resonance excitations by linear transformation technique theory. Acta Magn. 1985, II, 3–23. [Google Scholar]
- Madisetti, V.K.; Williams, D.B. The Digital Signal Processing Handbook; CRC/IEEE Press: New York, NY, USA, 1999. [Google Scholar]
- Krzyminiewski, R.; Kowalczyk, R.M.; Bielewicz-Mordalska, A.; Pająk, Z.; Czarnecki, P. Computer enhancement of CW-EPR experimental spectra resolution as a new method in investigation of molecular dynamics in pyridinium tetrafluoroborate. J. Mol. Struct. 1998, 471, 234–249. [Google Scholar] [CrossRef]
- Gan, J.; Ben-Nissan, G.; Arkind, G.; Tarnavsky, M.; Trudeau, D.; Garcia, L.N.; Tawfik, D.S.; Sharon, M. Native mass spectrometry of recombinant proteins from crude cell lysates. Anal. Chem. 2017, 89, 4398–4404. [Google Scholar] [CrossRef] [PubMed] [Green Version]
- Liu, Y.; Cong, X.; Liu, W.; Laganowsky, A. Characterisation of membrane protein-lipid interactions by mass spectrometry ion mobility mass spectrometry. J. Am. Soc. Mass Spectrom. 2017, 28, 579–586. [Google Scholar] [CrossRef] [PubMed]
- Bertolin, G.; Le Marchand, G.; Tramier, M. Real-time monitoring of aurora kinase a activation using conformational FRET biosensors in live cells. J. Vis. Exp. 2020, 30, e61611. [Google Scholar] [CrossRef] [PubMed]
- Benaissa, H.; Ounoughi, K.; Aujard, I.; Fischer, E.; Goïame, R.; Nguyen, J.; Tebo, A.G.; Li, C.; Le Saux, T.; Bertolin, G.; et al. Engineering of a fluorescent chemogenetic reporter with tunable color for advanced live-cell imaging. Nat. Commun. 2021, 12, 6989. [Google Scholar] [CrossRef] [PubMed]
- Bothwell, J.H.; Griffin, J.L. An introduction to biological nuclear magnetic resonance spectroscopy. Biol. Rev. Camb. Philos. Soc. 2011, 86, 493–510. [Google Scholar] [CrossRef]
- Grivet, J.P. NMR and microorganisms. Curr. Issues Mol. Biol. 2001, 3, 7–14. [Google Scholar] [CrossRef] [Green Version]
- Bonucci, A.; Ouari, O.; Guigliarelli, B.; Belle, V.; Mileo, E. In-Cell EPR: Progress towards structural studies inside cells. ChemBioChem 2020, 21, 451–460. [Google Scholar] [CrossRef]
- Khramtsov, V.V.; Bobko, A.A.; Tseytlin, M.; Driesschaert, B. Exchange Phenomena in the Electron Paramagnetic Resonance Spectra of the Nitroxyl and Trityl Radicals: Multifunctional Spectroscopy and Imaging of Local Chemical Microenvironment. Anal. Chem. 2017, 89, 4758–4771. [Google Scholar] [CrossRef]
- Smirnov, A.; Smirnova, T.; Morse, P.D. Very high frequency electron paramagnetic resonance of 2,2,6,6-Tetramethyl-1-Piperidinyloxy in 1,2-Dipalmitoyl-sn-Glycero-3-phosphatidylcholine liposomes: Partitioning and molecular dynamics. Biophys. J. 1995, 68, 2350–2360. [Google Scholar] [CrossRef] [Green Version]
- Jeschke, G. Spin Probes and Spin Traps. In Physical Chemistry IV. Part 2: Electron Paramagnetic Resonance; ETH: Zurich, Switzerland, 2016; pp. 75–84. [Google Scholar]
- Krzyminiewski, R.; Kubiak, T.; Dobosz, B.; Schroeder, G.; Kurczewska, J. EPR spectroscopy and imaging of TEMPO-labeled magnetite nanoparticles. Curr. Appl. Phys. 2014, 14, 798–804. [Google Scholar] [CrossRef]
- Dragutan, I.; Mehlhorn, R.J. Modulation of oxidative damage by nitroxide free radicals. Free Radic. Res. 2007, 41, 303–315. [Google Scholar] [CrossRef] [PubMed]
- Prestrelski, S.J.; Tedeschi, N.; Arakawa, T.; Carpenter, J.F. Dehydration-induced conformational transitions in proteins and their inhibition by stabilisers. Biophys. J. 1993, 65, 661–671. [Google Scholar] [CrossRef] [Green Version]
Figure 1.
The structures of the spin probes studied.

Figure 2.
ESR spectra of TEMPO (a,b) and TEMPOL (c,d) spin probes with yeast cells recorded at 295 K (a,c) and 240 K (b,d).
Figure 2.
ESR spectra of TEMPO (a,b) and TEMPOL (c,d) spin probes with yeast cells recorded at 295 K (a,c) and 240 K (b,d).

Figure 3.
Schematic representation of possible spin probe location based on ESR spectrum shape of TEMPO or TEMPOL with yeast cells recorded at 240 K: 1—spin probe outside cells, 2—spin probe attached to a cell, 3—spin probe inside cells, 4—spin probe inside cells (probably in cellular mitochondria). The figure was created using Servier Medical Art templates, licensed under a Creative Commons Attribution 3.0 Unported License; https://smart.servier.com (accessed on 16 December 2019).

Figure 4.
Confocal fluorescent imaging of TEMPO–Fluorescein with yeast cells (a,b) and the corresponding ESR spectrum (c) after 2 h of incubation.
Figure 4.
Confocal fluorescent imaging of TEMPO–Fluorescein with yeast cells (a,b) and the corresponding ESR spectrum (c) after 2 h of incubation.


Figure 5.
ESR spectra of spin probes with yeast cells at 240 K: (a) TEMPO with the narrow triplet; (b) TEMPOL with wide (WT) and narrow (NT) triplets.
Figure 5.
ESR spectra of spin probes with yeast cells at 240 K: (a) TEMPO with the narrow triplet; (b) TEMPOL with wide (WT) and narrow (NT) triplets.

Figure 6.
Decrease in the spin probe concentration during incubation with yeast cells determined by ESR signal intensity (a) of TEMPO (▲) and TEMPOL (■) and the exemplary ESR spectra at the beginning of incubation of TEMPO (b) and TEMPOL before (c) and after CREM process (d).
Figure 6.
Decrease in the spin probe concentration during incubation with yeast cells determined by ESR signal intensity (a) of TEMPO (▲) and TEMPOL (■) and the exemplary ESR spectra at the beginning of incubation of TEMPO (b) and TEMPOL before (c) and after CREM process (d).

Figure 7.
Changes of TEMPO (a) and TEMPOL (b) concentration in solutions incubated in nitrogen (▲) and oxygen (■) atmosphere.
Figure 7.
Changes of TEMPO (a) and TEMPOL (b) concentration in solutions incubated in nitrogen (▲) and oxygen (■) atmosphere.

Figure 8.
The schematic representation of TEMPO (R: -H) and TEMPOL (R: -OH) reduction to stable hydroxylamines.
Figure 8.
The schematic representation of TEMPO (R: -H) and TEMPOL (R: -OH) reduction to stable hydroxylamines.

Figure 9.
ESR spectrum of TEMPO spin probe with yeast cells in the presence of vitamin C recorded at 240 K (incubation time 10 min).
Figure 9.
ESR spectrum of TEMPO spin probe with yeast cells in the presence of vitamin C recorded at 240 K (incubation time 10 min).

Figure 10.
The influence of vitamin C on TEMPO concentration: yeast cells with TEMPO and vitamin C (■), TEMPO with vitamin C (•), and yeast cells with TEMPO (▲).
Figure 10.
The influence of vitamin C on TEMPO concentration: yeast cells with TEMPO and vitamin C (■), TEMPO with vitamin C (•), and yeast cells with TEMPO (▲).

Figure 11.
Intensity changes of TEMPO during incubation with yeast cells: experimental data (■), curve simulated according to Equation (2) (―), where C = 100 a.u. at the beginning of incubation, K1 = 0.8 a.u./min, τ1 = 2 min, and τ2 = 0.005 min.
Figure 11.
Intensity changes of TEMPO during incubation with yeast cells: experimental data (■), curve simulated according to Equation (2) (―), where C = 100 a.u. at the beginning of incubation, K1 = 0.8 a.u./min, τ1 = 2 min, and τ2 = 0.005 min.

Figure 12.
ESR spectrum (240 K) of TEMPO spin probe (WT: wide triplet, NT: narrow triplet) measured directly after adding HL-60 leukemia cells suspension (2.4 × 10⁵ cells/mL).
Figure 12.
ESR spectrum (240 K) of TEMPO spin probe (WT: wide triplet, NT: narrow triplet) measured directly after adding HL-60 leukemia cells suspension (2.4 × 10⁵ cells/mL).

Figure 13.
ESR spectrum (240 K) of TEMPOL spin probe (WT: wide triplet) measured after 15 min of incubation with HL-60 leukemia cells suspension (2.4 × 10⁵ cells/mL).
Figure 13.
ESR spectrum (240 K) of TEMPOL spin probe (WT: wide triplet) measured after 15 min of incubation with HL-60 leukemia cells suspension (2.4 × 10⁵ cells/mL).

Figure 14.
ESR spectrum (240 K) of TEMPO spin probe measured after 2 h of incubation with HL-60 leukemia cells.
Figure 14.
ESR spectrum (240 K) of TEMPO spin probe measured after 2 h of incubation with HL-60 leukemia cells.

Figure 15.
Decrease of TEMPO concentration introduced into HL-60 leukemia cells over time.

Publisher’s Note: MDPI stays neutral with regard to jurisdictional claims in published maps and institutional affiliations. |
© 2022 by the authors. Licensee MDPI, Basel, Switzerland. This article is an open access article distributed under the terms and conditions of the Creative Commons Attribution (CC BY) license (https://creativecommons.org/licenses/by/4.0/).
Share and Cite
MDPI and ACS Style
Dobosz, B.; Krzyminiewski, R.; Kucińska, M.; Murias, M.; Schroeder, G.; Kurczewska, J. Spin Probes as Scavengers of Free Radicals in Cells. Appl. Sci. 2022, 12, 7999. https://doi.org/10.3390/app12167999
AMA Style
Dobosz B, Krzyminiewski R, Kucińska M, Murias M, Schroeder G, Kurczewska J. Spin Probes as Scavengers of Free Radicals in Cells. Applied Sciences. 2022; 12(16):7999. https://doi.org/10.3390/app12167999
Chicago/Turabian StyleDobosz, Bernadeta, Ryszard Krzyminiewski, Małgorzata Kucińska, Marek Murias, Grzegorz Schroeder, and Joanna Kurczewska. 2022. "Spin Probes as Scavengers of Free Radicals in Cells" Applied Sciences 12, no. 16: 7999. https://doi.org/10.3390/app12167999
Note that from the first issue of 2016, this journal uses article numbers instead of page numbers. See further details here.