1. Introduction
For centuries, plants were sources of medicines that were used to cure diseases in humans and animals. The presence of secondary metabolites with specific properties has been recognized and applied [
1,
2]. Especially phenols, polyphenols and flavonoids constitute major groups of compounds having natural antioxidant properties [
3]. Phenolic compounds such as quercetin, rutin, catechin, genistein, caffeic acid, chlorogenic acid, and gallic acid are among those most popular [
4,
5]. The most powerful methods of detection of such compounds are chromatographic techniques such as LC–MS, GC–MS, HPLC, and NMR. The spectroscopic techniques such as UV–Vis or FTIR are less elaborate and faster to detect the presence of phytocomponents identifying functional groups [
6].
The rapid oxidation of biologically important substances and agents, present in any living organism, as well as delivered to the human body in a variety of forms: in everyday diet, as a diet supplement lotion, cream, drugs, etc., is a problem of great importance. Therefore, many methods have been developed to prevent this effect, especially when it comes to medical products of human health importance. Among those, the main one is the encapsulation of biologically active agents (especially unsaturated fatty acids) with the use of saccharide shells [
7,
8] or yeast cells [
9,
10,
11]. The aim of the capsule is to produce a mechanical barrier—wall, preventing invasive agents, including oxidizing species, from access to the active substance and, thus, maintaining the designed therapeutical action of the drug. The presence of natural antioxidants in the medical products, diet supplements, or edible products may reduce the need for encapsulation. Moreover, the presence of easily available natural antioxidants in the human body may also prevent from oxidation unsaturated fatty acids both building cell membranes and delivered with the diet.
Recently, much attention has been given to the influence of natural compounds present in everyday diet on human health. Much emphasis has been put on nonmedical or semi-medical cosmetics, food, and drink products, such as herbs (fresh and dried), teas, and infusions, as well as juices and extracts, and their antioxidant performance is one of the crucial factors [
12,
13]. One of the possible antioxidant sources are fruits of European bird cherry (
Prunus padus), which is a European and Asian native tree of the
Rosaceae family. The bark, leaves, and fruits have been known in the field of folk medicine, considering their antibacterial, diuretic, antirheumatic, styptic, and other performances. Nevertheless, properties of any part of the tree, including fruits and fruit extracts, are poorly known, and only a few reports on the topic are available [
14,
15]. The results presented in those publications showed that bird cherry fruits contain a number of compounds including polyphenols and bioactive compounds, especially vitamins, and many of the above are known antioxidant agents. The studies showed that 3-rutinoside and 3-glucoside of cyanidin are the main flavonoids detected in bird cherry fruits [
16]. The strong antioxidant properties of cyanidin 3-glucoside was reported by Smyk et al. [
17].
A review regarding phytopharmacological properties and its bioactive compounds was presented by Telichowsaka et al. [
18]. The authors showed that different parts of the plant, including fruit, contain many active compounds such as polyphenols, flavonoids, tocopherols, vitamins, terpenes, and cyanogenic glycosides. Most of them possess a beneficial influence on health, having antioxidant, antimicrobial, and anti-inflammatory activities.
A very thorough examination of the wild prunus fruit composition was carried out by Mikulic-Petkovsek at al. using HPLC-DAD-MSN analysis [
15]. They confirmed the presence of sugars, organic acids, carotenoids, tocopherols, chlorophylls, and phenolic compounds. The antibacterial action of extracts of bird cherry was also reported [
19]. In addition, shrouds of bird cherry are very invasive and its presence is almost everywhere including forestry where it may become a problem [
20]. Thus, any practical utilization or application of any part of this plant will be of great importance.
The above presented consideration indicates that there is some knowledge regarding the chemical composition of bird cherry extracts; however, there is scarce knowledge regarding its possible action and role during its antioxidant action in biological membranes. As lipid peroxidation causes oxidative damage to cell membranes and all other systems that contain lipids, in investigation of the total antioxidative activity of plant extracts, it is necessary to investigate their effects on lipid peroxidation.
To understand and explain the putative antioxidant properties of the reported presence of phenolics in bird cherry extracts, its composition and scavenging properties against generated peroxyl radicals were determined. The antioxidant properties of sirup and solvent extracts from bird cherry fruits against free radical oxidation as well as their inhibition potential of lipid peroxidation in soybean L-α-phosphatidylcholine (PC) liposomes used as a model of oxidation of one of the important membrane components were investigated.
2. Materials and Methods
2.1. Chemicals
Methanol, ethanol, chloroform, acetone, and DL-α-tocopherol (α-T) were purchased from Merck (Darmstadt, Germany). L-α-phosphatidylcholine (PC) from egg yolk, the generator of free radicals 2,2′-azobis(2-amidinopropane) dihydrochloride (AAPH), 2′,7′-dichlorofluorescein diacetate (DCFH-DA), and 1,1-diphenyl-2-picrylhydrazyl (DPPH), was obtained from Sigma-Aldrich (Steinheim, Germany). Fluorescent probe C11-BODIPY581/591 [4,4-difluoro-5-(4-phenyl-1,3-butadienyl)-4-bora-3a,4a-diaza-s-indacene-3-undecanoic acid] was purchased from Invitrogen (Carlsbad, CA, USA). The used water was purified by a MicroPure Water System (TKA, Niederelbert, Germany).
2.2. Preparation of Extracts
First, the bird cherry fruits were lyophilized, and then they were crushed with a pestle in a ceramic mortar. The obtained powder was suspended in a proportion of 10 g per 60 mL in different solvents: acetone, methanol, ethanol, and water. Next, the suspensions were incubated during 1 h at a 50 °C temperature in an ultrasound bath. After that, the obtained supernatant was filtered to remove solids and the remaining solid material in the sample was extracted again. Then, both extracts were added and, using a vacuum evaporator, the dry mass of each extract was obtained. Only pure native juice was directly obtained from squeezed fruits. Stock samples were diluted directly before measurements. The dilution was adjusted as required for absorption and fluorescence measurements.
2.3. Spectroscopic Measurements
To estimate the composition of obtained extracts for each sample, we measured the absorption spectra in the UV–Vis range and the fluorescence spectra at different excitation wavelengths. The steady-state absorption and fluorescence spectra of extracts were measured for each extract dissolved in a water concentration of 10 mg/mL, and additionally diluted directly before measurements to a concentration of 0.48 mg/mL (0.1 mL of stock solution was added to 2 mL of water). The absorption spectra were collected with the use of a Shimadzu UV-1201 spectrophotometer (Kyoto, Japan), and the fluorescence spectra—Shimadzu RF 5001PC fluorimeter (Kyoto, Japan). For fluorescence measurements, 90° (L-shaped) geometry was applied.
2.4. HPLC Measurements
High-performance liquid chromatography (HPLC) was performed with a Waters system with a binary gradient-forming module Waters 1525, diode-array UV–Vis detector Waters 2998, and fluorescence detector Waters 2475. HPLC analyses were performed on an Inertsil ODS-3 Column (5 µm, 4.6 × 250 mm) at 25 °C, eluted with 1% HCOOH aq., using a linear gradient of 0–30% of acetonitrile over 15 min, then 40% of acetonitrile over 10 min at a flow rate of 1 mL/min. Then, 10 µL of solution was injected. ESI–MS spectra were recorded using a ZQ Waters-Micromass Spectrometer.
2.5. GC-TOFMS Measurements
In order to identify extracts’ components and to indicate differences in composition between them, GC-TOFMS analyses were conducted. At the beginning, 10 mg of the freeze-dried extract was mixed with 0.1 mL of derivatization reagent BSTFA (N,O-bis(trimethylsilyl)trifluoroacetamide, 99%) and incubated for 60 min at 75 °C. Then, 0.3 mL of hexane was added. The samples were filtered and then injected (1 µL) to the chromatograph inlet. The analysis was conducted using the PEGASUS 4D GCxGC-TOFMS gas chromatograph (LECO Corp., St. Joseph, MO, USA) equipped with a BPX5 (5% phenyl equivalent, 28 m × 0.25 mm; 0.25 μm) capillary column (SGE Int., Melbourne, Australia).
Helium was used as a carrier gas (1.0 mL/min), and the ion source and transfer line temperature was set at 250 °C. The oven temperature program was as follows: 30 °C maintained for 2 min, followed by a heating ramp to 300 °C at a rate of 10 °C min−1, and the final temperature maintained for 15 min. The ionization source was operated in the positive ion mode (−70 V), and the acquisition rate was set to 10 spectra/s.
2.6. FTIR Measurements
The FTIR spectra were obtained using a Spectrum Two FT-IR spectrometer equipped with a Universal ATR with a diamond crystal (PerkinElmer, Waltham, MA, USA). The data were collected over a spectral range of 4000–500 cm−1. The measurements were repeated three times for each sample.
2.7. Oxidation Tests
2.7.1. Determination of Total Antioxidant Capacity by Inhibition of DCF-H Oxidation
The antioxidant properties of extracts in isotropic medium were also evaluated by fluorometric methods—we tested the influence of the extract and reference sample (gallic acid at final concentration of 12 μM) on free radicals produced by AAPH with the DCF-H fluorescence probe (obtained from the diacetate form—DCFH-DA). For that purpose, to 2 mL of phosphate buffer (pH = 7.4) stored at 40 °C of water, a 15 μL extract solution in water (0.01 g/mL; final content in the sample was 0.07 μg/mL) was added followed by the addition of a 20 μL DCF-H solution (1 mM) and 50 μL AAPH water solution (0.2 M) under constant stirring at 40 °C. The efficiency of free radical inhibition was assessed by relative changes in the fluorescence intensity of DCF (520 nm) created as a result of peroxidation. Measurements were conducted for 10 min with a 1 min interval. The gallic acid at a concentration range of 0–20 μM was chosen as reference samples.
2.7.2. DPPH Method
Scavenging of DPPH free radicals is one of most commonly used tests for antioxidant properties. To determine the scavenging efficiency of DPPH, we applied slight modifications to the traditional method (which includes usually only the measurement of absorbance after 20 min of incubation). Briefly, we prepared the following samples to perform the test. A 15 μL volume of each extract examined (0.01 g/mL in water) was added to a 2.2 mL methanol solution of DPPH, and its absorbance changes at 517 nm in specified time periods was evaluated, starting with the moment of addition. The 12 μM water solution of gallic acid in the final sample was chosen as a reference (aliquot volume of stock solution was added to 2.2 mL of DPPH methanol solution).. Measurements were conducted until the stabilization of each curve individually to establish the maximum scavenging ability of each extract examined. For scavenging performance assessment, the following formula was used:
where A
0 and A
min are absorbance values of DPPH at 517 nm before antioxidant addition and for the plateau (the lowest absorbance value detected) as a result of antioxidant agent addition, respectively.
2.7.3. Thermal Oxidation of PC Liposomes
The liposomes were prepared by the extrusion method according to Neunert at al. [
13]. For liposomes preparation, dry PC was dissolved in chloroform without any compounds (blind probe) or mixed in required proportions with DL-α-tocopherol dissolved in methanol, for final concentrations of tocopherol 12 µM (“tocopherol in membrane”). Then, the solvents were removed under vacuum at 30 °C by a rotary evaporator (Büchi Labortechnik AG, Flawil, Switzerland). The formed PC dry film was hydrated with 0.1 M phosphate buffer (pH 7.4) and vortexed for 10 min at 22 °C until the solution became clear. Next, the liposome suspension was extruded repeatedly 11 times through a 100 nm pore polycarbonate filter using the LiposoFast Basic LF-1 extruder (Avestin, Mannheim, Germany). The final concentration of lipids was 0.08 mg/mL with a mean liposome size of 100 nm as confirmed by dynamic light scattering (DLS) measurements using a Zetasizer Nano (Malvern Instruments, Worcestershire, UK) at 20 °C under an angle of 90°. The mean values of the liposome size of 100 nm was determined from analysis of the number of peaks from a few different samples (from different series). The mean results of DLS measurements are presented in
Supplementary Material (Figure S1). The stability of the liposomes was confirmed by zeta potential measurements. The average zeta potential of the liposomes was −17.6 mV. Moreover, the low average values observed for the polydispersity index (Pdl) equal to 0.15 revealed a good degree of homogeneity among the investigated samples.
The thermal oxidation of PC liposomes was realized as follows. The 15 μL of water solution of each extract (or aliquot volume of gallic acid water solution and tocopherol methanol solution—to obtain the final concentration of this compound of 12 μM) was added to 2 mL of PC liposomes in phosphate buffer (0.08 mg/mL) and left at ambient conditions for 30 min under stirring (magnetic stirrer at the rate of 150 RPM). After that time, the blind probe and the samples with extracts were placed in 40 °C under constant stirring and 16 μL of methanol solution of C11-BODIPY581/591 (0.5 mg/mL) was added. Fluorescence measurements of each sample (λex = 505 nm, λobs = 520 nm) were repeated in a 10 min time interval starting with C11-BODIPY581/591 addition up to stabilization or a noticeable drop in fluorescence intensity.
2.8. Data Evaluation and Statistical Analysys
Each sample was measured at least three times and average values with standard deviations were calculated (where necessary).
3. Results
The chemical composition of extracts was estimated with absorbance and fluorescence spectroscopy, HPLC, and GS–MS methods. The antioxidant properties of extracts in aqueous phase against 2,2′-azobis(2-amidinopropane) dihydrochloride (AAPH)-generated radicals were determined using a fluorescent probe of 2′,7′-dichlorofluorescein (DCF-H). The inhibition of lipid peroxidation in PC liposomes of the extracts was estimated using a fluorescent sensor C11-BODIPY581/591 [4,4-difluoro-5-(4-phenyl-1,3-butadienyl)-4-bora-3a,4a-diaza-s-indacene-3-undecanoic acid]. To approach a more realistic model of biological membranes, or at least a model of one of the important components of real biological membranes, the unilamellar- and homogenous-size-distribution PC liposomes in liquid-crystalline phase were used. As the applied PC liposomes are not a direct model of the cell membrane, it is worth noticing that we did not aim to create a model of a biological membrane; thus, such important components as cholesterol or proteins were not included. The use of PC was intentional as it possesses a low-main-phase transition temperature; thus, at room temperature, it exists in the fluid phase. It is a phase where biological processes occur, including the fastest permeation and inclusion of different compounds into the membrane interior. In addition, in PC from egg yolk, there is a number of unsaturated fatty acids prone to fast oxidation.
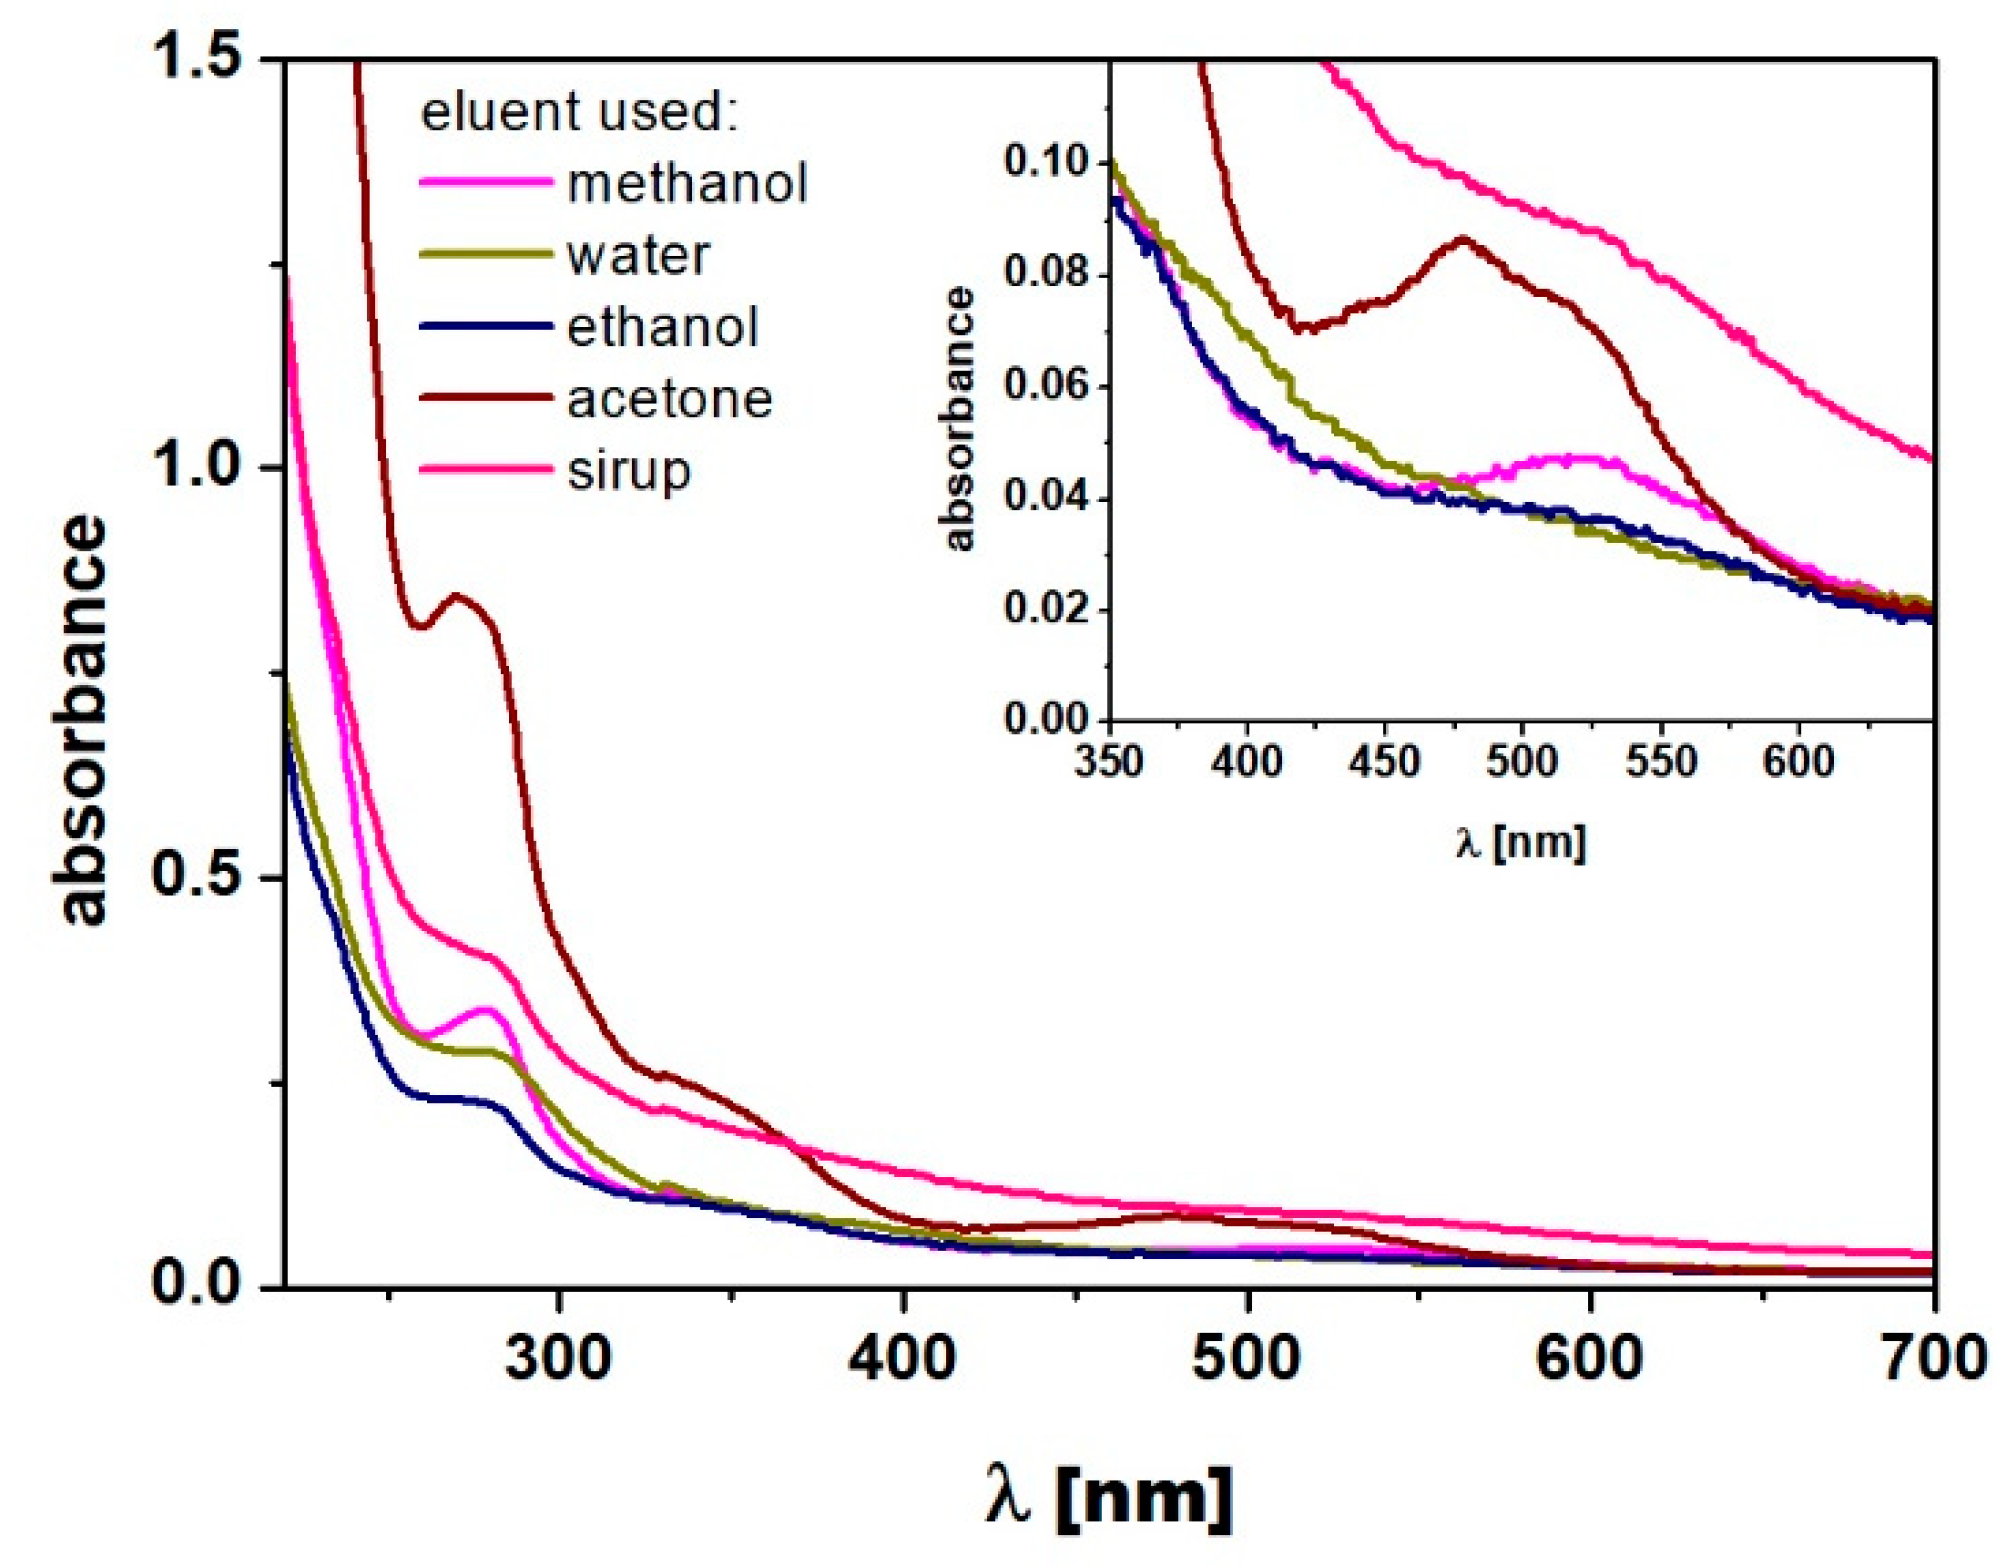
3.1. Absorption Spectra
The fact that phenolic compounds are organic compounds containing s-bonds, p-bonds, lone pairs of electrons, and chromophores where most of them in their structure composes the aromatic ring with many attached moieties, they exhibit strong absorption in the UV region originated from electronic transitions in molecules. Its presence is a source of vibrational molecular motions, thus giving the possibility of using IR spectroscopy to detect the presence of characteristic chemical groups, allowing the identification of polyphenols, flavonoids, and alkaloids.
The absorption spectrum of acetone extract shows one clearly visible peak at 270 nm and two wide ranges: at about 350 nm and the second at 475 nm. This indicates that this solvent is more specific than the other as the spectra of the other extracts and sirup (juice) are less structured with only one clearly visible peak at 280 nm. However, in the visible part of spectra, we may detect some specific peaks, as shown in the inset in
Figure 1. Therefore, local absorption maxima are observed at 400 nm in water extract, at 527 nm in methanol, and at 479 and 516 nm in acetone. The smoothest spectrum with barely visible peaks is observed for sirup, however, with absorption values in the whole range of the investigated spectrum area. This means that the recorded juice spectrum is an overlapped sum of absorption of all compounds present in natural juice, which is partially detected with other extracts. The distinct absorption bands at 270–280 nm are characteristic of tocopherols, gallic acid, or other phenolic acids and flavonoids. The range of 350–400 nm can be assigned to ascorbic acid and indicate the presence of flavonoids (II absorption band). The range between 410 and 550 nm is characteristic for flavonols and alkaloids, and the presented assignment is similar to that reported [
4,
21,
22,
23,
24].
3.2. Fluorescence Emission and Total Fluorescence Spectra
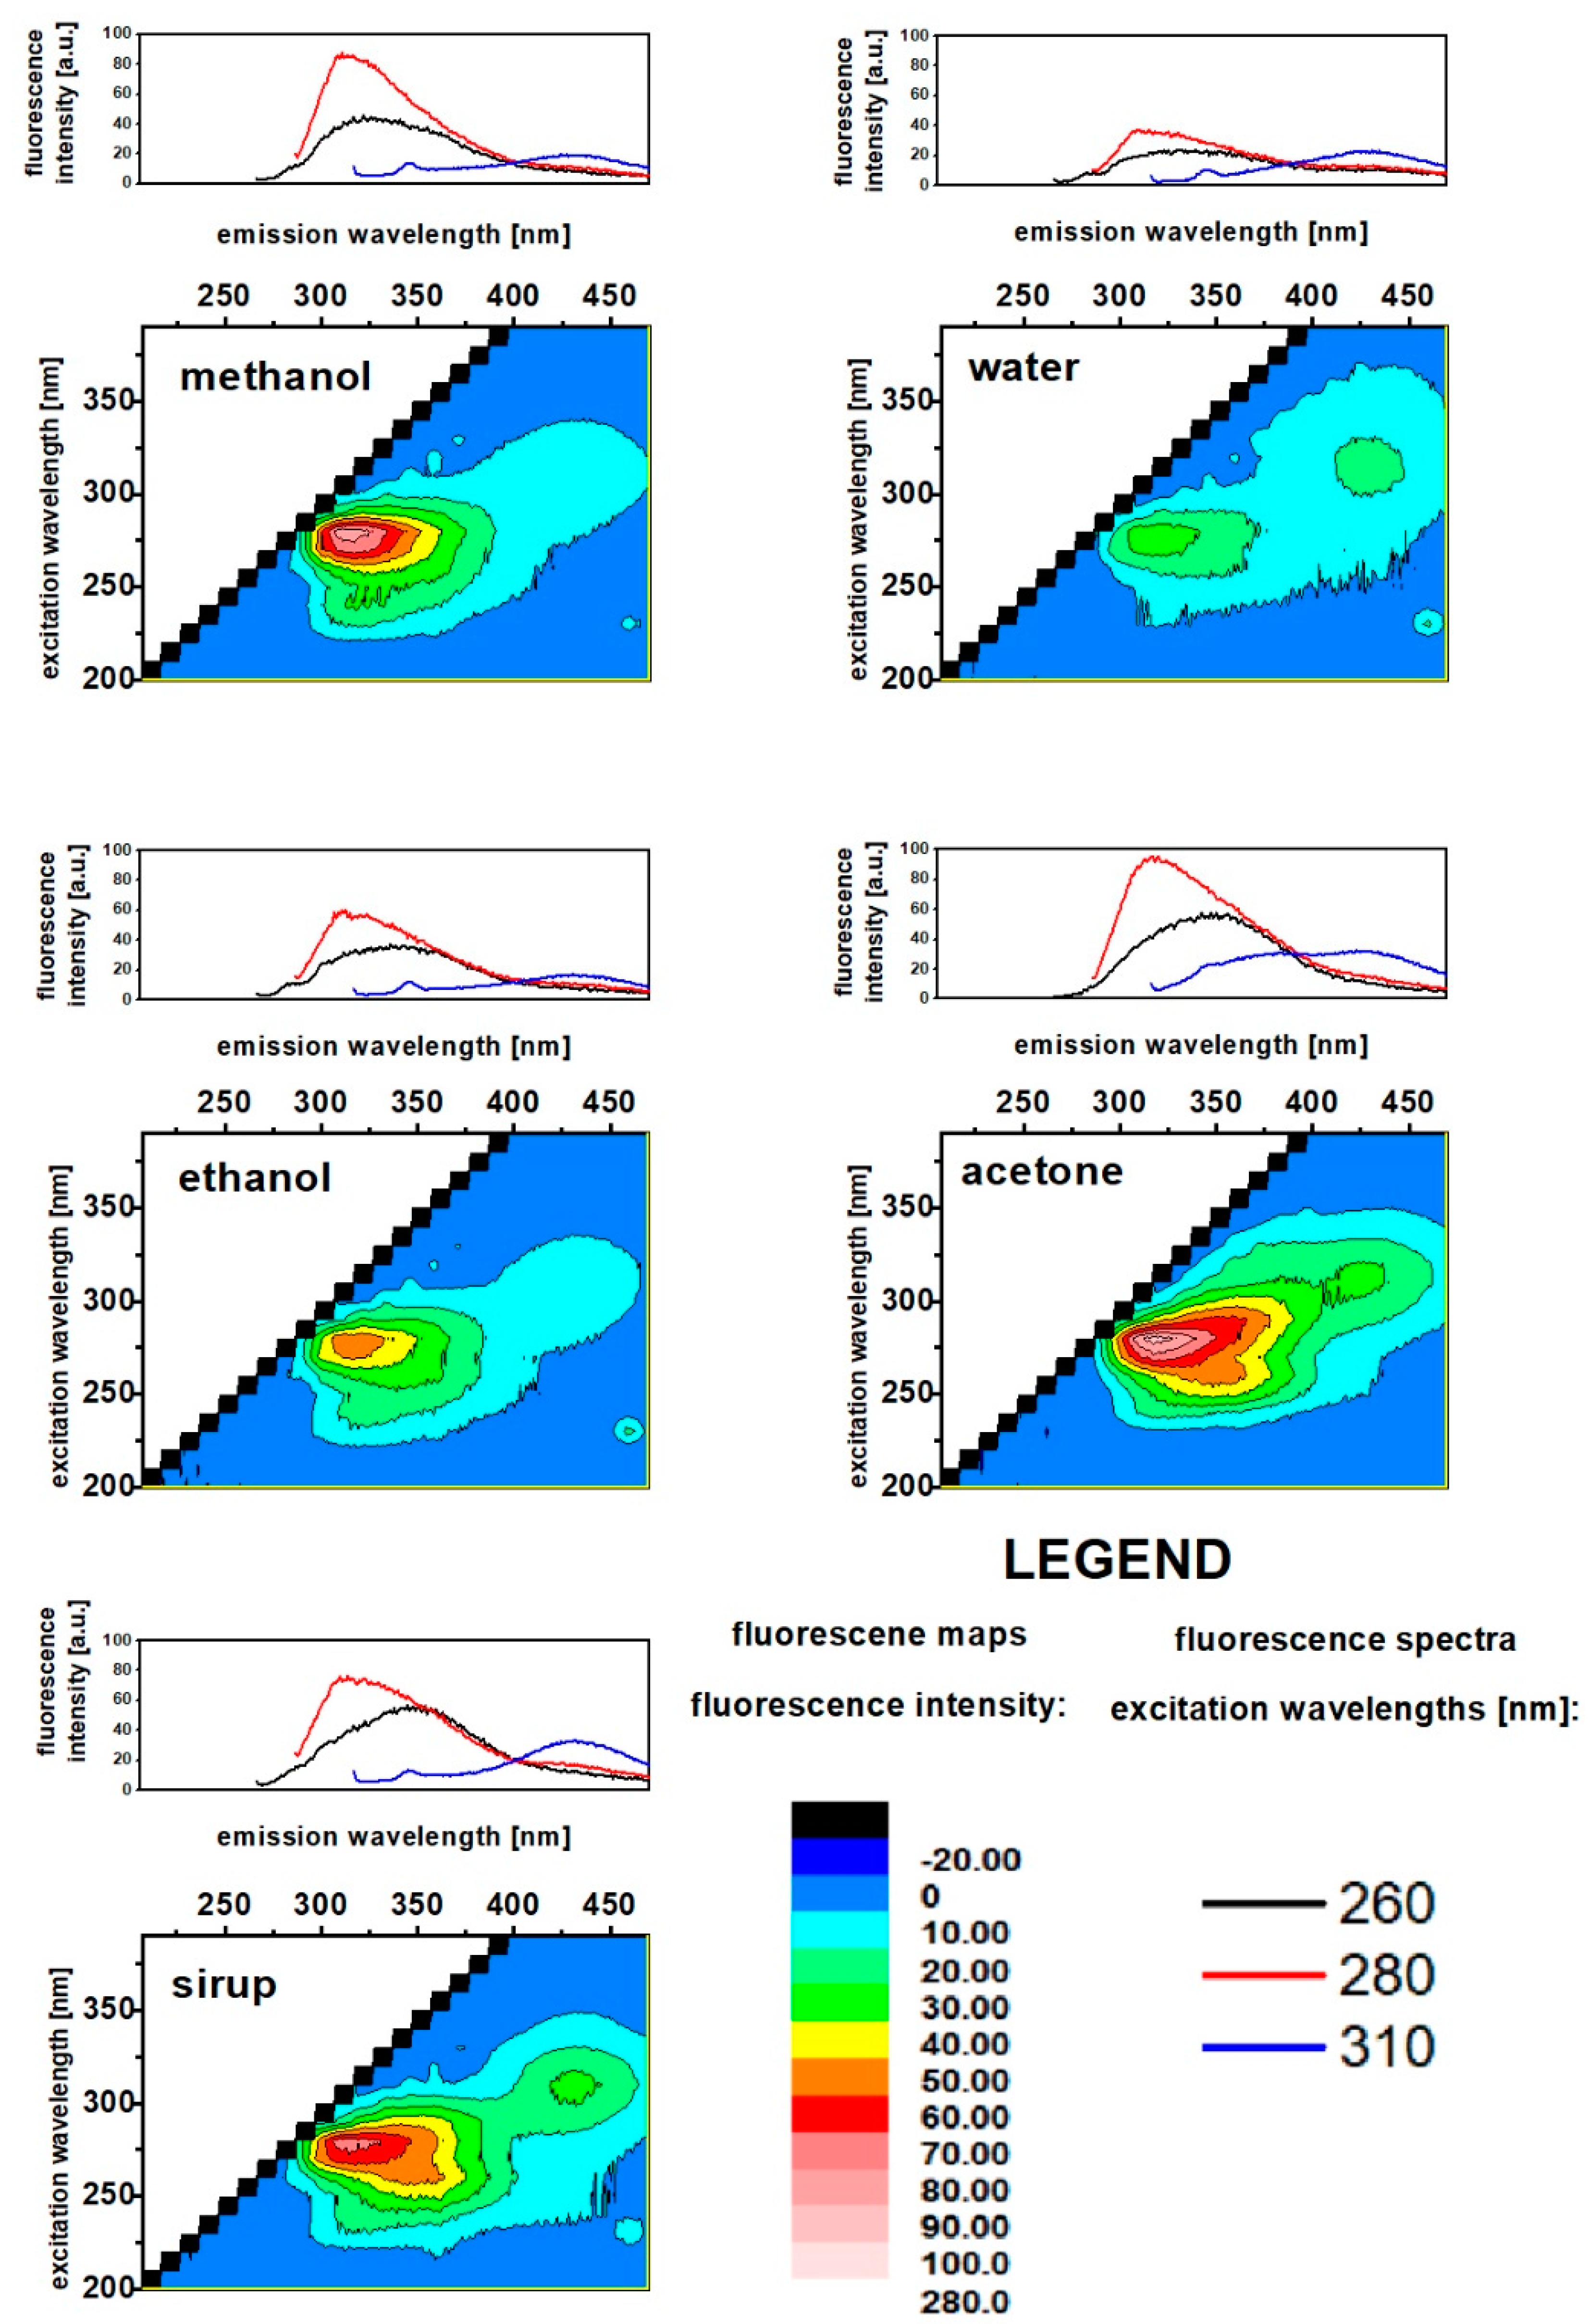
Fluorescence spectra were collected at the excitation range of 200 to 400 nm with 10 nm steps. This led to maps of total fluorescence presented in
Figure 2.
Analysis of the obtained fluorescence spectra revealed that three basic bands of fluorescence spectra shapes can be distinguished upon the excitation wavelength range. Representative fluorescence spectra are presented also in
Figure 2 (each set of fluorescence spectra is placed above the corresponding fluorescence map). From total fluorescence maps (
Figure 2), it follows that for all investigated samples, at least two fluorophores are present in each extract and in sirup. The longer the excitation wavelength is, the longer the fluorescence wavelength that takes place. The presence of two different fluorophores excited at wavelengths of 280 nm and 310 nm, respectively, is clearly seen for water and acetone extract, as well as for fresh sirup. Moreover, detailed insight into the set of fluorescence spectra of each extract reveals the presence of a third fluorophore (less manifested due to the much lower fluorescence intensity of the compound). The third component is characterized with a broad fluorescence band with a maximum close to 316 nm, which can be considered as the main fluorescence band, but slightly shifted to longer wavelengths (the shift depends on the extract) and substantially different shape.
Finally, we conclude that in the investigated samples, at least three fluorophores are present with fluorescence bands placed at 314–318 nm, 325–355 nm, and 428–435 nm, respectively (dependent on type of eluent used), which confirms the presence of phenolic acids in each sample [
25] and tocopherols [
13]. The most diversified in terms of the fluorescence (especially fluorescence intensity) of each fluorescent compound is acetone and methanol extract. For water extract, variations in the fluorescence intensity of each compound are much less visible. This leads to the conclusion that each solvent used elutes fluorescent compounds present in fruits and sirup with different efficiencies. The most efficient globally is the use of acetone as an eluent as the fluorescence of each compound is the most intensive among all investigated samples.
3.3. HPLC Results
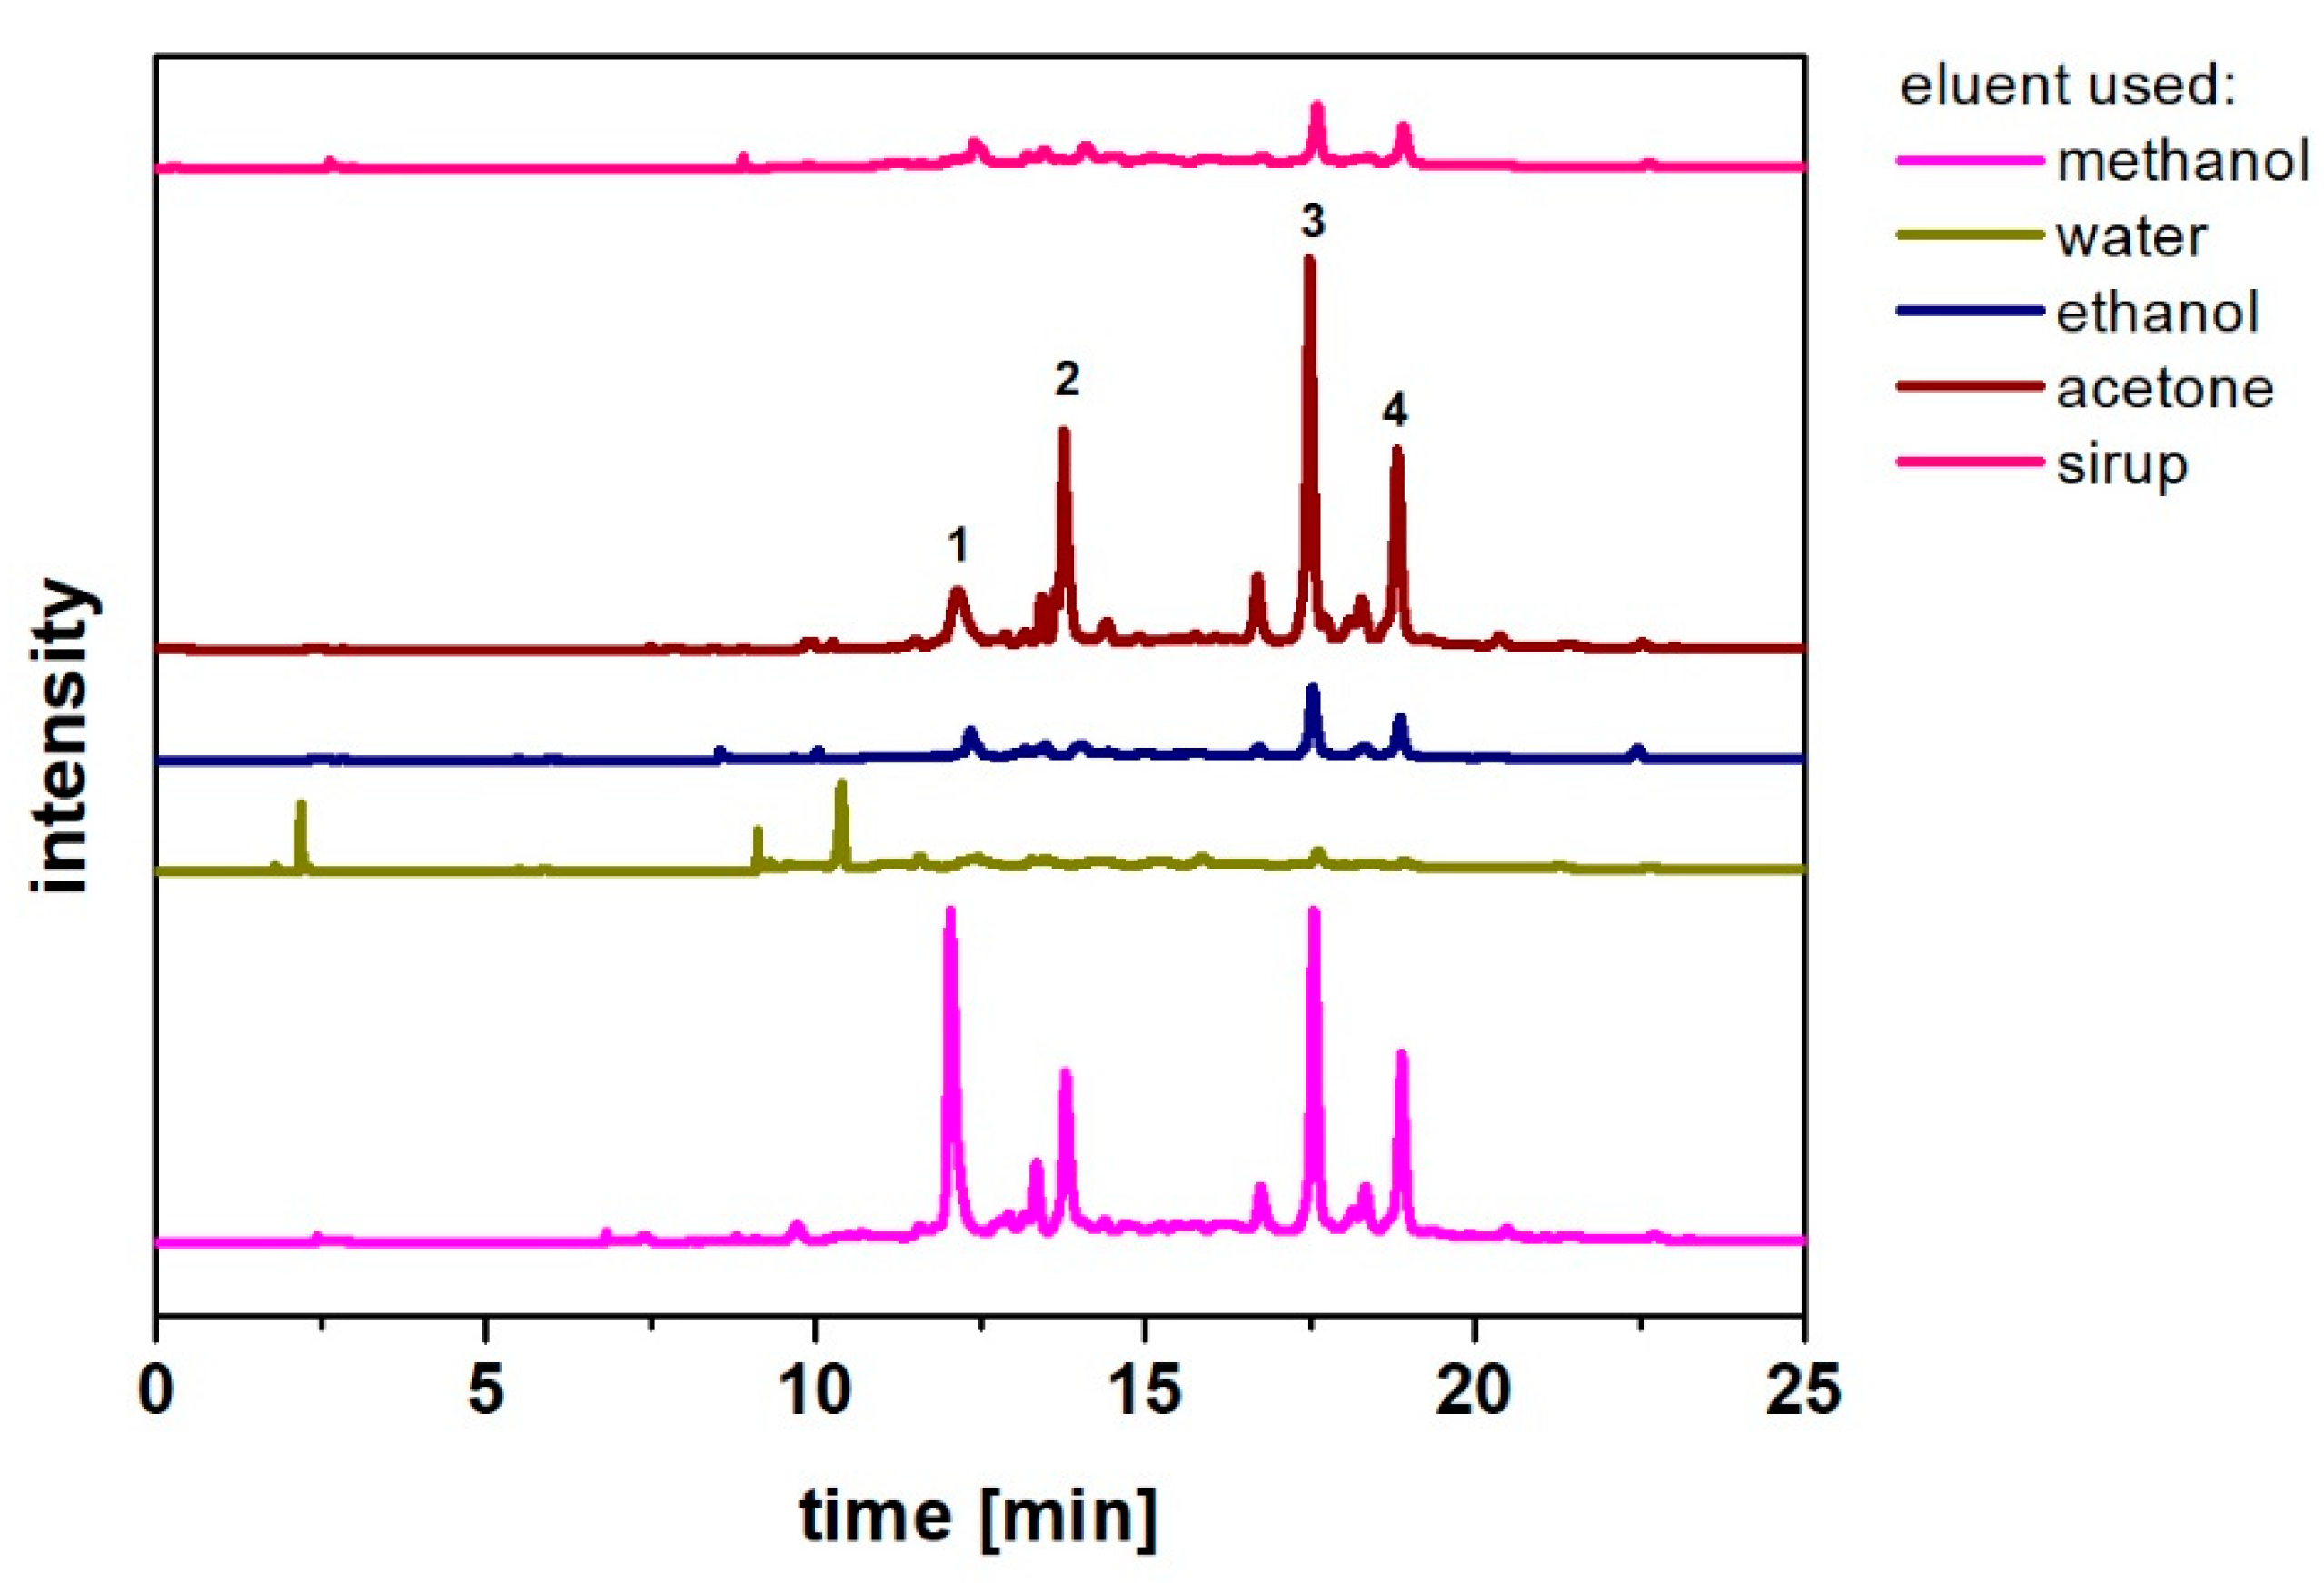
The chromatograms obtained for the investigated extracts and sirup are presented in
Figure 3 and
Figure S2. The four main peaks were clearly observed in nonaqueous extracts. The corresponding UV–Vis spectra of compounds
1–
4 are presented in
Figure S3. ESI–MS spectra were recorded for isolated compounds. The ESI–MS spectrum of compound
1 (r.t. 12.0 min) in positive mode (
Supplementary Figure S4) shows the three main ions at
m/
z 287, 449, and 595, which correspond to the cyanidin chromophore itself, and glucoside and rutinoside of cyanidin, respectively. The compounds with retention times of 17.5 min (marked 3) and 19.0 min (marked 4) are glycosides of quercetin, as, in both cases, ESI–MS spectra contain the same ion signals at
m/
z 303 in positive mode. In the case of compound
3, it is difficult to distinguish between glucoside or galactoside of quercetin as the obtained
m/z signal is 463 (negative mode) (
Supplementary Figure S5). The ESI–MS spectrum of compound
4 contains a signal at
m/z 433 (negative mode), which can be arabinoside of quercetin (
Supplementary Figure S6). In the case of compound
2 with r.t. 13.8, its UV–Vis spectrum and retention time were identical to the chlorogenic acid standard sample (
Supplementary Figures S2 and S3).
Therefore, the HPLC chromatographic method was used to quantify and specify the presence of phenolic and flavonoid compounds in the investigated extracts, which was supported by UV–Vis and ESI–MS spectra of isolated compounds (
Table 1). The obtained results show the highest amount of cyanidin in methanol extract; however, in acetone and ethanol extracts, it was also detected. The chlorogenic acid and quercetin glycosides were clearly visible in sirup and all extracts except water extract in which no presence of any of compounds
1–
4 were detected.
3.4. GC–MS Results
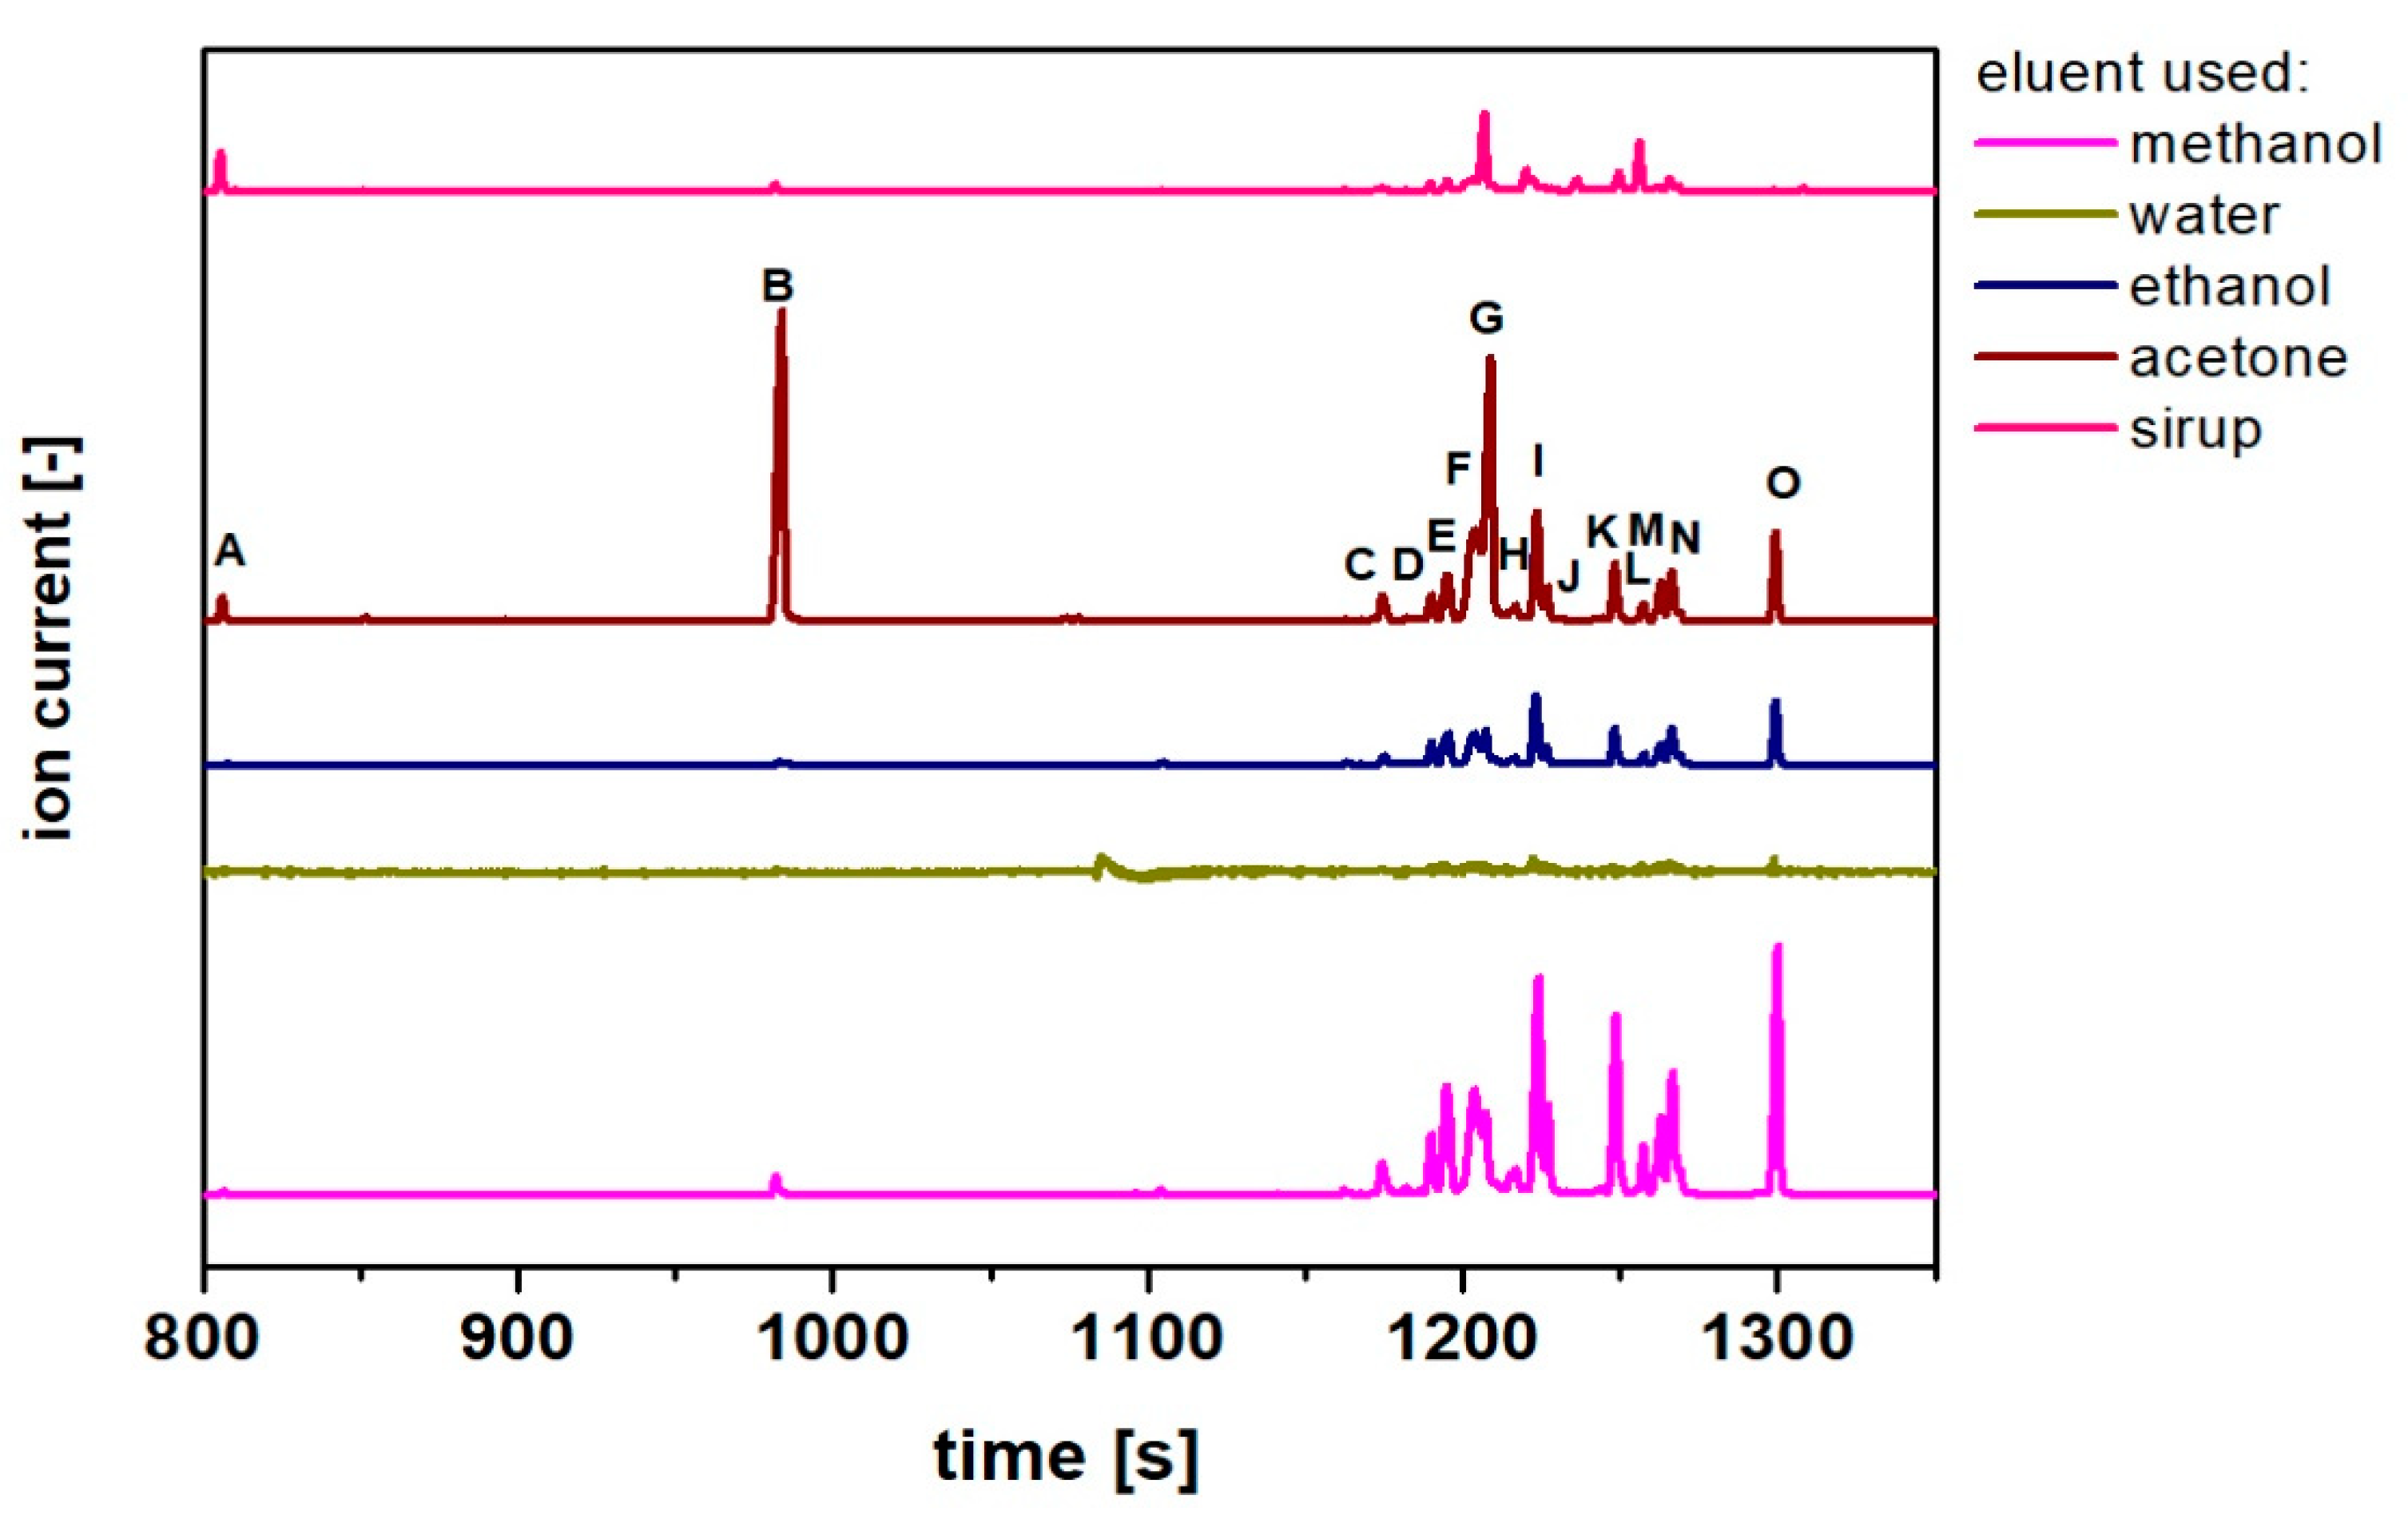
Gas chromatography analysis is mainly dedicated to volatile and/or hydrophobic compound analysis and identification. However, the derivatization procedure gives the possibility to increase its applicability to more polar compounds. The chromatograms of the analyzed extract are presented in
Figure 4. The list of compounds with possible identification (based on MS spectra of standard compounds) is presented in
Table 2. The results obtained show the variation in the composition of the different extracts. The acetone and methanol extract samples proved to be the most complex (after derivatization), and the water extract sample the least complex. In general, these observations are in good agreement with the HPLC results. However, it should be taken into account that silanized samples were analyzed by GC–MS, which will significantly change the selectivity of the analytical method; similarly, the identification of compounds should be considered as approximate, due to the complexity of the matrix, different susceptibility of the components to derivatization, and limitations in the availability of spectra of standards. However, it can be noted that the acetone extract sample contained relatively high amounts of carboxylic acids (such as citric and malic acids). In contrast, the methanol extract sample contained the most glucose and its derivatives (compared to other samples).
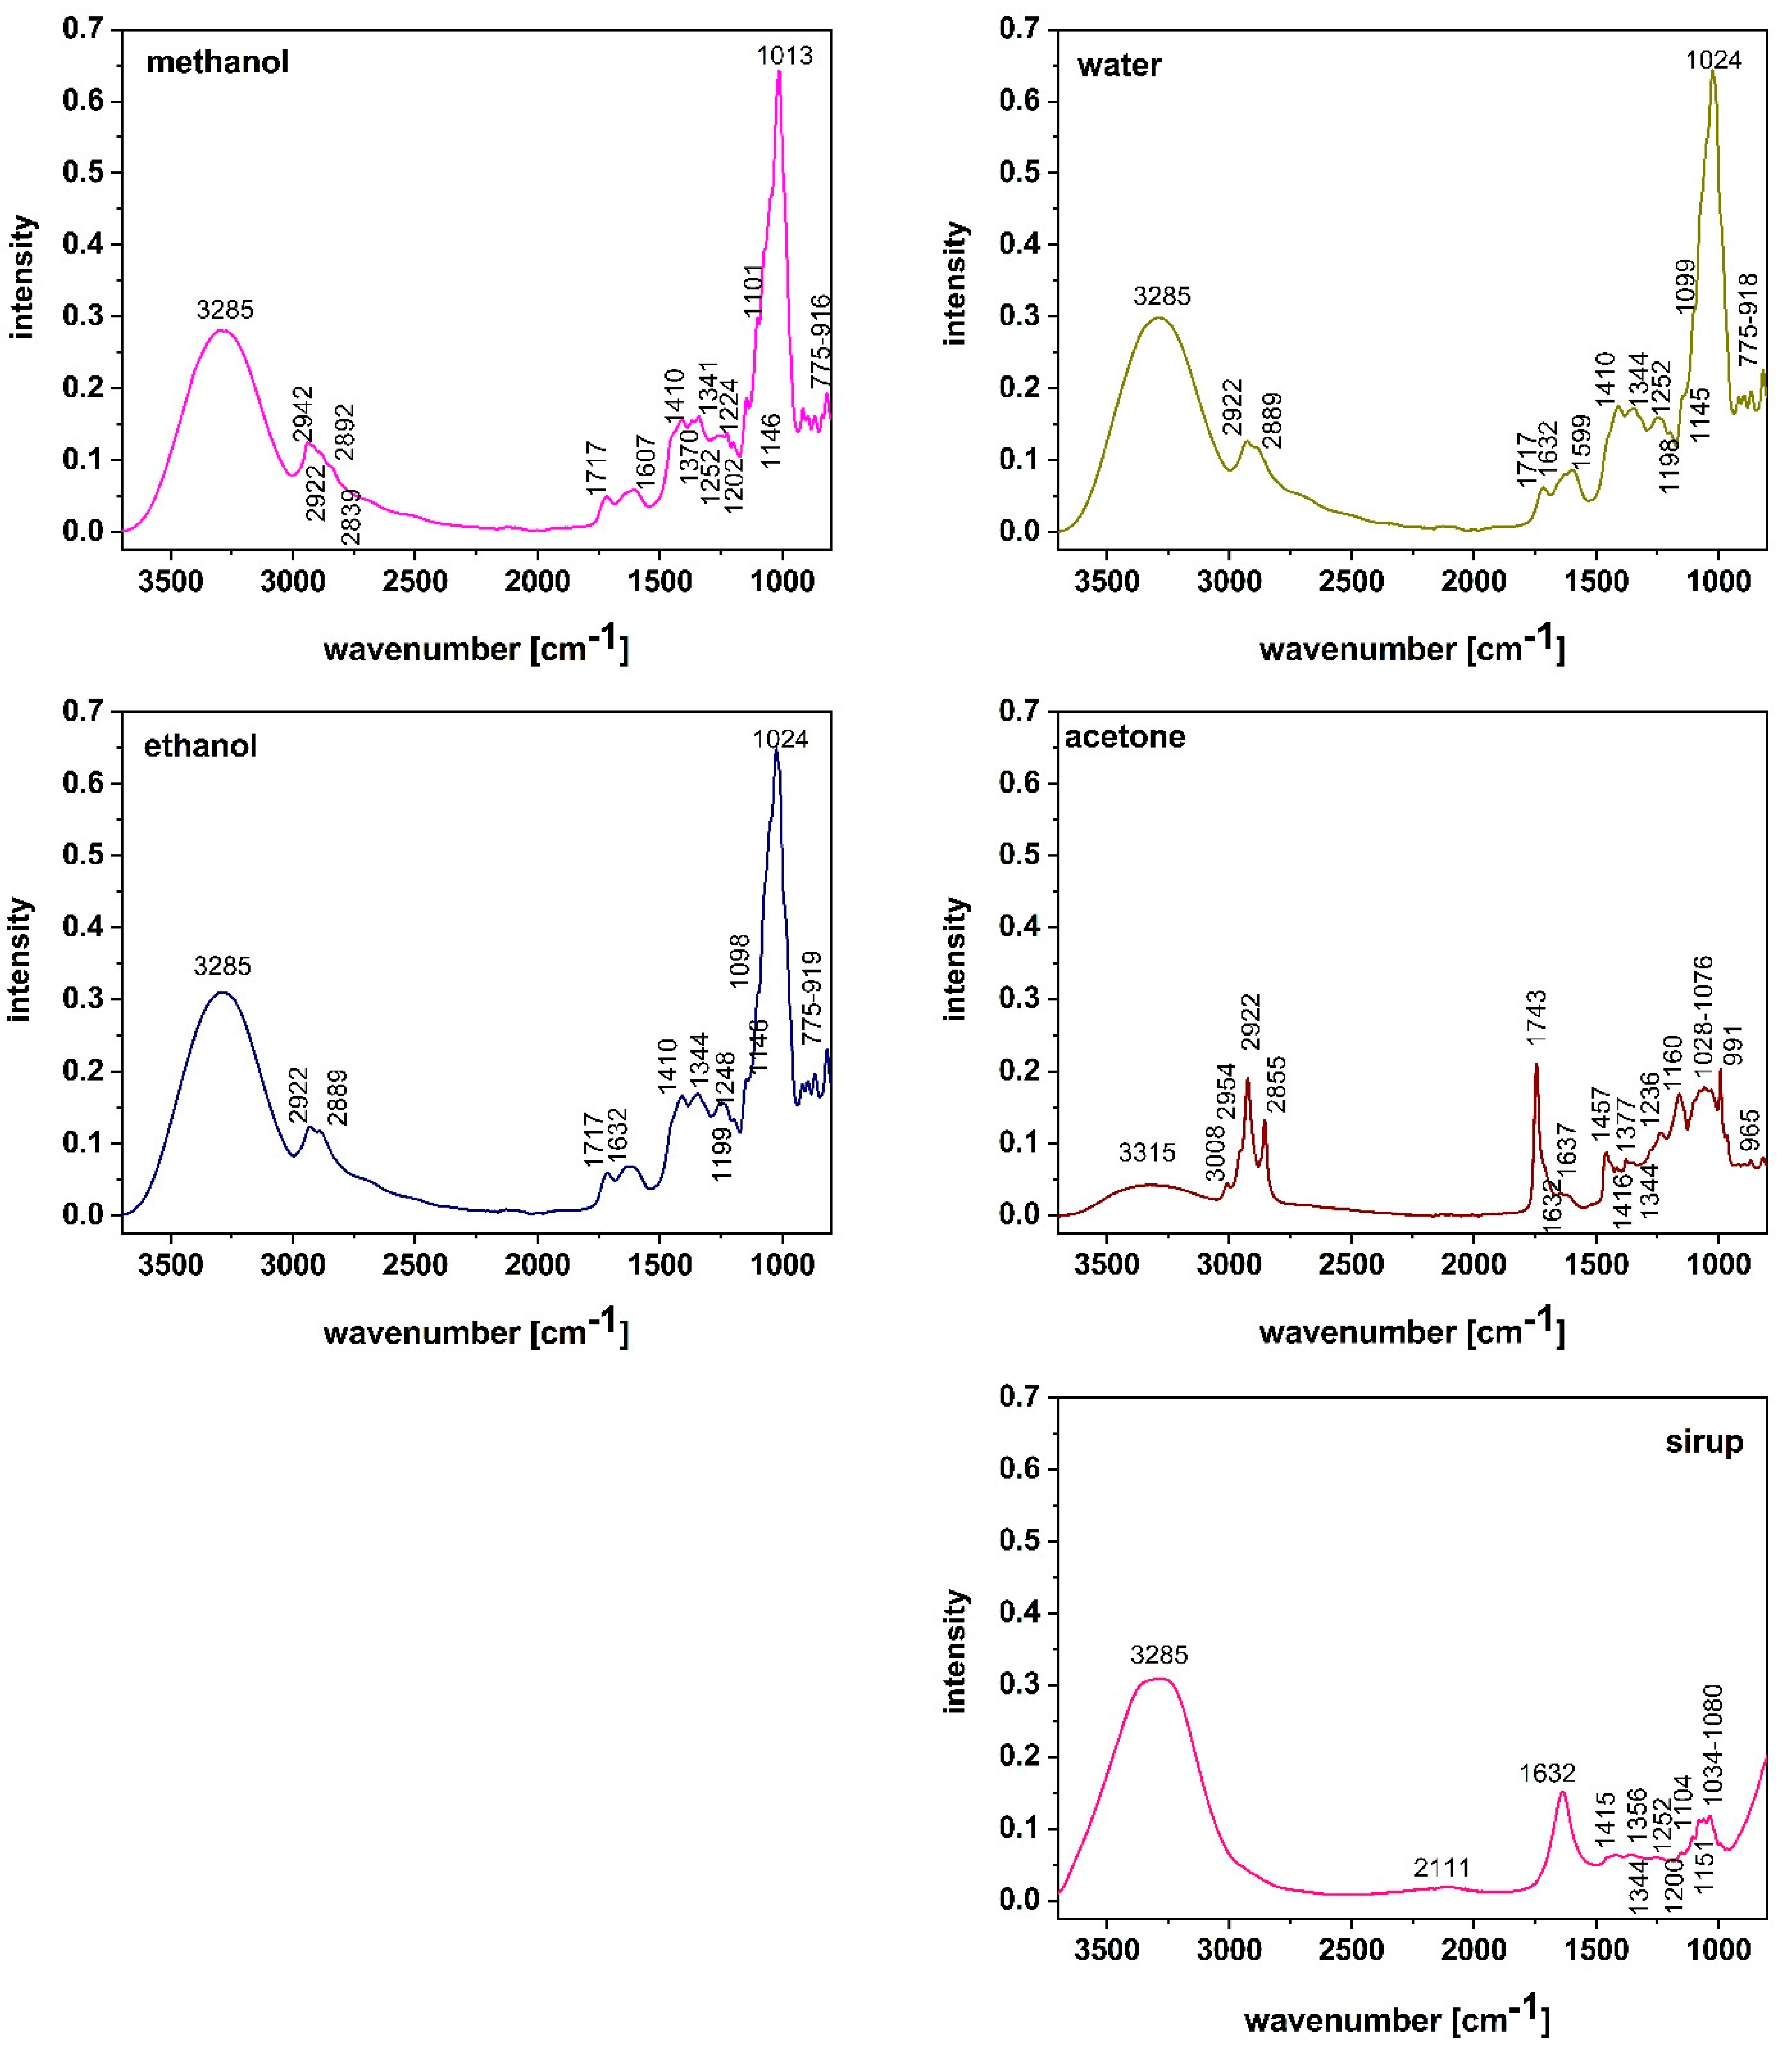
3.5. FTIR Results
FTIR spectra were used to determine the presence of active compounds identifying its functional groups. The results indicated the presence of various types of compounds including phenolic, flavonoids, and glycosides. The peaks’ positions are presented in
Figure 5.
The strong and broad band at 3285 cm−1 observed in extracts belongs to stretching vibrations of phenolic hydroxyl groups conforming to the presence of phenolic compounds in the investigated extracts. The peak at 2922 cm−1, 2890, and 2855 cm−1 belong to C-H stretching in the methyl and methylene group, indicating the presence of aromatic compounds. The band at 1632 cm−1 is related to the presence of the stretching vibration of C=O in aromatic ring deformation, related to the presence of flavonoids and amino acids. The band at 1717 cm−1 is related to stretching vibrations of the carboxyl group and indicates the presence of carboxylic acids. The band at 1410 cm−1 arises from C=C ring stretching. The band at 1344 cm−1 could be related to C-O stretching of acid groups or bending vibrations of CH3 or CH2 groups in carboxylic acid, indicating the presence of compounds related to alkenes. The presence of the cyanide group is particularly seen in sirup, at the range of 2260 cm−1. The lack of this peak in the investigated extracts shows its nontoxic nature, probably due to applied procedures. The band at 1252 cm−1 indicates the presence of aliphatic esters and would be assigned to C-O vibrations, indicating the presence of hydroxyflavonoids. The peak at 1024 cm−1 is connected with the C-O stretching band of alcohols, whereas the band at 1089 cm−1 would be related to secondary alcohols.
The presented FTIR spectra showed that fruit of bird cherry contains phenols, amino acids, carboxylic acids, alkanes, secondary alcohols, glycosides, and flavonoids and the assignment of groups and compounds are similar to those previously reported [
3,
11,
26].
3.6. Oxidation Tests
Considering the presence of antioxidant compounds, we performed additional tests to estimate the antioxidant potential of extracts of bird cherry fruits. The antioxidant properties of the obtained extract were determined with standard methods. For this purpose, we used 1,1-diphenyl-2-picrylhydrazyl (DPPH) free radicals and the oxidation of DCF-H, and the obtained results were compared with gallic acid, considered as standard. Moreover, to determine the possible role of the investigated extracts in membranes, we carried out our studies in a model membrane system consisting of PC liposomes in a solid-crystalline phase with the used C11-BODIPY581/591 probe.
3.6.1. Determination of Total Antioxidant Capacity by Inhibition of DCF-H Oxidation
The total antioxidant capacity of a biological material is defined as the resultant capacity of a test material to resist a specific oxidation reaction. As foods usually contain different antioxidants with often different mechanisms of action and different activities, the total antioxidant capacity is a useful concept for determining and comparing the antioxidant potential of different foods, body fluids, and other biological fluids [
27,
28].
On the basis of data presented in
Figure 6, the antioxidant efficiency of each extract was estimated as an equivalent of gallic acid concentrations. The results are presented in
Table 3.
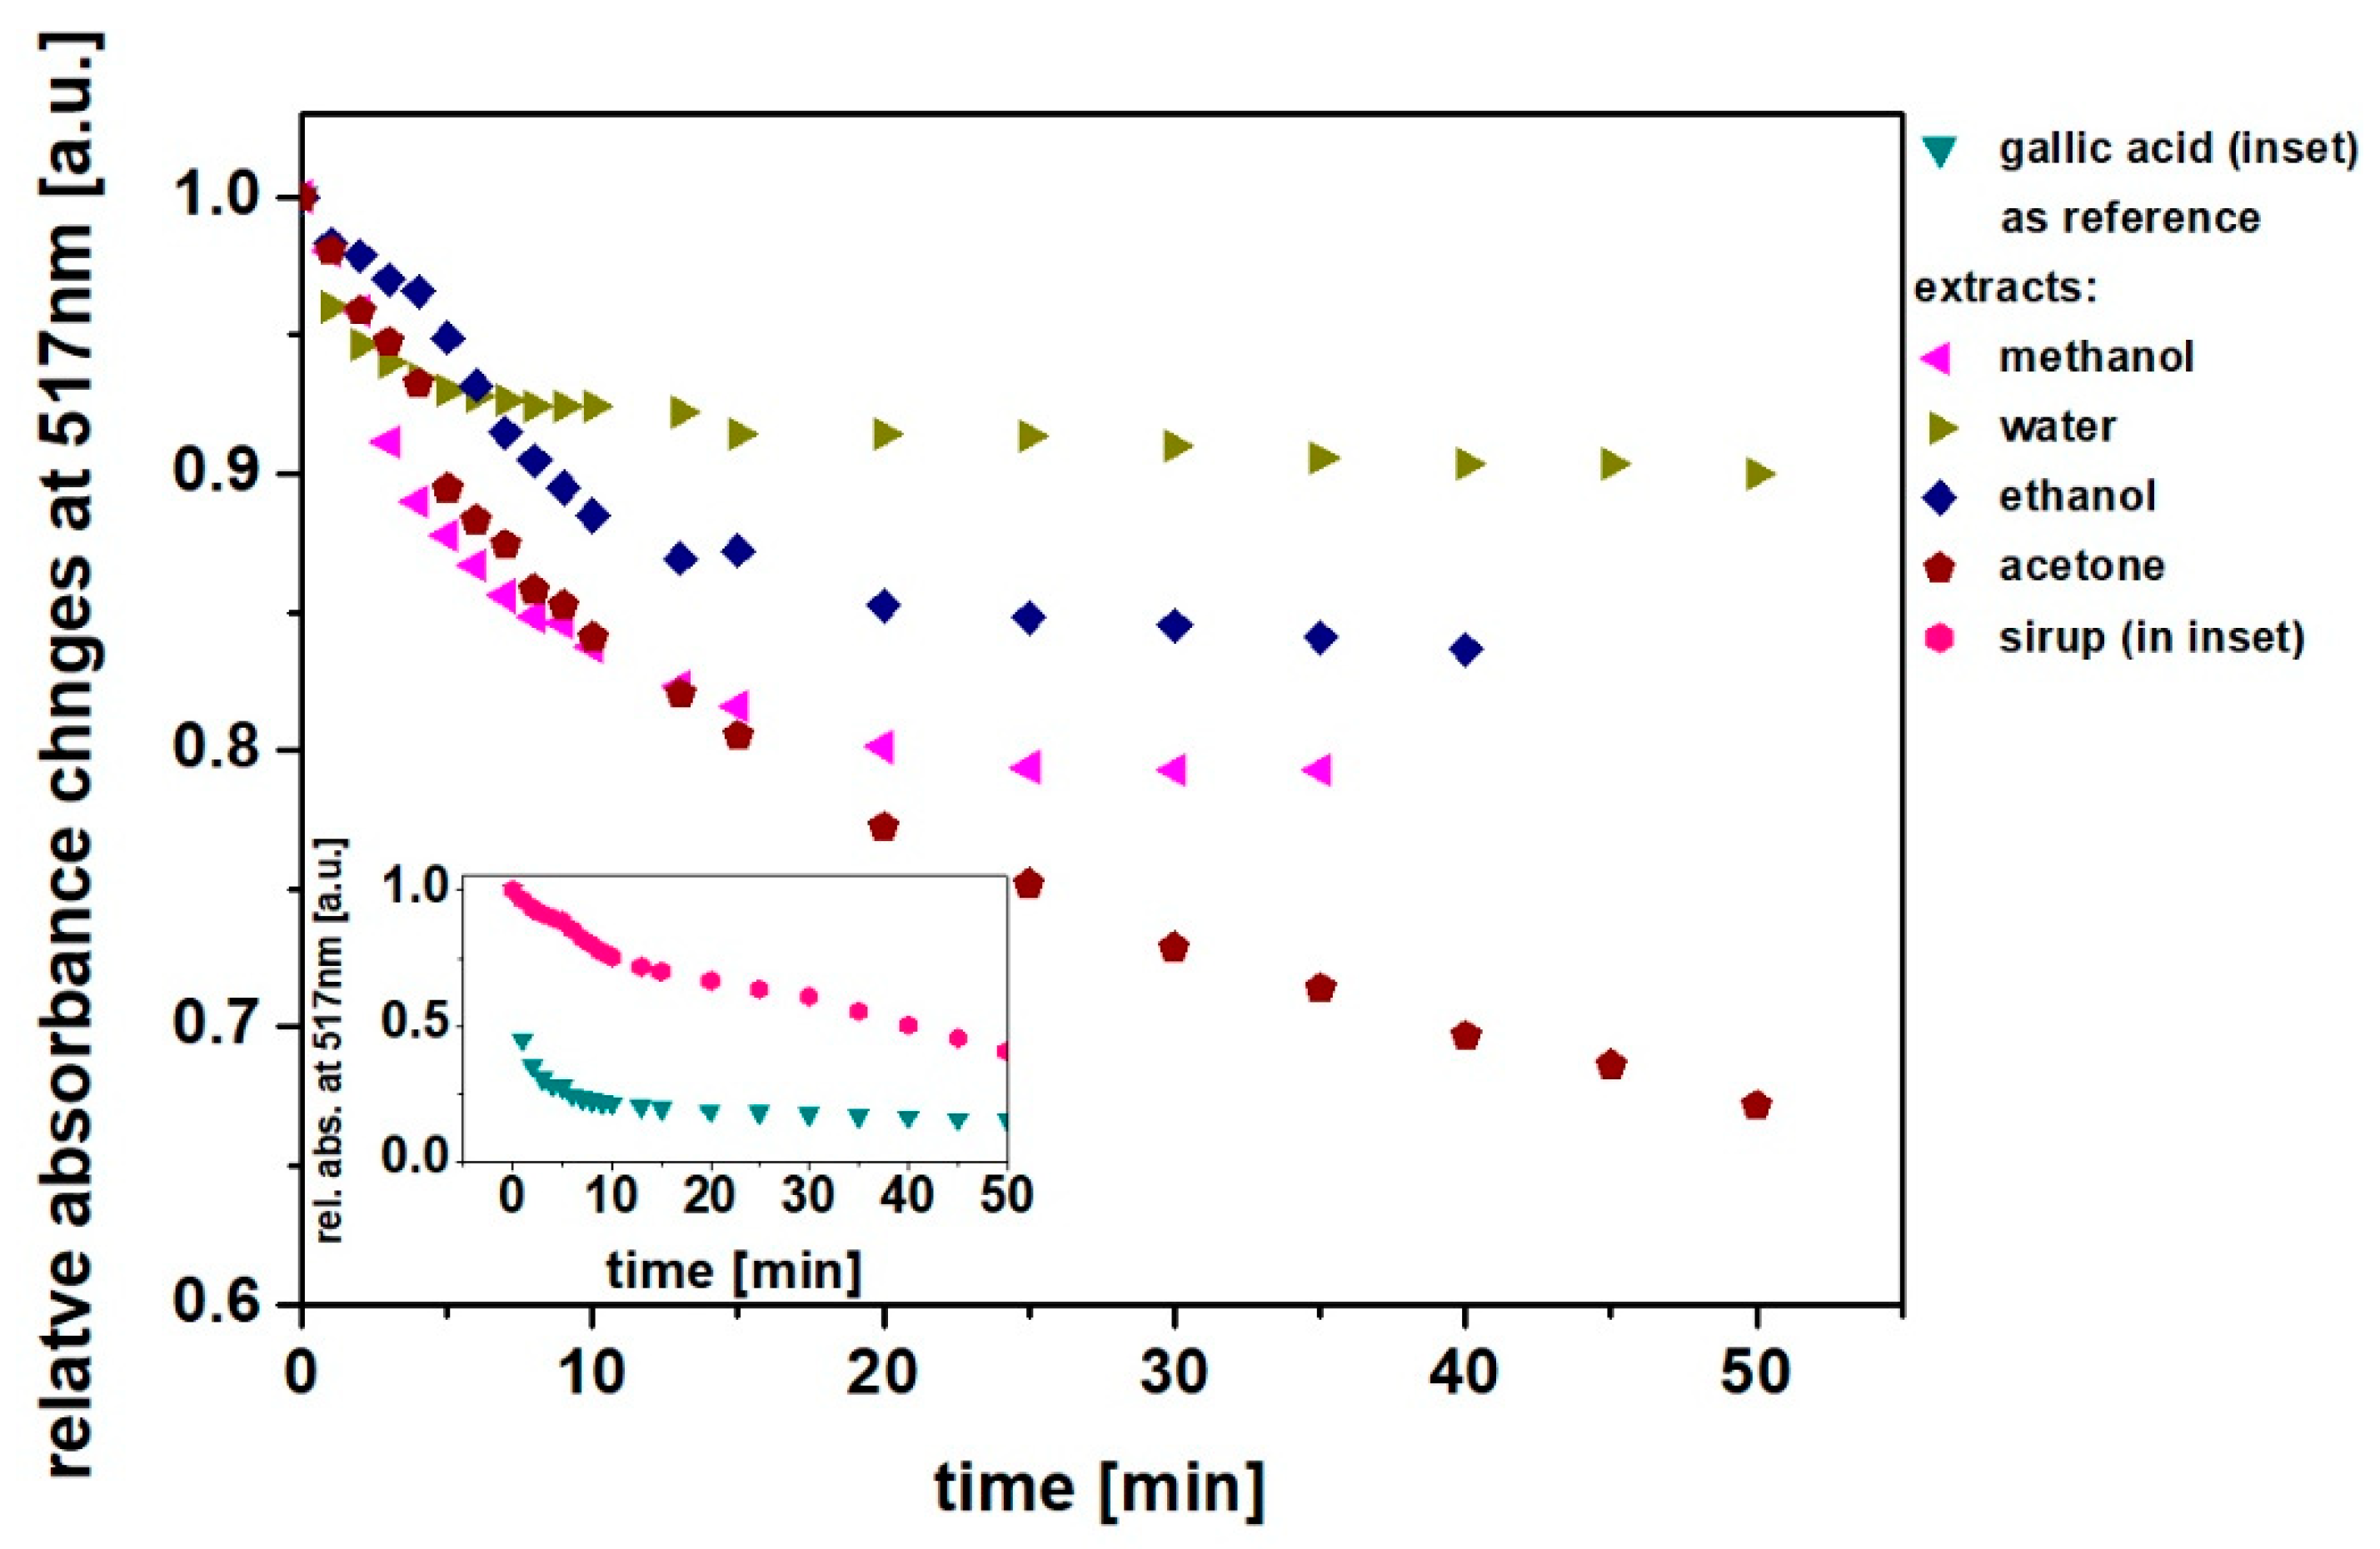
3.6.2. The Free Radical DPPH Scavenging Activity Assay
Determination of the antiradical activity of biological fluids with the use of DPPH is often included among the methods for determining the total antioxidant capacity based on the reduction in the indicator substance. This method is commonly used to measure the anti-radical activity of products such as fruit, juices, and plant extracts [
29,
30,
31,
32]. The kinetics of DPPH scavenging in methanol solutions by the examined extracts and sirup with reference to gallic acid (12 µM) is presented in
Figure 7.
On the basis of the kinetics presented in
Figure 7, we calculated the maximum scavenging efficiency according to Formula (1), where A
min is the lowest value of DPPH absorbance (at 517 nm) observed in the plateau. The plateau was obtained in different times after extract addition, depending on the eluent used. The results are presented in
Figure 8.
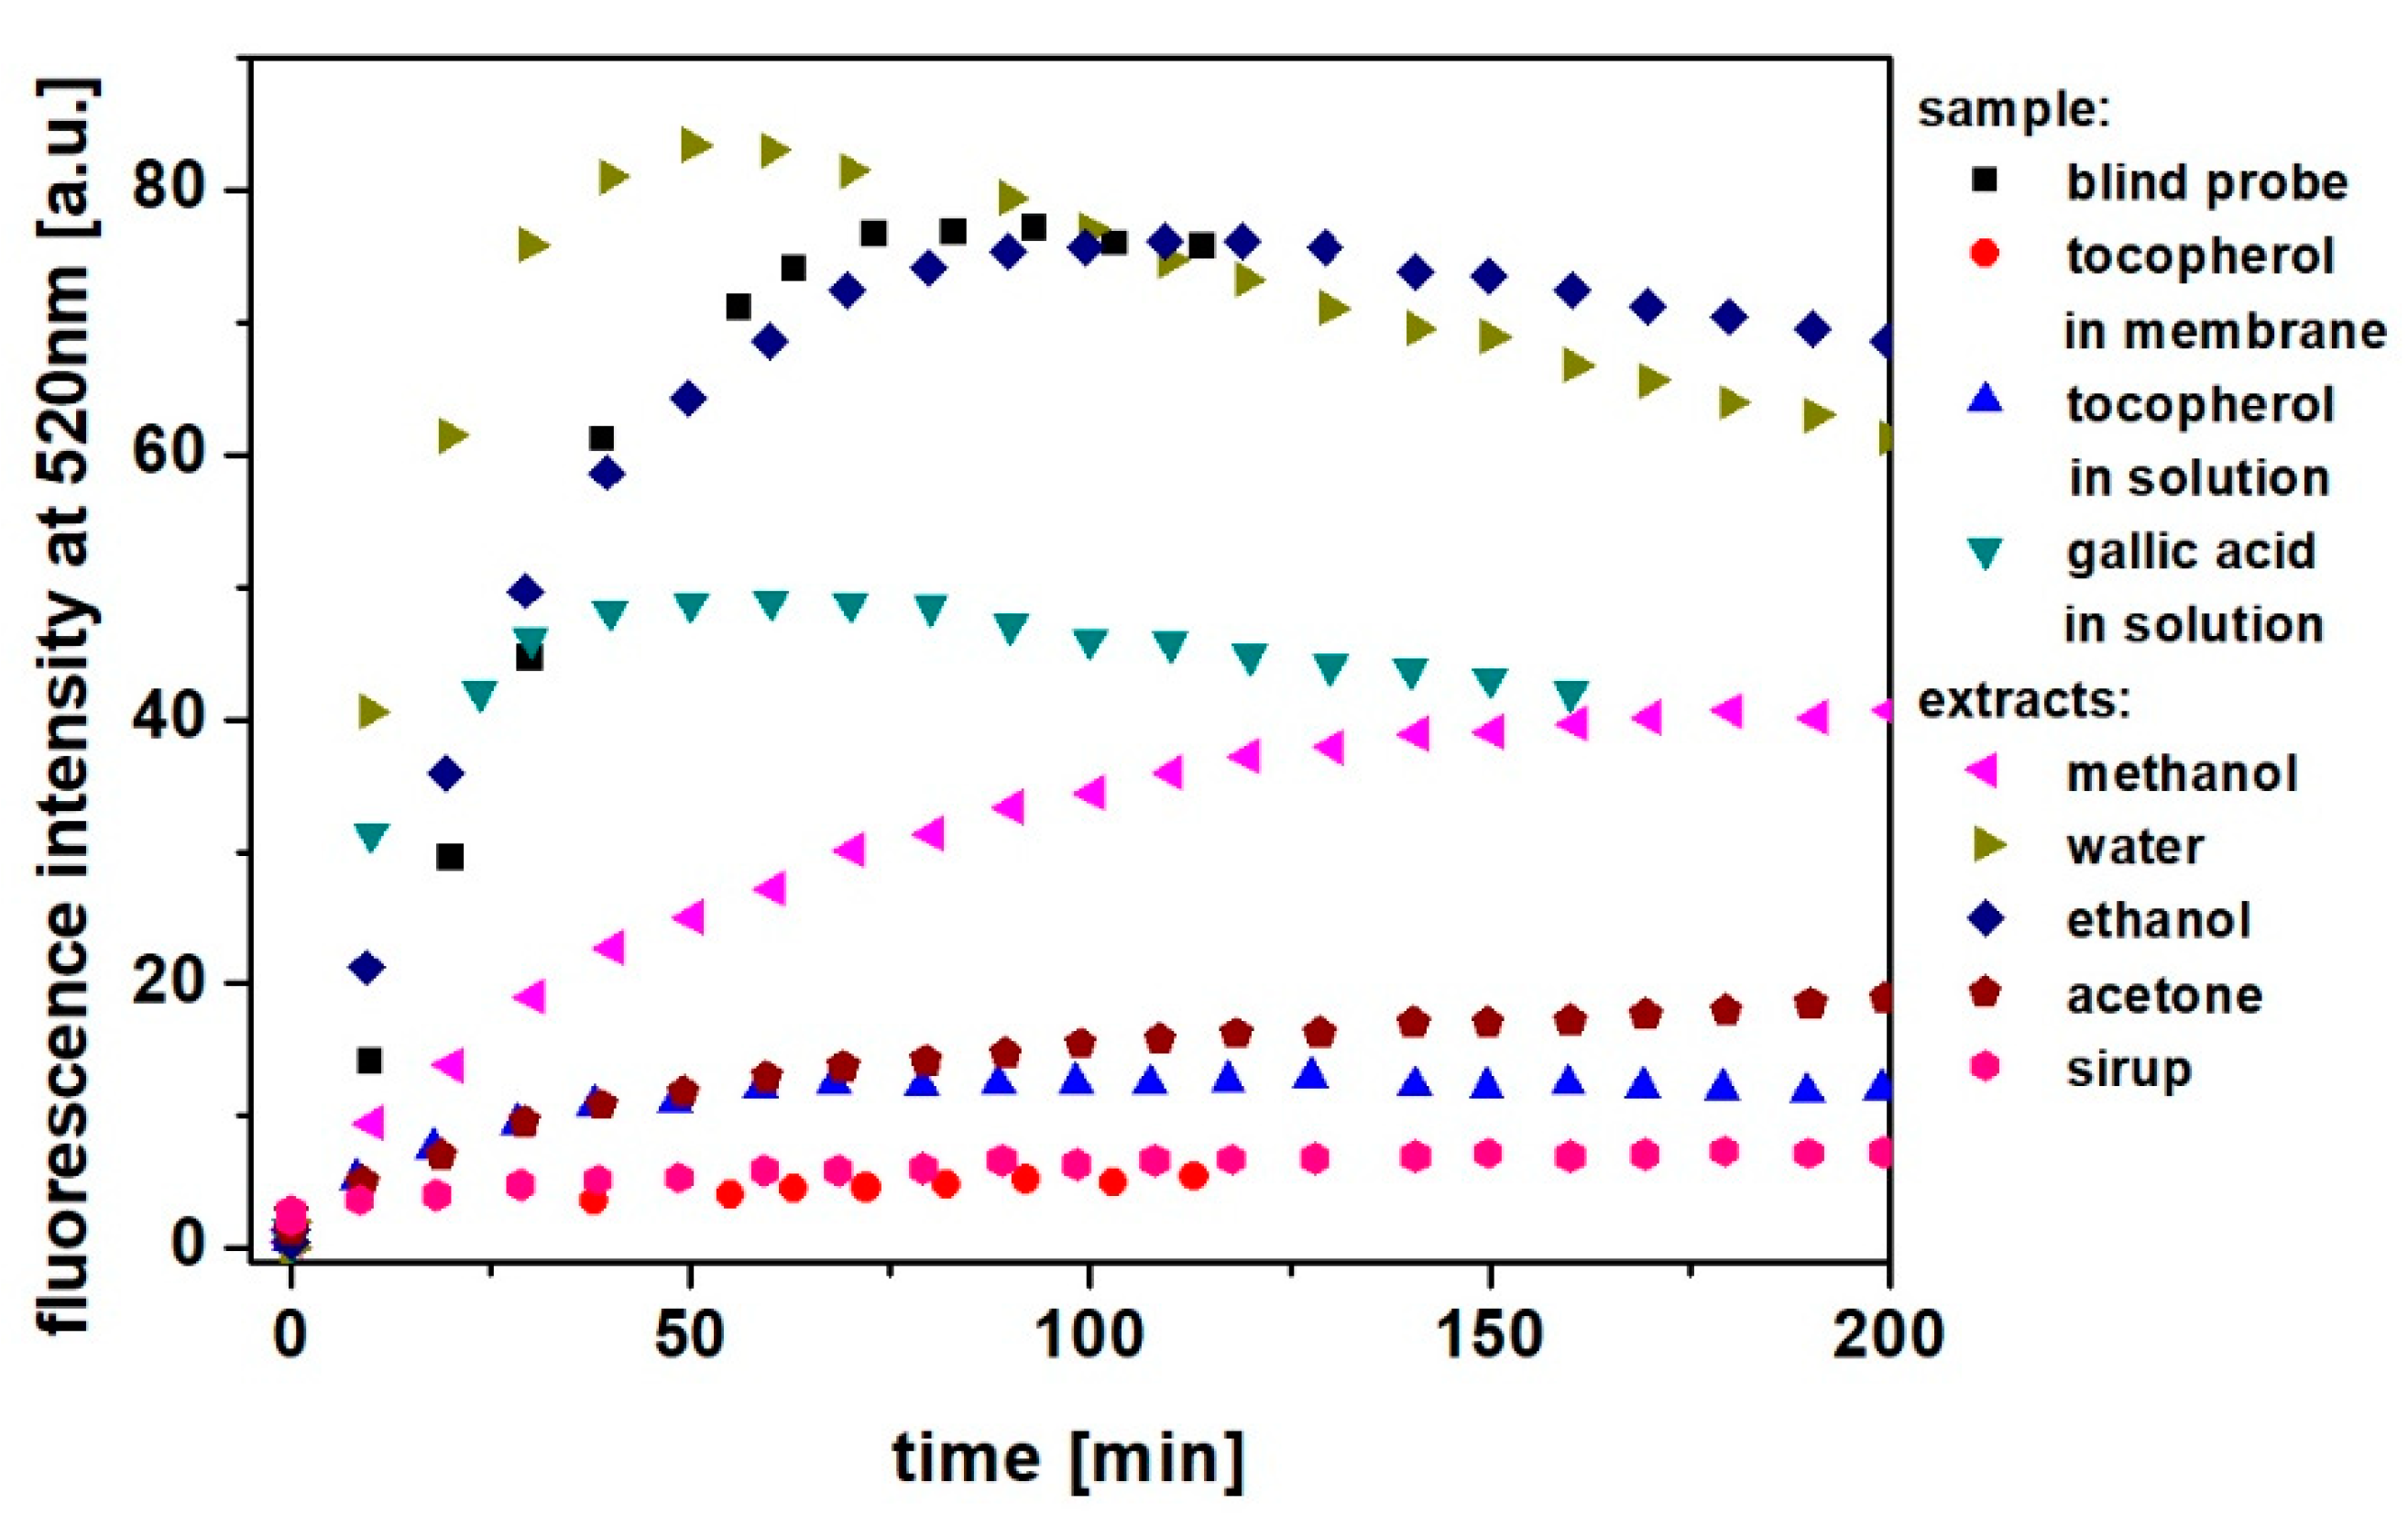
3.6.3. Oxidation in Liposomes
The oxidation process of the lipids was measured with the C11-BODIPY581/591 probe used as a fluorescent indicator. C11-BODIPY581/591 has been commonly used to determine lipid peroxidation in liposomes and mammalian cells [
13,
33]. The time changes of maximum fluorescence intensity of the C11-BODIPY581/591 probe embedded in the PC membrane is presented in
Figure 9. The figure reveals the thermal autooxidation of phospholipid-building PC liposomes. The blind probe is a PC membrane without any additional compounds. The “tocopherol in membrane” is the sample of PC with tocopherol embedded in the membrane in the PC liposomes preparation process (see Materials and Methods).
Thermal autooxidation leads to the significant oxidation of phosphatidylcholine observed as increasing C11-BODIPY581/591 fluorescence. The fastest oxidation occurs with extracts from water and ethanol. When compounds with antioxidant potential were added, the rate of oxidation was suppressed. The presence of gallic acid decreased oxidation by about 40%. The presence of tocopherol in solution very efficiently protects lipid oxidation, where, when embedded in the PC membrane, almost completely suppressed oxidation, and this value is comparable with the antioxidant power of raw sirup (juice). Interestingly, acetone extracts exhibit a similar antioxidant power as tocopherol. We may also notice that extracts from water and ethanol show biphasic kinetics, whereas the other extracts show a monotonic behavior of action. These results indicate the efficient ability of tocopherol to scavenge formed radicals, protecting the membrane lipids from autooxidation.
4. Discussion
To obtain the full spectrum of compounds present in bird cherry fruits, we applied solvents with different protic and hydrophobic properties. During these studies, we identified in different extracts a number of polyphenols and flavonoids and some minor components, including tocopherols, alkaloids, and sugars, and this composition was similarly reported in [
14,
15,
18,
34,
35]. Donno et al. [
14] detected some polyphenolic compounds including cinnamic acids (relatively high content of caffeic, coumaric, and ferulic), flavonols (especially quercetin and quercitrin), benzoic acids, catechins, and tannins, as well as monoterpenes, other organic acids (especially citric and quinic), and vitamin C in fresh fruits of bird cherry. Mikulic-Petrovsek et al. [
15] presented very detailed results of bird cherry (
Prunus padus), as well as other similar species such as mahaleb cherry (
Prunus mahaleb), wild cherry (
Prunus avium), and blackthorn (
Prunus spinosa) fruit content, including not only compounds presented by [
14] with much more detailed insight into each group, but also other natural compounds such as chlorophylls, carotens and carotenoids, xanthophylls, and different anthocyanins including cyanidin derivatives. Similar findings were recently presented by Brozdowski et al. [
34] for fruits of another
Prunnus species—black cherry (
Prunus serotina). A high content of quercetin and cyanidins in bird fruit was also reported by Lenchyk et al. [
35].
The focus of our studies is to estimate the antioxidant potential of the aqueous solution of the obtained extracts and raw sirup because the detailed phytochemical characterization of fruit was already described by others [
14,
15,
18,
34,
35]. The presence of bioactive compounds confirmed in this work, including antioxidants (polyphenols, cyanidins, and quercetins), as well as sugars, organic acids, etc., in extracts indicates the great potential of extracts to be used as antioxidant agents in everyday diet. Lipid oxidation, especially of unsaturated lipids, is one of the main concerns in the food industry as this process leads to food deterioration. To prevent or inhibit oxidation processes, the most effective way is to include antioxidants into food. Knowing that the investigated extracts contain antioxidant compounds, we apply DCF-H and BODIPY fluorescent probes, very sensitive markers of oxidation processes, to determine the antioxidant capacity of extracts against lipid peroxidation.
Investigation of lipid peroxidation in PC liposomes allow one to directly estimate the influence of free radicals in pure systems in the absence of the other interfering reactions. Additionally, it is possible to control the structural properties of phospholipids by choosing an appropriate phase; in our case, it was the fluid phase of the PC liposome that gives a better opportunity of the oxidation reaction carried out with unsaturated fatty acids chains present in PC liposomes. In addition, it is much easier to evaluate the antioxidant activity of the investigated extracts by monitoring the lipid peroxidation using the fast oxidation test based on the physical method of fluorescence of the specialized fluorescent dyes, DCF-H and BODIPY, sensitive to the presence of free radicals and oxidized species, as has been used in this study.
The antioxidant activity can be traditionally correlated with the number of phenolic compounds in plants. Phenolic compounds and flavonoids can be considered their secondary metabolites. Phenolic compounds would be the ones directly correlated with the antioxidant activity, but flavonoids could also be responsible for this effect. Their mechanism of action is related to their ability to donate hydrogen and scavenge free radicals. The ability to scavenge the free radicals allows these compounds to interact with reactive oxygen species (ROS), which can lead to oxidative stress and damage to tissues. Phenolic compounds and flavonoids, by reacting with ROS, avoid oxidative stress that could delay damaging processes, thus contributing to their antioxidant activity. Our HPLC, GC–MS and FTIR studies, shown in
Figure 3,
Figure 4 and
Figure 5 and
Table 1 and
Table 2, confirmed the presence of phenolics and flavonoids in the investigated extracts, and the test carried out confirmed their antioxidant properties against the generated free radicals. The use of different extracts showed that the antioxidant properties of the eluted compounds are related to their chemical composition/structures shown in
Table 1 and
Table 2. The lowest antioxidant efficiency is observed for water and ethanol extracts (
Table 3), which mainly include sugars and phenolic acids, suggesting that this type of chemical compound exhibits a low inhibition efficiency against peroxidation, as shown in
Figure 9. The highest antioxidant index was obtained for acetone extract, containing tocopherols and flavonoids, as shown by fluorescence and HPLC data, where both classes of compounds are well-documented inhibitors of free radical oxidation. Obtained for raw sirup from fruits, a high value of antioxidant index confirmed its potent antioxidant properties. Despite the measured concentration of tocopherols being relatively small due to the presence of many compounds with antioxidant properties, we may assume the existence of synergy between antioxidants, explaining such a high value of inhibition against the observed lipid peroxidation in PC membranes.


 ,
, 


