
An Improved Algorithm for Low-Light Image Enhancement Based on RetinexNet


1
College of Mechanical and Electronic Engineering, Nanjing Forestry University, Nanjing 210037, China
2
School of Computer Science, Northwestern Polytechnical University, Xi’an 710072, China
3
College of Landscape Architecture, Nanjing Forestry University, Nanjing 210037, China
*
Author to whom correspondence should be addressed.
Appl. Sci. 2022, 12(14), 7268; https://doi.org/10.3390/app12147268
Submission received: 12 June 2022
/
Revised: 11 July 2022
/
Accepted: 15 July 2022
/
Published: 19 July 2022
(This article belongs to the Special Issue Advances in Digital Image Processing)
Abstract
:Due to the influence of the environment and the limit of optical equipment, low-light images produce problems such as low brightness, high noise, low contrast, and color distortion, which have a great impact on their visual perception and the following image understanding tasks. In this paper, we take advantage of the independent nature of YCbCr color channels and incorporate RetinexNet into the brightness channel (Y) to reduce color distortion in the enhanced images. Meanwhile, to suppress the image noise generated during the enhancement, the enhanced image is also denoised. Finally, the original color and the enhanced brightness are recombined in the channel direction, converted back to the RGB color space, and adjusted to generate an enhanced result. The proposed algorithm is compared with other recently published counterparts on the LOL dataset. The experimental results demonstrate that the proposed algorithm achieved better performance in terms of both quantitative metrics and visual quality.
1. Introduction
With the development of society, intelligent devices have gradually become widely used. At the same time, the application field of video images is more extensive. When taking photos, insufficient light will lead to low contrast and overall low brightness, which will not only affect the subjective visual experience brought by appearances but also lead to the loss of image details. This hinders further image processing, such as face recognition and target detection [1]. However, due to bad weather conditions, poor ambient light, and limited performance of shooting equipment, low-contrast, low-light images are everywhere. Therefore, it is of great significance to study low-light image enhancement [2].
In recent years, scholars have tried to find an optimal algorithm to improve the quality of low illumination images. First, let us think of the gray-level transform algorithm. The gray level transform algorithm adjusts the image grayscale range. For example, histogram equalization adjusts a gray space originally concentrated in the image to the uniform distribution of all gray areas of the image [3], to a certain extent, improving the image brightness but did not consider the relationship between the pixels and making the enhanced images lack the sense of reality [4].
When studying the defogging image algorithm, Dong et al. [5] found that the pixel value distribution of the inverted image of the low-light image is very similar to that of the foggy notion, so the defogging algorithm can be applied to low-light image enhancement. Although the algorithm has a good enhancement effect, the enhanced image will appear with the artifact phenomenon [6].
Methods based on the Retinex theory [7] are relatively popular, and nearly one-third of the methods are designed in combination with Retinex theory. Different subnetworks are used to estimate other components of Retinex theory, which usually have good results. Jobson et al. [8] proposed a single-scale Retinex algorithm, which uses the constructed Gaussian surrounding function to filter the three color channels of the image, and the filtered image is the estimated illumination component. After logarithmic processing of the original image and illumination image, the output result is obtained by subtracting [9]. The multi-scale Retinex-enhanced algorithm [10], compared with the single-scale algorithm, increases the number of Gaussian wrapping functions, which can be regarded as a weighted sum of multiple single-scale Retinex of different scales. Wang et al. [11] designed a constraint condition formulated by the prior guidance layer of an end-to-end signal for the low-light enhancement of a single image. Feng et al. [12] proposed a color image enhancement algorithm based on adaptive weighted Retinex and wavelet transform. The low-frequency image is enhanced with adaptive weight Retinex, and the improved threshold is used for high-frequency image denoising. Finally, the inverse wavelet transform is used to reconstruct the luminance component.
In recent years, the popularity of deep learning has been very high. Its powerful feature representation and nonlinear mapping ability has also been widely used in the field of image, and has achieved great success [13]. Lore et al. [14] first used the method of deep learning to realize low illumination image enhancement (LLNet). They proposed a method based on a depth self-encoder to recognize signal features from low illumination images. In an image with a high dynamic range, the image is brightened adaptively, without supersaturating the lighter part. Experiments were carried out on real low illumination images, and the effectiveness of the LLNet algorithm is proved.
The Retinex theory is a very effective low-light image enhancement theory. In the case of the unknown reflection component, it is an ill-posed problem to solve the illumination component, so we can only calculate using the approximate estimation method. In this paper, an illumination image estimation method based on YCbCr color space is proposed. By processing the image y-channel component, combining Gamma correction, Retinex theory, noise reduction module, and image fusion procedure, the y-component illumination image is enhanced. Then, the final enhancement effect is obtained using the noise reduction fusion method. This method has been compared with low light image enhancement methods at home and abroad in recent years, and the experimental results have been analyzed objectively and subjectively.
The first section of this paper introduces the background and purpose of relevant research; the second section introduces the relevant work and theoretical knowledge; the third section introduces the design algorithm and details; the fourth section evaluates the experimental results to prove the effectiveness of the proposed algorithm; and finally, we summarize the full text.
2. Related Work
2.1. YCbCr Color Space
YCbCr is a primary color space that is commonly used in the continuous image processing of films or digital photography systems. Among them, the Y component refers to the image brightness component, Cb and Cr part refers to the image color saturation attribute. The RGB components and YCbCr components can be converted to each other, and their conversion relationships are as follows:
RGB to YCbCr formula:
YCbCr to RGB formula:
Compared with the RGB space, the three-color components of YCbCr have a stronger correlation with brightness, which changes the color proportion when enhancing the image, leading to image distortion. The brightness component and color component of the YCbCr color space are separated from each other. In this paper, the Y component is extracted to construct a lighting network, which can avoid the influence of image distortion.
2.2. Retinex Theory
Retinex theory [7] was first proposed by Land, a physicist. According to this theory, the image of an object is reflected from the object’s surface to the incident light, which is an inherent attribute of the object. Retinex theory assumes that the image is composed of an illumination image and a reflection image. The early Retinex algorithm adopts the idea of separation, and retains the reflected image attributes of objects by reducing or even removing the influence of illumination image. After Land proposed Retinex theory, scholars proposed approximate estimation methods for illumination images, such as the single-scale Retinex algorithm (SSR), multi-scale Retinex algorithm (MSR) [15], and adaptive multi-scale Retinex algorithm based on HSV color space [16]. However, the Retinex enhancement algorithm will produce a halo phenomenon in the region with a significant brightness difference, accompanied by color distortion, insufficient edge sharpening, and other problems. Jobson et al. proposed Retinex with color restoration (MSRCR) [17], in which color restoration factors are used to adjust the proportional relationship between color channels to make brightness more similar to the actual scene in order to eliminate the influence of image distortion.
2.3. Noise Reduction Module
Image denoising is the basis of image processing. The purpose of denoising is to keep image information while reducing regional noise. At present, image denoising can be divided into three categories: filter-based method, model-based method, and learning-based method. Classical filtering methods include median filtering and Wiener filtering. Model-based approaches usually define denoising tasks as optimization problems based on the maximum posterior (MAP), whose performance is mainly dependent on the image prior. Gu et al. [18], for example, proposed an infrared-weighted kernel norm minimization method based on a low-rank matrix approximation. Pang et al. [19] introduced a graph-based regularizer to reduce image noise. The performance of this method decreases significantly under heavy noise, and it takes a long time because of the complexity of iterative optimization. The learning-based methods focus on learning the potential mapping from noisy images to clean images, and can be divided into traditional learning-based methods and deep network-based learning methods. Zhang et al. [20] proposed a simple but effective denoising convolutional neural network (CNN) by superimposing convolutional, batch normalization, and linear correction unit (ReLU) layers. The method based on the deep network has excellent development potential. Still, it mainly relies on experience design, does not fully consider the traditional way, and lacks interpretability to a certain extent.
2.4. Deep Learning Method
In recent years, deep learning has become prevalent, and its robust feature representation and nonlinear mapping capabilities have made it widely used in image processing. Lore et al. [21] were the first to put forward the low illumination image enhancement algorithm based on deep learning LLNet, which is a kind of stack-based sparse denoising method since the encoder, from the low illumination image identification signal characteristics, and in the high dynamic range image adaptively lighting image without an over/saturated lighter parts, loss function using sparse regularization reconstruction. Later, Liang et al. [22] proposed an MSRNet algorithm imitating MSR to directly learn end-to-end mapping between dark images and bright images. Most parameters in the model are reversely optimized, which is superior to the traditional method. However, this method uses synthetic datasets and has some gaps with authentic images. Some scholars have put forward an enhancement algorithm based on the idea of decomposition, which divides the network into the decomposition part and the enhancement part and shares parameters. However, details will be lost in the process, the noise will be amplified, and the visual effect will be damaged. There are also some effective methods, such as the multi-exposure depth single-image contrast enhancement algorithm proposed by Cai et al., which mainly focuses on single-image contrast enhancement and aims at solving the low-contrast problem of under-exposure and over-exposure. Ying et al. [23] proposed a new convolutional network, which is characterized by feature extraction and fusion at different levels in the network. A recent loss function was proposed, including structural loss, content loss, and regional loss. Structural loss was combined using SSIM and MS-SSIM measures [24,25]. Content loss is a similar feature extracted by VGG. Region loss guides the network to focus more on low-light areas in the image.
3. Proposed Algorithm
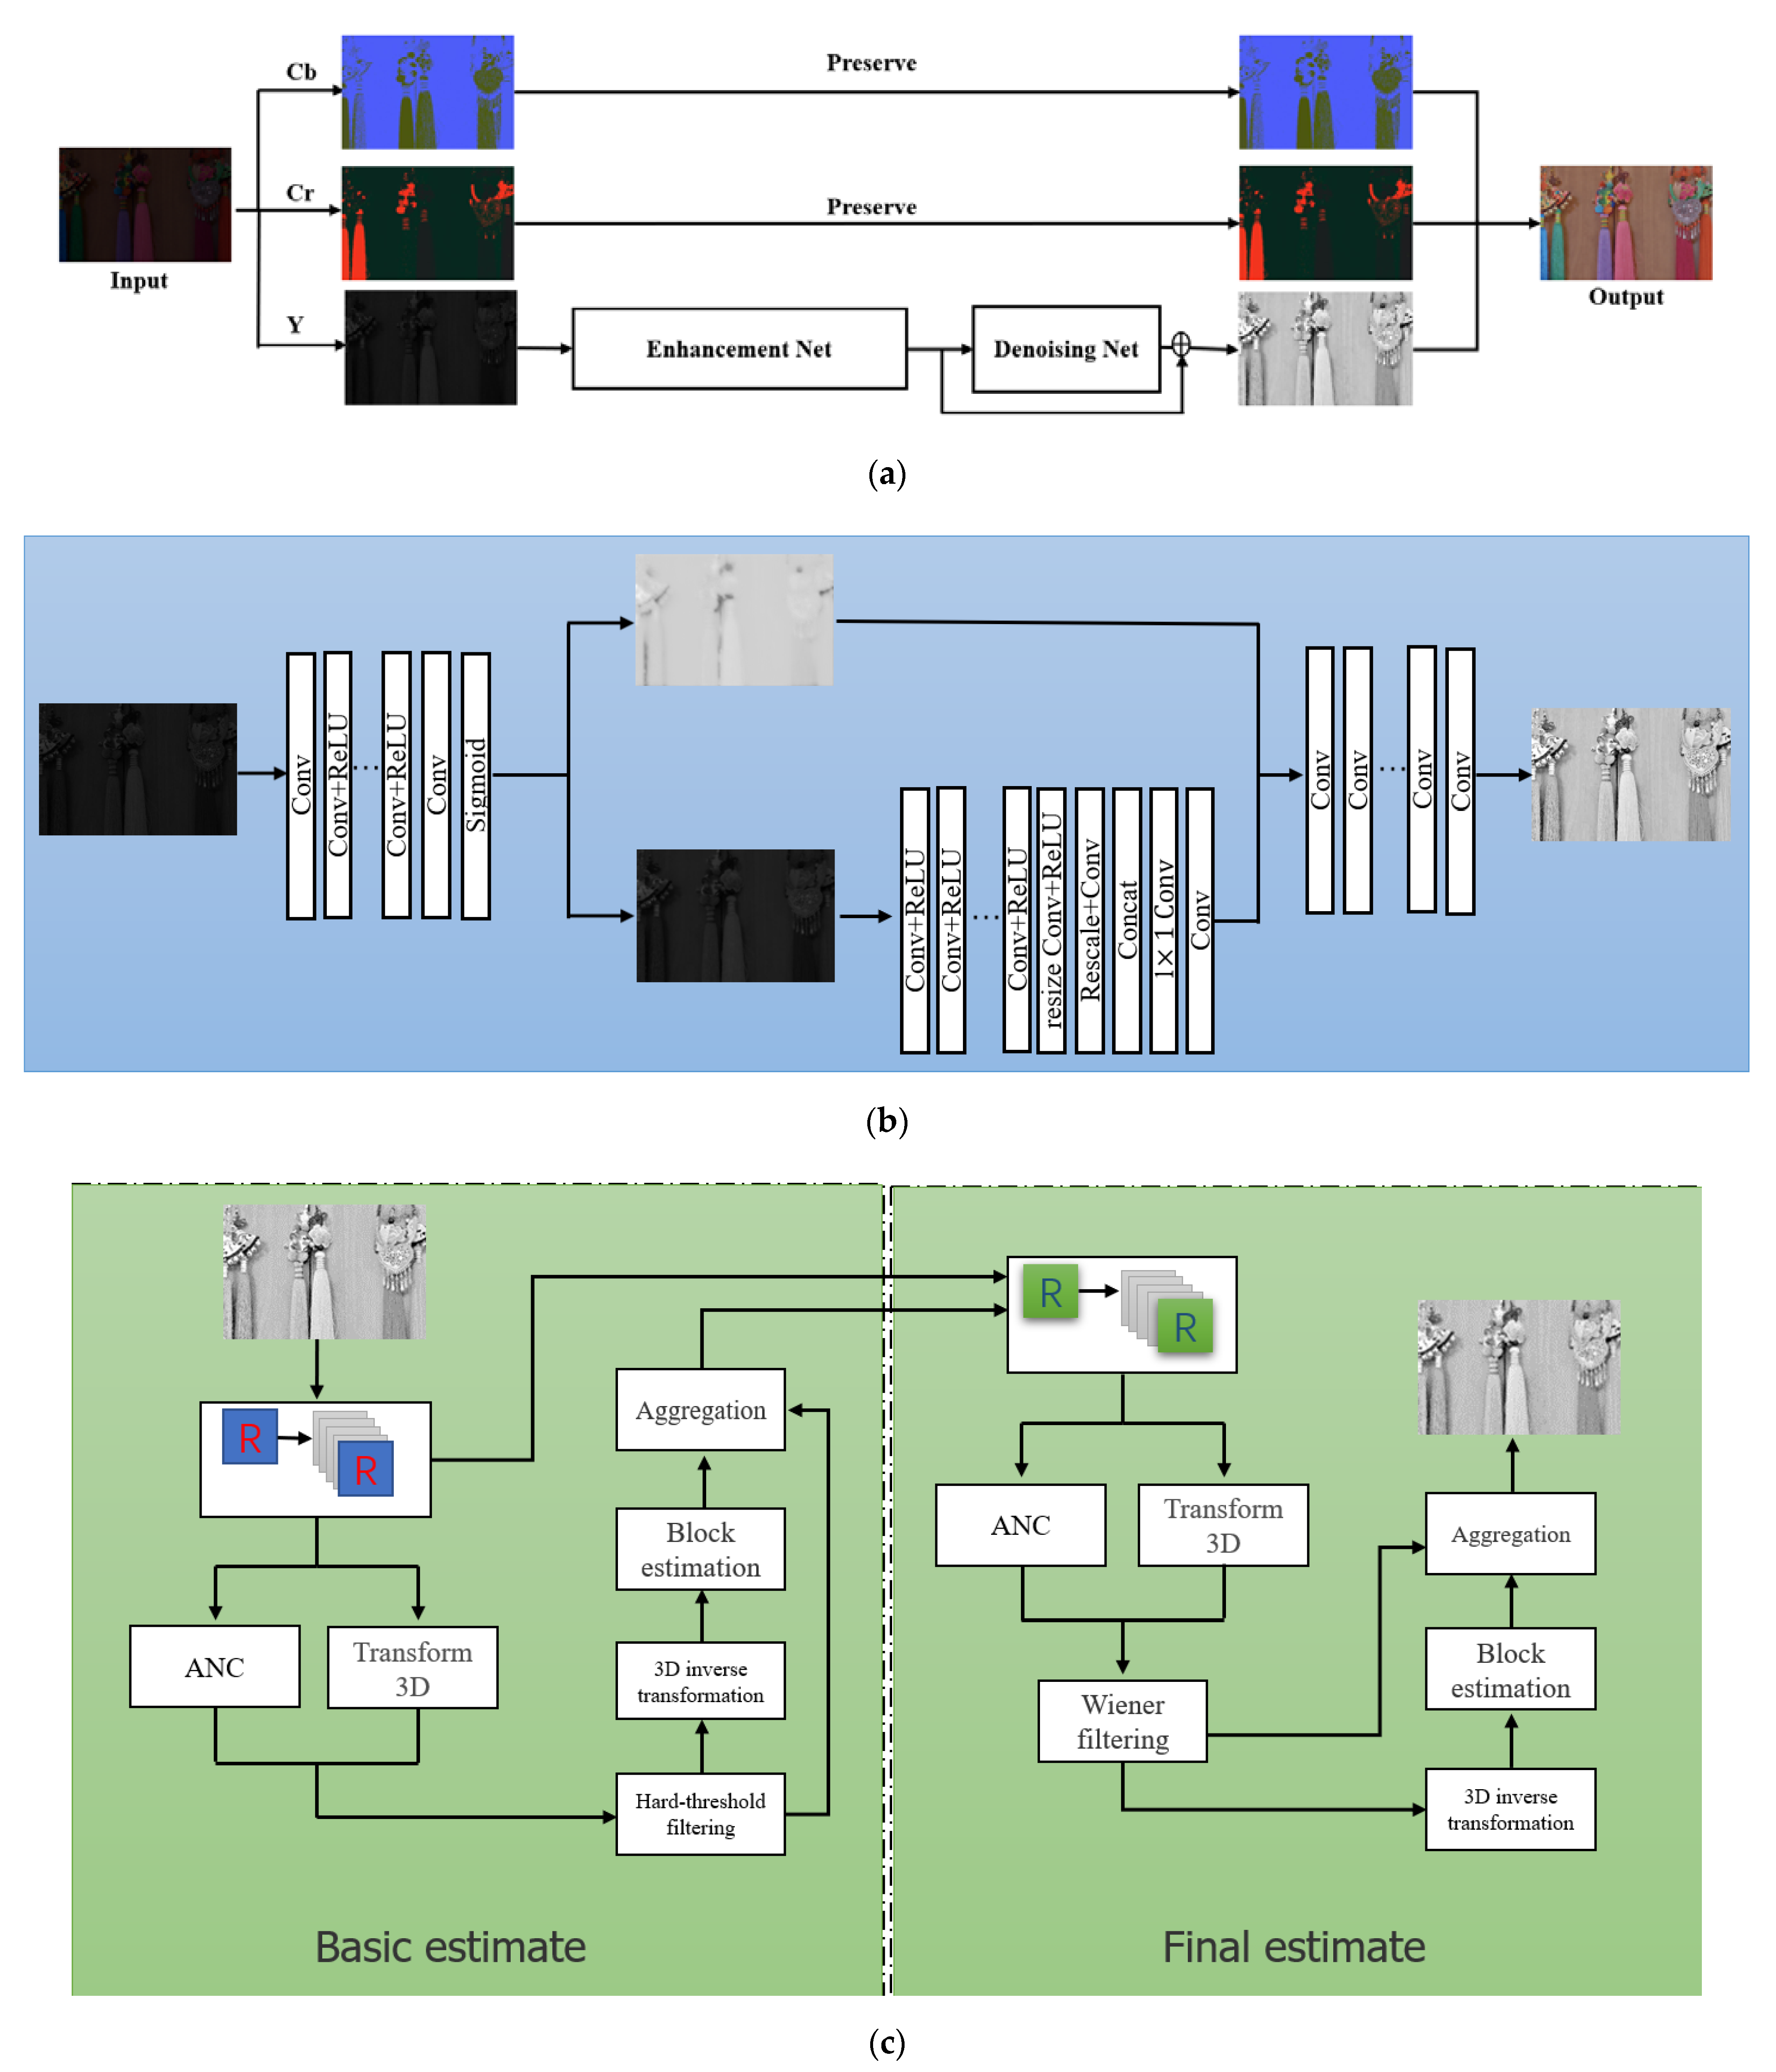
In this paper, the effects of color distortion and noise are considered, and a low illumination image enhancement algorithm based on YCbCr color space is proposed, which can avoid color distortion and noise while preserving image details. Figure 1 shows the algorithm model used in this paper. The algorithm is divided into two parts: the Enhancement Module and the Denoising Module. First, the image is decomposed into Y, Cb, and Cr channels. The Y channel component is input into RetinexNet to obtain the initial processing image. Then, the Y channel component is copied in two copies, and one is input to the noise reduction module; the other is combined with the output result of noise reduction to obtain the enhanced image. The final enhancement effect is obtained by the method of noise reduction fusion. In the following section, the functions and implementation of each network are described in detail.
3.1. Enhanced Networks
The enhanced network is a convolutional network model based on the Retinex theory. The network framework is composed of a decomposed network and an improved network.
The RetinexNet algorithm is divided into three steps: (1) the decomposition model uses a low illumination image and standard illumination image to estimate the illumination component and realize the decomposition of the reflection component and illumination component; (2) the adjustment model is used to de-noise the reflection component of the low light image, and encoder-decoder is used to capture an extensive range of light distribution context information for adaptive adjustment of the light component; (3) the reconstructed model restores the enhanced image from the processed reflection component and illumination component. The decomposition model is composed of 5 convolution layers with ReLU activate functions. The parameters of the low-light image and the typical light image are shared, and the reflection component and light component of the low-light image and the reflection component and light component of the normal light image are obtained. The constraint relationship between each component is used to optimize the model. The loss function of this model is composed of reconstruction loss , reflectivity loss and light smoothing loss :
where reconstruction loss , its objective is to make it possible to reconstruct the corresponding original image from the decomposed reflection component and illumination component. Reflectivity loss , the purpose is to make the reflection components of the paired low/standard light images as consistent as possible. Illumination component loss , this loss is to make the area with smooth reflection component as soft as possible on the corresponding illumination component.
3.2. Noise Reduction Module
The central idea of the module is to make full use of the abundant self-similar structures in the image to denoise the image. It is divided into two stages. The first stage is basic estimation filtering. First, a number of reference blocks are placed in the original image at a step size (usually 3 pixels), each reference block searches the appropriate area around it, and all blocks similar to the league are found, stacked into a three-dimensional array, and three-dimensional transformation is applied to the variety. The problematic threshold transformation coefficient was used to reduce the noise, and then 3D inverse transformation was carried out to obtain the estimates of all grouped blocks. Finally, all blocks were returned to their initial positions. The weighted average of all overlapping block estimates was carried out by coalition to obtain the basic calculations of the actual image. The final estimation filtering is performed in the second stage. For each block in the image, block matching is used to find all block positions similar to the current processing block based on the basic estimation. We use these positions to form two three-digit arrays, one from the raw image and one from the base estimate. Applying a 3D transformation to the two groups, wiener filtering is performed on the original image using the energy spectrum estimated as the real energy spectrum. All block estimates of the 3D inverse transform are performed on the filtered 3D coefficients. These block estimators are put back to their original positions. Finally, the weighted average is used to aggregate all the local estimates to obtain the final assessment of the actual image.
Different from bilinear filtering, median filtering, etc., which uses local image information to filter, it uses the whole image for denoising, searches for similar regions in the image-by-image block and averages these regions. It is good enough to remove Gaussian noise from the image.
4. Experiment and Results Analysis
4.1. Experimental Settings
The network performance of deep learning is closely related to datasets. The algorithm in this paper adopts the LOL (low-light) [21] training set to train and test the network, among which 485 pairs of low-light images are used for the training network and 15 for the test network. Training environment configuration: Intel i7-8700 CPU, 32G memory, and an NVIDIA GeForce RTX2080 Ti GPU. During the training, the batch size was set to 16, the patch size to 48, and Adam’s initial learning rate was set to 0.001. The network framework was built using the TensorFlow 2.6.0 framework, PyCharm software in a 32 GB environment, and an Anaconda Python 3.7 interpreter. Test environment configuration: Inter(R) Core (TM) i5-6300 hq CPU @ 2.3 GHz, Windows10 operating system, PyCharm in 12 GB environment, interpreter Anaconda Python 3.7.
4.2. Results Analysis
We evaluated the proposed experimental method through a large number of experiments, and compared them quantitatively through PSNR, SSIM, and UQI indicators. The higher the three values, the better the image enhancement effect.
PSNR is used to measure the difference between the two images. These include compressed image and original image, evaluation of the quality of the compressed image, restoration image and real image, evaluation of restoration algorithm performance, etc. The formula is:
where MSE is the mean square error of two images; MaxValue is the maximum value of image pixels.
Structural similarity is the most widely used standard for referenced image quality evaluation; SSIM is used to highlight the brightness, contrast, and structural similarity between two images. The value range is 0–1; the closer the value is to 1, the more similar the two images are. Assuming that x and y are two input images, the formula is:
where is brightness comparison, is contrast comparison, and is structural comparison. are the following formulas, respectively:
In the formula, and respectively represent the average value of the two images, and represent the standard deviations of the two images, represents the covariance of the two images, , and are constants to avoid 0 in the denominator.
The UQI is also called the image universal quality index. It can be easily calculated and applied to a variety of image processing applications, mainly combined with three factors to calculate: correlation loss, brightness distortion, and contrast distortion.
The calculation formula of the UQI index is as follows:
where , is the original image signal; , is the test image signal.
4.3. Experimental Comparison
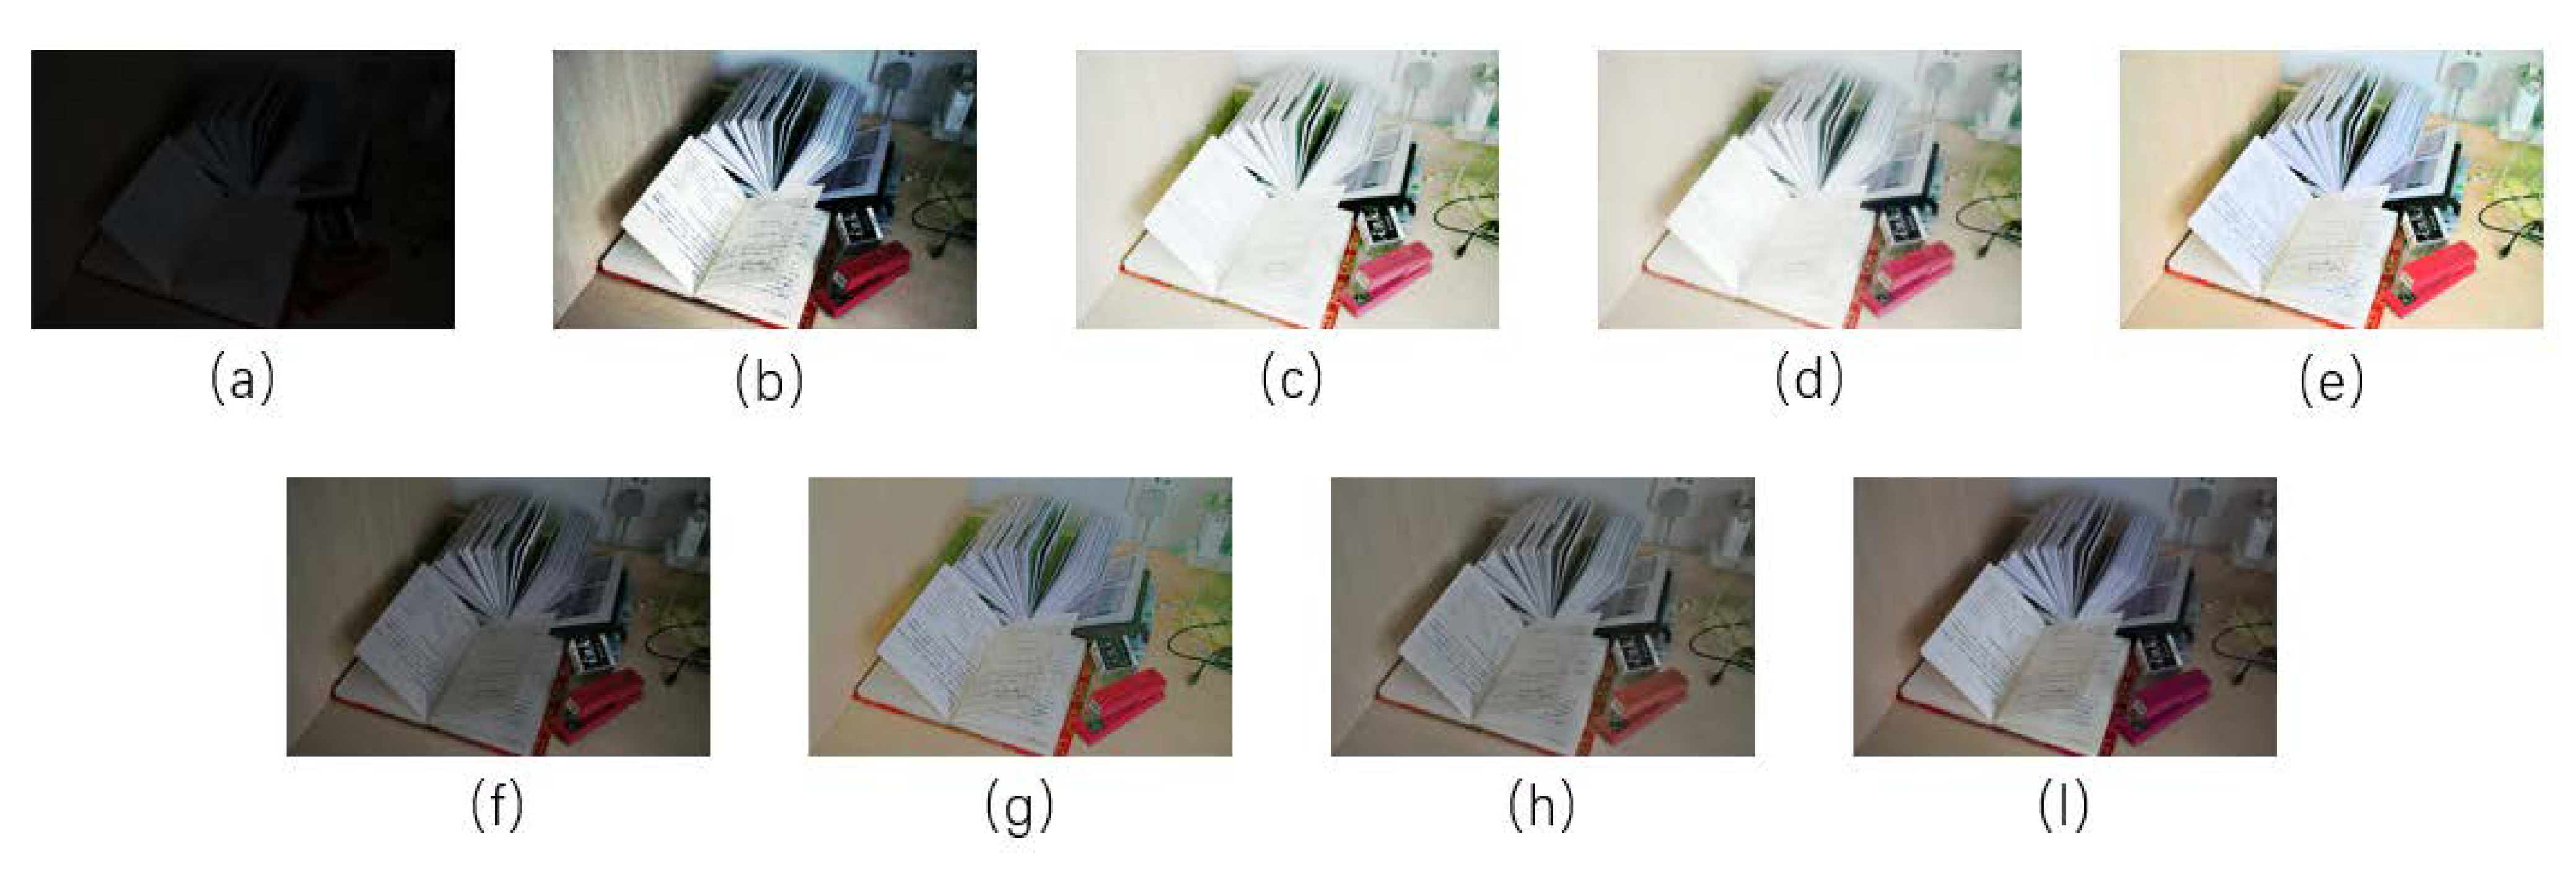
To reflect the effect of this algorithm, we compare the proposed approach with the traditional image enhancement algorithm and the latest image enhancement algorithm. Table 1 and Figure 2 show the comparison results between the classical low-illumination image-processing methods and our proposed methods on LOL datasets. The data show that our method is superior to other traditional image enhancement algorithms in terms of quality evaluation.
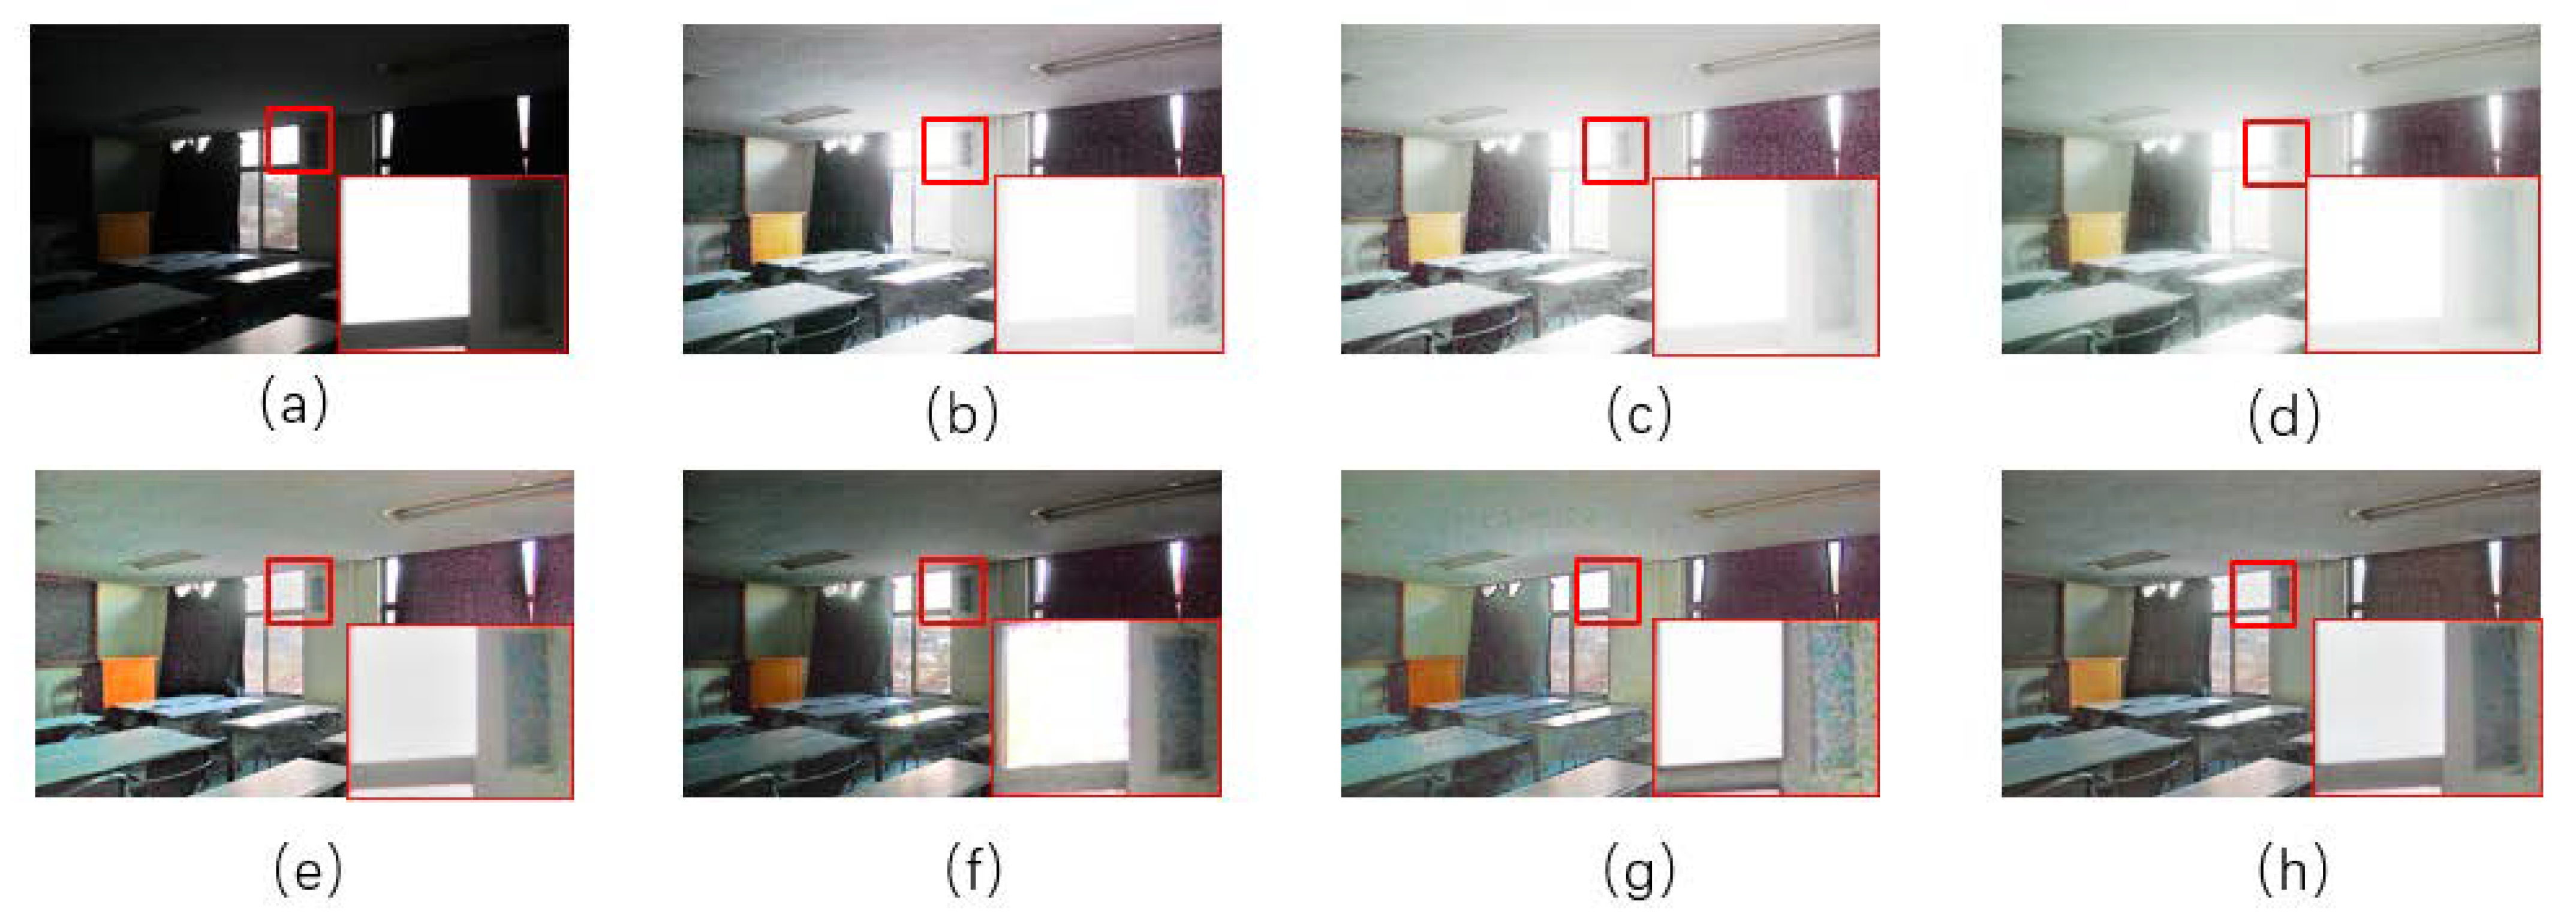
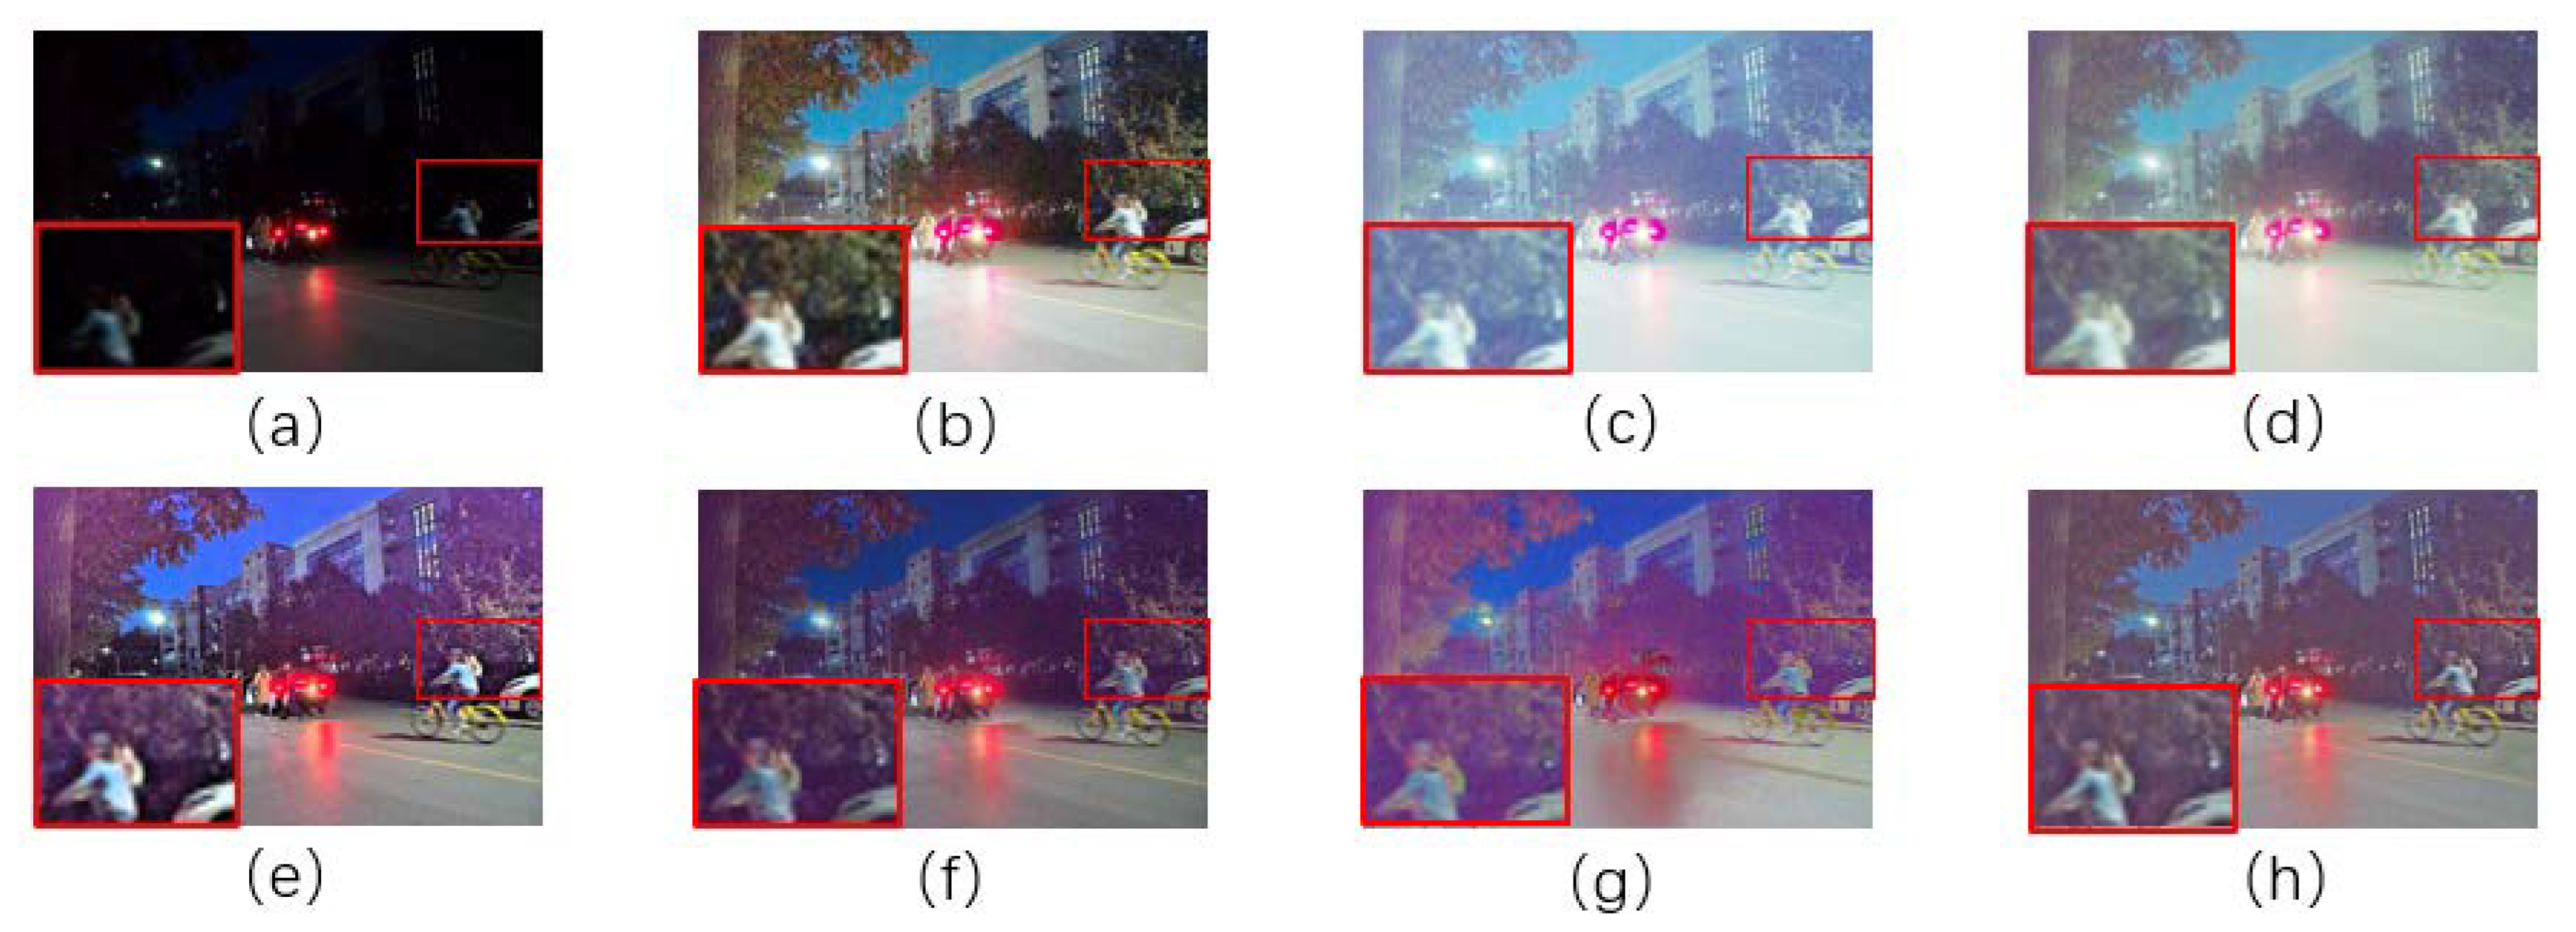
To better reflect the subjective visual effects, we selected indoor images and outdoor images for enhancement. We enlarge the detailed part of the image to better reflect the image enhancement effect, as shown in Figure 3 and Figure 4.
Figure 3 shows the indoor low illumination image and the enhanced effect picture. As you can see from the zoom in detail, indoor images were enhanced by HE, Retinex, and MSR, resulting in white, obvious distortion, and serious loss of image details. After processing with the RetinexNet algorithm, the overall brightness of the image is improved, but the contrast is reduced, the overall image becomes blurred, and the visual effect is reduced. LIME enhancement effect is dark on the whole and not obvious in dark areas.
Figure 4 shows the enhanced effect of outdoor low-illumination images. It can be seen from the detailed amplification effect display that the overall enhancement effect of Retinex and MSR is white, and the car light distortion is obvious; the enhancement effect of HE is relatively natural, but the image is noisy; the enhancement effect is not obvious in dark areas of MSRCP and LIME, and details are lost; RetinexNet Enhances the overall relative blur of the image.
The mean opinion score (MOS) test is a commonly used subjective image quality assessment method; human raters were asked to assign perceptual quality scores to test images. Usually, the score ranges from 1 (poor) to 5 (good). The final MOS is calculated as the arithmetic mean for all grades.
The expression of MOS is as follows:
where R represents the number of evaluators’ satisfaction scores for the image, and N represents the total number of evaluators. We selected the results of 100 questionnaires, and the average opinion score is shown in Table 2.
As can be seen from Table 2, our method gets the highest score in indoor image enhancement effect. As for outdoor image enhancement, our score is tied in the first place with HE, but the score is still higher when compared with the others.
5. Conclusions
In this paper, a composite model for image enhancement with low illumination is proposed that avoids color distortion, preserves image details as much as possible, considers the effect of image noise, and makes full use of the rich self-similar structure in the image to denoise the image. Experimental results show that compared with HE, Retinex, MSR, MSRCP, LIME, and RetinexNet algorithms, the peak signal-to-noise ratio, structure similarity, and universal quality index of images processed by the proposed algorithm are improved by 2.7%, 23.4%, and 15.7%, on average. Through many experiments, it has been proven that the method in this paper has good improvement in both the objective evaluation index and the subjective visual effect.
Author Contributions
Conceptualization, H.T. (Hao Tang) and C.X.; methodology, H.T. (Hao Tang); software, H.T. (Hao Tang); validation, H.T. (Huanjie Tao); formal analysis, H.Z.; investigation, H.T. (Huanjie Tao); resources, C.X.; data curation, C.X.; writing—original draft preparation, H.T. (Hao Tang); writing—review and editing, C.X.; visualization, H.T. (Huanjie Tao); supervision, C.X.; project administration, C.X.; funding acquisition, C.X. All authors have read and agreed to the published version of the manuscript.
Funding
This research was supported in part by the National Natural Science Foundation of China under Grant 61901221, in part by the Postgraduate Research & Practice Innovation Program of Jiangsu Province under Grant KYCX21_0872, and in part by the National Key Research and Development Program of China under Grant 2019YFD1100404.
Institutional Review Board Statement
Not applicable.
Informed Consent Statement
Not applicable.
Data Availability Statement
The data presented in this study are openly available at https://arxiv.org/abs/1808.04560, accessed on 10 August 2018.
Conflicts of Interest
The authors declare no conflict of interest.
References
- Huang, H.; Tao, H.; Wang, H. A convolutional neural network based method for low-illumination image enhancement. In Proceedings of the 2nd International Conference on Artificial Intelligence and Pattern Recognition, Beijing China, 16–18 August 2019; pp. 72–77. [Google Scholar]
- Liang, H.; Yu, A.; Shao, M.; Tian, Y. Multi-Feature Guided Low-Light Image Enhancement. Appl. Sci. 2021, 11, 5055. [Google Scholar] [CrossRef]
- Wang, X.; Chen, L. Contrast enhancement using feature-preserving bi-histogram equalization. Signal Image Video Process. 2018, 12, 685–692. [Google Scholar] [CrossRef]
- Pan, X.; Li, C.; Pan, Z.; Yan, J.; Tang, S.; Yin, X. Low-Light Image Enhancement Method Based on Retinex Theory by Improving Illumination Map. Appl. Sci. 2022, 12, 5257. [Google Scholar] [CrossRef]
- Dong, X.; Wang, G.; Pang, Y.; Li, W.; Wen, J.; Meng, W.; Lu, Y. Fast efficient algorithm for enhancement of low lighting video. In Proceedings of the 2011 IEEE International Conference on Multimedia and Expo, Barcelona, Spain, 11–15 July 2011; pp. 1–6. [Google Scholar]
- Si, W.; Xiong, J.; Huang, Y.; Jiang, X.; Hu, D. Quality Assessment of Fruits and Vegetables Based on Spatially Resolved Spectroscopy: A Review. Foods 2022, 11, 1198. [Google Scholar] [CrossRef] [PubMed]
- Land, E.H.; McCann, J.J. Lightness and Retinex Theory. J. Opt. Soc. Am. 1971, 61, 1–11. [Google Scholar] [CrossRef] [PubMed]
- Jobson, D.J.; Rahman, Z.U.; Woodell, G.A. Properties and Performance of a Center/Surround Retinex. IEEE Trans. Image Process. 1997, 6, 451–462. [Google Scholar] [CrossRef] [PubMed]
- Ye, M.; Yan, X.; Jia, M. Rolling bearing fault diagnosis based on VMD-MPE and PSO-SVM. Entropy 2021, 23, 762. [Google Scholar] [CrossRef] [PubMed]
- Jobson, D.; Rahman, Z.; Woodell, G. A multiscale retinex for bridging the gap between color images and the human observation of scenes. IEEE Trans. Image Process. 1997, 6, 965–976. [Google Scholar] [CrossRef] [PubMed] [Green Version]
- Yang, W.; Wang, W.; Huang, H.; Wang, S.; Liu, J. Sparse Gradient Regularized Deep Retinex Network for Robust Low-Light Image Enhancement. IEEE Trans. Image Process. 2021, 30, 2072–2086. [Google Scholar] [CrossRef] [PubMed]
- Feng, H.; Ping, L.; Wang, B. Color image enhancement algorithm based on adaptive weight Retinex and wavelet transform. Radioengineering 2020, 4, 19. [Google Scholar]
- Zou, Z.; Liu, Y. Simulation Calculation of the Magnetic Torque of Dual Mode Permanent Magnet Transmission Based on Magnetic Circuit Analysis. IEEE Access 2019, 7, 149926–149934. [Google Scholar] [CrossRef]
- Guo, X.; Li, Y.; Ling, H. LIME: Low-light image enhancement via illumination map estimation. IEEE Trans. Image Process. 2016, 26, 982–993. [Google Scholar] [CrossRef] [PubMed]
- Rahman, Z.; Woodell, G.A.; Jobson, D.J. A Comparison of the Multiscale Retinex with Other Image Enhancement Techniques; NASA Langley Technical Report Server: Washington, DC, USA, 1997. [Google Scholar]
- Kumar, M.; Jindal, S.R. Fusion of RGB and HSV colour space for foggy image quality enhancement. Multimed. Tools Appl. 2019, 78, 9791–9799. [Google Scholar] [CrossRef]
- Heng, B.; Xiao, D.; Zhang, X. Night color image mosaic algorithm combined with MSRCP. Comput. Eng. Des. 2019, 40, 3200–3204. [Google Scholar]
- Gu, S.; Zhang, L.; Zuo, W.; Feng, X. Weighted nuclear norm minimization with application to image denoising. In Proceedings of the IEEE Conference on Computer Vision and Pattern Recognition, Columbus, OH, USA, 23–28 June 2014; pp. 2862–2869. [Google Scholar]
- Pang, J.; Cheung, G. Graph Laplacian Regularization for Image Denoising: Analysis in the Continuous Domain. IEEE Trans. Image Process. 2017, 26, 1770–1785. [Google Scholar] [CrossRef] [PubMed] [Green Version]
- Zhang, K.; Gao, X.; Tao, D.; Li, X. Single Image Super-Resolution with Non-Local Means and Steering Kernel Regression. IEEE Trans. Image Process. 2012, 21, 4544–4556. [Google Scholar] [CrossRef] [PubMed]
- Wei, C.; Wang, W.; Yang, W.; Liu, J. Deep retinex decomposition for low-light enhancement. arXiv 2018, arXiv:1808.04560. [Google Scholar]
- Priyadarshini, R.; Bharani, A.; Rahimankhan, E.; Rajendran, N. Low-Light Image Enhancement Using Deep Convolutional Network. In Innovative Data Communication Technologies and Application; Springer: Singapore, 2021. [Google Scholar]
- Ying, Z.; Li, G.; Ren, Y.; Wang, R.; Wang, W. A new image contrast enhancement algorithm using exposure fusion framework. In Proceedings of the International Conference on Computer Analysis of Images and Patterns, Ystad, Sweden, 22–24 August 2017; pp. 36–46. [Google Scholar]
- Bei, G.; Ma, C.; Sun, J.; Ni, X.; Ma, Y. A Porous Media Leakage Model of Contact Mechanical Seals Considering Surface Wettability. Coatings 2021, 11, 1338. [Google Scholar] [CrossRef]
- Zhang, J.; Chen, Q.; Shi, M.; Zhou, H.; Xu, L. Interaction and influence of a flow field and particleboard particles in an airflow forming machine with a coupled Euler-DPM model. PLoS ONE 2021, 16, e0253311. [Google Scholar] [CrossRef] [PubMed]
Figure 1.
Schematic diagram of the network structure. (a) Schematic diagram of algorithm structure; (b) Enhancement Net; (c) Denoising Net.
Figure 1.
Schematic diagram of the network structure. (a) Schematic diagram of algorithm structure; (b) Enhancement Net; (c) Denoising Net.

Figure 2.
Enhanced effect of low illumination image. (a) Low illumination image; (b) HE; (c) Retinex; (d) MSR; (c) MSRCP; (f) LIME; (g) RetinexNet; (h) Ours; (I) Ground Truth.
Figure 2.
Enhanced effect of low illumination image. (a) Low illumination image; (b) HE; (c) Retinex; (d) MSR; (c) MSRCP; (f) LIME; (g) RetinexNet; (h) Ours; (I) Ground Truth.

Figure 3.
Contrast of indoor image enhancement effect. (a) Original image; (b) HE; (c) Retinex; (d) MSR; (e) MSRCP; (f) LIME; (g) RetinexNet; (h) Ours.
Figure 3.
Contrast of indoor image enhancement effect. (a) Original image; (b) HE; (c) Retinex; (d) MSR; (e) MSRCP; (f) LIME; (g) RetinexNet; (h) Ours.

Figure 4.
Contrast of outdoor image enhancement effect. (a) Original image; (b) HE; (c) Retinex; (d) MSR; (e) MSRCP; (f) LIME; (g) RetinexNet; (h) Ours.
Figure 4.
Contrast of outdoor image enhancement effect. (a) Original image; (b) HE; (c) Retinex; (d) MSR; (e) MSRCP; (f) LIME; (g) RetinexNet; (h) Ours.


Table 1.
Quantitative comparison of the results of each method. The bold numbers indicate the best performance.
Table 1.
Quantitative comparison of the results of each method. The bold numbers indicate the best performance.
| Method | PSNR | SSIM | UQI |
|---|---|---|---|
| HE | 27.927 | 0.898 | 0.783 |
| Retinex [10] | 27.562 | 0.616 | 0.674 |
| MSR [15] | 27.439 | 0.633 | 0.728 |
| MSRCP [17] | 27.994 | 0.624 | 0.634 |
| LIME [14] | 27.825 | 0.878 | 0.776 |
| RetinexNet [21] | 27.869 | 0.894 | 0.794 |
| Ours | 28.534 | 0.988 | 0.868 |
Publisher’s Note: MDPI stays neutral with regard to jurisdictional claims in published maps and institutional affiliations. |
© 2022 by the authors. Licensee MDPI, Basel, Switzerland. This article is an open access article distributed under the terms and conditions of the Creative Commons Attribution (CC BY) license (https://creativecommons.org/licenses/by/4.0/).
Share and Cite
MDPI and ACS Style
Tang, H.; Zhu, H.; Tao, H.; Xie, C. An Improved Algorithm for Low-Light Image Enhancement Based on RetinexNet. Appl. Sci. 2022, 12, 7268. https://doi.org/10.3390/app12147268
AMA Style
Tang H, Zhu H, Tao H, Xie C. An Improved Algorithm for Low-Light Image Enhancement Based on RetinexNet. Applied Sciences. 2022; 12(14):7268. https://doi.org/10.3390/app12147268
Chicago/Turabian StyleTang, Hao, Hongyu Zhu, Huanjie Tao, and Chao Xie. 2022. "An Improved Algorithm for Low-Light Image Enhancement Based on RetinexNet" Applied Sciences 12, no. 14: 7268. https://doi.org/10.3390/app12147268
Note that from the first issue of 2016, this journal uses article numbers instead of page numbers. See further details here.