
Hybrid Shielding for Hypervelocity Impact of Orbital Debris on Unmanned Spacecraft


Institute of Infrastructure and Environment (IIE)—School of Engineering, The University of Edinburgh, The King’s Buildings, Edinburgh EH9 3FG, UK
*
Author to whom correspondence should be addressed.
Appl. Sci. 2022, 12(14), 7071; https://doi.org/10.3390/app12147071
Submission received: 12 May 2022
/
Revised: 8 July 2022
/
Accepted: 12 July 2022
/
Published: 13 July 2022
(This article belongs to the Special Issue Blast and Impact Engineering on Structures and Materials)
Abstract
:The passive shielding of space craft structures is critical due to the increase in demand for lightweight protection, which is required to counter the damaging effects of micro-meteoroid orbital debris (MMOD) on unmanned spacecraft, which have steeply increased in recent years. Research on hypervelocity impact (HVI) led to the development of shield configurations such as the conventional Whipple shield, which consists of two plates separated by a stand-off distance to allow for the fragmentation and dispersion of the debris from the impact. Variations in the Whipple shield have been proposed, where additional layers are included for increased energy dissipation efficiency. In this work, the authors develop, validate and test a numerical model of an orthogonally loaded hybrid Whipple shield, incorporating an aluminium honeycomb core, orientated with hexagonal tubes perpendicular to the direction of proposed debris travel, to mitigate the well-known channelling effect. The debris threat is an A2024-T3 projectile, impacting the structure at a velocity of 6.5 km/s. The proposed model is validated with experimental observations of the debris spread at half-angle and the efficiency of the proposed topology is assessed against a conventional two-plate A2024-T3 shield. The honeycomb core cell density, its position relative to the point of impact, the thickness of the honeycomb shell, and the material of the honeycomb are thoroughly analysed. A hybrid honeycomb structure concept is proposed, which provides a highly efficient alternative to a standard Whipple shield design, without significantly compromising the weight of the structure. The obtained results clearly show that the hybrid Whipple shield exhibits significantly increased the kinetic energy dissipation of the debris from the impactor and shield front plate, with an increase in the dissipated kinetic energy that can reach relative to the conventional shield.
1. Introduction
Research into the passive shielding of spacecraft structures has heightened over recent decades owing to an increase in demand for lightweight, cost-effective technology, which is required to counter the damaging effects of micro-meteoroid orbital debris (MMOD) [1]. The amount of MMOD in space has been “steadily rising since the beginning of the space age”, as stated in the European Space Agency’s Annual Space Environment Report in 2020 [2]. In 2007 alone, a further 32% increase in MMOD was observed as a result of major low-earth-orbit (LEO) collisions [3]. The rise in MMOD significantly increased the risk associated with space exploration and, as a result, the Inter-Agency Space Debris Coordination Committee (IDAC) was established in 1993 to mitigate the damage caused by micro-meteoroid orbital debris.
The design of the International Space Station (ISS) in the 1990s prompted the further development of protective shielding methods. Hypervelocity impact (HVI) research, along with the hydrocode simulations conducted by NASA and other research facilities and groups, led to the development of numerous shield configurations, such as the Whipple, Stuffed Whipple, and metallic foam sandwich Whipple shields [4]. These protective structures are designed with the main aim of mitigating the effects of hypervelocity impacts that, due to their extremely high energy, have the potential to perforate shields in space structures.
The conventional Whipple shield design consists of two plates, usually made of aluminium, separated by a stand-off distance to allow for the fragmentation and dispersion of debris from the impact on the first plate. A schematic illustration of this design principle is shown in Figure 1.
The Stuffed Whipple, as shown in Figure 2a, incorporates an additional layer, commonly a combination of Nextel or Kevlar/Epoxy, to improve overall shield performance and energy dissipation [6]. The incorporation of metal foams into the Whipple shield design has also been studied in 2017 by Cherniaev and Telichev [6], as shown schematically in Figure 2b. Ryan and Christiansen [5] also demonstrated the potential of such design approaches for space applications, owing to ability to significantly increase the absorption of impact energy compared to more conventional shielding structures. In these studies, it was clearly demonstrated that the two main design characteristics affecting the dissipation of kinetic energy and debris fragmentation are the choice of material(s) (and corresponding material properties) and the geometry of the shield design [1].
In the late 1990s, Christiansen et al. [7] proposed the use of lightweight, non-metallic materials, such as Nextel ceramic cloth and Kevlar, for the Whipple shield. These materials were configured in a number of different flexible multi-layer designs. Christiansen et al. tested the penetration resistance in terms of hypervelocity impact and successfully demonstrated the potential for this lightweight shielding, going as far as deriving a set of ballistic limit equations for the proposed shields for orthogonal and non-orthogonal low ( [m/s]), intermediate ( [m/s]) and high velocity impacts ( [m/s]).
Plassard et al. [8] conducted HVI experiments using a two-stage light gas gun. A 3-mm aluminium projectile was fired with a velocity of 4119 m/s at a Whipple shield consisting of an aluminium target plate and a witness plate positioned 30 mm apart. The experimental observations were compared to numerical simulation results in LS-DYNA. The proposed numerical model was found to be a sufficiently accurate representation of the experiment, justifying the use of the hydrocode in further analysis and the shielding design for the hypervelocity impact of orbital debris on unmanned spacecraft.
Research into the material properties of the Whipple shield was more recently conducted by Zhang et al. [9], where the energy absorption efficiency of the combination of a homogeneous aluminium sheet with a Ti-Al-nylon impedance-graded material (IGM) was compared using both laboratory testing and numerical simulations. The experiments were performed using a two-stage light gas gun and focussed on post-impact effects, using 3D scanners to detect physical damage in detail. Zhang et al. proposed a smooth particle hydrodynamics (SPH) numerical model, developed in AUTODYN, and performed a detailed analysis of the relevant kinetic energy dissipation, fragmentation, and pressure distribution. Their results revealed a significant improvement in shield performance using the IGM with regards to both fragmentation and energy dissipation. The increased shock pressure that was experienced, achieved through the interaction between travelling shock waves and reflected rarefractions, allowed for an optimised shield design. The increase in debris spread angle was further confirmation that the material properties of the IGM were suited to HVI shield design.
Recently, the addition of a honeycomb structure to Whipple shield design has been extensively explored by authors such as Carriere and Cherniaev [10,11] and Aslebagh and Cherniaev [12], among others. These researchers adopted an orientation of the honeycomb, where the cells’ axis is perpendicular to the front and bumper plates. This allows for a significant reduction in the debris spread angle, but creates a channelling effect, as the honeycomb is orientated parallel to the direction of debris travel, as shown in Figure 3. Although the reduction in the debris spread angle is significant, it creates the adverse effect of concentrating the impact on a smaller area, adversely affecting the energy dissipation of the projectile. Double/multi-honeycomb core configurations were noted as being less prone to channelling effects due to the implementation of a staggered design [10].
More recently, Pai and Shenoy [13] presented a detailed review of recent advances in the Whipple shield design, noting that debris channelling (also referred to as ejecta-tunnelling effect) should be considered in the design process of Whipple shields, and can be detrimental to the energy dissipation and mechanisms.
A solution to the channelling effects, however, would be to change the orientation of the honeycomb cells from parallel to perpendicular to debris travel, with the added advantages that the weight of the structure could remain unchanged. In 2009, Ryan et al. [14] conducted a comparative study between the use of a parallel-orientated honeycomb core and metallic open-cell foam for Whipple shield application. These authors found that the foam had several advantages over the honeycomb due to the elimination of channelling.
Very few studies have been dedicated to determining the effectiveness of a perpendicular honeycomb cell orientation regarding the energy absorption of Whipple shields. Therefore, the proposed research aims to explore the potential benefits of implementing a perpendicularly orientated honeycomb core in relation to the energy dissipation of an impact projectile at hypervelocity, and exploring the effects of the topology of the honeycomb structure on the energy absorption of the shield as a whole.
2. Numerical Modelling
The main aim of the proposed research is to explore and optimise the benefits of using lightweight honeycomb structures in the Whipple shield design, with potential application in unmanned spacecraft. A set of numerical models is developed and validated, based on an aluminium honeycomb Whipple shield. These passive shielding models are implemented in LS-DYNA and described in detail in the following paragraphs. The validated models are then used to perform a thorough analysis of the effects of different shield parameters (core density, impact location, etc.) on the energy absorption performance and impact protection of the Whipple shield.
2.1. Model Configuration
The proposed modified Whipple shield has a honeycomb layer—the shield core—between the bumper plate and the rear wall. The honeycomb is orientated with the axis of the cells perpendicular to the impact direction, as shown in Figure 4. The main design principle is that this allows for the sides of the honeycomb cells to maximise the dispersion of fragments at wider angles, also maximising the dissipation of energy further from the back plate and onto a larger area. This orientation also fully eliminates the possibility of channelling effects, which, as previous research suggests, has a highly detrimental effect on reducing the impact kinetic energy of the debris particle [10].
The numerical models include a spherical projectile, and front and back plates with 1 and mm thickness, respectively. The diameter of the projectile is 5 mm, which is consistent with the lower end of the equivalent sphere diameter (ESD) distribution, as reported by a number of different authors [15,16,17]. The model developed by the authors is validated and optimised based on the effects of a number of design parameters on the energy absorption capacity of the shield. These include the density of the honeycomb (i.e., number of honeycomb cells per unit length), the thickness of the honeycomb shell, the choice of honeycomb material, and the location of impact relative to the honeycomb.
2.2. Finite Elements and SPH Model
The finite-element method is used to model the impact response of the whole system, including the front (bumper) and back plates, and all models were set up in LS-DYNA.
Solid constant stress solid elements are used to model the bumper plate and black wall, and four-node constant thickness shell elements are used in the honeycomb structure. The same mesh size is used in both the bumper and back plates and a thorough mesh convergence analysis is carried out to determine the optimal mesh size. The spherical projectile and the impact area on the front plate are modelled using Smoothed Particle Hydrodynamics (SPH). The convergence analysis was also extended into the SPH domain to determine the optimal particle density, especially as this method is highly computationally heavy and often leads to high CPU times. Specific contacts were implemented to model the interaction between the different model components: (i) tied contacts between the finite element and the SPH particles in the bumper plate, and (ii) automatic contacts between all SPH particles—both from the impactor and the impacted area—and all other finite-element components in the model (the back plate, the front plate and the honeycomb). In LS-DYNA, these contacts were implemented with the keywords *CONTACT_AUTOMATIC_NODES_TO_SURFACE and *CONTACT_TIED_NODES_TO_SURFACE, respectively.
To optimise computational efficiency the proposed models explored symmetries when possible, that is, when all impact, geometrical and boundary conditions were symmetrical. and are the two symmetry planes of this model, as can be seen in Figure 5a. One of these planes—symmetry plane —is used in this research, as shown in Figure 5b. Symmetry plane , however, cannot be used, as it is not a symmetry plane for the impact location analyses, where symmetry is broken when the debris particle impacts at different locations.
The HVI problem being analysed is a kinematics-dominated problem; thus, imposing fixed boundary conditions on the Whipple plates is not strictly necessary. This is supported by the progression of the post-impact radial stress wave on the Whipple front plate. To ensure the consistency of analysis with the experimental results of Zhang et al. [9], these boundary conditions were imposed. The implemented boundary conditions are shown in Figure 5. The external edges of the finite-element meshes on the front and back plate, as well as the honeycomb core, are fixed in all degrees of freedom (linear and rotational). The motion of all SPH particles on the plane of symmetry was also restricted to in-plane motion, that is, fixed in the y-direction, as shown in Figure 5.
An initial constant velocity of 6500 m/s is imposed on the spherical projectile along the direction perpendicular to the bumper plate (z-direction in Figure 5). This velocity is representative of a generic micro-meteoroid orbital debris particle impacting the shield.
2.3. Constitutive Modelling
Due to the high energy involved in the hypervelocity impact, all Whipple shield components, including the honeycomb core and debris particle, were modelled with the Johnson–Cook constitutive law to ensure adequate plasticity, strain-rate and temperature material behaviour is captured. These three terms are explicitly and separately described in Johnson–Cook’s constitutive equation
where is the flow stress, is the equivalent plastic strain, n is the strain hardening exponent, A, B, C and m are material constants that can be determined experimentally, is the equivalent plastic strain rate [18], and is the non-dimensional homologous temperature, defined as
where T is the current temperature, is the melting temperature and is the transition temperature, at or below which there is no temperature dependence for the yield stress.
Damage caused by the impact is modelled using the associated Johnson–Cook damage model, which similarly considers the effects of plasticity, strain-rate and temperature, and can be described by the equation
where are the damage parameters measured at or below the transition temperature and is the stress triaxiality, which represents the ratio of pressure to von Mises stress. The damage parameter is then calculated as
and damage occurs when the damage parameter D reaches a value of . After damage initiation, the material stiffness is progressively degraded according to the damage evolution relationship [18].
The developed models of the Whipple shield honeycomb core were tested with two different lightweight materials: an aluminium alloy (AL2024-T3) and a titanium alloy (Ti-6Al-4V). The impact energy absorption efficiency of both materials is analysed and compared. The front plate, the back plate and the debris particle (projectile) are aluminium (AL2024-T3) throughout. The material parameters for all materials in the models are listed in Table 1 [19,20].
Due to the high energy involved in the hypervelocity impact, the compressibility of the materials is modelled using the non-linear Mie–Grüneisen equation of state
where E is the internal energy, is the relative density, is the non-dimensional Grüneisen constant, a is the volume correction for and are material constants that depend on the shock wave and particle velocities. The corresponding parameters are listed in Table 1. This simplified version of the non-linear Mie–Grüneisen equation of state in Equation (5) only considers the first-order dependency of the pressure on the material density ().
2.4. Convergence and Validation
A standard two-plate Whipple shield was used to validate the methodology and models in this research. To achieve this, the numerical results from the standard Whipple shield (SWS) were compared to experimental observations by Zhang et al. [9], where all model parameters were kept the same to allow for a direct comparison. The SWS simulation setup is shown in Figure 6. A 5-mm aluminium projectile was fired with a velocity of 6500 m/s at a Whipple shield with a front plate of thickness 1 mm and a back plate thickness of mm. Figure 7 shows the progression of the simulation in approximately 2-s intervals.
2.4.1. SPH Particle Density
Zhang et al. [9] published the results of a pressure analysis conducted on an AL2024 standard Whipple shield. These authors used pressure gauges applied to the front of the projectile to calculate the average impact pressure on the front plate on the first s of the impact. A similar procedure is followed in the numerical model developed in this work. The simulation was run with varying SPH particle densities and the results obtained for s are shown in Figure 8. Datapoints were extracted from the work of Zhang et al. [9] and have also been included in Figure 8 to allow or a comparison and validation to be made, where the average impact pressure p was determined as the average of the pressure distribution for s, for a range of selected SPH particles on the front side (towards the direction of impact) of the projectile, to match the data recorded by Zhang et al. [9].
The general trend of the impact pressure results is similar to the experimental observations of Zhang et al., albeit with a relatively high level of scatter—the largest relative difference in peak average impact pressure between the numerical model and the observations of Zhang et al. [9] is below 43%. The results in Figure 9, showing the average impact pressure p and computational runtime against the SPH particle density, allow for a converging solution to be more easily identified. A clear convergence can be observed from an SPH particle density of 5 particles/mm to 13 particles/mm. The computational runtime is shown to exponentially increase with an increase in the SPH particle density. This clearly suggests that using fewer SPH particles within the model is a more efficient approach. The intersection of best-fit curves in Figure 9 can be used to select the optimum modelling approach and SPH particle density, which, in this case, is below 10 particles/mm. Optimising the computational runtime for the available resources was necessary, leading to an optimal particle density of 5 particles/mm.
To more robustly validate the proposed models, a thorough comparison of the debris spread angle was also done. Zhang et al. [9] reported that the half-angle obtained using the aforementioned parameters to be °. The debris spread half-angle for the LS-DNYA model was measured on the Whipple shield model at multiple time intervals and averaged to obtain a half-angle of °. This corresponds to a relative difference of %, and is thus considered accurate, further validating the use of the proposed SPH particle density in the model for further analysis.
2.4.2. Honeycomb Mesh Convergence
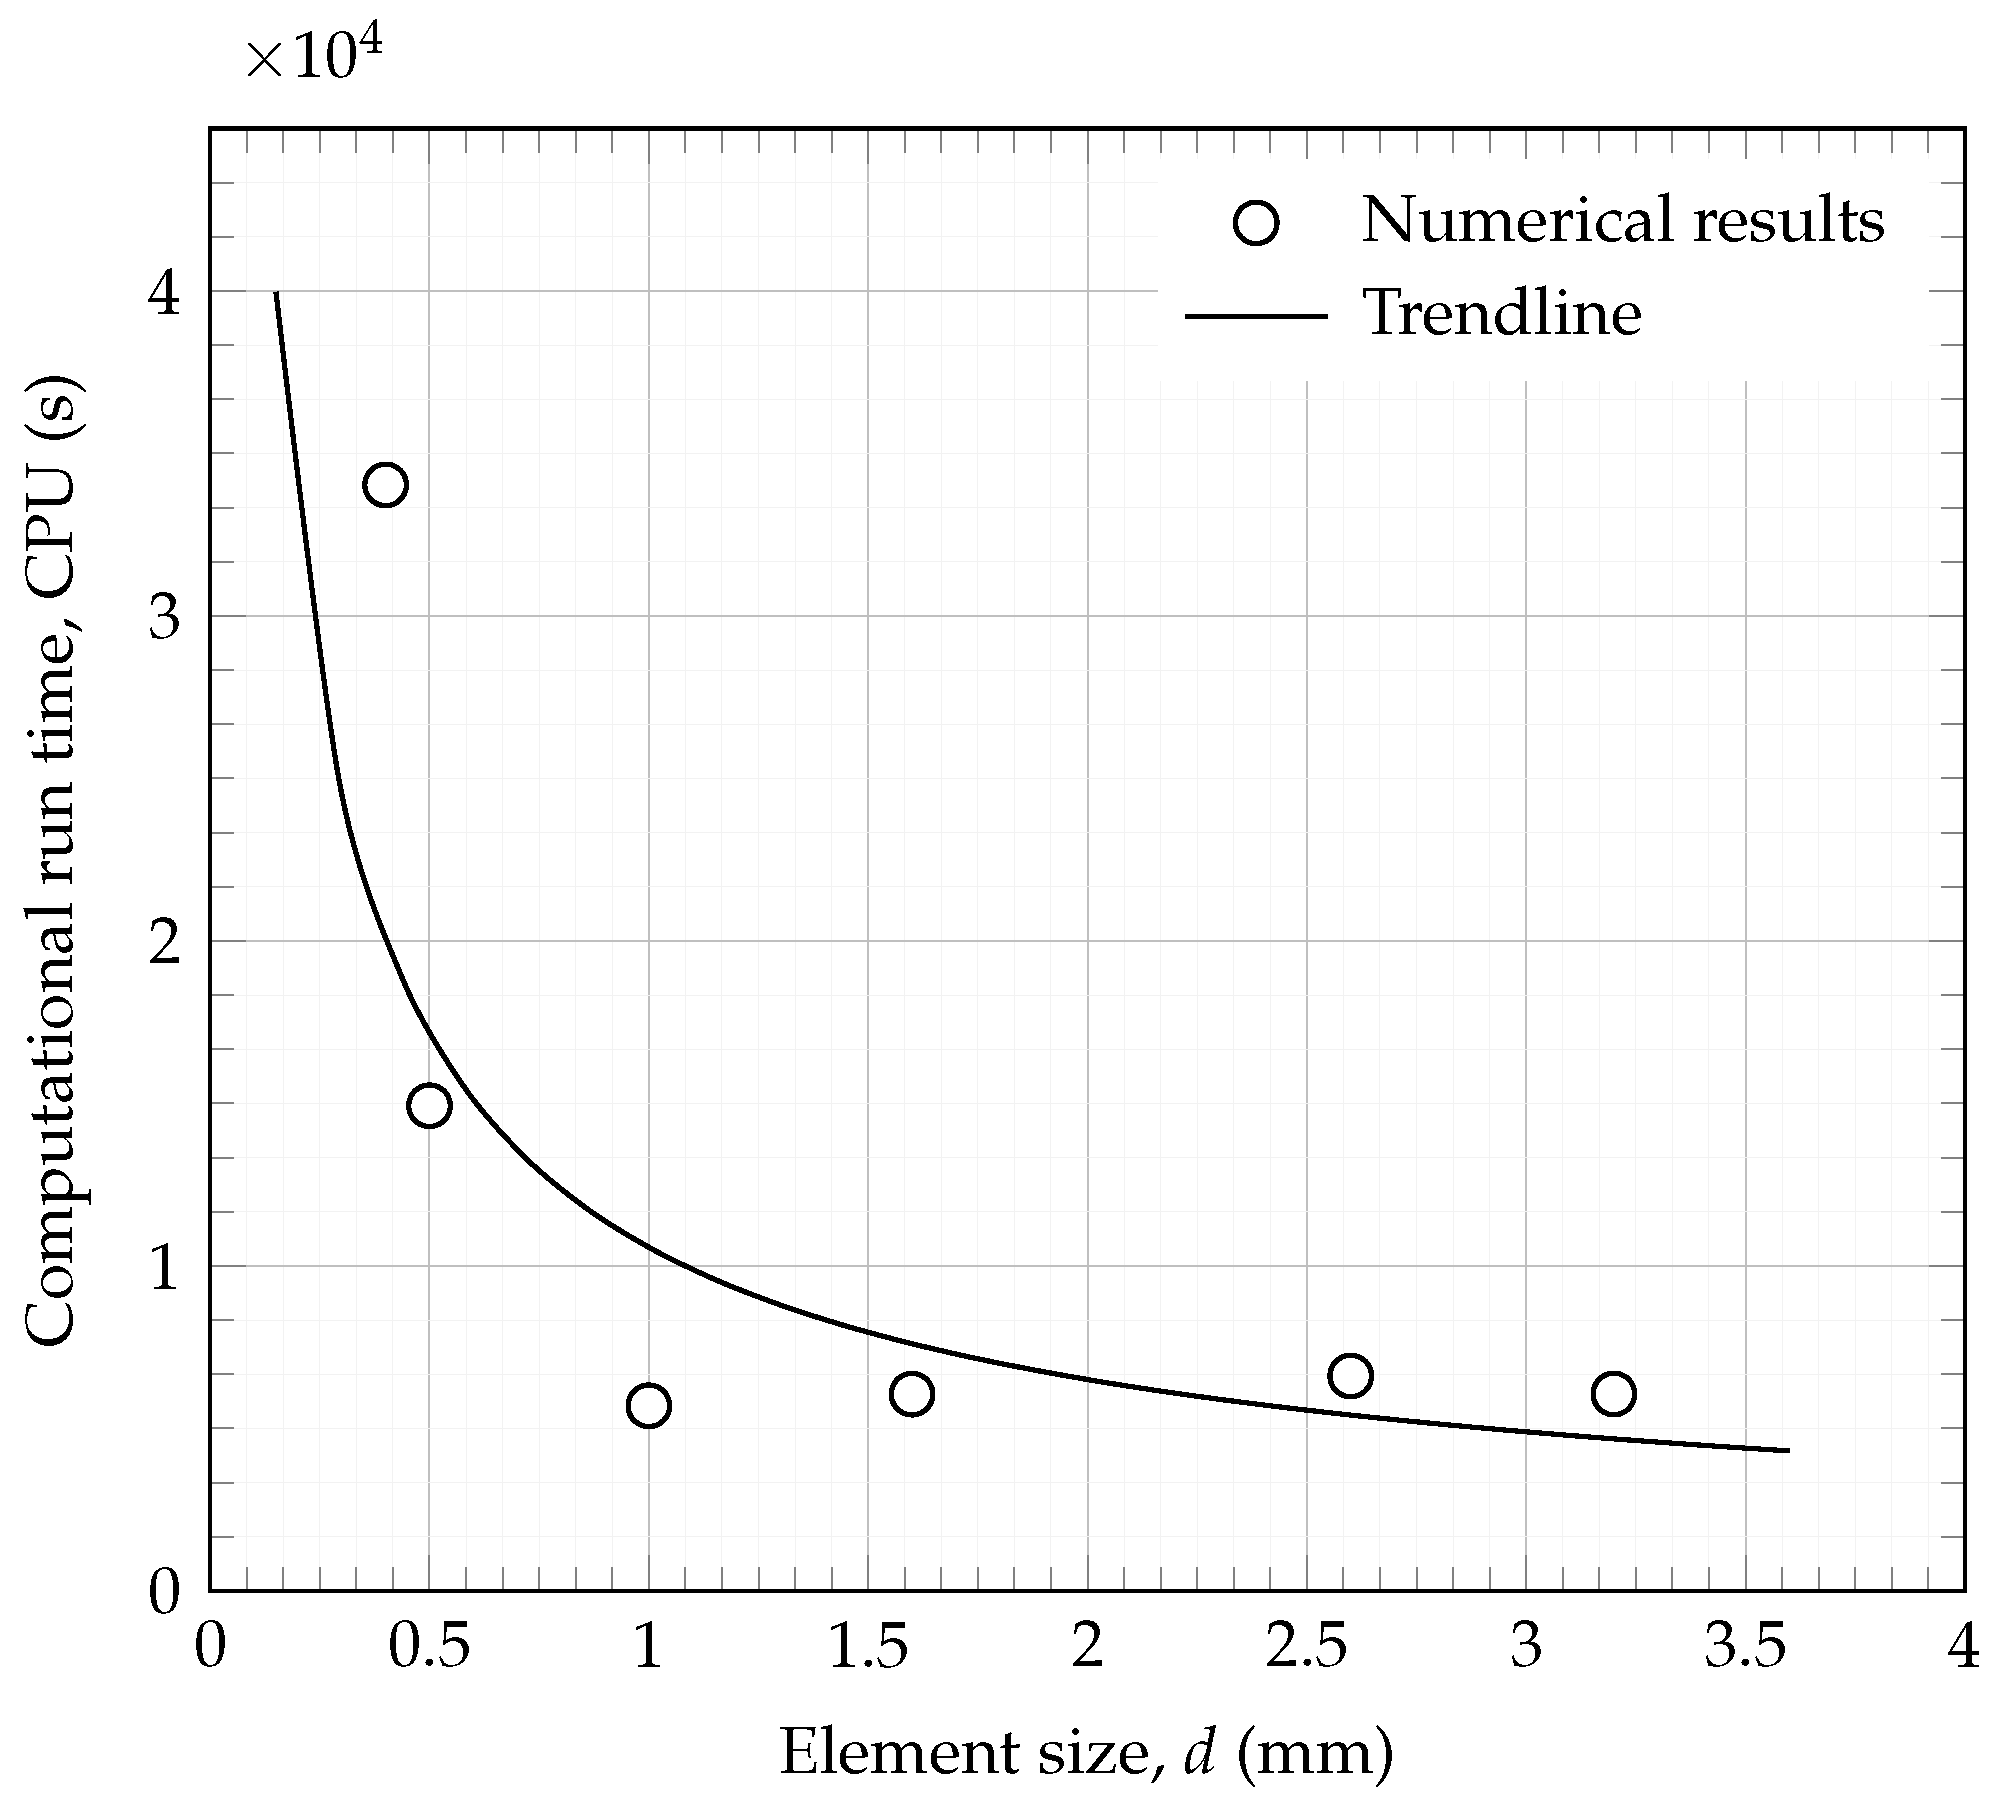
A detailed mesh convergence analysis was also performed on the honeycomb core structure. The computational run time (CPU) was monitored for finite element meshes of the honeycomb with different element sizes, ranging from to mm, with the corresponding results shown in Figure 10. The convergence analysis simulation was set up with an SPH density of 5 particles/mm to minimise computational run time, and all remaining models were set up with the optimal 7 particles/mm density. Al2024-T3 was used for all components of the shield, and all parameters other than the mesh element size of the honeycomb shell were kept constant. The results in Figure 10 indicate that the optimum solution in terms of reducing CPU time whilst retaining an accurate solution, is to use a 1 mm element size.
3. Results and Discussion
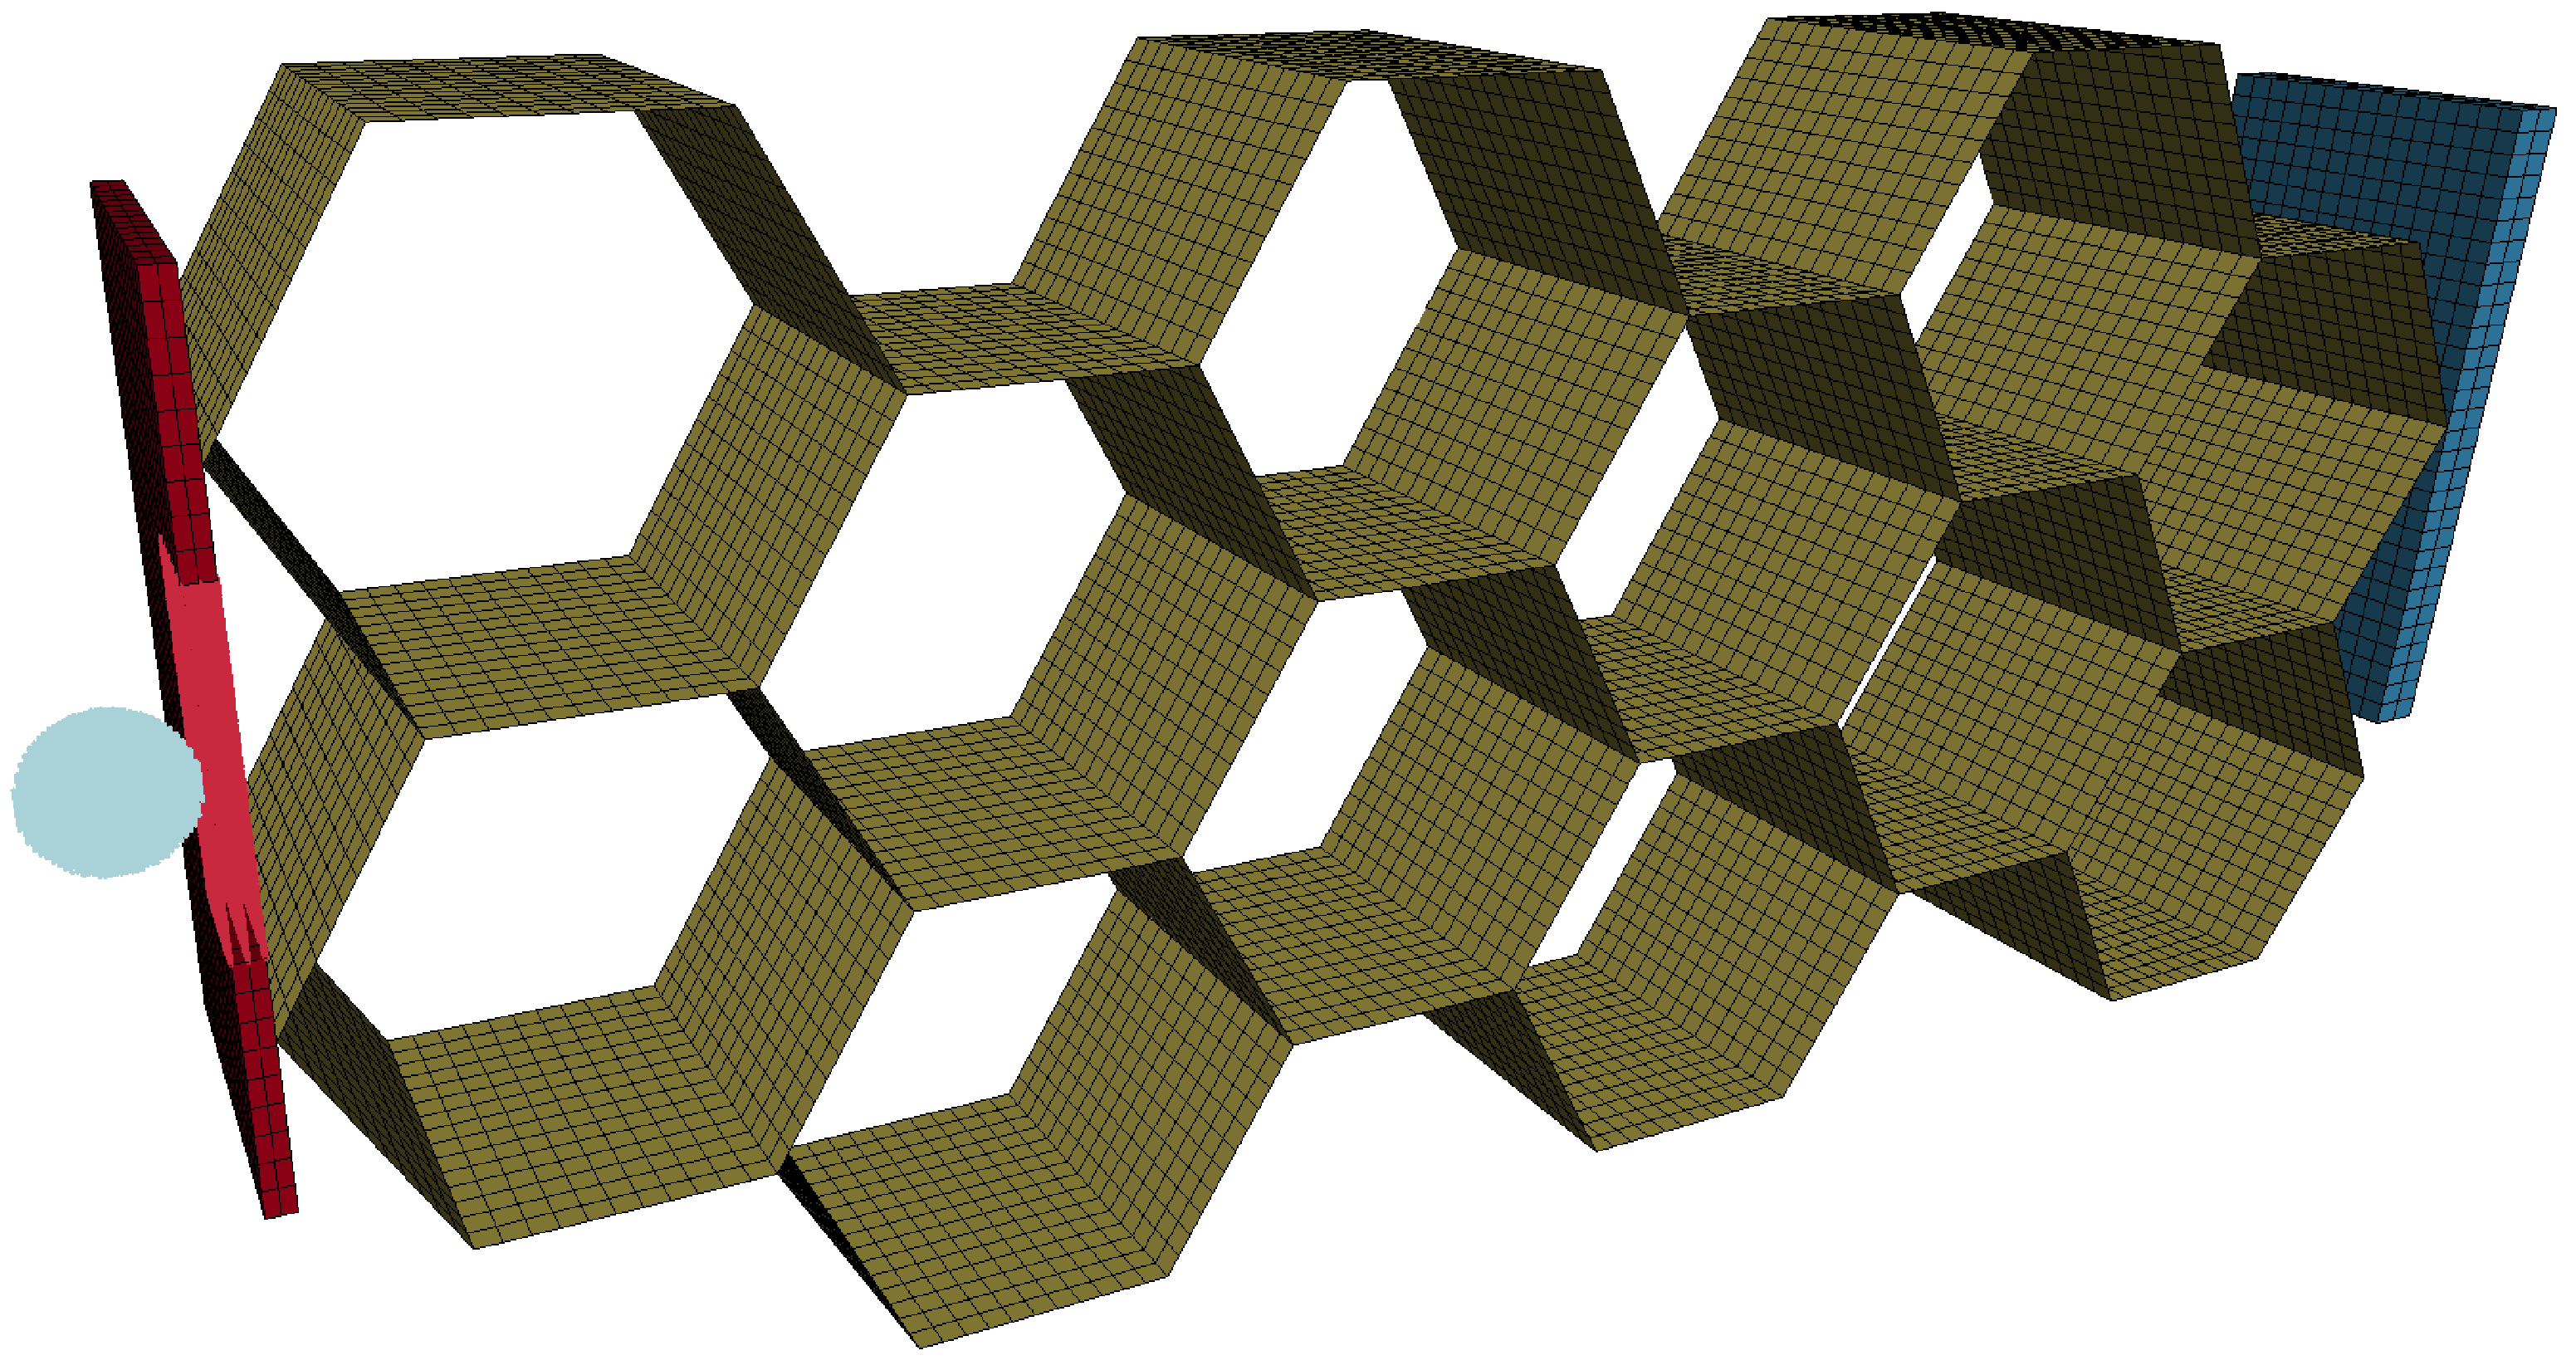
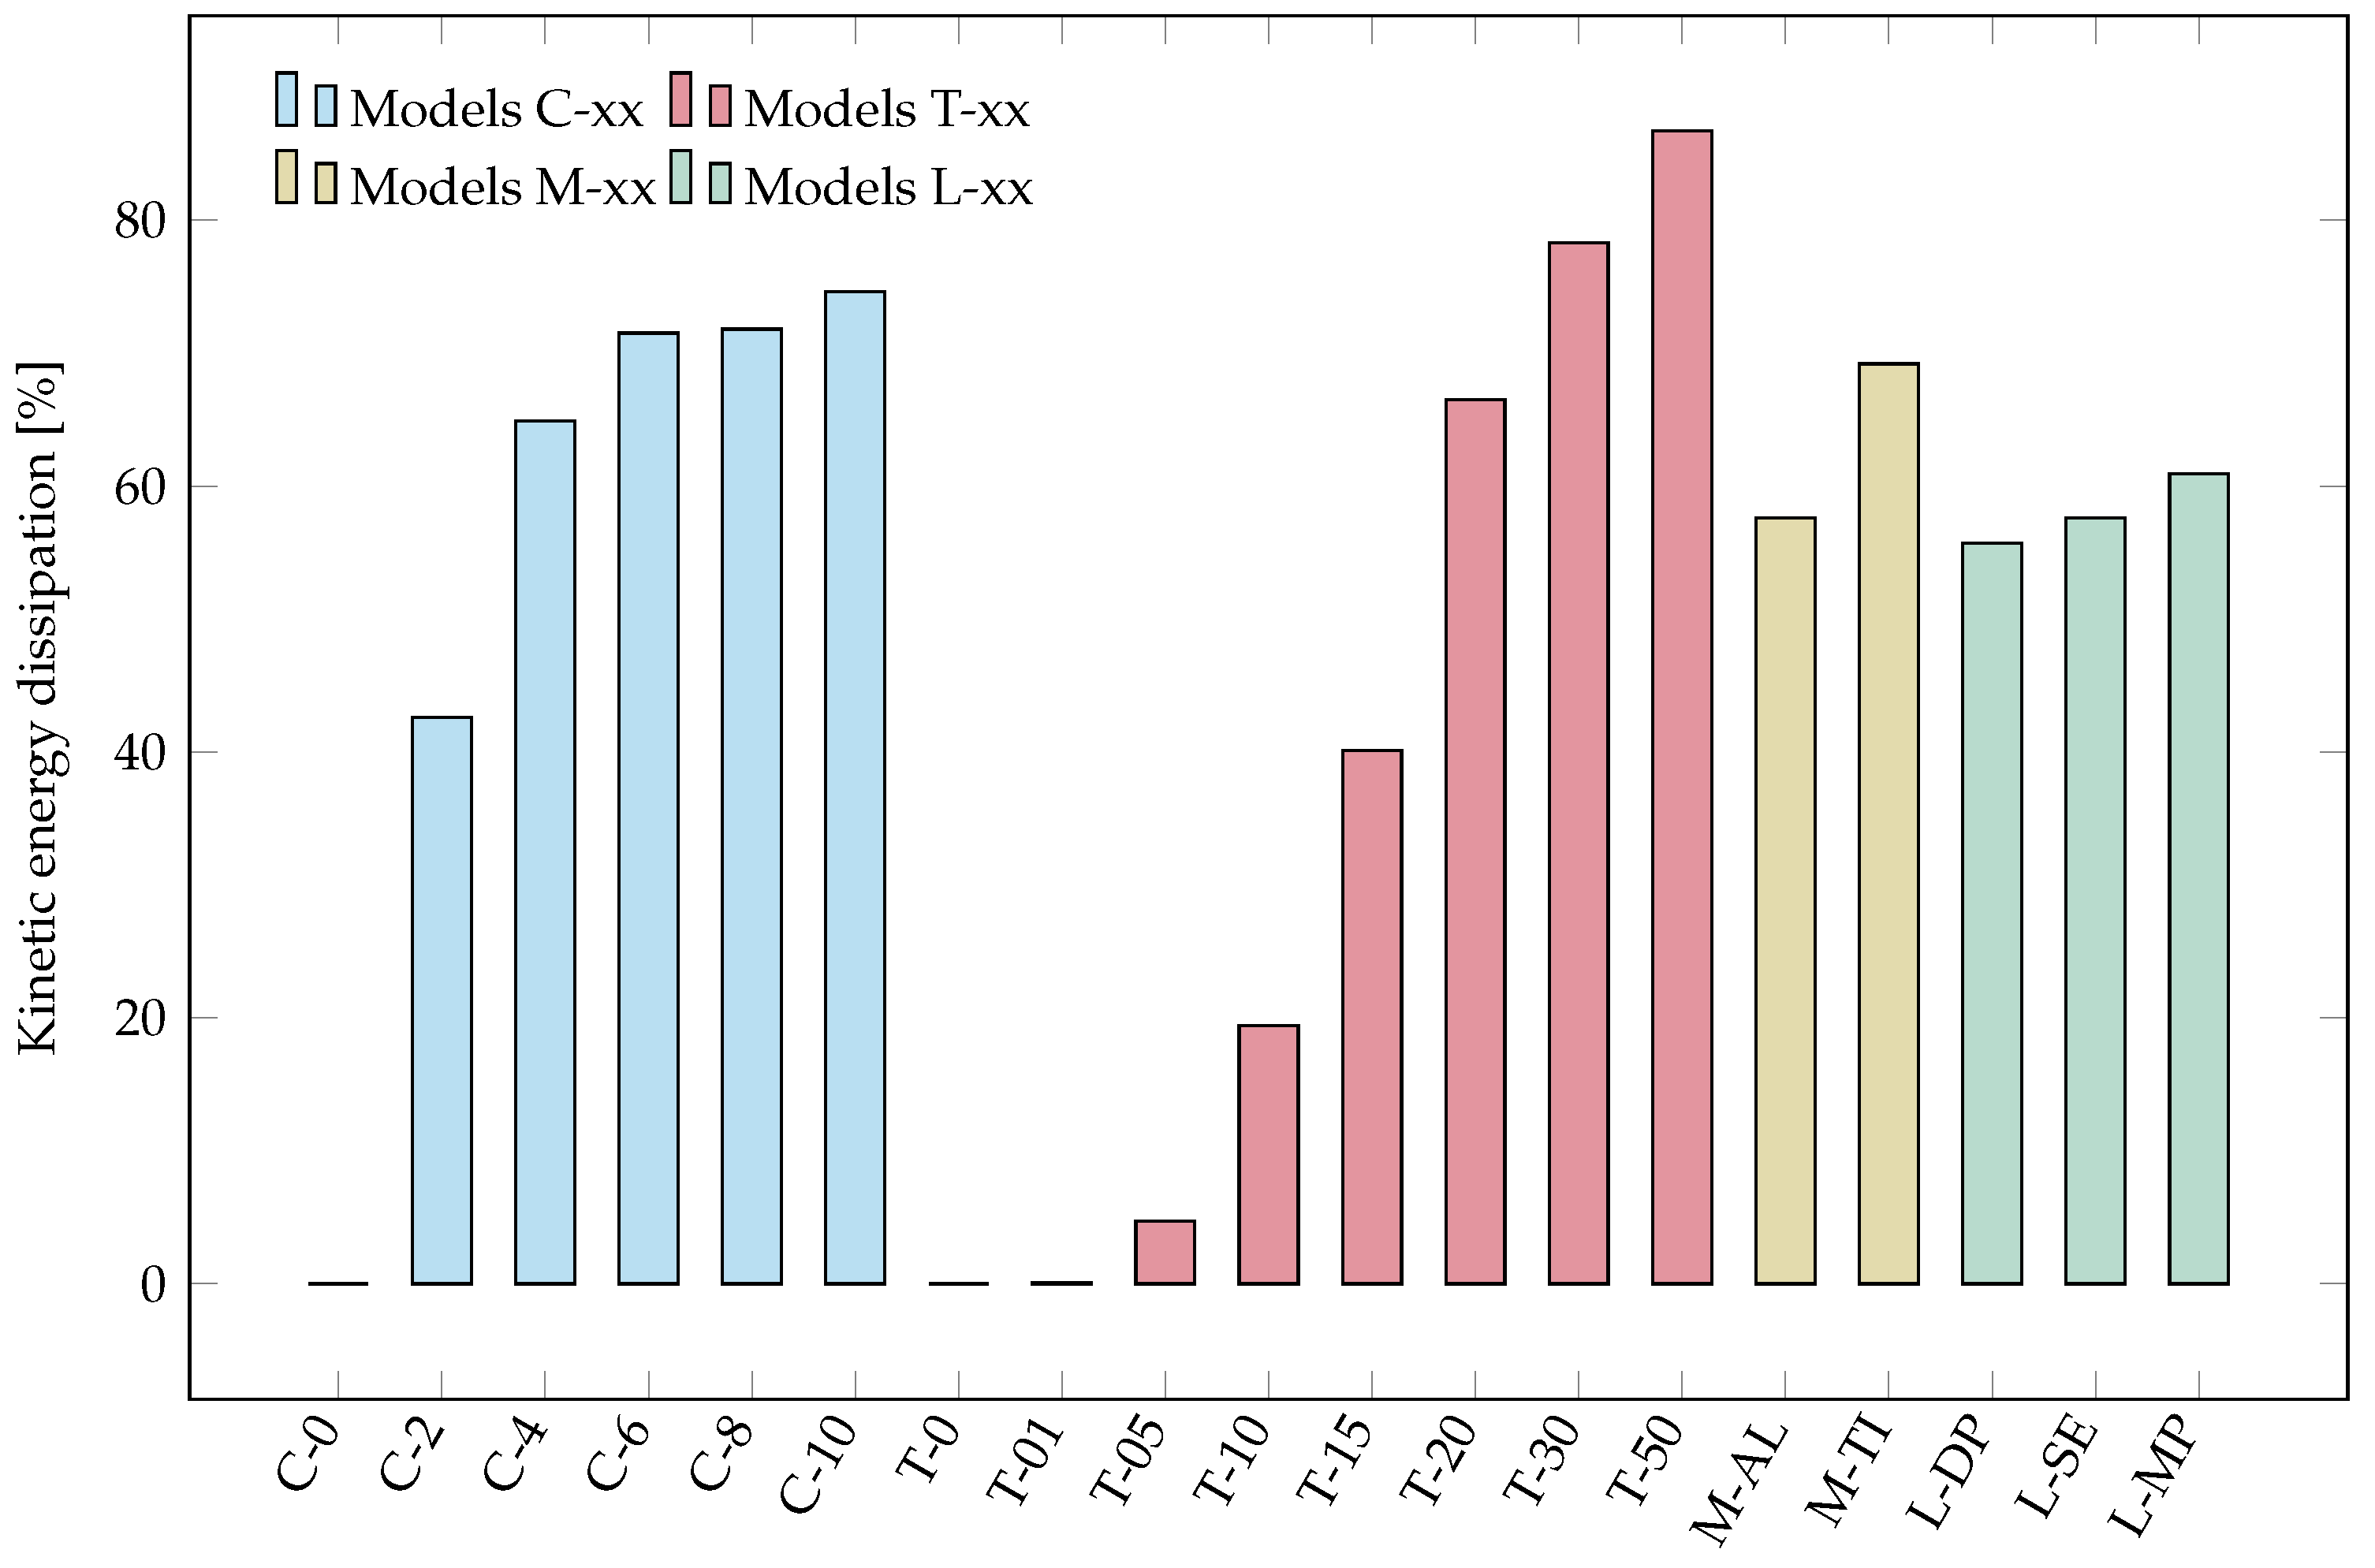
This section discusses the results of further analyses done with the models described and validated in the previous sections. These include a number of critical design parameters of the Whipple shield, such as (i) the density of the honeycomb core (i.e., the number of honeycomb cells along the width of the core); (ii) the thickness of the honeycomb shell, both of which will directly impact the weight (areal density) of the final shield; (iii) the honeycomb base material; and (iv) the exact location of the impact relative to the honeycomb. The capacity for the shield to dissipate the kinetic energy of the impact was used as the main design parameter in these studies. The labels and specifications of the developed models are listed in Table 2, along with the key results from each parameter study to analyse the effectiveness of the honeycomb core shield. As an example, Figure 11 shows a 3-dimensional view of the T-50 model, with a core cell density of 6 and a shell thickness mm. Table 3 and Figure 12 summarise the main results from all the tests. In order to record the energy dissipated before particles bounce back off the back plate, some results are captured at different times, s for the honeycomb shell thickness simulations and s for all remaining ones.
3.1. Honeycomb Core Cell Density
It was anticipated that the honeycomb core cell density, i.e., the number of cells per unit length across the width of the shield gap, would be a critical parameter influencing the energy absorption efficiency of the shield. In order to test this hypothesis and quantify the influence of the honeycomb core cell density, a number of models were developed using an SPH particle density of 7 particles/mm for the projectile and region of impact, as discussed in Section 2.4.1, and different cell densities. All model parts, including the honeycomb, were set as AL2024-T3 and a finite-element mesh element size of 1 mm was used.
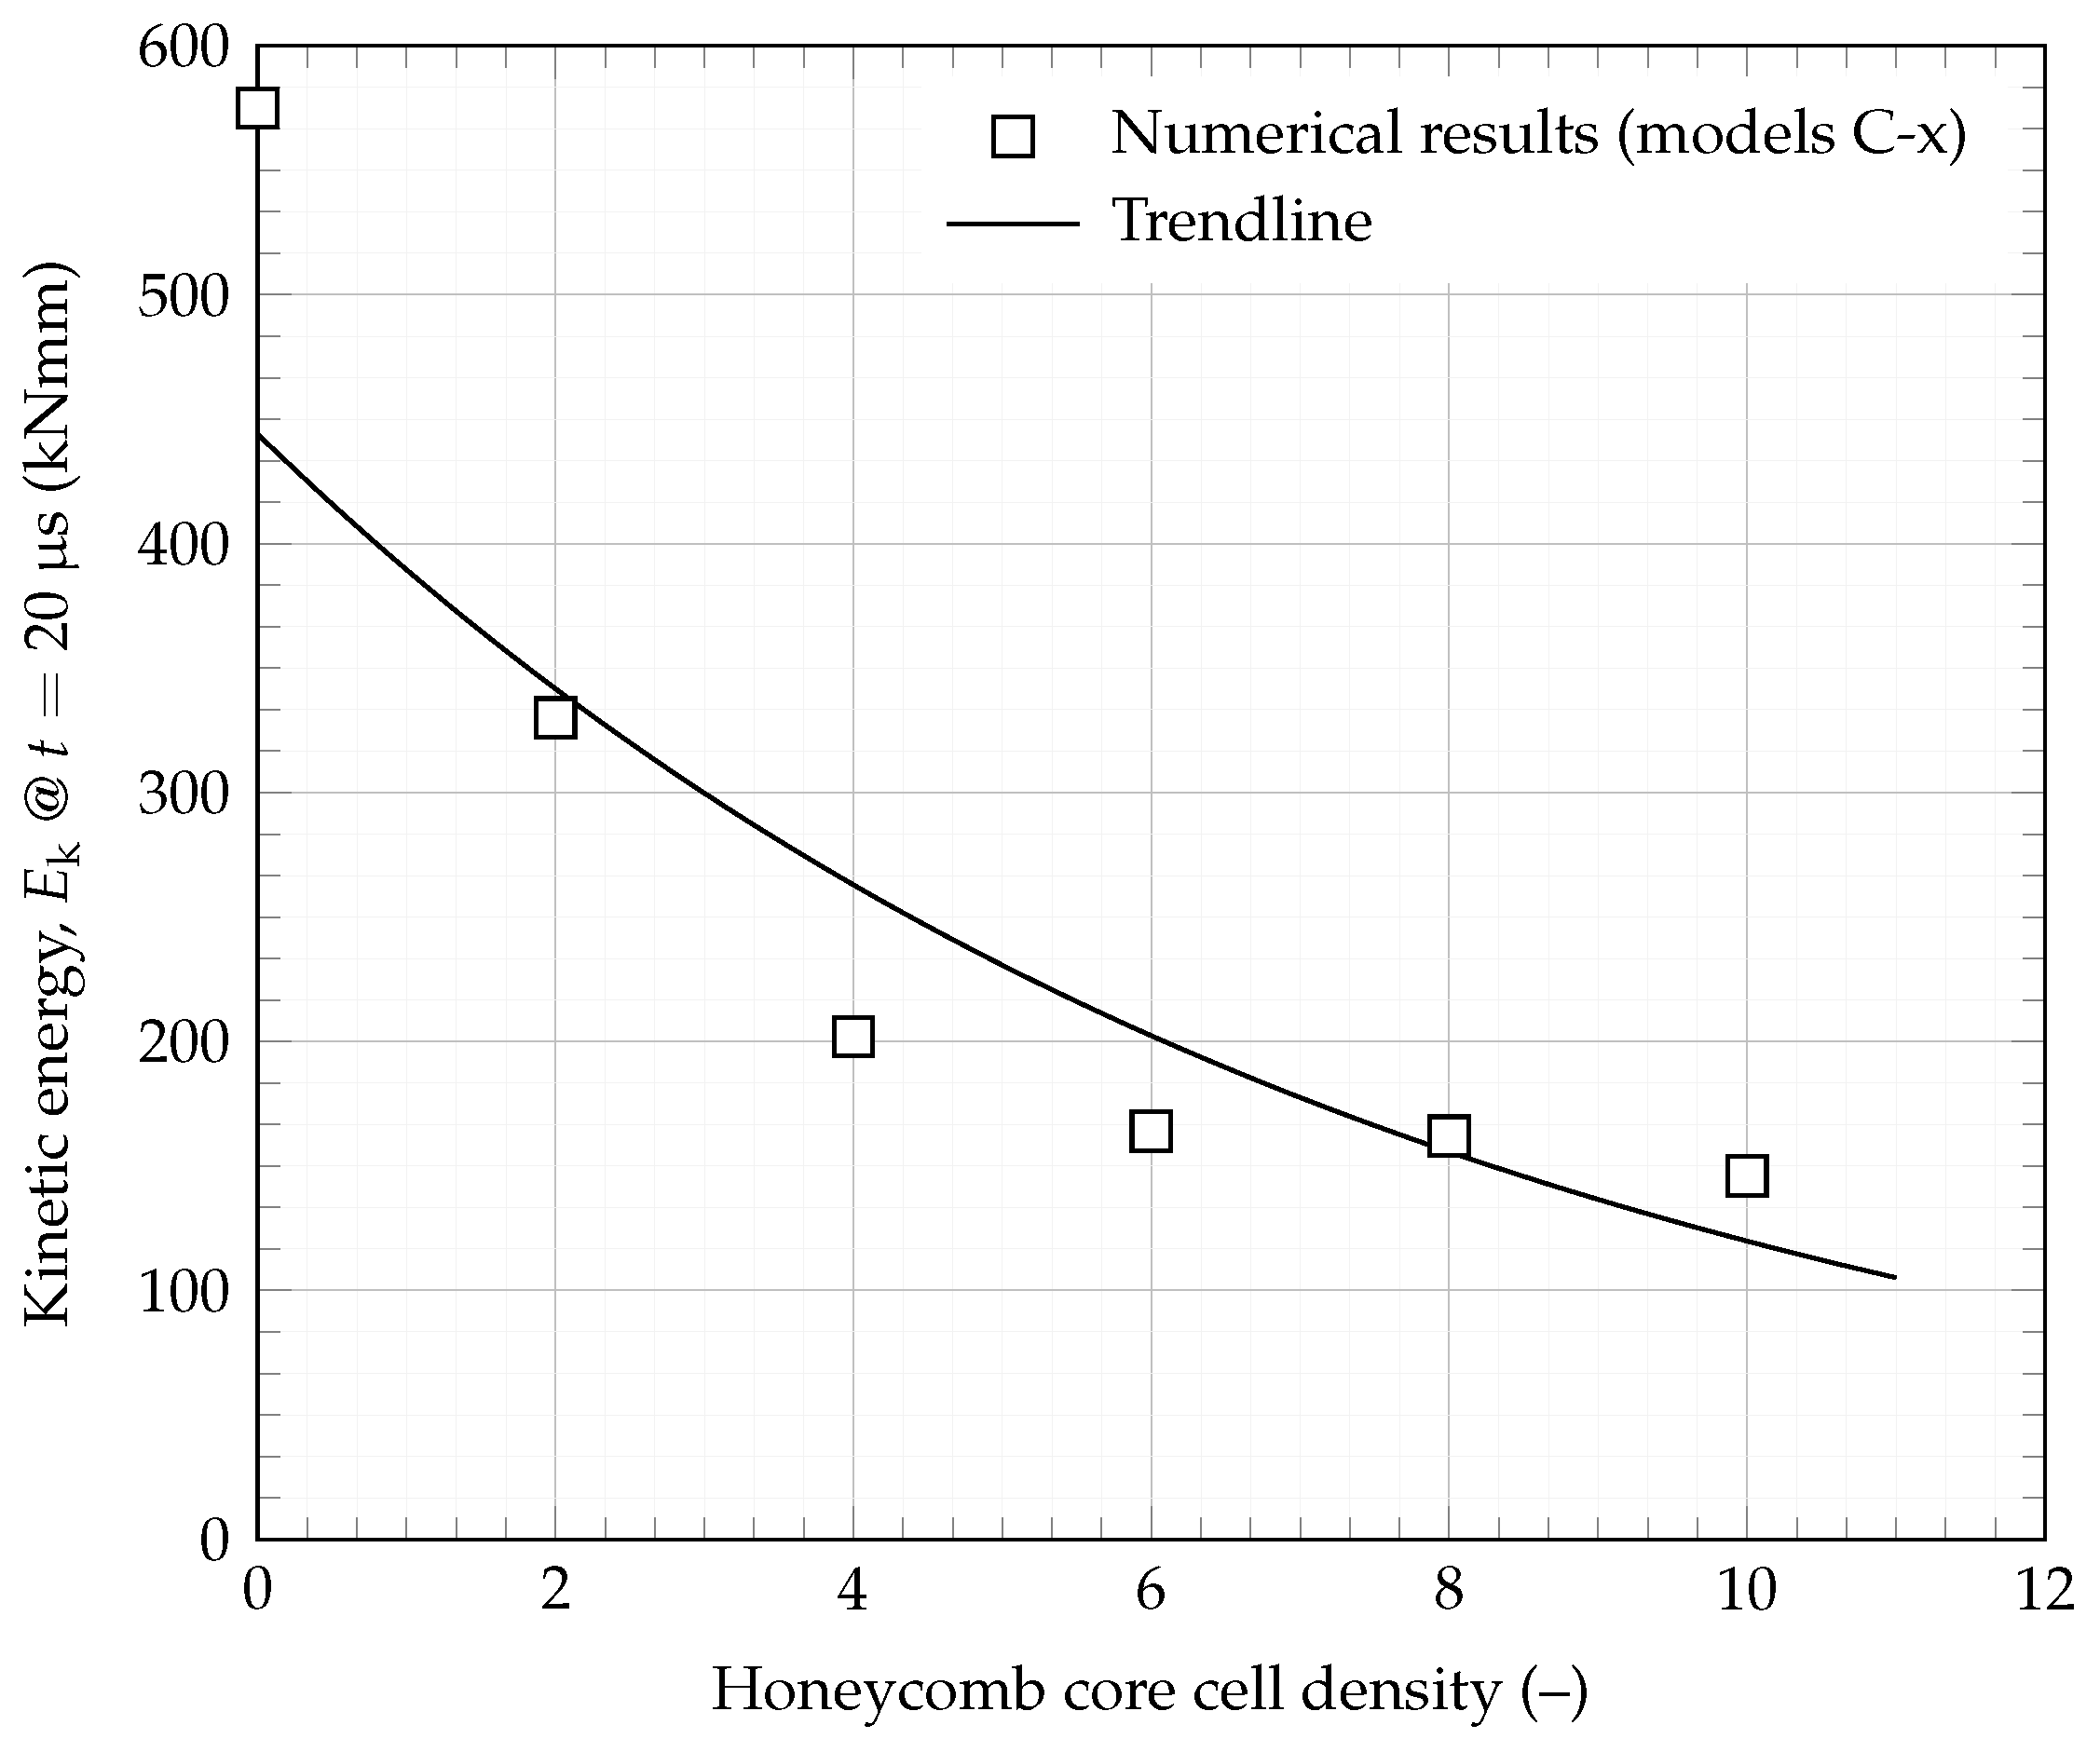
The results in Figure 13 show how the total kinetic energy of the debris particle was dissipated to increase the honeycomb core cell densities (models C-0 to C-10). Model C-0 is included as it represents the standard Whipple shield, i.e., without a honeycomb core. It can be clearly observed that the kinetic energy of the debris particle significantly decreases when a honeycomb component is introduced, corresponding to an increase in the energy dissipation ranging from a minimum of to a maximum of , as shown in Table 3. Figure 13 also shows that the change in kinetic energy of the debris particle for cores with more than six cells across the width is minimal. The difference in energy dissipation between model C-6 and model C-10 is only . Therefore, for the modelled impact conditions, increasing the core cell density above six cells (model C-6) is not beneficial in terms of energy absorption and will clearly be detrimental to the weight of the structure.
The simulation frames in Figure 14, showing the numerical model of each honeycomb configuration at time s, further support these observations and conclusions, clearly showing that the dispersion of particles becomes more evident when increasing honeycomb core cell density. There is some visible penetration of rogue SPH particles, which is a known issue with SPH modelling. Common strategies to try to mitigate these nonphysical effects include changing the contact algorithm and/or refining the finite-element mesh of the impacted part. In the present case, however, these two strategies were tested and proved to not decrease rogue particle penetration without significantly increasing the cost of the computation. Additionally, the energy of these rogue particles was estimated to be insignificant (less than ) compared to the total energy of the problem. A higher level of fragmentation and damage to the honeycomb shell occurred closer to the front plate, which further supports the results shown in Figure 13. A complete absence of channelling effects is also visible.
3.2. Honeycomb Shell Thickness
The impact of the thickness of the honeycomb core shell on the energy dissipation efficiency is analysed by simulating varying values of shell thickness, . Following the conclusions regarding the optimisation of the honeycomb core cell density in Section 3.1 above, model C-6 is used, with an AL2024-T3 honeycomb, and a shell thickness ranging from to mm, as listed in Table 2. The debris particle and impact zone have an SPH particle density of 7 particles/mm. The results in Figure 15 show a significant decrease in the kinetic energy of the debris particle at s for increasing . This trend shows that, for thicknesses above mm, the increase in energy dissipation becomes less evident. The energy dissipation increases only for thicknesses between and mm, compared to a increase between and mm, which corresponds to model T-30 in Table 3.
To further support these conclusions, the simulation images in Figure 16 clearly show that, for shell thicknesses above mm, there is no clustering of SPH particles (i.e., debris) reaching the back plate of the Whipple shield. A clear increase in debris fragmentation can also be observed from model T-01 to model T-50 at s. Models with a smaller shell thickness exhibit a more tightly packed particle spread than models with a larger shell thickness, showing fewer particle clusters. The particle spread also appears much closer to the back plate for a smaller shell thickness. This further supports the results in Figure 15, as the increasing thickness of the honeycomb shell could be expected to positively influence the spread of debris fragments.
3.3. Honeycomb Material
The honeycomb material is a critical design aspect for the optimised Whipple shield as this will not only have a direct impact on the energy absorption, but also on the weight of the structure. Two different numerical models were developed using aluminium alloy (AL2024-T3) and titanium alloy (Ti-6Al-4V) honeycomb cores, corresponding to models M-AL and M-TI in Table 2, respectively. These models are compared to determine the effect that changing the material of the honeycomb core has on the energy dissipation of the debris particle. Figure 17 shows how the kinetic energy is dissipated for both models in the first s of the impact. These results clearly show that, from early in the impact (s), model M-TI is more efficient at dissipating the kinetic energy of the debris particle when compared with model M-AL. Although a difference can be observed in the kinetic energy of the debris particle between the two different materials at s, when comparing to the standard Whipple shield, the energy dissipation efficiency is significantly higher, at and for the M-AL and M-TI models, respectively.
Figure 18 shows a comparison in debris fragmentation and honeycomb perforation between the two material models, M-AL and M-TI. Although the perforation pattern of the honeycomb is similar between the two models, there is an evident variation, albeit slight, in the distribution of the debris going through the honeycomb structure, with a larger fraction of particles appearing further toward the back plate in model M-AL compared with model M-TI. This agrees with the results in Figure 17, and suggests that the titanium alloy Ti-6Al-4V honeycomb is more effective in dissipating the kinetic energy from the hypervelocity impact.
3.4. Location of Impact
Given the hexagonal geometry of the honeycomb core when orientated perpendicular to the impact direction, it could be expected that the exact location of the impact might lead to different energy dissipation patterns. To explore this, three distinct models were developed where the location of impact is changed according to the schematics in Figure 19. Model T-30, with an Al2024-T3 alloy honeycomb core, was used to analyse the effect of changing the location of impact on the dissipation of kinetic energy of the debris particle. The debris particle was fired at a velocity of 6500 m/s at a single edge of the honeycomb structure, a double point and at the mid-point. The details of these models are listed in Table 2. The results in Table 3 show that the highest kinetic energy dissipation occurs for model L-MP, where the debris particle impacts the mid-point of the honeycomb. However, the energy absorption history is similar across all three models, as can be seen in Figure 20, which indicates that very little variation is seen between simulations at different debris impact locations. This is additionally supported by the maximum difference in energy dissipation of between the three models. Further, Figure 21 shows little visible variation in particle fragmentation, demonstrating that using the honeycomb structure in this orientation is a suitable method for dissipating kinetic energy, irrespective of the exact location of the impact.
4. Conclusions
This research proposes a set of numerical models to improve the design practice of unmanned hypervelocity impact shields. These are validated with experimental observations, including the debris-spread half-angle. Critical design parameters such as the honeycomb core cell density (i.e., the number of cells per unit length of the standoff gap), the thickness of the honeycomb core shell, the material of the honeycomb and the location of the impact relative to the honeycomb, are thoroughly analysed. The observations and results from this research clearly show that the proposed hybrid Whipple shield exhibits a significantly increased kinetic energy dissipation of the debris from the impactor and shield front plate.
The extent of the effect of altering both the material properties and the location of impact is not comparable to the cases in which the geometry of the honeycomb core was altered (the number of honeycomb cells and the thickness of the honeycomb shell). The dissipation of the kinetic energy of the debris particle is more sensitive to geometrical changes than to changes in the material properties and location of impact. The observed relative increase in energy dissipation can reach by including the honeycomb core and increasing the thickness of its shell.
From a shield design perspective, however, there are a number of other factors that cannot be accounted for in the present work. These include, for example, component and assembly level cost, component and assembly level weight and geometrical constraints beyond those considered in this research. The work presented here is not intended to be a multi-parameter optimisation study, but instead a detailed analysis of the main design parameters affecting the shielding performance under hypervelocity impact. With these constraints, the following conclusions can be drawn:
- Adding a honeycomb core can significantly improve the shielding ability.
- Increasing the thickness of the honeycomb core shell also increases efficiency, although this parameter has the opposite effect on the cost and weight of the shield.
It should be added that no definite conclusion should be drawn regarding the location of the impact, as this parameter cannot be controlled by design. These observations clearly suggest that the proposed hybrid honeycomb structure concept provides a highly efficient alternative to a standard Whipple shield design without significantly compromising the weight of the structure.
Author Contributions
Conceptualization, K.F. and F.T.-D.; methodology, K.F. and F.T.-D.; validation, K.F. and F.T.-D.; formal analysis, K.F. and F.T.-D.; resources, F.T.-D.; writing—original draft preparation, K.F.; writing—review and editing, K.F. and F.T.-D.; supervision, F.T.-D. All authors have read and agreed to the published version of the manuscript.
Funding
This research received no external funding.
Data Availability Statement
Not applicable.
Acknowledgments
For the purpose of open access, the authors have applied a Creative Commons Attribution (CC BY) licence to any Author Accepted Manuscript version arising from this submission.
Conflicts of Interest
The authors declare no conflict of interest.
Abbreviations
The following abbreviations are used in this manuscript:
| CPU | Central Processing Unit |
| ESD | Equivalent Sphere Diameter |
| FEM | Finite-Element Method |
| HVI | Hypervelocity impact |
| IDAC | Inter-Agency Space Debris Coordination Committee |
| IGM | Impedance-graded material |
| ISS | International Space Station |
| LEO | Low earth orbit |
| MMOD | Micro-meteoroid orbital debris |
| NASA | National Aeronautics and Space Administration |
| SPH | Smoothed Particle Hydrodynamics |
| SWS | Standard Whipple Shield |
References
- Astromaterials Research and Exploration Science Directorate. Handbook for Designing MMOD Protection; Technical Report JSC-64399; National Aeronautics and Space Administration (NASA): Washington, DC, USA, 2009. [Google Scholar]
- European Space Agency (ESA) Space Debris Office. European Space Agency’s Annual Space Environment Report; European Space Agency (ESA) Space Debris Office: Darmstadt, Germany, 2020. [Google Scholar]
- National Research Council. Limiting Future Collision Risk to Spacecraft: An Assessment of NASA’s Meteoroid and Orbital Debris Programs; The National Academies Press: Washington, DC, USA, 2011. [Google Scholar]
- Astromaterials Research & Exploration Science, Hypervelocity Impact Technology, Shield Development. National Aeronautics and Space Administration (NASA). Available online: https://hvit.jsc.nasa.gov/shield-development/ (accessed on 2 February 2021).
- Ryan, S.; Christiansen, E. Hypervelocity Impact Performance of Open Cell Foam Core Sandwich Panel Structures; Technical Report TM-2015-218593; National Aeronautics and Space Administration (NASA): Washington, DC, USA, 2015. [Google Scholar]
- Cherniaev, A.; Telichev, I. Weight-Efficiency of Conventional Shielding Systems in Protecting Unmanned Spacecraft from Orbital Debris. J. Spacecr. Rocket. 2017, 54, 1–15. [Google Scholar] [CrossRef]
- Christiansen, E.; Kerr, J.; de la Fuente, H.; Schneider, W. Flexible and deployable meteoroid/debris shielding for spacecraft. Int. J. Impact Eng. 1999, 23, 125–136. [Google Scholar] [CrossRef]
- Plassard, F.; Mespoulet, J.; Hereil, P. Hypervelocity impact of aluminium sphere against aluminium plate: Experiment and LS-DYNA correlation. In Proceedings of the 8th European LSDYNA Users Conference, Strasbourg, France, 23–24 May 2011; pp. 142–149. [Google Scholar]
- Zhang, P.; Gong, Z.; Tian, D.; Song, G. Study of the shielding performance of Whipple shield enhanced by impedance-graded materials. Int. J. Impact Eng. 2019, 124, 23–30. [Google Scholar] [CrossRef]
- Carriere, R.; Cherniaev, A. Hypervelocity impacts on satellite sandwich structures—A review of experimental findings and predictive models. Appl. Mech. 2021, 2, 25–45. [Google Scholar] [CrossRef]
- Carriere, R.; Cherniaev, A. Honeycomb parameter-sensitive predictive models for ballistic limit of spacecraft sandwich panels subjected to hypervelocity impact at normal incidence. J. Aerosp. Eng. 2022, 35, 04022039. [Google Scholar] [CrossRef]
- Aslebagh, R.; Cherniaev, A. Projectile shape effects in hypervelocity impact of honeycomb-core sandwich structures. J. Aerosp. Eng. 2022, 35, 04021112. [Google Scholar] [CrossRef]
- Pai, A.; Divakaran, R.; Anand, S.; Shenoy, S.B. Advances in the Whipple shield design and development: A brief review. J. Dyn. Behav. Mater. 2022, 8, 20–38. [Google Scholar] [CrossRef]
- Ryan, S.; Hedman, T.; Christiansen, E. Honeycomb vs. foam: Evaluating potential upgrades to ISS module shielding. Acta Astronaut. 2010, 67, 818–825. [Google Scholar] [CrossRef] [Green Version]
- Lambour, R.; Rajan, N.; Morgan, T.; Kupiec, I.; Stansbery, E. Assessment of orbital debris size estimation from radar cross-section measurements. Adv. Space Res. 2004, 34, 1013–1030. [Google Scholar] [CrossRef]
- Rajan, N.; Morgan, T.; Lambour, R.; Kupiec, I. Orbital debris size estimation from radar cross section measurements. In Proceedings of the 3rd European Conference on Space Debris, Darmstadt, Germany, 19–21 March 2001. [Google Scholar]
- Cowardin, H.M.; Hostetler, J.M.; Murray, J.I.; Reyes, J.A.; Cruz, C.L. Optical characterization of DebriSat fragments in support of orbital debris environmental models. J. Astronaut. Sci. 2021, 68, 1186–1205. [Google Scholar] [CrossRef]
- Wang, X.; Shi, J. Validation of Johnson-Cook plasticity and damage model using impact experiment. Int. J. Impact Eng. 2013, 60, 67–75. [Google Scholar] [CrossRef]
- Venkatesan, J.; Iqbal, M.; Gupta, N.; Bratov, V. Ballistic characteristics of bi-layered armour with various aluminium backing against ogive nose projectile. Procedia Struct. Integr. 2017, 6, 40–47. [Google Scholar] [CrossRef]
- Zhang, Y.; Outeiro, J.; Mabrouki, T. On the selection of Johnson-Cook constitutive model parameters for Ti-6Al-4V using three types of numerical models of orthognal cutting. In Proceedings of the 15th Conference on Modelling of Machining Operations, Karlsruhe, Germany, 11–12 June 2015. [Google Scholar]
- Nor, M.K.M.; Ho, C.S.; Ma’at, N. Modelling shock waves in composite materials using generalised orthotropic pressure. Contin. Mech. Thermodyn. 2020, 32, 1217–1229. [Google Scholar]
- Olleak, A.A.; El-Hofy, H.A. SPH Modelling of cutting forces while turning of Ti6Al4V alloy. In Proceedings of the 10th European LS-DYNA Conference, Wurzburg, Germany, 15–17 June 2015. [Google Scholar]
Figure 1.
Conventional Whipple shield design: (left) Whipple shield configuration, (centre) post-impact debris cloud formation and (right) effects of impact on rear plate (adapted from [5]).
Figure 1.
Conventional Whipple shield design: (left) Whipple shield configuration, (centre) post-impact debris cloud formation and (right) effects of impact on rear plate (adapted from [5]).

Figure 2.
Schematics of alternative Whipple shield designs: (a) Stuffed Whipple and (b) aluminium foam sandwich (adapted from [6]).
Figure 2.
Schematics of alternative Whipple shield designs: (a) Stuffed Whipple and (b) aluminium foam sandwich (adapted from [6]).

Figure 3.
Illustration of the channelling effect on honeycomb core Whipple shields: without honeycomb core (left) and with honeycomb core (right).
Figure 3.
Illustration of the channelling effect on honeycomb core Whipple shields: without honeycomb core (left) and with honeycomb core (right).

Figure 4.
Honeycomb Whipple shield configuration with cell numbering, sequentially from the front towards the back plate.
Figure 4.
Honeycomb Whipple shield configuration with cell numbering, sequentially from the front towards the back plate.

Figure 5.
Simulation set-up showing (a) FE mesh, SPH regions and coordinate system; and (b) boundary conditions.
Figure 5.
Simulation set-up showing (a) FE mesh, SPH regions and coordinate system; and (b) boundary conditions.

Figure 6.
Standard Whipple shield configuration.

Figure 7.
Simulation of standard Whipple shield model shown at: (a) s, (b) s, (c) s, and (d) s.

Figure 8.
Average impact pressure p for varying SPH density and comparison with observations by Zhang et al. [9].
Figure 8.
Average impact pressure p for varying SPH density and comparison with observations by Zhang et al. [9].

Figure 9.
Average impact pressure p at time s and computational run time (CPU) against the SPH particle density, with corresponding trendlines.
Figure 9.
Average impact pressure p at time s and computational run time (CPU) against the SPH particle density, with corresponding trendlines.

Figure 10.
Computational run time (CPU) against finite element mesh element size of the honeycomb core structure.
Figure 10.
Computational run time (CPU) against finite element mesh element size of the honeycomb core structure.

Figure 11.
3-dimensional view of model T-50, with a core cell density of 6 and a shell thickness mm (see Table 2).
Figure 11.
3-dimensional view of model T-50, with a core cell density of 6 and a shell thickness mm (see Table 2).

Figure 12.
Kinetic energy dissipation for the honeycomb core density, shell thickness, material and impact location models, relative to reference cases (see Table 3).
Figure 12.
Kinetic energy dissipation for the honeycomb core density, shell thickness, material and impact location models, relative to reference cases (see Table 3).

Figure 13.
Kinetic energy of the debris particle at s against the number of cells across the width of honeycomb core.
Figure 13.
Kinetic energy of the debris particle at s against the number of cells across the width of honeycomb core.

Figure 14.
Simulation progress at s for an increasing number of cells across the width of honeycomb core for model C-0 (top left) to model C-10 (bottom right).
Figure 14.
Simulation progress at s for an increasing number of cells across the width of honeycomb core for model C-0 (top left) to model C-10 (bottom right).

Figure 15.
Kinetic energy of the debris particle at s against thickness of the honeycomb shell.

Figure 16.
Simulation progress at s for an increasing thickness of honeycomb core from top left (model T-01) to bottom right (model T-50).
Figure 16.
Simulation progress at s for an increasing thickness of honeycomb core from top left (model T-01) to bottom right (model T-50).

Figure 17.
Kinetic energy comparison using Al2024-T3 and Ti-6Al-4V honeycombs.

Figure 18.
Numerical simulation comparing honeycomb shell materials: Al2024-T3 (model M-AL, left) and Ti-6Al-4V (model M-TI, right).
Figure 18.
Numerical simulation comparing honeycomb shell materials: Al2024-T3 (model M-AL, left) and Ti-6Al-4V (model M-TI, right).

Figure 19.
Location of impact on Whipple shield relative to honeycomb.

Figure 20.
Kinetic energy of debris particle against time for varying debris impact locations.

Figure 21.
Comparison between varying points of impact: single edge (model L-SE, left), mid-point (model L-MP, centre) and double point (model L-DP, right).
Figure 21.
Comparison between varying points of impact: single edge (model L-SE, left), mid-point (model L-MP, centre) and double point (model L-DP, right).


Table 1.
Johnson–Cook constitutive and damage models, and Mie–Grüneisen equation of state parameters for AL2024-T3 (debris particle, shield and honeycomb core) and Ti-6Al-4V (honeycomb core) [21,22].
| Constitutive Equation | Material Parameter | AL2024-T3 | Ti-6Al-4V |
|---|---|---|---|
| Johnson–Cook | A (MPa) | 167 | 862 |
| B (MPa) | 684 | 331 | |
| n | 0.551 | 0.34 | |
| C | 0.001 | 0.012 | |
| m | 0.859 | 0.8 | |
| Johnson–Cook (damage) | 0.112 | −0.09 | |
| 0.123 | 0.25 | ||
| 1.5 | −0.5 | ||
| 0.007 | 0.014 | ||
| 0 | 3.87 | ||
| Mie–Grüneisen (EoS) | G | 5240 | 5130 |
| 1.97 | 1.23 | ||
| 1.400 | 1.028 | ||
| a | 0.48 | 0.17 |
Table 2.
Characteristics and labels of the developed Whipple shield numerical models.
| Test | Model Label | Material | Cells | Thickness (mm) | Impact Location |
|---|---|---|---|---|---|
| Standard shield | C-0 | – | 0 | – | – |
| Cell density | C-2 | AL2024-T3 | 2 | 0.5 | Single edge |
| C-4 | 4 | 0.5 | |||
| C-6 | 6 | 0.5 | |||
| C-8 | 8 | 0.5 | |||
| C-10 | 10 | 0.5 | |||
| Shell thickness | T-01 | AL2024-T3 | 6 | 0.01 | Single edge |
| T-05 | 6 | 0.05 | |||
| T-10 | 6 | 0.1 | |||
| T-15 | 6 | 0.15 | |||
| T-20 | 6 | 0.2 | |||
| T-30 | 6 | 0.3 | |||
| T-50 | 6 | 0.5 | |||
| Material | M-AL | AL2024-T3 | 6 | 0.3 | Single edge |
| M-TI | Ti-6Al-4V | 6 | 0.3 | ||
| Impact location | L-SE | AL2024-T3 | 6 | 0.3 | Single edge |
| L-MP | 6 | 0.3 | Mid point | ||
| L-DP | 6 | 0.3 | Double point |
Table 3.
Summary of main results and dissipation of kinetic energy for all numerical simulations.
| Model Label | Kinetic Energy (kNmm) | Time Stamp t (s) | Energy Dissipation |
|---|---|---|---|
| C-0 | 575 | 20 | Reference @ s |
| C-2 | 330 | ||
| C-4 | 202 | ||
| C-6 | 164 | 20 | |
| C-8 | 162 | ||
| C-10 | 146 | ||
| T-0 | 1286 | Reference @ s | |
| T-01 | 1285 | ||
| T-05 | 1230 | ||
| T-10 | 1040 | ||
| T-15 | 773 | ||
| T-20 | 432 | ||
| T-30 | 280 | ||
| T-50 | 172 | ||
| M-AL | 244 | 20 | |
| M-TI | 177 | ||
| L-DP | 255 | ||
| L-SE | 244 | 20 | |
| L-MP | 225 |
Publisher’s Note: MDPI stays neutral with regard to jurisdictional claims in published maps and institutional affiliations. |
© 2022 by the authors. Licensee MDPI, Basel, Switzerland. This article is an open access article distributed under the terms and conditions of the Creative Commons Attribution (CC BY) license (https://creativecommons.org/licenses/by/4.0/).
Share and Cite
MDPI and ACS Style
Fowler, K.; Teixeira-Dias, F. Hybrid Shielding for Hypervelocity Impact of Orbital Debris on Unmanned Spacecraft. Appl. Sci. 2022, 12, 7071. https://doi.org/10.3390/app12147071
AMA Style
Fowler K, Teixeira-Dias F. Hybrid Shielding for Hypervelocity Impact of Orbital Debris on Unmanned Spacecraft. Applied Sciences. 2022; 12(14):7071. https://doi.org/10.3390/app12147071
Chicago/Turabian StyleFowler, Kayleigh, and Filipe Teixeira-Dias. 2022. "Hybrid Shielding for Hypervelocity Impact of Orbital Debris on Unmanned Spacecraft" Applied Sciences 12, no. 14: 7071. https://doi.org/10.3390/app12147071
Note that from the first issue of 2016, this journal uses article numbers instead of page numbers. See further details here.