
Numerical Application of a Proposed Material Constant Estimation Method Based on Ideal Mixing Theory
by
 ,
,
Hyeong-Joo Kim
1 ,
,
Tae-Gew Ham
2,*,
Peter Rey Dinoy
2,3,
James Vincent Reyes
3 and
Hyeong-Soo Kim
3 1
Department of Civil Engineering, Kunsan National University, Gunsan 54150, Korea
2
Renewable Energy Research Institute, Kunsan National University, Gunsan 54150, Korea
3
Department of Civil and Environmental Engineering, Kunsan National University, Gunsan 54150, Korea
*
Author to whom correspondence should be addressed.
Appl. Sci. 2022, 12(13), 6528; https://doi.org/10.3390/app12136528
Submission received: 3 June 2022
/
Revised: 20 June 2022
/
Accepted: 23 June 2022
/
Published: 28 June 2022
(This article belongs to the Section Civil Engineering)
Abstract
:In large projects such as dams, embankments, and seawalls, it is sometimes important to determine the compressive properties of a mixture containing soil and gravel with particle sizes exceeding 75 mm. The Saemangeum Renewable Energy Vision Proclamation Ceremony, held in October 2018 in Korea, confirmed and promulgated the plan to build a total of 4.0 GW of renewable energy power generation complex in the Saemangeum area. The project will be carried out on an area of 31.95 km2, and a 1.0 GW offshore wind power development plan is in progress. Since most of the Saemangeum area has a soft ground layer that has been reclaimed, a key research institute is absolutely necessary to lead in the stabilization of the supporting structures for power generation facilities and to achieve the renewable energy 3020 policy in extreme environments. Hence, it is meaningful to investigate the effect of gravel content (P) on the ground strength characteristics. However, such investigation cannot be routinely performed due to the limited size of the equipment available. Several equations have been proposed in the literature to modify the compaction properties of gravel-mixed soils containing coarse aggregates. Among these is the proposed equation by Walker and Holtz, which has widely been used. However, the use of this equation in the case of high gravel content is not appropriate because the physical meaning of this equation is not clear and does not apply to materials with gravel content exceeding 40%. Therefore, a better quantitative evaluation method in determining material characteristics according to gravel content must be established through laboratory tests on samples of acceptable particle size for the experimental equipment. To obtain the compressive properties of decomposed granite soil (D-G-S), in this study, the results from large-scale one-dimensional compression tests on samples compacted at various gravel concentrations, constant compaction energy, and constant water content were analyzed. To quantitatively evaluate the properties of D-G-S according to the gravel content, a modified formula based on the two-phase mixing theory was utilized. It was shown that the degree of mixing between the gravel and sand for the conditions of D-G-S used in the experiments was high, at 0.85. To estimate the compression curves of D-G-S at various gravel content, the compression curves of purely sand (P = 0%) and purely gravel (P = 100%) materials, and the value of Rm = 0.85 were utilized, and it was shown that the compression index and swelling index curves estimated using the method presented in this study were in good agreement with the experimental results. To confirm the engineering applicability of the presented method, finite element analysis was performed, and as a result, it was revealed that it can be sufficiently applied in the simulation of embankment settlement. In order to obtain more reliable results in the future, verification using various samples is required.
Keywords:
compression; density; gravel; gravel content; compacted soil; granular material; gravel–sand mixture1. Introduction
Gravel–soil mixture is an important medium of concern in the field of geotechnical engineering [1], and several studies in the literature have been conducted to clarify the engineering characteristics of gravel materials including investigations on the effect of gravel content on precompression stress [2,3,4,5,6,7,8,9,10,11,12,13]. However, the mechanical properties and deformation mechanism of gravelly soils are complex because of inhomogeneity, high porosity, and under-compaction [14]. As a result, some findings from previous studies have shown contradicting results. For example, a study by Horn and Fleige (2003) [2] revealed that precompression stress increases as gravel content increases; however, Kaufmann et al. (2009) [3] described a contradicting effect with an increase in gravel content in multiple regressions. In the past, investigations on gravel–soil mixtures with grain sizes exceeding 75 mm could not be routinely performed, due to size limitations of equipment [12,15]. For this reason, previously studied calibration values for mixtures not exceeding 2 mm were utilized to obtain the initial density and material parameters for larger-sized gravel–soil mixtures. Walker and Holtz (1951) [16], Humphres (1957) [17], and Hsu and Saxena (1991) [18] are among those that proposed equations for modifying the compaction properties of mixed soils containing coarse aggregates. For use in dealing with the stability of earth and rock structures, Schwab (1993) [19] summarized other equations available. Among the many correction equations, the one proposed by Walker and Holtz is widely used in Japan. However, since the physical meaning of this equation is not clear and does not apply to materials with gravel content exceeding 40%, the use of this equation is not appropriate in the case of mixtures with high gravel content. In 2010, Ham et al. [20] were able to perform large-scale one-dimensional (1D) compression tests on gravel–soil mixtures with particles larger than 2 mm. From the results of the experiments, they were able to propose an expression that applies to mixtures with gravel content exceeding 40% to quantitatively evaluate the influence of gravel content through a material parameter.
In analyzing large-scale embankment projects, the utilization of an appropriate method in interpreting the behavior of soil–gravel mixtures through quantitative evaluation of compression tests is necessary. However, the application of such methods in numerical analysis is equally as important, and there are only a limited number of studies in the literature related to the simulation of embankments composed of gravel–sand mixtures. In order to evaluate the performance of embankments through numerical analysis, parameters that are representative of the behavior of embankment materials must be utilized. The behavioral characteristics greatly depend on the material constants such as compression index (λ) and swelling index (κ), which may be influenced by the interaction between the two materials. In this study, the results of large-scale one-dimensional compaction tests on mixed decomposed granite soil (D-G-S) are analyzed, and a material constant estimation method based on the ideal mixing theory is presented to quantitatively evaluate the effect of the gravel content on the compression properties of the gravel mixture. Numerical simulations using the properties of D-G-S obtained from experiments are then performed to confirm the applicability of the method used in this study.
2. Theoretical Background
2.1. Relationship between Void Ratio and Dry Density in Gravel–Sand Mixtures
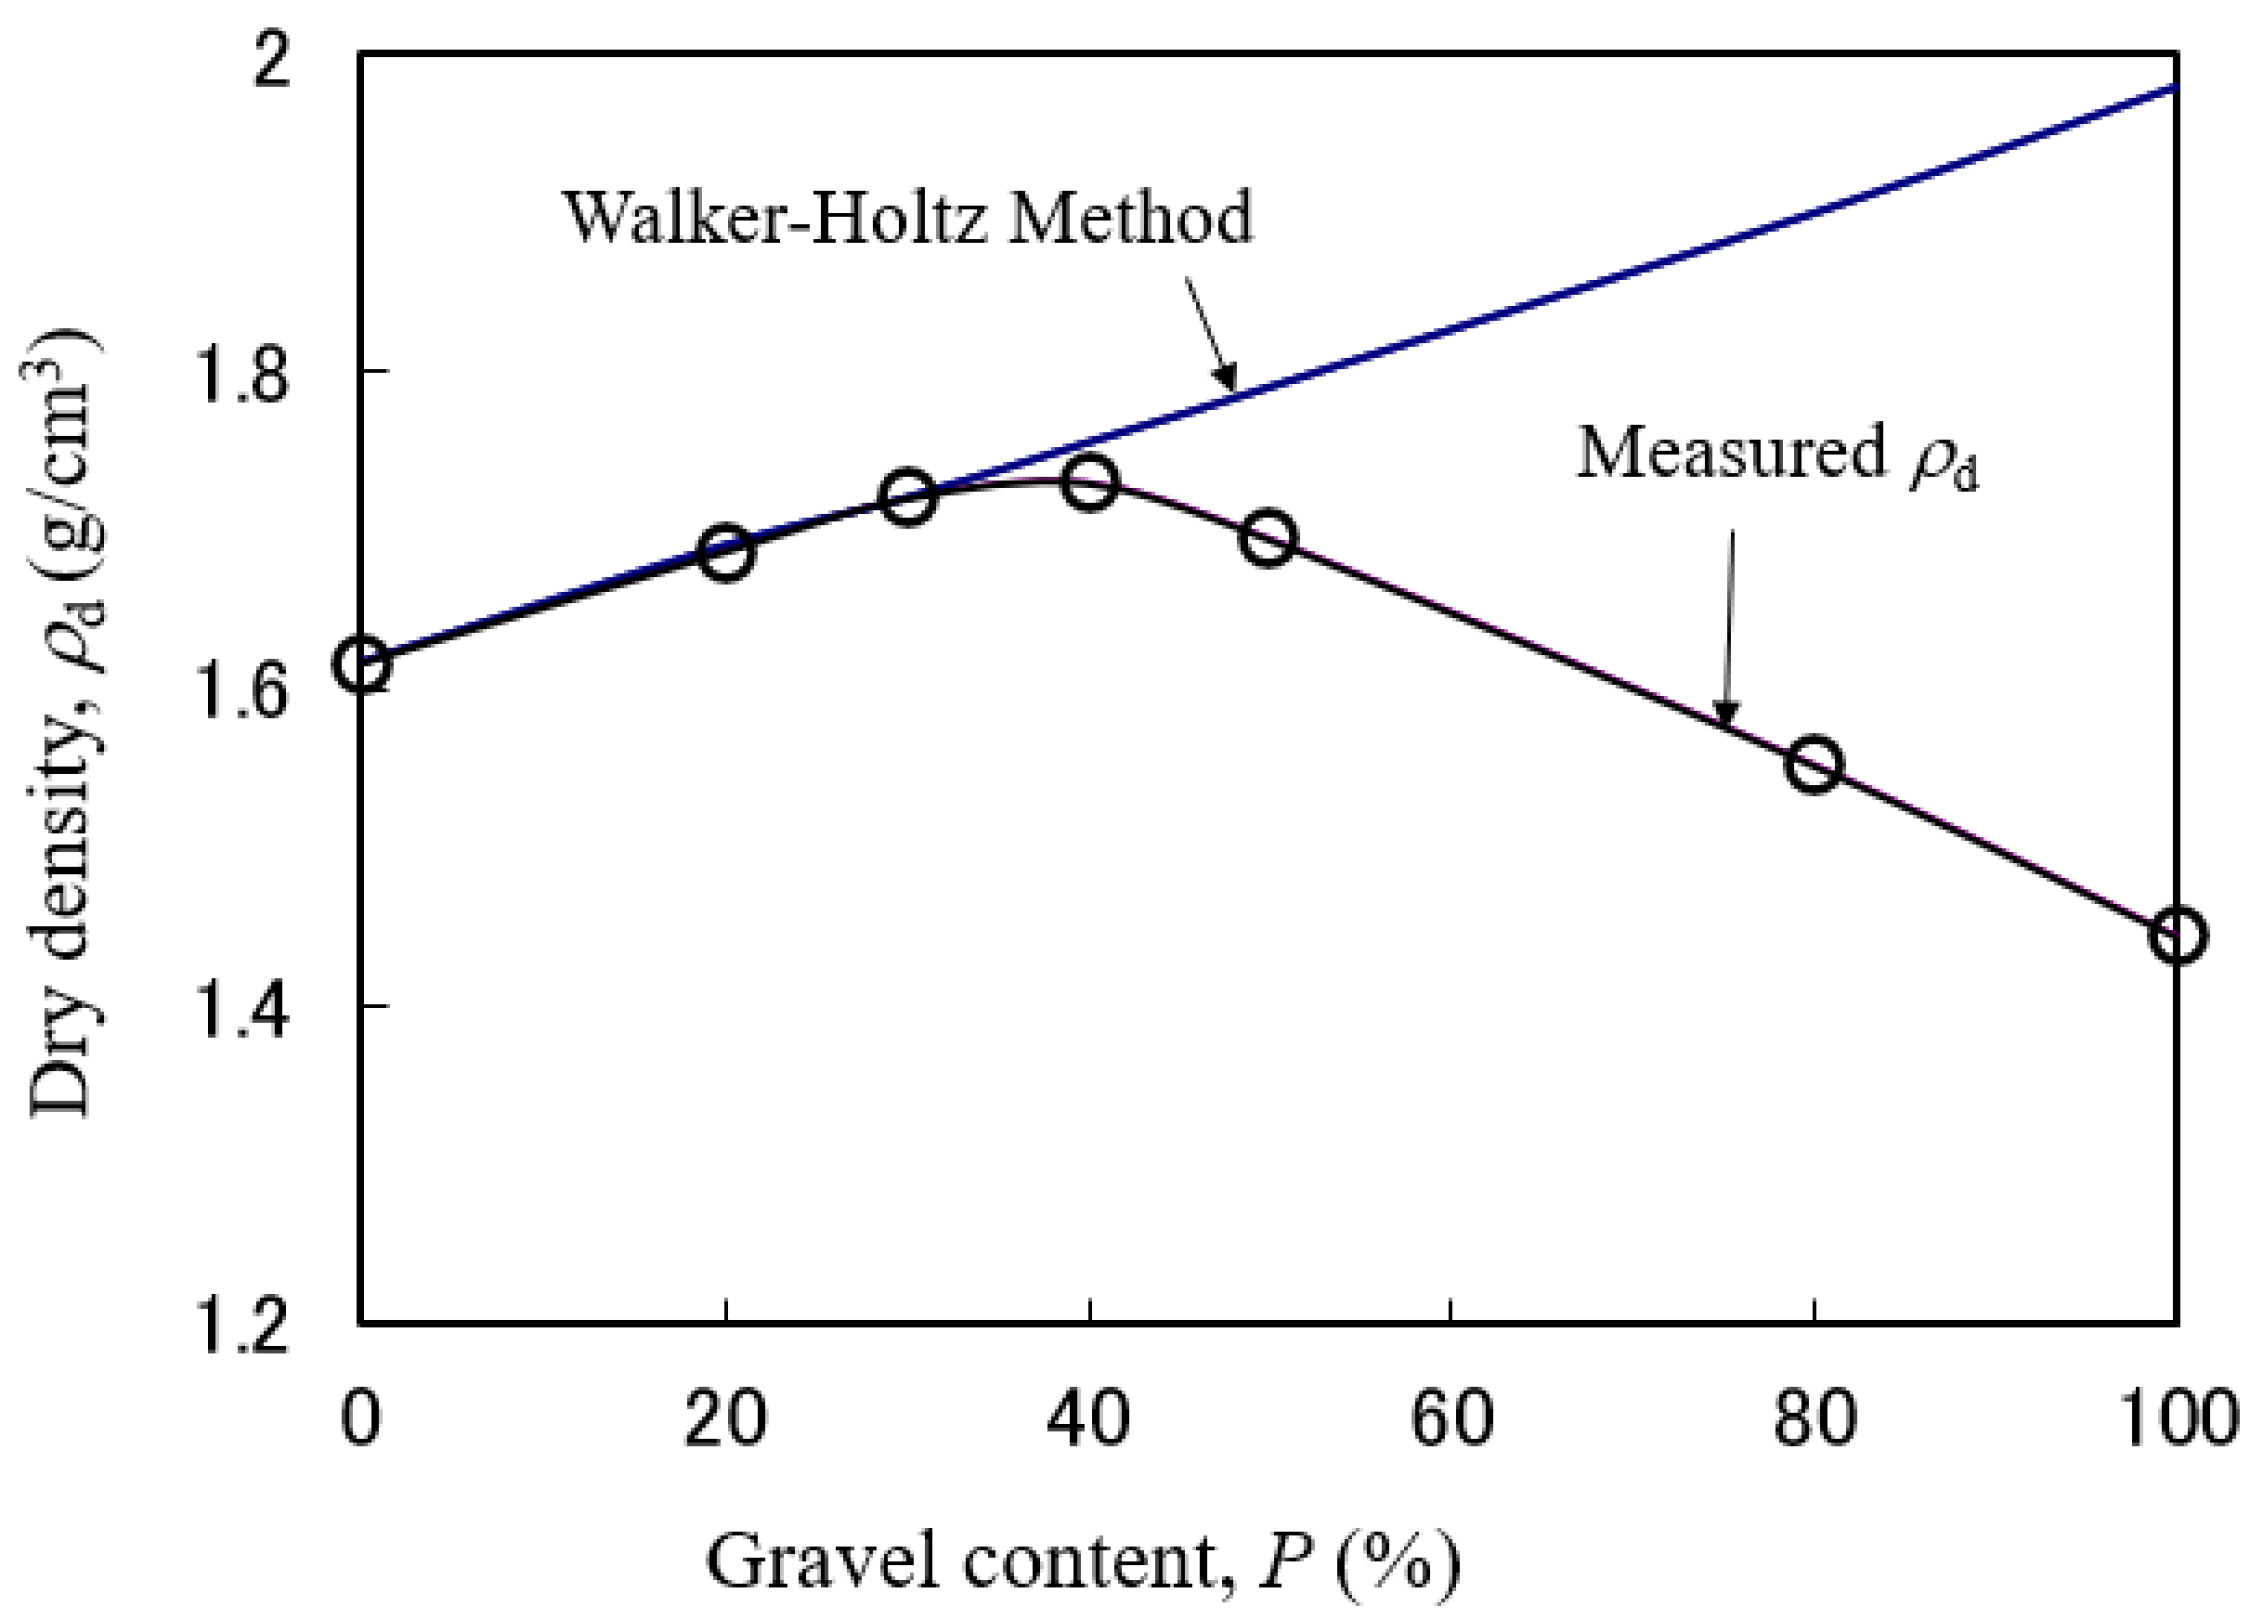
Ham et al. (2010) [20] conducted large-scale, one-dimensional compression tests on gravel-mixed decomposed granite soils (D-G-S) in an effort to analyze the influence of gravel on its compression characteristics. Before the application of compressive vertical loading of up to 10 MPa, the specimens with water content set at an optimum moisture content of 13% were compacted in a mold in 3 layers, with each layer given 21 blows of a 2.5 kg rammer falling through a height of 30 cm, resulting in constant compaction energy of Ec = 187.469 kJ/m3. The optimum moisture content of 13% was obtained from the results of compaction tests on the soil components of the D-G-S, and the dry density of the mixture was obtained by taking the quotient between the wet density and the water content plus unity. Based on the results of compaction, they presented the limitation of the equation proposed by Walker and Holtz (1951) [16] by comparing the predicted and measured relationship between gravel content and dry density, as shown in Figure 1. It was found that, for D-G-S, its initial dry density increased as the gravel content (P) increased up to a gravel content of 40% and decreased significantly at gravel contents (P) greater than 40%. This behavior is in disagreement with the values predicted by the Walker and Holtz (1951) [16] equation, which assumes that an increase in the density of sand due to compaction increases the overall dry density of mixed material, and sand fills up the voids between gravels. In reality, the overall dry density reduces when the gravel content increases because there is less amount of sand that can fill up the voids between gravels, causing the overall void ratio to increase.
Ham et al. (2010) [20] employed the two-phase mixture theory suggested by Gutierrez (2005) [21] in an effort to study the influence of gravel content on initial dry density and compression index of D-G-S. In this theory, the overall void ratio e(P) of the mixed material is a function of the gravel content (P) by mass and is related to the void ratio of sand (es) and void ratio of gravel (eg), as shown in Equation (1).
where
In Equation (2), ms1 is the dry mass of sand only, and ms2 is the dry mass of gravel only.
Mixing sand with gravel during compaction would result in a change in the actual gravel void ratio. In that case, eg in Equation (1) is replaced with the effective void ratio of gravel (eg′), and the overall void ratio of the gravel–sand mixture e(P) is calculated as
where
In Equation (4), the parameter Rm indicates the degree of mixing between sand and gravel. If the sand and gravel are not mixed at all, Rm = 0, but when they are mixed completely, Rm = 1. When sand and gravel are partially mixed, 0 ≤ Rm ≤ 1.
Substituting Equation (4) into Equation (3), the overall void ratio of the gravel–sand mixture e(P) can also be expressed as
The specific gravity of the mixture Ge(P) is obtained by considering the ratio of the dry mass between sand and gravel, as shown in Equation (6), wherein Gs and Gg are the specific gravities of sand and gravel, respectively. To obtain the dry density of the mixture ρd(P), Equation (7) is used. Substituting Equations (5) and (6) into Equation (7), ρd(P) can be calculated using Equation (8), considering the effect of the change in actual gravel void ratio or degree of mixing between sand and gravel.
2.2. Determination of Rm and Compression Characteristics of D-G-S in Large-Scale One-Dimensional Compression Test
2.2.1. Test Materials and Setup
Ham et al. (2010) [20] conducted experiments on gravel-mixed D-G-S samples obtained from Shimonoseki City, Japan, using a large-scale, one-dimensional compression tester. The maximum grain size of the samples used in their test was 9.52 mm. Gravel was determined as particles larger than 2 mm, as per Japanese standards, and was separated from the rest of the soil. The specific gravity of gravel (Gg) and specific gravity of sand (Gs) of the materials are 2.650 and 2.685, respectively. The density of sand is believed to be larger than gravel due to natural cracks within D-G-S, which are more noticeable as the particle size is enlarged [8,9,22].
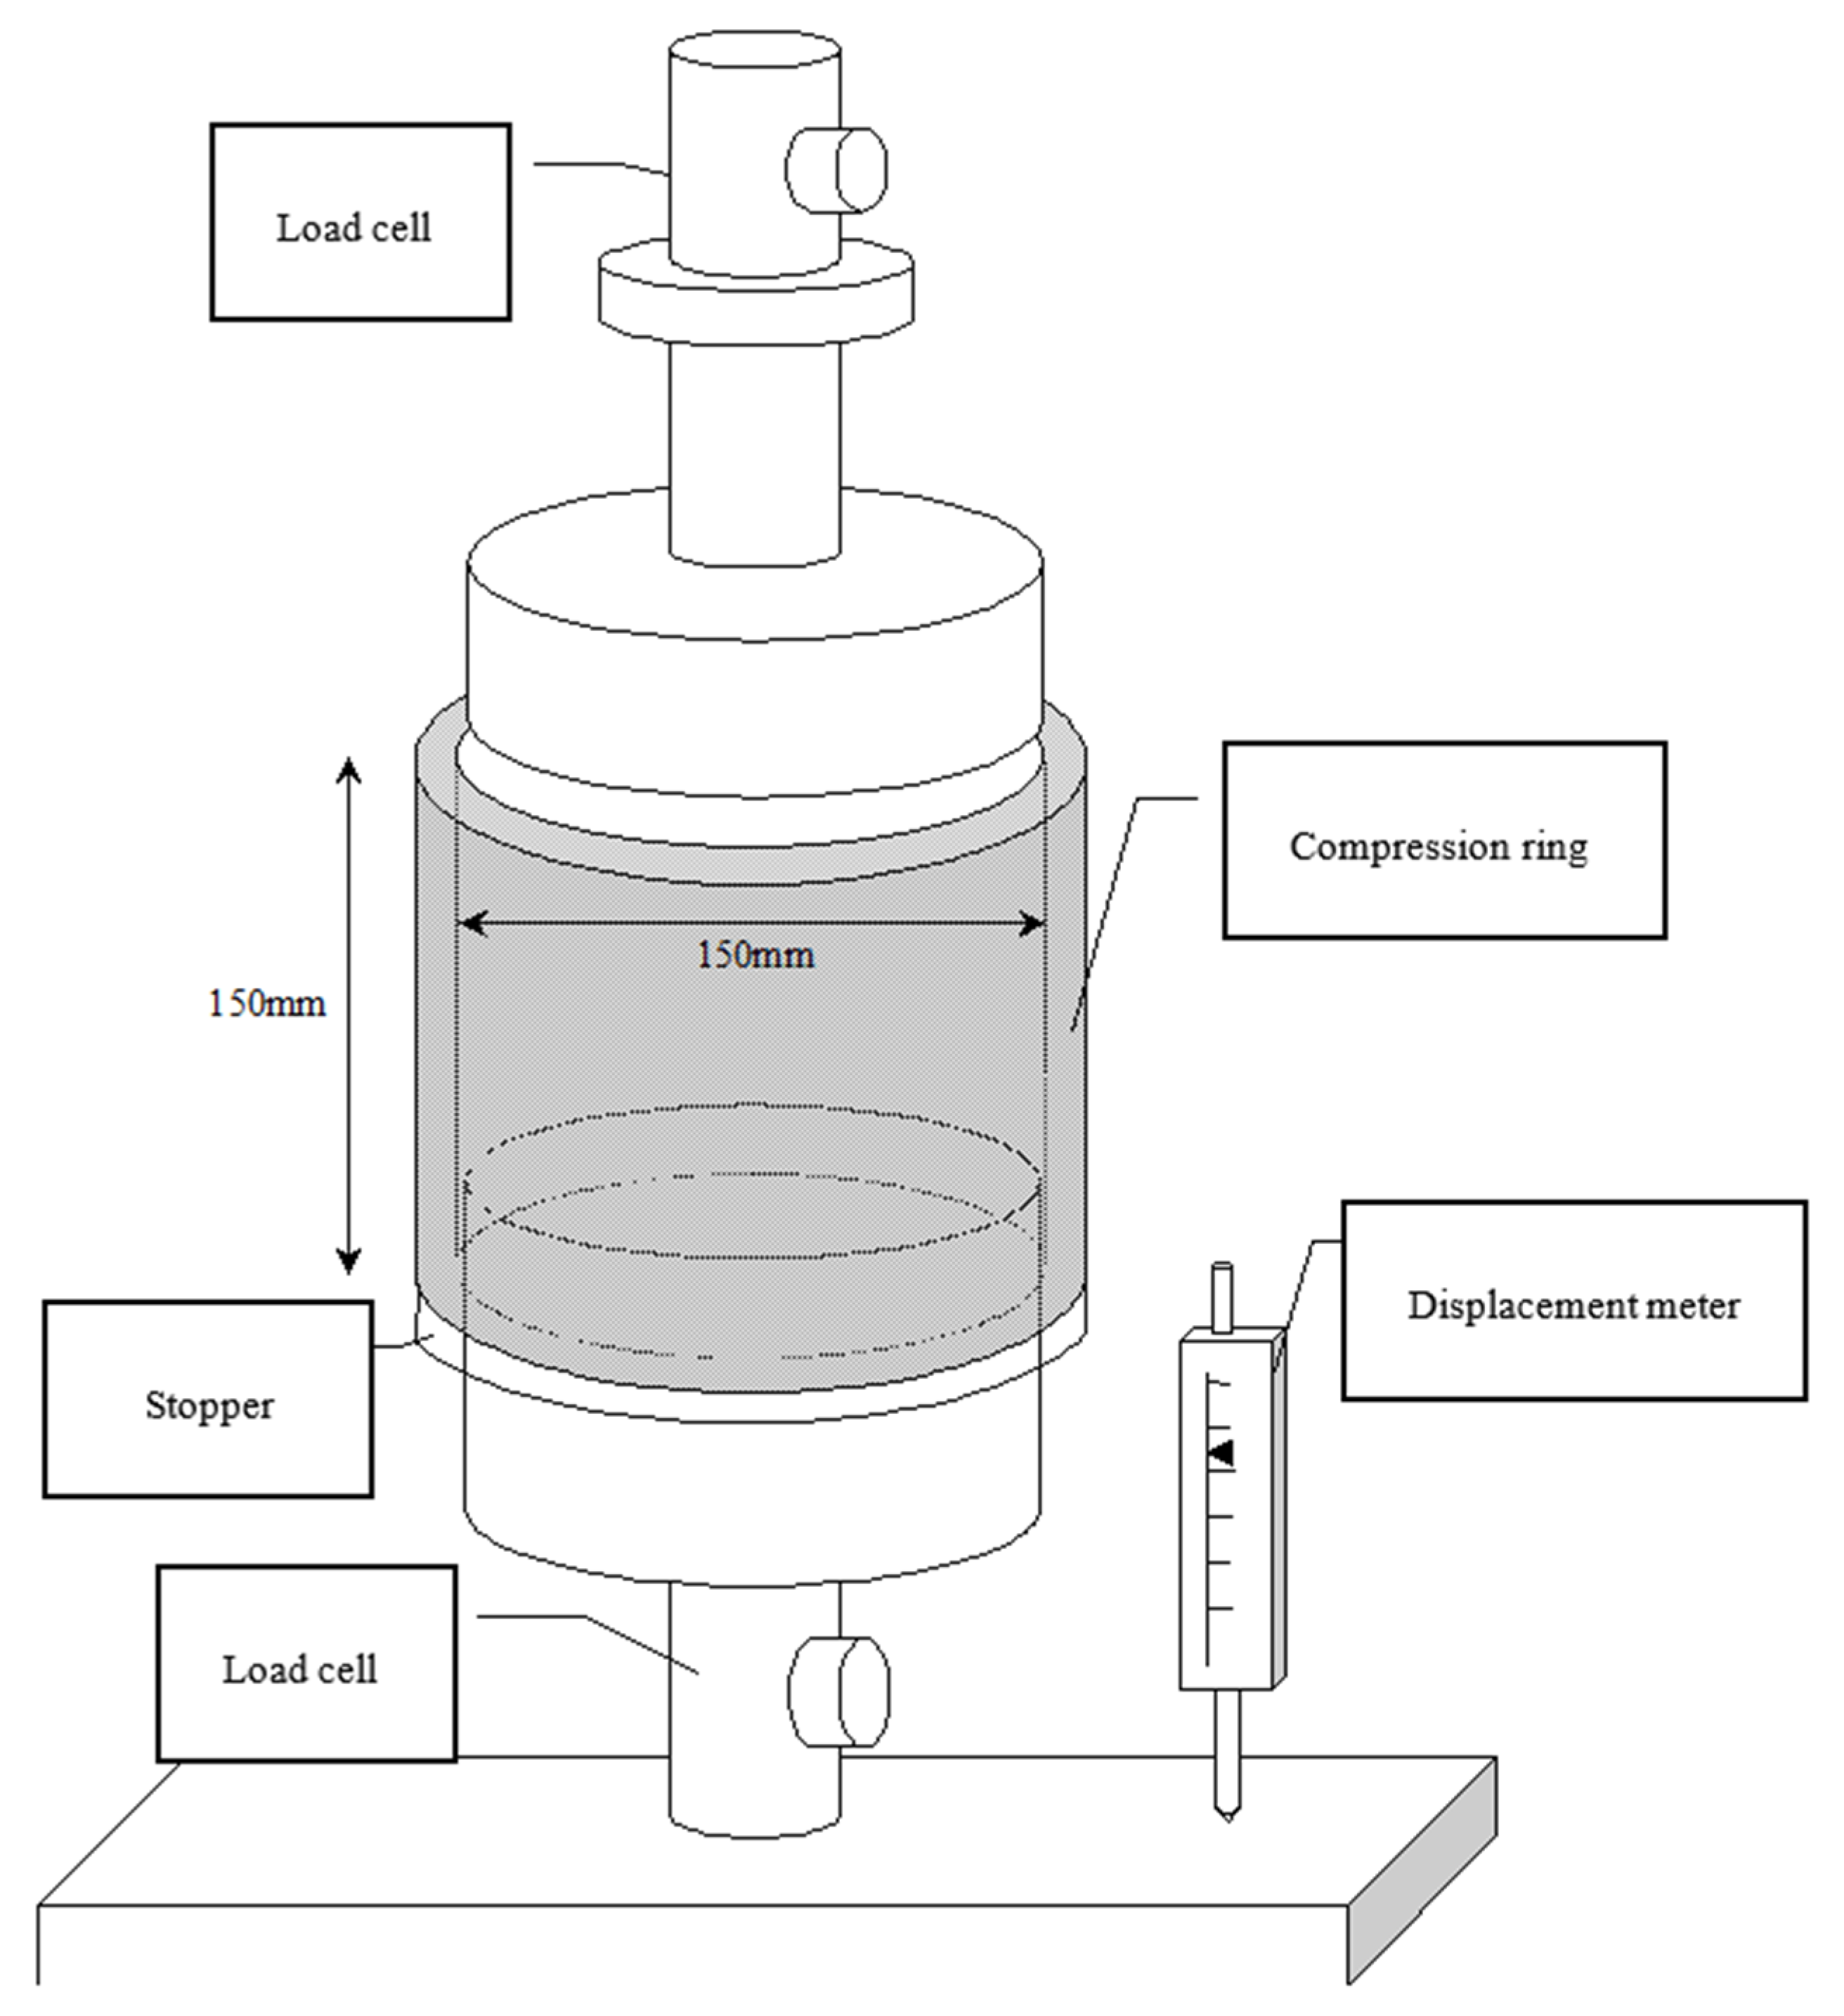
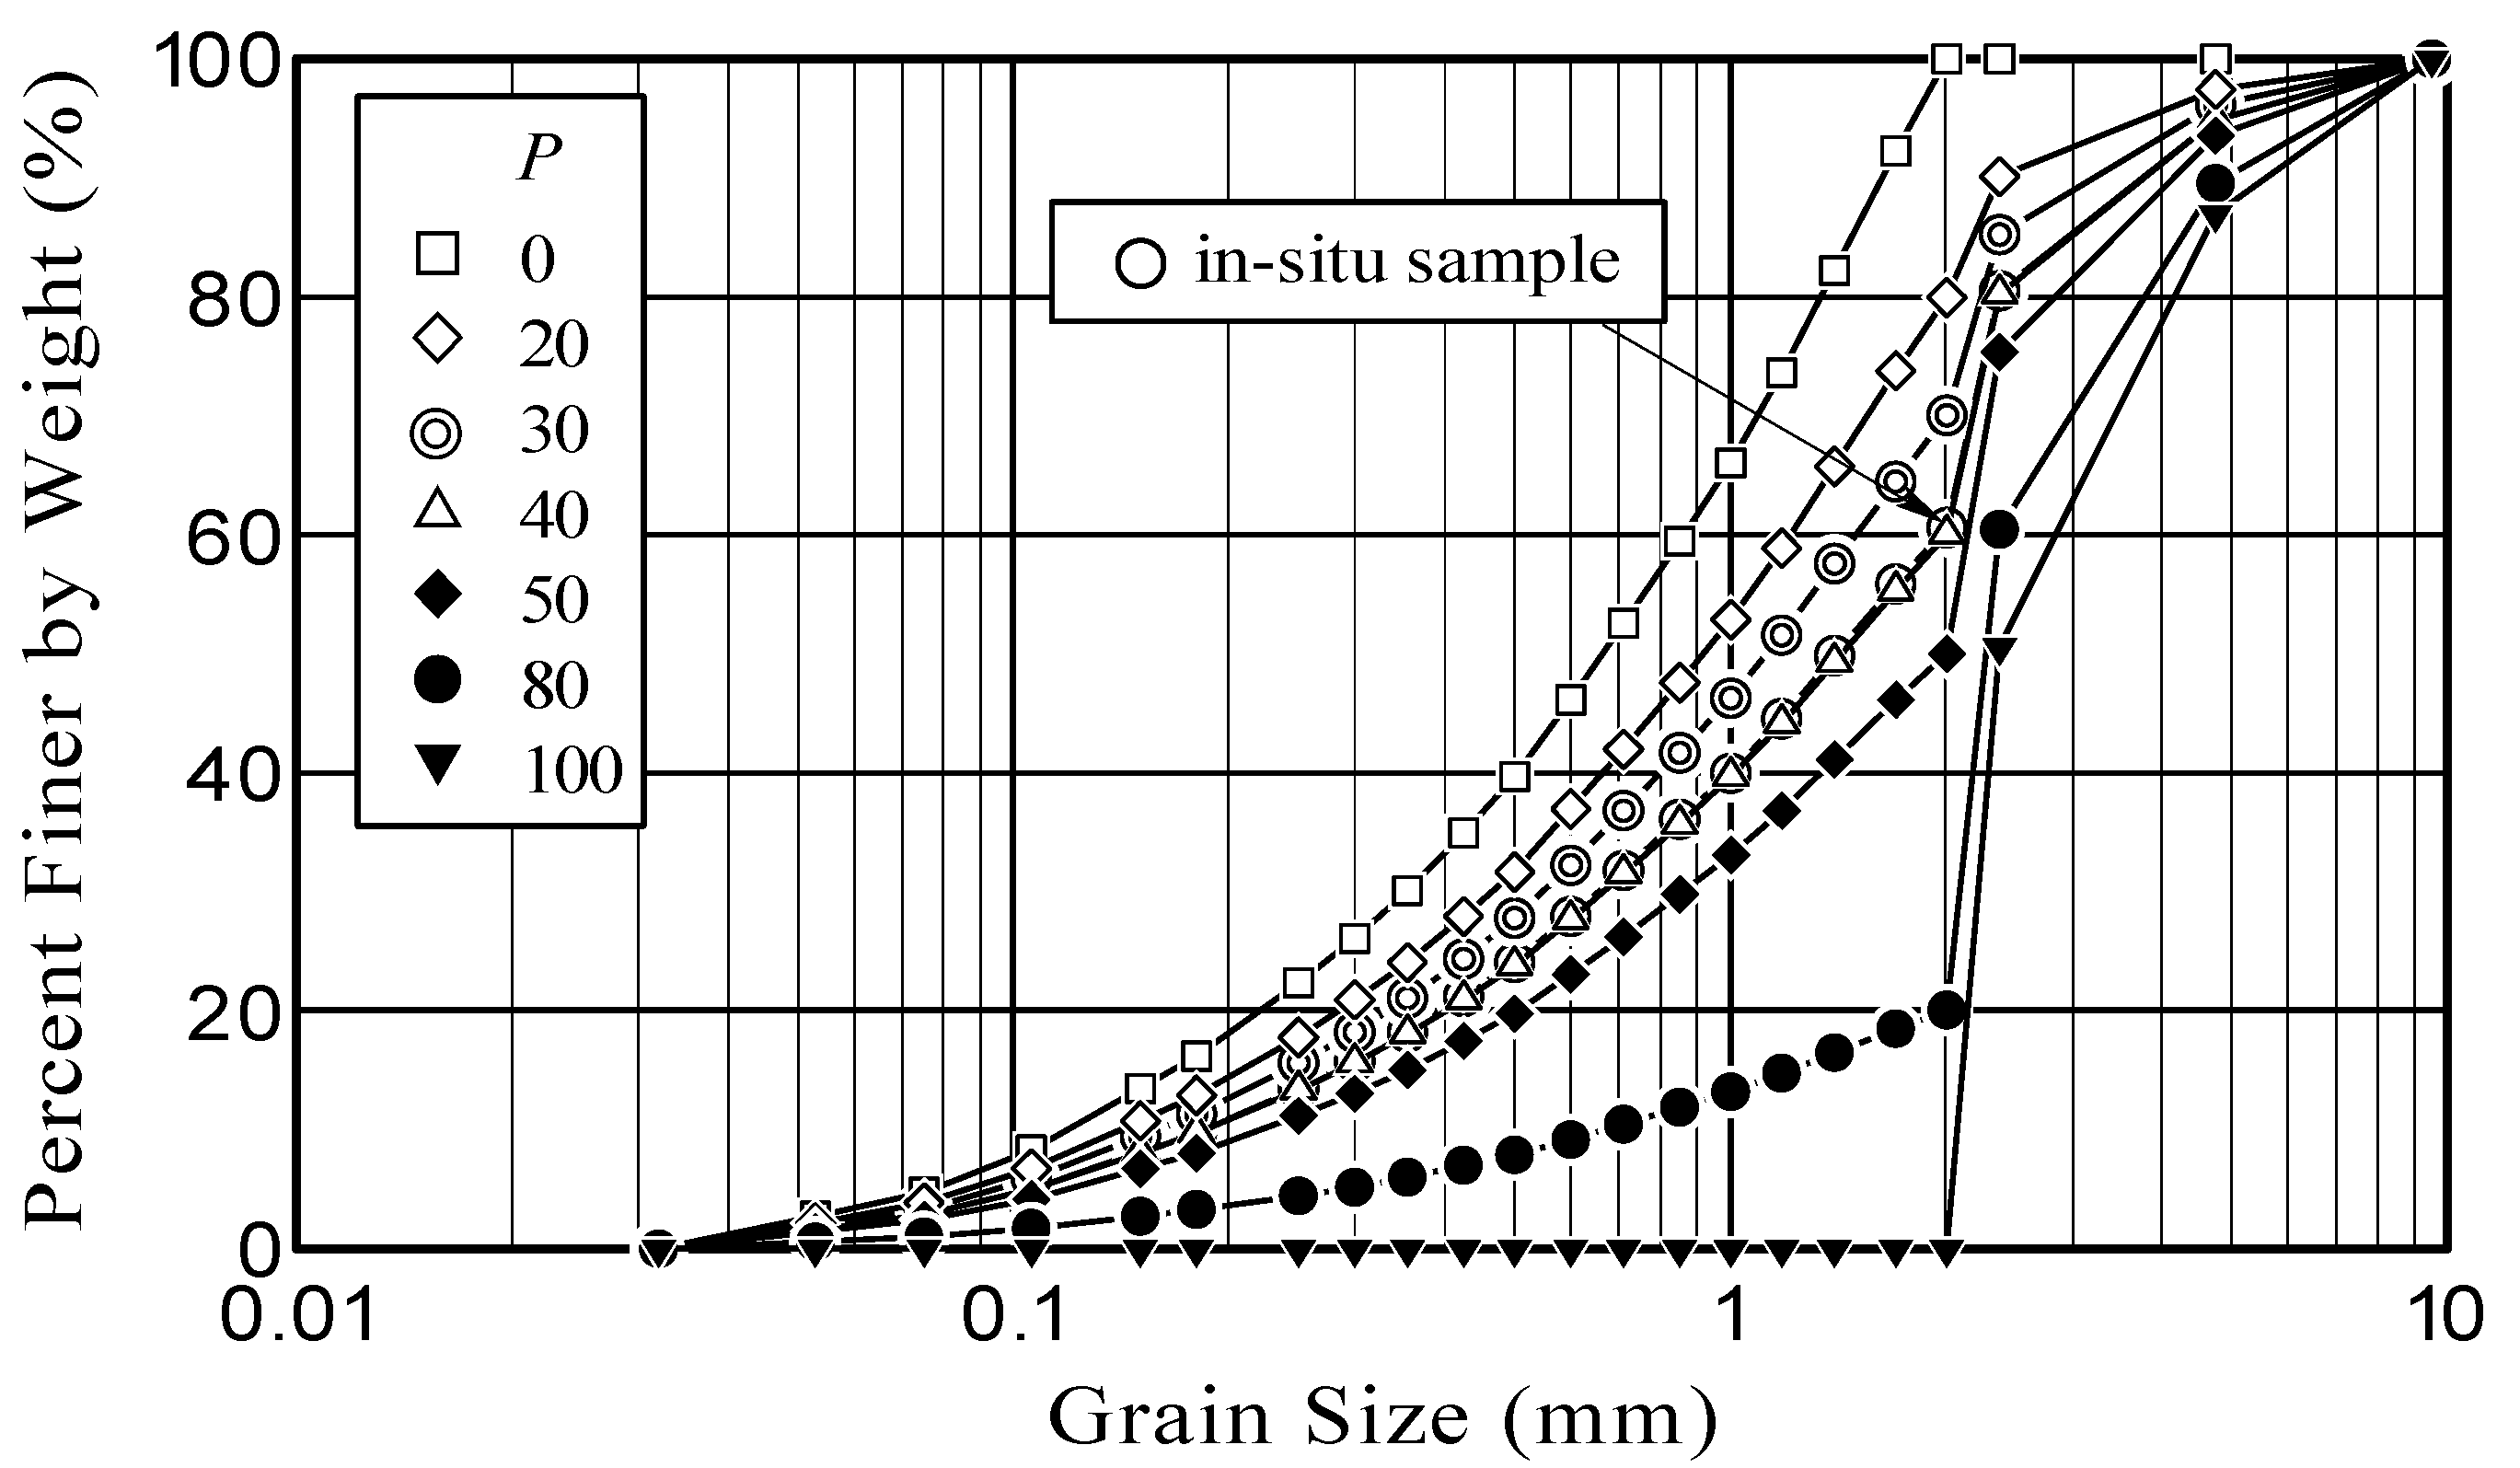
The test setup is shown in Figure 2. A cylindrical mold with a diameter of 150 mm and a height of 150 mm was used. Sand and gravel were mixed at gravel contents of 0, 20, 30, 40, 50, 80, and 100%. The samples were generally well-graded, especially at low levels of water content. The grain-size distribution curve based on the Japanese Geotechnical Society (2000) [23] and the properties of the samples are shown in Figure 3 and Table 1, respectively, which shows that the specimens are generally well-graded, especially at low levels of gravel content. The test specimens were compacted in the mold in 3 layers, with the water content set at 13%, in which 21 blows were performed for each layer using a 2.5 kg rammer falling from a height of 30 cm. Compression tests were then conducted by slowly increasing the vertical load at a rate of 0.5 mm/min up to a maximum compressive stress of 10 MPa.
2.2.2. Determination of Rm
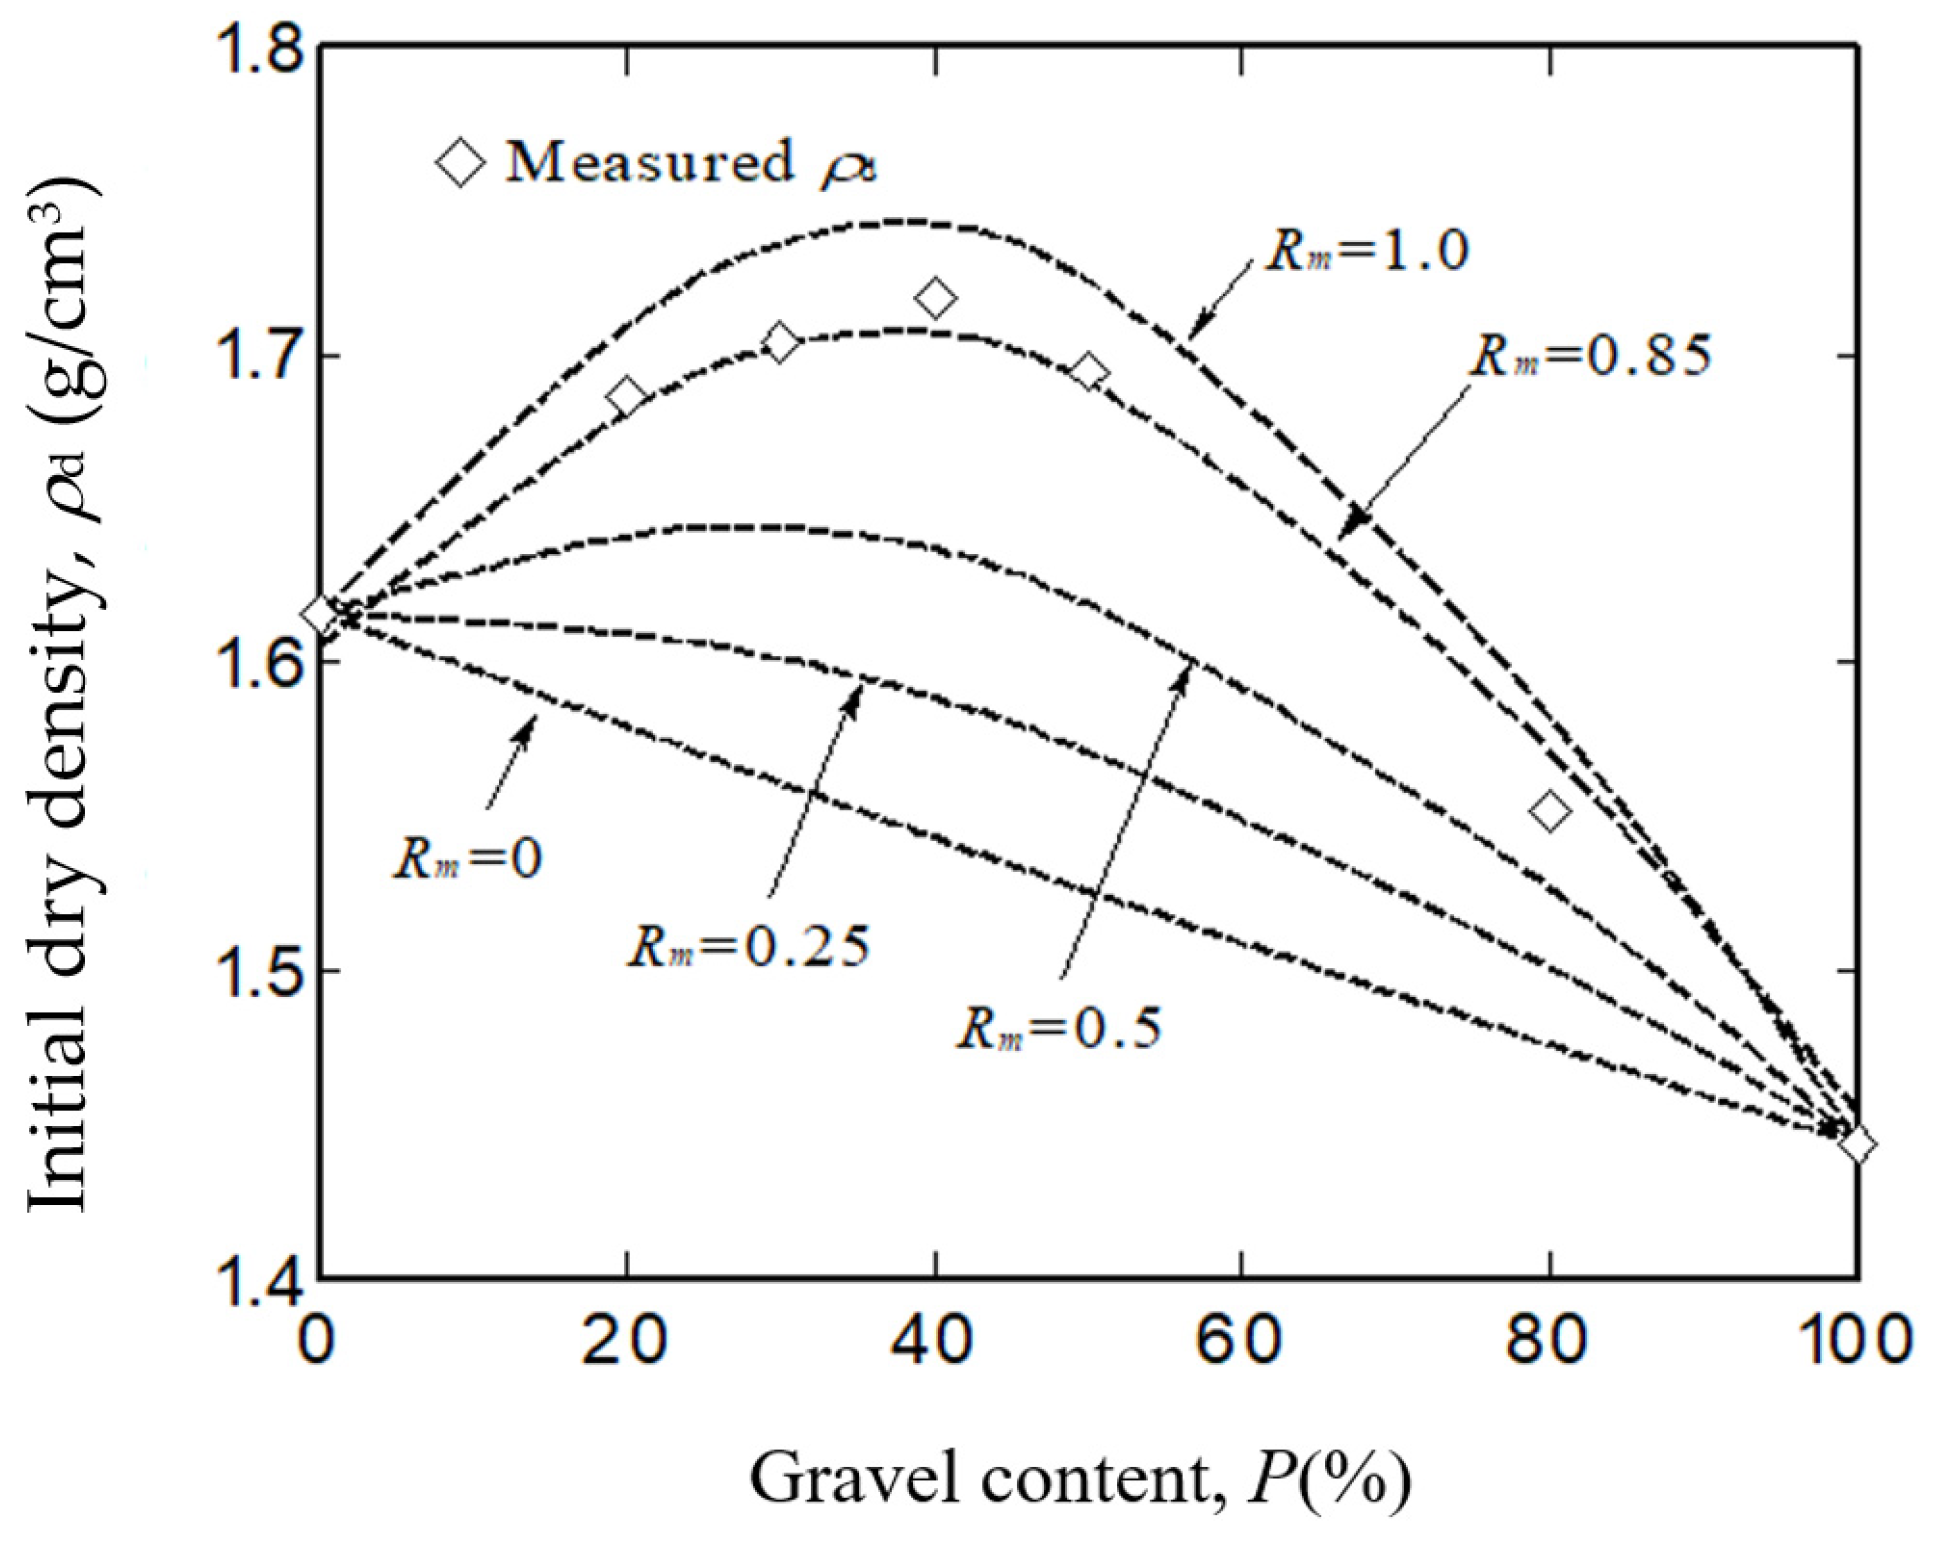
There is currently no well-defined procedure to establish the value of the mixing parameter Rm other than curve-fitting results from experiments. A procedure in relating Rm to other determined properties of the component of the mixtures such as shape, size, and distribution of the grains is not discussed in this study. Curve fitting is a trial-and-error process, which requires changing the value of a single parameter or multiple parameters to be able to obtain results that are representative of the measured data. In this study, the initial dry densities with gravel content were predicted by adjusting the value of Rm from 0 to 1.0 in steps of 0.25. It was found that the measured initial dry density lay between the predicted dry density using values of Rm 1.0 and 0.75. Rm was then adjusted, and it was found that values close to 0.85 resulted in better agreement with the measured data. A summary of the results obtained via compaction of the specimens is listed in Table 2, and the curves for values of Rm = 0, 0.25, 0.5, 0.85, and 1.0 are shown in Figure 4. Results show that the value of Rm = 0.85 agreed well with the experimental results, indicating a high degree of mixing between the gravel and sand for the conditions of D-G-S used in the experiment.
2.2.3. Compression Characteristics of D-G-S
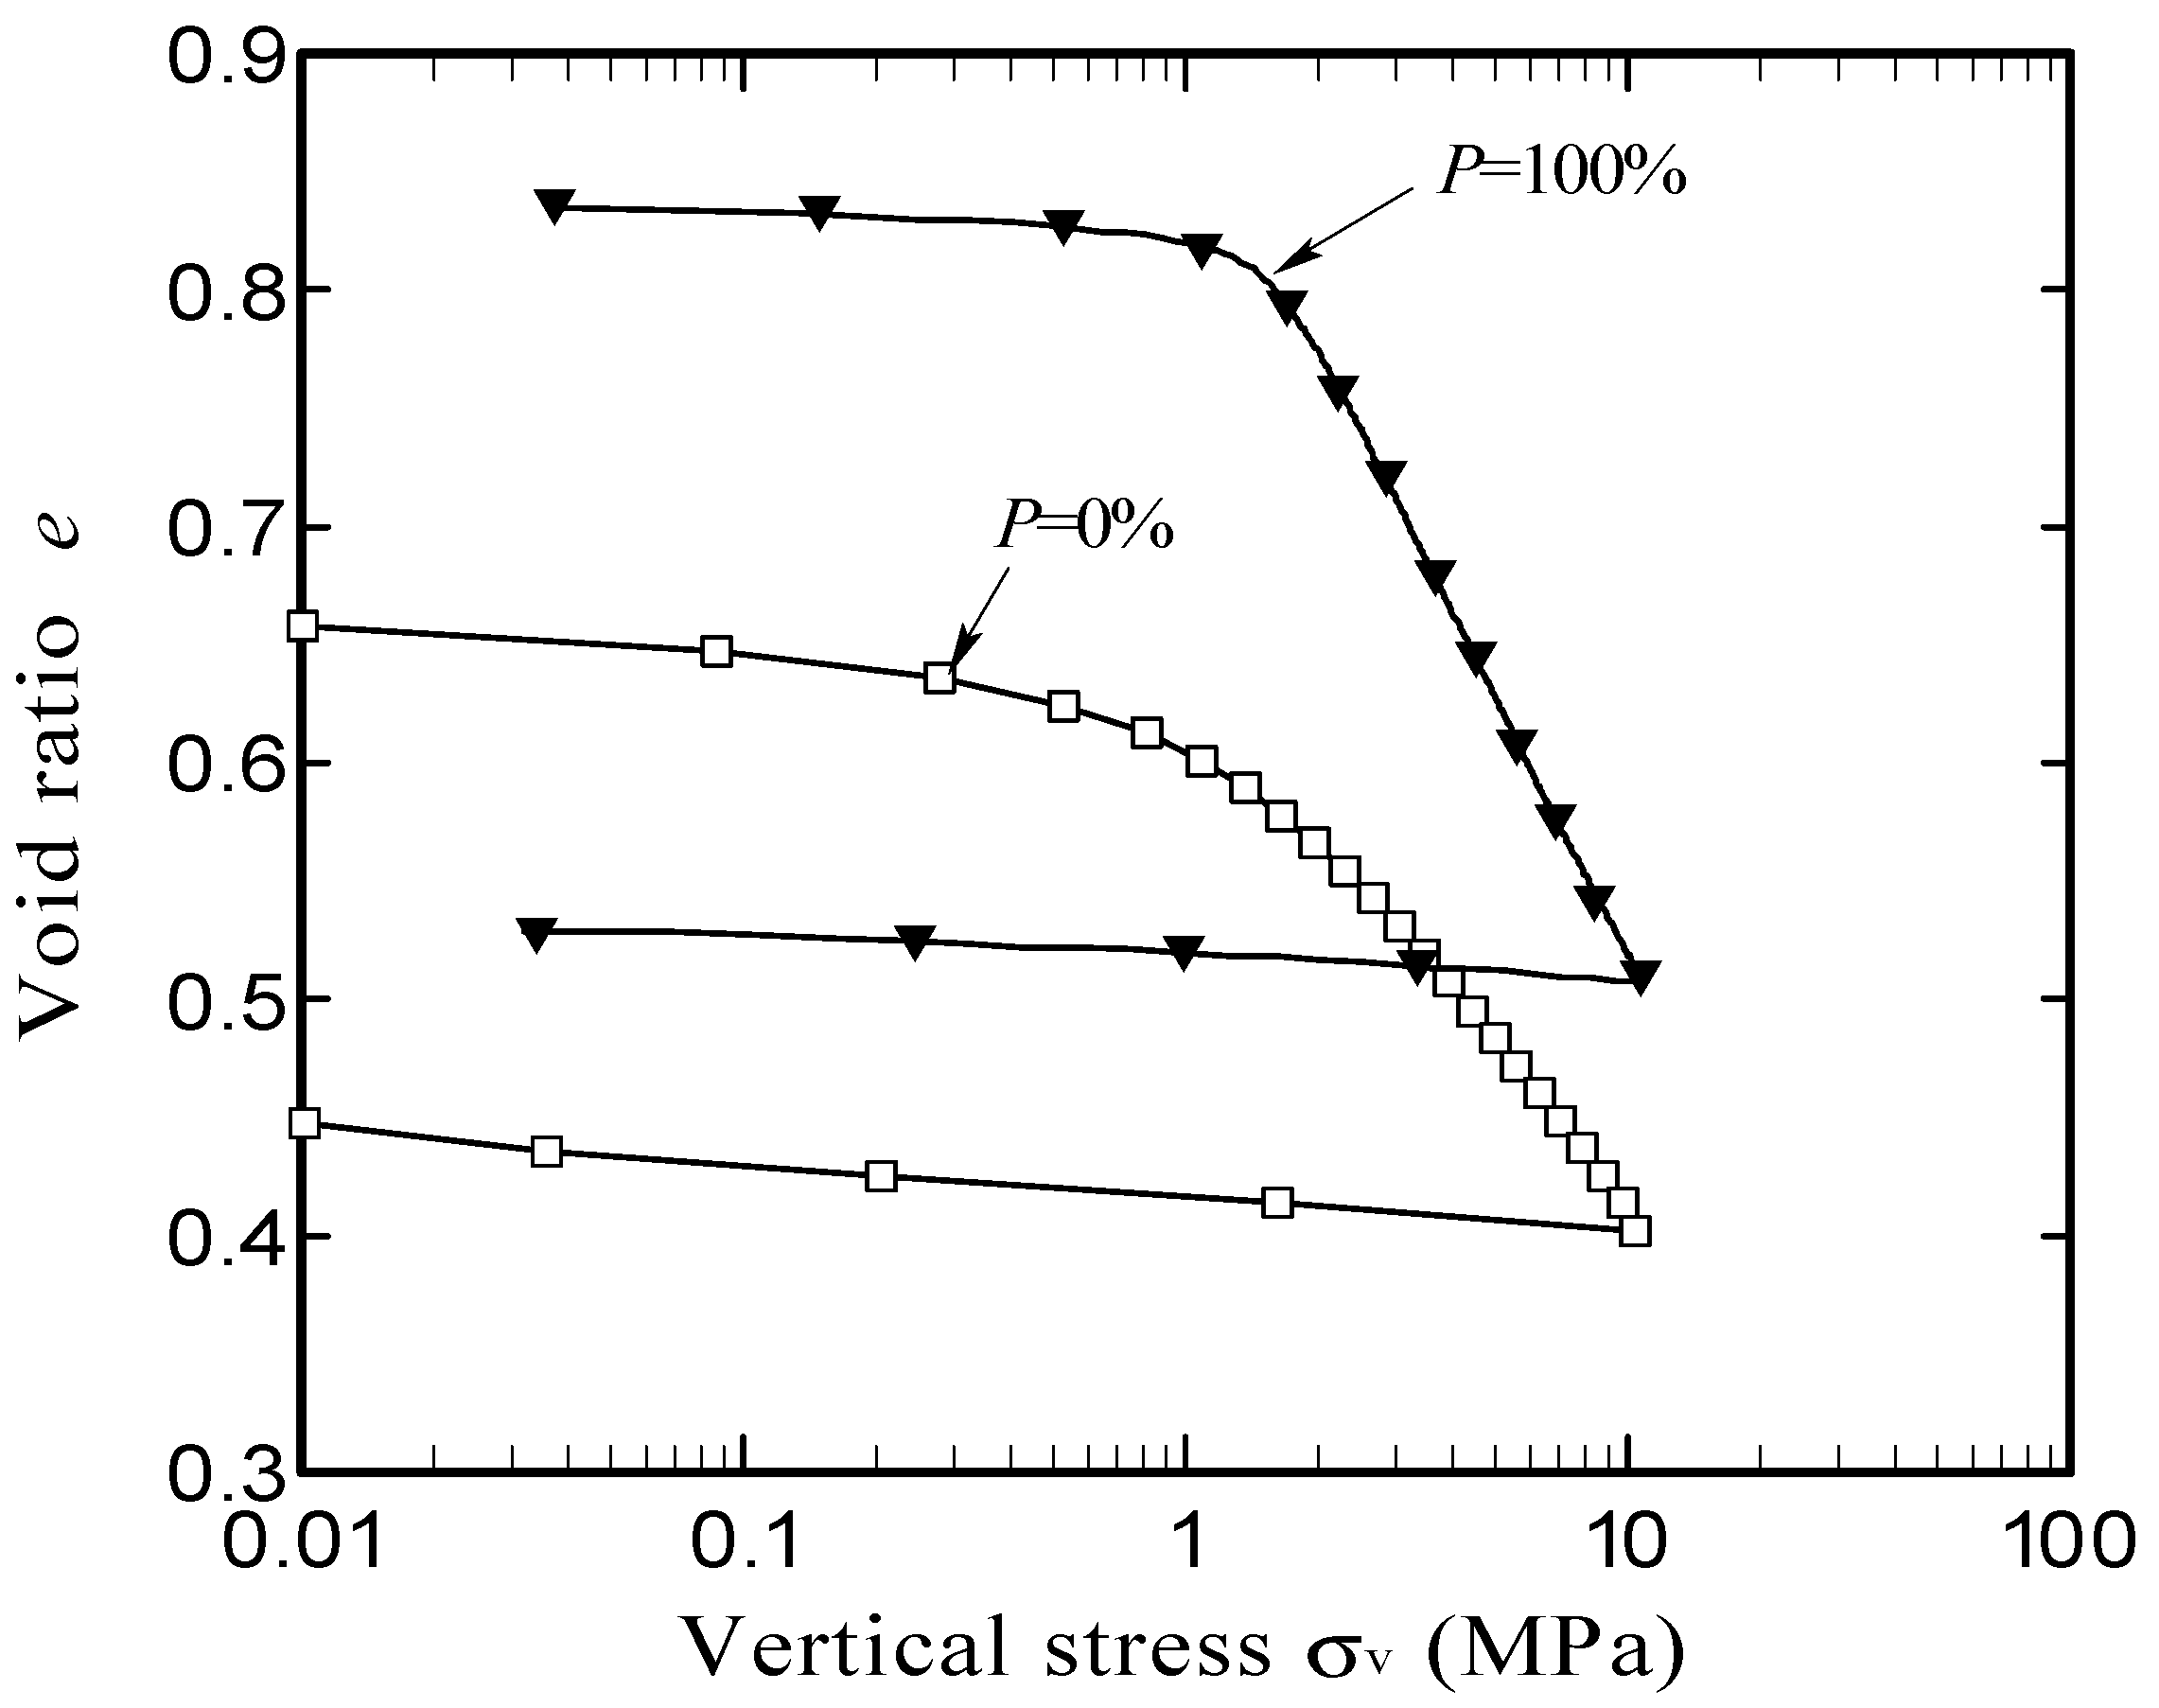
To estimate the compression characteristics of gravel–sand mixtures considering various gravel contents P, the compression curves for sand (P = 0%) and gravel (P = 100%) were utilized, as shown in Figure 5. The individual void ratios es and eg at a specified vertical stress σv were obtained based on Figure 5 and then substituted into Equation (5) while utilizing the values of Rm shown in Figure 5. The overall void ratio of the gravel–sand mixture corresponding to each gravel content (P) value was then obtained for specified values σv. The e log σv curve was then estimated and plotted for any gravel content value P, and the values of the compression index (λ) and swelling index (κ) were predicted as well.
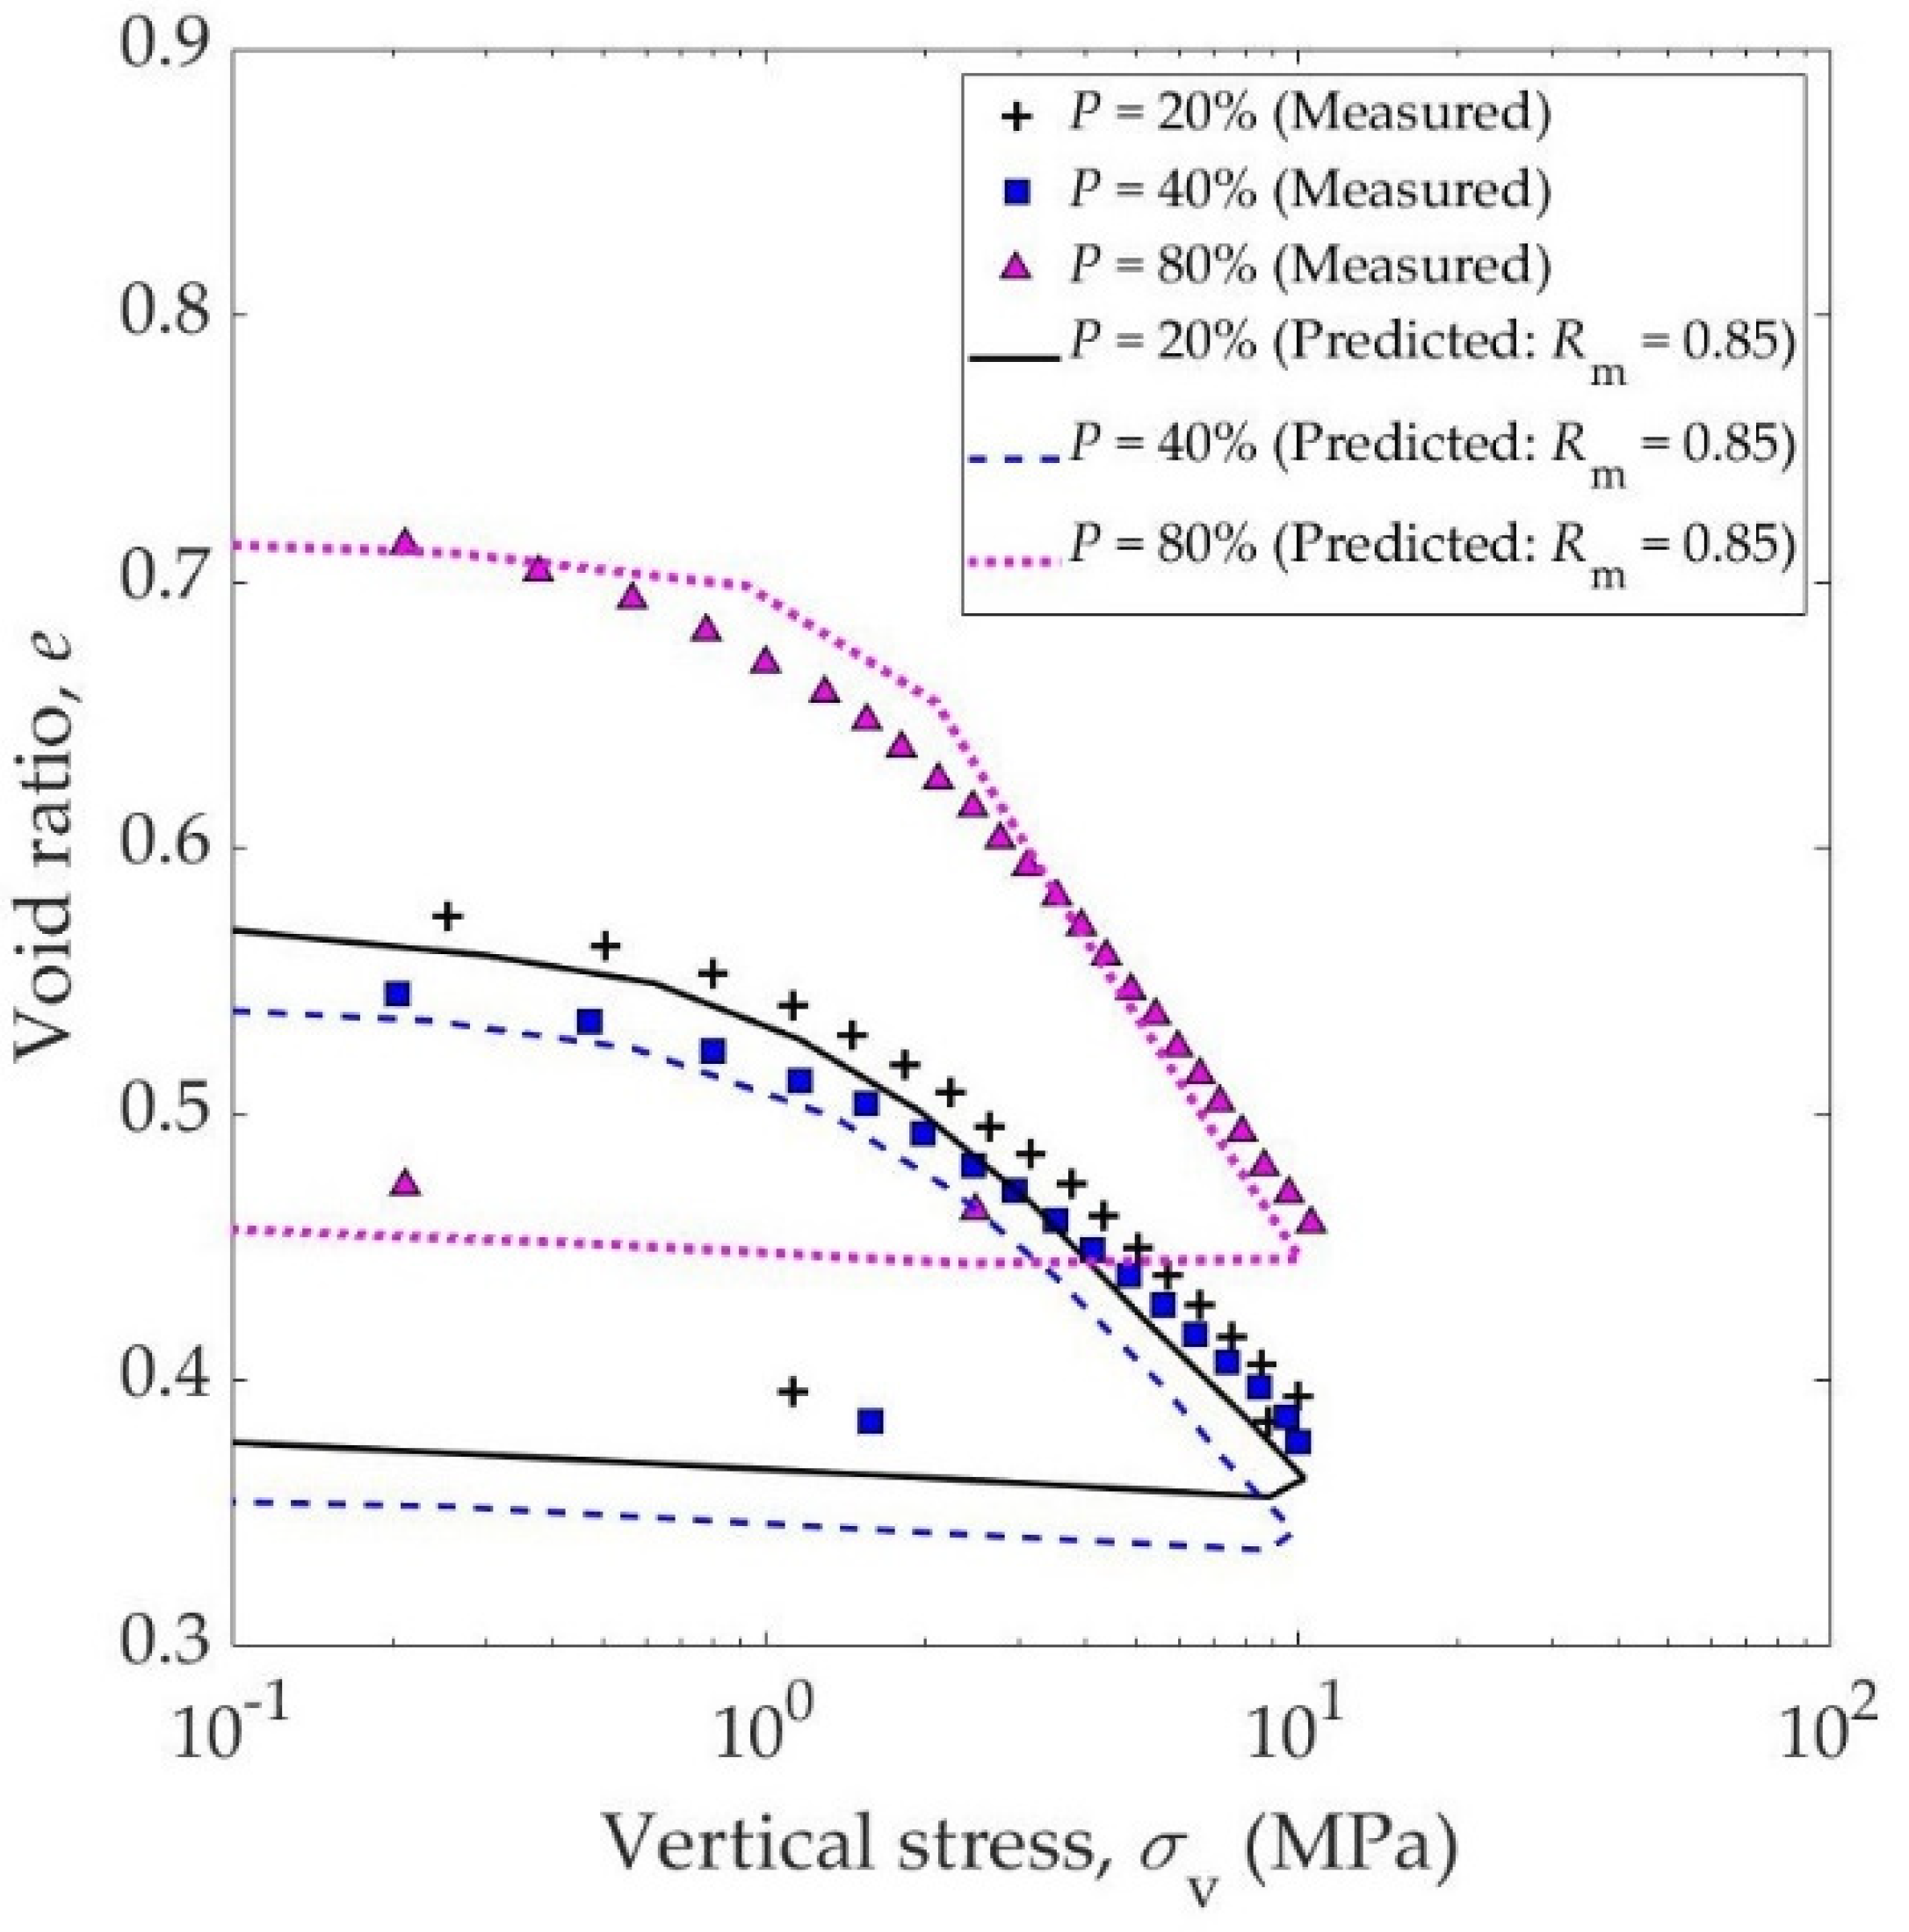
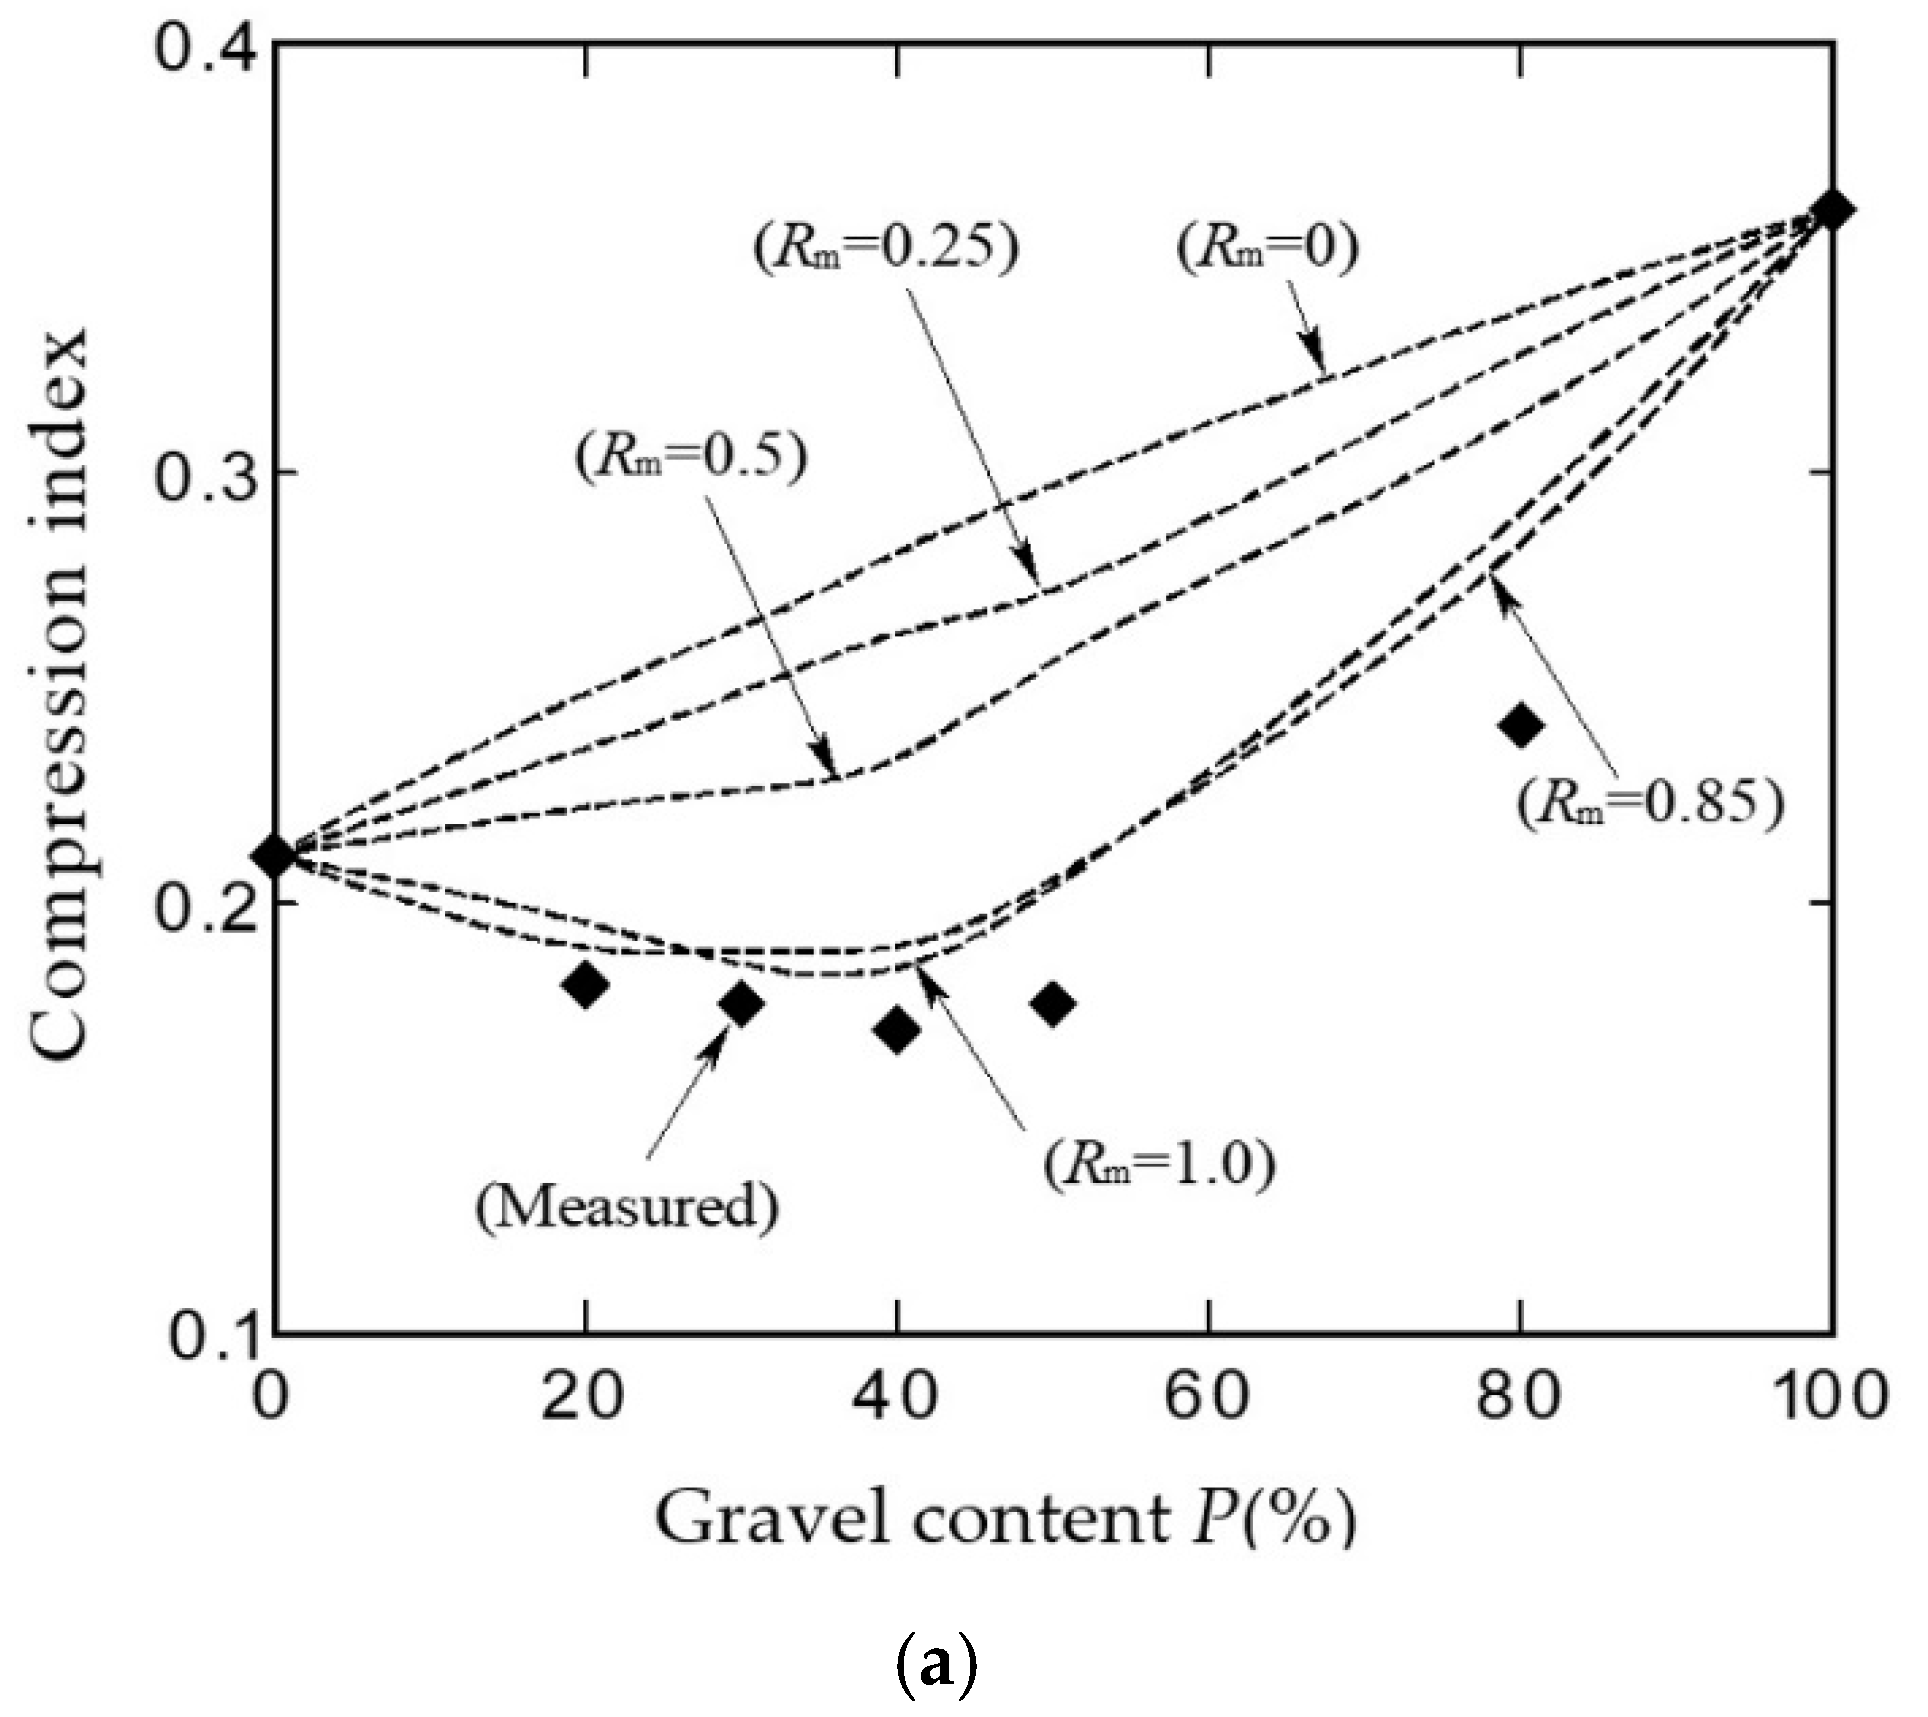
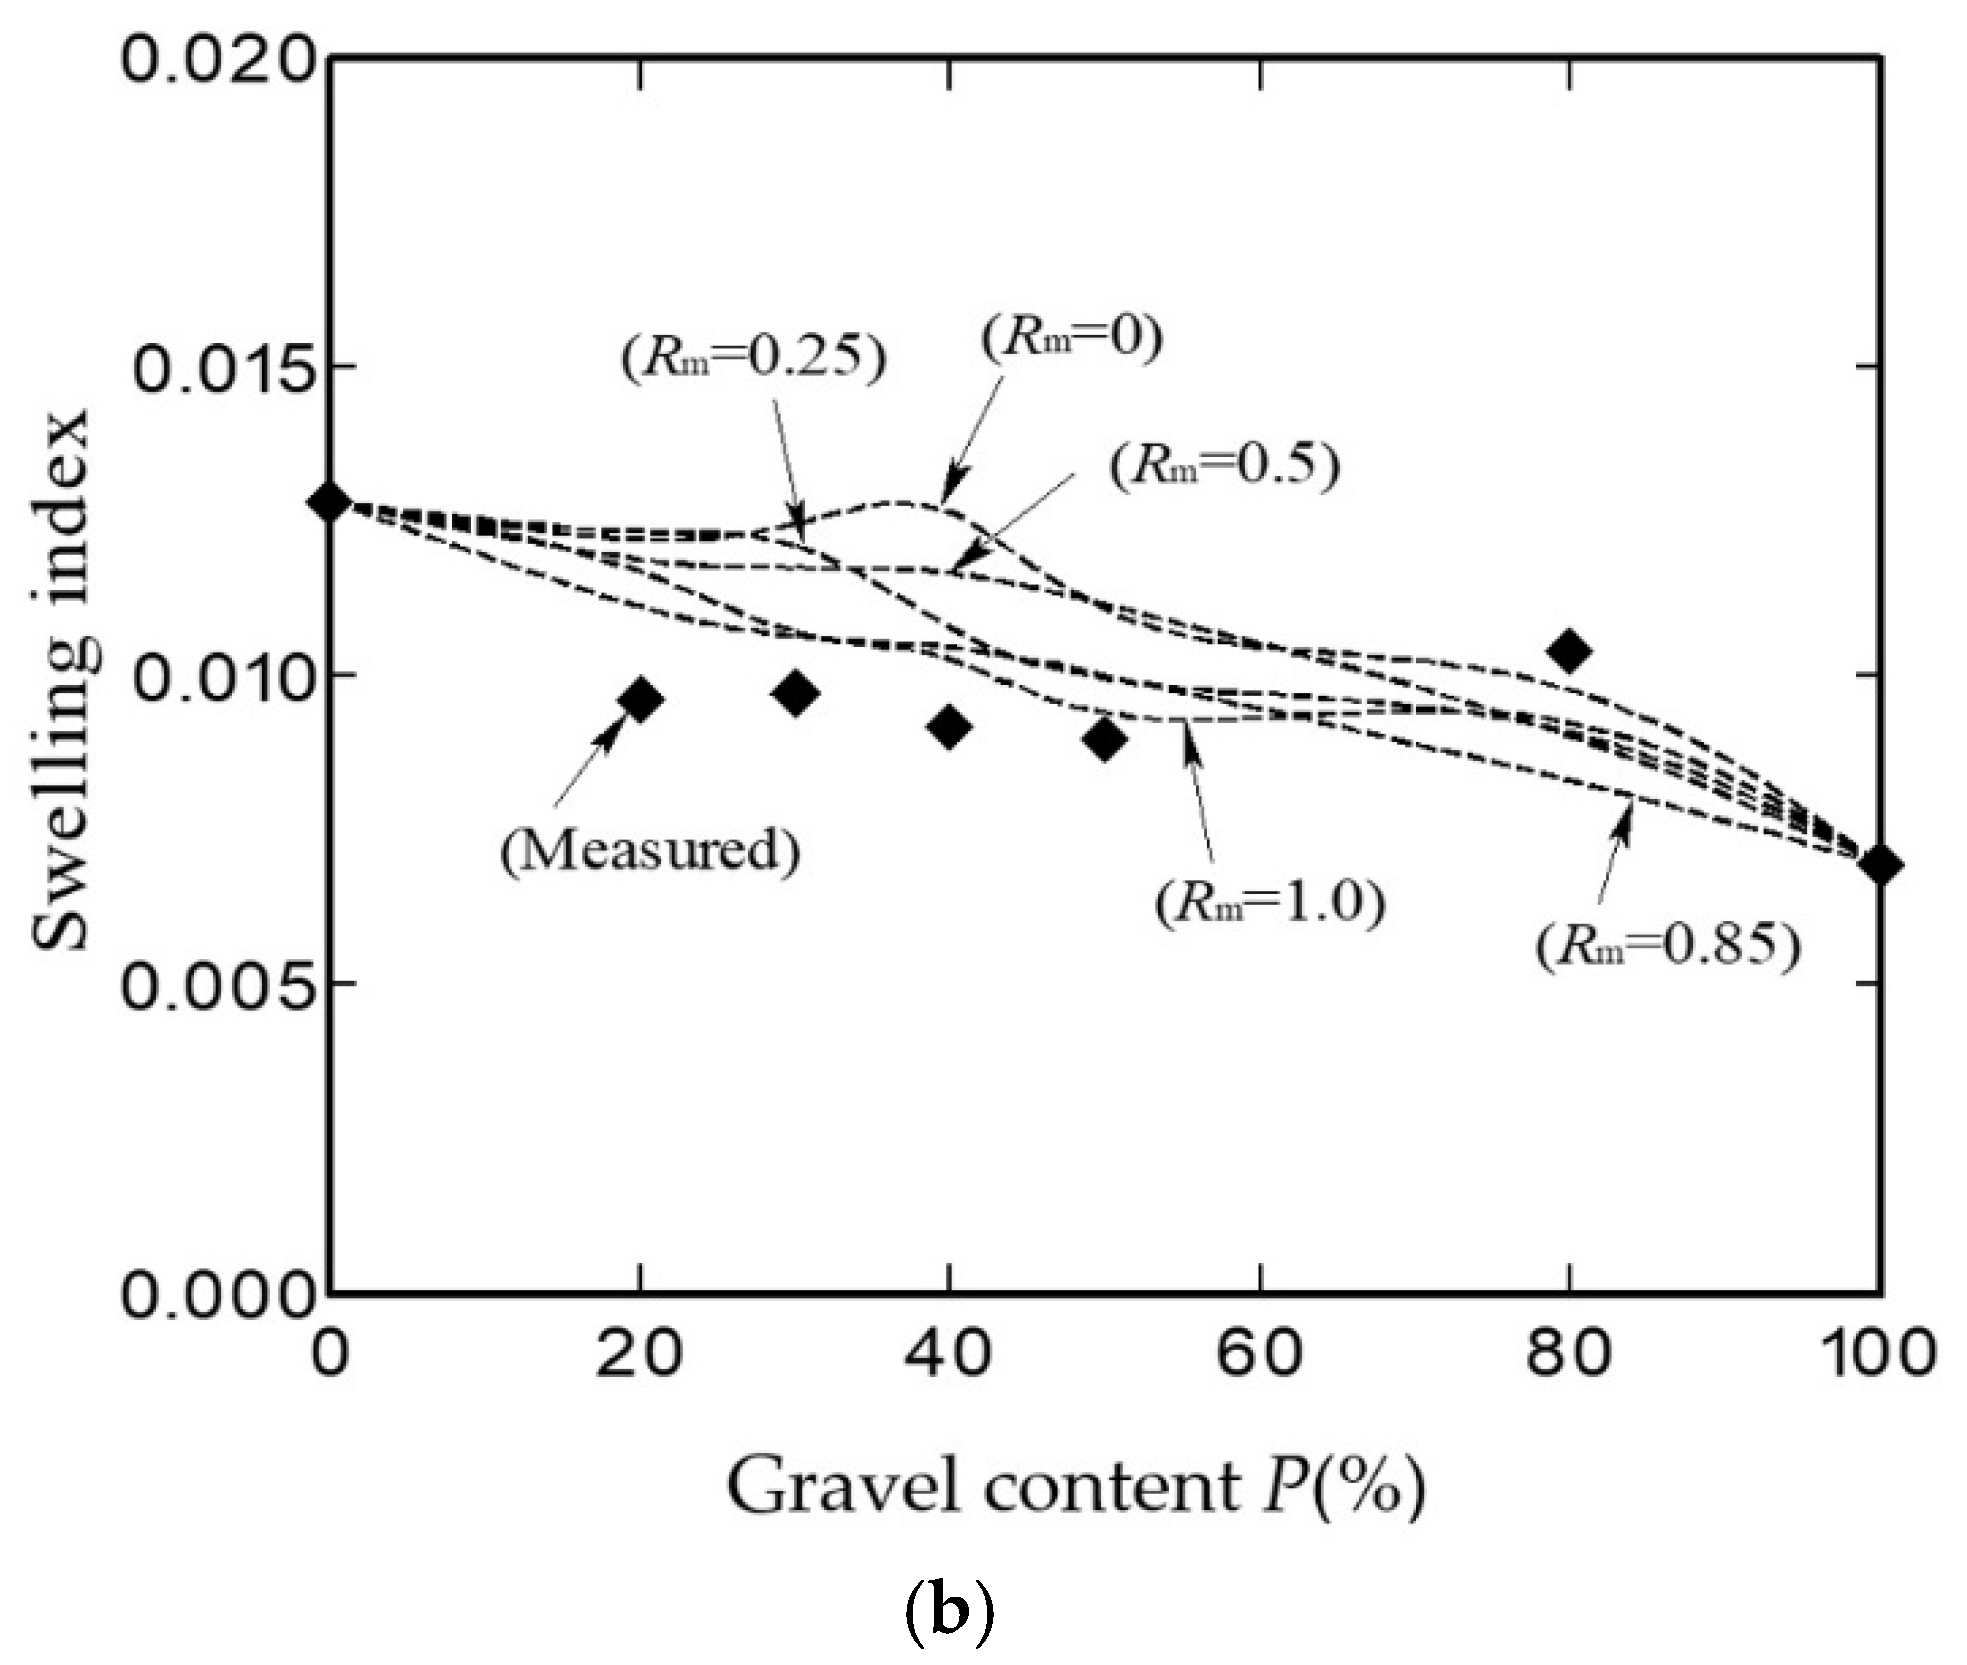
Using the method presented in this study, the predicted compression curves for P = 20%, 40%, and 80% using an Rm of 0.85 was compared with the measured data, as shown in Figure 6, and it can be seen that the predicted curves fairly agreed with the measured data. Therefore, Rm obtained from the compaction test could be utilized to reasonably predict the compression curves of the gravel–sand mixture. As a summary, and for comparison, Figure 7a,b show the comparison of the predicted and measured compression index and swelling index for various values of Rm. As shown, the swelling index varied with gravel content with the values ranging between 0.005 and 0.015, in which the predicted curves using Rm of 0.85 and 1.0 showed closer agreement with the measured curve. Similarly, for the compression index, the predicted curves with Rm of 0.85 and 1.0 showed good agreement with the measured curve. These results showed that parameters at various gravel contents could be predicted by using the mixing degree Rm of the gravel material and the data of the one-dimensional compression test of sand only (P = 0%) and gravel only (P = 100%). Hence, the method can be used to quantitatively assess the influence of the gravel ratio on the compression characteristics of mixed materials. It should be noted, however, that the test results presented herein are valid only for the indicated conditions of D-G-S (in terms of grain-size distributions, initial water content, and compaction energy), and other conditions may lead to different values of Rm. Furthermore, the degree of weathering of the D-G-S can also affect the compressibility of the mixture.
3. Evaluation of the Stability of a Gravel–Sand-Mixed Embankment Using Finite Element Analysis
3.1. Effect of Gravel Content on Embankment Behavior
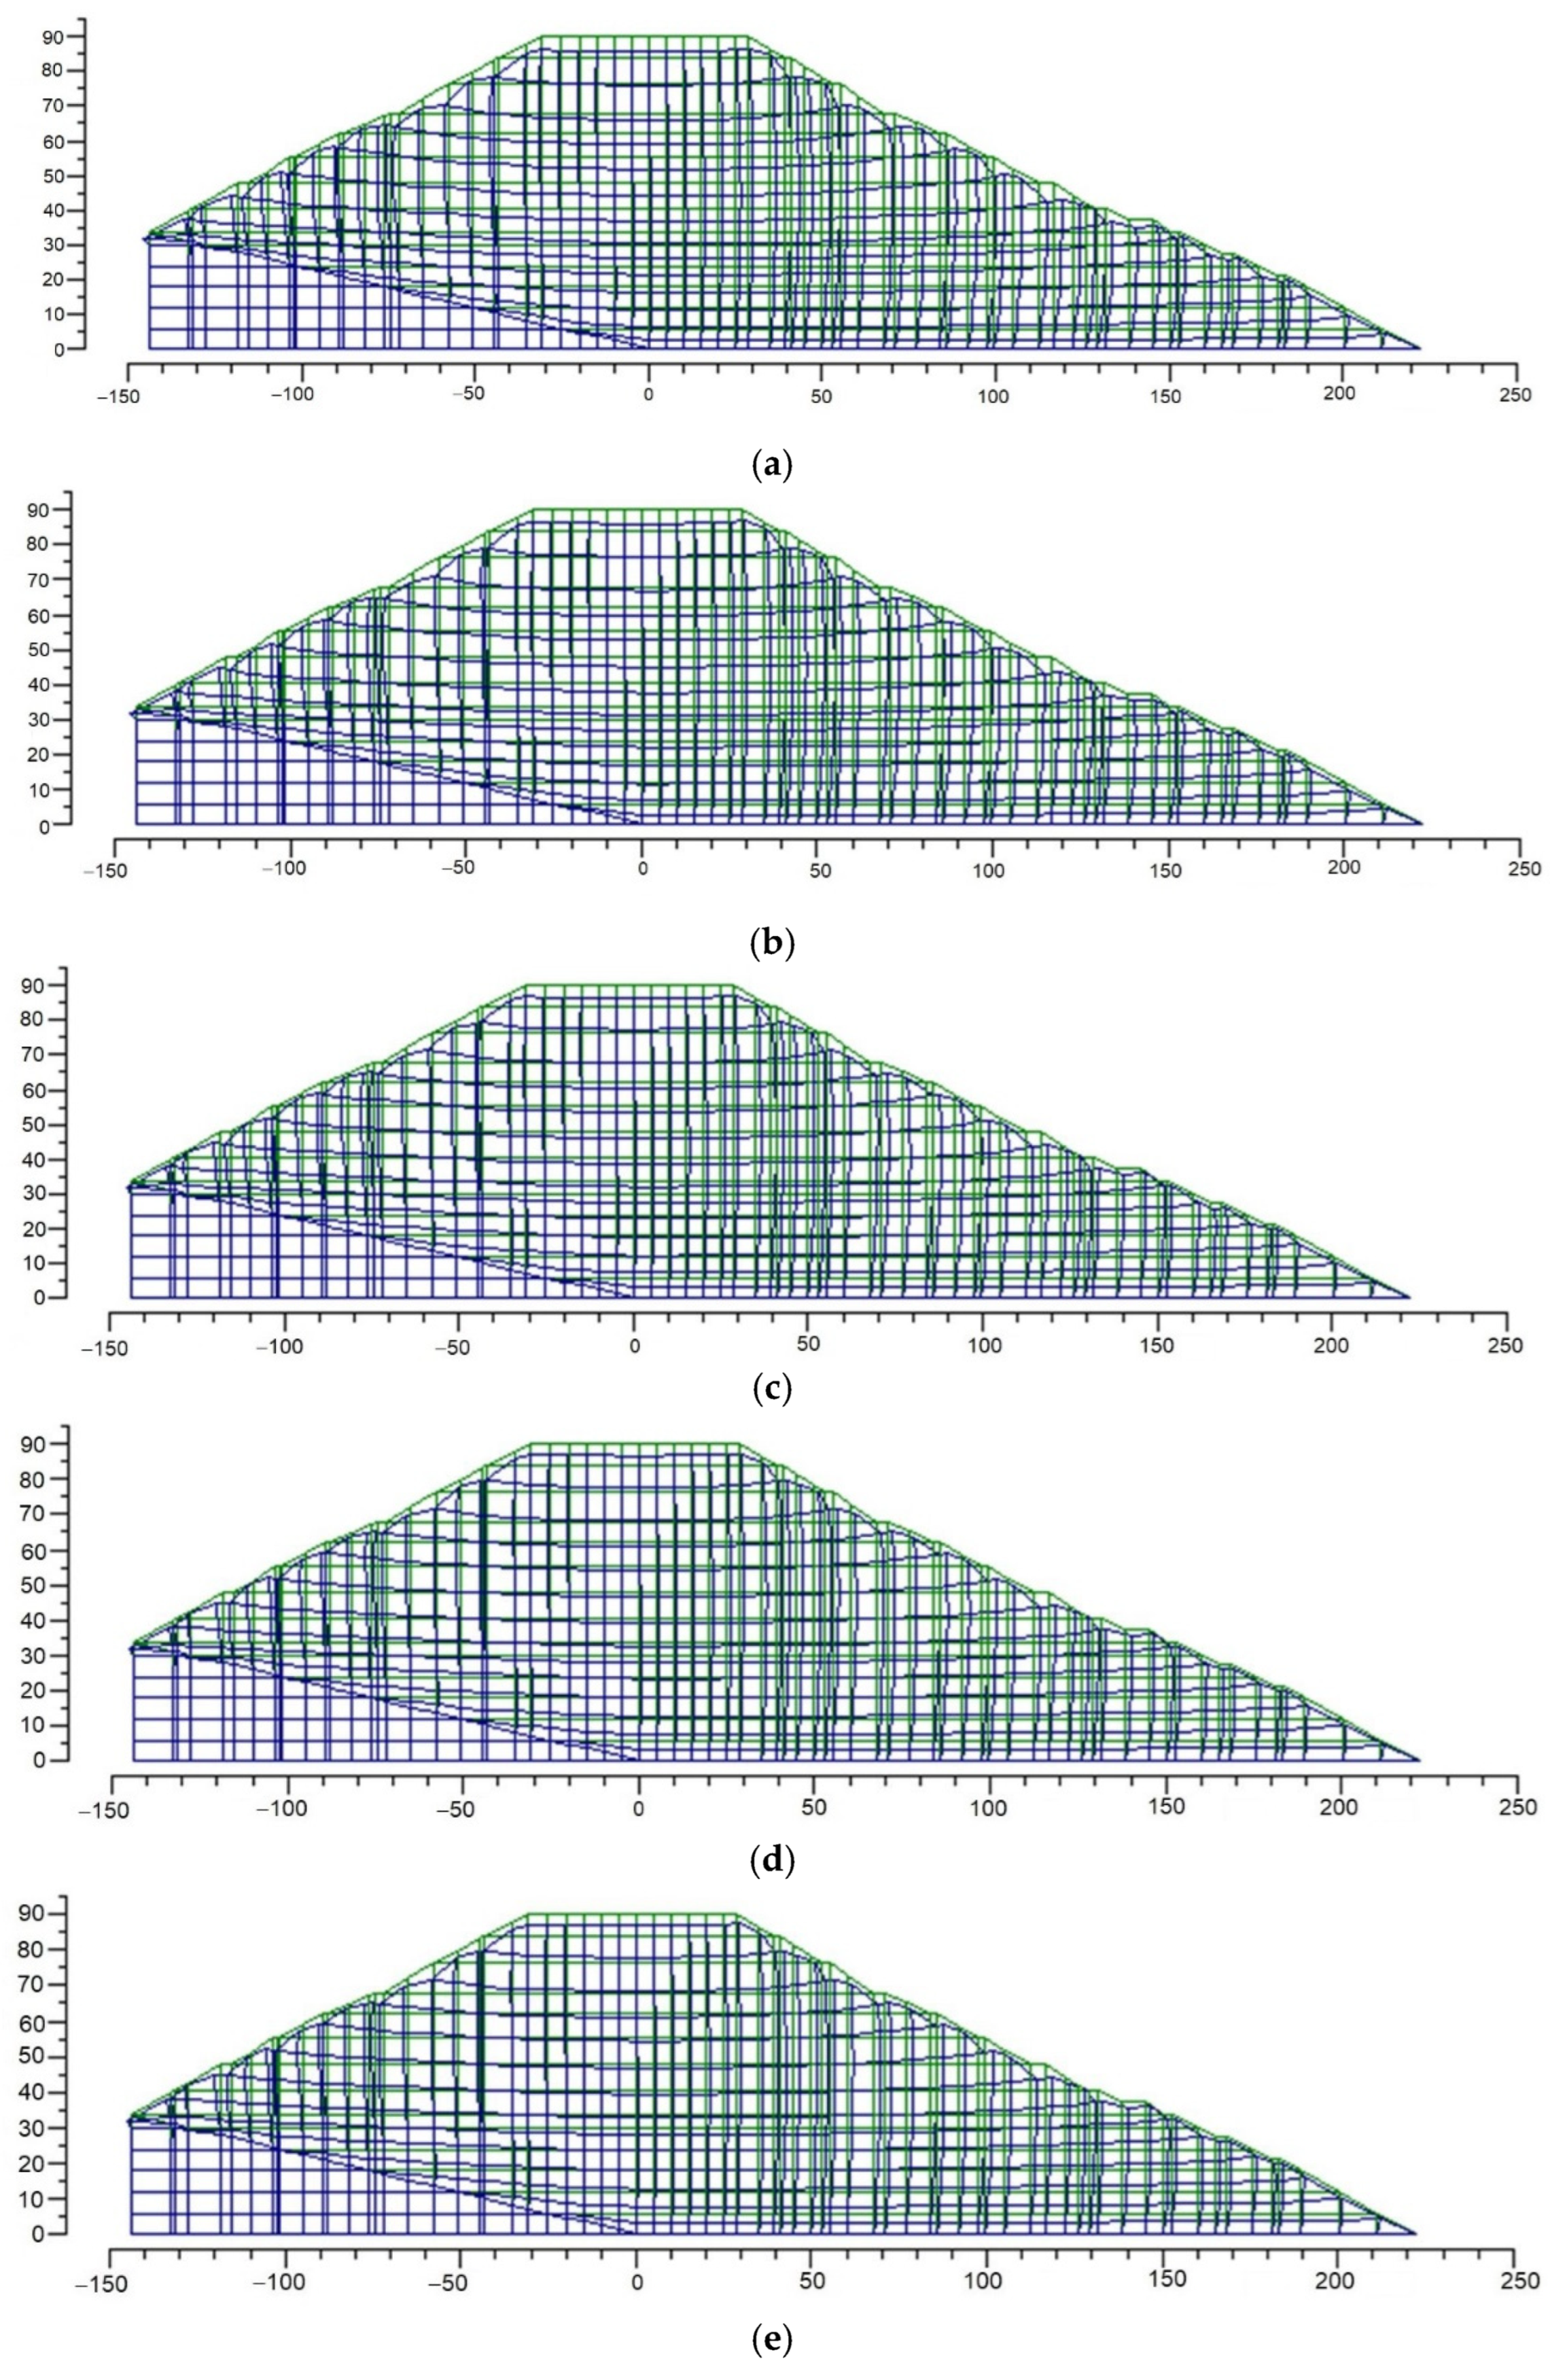
In order to investigate the effect of gravel content on the embankment behavior, finite element analysis was performed based on the geometry of an actual embankment—the second Tomei Expressway embankment in the Kasesawa area in Japan. The cross-sectional view of the embankment is shown in Figure 8, and its equivalent cross-sectional model used in the finite element analysis is shown in Figure 9. The embankment has a height of 91.9 m and a side slope of 1:1.8. Mori et al. (2001) [24] clarified that coarse-grained material under loading stress exceeding the preceding compressive stress takes the elastoplastic compressive deformation behavior under the influence of various factors such as particle-size distribution, void ratio, etc. Since the loading stress exceeds the preceding compressive stress, and assuming that the embankment material is the Shimonoseki D-G-S, it is possible to use the elastoplastic model proposed by Sekiguchi and Ohta (1977) [25] as the material model for the finite element analysis. In the Sekiguchi and Ohta (1977) [25] model, the dilatancy coefficient D is required, which can be obtained from the initial void ratio e, compression index λ, and the swelling index κ [23]. A summary of the characteristics of the finite element model is listed in Table 3, and the parameters and calculation formulas used for the finite element analysis are shown in Table 4. Seven simulations were performed by varying the gravel content (P) value of the embankment material. Matsumoto et al. (1982, 1983) [26] and Matsuoka et al. (1999) [27] reported and supported their results that the size of the gravel specimen does not significantly affect the internal friction angle. In this study, the internal friction angle of the material was considered to be equivalent to that of sand, with a size of 2 mm or less.
Figure 10a–g show the results of the finite element analysis for embankments with gravel contents (P) of 0, 20, 30, 40, 50, 80, and 100%, respectively, while Figure 11 shows the variation in the vertical displacement at the center of the embankment with the heights for various gravel contents (P) obtained from the results of Figure 10a–g.
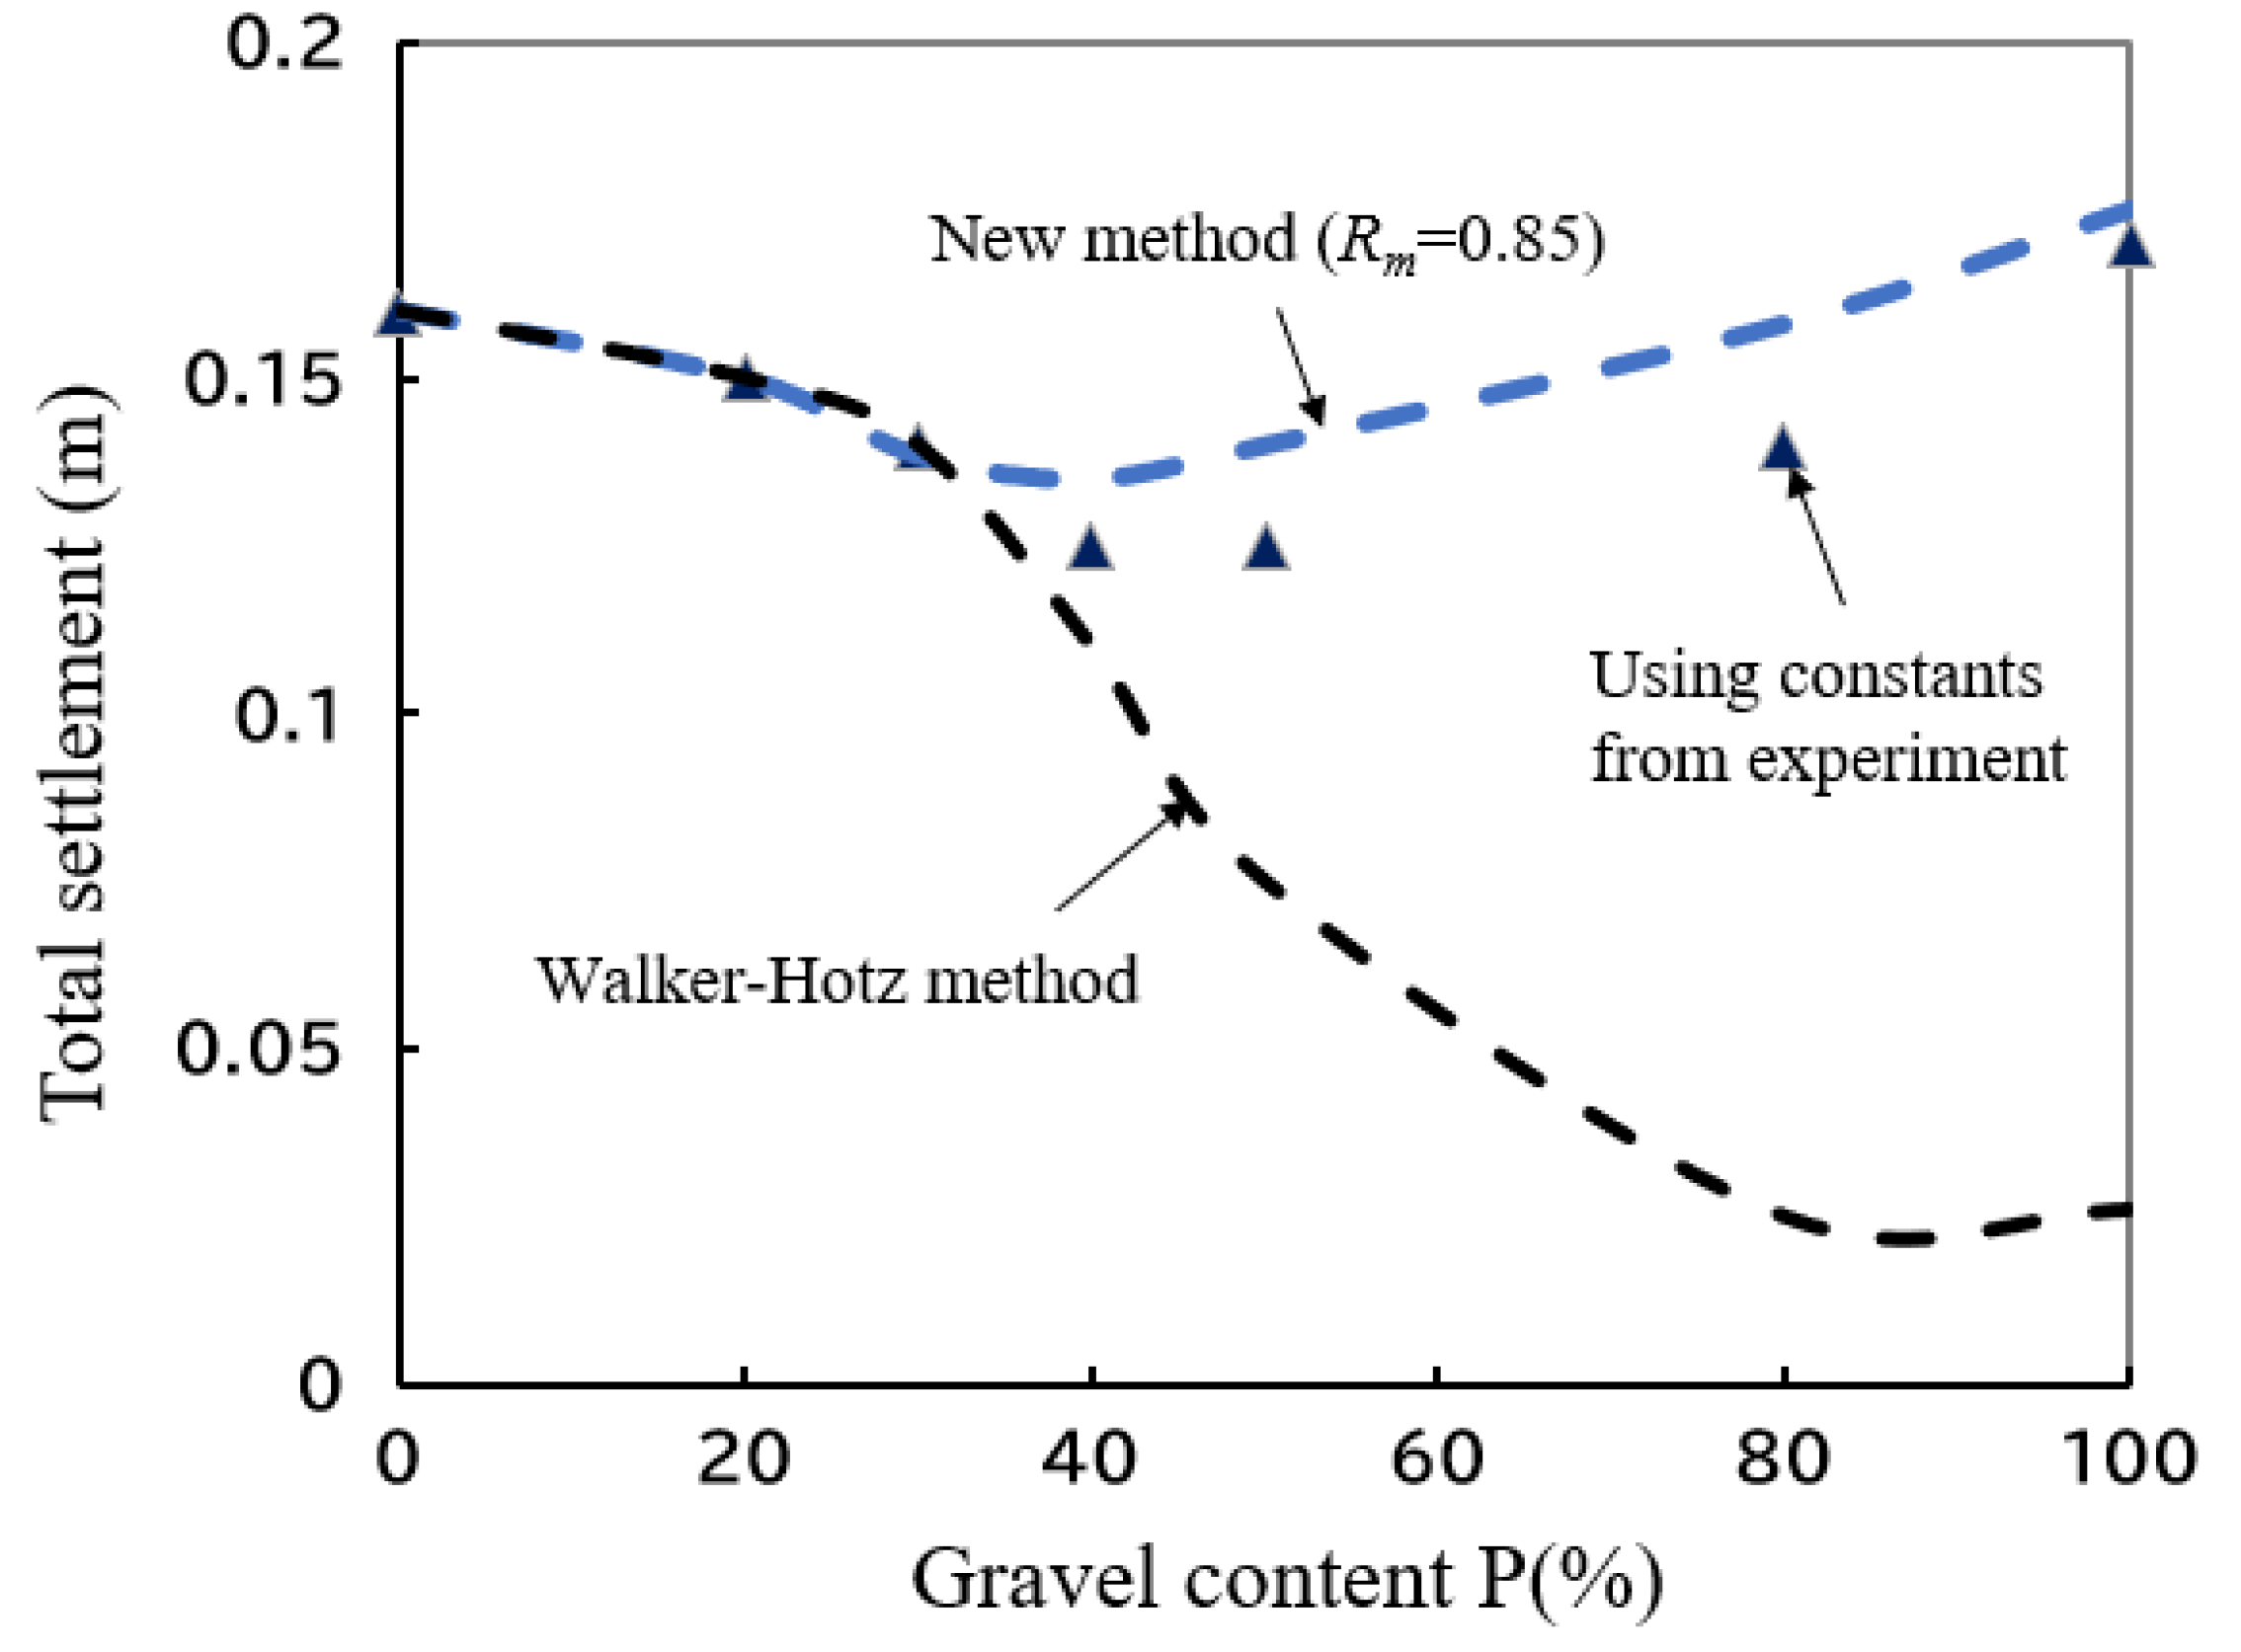
Figure 11 shows the total settlement at the end of embankment construction. It can be seen that the total settlement amount decreased with the increase in P from 0% up to 50% of gravel content (P), and the total settlement increased from a gravel content (P) of 50% to 100%. This trend is almost the same result as the data showing the relationship between gravel content (P) and compression index in Figure 7a. The total settlement at the end of construction is related to the material constants (compression index λ and swelling index κ). It means that the material constants are important parameters that greatly influence the result of the simulation via finite element analysis.
3.2. Engineering Application of the Proposed Equation
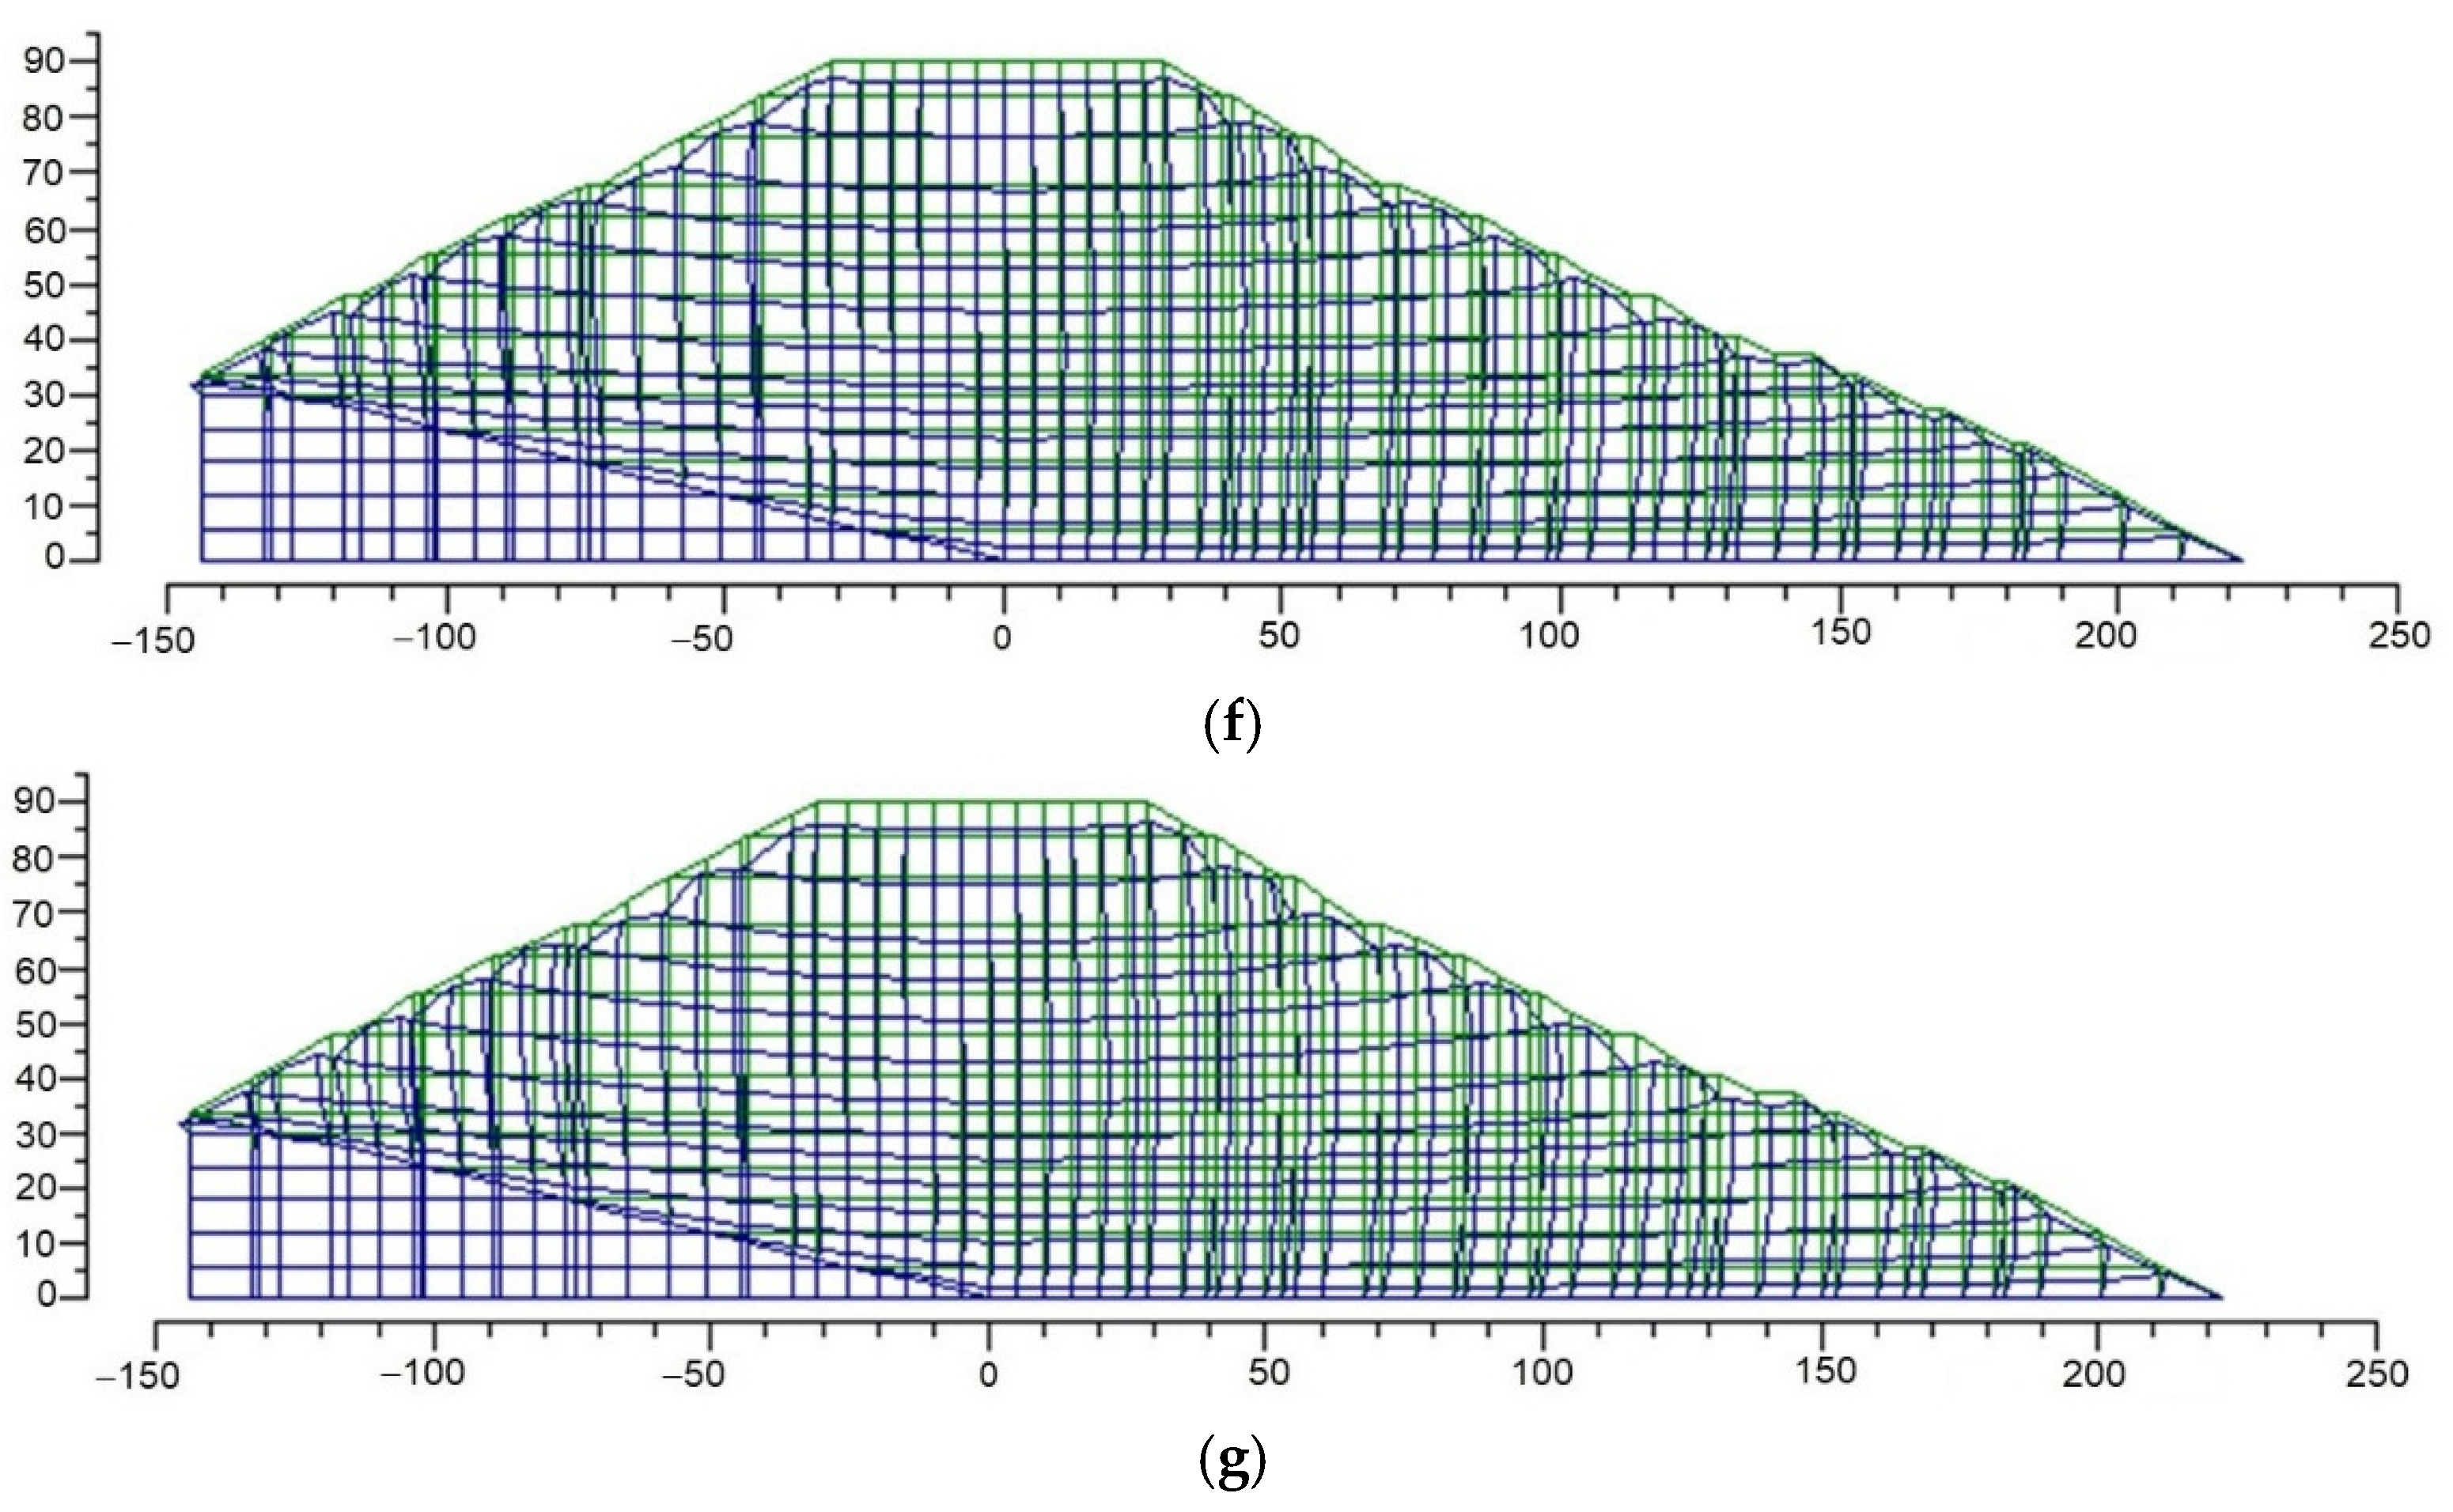
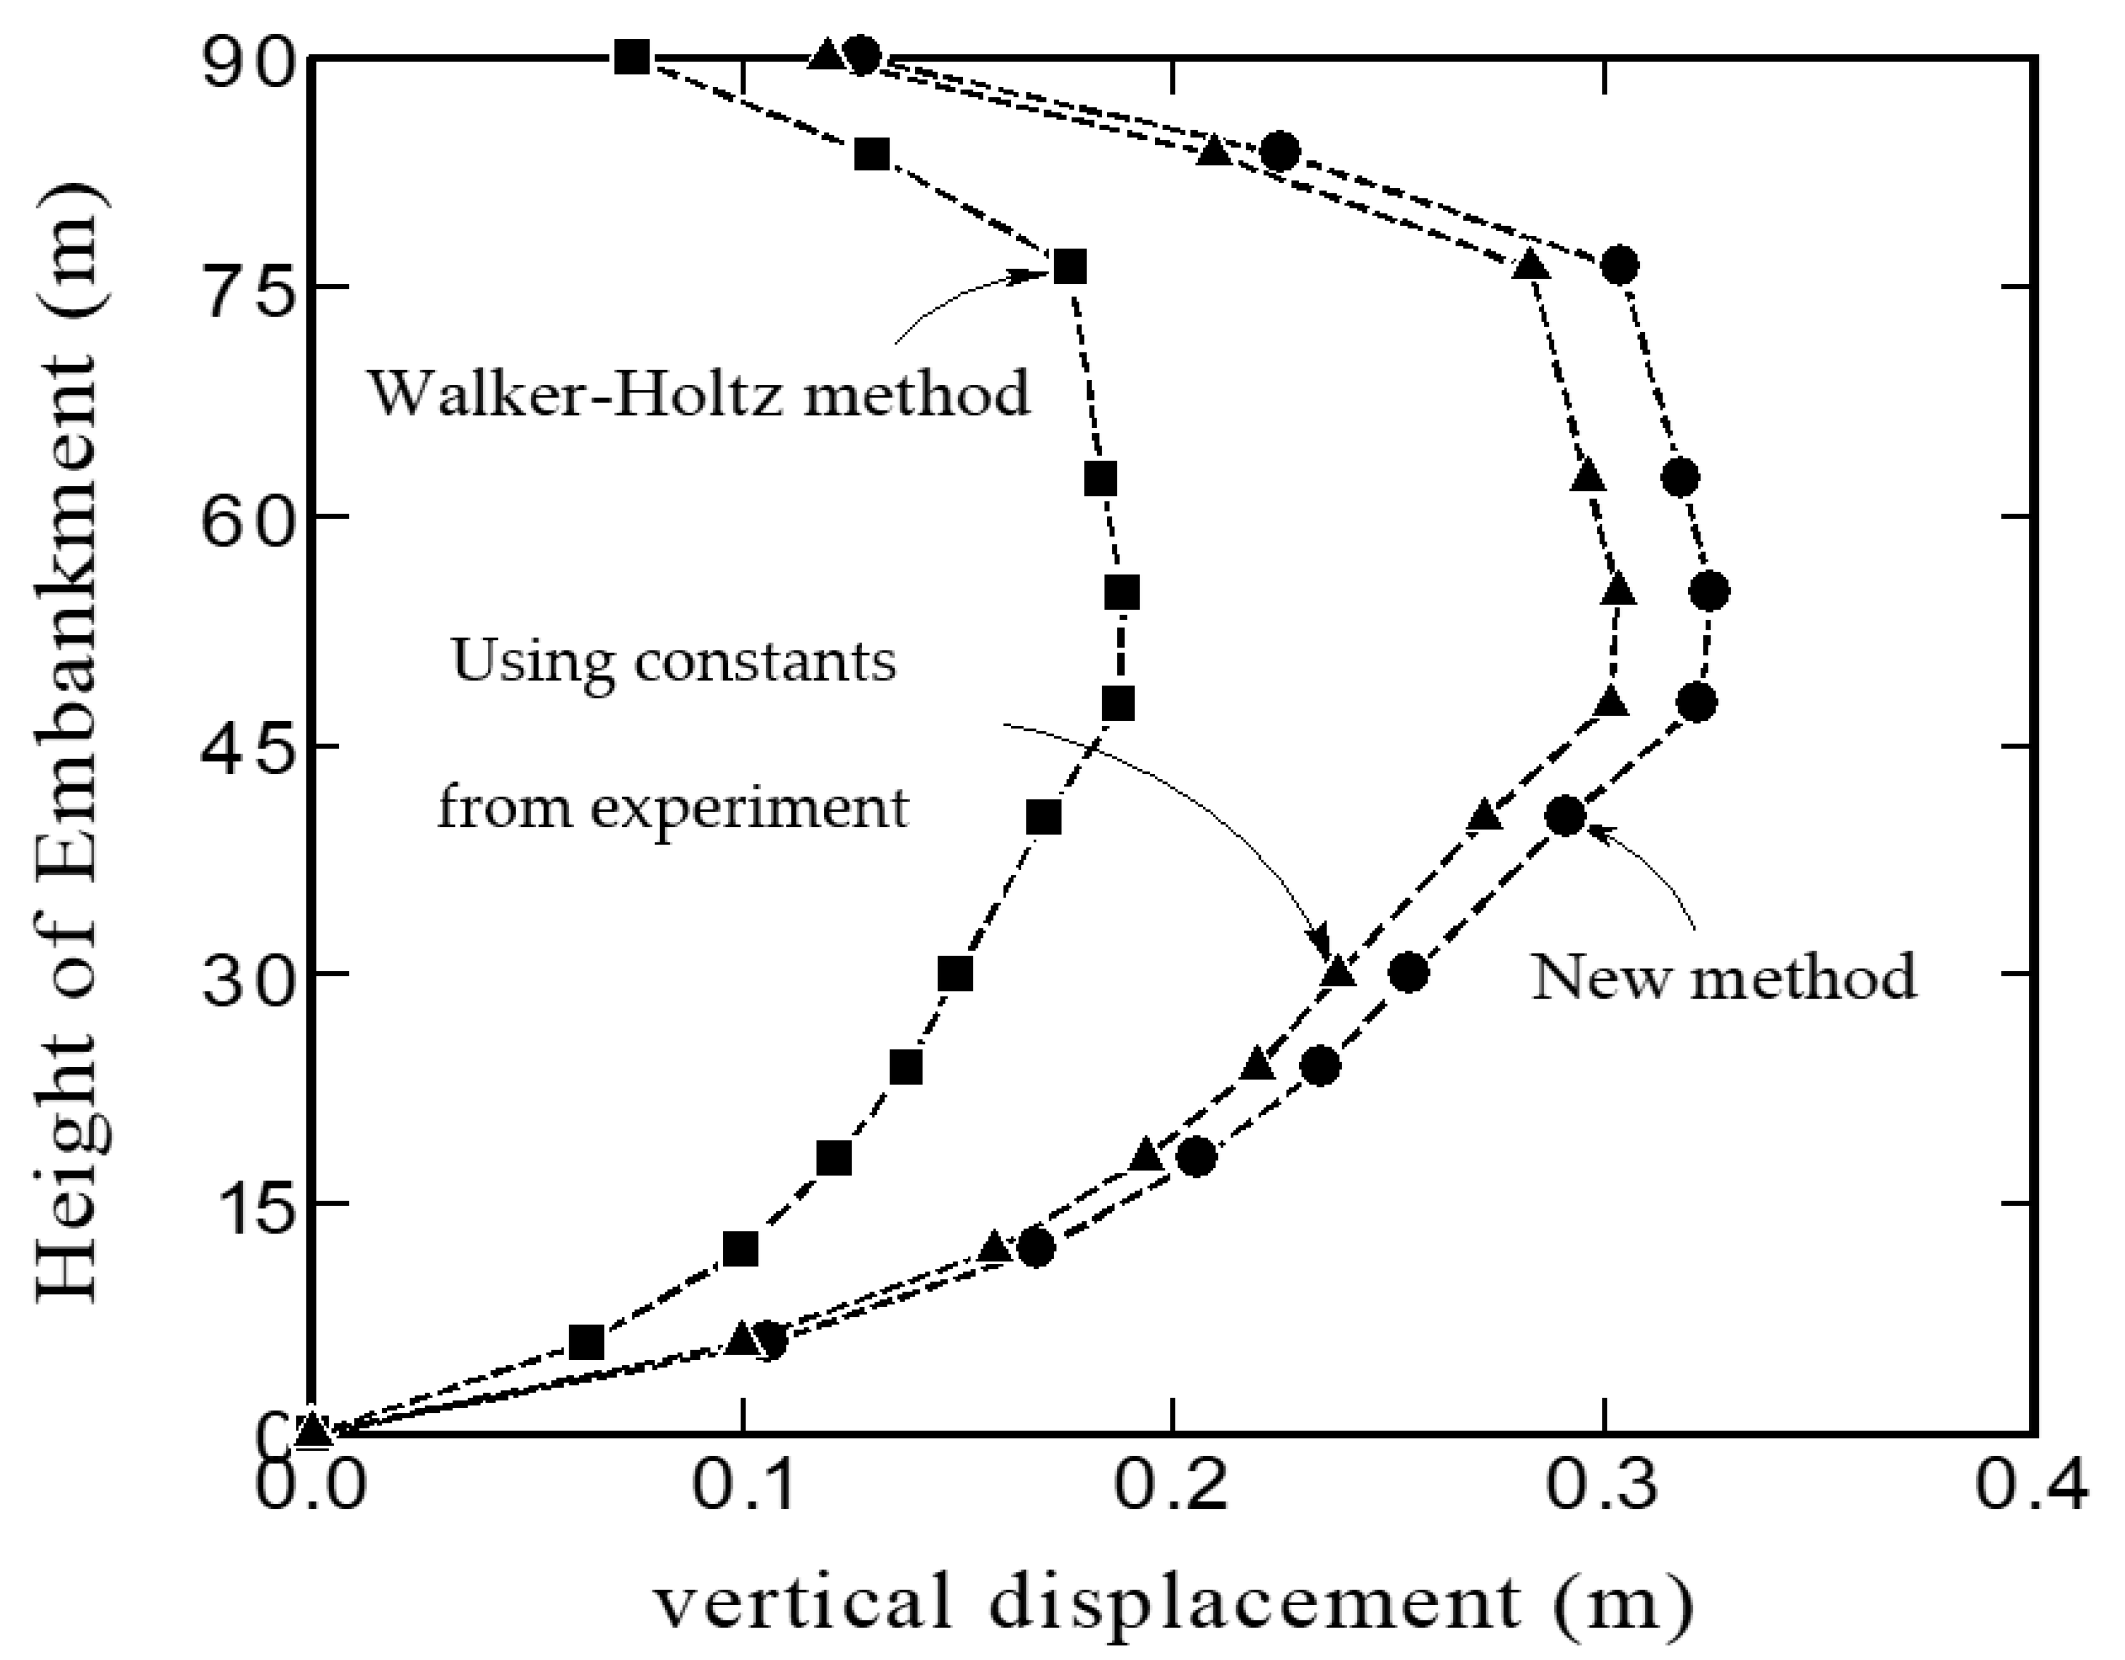
Finite element analysis was performed to evaluate the engineering application of the proposed gravel correction formula for estimating the material constants of gravel–sand mixtures. The proposed method was compared with material constants directly obtained from the one-dimensional compression test, and material constants corrected with the Walker–Holtz method. Figure 12a–c show the results of the analysis when the embankment material was a gravel material with gravel content (P) = 50%. It can be seen that the deformation behavior in Figure 12c is somewhat identical to the deformation behavior in Figure 12a. Hence, the deformation of the embankment was better represented using the new method rather than the Walker–Holtz method. The analysis result using the material constants corrected with the Walker–Holtz method, as shown in Figure 12b, had a significantly smaller amount of deformation in comparison to the other two sets of material constants.
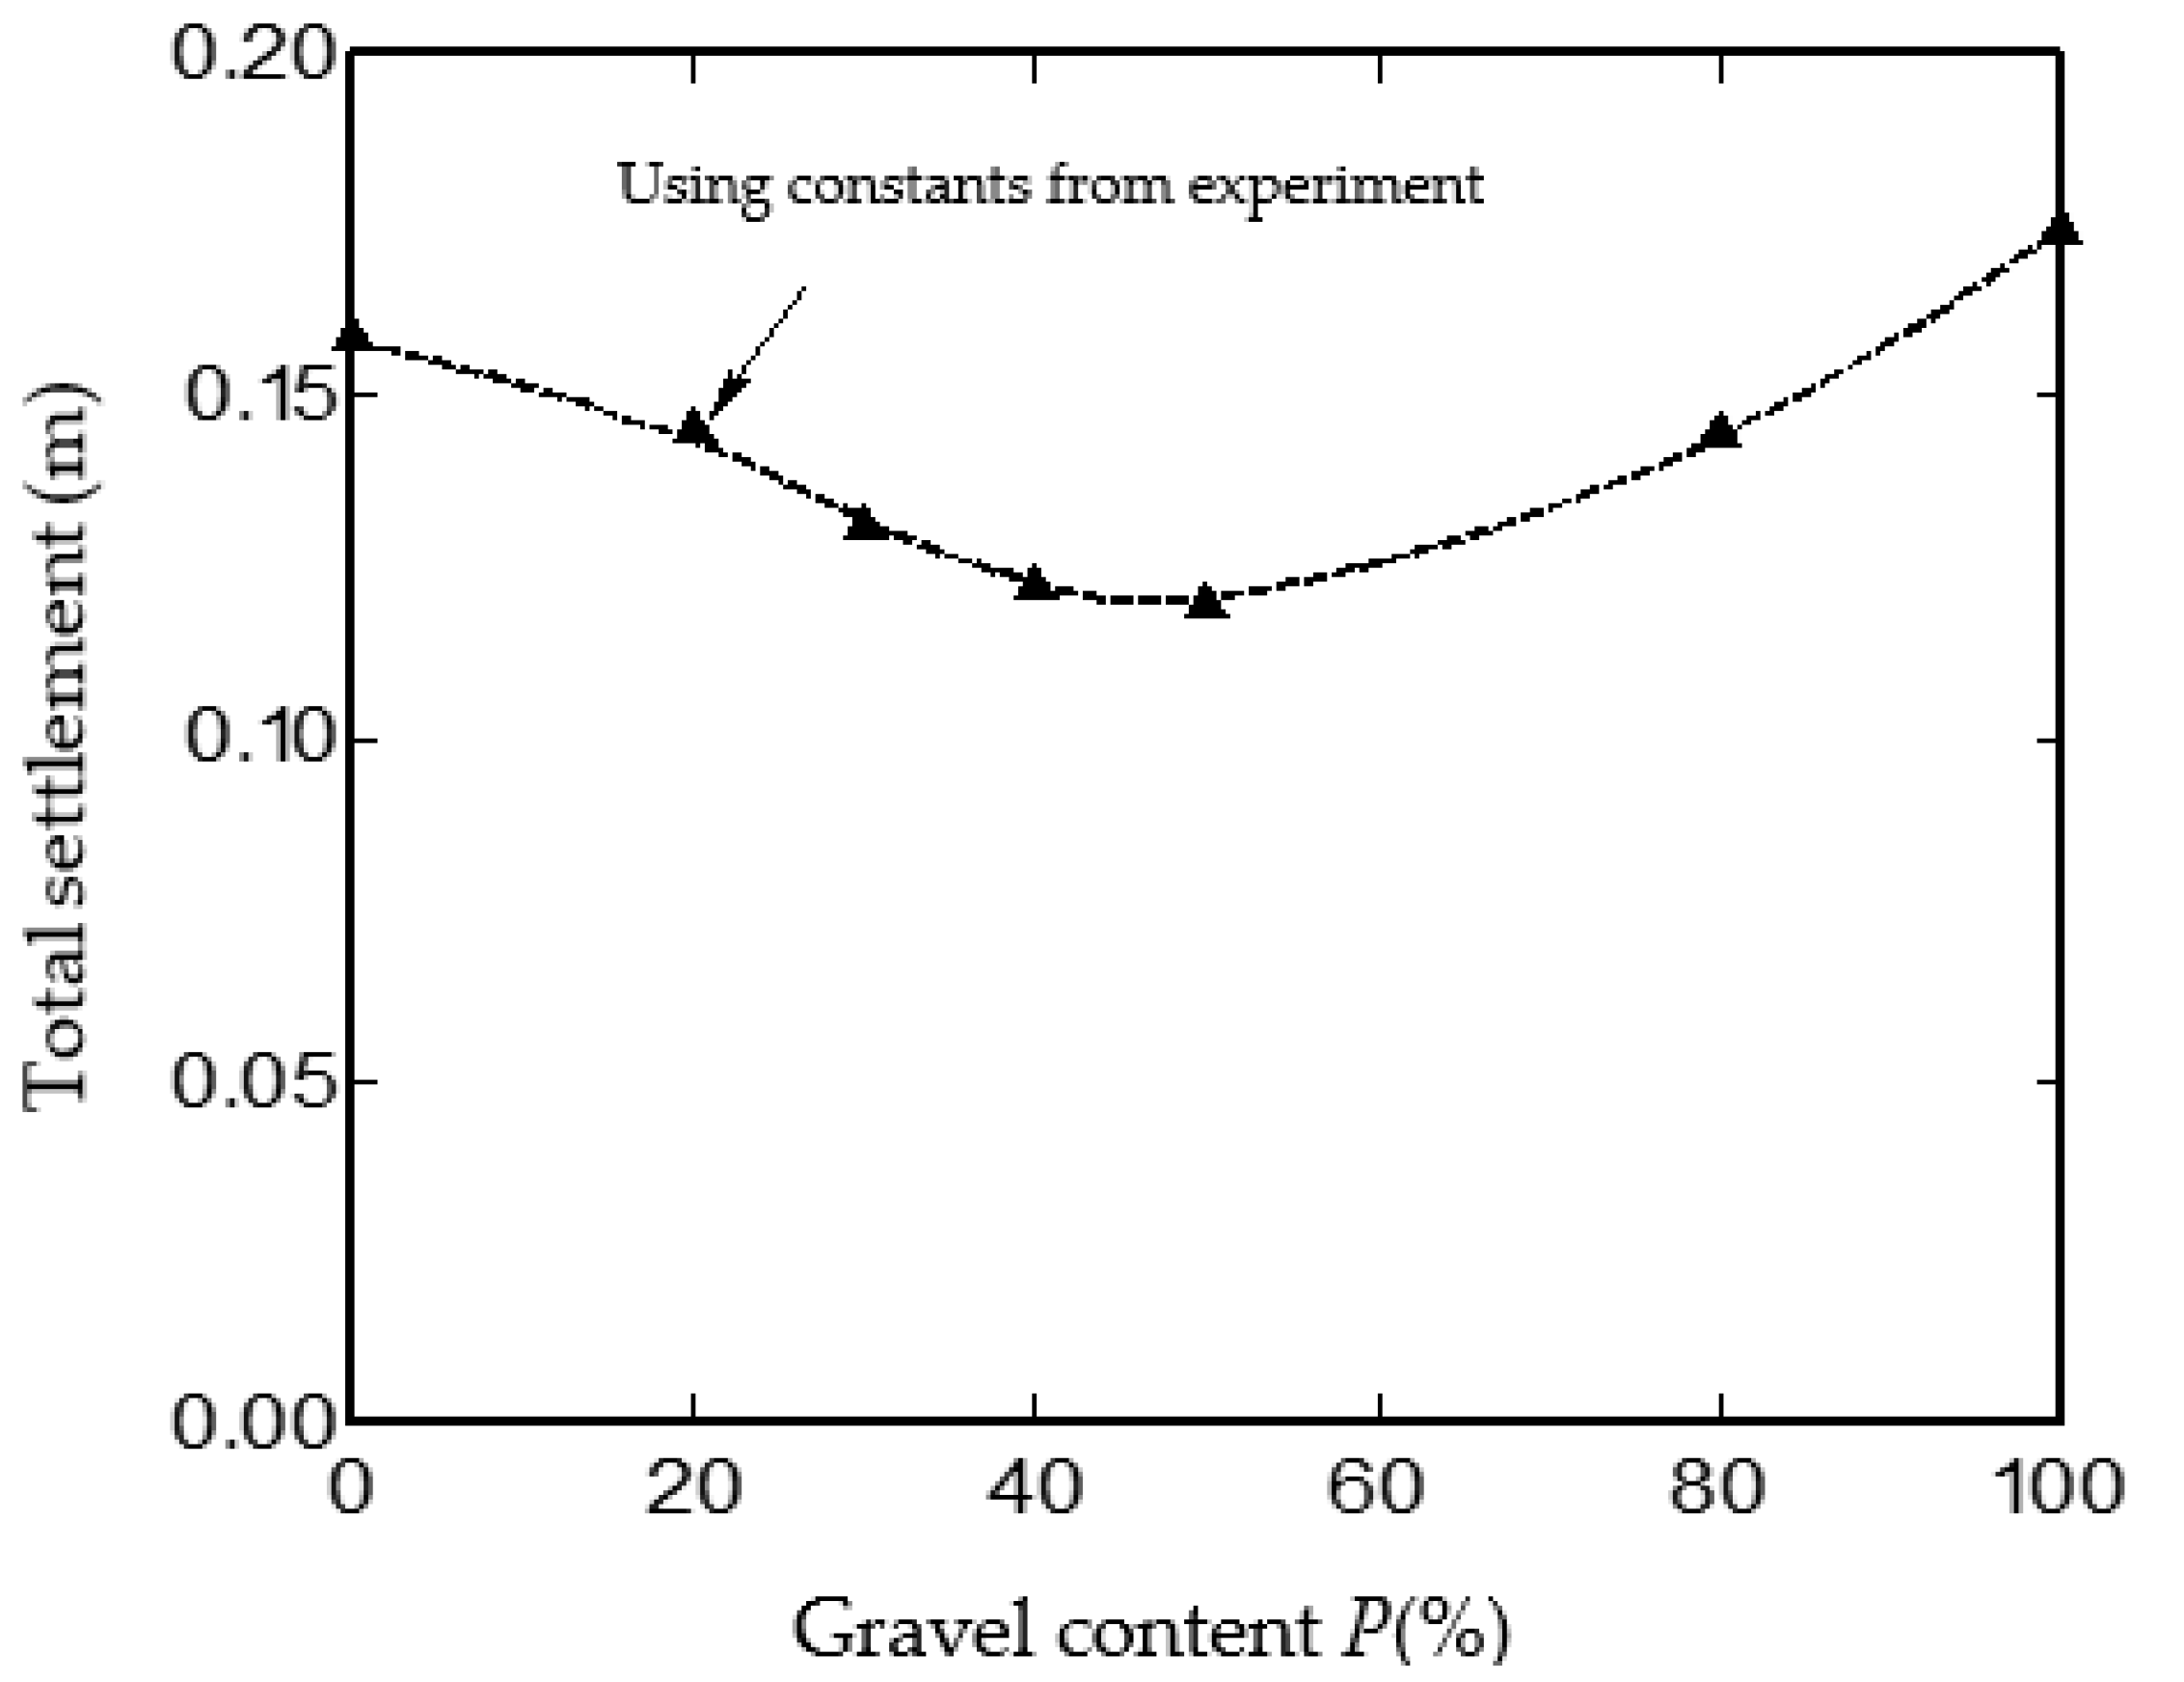
A comparison of the vertical displacement distribution with height at the center of the embankment between three different sets of material constants is shown in Figure 13. It can be seen that the results using the material constants corrected with the Walker–Holtz method underestimated the vertical displacement in comparison to the results using the material constants directly obtained from the one-dimensional compression test. In addition, it can be seen that the results of the analysis performed from the material constants corrected with the new method proposed in this study almost accurately reproduced the analysis results using the material constants obtained from the test. From the above results, it can be derived that the material constants obtained from the formula proposed in this study estimated the material constants obtained from the experiment almost accurately, and the same results were found for the total settlement at the end of construction, as shown in Figure 14. At low gravel content (P) in the range of 0% to 30%, the total settlement at the end of construction using the material constant corrected with the Walker–Holtz method was estimated almost exactly as the analysis result using the material constant directly obtained from the experiment. However, it can be seen that, at a gravel content of more than 30%, the results were significantly different from the analysis results using the directly obtained material constants. The total settlement from the material constant corrected using the new method showed almost the same value as the analysis result using the material constant directly obtained from the experiment for all values of P. From these results, it was revealed that the correction formula proposed in this study could estimate the material constants of the measured values almost accurately and that it could be sufficiently applied for the simulation of settlement in the embankment using the finite element analysis.
4. Conclusions
In this paper, the influence of gravel content on the compression properties of gravel–soil mixtures was examined, and a method to quantitatively assess such influence using the two-phase mixture theory was proposed. In addition, finite element analysis was performed to confirm the engineering applicability of the proposed formula. Based on the above discussions, the following are the major conclusions obtained:
- (a)
- The results reconfirmed earlier observations that the Walker–Holtz (1951) [14] equation was not applicable to gravel–sand mixtures with gravel content in excess of 40%;
- (b)
- For D-G-S compacted at specified water content and compaction energy, the dry density increased with increasing gravel content until P = 40%. With a further increase in P, the initial dry density decreased. Accordingly, it was confirmed that, for the condition adopted, there was a particular gravel content where the dry density was maximum and, at the same time, the compression index was also minimum;
- (c)
- Using the two-phase mixture theory, a method to quantitatively assess the influence of gravel content was proposed. With the obtained parameters, the estimated variation in initial dry density and compression parameters using the theory corresponded well with the actual values from the tests;
- (d)
- In addition, finite element analysis was performed to confirm the engineering applicability of the proposed formula, and as a result, it was revealed that it can be sufficiently applied in embankment simulation. In order to obtain more reliable results in the future, verification using various samples is required.
Author Contributions
Conceptualization, T.-G.H.; methodology, T.-G.H.; formal analysis, T.-G.H.; writing—original draft preparation, T.-G.H.; writing—review and editing, P.R.D., H.-S.K. and J.V.R.; supervision, H.-J.K.; funding acquisition, H.-S.K. All authors have read and agreed to the published version of the manuscript.
Funding
This research was funded by National Research Foundation of Korea (NRF), grant number: NRF2021R1A6A1A0304518511. The APC was funded by National Research Foundation of Korea (NRF).
Institutional Review Board Statement
Not applicable.
Informed Consent Statement
Not applicable.
Data Availability Statement
The data presented in this study are available on request from the corresponding author.
Acknowledgments
This research was supported by the Basic Science Research Program through the National Research Foundation of Korea (NRF), funded by the Ministry of Education.
Conflicts of Interest
The authors declare no conflict of interest.
References
- Ning, Y.; Huang, Q.; Shi, C.; Meng, Q. Numerical simulation study on compression characteristics of gravelly soil mixture based on soft servo method. Geofluids 2021, 2021, 9946628. [Google Scholar] [CrossRef]
- Horn, R.; Fleige, H. A method for assessing the impact of load on mechanical stability and on physical properties of soils. Soil Tillage Res. 2003, 73, 89–99. [Google Scholar] [CrossRef]
- Kaufmann, M.; Tobias, S.; Schulin, R. Development of the mechanical stability of a restored soil during the first 3 years of re-cultivation. Soil Tillage Res. 2009, 103, 127–136. [Google Scholar] [CrossRef]
- Dean, S.W.; Chinkulkijniwat, A.; Man-Koksung, E.; Uchaipichat, A.; Horpibulsuk, S. Compaction Characteristics of Non-Gravel and Gravelly Soils Using a Small Compaction Apparatus. J. ASTM Int. 2010, 7. [Google Scholar] [CrossRef] [Green Version]
- Brakensiek, D.; Rawls, W. Soil containing rock fragments: Effects on infiltration. Catena 1994, 23, 99–110. [Google Scholar] [CrossRef]
- Topp, G.C.; Reynolds, W.D.; Cook, F.J.; Kirby, J.M.; Carter, M.R. Physical attributes of soil quality. In Developments in Soil Science; Elsevier: Amsterdam, The Netherlands, 1997; Volume 25, pp. 21–58. [Google Scholar]
- Arvidsson, J.; Keller, T. Soil precompression stress: I. A survey of Swedish arable soils. Soil Tillage Res. 2004, 77, 85–95. [Google Scholar] [CrossRef]
- Poesen, J.; Lavee, H. Rock fragments in top soils: Significance and processes. Catena 1994, 23, 1–28. [Google Scholar] [CrossRef]
- Mitchell, J.K.; Soga, K. Fundamentals of Soil Behavior; John Wiley & Sons: New York, NY, USA, 2005; Volume 3. [Google Scholar]
- Batjes, N.H. A world dataset of derived soil properties by FAO?UNESCO soil unit for global modelling. Soil Use Manag. 1997, 13, 9–16. [Google Scholar] [CrossRef]
- Babalola, O.; Lal, R. Subsoil gravel horizon and maize root growth. Plant Soil 1977, 46, 337–346. [Google Scholar] [CrossRef]
- Xu, D.; Tang, Z.; Zhang, L. Interpretation of coarse effect in simple shear behavior of binary sand-gravel mixture by DEM with authentic particle shape. Constr. Build. Mater. 2018, 195, 292–304. [Google Scholar] [CrossRef]
- Xu, D.-S.; Tang, J.-Y.; Zou, Y.; Rui, R.; Liu, H.-B. Macro and micro investigation of gravel content on simple shear behavior of sand-gravel mixture. Constr. Build. Mater. 2019, 221, 730–744. [Google Scholar] [CrossRef]
- Chen, L.; Qiao, L.; Li, Q. Study on dynamic compaction characteristics of gravelly soils with crushing effect. Soil Dyn. Earthq. Eng. 2019, 120, 158–169. [Google Scholar] [CrossRef]
- Simoni, A.; Houlsby, G. The Direct Shear Strength and Dilatancy of Sand–gravel Mixtures. Geotech. Geol. Eng. 2006, 24, 523–549. [Google Scholar] [CrossRef]
- Walker, F.C.; Holtz, W.G. Control of embankment material by laboratory testing. Trans. Am. Soc. Civ. Eng. 1953, 118, 1–25. [Google Scholar] [CrossRef]
- Humphres, H.W. A method for controlling compaction of granular materials. Highw. Res. Board Bull. 1957, 159, 41–57. [Google Scholar]
- Hsu, T.S.; Saxena, S.K. A general formula for determining density of compacted soils with oversize panicles. Soils Found. 1991, 31, 91–96. [Google Scholar] [CrossRef] [Green Version]
- Schwab, H.H. A contribution to the examination of hydraulic stability of earth and rock. Filters Geotech. Hydraul. Eng. 1993, 1993, 307–308. [Google Scholar]
- Ham, T.-G.; Nakata, Y.; Orense, R.P.; Hyodo, M. Influence of Gravel on the Compression Characteristics of Decomposed Granite Soil. J. Geotech. Geoenviron. Eng. 2010, 136, 1574–1577. [Google Scholar] [CrossRef]
- Gutierrez, M. Mixture Theory Characterization and Modeling of Soil Mixtures. Geomech. Test. Modeling Simul. 2005. [Google Scholar] [CrossRef]
- Rücknagel, J.; Götze, P.; Hofmann, B.; Christen, O.; Marschall, K. The influence of soil gravel content on compaction be-haviour and pre-compression stress. Geoderma 2013, 209, 226–232. [Google Scholar] [CrossRef] [Green Version]
- Japanese Geotechnical Society. Soil Test Procedures and Commentaries, 1st ed.; JGS: Tokyo, Japan, 2000. (In Japanese) [Google Scholar]
- Mori, Y.; Uchita, Y.; Nakano, Y.; Yoshikoshi, H.; Ishiguro, T.; Ohta, H. Compressibility and Material Constants Of In-Situ Compacted Rock Material Under High Overburden Pressure. Doboku Gakkai Ronbunshu 2001, 2001, 233–247. [Google Scholar] [CrossRef] [Green Version]
- Sekiguchi, H.; Ohta, H. Induced anisotropy and time dependency in clay. In Proceedings of the 9th Conference of JCSMFE, Tokyo, Japan, 5–6 April 1997; pp. 229–239. [Google Scholar]
- Matsumoto, N.; Watanabe, K.; Ogawa, Y. Triaxial compression comparative test focusing on the maximum particle size of rock material. Civ. Eng. Data 1982, 24, 359–364. [Google Scholar]
- Matsuoka, H.; Liu, S.; Tokuyasu, S.; Kudo, A.; Nishikata, U.; Yasuhara, T. In-situ simple direct shear test for large grain size coarse grain materials such as rock fill materials. Soil Mech. Found. Eng. 1999, 47, 25–28. [Google Scholar]
Figure 1.
Limitation of Walker and Holtz (1951) [16] equation as presented by Ham et al. (2010) [20].

Figure 2.
Large 1D compression tester.

Figure 3.
Grain-size distribution curves for samples used in 1D compression tests conducted by Ham et al. (2010) [20].
Figure 3.
Grain-size distribution curves for samples used in 1D compression tests conducted by Ham et al. (2010) [20].

Figure 4.
Relationship between various values of Rm between gravel content and initial dry density.

Figure 5.
Compression characteristics of sand and gravel components of D-G-S.

Figure 6.
Comparison between measured and predicted compression curves for P = 20%, 40%, and 80% using an Rm of 0.85.
Figure 6.
Comparison between measured and predicted compression curves for P = 20%, 40%, and 80% using an Rm of 0.85.

Figure 7.
Relationship between gravel content and material constant: (a) compression index (λ); (b) swelling index (κ).
Figure 7.
Relationship between gravel content and material constant: (a) compression index (λ); (b) swelling index (κ).


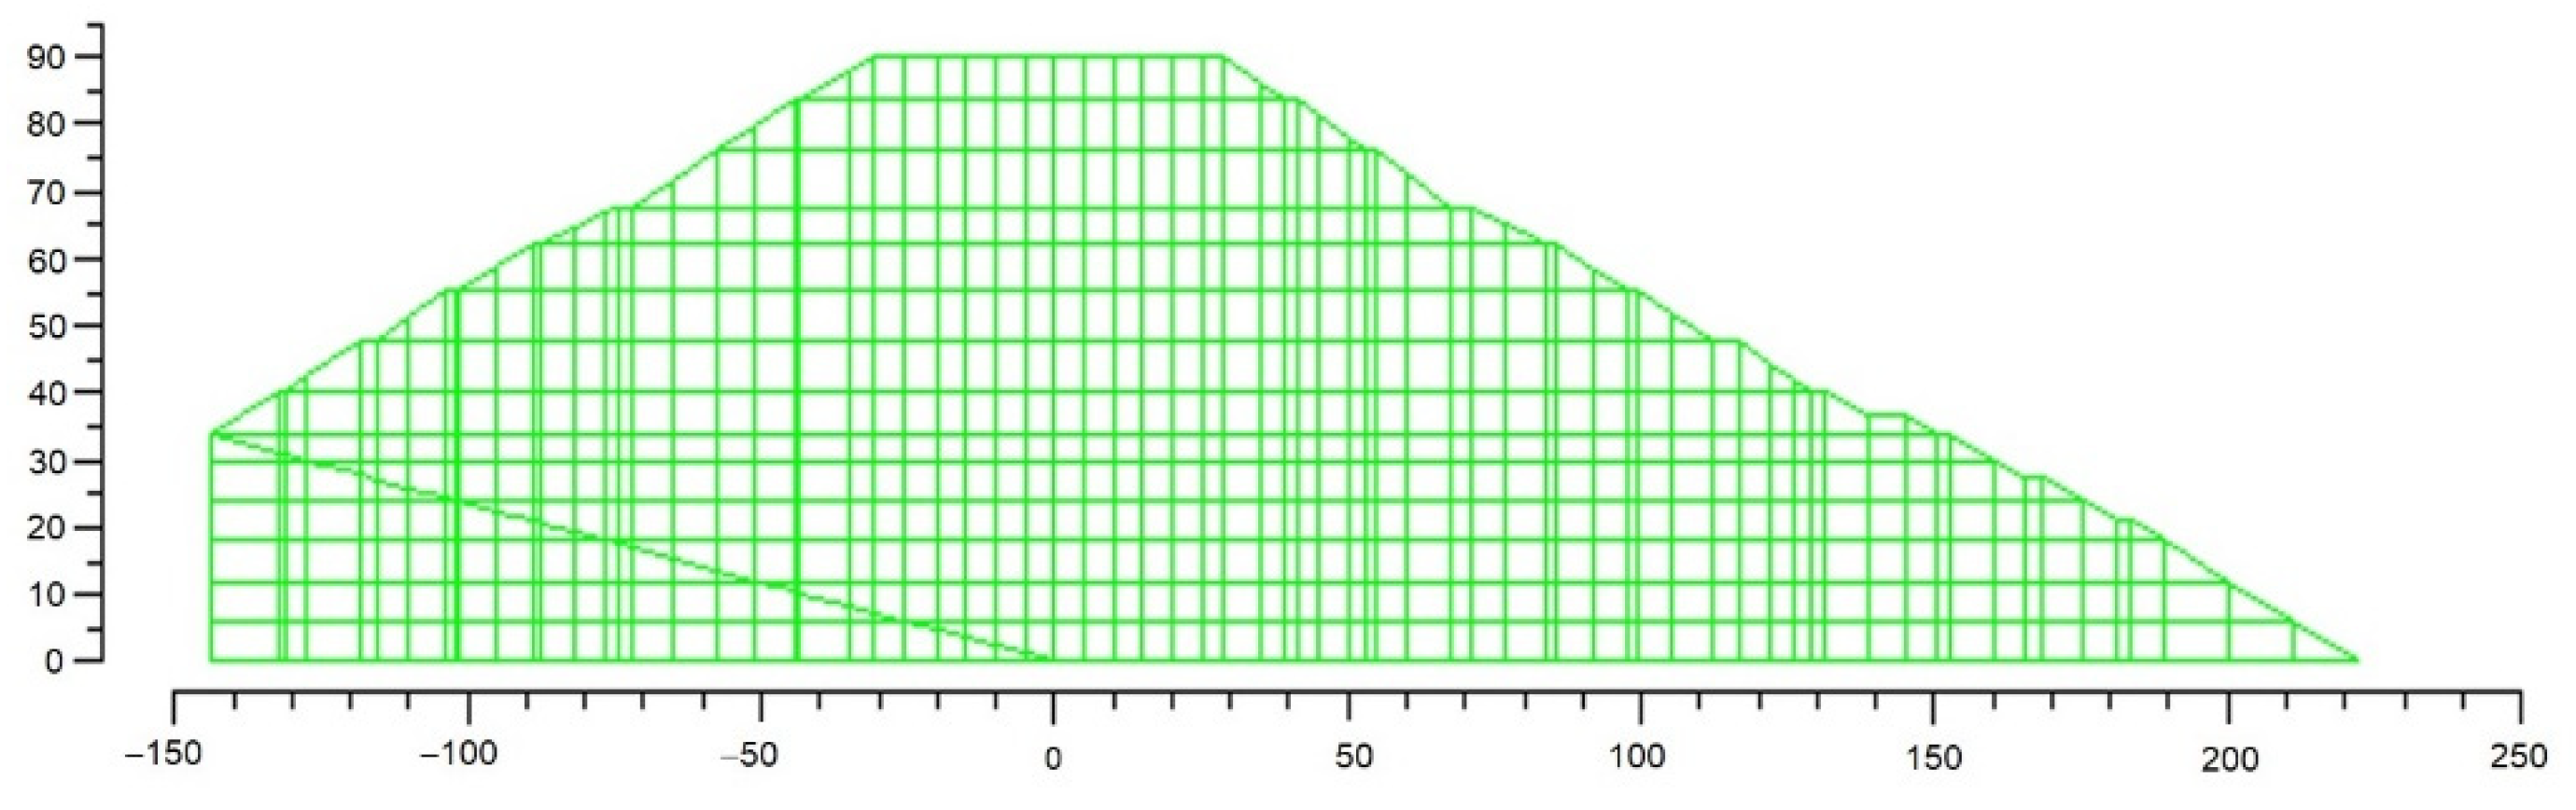
Figure 8.
Cross-sectional view of the 2nd Tomei Expressway embankment in the Kasesawa area in Japan.
Figure 8.
Cross-sectional view of the 2nd Tomei Expressway embankment in the Kasesawa area in Japan.

Figure 9.
Cross-sectional view of the embankment used in the finite element analysis.

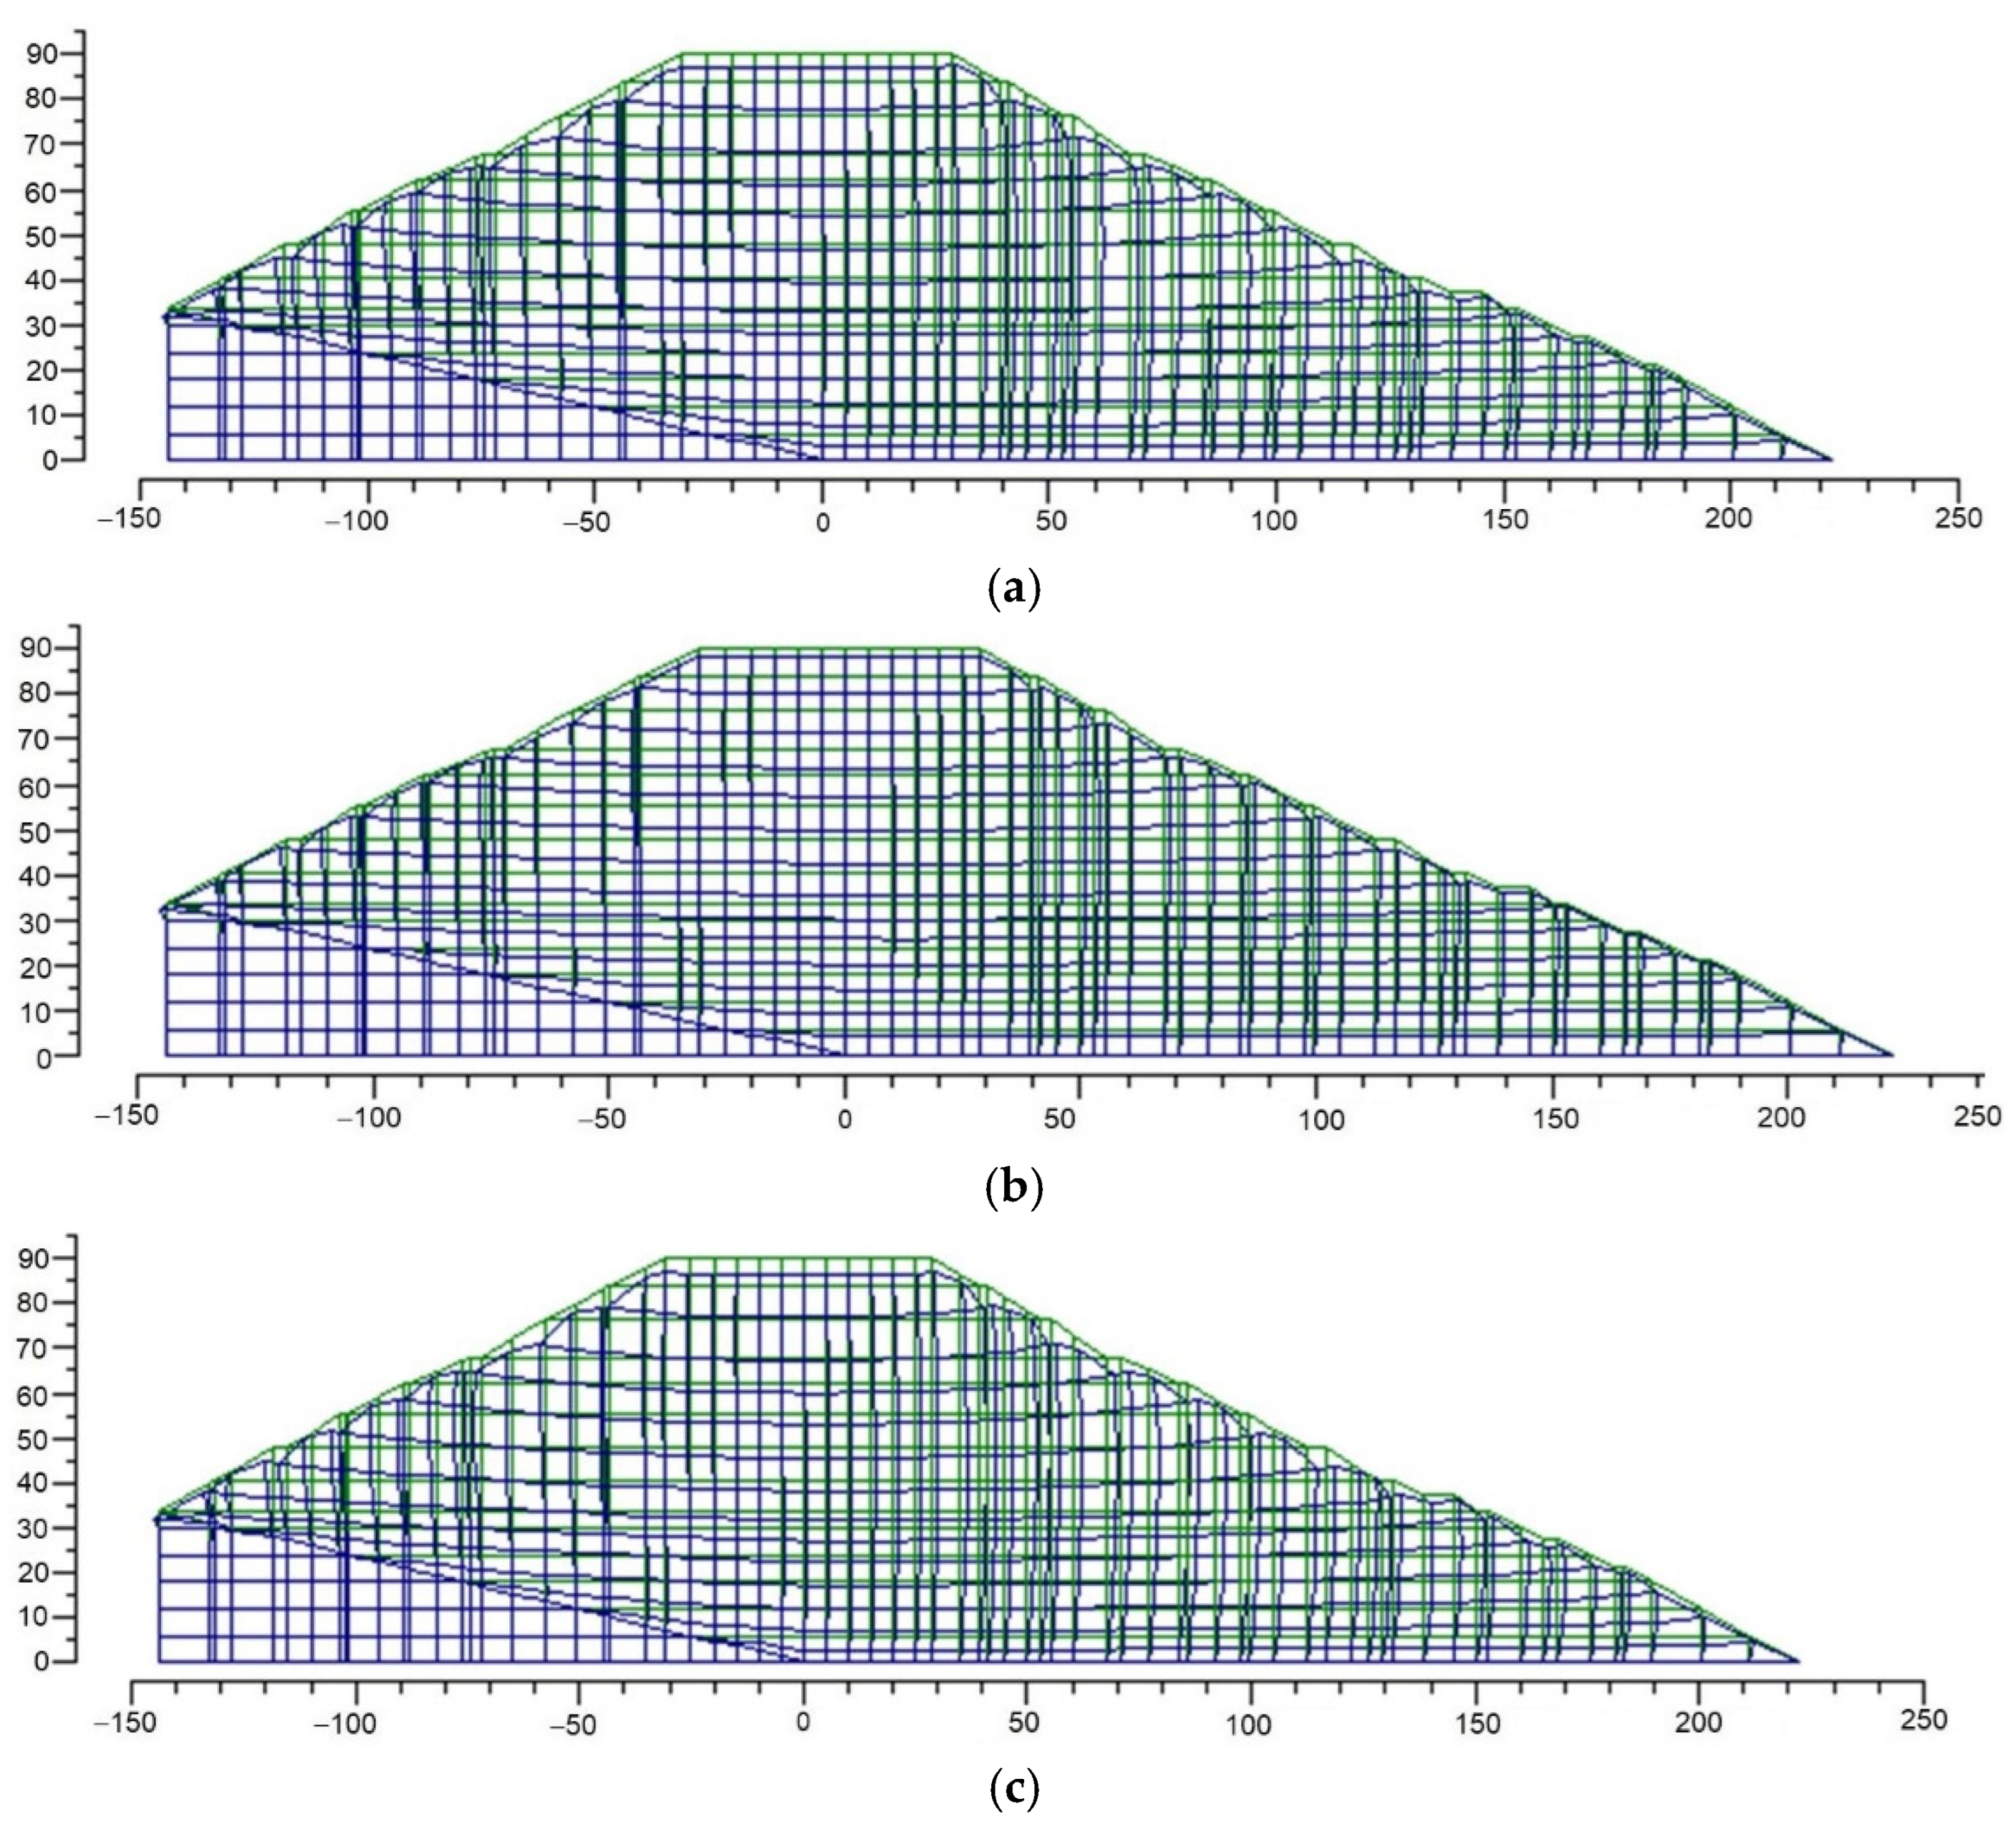
Figure 10.
Deformation of embankment at various gravel contents using material constants obtained from one-dimensional compression test (displacements scaled up 25 times): (a) P = 0%; (b) P = 20%; (c) P = 30%; (d) P = 40%; (e) P = 50%; (f) P = 80%; (g) P = 100%.
Figure 10.
Deformation of embankment at various gravel contents using material constants obtained from one-dimensional compression test (displacements scaled up 25 times): (a) P = 0%; (b) P = 20%; (c) P = 30%; (d) P = 40%; (e) P = 50%; (f) P = 80%; (g) P = 100%.


Figure 11.
Total settlement of the embankment after completion using the constants obtained from the one-dimensional compression test.
Figure 11.
Total settlement of the embankment after completion using the constants obtained from the one-dimensional compression test.

Figure 12.
Deformation of embankment for gravel content (P) = 50 (displacements scaled up 25 times): (a) analysis results using material constants obtained from one-dimensional compression test (experimental result); (b) analysis results using material constants corrected using the Walker–Holtz method (Walker–Holtz method); (c) analysis results using material constants corrected with the formula proposed in this study (new method).

Figure 13.
Comparison of the vertical displacement distribution with height at the center of the embankment between three different sets of material constants.
Figure 13.
Comparison of the vertical displacement distribution with height at the center of the embankment between three different sets of material constants.

Figure 14.
Total settlement after construction of embankment.


Table 1.
Physical properties of soils used by Ham et al. (2010) [20].
Table 1.
Physical properties of soils used by Ham et al. (2010) [20].
| Specimen | d50 (mm) | Fines Content, Fc (%) | Uniformity Coefficient, Cu | Curvature Coefficient, Cc | Ge(P) |
|---|---|---|---|---|---|
| P(0%) | 0.67 | 4.78 | 7.11 | 1.16 | 2.650 |
| P(20%) | 1.00 | 3.83 | 8.71 | 1.20 | 2.682 |
| P(30%) | 1.18 | 3.35 | 9.70 | 1.31 | 2.678 |
| P(40%) | 1.40 | 2.87 | 10.90 | 1.22 | 2.674 |
| P(50%) | 2.00 | 2.39 | 9.48 | 1.52 | 2.670 |
| P(80%) | 2.18 | 0.95 | 3.84 | 2.89 | 2.685 |
| P(100%) | 2.38 | 0 | 1.35 | 0.82 | 2.690 |
Table 2.
Void ratio and dry density of gravel-mixed sample.
| Specimen | Ge(P) | e(P) | ρd(P) (g/cm3) |
|---|---|---|---|
| P(0%) | 2.650 | 0.661 | 1.616 |
| P(20%) | 2.682 | 0.588 | 1.686 |
| P(30%) | 2.678 | 0.570 | 1.703 |
| P(40%) | 2.674 | 0.554 | 1.718 |
| P(50%) | 2.670 | 0.574 | 1.695 |
| P(80%) | 2.685 | 0.712 | 1.552 |
| P(100%) | 2.690 | 0.835 | 1.444 |
Table 3.
Characteristics of the embankment model used in the finite element analysis.
| Characteristic | Description |
|---|---|
| Material model | Sekiguchi–Ohta model (1977) |
| Embankment height | 91.9 m |
| Ground inclination angle | To the center of the slope (0°) |
| Embankment slope | 1:1.8 |
| Embankment material | Shimonoseki D-G-S (Granular material) |
Table 4.
Parameters used for the finite element method.
| Parameters | Formula |
|---|---|
| Marginal state index, M | |
| Dilatancy coefficient, D | |
| Poisson’s ratio, ν | 0.3 |
| Secondary consolidation coefficient |
Publisher’s Note: MDPI stays neutral with regard to jurisdictional claims in published maps and institutional affiliations. |
© 2022 by the authors. Licensee MDPI, Basel, Switzerland. This article is an open access article distributed under the terms and conditions of the Creative Commons Attribution (CC BY) license (https://creativecommons.org/licenses/by/4.0/).
Share and Cite
MDPI and ACS Style
Kim, H.-J.; Ham, T.-G.; Dinoy, P.R.; Reyes, J.V.; Kim, H.-S. Numerical Application of a Proposed Material Constant Estimation Method Based on Ideal Mixing Theory. Appl. Sci. 2022, 12, 6528. https://doi.org/10.3390/app12136528
AMA Style
Kim H-J, Ham T-G, Dinoy PR, Reyes JV, Kim H-S. Numerical Application of a Proposed Material Constant Estimation Method Based on Ideal Mixing Theory. Applied Sciences. 2022; 12(13):6528. https://doi.org/10.3390/app12136528
Chicago/Turabian StyleKim, Hyeong-Joo, Tae-Gew Ham, Peter Rey Dinoy, James Vincent Reyes, and Hyeong-Soo Kim. 2022. "Numerical Application of a Proposed Material Constant Estimation Method Based on Ideal Mixing Theory" Applied Sciences 12, no. 13: 6528. https://doi.org/10.3390/app12136528
Note that from the first issue of 2016, this journal uses article numbers instead of page numbers. See further details here.