
Airborne and Dermal Collection Methods of Gunshot Residue for Toxicity Studies


1
Department of BioMolecular Sciences, University of Mississippi, University, MS 38677, USA
2
Department of Natural Sciences, Albany State University, Albany, GA 31707, USA
*
Author to whom correspondence should be addressed.
Appl. Sci. 2022, 12(9), 4423; https://doi.org/10.3390/app12094423
Submission received: 3 March 2022
/
Revised: 22 March 2022
/
Accepted: 26 April 2022
/
Published: 27 April 2022
(This article belongs to the Special Issue Shooting and Military Activities: A Holistic Approach from Source, Contamination and Remediation)
Abstract
:Gunshot residue (GSR) has potential negative health effects on humans as a result of inhalation and dermal exposure to the chemical and physical characteristics of GSR such as Pb, Sb, Ba, nitrocellulose, nitroglycerine, and particulate size fraction. Filter (size selective) and double-sided tape (non-size selective) samples collected airborne GSR during single and triple firing of a 0.22 caliber revolver. Dermal exposures were considered using hand swabs and de-leading wipes, designed to remove the heavy metals. The samples underwent analysis to investigate physical (morphology, size distribution, zeta potential), chemical (black carbon and element concentrations), and potential to induce oxidative stress (oxidative potential via the dithiothreitol (DTT) assay). All sample types detected Pb concentrations higher than national ambient air standards. The de-leading wipes reduced the metal content on the hands of the shooter for Pb (15.57 ± 12.99 ppb and 3.13 ± 4.95 ppb). Filter samples provided health relevant data for airborne PM2.5 for all of the analysis methods except for GSR morphology. This work identified collection and analysis methods for GSR in an outdoor setting, providing protocols and considerations for future toxicological studies related to inhalation and dermal exposures to particulate GSR. Future studies should investigate the influence of meteorological factors on GSR exposure in an outdoor setting.
1. Introduction
Recreational and professional use of firearms is common throughout the world, with an estimated 11.5 million people in the United States participating in recreational hunting and 32 million firearm users [1]. Gunshot residue (GSR) is the organic and inorganic components deposited in the air and surrounding environment after the discharge of a firearm [2]. Common elements considered tracers of GSR include lead (Pb), barium (Ba), and antimony (Sb). Other elements found in GSR include aluminum (Al), sulfur (S), calcium (Ca), zinc (Zn), copper (Cu), titanium (Ti), and silicon (Si) [3]. Particles of various sizes are present in GSR following the combustion of the primer and fractionation of the projectile or barrel of the firearm [4]. In addition to elemental components of GSR, recent work has focused on the detection and analysis of organic GSR to establish a more complete chemical profile [5,6,7,8].
Traditionally, the study of GSR has been related to applications for crime investigation. This research has included determining the air suspension time and deposition area of GSR in indoor, controlled environments [9,10,11]. Previous investigations primarily used carbon-based adhesives on stubs [4,12,13], but other methods look at nasal mucus [14,15,16]. Different instrumentation coupled with mass spectrometry have been used to confirm GSR [7,17,18,19]. While this previous literature has been useful for forensic purposes, there is a need to understand the behavior of GSR particles in outdoor settings as well as improve the understanding of the human exposure and environmental implications of the discharge of firearms [20].
Research into the health effects of GSR is a growing area of interest with firearm at military firing ranges [21,22]. Some of the common elements found in GSR have known health relevance such as Pb [23,24,25] and Ba [26,27]. Recent studies investigated the in vitro toxicity of GSR [28] and through use of a lung deposition model [29]. Oxidative stress and inflammation were increased following exposure to GSR in two epithelial airway cell lines [28]. Another area of concern related to GSR is the environmental impact as the dispersion of different sizes of GSR particles may vary. The current literature available focuses on the impact of Pb deposited into the soil through bullet fragments [30,31,32], but a subset of studies detected increased concentration of metals in the soil near the firing line of different ranges [33,34], presumably from the settling of airborne GSR particles. Combined, these studies show the necessity to continue researching the environmental and human health impacts of GSR.
Notably, the available research is limited to a few studies analyzing GSR particles in an outdoor setting [29] and detecting fine particulates that would be respirable to the shooter and bystanders [28,29,35]. The determination of size deposition of GSR is important to understand due to the health effects related to different fractions. Fine particulate matter (PM2.5) can directly enter the lungs due to the small size of the particles, being less than 2.5 microns in aerodynamic diameter [36]. Particle size distribution of organic and inorganic components from GSR is a key factor in the determination of health and environmental effects related to PM2.5. A limited number of studies observed the deposition and particle size in an indoor or controlled setting [10,11,28,29,35,37] but there is a lack of research, particularly in outdoor settings, for characterizing PM2.5 from GSR.
PM2.5 is composed of a number of health-relevant components: including the aforementioned inorganic and organic species in GSR as well as black carbon which has known health effects [38,39]. Black carbon is a component of PM2.5 that is emitted during combustion reactions from a number of sources such as biomass burning, fuel exhaust, and industry [38,40]. Additionally, one study identified the presence of carcinogenic polycyclic aromatic hydrocarbons (PAHs) in lead-free GSR ammunition [41]. When considering inhalation or other exposure routes to GSR, the health effects are less investigated with studies primarily focused on blood Pb levels in firearm users [23,24,25]. One hypothesized mechanism for health effects following outdoor PM2.5 exposures is oxidative stress. Oxidative stress is the imbalance of antioxidants and free radicals that leads to the accumulation of reactive oxygen species (ROS) and leads to inflammation in cells and tissues [42]. Oxidative potential is a proxy for oxidative stress as it measures the ability of particulate matter to oxidize various molecules to produce ROS; however, it is understudied for particulates collected from firearm discharge.
In this study, the dithiothreitol (DTT) assay was used to measure the oxidative potential of the GSR samples. Here, we test GSR sample collection and analysis methods to determine optimal procedures for assessing the exposure to GSR particles through airborne and dermal contact. Different size fractions of airborne particles and hand swabs from a shooter were collected and analyzed following one or three shots from a 0.22 caliber revolver. Particle morphology, chemical composition, and oxidative potential were determined for all samples. In contrast to previous work, this study investigates the ability to detect and analyze GSR ≤ 2.5 microns, a fraction of particular relevance to human health. This work outlines potential collection and analysis methods for airborne and dermal exposure to GSR in an outdoor setting. We begin to propose procedures to fill the substantial gaps in GSR research that exist in environmental and human health exposure assessments.
2. Materials and Methods
2.1. Sampling Procedure
Samples were collected on two days (11 August 2020 and 3 April 2021), in quadruplicate to account for potential variability between sample collection day and season with one run collected in August and three runs in April. The revolver used was a Harrington & Richardson (H & R) Model 949 revolver chambered in a 0.22 long rifle (22 LR) with a nine cartridge capacity. Remington Viper rimfire cartridges with a bullet weight of 36 grains were used. Two collection scenarios occurred: (1) a single shot fired and (2) three shots fired in rapid succession, with 10 min between each collection. For the triple shot scenario, the revolver was fired rapidly three times with one to three seconds between each shot. Between repeated collections of single and triple firings (n = 4), there was at least 20 min to allow for the deposition of GSR from the sampling area based on a number of previous studies in this research area [9,10,11,37,43,44]. Identical procedures outlined in the Collection section were used for both the single and triple shot scenarios. Background samples for each collection method were taken prior to the discharge of the firearm.
2.2. Collection
During each sample collection multiple sample matrices were used for size-selective (filters) and non-size-selective (double-sided tape, hand swabs) methods.
2.2.1. Filters
The size-selective air sampling method was collection of PM2.5 onto 37 mm filters made of borosilicate glass microfibers reinforced with woven glass cloth and bonded with polytetrafluoroethylene (PTFE) (Pall Corporation). An active air sampler was used for collection (Access Sensor Technologies, Fort Collins, CO, USA, Ultrasonic Personal Air Sampler, UPAS) [45]. The sampler was attached to the right arm of the shooter and active during the discharge of the firearm and for approximately one minute after discharge, at a flow rate of 1 L/min. A background sample was collected at the sample site for 30 min prior to the first shot on each sampling day. The sample site was an isolated private firing range with no firearm use at least a day before each sampling period. No alternative contamination sources were present with the closest paved road being greater than 5 miles away from the range. New filters were placed into the UPAS after each collection (totaling 4 single shot and 4 triple shot filters collected).
2.2.2. Double-Sided Tape (DST)
For the non-size-selective collection of airborne GSR, double-sided tape (DST) near the firearm was used. Prior to firearm discharge, two pieces of carbon-based adhesive DST (Scotch®, 3M, St. Paul, MN, USA) collected on aluminum stubs were placed perpendicular to the barrel of the 0.22 caliber revolver, two feet in front of and one foot to the right of the barrel. New DST was set out in between each shooting scenario and immediately stored in airtight containers following collection. One of the DST pieces was sent for analysis with a field-emission scanning electron microscope with an energy dispersive X-ray spectrometer (FE-SEM/EDS), while the other DST piece was removed from the aluminum stub and underwent extraction for elemental analysis and DTT analysis (described in detail below). Blank samples were collected prior to the discharge of the firearm by exposing the tape to ambient air for five minutes.
2.2.3. Hand Swabs and De-Leading Wipes
In addition to the airborne samples, dermal samples were collected from the shooter using hand swabs, individually packaged in 70% isopropyl alcohol (Med Pride®, Hackensack, NJ, USA). The hand swab towelettes were wiped evenly over the front and back of both hands for approximately one minute before and after firearm discharge. Commercially available de-leading wipes that were advertised to remove heavy metals such as Pb, Ni, Cd, As, Ag, Hg, Cr, and Zn from hands or other surfaces (D•Wipe® Towels by ESCA Tech Inc., Milwaukee, WI, USA) were also used with identical procedures to the hand swabs. After each shooting scenario, a hand swab was used followed by a de-leading wipe and finally another hand swab. This design allowed for the collection of blanks and samples after shooting and after the use of a de-leading wipe. The de-leading wipes were collected and ¼ of the wipe was cut with ceramic scissors and stored at 4 °C until subsequent analysis. Blank hand swabs and de-leading wipes were taken on the shooter’s hands for blank correction.
2.3. Sample Preparation
Non-destructive analyses conducted directly on the sampling material preceded sample extraction and is described below (i.e., FE-SEM/EDS, black carbon).
All samples were extracted using sonication in methanol for 60 min at 60 Hz (Barnson Ultrasonics Corporation, Brookfield, CT, USA). The filters and hand swabs were extracted in 8 mL of methanol in 15 mL tubes while the DST and de-leading wipes were extracted in 20 mL of methanol in 50 mL tubes. Following sonication, each sample was rinsed with methanol to collect any residual sample and 300 µL aliquots were collected for oxidative potential analysis. The remaining sample was dried via nitrogen gas blowdown (Organomation Associates N-Evap 111 Nitrogen Evaporator, Berlin, MA, USA) and resuspended in 8 mL of deionized (DI) water, sonicated for 10 min, and vortexed for 10 s at 1500 rpm. A 1 mL aliquot of these solutions was removed for dynamic light scattering (DLS) analysis. The remaining samples were stored at 4 °C for elemental analysis.
2.4. Analysis
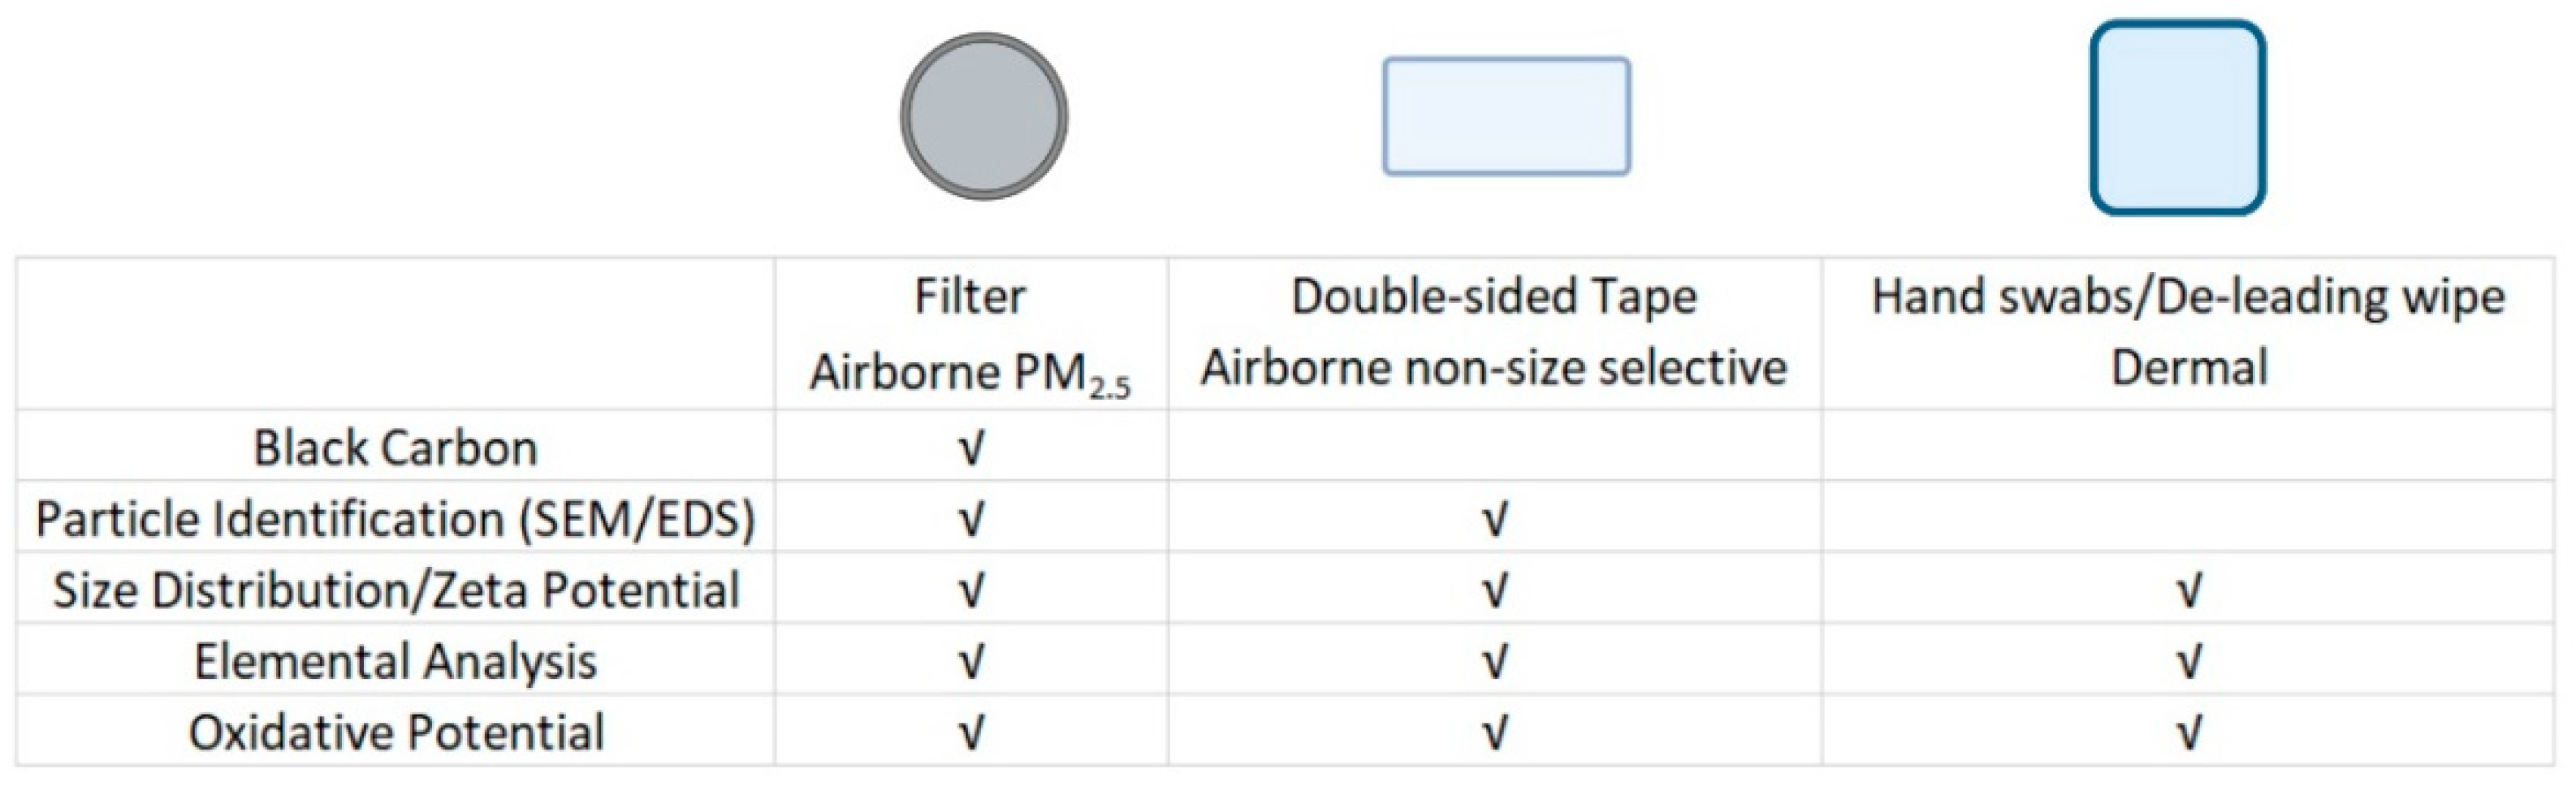
Multiple analysis methods were dependent on the sample collection medium. Analysis methods with specific sample types that underwent the analysis are detailed in Figure 1.
2.4.1. FE-SEM/EDS (Filters and DST)
A JSM-7200 FLV field-emission scanning electron microscope with an energy dispersive X-ray spectrometer (FE-SEM/EDS, Peabody, MA, USA) with a gold sputter coating was used for analysis of samples and controls at several magnifications (100×, 500×, 1000×, and 5000×). FE-SEM/EDS analysis was performed on a portion of the collected filters (5 × 5 mm section) and DST strips for each shooting scenario by the Microscopy and Imaging Center at the University of Mississippi. The stored DST samples were collected directly on top of aluminum stubs and thus additional preparation was not needed. Filter portions were cut using ceramic scissors following black carbon analysis on all blanks and samples.
2.4.2. Dynamic Light Scattering (All Samples)
Size distribution and zeta potential were determined using a Malvern nanoseries zetasizer (United Kingdom) for all samples and controls. Aqueous 1 mL extracted samples were placed into appropriate cuvettes for size distribution and zeta potential analysis, run in triplicate. One-eighth of the original sample was used for this analysis. The data analysis and sample comparisons were completed using the Malvern zetasizer software.
2.4.3. Black Carbon (Filters Only)
Prior to extraction all 37 mm filters were analyzed using a Magee OT21 Sootscan instrument (Magee Scientific, Berkeley, CA, USA) set at 880 nm to measure black carbon concentrations. The absorbance between blank and collected filters were compared. All sample filters were analyzed (in triplicate) alongside the blank filter collected at the firing range. The attenuation measurements from the instrument were converted to black carbon concentrations using precise sampler runtimes and flowrates.
2.4.4. Elemental Analysis (All Samples)
Aliquots of all samples and controls underwent Inductively Coupled Plasma Mass Spectrometry (Thermo Fisher Element XR ICP-MS, Waltham, MA, USA) for elemental quantification of Ag, Ba, Ca, Cd, Ce, Co, Cr, Cs, Cu, Fe, Ga, Mn, Ni, P, Pb, Sr, Tl, U, V, and Zn. The calibration curves were generated by Multielement Calibration Standard Solution 2A (Spex Certiprep), and method accuracy was confirmed by the analyzing NIST certified standard reference material 1640a “Trace Elements in Water” as previously described in detail [46]. For the elements representative of GSR, the percent recovery was within ±10% from the actual value of the standard reference material 1640a. The operational parameters of the instrument are described in Table S1. All samples were blank corrected except for the de-leading wipe samples. Prior elemental analysis, the 8 mL samples were acidified with 166 µL of HNO3 and 134 µL of internal standard was added for quality assurance. Based on instrumental quality assurance standards, the number of samples for each group ranged from 3 to 4, except for the first de-leading wipe used which was in duplicate.
2.4.5. Oxidative Potential (All Samples)
Oxidative potential was measured for the samples and controls using the acellular dithiothreitol (DTT) assay in a 96-well plate. The assay was performed as previously described [47] with the following modifications to adjust for measurement of the different sample types. The samples were run at different volumes to determine the optimal volume for each sample type. The final volumes used were: 20 µL for filters and hand swabs and 15 µL for DST. The volume of methanol added into the DTT calibration curve was matched for each sample type. DTT consumption was measured at 412 nm and determined by using sample specific calibration curves followed by blank correction of the samples. All of the calibration curves, controls, and samples were run in triplicate on the 96-well plate.
2.4.6. Statistical Analysis
All statistical analysis was performed using Excel, SigmaPlot, and R version 4.1.1 with R studio software version 4.1.1717 [48]. Figure graphing was done using the “ggplot2” R package [49]. Data are reported as averages with standard deviation (sd) or standard error means (SEM) where noted. Following blank corrections comparisons between single and triple shots scenarios were made using the Welch’s t-test in SigmaPlot. The Welch’s t-test compared the scenarios for black carbon, elemental concentrations, and oxidative potential analysis using SigmaPlot. Multiple group analysis for hand swab samples were performed using a one-way analysis of variance (ANOVA). Correlations between oxidative potential chemical components were made using Spearman’s Correlation in SigmaPlot software. Statistical significance was defined as <0.05 unless otherwise noted.
3. Results/Discussion
3.1. GSR Particle Identification (Filter and DST)
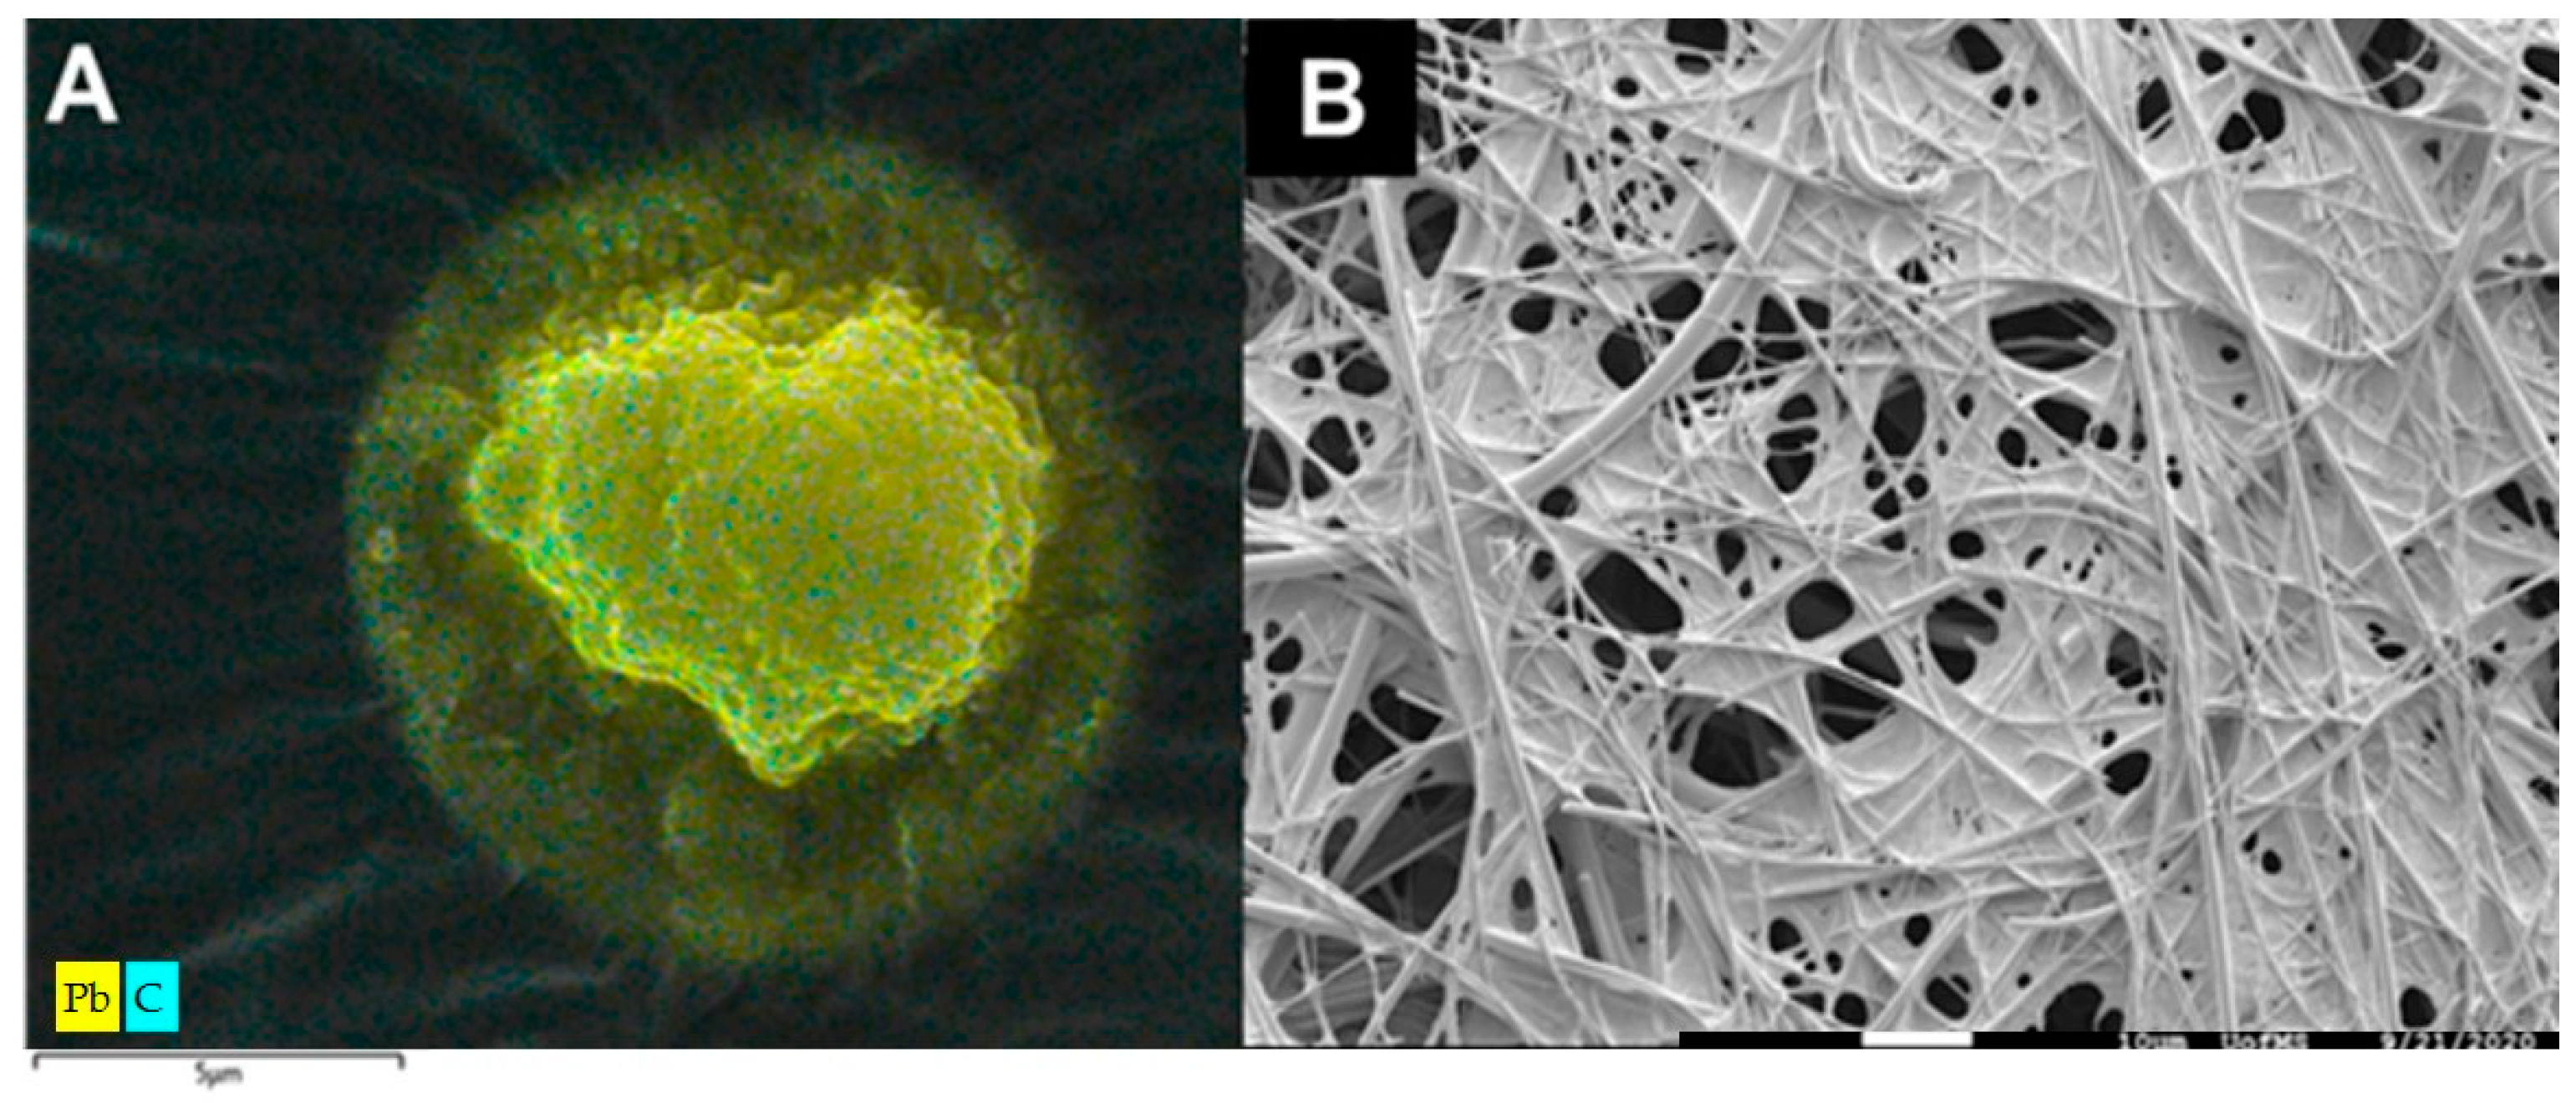
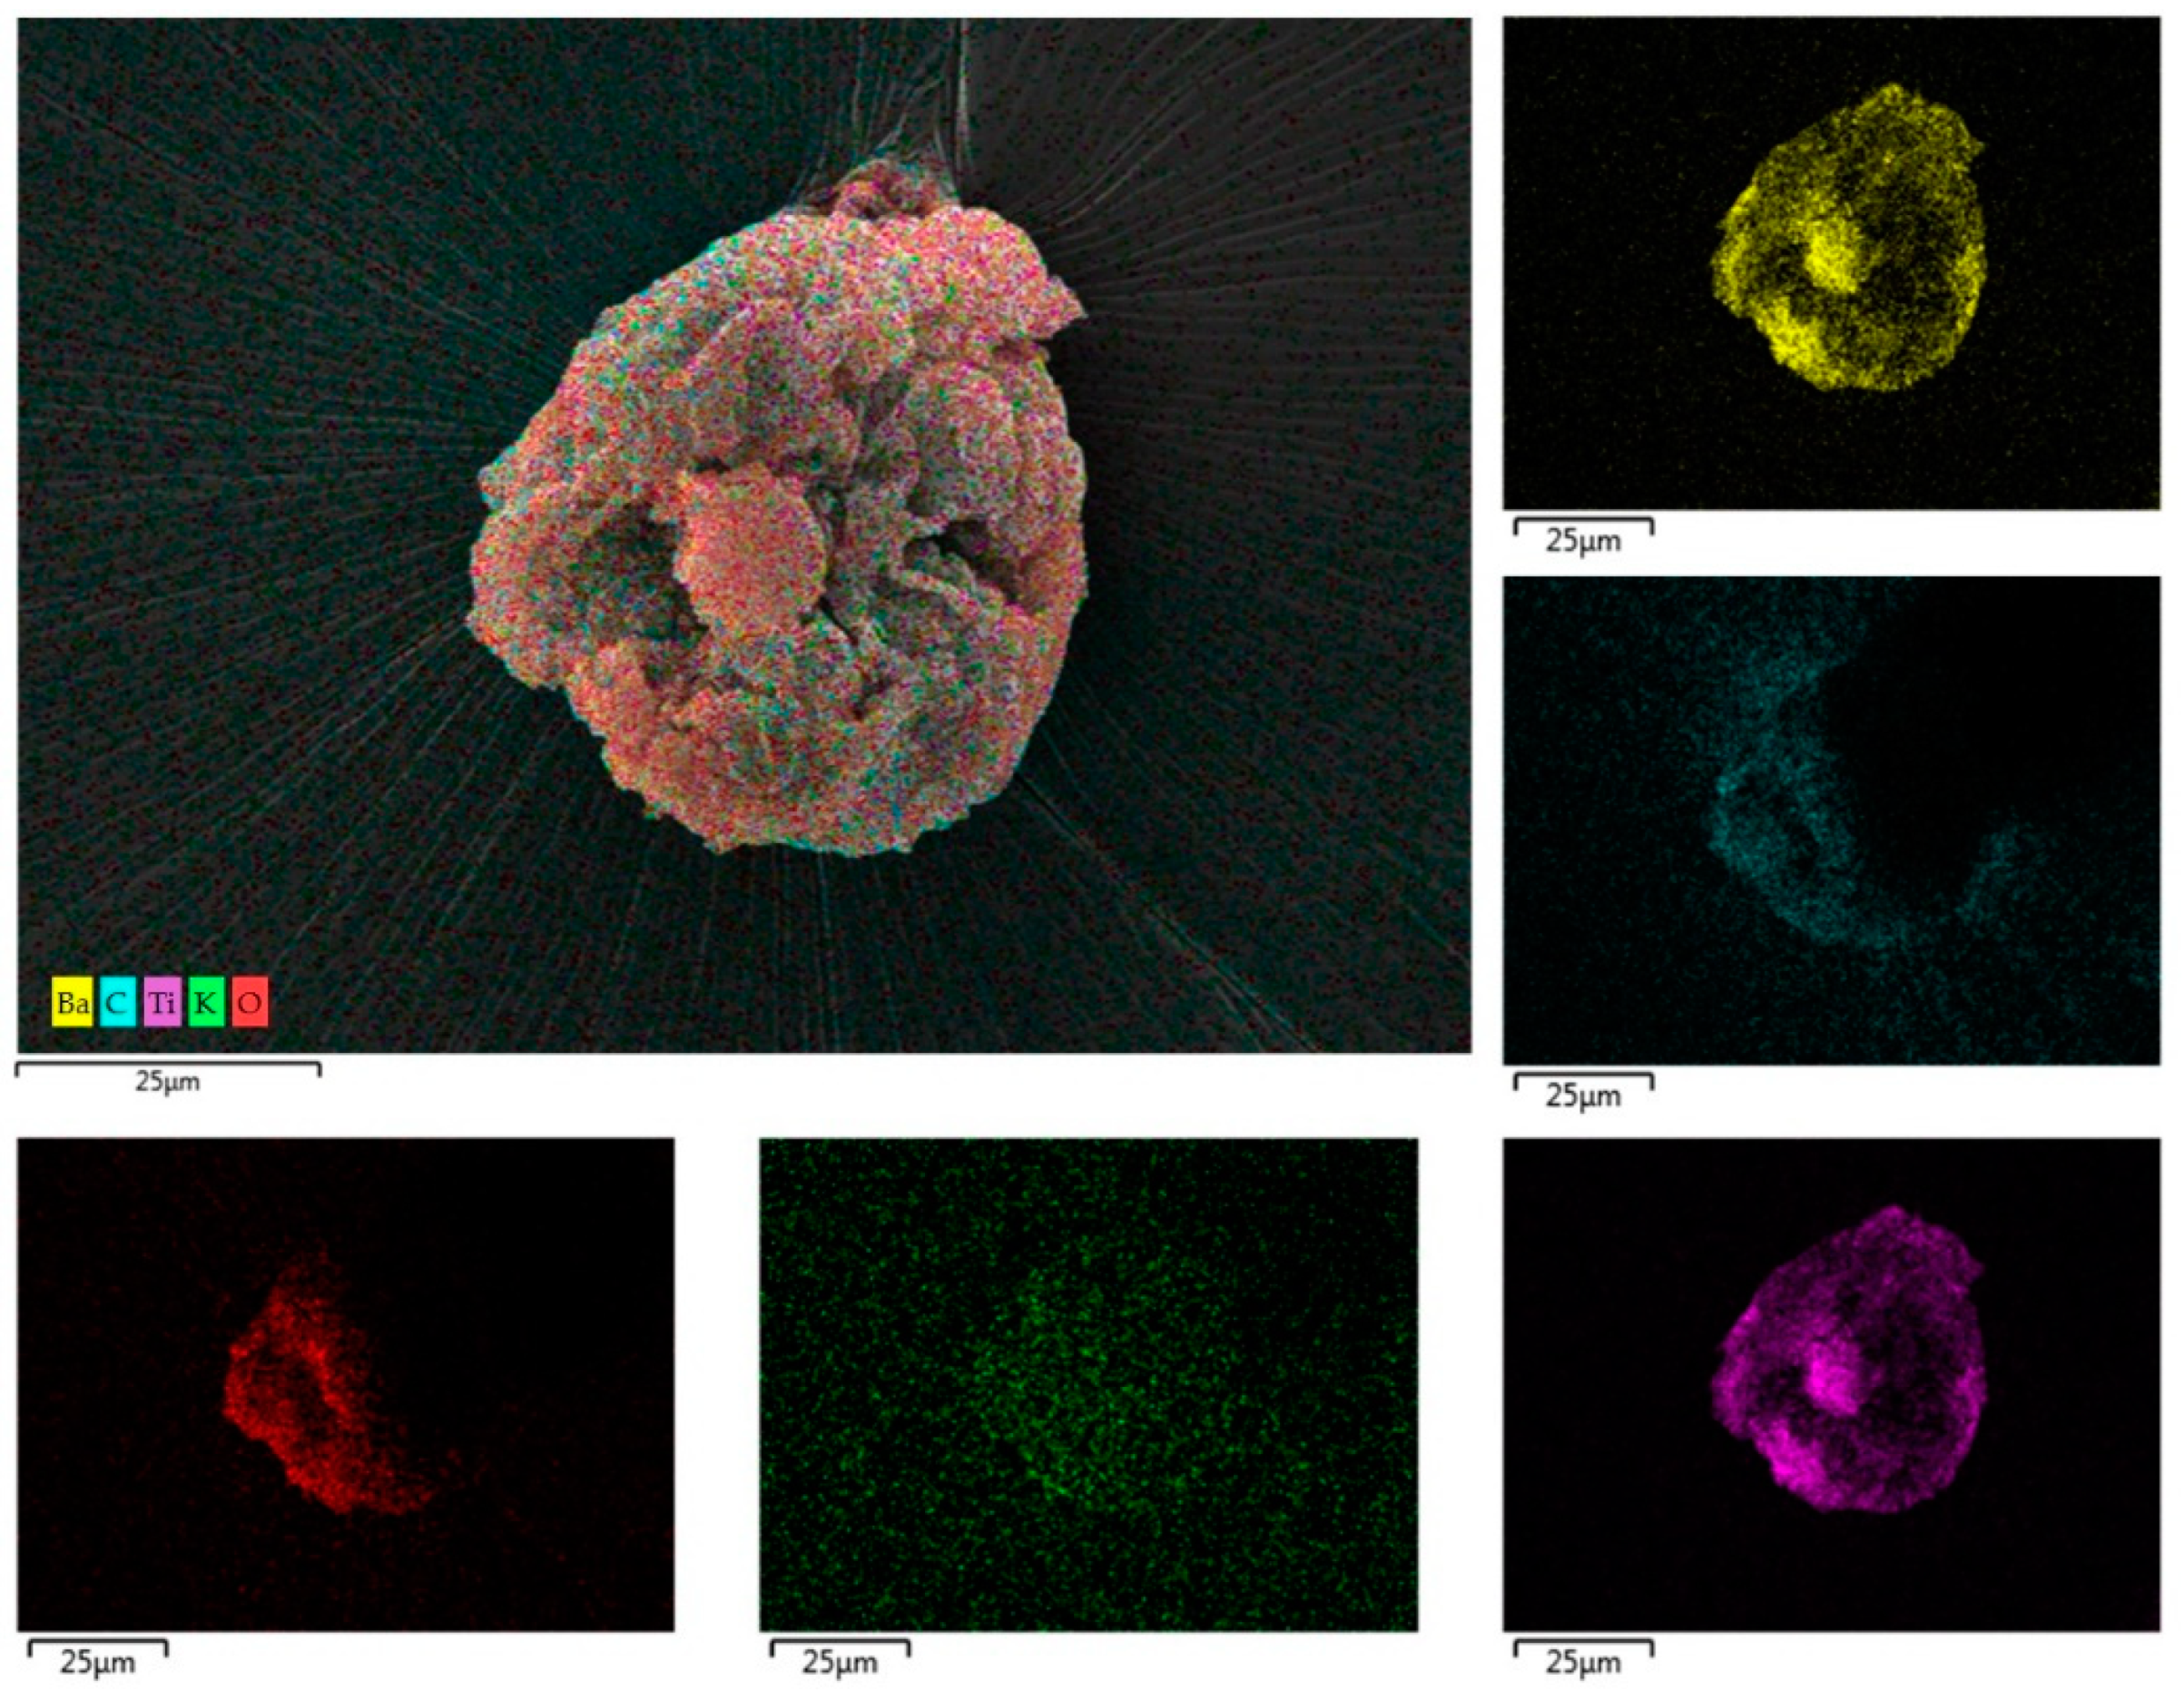
FE-SEM/EDS analysis was used to identify airborne GSR particles on two sample substrates. Characteristic GSR elements and particles were detected on the single and triple shot DST samples (Figure 2A) but not on the filters (Figure 2B). The DST served as a particle collection surface that allowed for the identification of GSR after a single shot (Figure 2A and Figure 3). Traditionally, GSR morphology is identified as a spherical particle containing a mix of Pb, Ba, and Sb [3]. The particles collected on the DST were slightly misshapen from an ideal spherical shape (Figure 3). These findings align with a previous study that collected GSR directly from the ammunition primer onto carbon adhesive tape and found irregular morphology of some particles [50]. A potential rationale for the non-spherical particles collected is the collection method, with particles needing to directly adhere to the DST and in the process of impaction slight alterations to the shape may have occurred. Additional elements (Al, K, O, Si, Sr, Ti) aside from characteristic GSR (Ba and Pb) were used as further validation of the source of the collected particles [51,52]. The elemental composition of all samples will be discussed in detail below.
DST is routinely used forensically for collecting GSR from suspects’ hands; however, in this study, it was used to collect airborne particles. In contrast, the complex woven nature of the filters (Figure 2B) was a difficult matrix for particle identification with no GSR particles detected. However, additional chemical analysis, described below, provides data that GSR was present on the filter samples. It is likely that GSR particles were present on the filter samples but that the smaller particles collected on the filters (under 2.5 µm) were deposited deep into the layers of the filter during the active sample collection. A study investigating size-selective traffic emissions was able to obtain elemental and morphological characterization of PM2.5 particles on PTFE membrane filters [53,54]. Sampling times and exact filter materials in the study differed from those in the current work. Differences in sampling times, 12 h vs. 1 min in this study, likely resulted in different particle loading amounts on the filters. Previous studies using borosilicate glass PTFE-coated filters, like the ones in this study, have documented the complex woven background [55]. The lower particle loading and filter material used in this study likely prevented visualization and characterization. FE-SEM/EDS is the standard analysis for use on carbon adhesive tape in forensic sciences, but chemical characterization may not be adequate for use on filter samples unless the filters have a higher loading of sample than in this study.
3.2. Particle Size Distribution and Zeta Potential (All Samples)
Size distribution and zeta potential for each sample type is provided in Table S2. Overall, the particle size distribution did not substantially vary between sample collection mediums. The zeta-potential, which is a measure of particle dispersion in solution, was in a stable or highly stable range [56]. These findings support the ability to extract GSR from different collection media into solution for subsequent analyses.
3.3. Black Carbon (Filters Only)
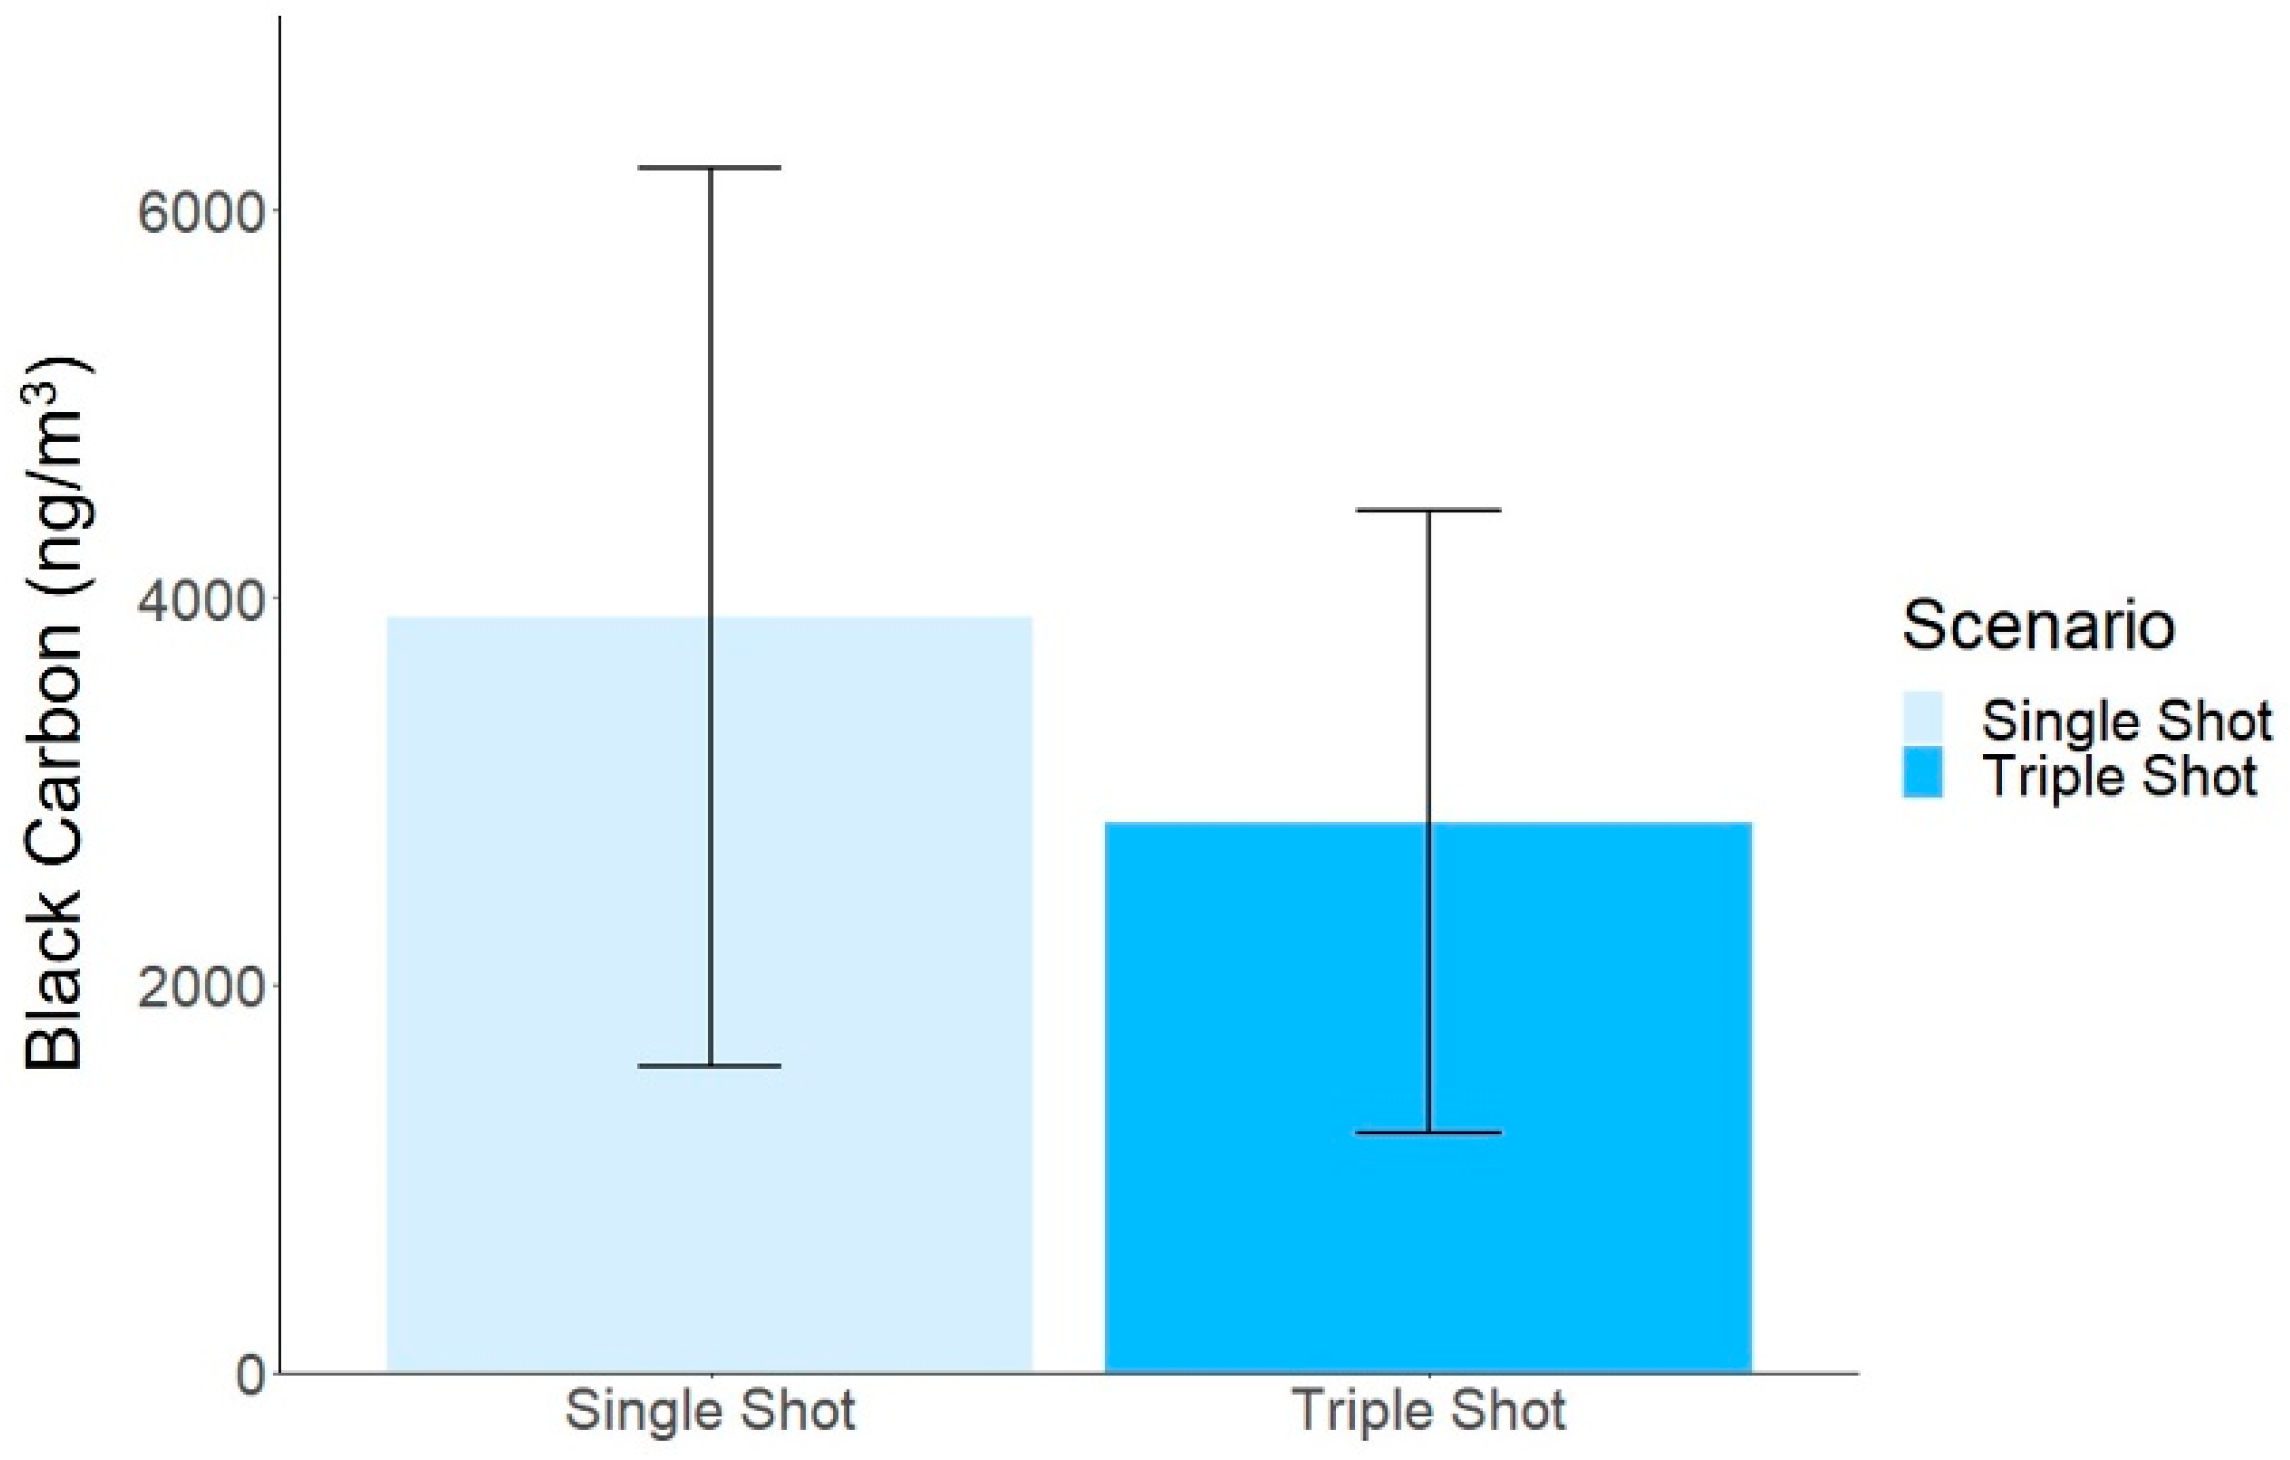
Black carbon was detected on all filter samples (Figure 4) aside from one of the four replicates of the single shot scenario. The average concentration between the shooting scenarios was not significantly different based on the number of shots fired but there was a trend that the triple shot (2836 ± 1606 ng/m3) was lower than the single shot scenario (3893 ± 2316 ng/m3). The average black carbon collected during the triple shot scenario was 31% lower than the single shot average. Black carbon was anticipated to increase with the number of shots due to the increase in GSR released, but the unexpected findings may be due to high variation between the replications of each shooting scenario. Meteorological factors such as wind could play a substantial role in the sample collection and can rapidly change even with samples collected during a small time period outdoors. Additional meteorological factors are discussed in detail below.
Black carbon is generated from incomplete combustion reactions, and GSR is primarily the product of incomplete combustion of unburnt propellant [12]. Determining the concentrations of black carbon following the discharge of firearms is important due to the potential human health impacts [38], yet thus far there is limited research quantifying a shooters’ exposure to black carbon. A previous study measured the distribution and amount of soot, a commonly used term to describe black carbon, emitted at the point of impact from a bullet [57]. However, the reported absorption wavelength, sample media, and sampling distance differed from the current study. Additional measurements of black carbon concentrations near shooters are needed to understand the scope of human exposure.
3.4. Elemental Analysis (All Samples)
Concentrations for all detected elements are presented in Table 1. The total elemental values reported are averages of the total elements for all of the sampling events in a given scenario (single or triple shot), while the GSR elemental values are defined as the average of Ba and Pb concentrations for all sample runs.
3.4.1. Filters
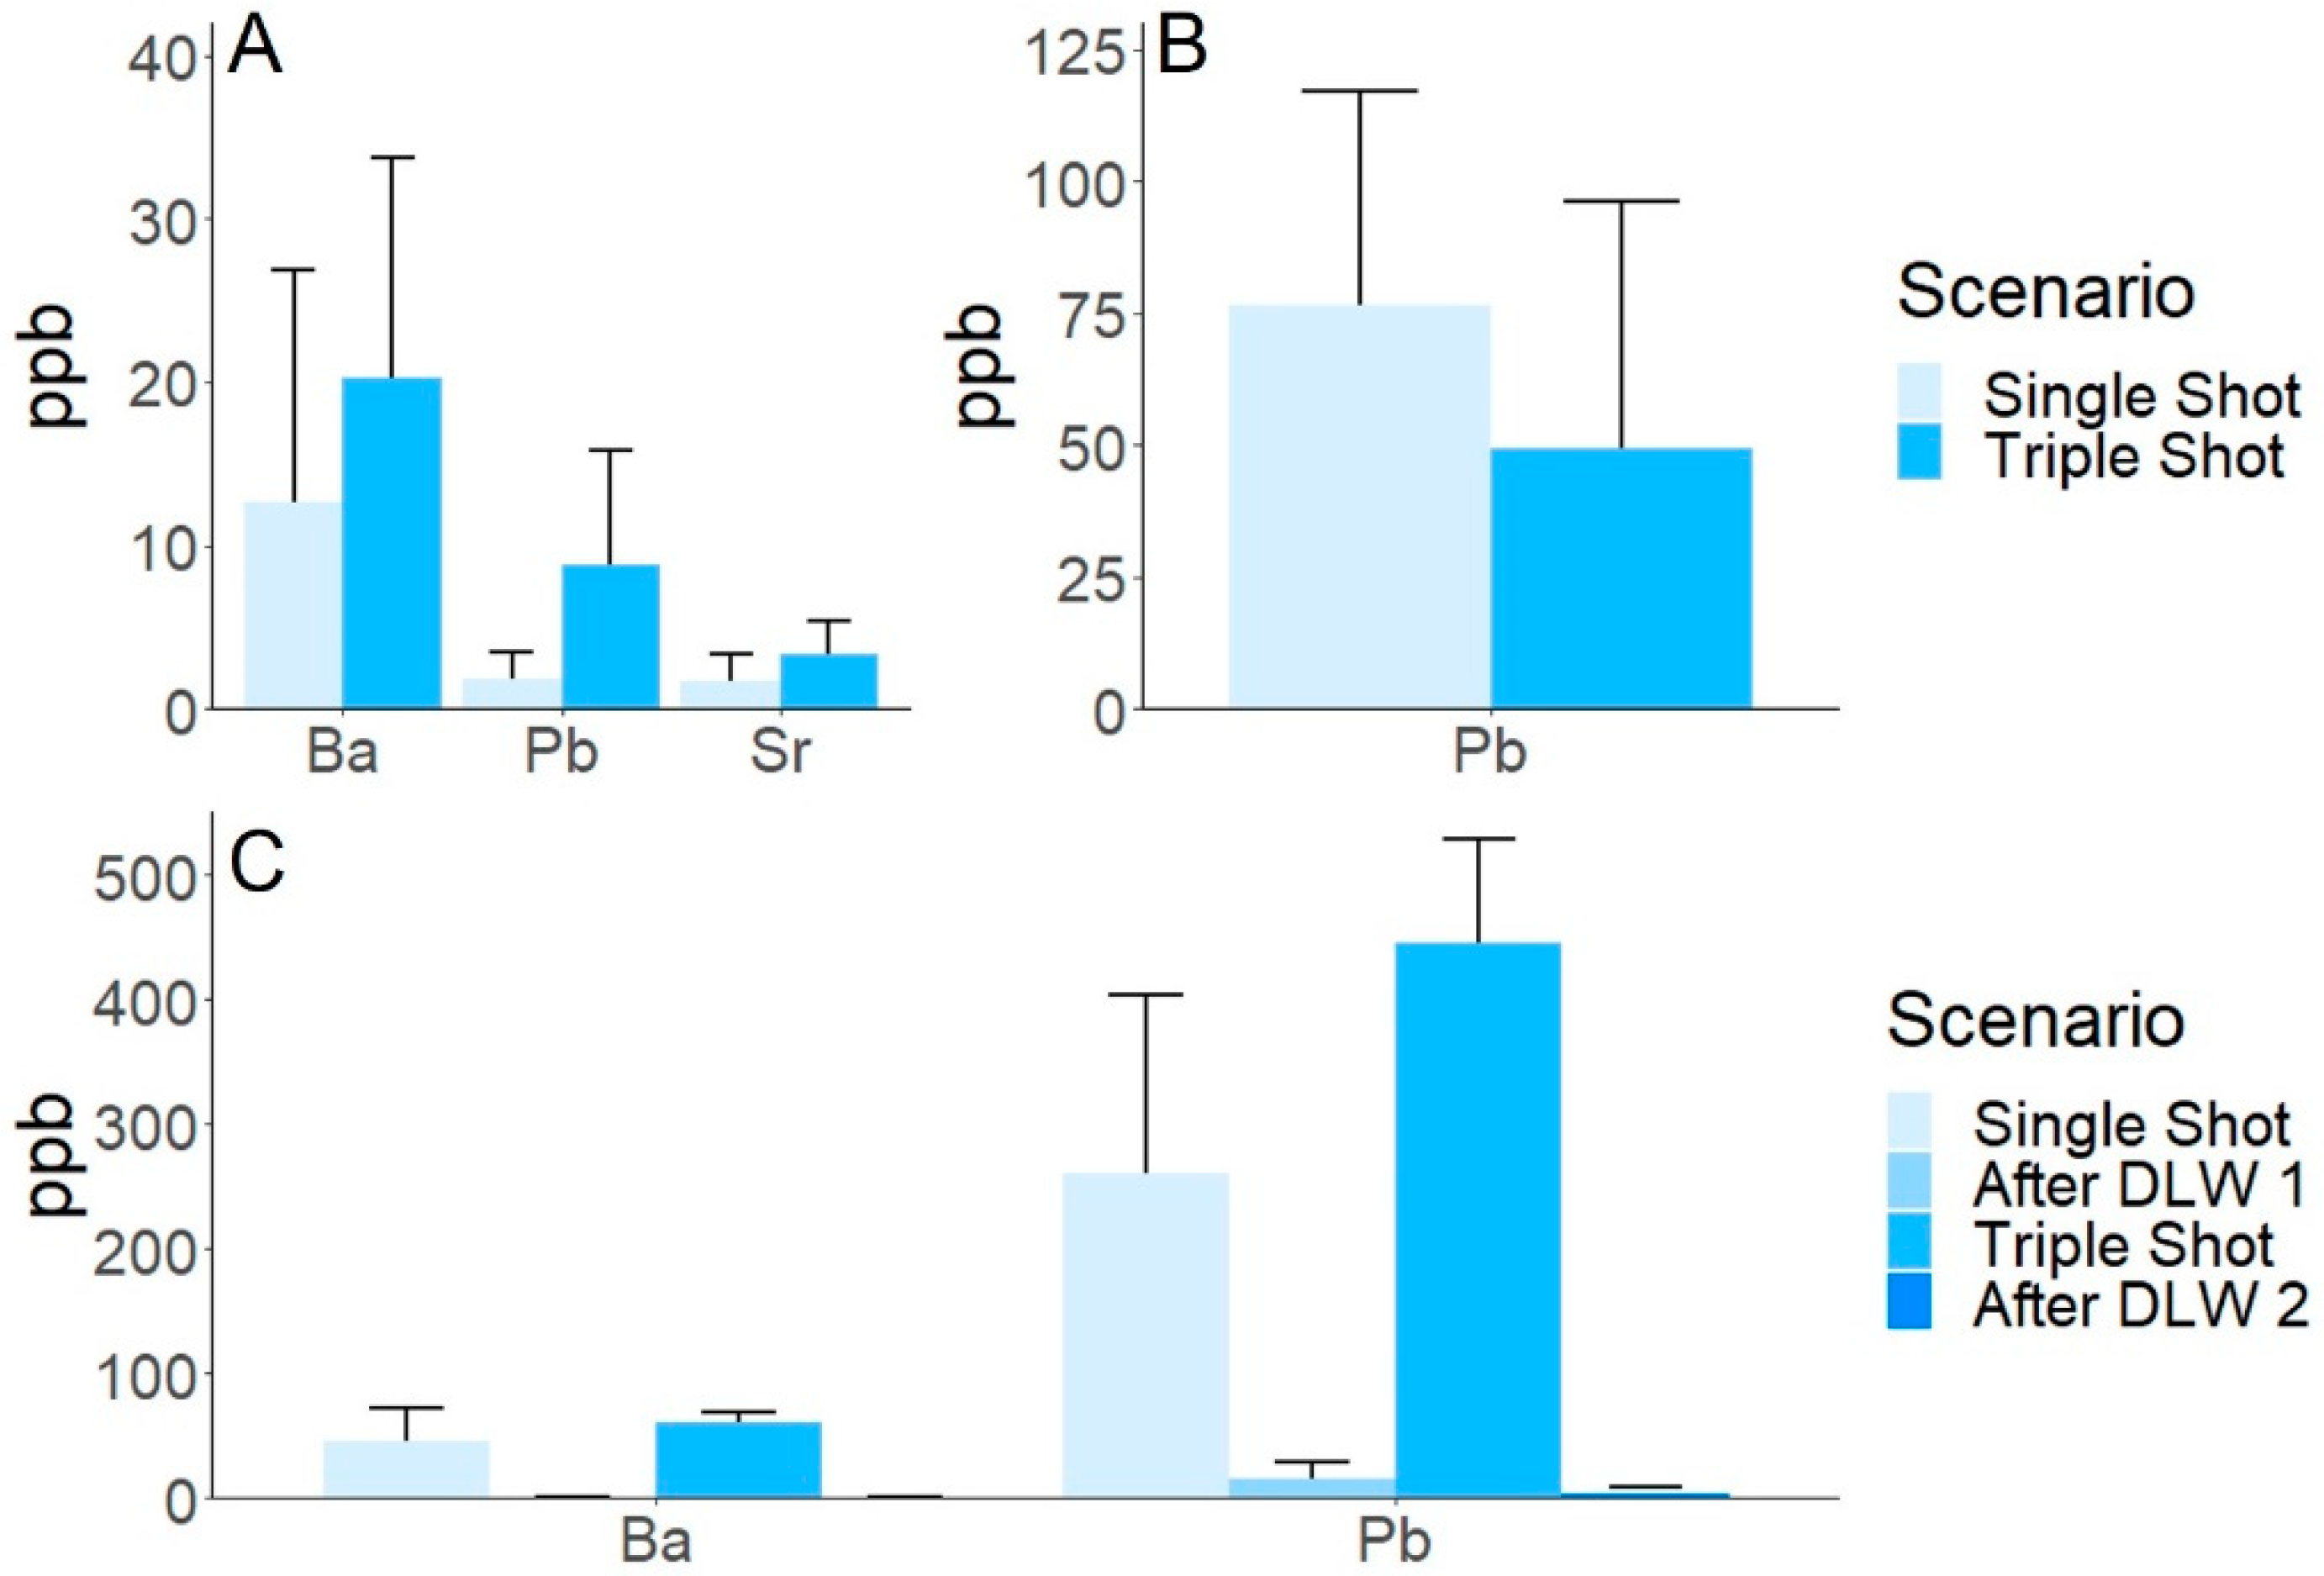
Elements commonly found in GSR including Pb and Ba as well as Sr had elevated concentrations for triple shot samples in comparison to the single shot samples (Figure 5A). The trend of higher elemental concentrations for the triple shot scenario compared to the single shot was expected due to the increased number of shots which could release additional GSR into the air for collection. The elemental concentrations for the triple shot samples were 46%, 69%, and 132% higher than the single shot samples for Ba, Sr, and Pb, respectively. These findings contradict the trends observed with black carbon. Even though both black carbon and elemental concentrations are part of the chemical composition of GSR the collection of each may differ due to meteorological factors, particle size, or susceptibility to dispersion by the wind. The ability to quantify increased characteristic GSR elements between the single and triple shots is important to note. Future research is needed to determine if this trend persists in other scenarios, for example a 100-round sample at an outdoor range or exposure from multiple shooters.
3.4.2. DST
The elemental concentrations for DST (Table 1) differed from those observed from the filter samples. The single shot elemental concentrations for Ba, Sr, and Pb were elevated compared to the triple shot concentrations. While statistically significant differences were not observed, this is an interesting trend across elements. When comparing concentrations to those collected in the particle size-selective method onto filters, Ba was lower for both single and triple shot. Conversely, for Pb (Figure 5B), the DST samples had higher concentrations potentially due to Pb particles being in a larger size fraction detectable by this sampling method. Even though Ba had a low contribution to the total concentration of characteristic GSR elements, the DST samples still had higher concentrations in comparison to the filter samples. In contrast to the filter samples, the concentration for triple shot DST was 40% lower than the single shot scenario. The FE-SEM/EDS analysis in this paper showed the ability to detect the GSR characteristic elements on the DST, while elemental analysis via ICP-MS showed that Pb was the primary GSR indicator for this collection method. Based on the adhesive nature of the DST, it is possible the methanol extraction process was not able to completely remove the additional inorganic GSR constituents collected. A previous study was able to extract organic GSR from the surface of a carbon adhesive tape without disturbing the inorganic GSR for FE-SEM/EDS analysis [2]. Following extraction in this work, the double-sided tape broke down into a thin strip of fragile tape and an adhesive gum-like substance. The adhesive portion of the DST may have retained a portion of the collected GSR particles. Thus, particle size and collection/extraction methods need to be considered when designing GSR-related studies. Additional analysis of GSR components including organic GSR may provide a more robust quantification of GSR from DST samples [17]. Further assessment of extraction and quantification methods for elements on DST is needed as this is a promising low-cost, passive GSR collection method.
3.4.3. Hand Swabs/De-Leading Wipes
The hand swab and de-leading wipe elemental data (Table 1) had concentrations for some of the GSR-related elements that were elevated compared to the airborne samples. The hand swab average and SEM for single and triple shots were Ba (45.52 ± 27.16 ppb and 61.25 ± 8.26 ppb) and Pb (261.11 ± 143.20 ppb and 446.24 ± 82.67 ppb), respectively (Figure 5C). Following use of de-leading wipes, the concentrations on the hand swabs after one or three shots were below the limit of detection for Ba and substantially reduced for Pb (15.57 ± 12.99 ppb and 3.13 ± 4.95 ppb), respectively. Prior to use of the de-leading wipe, the hand swab samples had the highest concentration of combined characteristic GSR elements when compared to the airborne samples. The use of de-leading wipe decreased the hand swab characteristic GSR (Ba, Pb) concentrations by over 175% for the single and triple shot scenarios, demonstrating the effectiveness of the wipes in removing heavy metals from the hands of the shooter (Figure 5C). This was further confirmed by measuring the elements present on the used de-leading wipes which had the highest total elemental concentrations of all samples analyzed. The high levels of Ba, Pb on the de-leading wipes further suggest the transfer of metals from the hands of the shooter to the de-leading wipe. The chemicals present in the de-leading wipe allow for the effective removal of metals, including ethylenediaminetetraacetic acid (EDTA), a known chelator [58], along with other chemical compounds present in the wipes. The use of de-leading wipes helped reduce the amount of Ba and Pb on the hands of the shooter after both scenarios and may be a more effective collection method for inorganic GSR than hand swabs.
The above table shows the concentration mean values and standard error mean (SEM) in ppb for all four of the sample types. All the samples were blank corrected with respective sample blanks except for the de-leading wipe samples. The GSR elemental is the average combined concentration of Pb and Ba from all of the sample runs.
3.5. Oxidative Potential (All Samples)
Oxidative potential is the ability for particulate matter to oxidize molecules and produce reactive oxygen species (ROS). The production of ROS can induce health effects such as oxidative stress which is the imbalance of free radicals and antioxidants [59,60,61]. The DTT assay is one method to measure oxidative potential [62,63]. The assay determines the amount of DTT consumed with an increase in DTT consumption indicating increased oxidative potential [59].
3.5.1. Filters
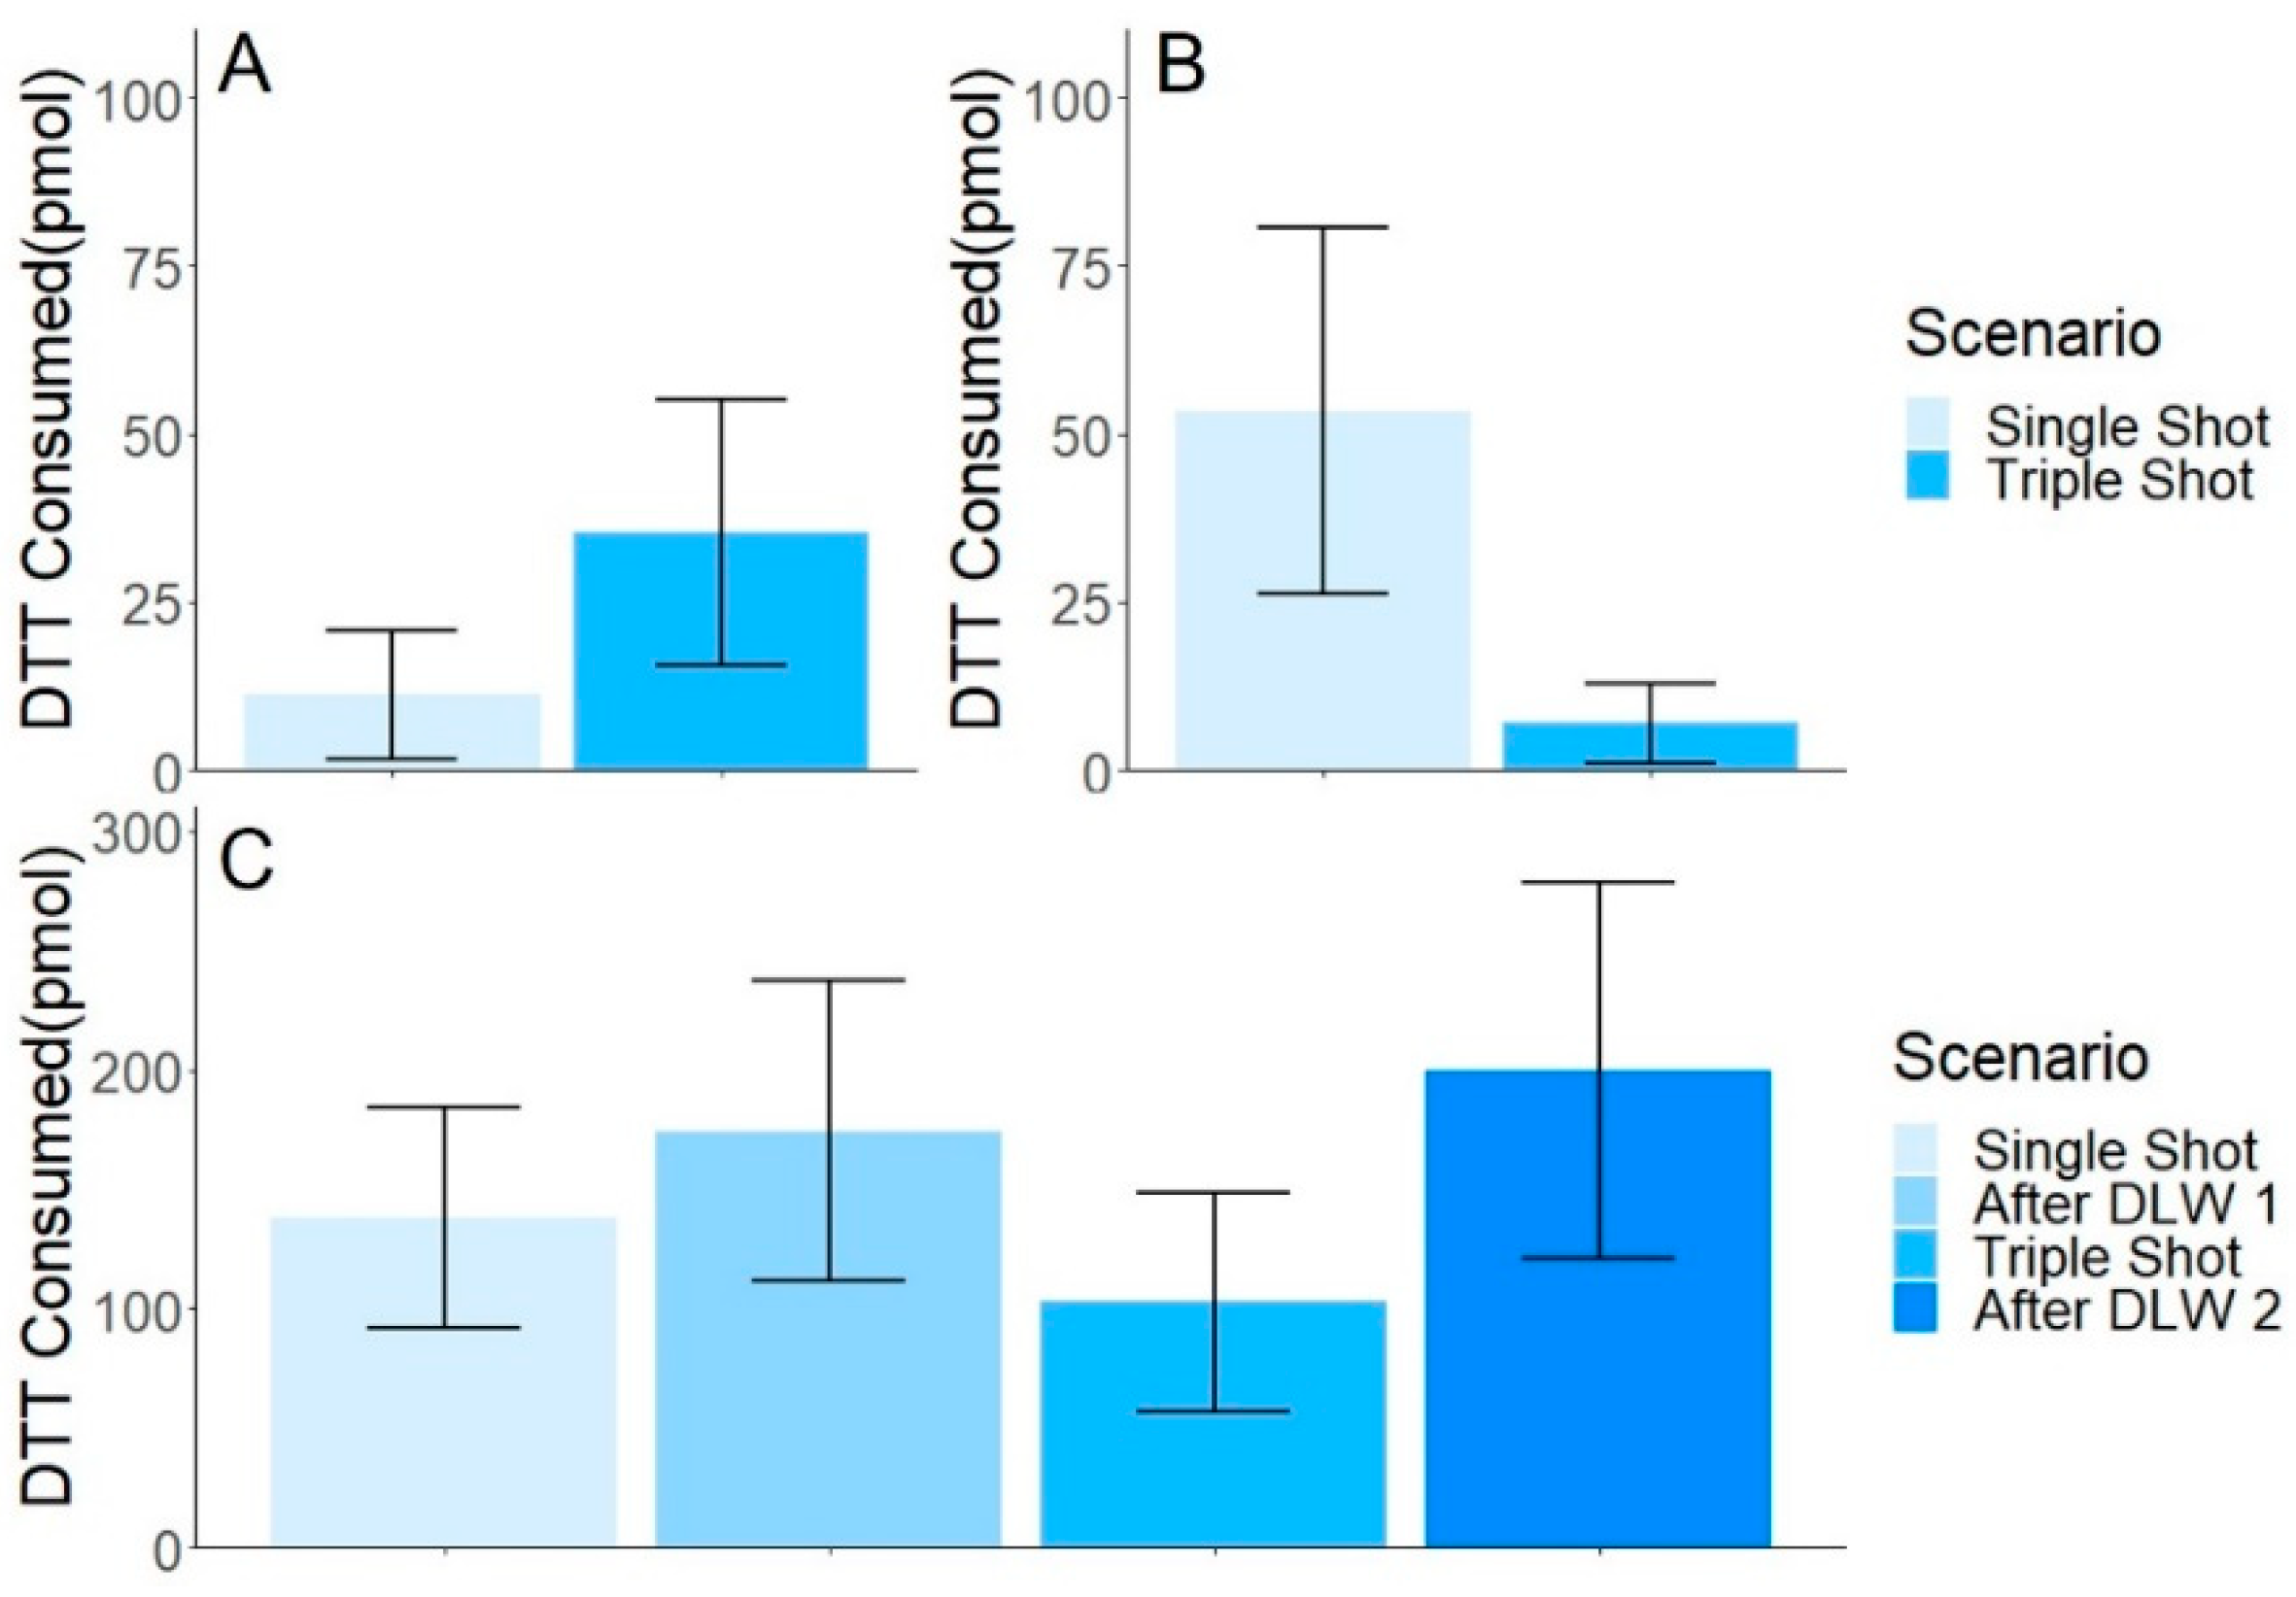
Oxidative potential was measured by DTT consumption with averages and SEM for single shot (11.1 ± 9.6 pmol) and triple shot (35.3 ± 19.9 pmol) (Figure 6A). There was a 68% increase in oxidative potential for the triple shot compared to the single shot averages. This increase was consistent with the observed increase in elemental concentrations for the filter samples based on number of shots. A previous study investigating PM2.5 identified metals as a major contributor to DTT consumption [64]. Additional DTT analysis of GSR samples may help identify differences based on the number of shots fired or specific firearms used.
3.5.2. DST
DTT consumption of the GSR samples collected on DST was below the limit of detection for two or three of the sample replicates after blank correction. The average DTT consumption was elevated in the single shot compared to the triple shot scenario (Figure 6B). These findings were consistent with the elemental data that had elevated concentrations in the single shot scenario for the DST. To the authors’ knowledge this is the first study to conduct oxidative potential analysis from DST collected samples, identifying a new collection and analysis scheme for airborne GSR.
3.5.3. De-Leading Wipes/Hand Swabs
Oxidative potential was detected for all hand swab collected samples. The average DTT consumed and SEM for after single shot (137.8 ± 46.2 pmol), after using de-leading wipe one (174.2 ± 63.0 pmol), after triple shots (102.8 ± 45.8 pmol), and after using de-leading wipe two (199.4 ± 78.8 pmol) is shown in Figure 6C. The de-leading wipe DTT consumption did not provide reproducible results which was likely due to the composition of the de-leading wipes themselves because the blank, non-used de-leading wipes had high oxidative potential values, preventing blank correction of samples. The hand swabs directly following shooting scenarios had lower DTT consumption than the samples directly following the use of a de-leading wipe (Figure 6C). The higher values of the hand swab samples after de-leading wipe could be explained by the de-leading wipe residue left on the shooters hands potentially reacting with the DTT. The de-leading wipes also contain EDTA, a compound that suppresses the DTT response from metals, which likely impacted the oxidative potential results from the de-leading wipe samples [64]. Even though EDTA itself suppresses DTT response, other components of the de-leading wipes could directly react with reagents in the assay. Overall, the DTT consumption values for the hand swab samples were higher than both the filter and DST samples, which may be a result of the higher collection of GSR elemental concentrations (Table 1). While the DTT assay was effective for extracted hand swabs following GSR collection, the analysis method is not optimal for de-leading wipe analysis.
3.6. Associations
Correlations between collected components and oxidative potential were determined for each sample type (Table 2). Significant positive correlations were observed between total GSR-related elements and a number of metals across sample types. DTT consumption did not have significant correlations with specific elements or total elements in any of the samples, suggesting that other components collected may be driving the oxidative potential responses. This is consistent with previous studies that observed high DTT consumption with organic compounds [64], demonstrating the importance of measuring both inorganic and organic GSR in future studies. For the filter samples, no significant correlations with black carbon were observed. While no statistically significant associations were made between the oxidative potential and the elemental data, there was a moderately positive correlation between total elements and DTT consumed in filter samples that was not observed in the DST and hand swab samples. These findings indicate that elements may play a larger contributing role to oxidative potential for size-selective GSR than non-size-selective GSR.
3.7. Inhalation Considerations (Filter and DST)
The use of filter and DST sampling allowed for the detection of GSR released into the air, identifying a potential inhalation exposure scenario from the firing of a weapon. The filter samples represented GSR particles that were ≤2.5 µm in aerodynamic diameter (PM2.5). PM2.5 can not only be inhaled but can also travel deep into the lungs and potentially into the bloodstream [36]. Importantly, the chemical composition of PM2.5 could increase the negative impacts of acute and chronic exposure, with the GSR elements, Pb [23,24] and Ba [26,27], having known health effects, including kidney diseases, cardiovascular, neurological, metabolic, and mental disorders. This study was able to quantify Pb and Ba from a single shot of a 0.22 caliber revolver. In our study, concentrations of Pb ranged from 1.81 to 76.37 ppb in the airborne samples, which is over 12 times higher than the National Ambient Air Quality Standards (NAAQS) for Pb [65]. In future toxicological studies, PM2.5 should be collected to assess the potential for GSR particles to enter the lungs and bloodstream. The size-selective filter samples in this work were able to detect and quantify elements consistent with GSR using ICP-MS. Filter samples have been used in toxicological studies to investigate health impacts from environmental contaminants [66,67] and similar methods can be used to assess potential toxicity of inhalation exposures from GSR. The sample type also exhibited the ability to determine oxidative potential of GSR samples. The main concern for filter samples is the inability to acquire morphology data from the complex matrix of the borosilicate glass filters, this can be reduced by using different filter membrane materials in future work or collecting broader size ranges, for example particles up to 10 microns.
The DST samples collected airborne particles, of all sizes that were released out of the firearm in the vicinity of the shooting event. The non-size-selective nature of the samples allows for a more robust analysis of the particles present, as larger particles are inhalable but generally with fates in the upper respiratory system [36]. This method of detection is used primarily in the forensic sciences field where tape is patted on the hands of a suspect to determine the presence of GSR [4,13]. In contrast to previous work, DST served as a non-size-selective, passive method of atmospheric collection of particles in our study. To optimize the passive collection in this study, the tape was placed in closer proximity to the weapon than in previous studies of GSR deposition [9,11]. The DST samples proved to provide a good substrate for FE-SEM/EDS analysis, but may falter regarding extraction efficiency for elemental analysis via ICP-MS. With increased research using tandem organic and inorganic GSR analysis, this sample type may be amenable for morphological and toxicological analysis after further method development, but the limitations regarding particles that are not inhalable and concerns with extraction methods must be considered.
3.8. Dermal Exposure (Hand Swab and De-Leading Wipes)
The dermal exposures from single and triple shot scenarios were investigated by collecting hand swabs and de-leading wipes. This data represented the GSR present on an individual’s hands after the firing of the revolver and assessed if using de-leading wipes decreased the elemental concentrations present. The hand swab samples allowed for GSR collection and analysis of elements and oxidative potential. The de-leading wipes removed large concentrations of elements from hands and were more effective than use of hand swabs alone in collecting elements from skin. However, complications arose for DTT analysis with the de-leading wipes, making these effective for chemical analysis but not toxicological assessments in the acellular model used in this study. If de-leading wipe collected GSR is desired for future toxicological studies, additional analysis of the components present in the product itself must be considered to prevent elevated responses in blank controls. Overall, the hand swabs and de-leading wipes demonstrated potential options for assessing dermal exposures to GSR but additional considerations including absorption rates must be determined in future studies.
3.9. Limitations
A major factor to be determined in future outdoor collection of GSR is wind direction and velocity. Wind likely contributed to the lower-than-expected collection between shooting scenarios. Dispersion and deposition behavior of GSR could be highly influenced by the positioning of samplers, orientation to the wind, or particle size. During sample collection, the wind direction change was noted, but real-time monitoring was unavailable. The addition of these monitors as well as sample collection in a radius around the shooter will be explored in future work. The ability to identify GSR on filter samples via FE-SEM/EDS can be tested further by collecting samples with higher filter loadings to try and identify characteristic GSR particles directly on the filter. A wider range of GSR-related elements or organic compounds was lacking in this work due to instrument calibration and quality assurance failures or lack of sample for use in multiple analytical instruments. In future studies, the collection of larger mass loadings by increasing the number of shots or shooters or pooling of samples will be considered.
4. Conclusions
The outdoor collection and analysis of GSR from a 0.22 caliber revolver was possible for airborne and dermal GSR samples, even after a single shot. Size-selective air sampling provided a health-relevant GSR particle size for collection, but the complex woven matrix of the filters prevented morphological analysis. Double-sided tape provided a substrate for the non-size-selective collection of airborne GSR that was amenable to morphological analysis to confirm the collection of GSR, but the extraction efficiency from the tape was a potential limitation for sonication-based removal. Hand swabs allowed for the collection of GSR from the shooters hands and de-leading wipes proved effective in reducing the presence of elemental components of GSR on skin. In future studies, additional compositional characterization and collection of meteorological parameters would strengthen the presented findings. This work was able to identify collection and analysis methods for GSR in an outdoor setting, providing protocols and considerations for future toxicological studies on the inhalation and dermal exposures to particulate GSR.
Supplementary Materials
The following supporting information can be downloaded at: https://www.mdpi.com/article/10.3390/app12094423/s1, Table S1: ICP-MS Instrumental Parameters, Table S2: Particle size distribution and zeta potential
Author Contributions
Conceptualization, S.C.S., O.B.B. and C.R.; methodology, S.C.S., O.B.B. and C.R.; writing—original draft preparation, S.C.S.; writing—review and editing, O.B.B. and C.R. All authors have read and agreed to the published version of the manuscript.
Funding
Funding for this research was provided by the University of Mississippi, Department of BioMolecular Sciences, and School of Pharmacy.
Institutional Review Board Statement
Not applicable.
Informed Consent Statement
Not applicable.
Data Availability Statement
The data presented in this study are available in the article and supplementary material.
Acknowledgments
The authors would like to thank the University of Mississippi’s Majumdar lab in the School of Pharmacy for providing instrumentation and assistance with the dynamic light scattering analysis and The University of Mississippi ICP-MS Facility and the Cizdziel lab for elemental analysis support. FE-SEM/EDS analysis was completed by the Microscopy and Imaging Center of the University of Mississippi. The JSM-7200 FLV FE-SEM was funded in part by the National Science Foundation (NSF) under the Major Research Instrumentation (MRI) program (Award number 1726880). Finally, we appreciate the Jones Center for allowing the outdoor sample collection in this study.
Conflicts of Interest
The authors declare no conflict of interest.
References
- U.S. Department of the Interior; U.S. Fish and Wildlife Service; U.S. Department of Commerce; U.S. Census Bureau. 2016 National Survey of Fishing, Hunting, and Wildlife-Associated Recreation; U.S. Fish and Wildlife Service: Washington, DC, USA, 2018.
- Bonnar, C.; Moule, E.C.; Lucas, N.; Seyfang, K.E.; Dunsmore, R.P.; Popelka-Filcoff, R.S.; Redman, K.; Paul Kirkbride, K. Tandem Detection of Organic and Inorganic Gunshot Residues Using LC–MS and SEM-EDS. Forensic Sci. Int. 2020, 314, 110389. [Google Scholar] [CrossRef] [PubMed]
- Saverio Romolo, F.; Margot, P. Identification of Gunshot Residue: A Critical Review. Forensic Sci. Int. 2001, 119, 195–211. [Google Scholar] [CrossRef]
- Trimpe, M. The Current Status of GSR Examinations; SWGGSR: Washington, DC, USA, 2011; pp. 24–32. [Google Scholar]
- Goudsmits, E.; Sharples, G.P.; Birkett, J.W. Preliminary Classification of Characteristic Organic Gunshot Residue Compounds. Sci. Justice 2016, 56, 421–425. [Google Scholar] [CrossRef] [PubMed] [Green Version]
- Moran, J.W.; Bell, S. Skin Permeation of Organic Gunshot Residue: Implications for Sampling and Analysis. Anal. Chem. 2014, 86, 6071–6079. [Google Scholar] [CrossRef]
- Black, O.; Cody, R.; Edwards, D.; Cizdziel, J.V. Identification of Polymers and Organic Gunshot Residue in Evidence from 3D-Printed Firearms Using DART-Mass Spectrometry: A Feasibility Study. Forensic Chem. 2017, 5, 26–32. [Google Scholar] [CrossRef]
- Benito, S.; Abrego, Z.; Sánchez, A.; Unceta, N.; Goicolea, M.A.; Barrio, R.J. Characterization of Organic Gunshot Residues in Lead-Free Ammunition Using a New Sample Collection Device for Liquid Chromatography–Quadrupole Time-of-Flight Mass Spectrometry. Forensic Sci. Int. 2015, 246, 79–85. [Google Scholar] [CrossRef]
- Fojtášek, L.; Vacínová, J.; Kolář, P.; Kotrlý, M. Distribution of GSR Particles in the Surroundings of Shooting Pistol. Forensic Sci. Int. 2003, 132, 99–105. [Google Scholar] [CrossRef]
- Fojtášek, L.; Kmječ, T. Time Periods of GSR Particles Deposition after Discharge-Final Results. Forensic Sci. Int. 2005, 153, 132–135. [Google Scholar] [CrossRef]
- Luten, R.; Neimke, D.; Barth, M.; Niewoehner, L. Investigating Airborne GSR Particles by the Application of Impactor Technology. Forensic Chem. 2018, 8, 72–81. [Google Scholar] [CrossRef]
- Wright, D.; Trimpe, M. FBI GSR Symposium Summary; FBI: Washington, DC, USA, 2005; pp. 1–21.
- Zeichner, A.; Levin, N. Collection Efficiency of Gunshot Residue (GSR) Particles from Hair and Hands Using Double-Side Adhesive Tape. J. Forensic Sci. 1993, 38, 571–584. [Google Scholar] [CrossRef]
- Schwartz, R.H.; Zona, C.A. A Recovery Method for Airborne Gunshot Residue Retained in Human Nasal Mucus. J. Forensic Sci. 1995, 40, 13845J. [Google Scholar] [CrossRef]
- Merli, D.; Brandone, A.; Amadasi, A.; Cattaneo, C.; Profumo, A. The Detection of Gunshot Residues in the Nasal Mucus of Suspected Shooters. Int. J. Leg. Med. 2016, 130, 1045–1052. [Google Scholar] [CrossRef]
- Aliste, M.; Chávez, L.G. Analysis of Gunshot Residues as Trace in Nasal Mucus by GFAAS. Forensic Sci. Int. 2016, 261, 14–18. [Google Scholar] [CrossRef] [PubMed]
- Taudte, R.V.; Beavis, A.; Blanes, L.; Cole, N.; Doble, P.; Roux, C. Detection of Gunshot Residues Using Mass Spectrometry. BioMed Res. Int. 2014, 2014, 965403. [Google Scholar] [CrossRef] [PubMed] [Green Version]
- Abrego, Z.; Grijalba, N.; Unceta, N.; Maguregui, M.; Sanchez, A.; Fernández-Isla, A.; Goicolea, M.A.; Barrio, R.J. A Novel Method for the Identification of Inorganic and Organic Gunshot Residue Particles of Lead-Free Ammunitions from the Hands of Shooters Using Scanning Laser Ablation-ICPMS and Raman Micro-Spectroscopy. Analyst 2014, 139, 6232–6241. [Google Scholar] [CrossRef]
- Costa, R.A.; Motta, L.C.; Destefani, C.A.; Rodrigues, R.R.T.; do Espírito Santo, K.S.; Aquije, G.M.F.V.; Boldrini, R.; Athayde, G.P.B.; Carneiro, M.T.W.D.; Romão, W. Gunshot Residues (GSR) Analysis of Clean Range Ammunition Using SEM/EDX, Colorimetric Test and ICP-MS: A Comparative Approach between the Analytical Techniques. Microchem. J. 2016, 129, 339–347. [Google Scholar] [CrossRef]
- Black, O.; Smith, S.C.; Roper, C. Advances and Limitations in the Determination and Assessment of Gunshot Residue in the Environment. Ecotoxicol. Environ. Saf. 2021, 208, 111689. [Google Scholar] [CrossRef]
- Sikkeland, L.I.B.; Borander, A.K.; Voie, Ø.A.; Aass, H.C.D.; Øvstebø, R.; Aukrust, P.; Longva, K.; Alexis, N.E.; Kongerud, J.; Ueland, T. Systemic and Airway Inflammation after Exposure to Fumes from Military Small Arms. Am. J. Respir. Crit. Care Med. 2018, 197, 1349–1353. [Google Scholar] [CrossRef]
- Skalny, A.V.; Aschner, M.; Bobrovnitsky, I.P.; Chen, P.; Tsatsakis, A.; Paoliello, M.M.B.; Buha Djordevic, A.; Tinkov, A.A. Environmental and Health Hazards of Military Metal Pollution. Environ. Res. 2021, 201, 111568. [Google Scholar] [CrossRef]
- Madrid, G.A.; Téllez-Cárdenas, L.; Juárez-Pérez, C.A.; Haro-García, L.C.; Mercado-García, A.; Gopar-Nieto, R.; Cabello-López, A. Blood Lead Determinants and the Prevalence of Neuropsychiatric Symptoms in Firearm Users in Mexico. Int. J. Occup. Med. Environ. Health 2015, 29, 219–228. [Google Scholar] [CrossRef] [Green Version]
- Rocha, E.D.; Sarkis, J.E.S.; de Fátima, H.; Carvalho, M.; Vechio dos Santos, G.; Canesso, C. Occupational Exposure to Airborne Lead in Brazilian Police Officers. Int. J. Hyg. Environ. Health 2014, 217, 702–704. [Google Scholar] [CrossRef] [PubMed]
- Cook, J.M.; Sakr, C.J.; Redlich, C.A.; DeLoreto, A.L. Elevated Blood Lead Levels Related to the Use of Firearms. J. Occup. Environ. Med. 2015, 57, e136–e138. [Google Scholar] [CrossRef] [PubMed]
- Kravchenko, J.; Darrah, T.H.; Miller, R.K.; Lyerly, H.K.; Vengosh, A. A Review of the Health Impacts of Barium from Natural and Anthropogenic Exposure. Environ. Geochem. Health 2014, 36, 797–814. [Google Scholar] [CrossRef] [PubMed]
- Peana, M.; Medici, S.; Dadar, M.; Zoroddu, M.A.; Pelucelli, A.; Chasapis, C.T.; Bjørklund, G. Environmental Barium: Potential Exposure and Health-Hazards. Arch. Toxicol. 2021, 95, 2605–2612. [Google Scholar] [CrossRef]
- Bergström, U.; Ekstrand-Hammarström, B.; Hägglund, L.; Wingfors, H. Comparing Acute Toxicity of Gunshot Particles, from Firing Conventional and Lead-Free Ammunition, in Pulmonary Epithelial Cell Cultures. J. Toxicol. Environ. Health A 2015, 78, 645–661. [Google Scholar] [CrossRef]
- Lach, K.; Brian, S.; Boris, G.; Vladimir, M.; Robert, M. Evaluation of Exposure to Airborne Heavy Metals at Gun Shooting Ranges. Ann. Occup. Hyg. 2014, 59, 307–323. [Google Scholar] [CrossRef]
- Islam, M.N.; Nguyen, X.P.; Jung, H.-Y.; Park, J.-H. Chemical Speciation and Quantitative Evaluation of Heavy Metal Pollution Hazards in Two Army Shooting Range Backstop Soils. Bull. Environ. Contam. Toxicol. 2016, 96, 179–185. [Google Scholar] [CrossRef]
- Sanderson, P.; Naidu, R.; Bolan, N.; Bowman, M.; Mclure, S. Effect of Soil Type on Distribution and Bioaccessibility of Metal Contaminants in Shooting Range Soils. Sci. Total Environ. 2012, 438, 452–462. [Google Scholar] [CrossRef]
- Urrutia-Goyes, R.; Mahlknecht, J.; Argyraki, A.; Ornelas-Soto, N. Trace Element Soil Contamination at a Former Shooting Range in Athens, Greece. Geoderma Reg. 2017, 10, 191–199. [Google Scholar] [CrossRef]
- Cao, X.; Ma, L.; Chen, M.; Hardison, D.; Harris, W. Lead Transformation and Distribution in the Soils of Shooting Ranges in Florida, USA. Sci. Total Environ. 2003, 307, 179–189. [Google Scholar] [CrossRef]
- Stauffer, M.; Pignolet, A.; Corcho Alvarado, J. Persistent Mercury Contamination in Shooting Range Soils: The Legacy from Former Primers. Bull. Environ. Contam. Toxicol. 2017, 98, 14–21. [Google Scholar] [CrossRef] [PubMed]
- Orru, H.; Pindus, M.; Harro, H.; Maasikmets, M.; Herodes, K. Metallic Fumes at Indoor Military Shooting Ranges: Lead, Copper, Nickel, and Zinc in Different Fractions of Airborne Particulate Matter. Propellants Explos. Pyrotech. 2018, 43, 228–233. [Google Scholar] [CrossRef]
- US EPA. Particulate Matter (PM) Basics. Available online: https://www.epa.gov/pm-pollution/particulate-matter-pm-basics (accessed on 21 August 2020).
- Gerard, R.V.; McVicar, M.J.; Lindsay, E.; Randall, E.D.; Harvey, E. The Long Range Deposition of Gunshot Residue and the Mechanism of Its Transportation. Can. Soc. Forensic Sci. J. 2011, 44, 97–104. [Google Scholar] [CrossRef]
- Kirrane, E.F.; Luben, T.J.; Benson, A.; Owens, E.O.; Sacks, J.D.; Dutton, S.J.; Madden, M.; Nichols, J.L. A Systematic Review of Cardiovascular Responses Associated with Ambient Black Carbon and Fine Particulate Matter. Environ. Int. 2019, 127, 305–316. [Google Scholar] [CrossRef] [PubMed]
- Quinn, C.; Miller-Lionberg, D.D.; Klunder, K.J.; Kwon, J.; Noth, E.M.; Mehaffy, J.; Leith, D.; Magzamen, S.; Hammond, S.K.; Henry, C.S.; et al. Personal Exposure to PM2.5 Black Carbon and Aerosol Oxidative Potential Using an Automated Microenvironmental Aerosol Sampler (AMAS). Environ. Sci. Technol. 2018, 52, 11267–11275. [Google Scholar] [CrossRef]
- Luben, T.J.; Nichols, J.L.; Dutton, S.J.; Kirrane, E.; Owens, E.O.; Datko-Williams, L.; Madden, M.; Sacks, J.D. A Systematic Review of Cardiovascular Emergency Department Visits, Hospital Admissions and Mortality Associated with Ambient Black Carbon. Environ. Int. 2017, 107, 154–162. [Google Scholar] [CrossRef]
- Wingfors, H.; Svensson, K.; Hägglund, L.; Hedenstierna, S.; Magnusson, R. Emission Factors for Gases and Particle-Bound Substances Produced by Firing Lead-Free Small-Caliber Ammunition. J. Occup. Environ. Hyg. 2014, 11, 282–291. [Google Scholar] [CrossRef]
- Pizzino, G.; Irrera, N.; Cucinotta, M.; Pallio, G.; Mannino, F.; Arcoraci, V.; Squadrito, F.; Altavilla, D.; Bitto, A. Oxidative Stress: Harms and Benefits for Human Health. Oxid. Med. Cell. Longev. 2017, 2017, 8416763. [Google Scholar] [CrossRef]
- Brożek-Mucha, Z. Distribution and Properties of Gunshot Residue Originating from a Luger 9mm Ammunition in the Vicinity of the Shooting Gun. Forensic Sci. Int. 2009, 183, 33–44. [Google Scholar] [CrossRef]
- Rijnders, M.R.; Stamouli, A.; Bolck, A. Comparison of GSR Composition Occurring at Different Locations Around the Firing Position. J. Forensic Sci. 2010, 55, 616–623. [Google Scholar] [CrossRef]
- Pillarisetti, A.; Carter, E.; Rajkumar, S.; Young, B.N.; Benka-Coker, M.L.; Peel, J.L.; Johnson, M.; Clark, M.L. Measuring Personal Exposure to Fine Particulate Matter (PM2.5) among Rural Honduran Women: A Field Evaluation of the Ultrasonic Personal Aerosol Sampler (UPAS). Environ. Int. 2019, 123, 50–53. [Google Scholar] [CrossRef] [PubMed]
- Vinson, A.; Sidwell, A.; Black, O.; Roper, C. Seasonal Variation in the Chemical Composition and Oxidative Potential of PM2.5. Atmosphere 2020, 11, 1086. [Google Scholar] [CrossRef]
- Roper, C.; Perez, A.; Barrett, D.; Hystad, P.; Massey Simonich, S.L.; Tanguay, R.L. Workflow for Comparison of Chemical and Biological Metrics of Filter Collected PM2.5. Atmos. Environ. 2020, 226, 117379. [Google Scholar] [CrossRef] [PubMed]
- R Core Team R: A Language and Environment for Statistical Computing; R Foundation for Statistical Computing: Vienna, Austria, 2021.
- Wickham, H. Ggplot2: Elegant Graphics for Data Analysis; Springer: Berlin/Heidelberg, Germany, 2016. [Google Scholar]
- Martiny, A.; Campos, A.P.C.; Sader, M.S.; Pinto, M.A.L. SEM/EDS Analysis and Characterization of Gunshot Residues from Brazilian Lead-Free Ammunition. Forensic Sci. Int. 2008, 177, e9–e17. [Google Scholar] [CrossRef] [PubMed]
- Hogg, S.R.; Hunter, B.C.; Waddell Smith, R. Elemental Characterization and Discrimination of Nontoxic Ammunition Using Scanning Electron Microscopy with Energy Dispersive X-Ray Analysis and Principal Components Analysis. J. Forensic Sci. 2016, 61, 35–42. [Google Scholar] [CrossRef] [PubMed]
- Romanò, S.; De-Giorgio, F.; D’Onofrio, C.; Gravina, L.; Abate, S.; Romolo, F.S. Characterisation of Gunshot Residues from Non-Toxic Ammunition and Their Persistence on the Shooter’s Hands. Int. J. Leg. Med. 2020, 134, 1083–1094. [Google Scholar] [CrossRef]
- Slezakova, K.; Pires, J.C.M.; Pereira, M.C.; Martins, F.G.; Alvim-Ferraz, M.C. Influence of Traffic Emissions on the Composition of Atmospheric Particles of Different Sizes—Part 2: SEM–EDS Characterization. J. Atmos. Chem. 2008, 60, 221–236. [Google Scholar] [CrossRef]
- Slezakova, K.; Pereira, M.C.; Reis, M.A.; Alvim-Ferraz, M.C. Influence of Traffic Emissions on the Composition of Atmospheric Particles of Different Sizes–Part 1: Concentrations and Elemental Characterization. J. Atmos. Chem. 2007, 58, 55–68. [Google Scholar] [CrossRef]
- Dhaniyala, S.; Liu, B.Y.H. Investigations of Particle Penetration in Fibrous Filters. J. IEST 1999, 42, 32. [Google Scholar] [CrossRef]
- Samimi, S.; Maghsoudnia, N.; Eftekhari, R.B.; Dorkoosh, F. Lipid-Based Nanoparticles for Drug Delivery Systems. In Characterization and Biology of Nanomaterials for Drug Delivery; Elsevier: Amsterdam, The Netherlands, 2019; pp. 47–76. ISBN 978-0-12-814031-4. [Google Scholar]
- Zain, Z.M.; Jaluddin, S.N.; Halim, M.I.A.; Subri, M.S.M. The Effect of Type of Firearm and Shooting Distance on Pattern Distribution, Particle Dispersion and Amount of Gunshot Residue. Egypt. J. Forensic Sci. 2021, 11, 10. [Google Scholar] [CrossRef]
- Alessandro, F.; Maria Elena, F. EDTA Chelation Therapy for the Treatment of Neurotoxicity. Int. J. Mol. Sci. 2019, 20, 1019. [Google Scholar] [CrossRef] [PubMed] [Green Version]
- Bates, J.T.; Fang, T.; Verma, V.; Zeng, L.; Weber, R.J.; Tolbert, P.E.; Abrams, J.Y.; Sarnat, S.E.; Klein, M.; Mulholland, J.A.; et al. Review of Acellular Assays of Ambient Particulate Matter Oxidative Potential: Methods and Relationships with Composition, Sources, and Health Effects. Environ. Sci. Technol. 2019, 53, 4003–4019. [Google Scholar] [CrossRef] [PubMed]
- Gao, D.; Ripley, S.; Weichenthal, S.; Godri Pollitt, K.J. Ambient Particulate Matter Oxidative Potential: Chemical Determinants, Associated Health Effects, and Strategies for Risk Management. Free Radic. Biol. Med. 2020, 151, 7–25. [Google Scholar] [CrossRef]
- Jiang; Ahmed; Canchola; Chen; Lin Use of Dithiothreitol Assay to Evaluate the Oxidative Potential of Atmospheric Aerosols. Atmosphere 2019, 10, 571. [CrossRef] [Green Version]
- Berg, K.E.; Clark, K.M.; Li, X.; Carter, E.M.; Volckens, J.; Henry, C.S. High-Throughput, Semi-Automated Dithiothreitol (DTT) Assays for Oxidative Potential of Fine Particulate Matter. Atmos. Environ. 2020, 222, 117132. [Google Scholar] [CrossRef]
- Gao, D.; Fang, T.; Verma, V.; Zeng, L.; Weber, R.J. A Method for Measuring Total Aerosol Oxidative Potential (OP) with the Dithiothreitol (DTT) Assay and Comparisons between an Urban and Roadside Site of Water-Soluble and Total OP. Atmos. Meas. Tech. 2017, 10, 2821–2835. [Google Scholar] [CrossRef] [Green Version]
- Charrier, J.G.; Anastasio, C. On Dithiothreitol (DTT) as a Measure of Oxidative Potential for Ambient Particles: Evidence for the Importance of Soluble Transition Metals. Atmos. Chem. Phys. 2012, 12, 9321–9333. [Google Scholar] [CrossRef] [Green Version]
- US EPA NAAQS Table. Available online: https://www.epa.gov/criteria-air-pollutants/naaqs-table (accessed on 24 February 2022).
- Castañeda, A.R.; Bein, K.J.; Smiley-Jewell, S.; Pinkerton, K.E. Fine Particulate Matter (PM2.5) Enhances Allergic Sensitization in BALB/c Mice. J. Toxicol. Environ. Health A 2017, 80, 197–207. [Google Scholar] [CrossRef]
- Hou, T.; Liao, J.; Zhang, C.; Sun, C.; Li, X.; Wang, G. Elevated Expression of MiR-146, MiR-139 and MiR-340 Involved in Regulating Th1/Th2 Balance with Acute Exposure of Fine Particulate Matter in Mice. Int. Immunopharmacol. 2018, 54, 68–77. [Google Scholar] [CrossRef]
Figure 1.
Sample Flow Chart. The flow chart summarizes all of the analysis processes done to each of the sample types.
Figure 1.
Sample Flow Chart. The flow chart summarizes all of the analysis processes done to each of the sample types.

Figure 2.
Representative FE-SEM/EDS images of DST and Filters. A representative image of a particle for the DST collection (A) is displayed with elemental overlay for Pb (yellow) and C (blue) after a single shot at 6500×; the scale bar indicates 5 µm. No particles were identified on the filter samples (B) which provided a complex matrix for imaging at 1000×; the white scale bar indicates 10 µm.

Figure 3.
FE-SEM/EDS data for DST single shot sample. A representative GSR particle on DST from the single shot sampling shows the morphology and elemental composition. The elemental overlay of Ba (yellow), K (green), Ti (purple), O (red), and C (blue) along with a combined image (in the top left) are displayed at 1000× magnification; the scale bars indicate 25 µm.

Figure 4.
Average Black Carbon Concentrations. Averages and standard deviations of single (3893 ± 2316 ng/m3) and triple shot (2836 ± 1606 ng/m3) are reported (n = 4). Statistically significant differences were not observed between single and triple shot scenarios using the Welch’s t-test (p = 0.543).

Figure 5.
Elemental Concentrations. The elemental concentrations (ppb ± SEM) are shown for Ba, Pb, and Sr in filter samples (A), Pb in DST samples (B), and Ba and Pb in hand swab samples (C). Statistical significance was determined using a Welch’s t-test for comparison of single and triple shot scenarios (filter and DST) and a one-way ANOVA for multiple group comparisons (hand swabs) with a p-value of ≤0.05 considered significant. No statistically significant differences were observed.

Figure 6.
Oxidative Potential. DTT consumption and SEM (pmol) are shown for the filters (A), DST (B), and hand swab samples (C). No significant differences were detected during statistical analysis using a Welch’s t-test (filters and DST) and one-way ANOVA (hand swabs) with p-values of ≤0.05 considered significant.


Table 1.
Elemental Concentrations for All Sample Types.
| Sample Description | Element Concentrations (ppb ± (SEM)) | ||||||||||||
|---|---|---|---|---|---|---|---|---|---|---|---|---|---|
| Sample Type | Sample Name | Ag | Ba | Cd | Ce | Cs | Pb | Rb | Sr | Th | U | Total Elemental | GSR Elemental |
| Filters | 1-shot | - | 12.64 (14.24) | - | 0.08 (0.07) | - | 1.81 (1.59) | 0.07 (0.08) | 1.64 (1.67) | 0.01 (0.01) | - | 23.42 (11.00) | 20.72 (9.90) |
| 3-shots | - | 20.27 (13.41) | - | 0.13 (0.08) | 0.01 (0.00) | 8.83 (6.91) | 0.14 (0.08) | 3.39 (1.96) | 0.02 (0.01) | 0.01 (0.00) | 39.79 (11.71) | 35.54 (10.75) | |
| Double-sided Tape | 1-shot | - | 4.30 (1.59) | 0.03 (0.02) | 0.03 (0.02) | - | 76.37 (40.62) | - | 0.35 (0.11) | - | - | 81.24 (41.29) | 80.78 (41.19) |
| 3-shots | - | 0.65 (1.27) | 0.01 (0.00) | - | - | 49.39 (46.76) | - | 0.17 (0.19) | - | - | 54.36 (46.96) | 54.09 (46.80) | |
| Hand Swabs | 1-shot | - | 45.52 (27.16) | 0.02 (0.05) | 0.21 (0.17) | 0.01 (0.01) | 261.11 (143.20) | 2.07 (1.49) | - | - | - | 309.61 (170.07) | 306.71 (170.30) |
| After De-leading Wipe | - | - | - | - | - | 15.57 (12.99) | - | - | - | - | 19.90 (9.95) | 19.90 (9.95) | |
| After 3-shots | - | 61.25 (8.26) | - | 0.01 (0.06) | - | 446.24 (82.67) | - | - | - | - | 507.91 (90.13) | 507.49 (90.10) | |
| After De-leading wipe | - | - | - | - | - | 3.13 (4.95) | - | - | - | - | 5.98 (3.29) | 5.98 (3.29) | |
| De-leading wipe * | Wipe after 1 shot | 0.07 (0.00) | 29.60 (16.46) | 1.00 (0.12) | 0.73 (0.14) | 0.19 (0.05) | 2518.89 (1707.78) | 25.49 (2.92) | 13.68 (5.08) | - | 0.05 (0.01) | 2589.70 (1732.33) | 2548.49 (1724.24) |
| Wipe after 3 shots | 0.06 (0.01) | 31.93 (14.60) | 0.94 (0.25) | 0.60 (0.05) | 0.13 (0.01) | 824.04 (243.37) | 15.22 (2.40) | 25.11 (8.82) | - | 0.05 (0.00) | 898.09 (264.59) | 855.96 (257.95) | |
* = Sample was not blank corrected.
Table 2.
Associations by Sample Type.
| Filters | |||||||||||||
| DTT | Ag | Ba | Cd | Ce | Cs | Pb | Rb | Sr | Th | U | Total Elements | GSR Elements | |
| BC | −0.0687 | 0.356 | 0.595 | 0.445 | 0.631 | 0.595 | 0.556 | 0.631 | 0.631 | 0.631 | 0.487 | 0.378 | 0.414 |
| DTT | 0.149 | 0.543 | 0.0745 | 0.663 | 0.482 | 0 | 0.422 | 0.663 | 0.663 | 0.784 | 0.543 | 0.482 | |
| Ag | 0.494 | 0.278 | 0.584 | 0.809 | −0.096 | 0.674 | 0.584 | 0.584 | 0.584 | 0.494 | 0.36 | ||
| Ba | 0.809 | 0.855 | 0.891 * | 0.299 | 0.964 * | 0.855 | 0.855 | 0.891 * | 0.673 | 0.745 | |||
| Cd | 0.494 | 0.584 | 0.139 | 0.764 | 0.494 | 0.494 | 0.494 | 0.27 | 0.449 | ||||
| Ce | 0.855 | 0.075 | 0.818 | 1.000 * | 1.000 * | 0.964 * | 0.527 | 0.491 | |||||
| Cs | 0.262 | 0.964 * | 0.855 | 0.855 | 0.891 * | 0.782 | 0.745 | ||||||
| Pb | 0.337 | 0.075 | 0.075 | 0.112 | 0.636 | 0.711 | |||||||
| Rb | 0.818 | 0.818 | 0.855 | 0.745 | 0.782 | ||||||||
| Sr | 1.000 * | 0.964 * | 0.527 | 0.491 | |||||||||
| Th | 0.964 * | 0.527 | 0.491 | ||||||||||
| U | 0.673 | 0.636 | |||||||||||
| Total Elements | 0.964 * | ||||||||||||
| Double-Sided Tape | |||||||||||||
| Ag | Ba | Cd | Ce | Cs | Pb | Rb | Sr | Th | U | Total Elements | GSR Elements | ||
| DTT | −0.094 | 0.102 | −0.11 | 0.671 | −0.283 | 0.014 | 0.32 | 0.096 | 0.559 | 0.615 | −0.055 | −0.096 | |
| Ag | 0.291 | 0.357 | 0.363 | −0.283 | −0.274 | 0.291 | −0.137 | −0.056 | 0.363 | −0.191 | −0.137 | ||
| Ba | 0.638 | 0.273 | −0.351 | 0.727 | 0.284 | 0.817 | 0.468 | 0.273 | 0.812 | 0.817 | |||
| Cd | 0.503 | 0.249 | 0.271 | 0.74 | 0.428 | 0.233 | 0.54 | 0.443 | 0.428 | ||||
| Ce | −0.085 | −0.172 | 0.767 | −0.123 | 0.425 | 0.925 * | −0.073 | −0.123 | |||||
| Cs | −0.249 | 0.439 | −0.249 | 0.085 | 0.085 | −0.247 | −0.249 | ||||||
| Pb | −0.198 | 0.976 * | 0.491 | −0.049 | 0.970 * | 0.976 * | |||||||
| Rb | −0.108 | 0.351 | 0.754 | −0.076 | −0.108 | ||||||||
| Sr | 0.417 | −0.025 | 0.994 * | 1.000 * | |||||||||
| Th | 0.625 | 0.415 | 0.417 | ||||||||||
| U | 0 | −0.025 | |||||||||||
| Total Elements | 0.994 * | ||||||||||||
| Hand Swabs | |||||||||||||
| Ag | Ba | Cd | Ce | Cs | Pb | Rb | Sr | Th | U | Total Elements | GSR Elements | ||
| DTT | n/a | −0.361 | −0.079 | 0.034 | 0.169 | −0.532 | 0.007 | 0.311 | 0.311 | 0.169 | −0.501 | −0.532 | |
| Ag | n/a | n/a | n/a | n/a | n/a | n/a | n/a | n/a | n/a | n/a | n/a | ||
| Ba | 0.061 | 0.628 | 0.593 | 0.912 * | 0.339 | 0.081 | 0.081 | 0.593 | 0.891 * | 0.912 * | |||
| Cd | 0.486 | 0.191 | 0.201 | −0.354 | 0.626 | 0.626 | 0.191 | 0.201 | 0.201 | ||||
| Ce | 0.795 * | 0.598 | 0.270 | 0.565 | 0.565 | 0.795 * | 0.598 | 0.598 | |||||
| Cs | 0.564 | 0.475 | 0.565 | 0.565 | 1 * | 0.564 | 0.564 | ||||||
| Pb | 0.349 | 0.077 | 0.077 | 0.564 | 0.983 * | 1 * | |||||||
| Rb | −0.188 | −0.188 | 0.475 | 0.457 | 0.349 | ||||||||
| Sr | 1 * | 0.565 | 0.077 | 0.077 | |||||||||
| Th | 0.565 | 0.077 | 0.077 | ||||||||||
| U | 0.564 | 0.564 | |||||||||||
| Total Elements | 0.983 * | ||||||||||||
The above table shows the Spearman’s correlation coefficients and significant correlations are represented by bold (<0.05) and bold * (<0.001). Correlations with no values are represented by (n/a).
Publisher’s Note: MDPI stays neutral with regard to jurisdictional claims in published maps and institutional affiliations. |
© 2022 by the authors. Licensee MDPI, Basel, Switzerland. This article is an open access article distributed under the terms and conditions of the Creative Commons Attribution (CC BY) license (https://creativecommons.org/licenses/by/4.0/).
Share and Cite
MDPI and ACS Style
Smith, S.C.; Black, O.B.; Roper, C. Airborne and Dermal Collection Methods of Gunshot Residue for Toxicity Studies. Appl. Sci. 2022, 12, 4423. https://doi.org/10.3390/app12094423
AMA Style
Smith SC, Black OB, Roper C. Airborne and Dermal Collection Methods of Gunshot Residue for Toxicity Studies. Applied Sciences. 2022; 12(9):4423. https://doi.org/10.3390/app12094423
Chicago/Turabian StyleSmith, Samuel Cole, Oscar Beau Black, and Courtney Roper. 2022. "Airborne and Dermal Collection Methods of Gunshot Residue for Toxicity Studies" Applied Sciences 12, no. 9: 4423. https://doi.org/10.3390/app12094423
Note that from the first issue of 2016, this journal uses article numbers instead of page numbers. See further details here.